


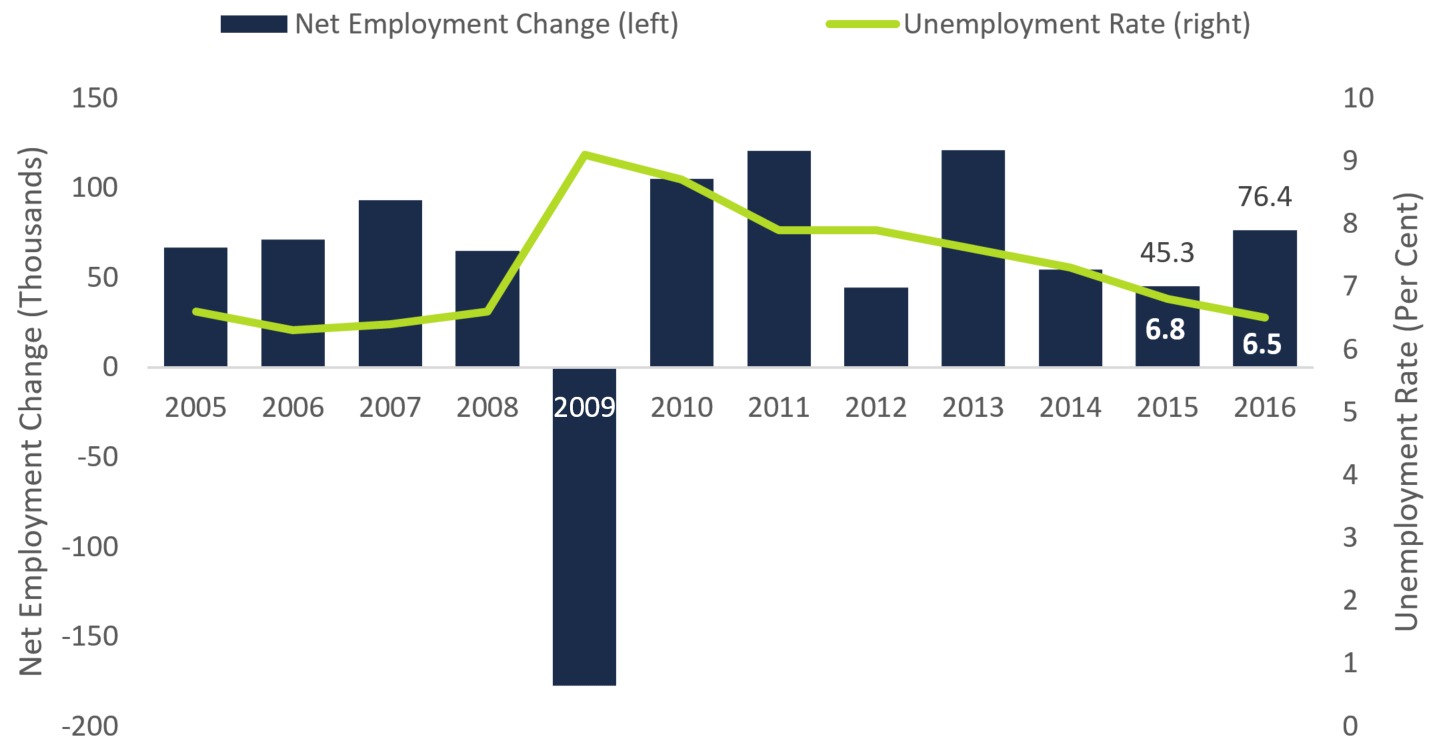
Statistics Canada recently released its Labour Force Survey (LFS) for December 2016, providing an assessment of Canada’s annual labour market performance in 2016.[1] Overall, Ontario posted a relatively strong job gain of 76,400 net new jobs (+1.1 per cent) in 2016, up from a gain of 45,300 new jobs in 2015 (+0.7 per cent). The unemployment rate also improved last year, declining 0.3 percentage points to 6.5 per cent.
However, looking beyond the headline results reveals a labour market that is undergoing both structural and behavioural changes as well as continuing challenges for some workers. These underlying trends include:
- A decrease in the share of both full-time and private sector positions relative to total employment. The share of full-time and private sector jobs fell noticeably during the 2008-2009 recession and have shown only modest improvements in recent years.
- Weaker labour market results for younger workers (ages 15 to 24). The employment rate[2] of younger workers dropped during the recession and has shown only limited signs of recovering.
- Large disparities in labour market conditions across Ontario’s regions.[3] In particular, job creation remains concentrated in the Greater Toronto Area (GTA) while employment rates in Northern and Southwestern Ontario continue to remain well below the provincial average.
Ontario Posts Solid Job Growth in 2016
Source: Statistics Canada
Share of Full-time and Private Sector Employment Remain Below Pre-recessionary Levels
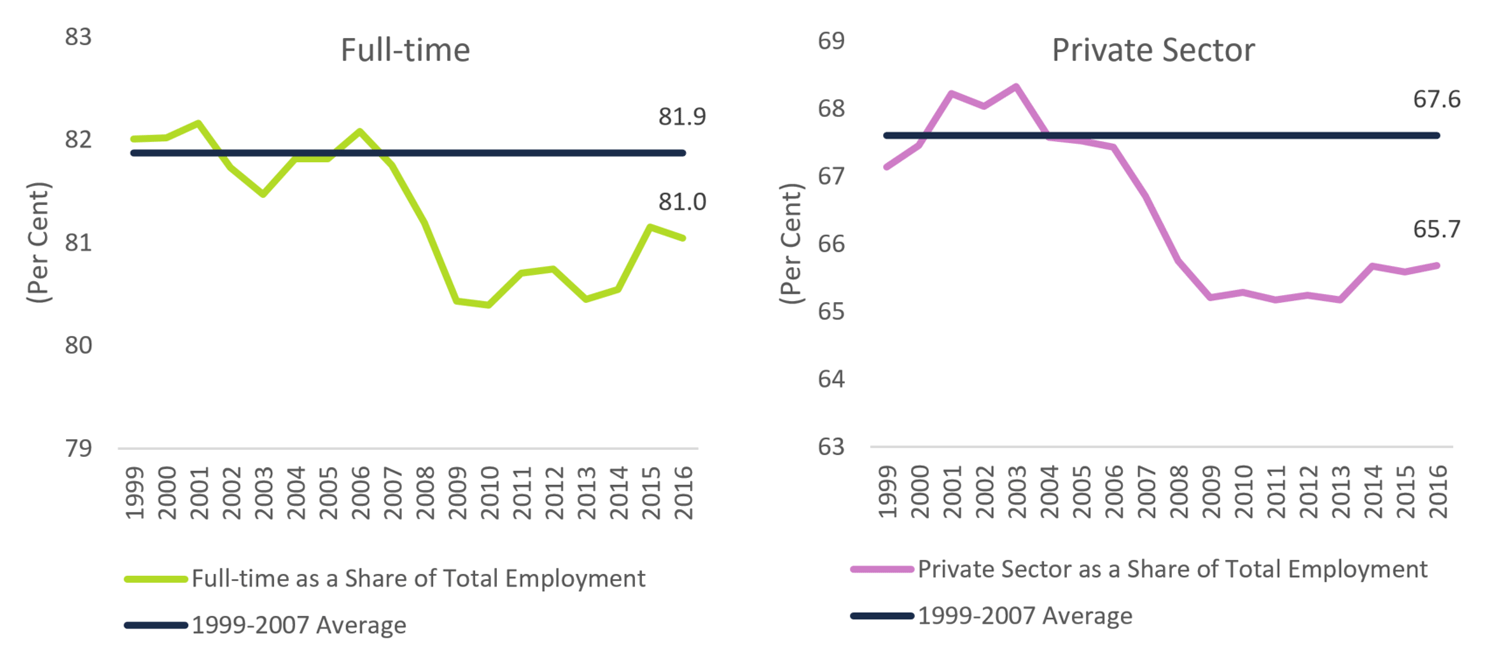
The majority of new jobs created in 2016 were in full-time positions (+54,400 jobs). Even so, the number of part-time jobs grew at a faster rate (1.7 per cent), resulting in the share of full-time employment relative to total employment slipping to 81.0 per cent in 2016, almost a full percentage point below the pre-recession average. An increase back to the average pre-recession share would require roughly 60,000 workers moving into full-time positions from part-time work.
Share of Full-time and Private Sector Workers Recovering Slowly
Source: Statistics Canada and FAO
Private-sector positions accounted for 74 per cent of total job growth in 2016, increasing the overall share of private-sector jobs to 65.7 per cent of total employment. Despite the solid private sector job gain last year, the share of private sector employment remains roughly two percentage points below its pre-recession average.
Ontario’s Employment Rate Has Not Recovered
While the overall Ontario unemployment rate has improved steadily since the recession, the employment rate (the share of the adult population with a job) remains well below pre-recession levels. During the 2008-2009 recession, Ontario’s employment rate dropped sharply, largely due to the significant rise in unemployment. However, as the economy has recovered, the overall employment rate has shown no sign of improvement.
Ontario’s overall employment rate reflects trends in three underlying age groups: young workers (ages 15 to 24), core-age workers (ages 25 to 54) and older workers (ages 55+). Much of the decline in Ontario’s employment rate can be attributed to the growing share of older workers relative to the size of the total population.[4] However, examining the employment rates of each age group provides insight into important underlying trends.
Youth Employment Rate Remains Stagnant, as Core-age Rate Continues to Recover
Source: Statistics Canada and FAO
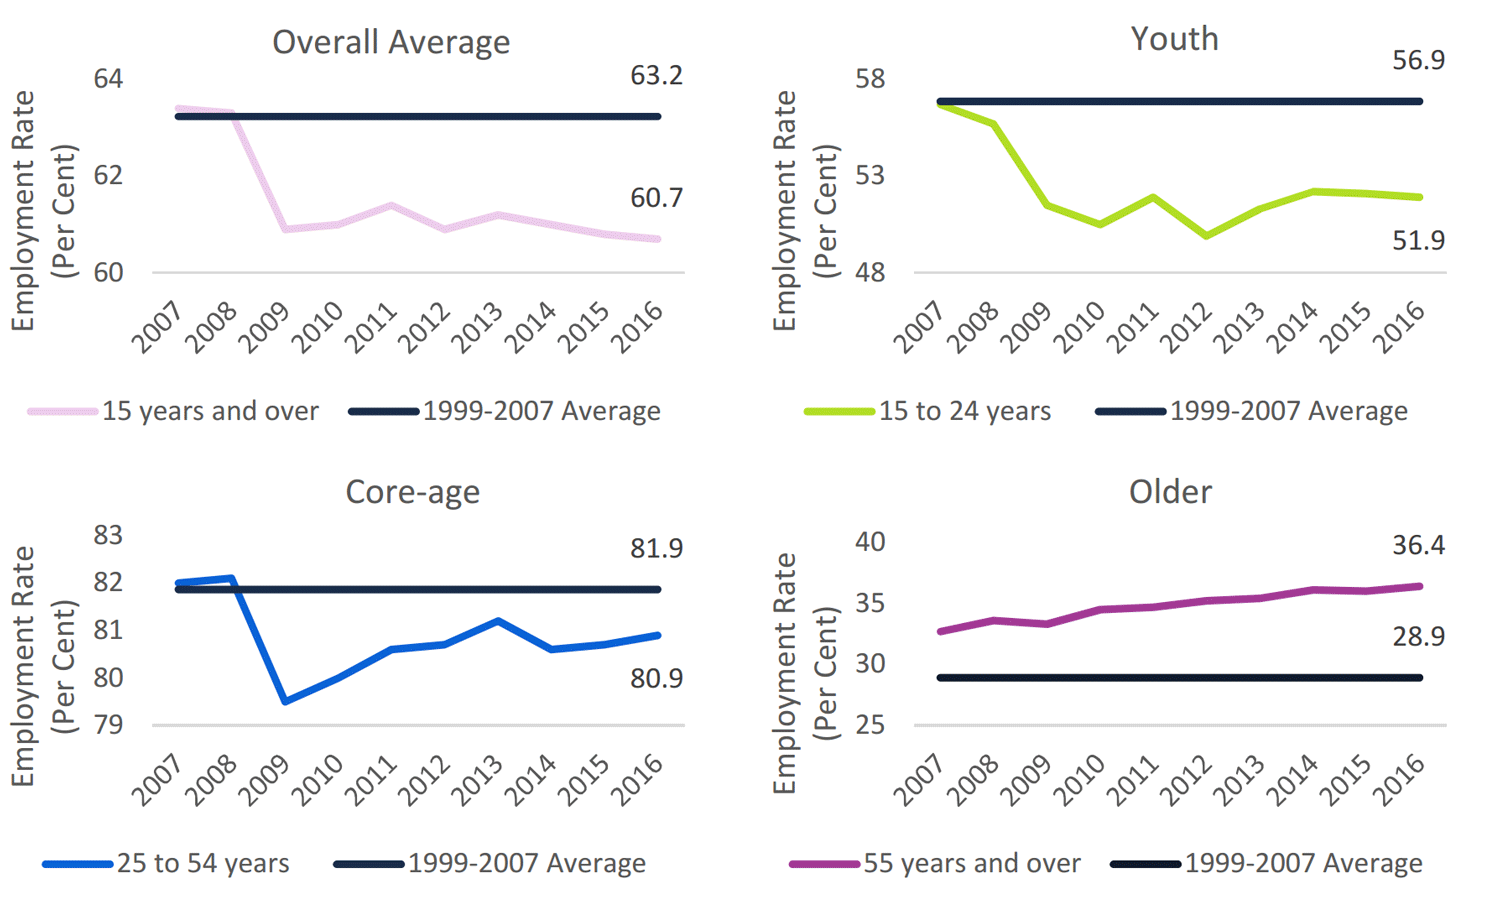
- Young workers continue to face a challenging job market as demonstrated by the lack of improvement in the youth employment rate since the recession. In 2016, the employment rate for young workers edged down to 51.9 per cent, five percentage points below the pre-recession average.
- The core-age worker employment rate has improved at a steady but moderate pace since the recession. In 2016, the core-age employment rate increased to 80.9 per cent, but remains one percentage point below the pre-recession average.
- The employment rate for older workers was largely unaffected by the recession and has been rising steadily since 1996, as older workers choose to remain in the workforce in increasing numbers.
Regional Disparities Persist
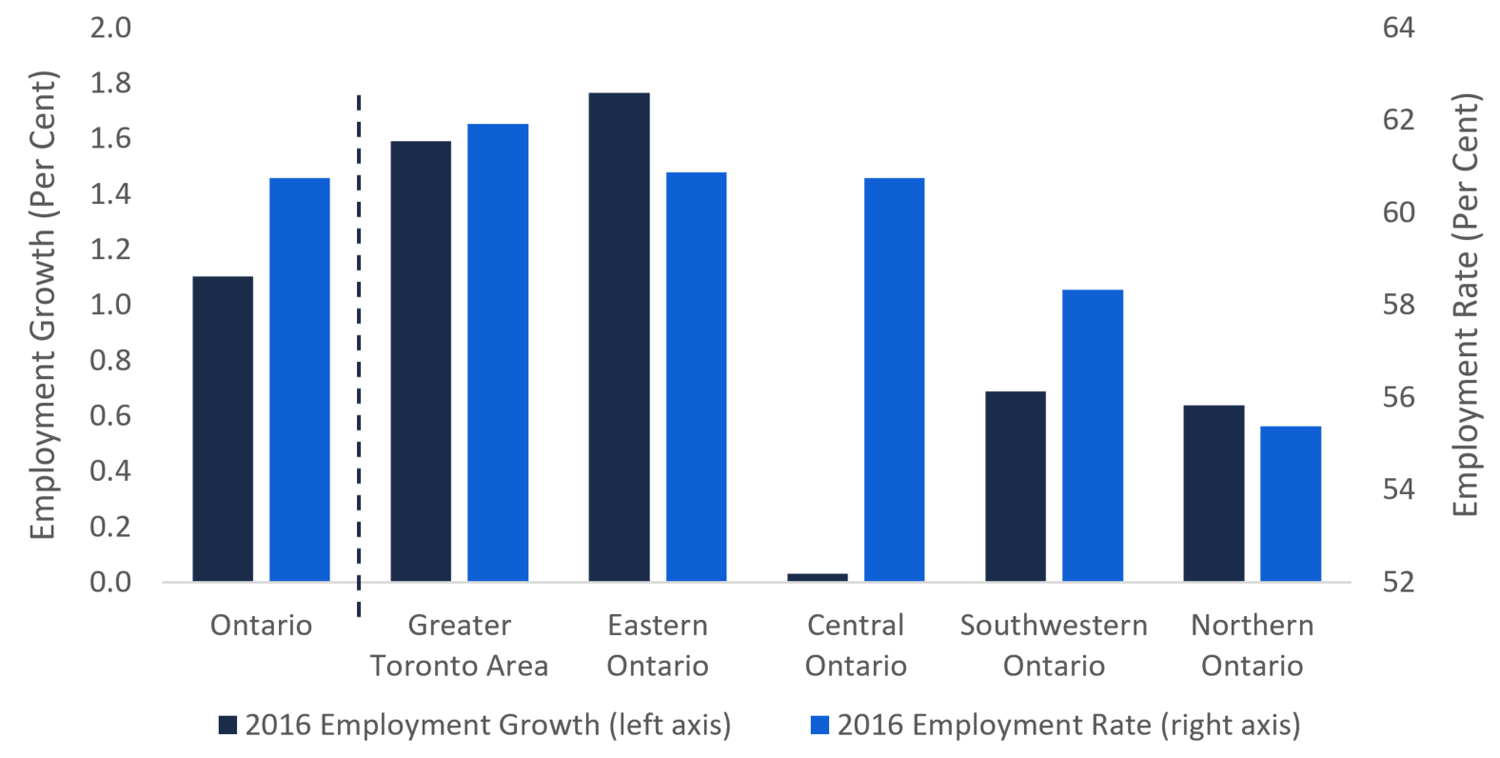
Finally, despite the solid overall provincial job gain in 2016, sharp regional disparities remain, particularly between the GTA and Northern and Southwestern Ontario.
- Employment in the GTA increased by a strong 52,800 net new jobs in 2016 (+1.6 per cent). The GTA also boasts the highest employment rate in the province at 61.9 per cent.
- Eastern Ontario also posted a strong job gain of 15,700 new jobs (+1.8 per cent) in 2016, increasing its employment rate above the provincial average to 60.9 per cent.
- Northern Ontario added 2,200 new positions (+0.6 per cent) in 2016. Despite the increase, Northern Ontario’s employment rate remains the lowest in the province at 55.4 per cent.
- Southwestern Ontario added 5,300 jobs in 2016 (+0.7 per cent). The region’s employment rate increased to 58.3 per cent, but remains below the provincial average.
- Central Ontario employment increased by just 500 net new jobs in 2016, while the region’s employment rate slipped to 60.7 per cent.
Northern and Southwestern Ontario Employment Rates Well Below Provincial Average
Source: Statistics Canada and FAO
Nicolas Rhodes
Economist
nrhodes@fao-on.org
David West
Chief Economist
dwest@fao-on.org
Financial Accountability Office of Ontario
2 Bloor Street West, Suite 900
Toronto, Ontario M4W 3E2
Media queries, contact: Kismet Baun, 416.254.9232 or email kbaun@fao-on.org.
[1] This Commentary reports 2016 labour market results based on LFS annual values. Other reports sometimes measure yearly performance by comparing December over December values.
[2] The employment rate is the number of employed relative to the size of the population.
[3] The regions include: the Greater Toronto Area, Southwestern Ontario (Windsor, London and Stratford areas), Central Ontario (Kitchener, Waterloo, Barrie, Hamilton, Niagara, Muskoka and Kawarthas areas), Eastern Ontario (Ottawa, Kingston and Pembroke areas) and Northern Ontario (Sudbury and Thunder Bay areas).
[4] As the population ages, older workers (who have a much lower employment rate than the overall working age population) account for a growing share of the total population and are exerting a downward pull on the overall employment rate.
Ontario Posts Solid Job Growth in 2016
This graph shows Ontario’s net employment change and unemployment rate from 2005 to 2016. Employment grew in 2016 by +76,400 positions, compared to +45,300 positions in 2015. The graph shows the unemployment rate declining since 2009, falling from 9.1 per cent in 2009 to 6.5 per cent in 2016.
Share of Full-time and Private Sector Workers Recovering Slowly
This figure shows two graphs. The first graph compares the share of full-time employment relative to total employment against its 1999-2007 average of 81.9 per cent. The graph shows a steep drop in the share of full-time positions from 2006 to 2009, falling from 82.1 per cent in 2006 to 80.4 per cent in 2009. After the drop, the share of full-time employment increased slightly, reaching 81.0 per cent in 2016. In 2016, the share was almost one percentage point below its 1999-2007 average.
The second graph compares the share of private sector positions relative to total employment against its 1999-2007 average of 67.6 per cent. The graph shows a steep drop in the share of private sector positions from 2006 to 2009, falling from 67.6 per cent in 2006 to 65.2 per cent in 2009. After the drop, the share of private sector employment increased slightly, reaching 65.7 per cent in 2016. In 2016, the share was almost two percentage points below its 1999-2007 average.
Youth Employment Rate Remains Stagnant, as Core-age Rate Continues to Recover
This figure shows four graphs, all of which compare a certain age group’s (15 years and over, 15 to 24 years, 25 to 54 years and 55 years and over) employment rate to their respective 1999-2007 employment rate average. The graphs each span the years 2007 to 2016.
The first graph compares the employment rate of those ages 15 and over against their 1999-2007 average employment rate of 63.2 per cent. The graph shows a steep drop in the employment rate from 2008 to 2009, falling from 63.2 per cent in 2008 to 60.9 per cent in 2009. After the drop, the employment rate declined slightly, falling to 60.7 per cent by 2016, 2.5 percentage points below its 1999-2007 average.
The second graph compares the employment rate of those ages 15 to 24 against their 1999-2007 average employment rate of 56.9 per cent. The graph shows a steep drop in the employment rate from 2007 to 2012, falling from 56.9 per cent in 2007 to 49.9 per cent in 2012. After the drop, the employment rate increased slightly, rising to 51.9 per cent by 2016, five percentage points below its 1999-2007 average.
The third graph compares the employment rate of those ages 25 to 54 against their 1999-2007 average employment rate of 81.9 per cent. The graph shows a steep drop in the employment rate from 2008 to 2009, falling from 82.1 per cent in 2008 to 79.5 per cent in 2009. After the drop, the employment rate increased steadily, rising to 80.9 per cent by 2016, one percentage point below its 1999-2007 average.
The fourth graph compares the employment rate of those ages 55 and over against their 1999-2007 average employment rate of 28.9 per cent. The graph shows that the employment rate was above the average rate by 2007 and continued to increase, rising to 36.4 per cent by 2016.
Northern and Southwestern Ontario Employment Rates Well Below Provincial Average
This graph compares both employment growth in 2016 (in per cent terms) and the employment rate in 2016 between Ontario and five regions within Ontario (the Greater Toronto Area, Eastern Ontario, Central Ontario, Southwestern Ontario and Northern Ontario). The Greater Toronto Area and Eastern Ontario had employment growth above the provincial average, while employment growth in Central, Southwestern and Northern Ontario were below the provincial average. The Greater Toronto Area and Eastern Ontario both had employment rates above the provincial average, the employment rate in Central Ontario was equivalent to the provincial average, and the employment rate in both Southwestern and Northern Ontario were below the provincial average.


