


The Government of Ontario’s (the Province's) annual deficit is a headline number in its Public Accounts and budget, as well as in the Financial Accountability Officer’s own Economic and Fiscal Outlook.[1] However, this number is not a cash concept. Rather, it is based on accrual accounting.[2] As such, it is difficult to determine the cash and borrowing requirements of the Province simply by considering its reported surplus/deficit.
For example, the Province reported a deficit of $5.0 billion in 2015-16. However, after adjusting for non-cash transactions and other asset/liability changes (e.g. accounts receivable), the Province required $1.4 billion in additional cash to finance its operations, and spent $10.9 billion in cash to purchase assets in 2015-16; resulting in a related borrowing requirement for cash of $12.3 billion.[3]
This example shows that largely because of cash outlays to acquire capital, the Provincial budget could be reported as in balance, while the net debt continues to grow. Therefore, while the annual surplus/deficit is an important and useful concept, cash flow is also an important part of understanding the Province’s finances for at least two reasons:
- Liquidity and solvency: [4] Ultimately, the Province requires cash to settle most of its obligations, such as paying down debt or paying its employees. As such, having access to sufficient cash to meet short-term requirements (liquidity) and long-term obligations (solvency) is critical to the Province delivering on its objectives. Also, there may be times when the Provincial requirements for cash suddenly increase, such as after the financial crisis in fiscal 2008-09. Given the timing of cash receipts from tax and other revenues can vary significantly, the ability to raise cash quickly is an important factor. The government credit rating analysis by bond-rating agencies is one measure to consider when evaluating this ability.
- Less policy influence in cash flows relative to the annual deficit. The annual deficit reflects non-cash transactions. For example, the Province recorded a $4.9 billion non-cash amortization expense in 2015-16,[5] which increased the annual deficit, but resulted in no cash outlay. The Province uses non-cash transactions to provide more relevant information regarding the use and benefits consumed from its assets. But estimating the value of these transactions requires more assumptions, which are subject to policy decisions by the Province and introduce uncertainty (e.g., determining the useful life of a provincial highway). In contrast, no assumptions are required to report the value of cash transactions.
Overall, understanding cash flows offers a perspective on the Province’s finances that is complementary to the annual deficit. This commentary provides information on the Province’s cash flows by answering the following questions:
- What are the sources of the Province’s cash?
- How is the Province’s cash used?
- How has this changed over time?
What are the sources of the Province’s cash?
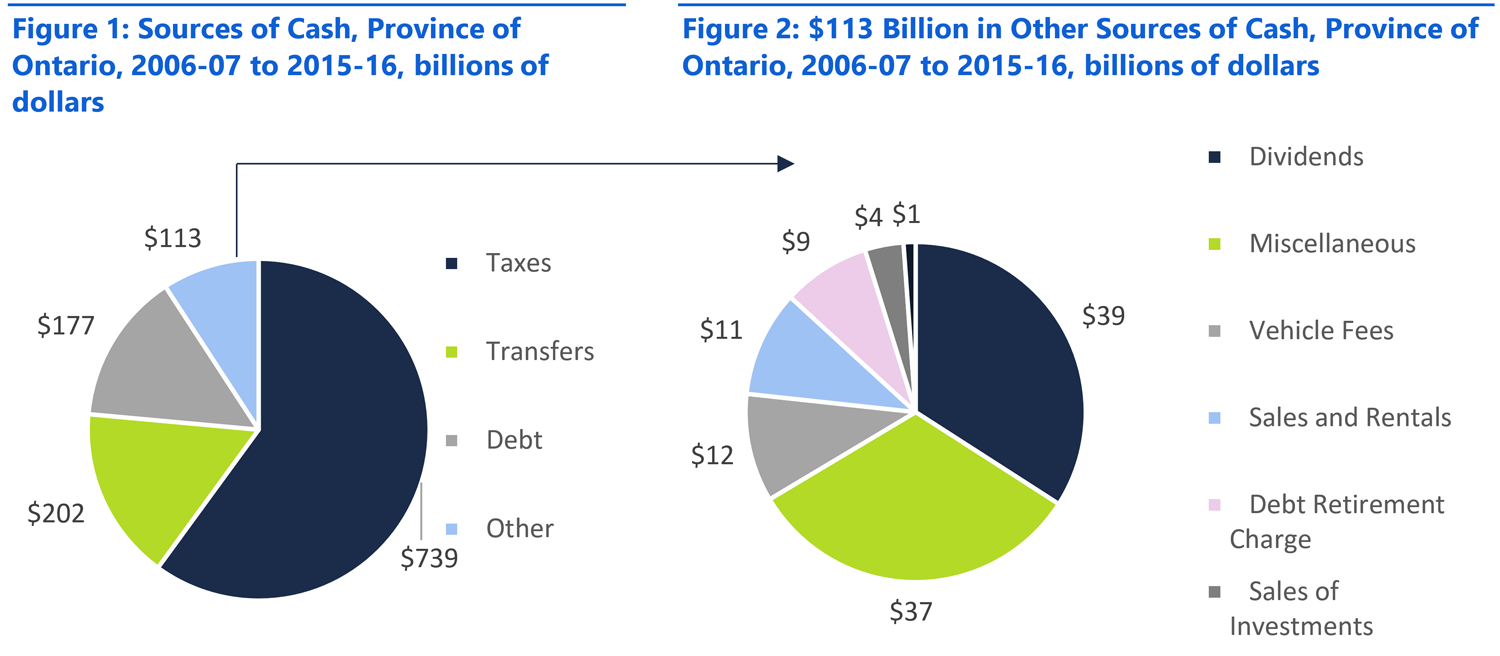
The Province has received about $1.2 trillion in cash over the past 10 fiscal years.[6] Figure 1 shows the FAO’s estimate[7] of the different sources of cash. The most significant sources are taxes ($739 billion) and cash received from the federal government ($202 billion). The Province received $177 billion in cash from issuing debt (on a net basis[8]) and $113 billion from other sources. Figure 2 also shows the FAO’s estimate of the different sources of cash included in the Other category. The most significant source of cash in this category is dividends received from government business enterprises (GBEs) ($39 billion). Other sources include vehicle and driver registration fees ($12 billion) and the electricity sector debt retirement charge ($9 billion), among others.
Source: FAO analysis of the Public Accounts of Ontario
For an accessible version of this chart click here
How is the Province’s cash used?
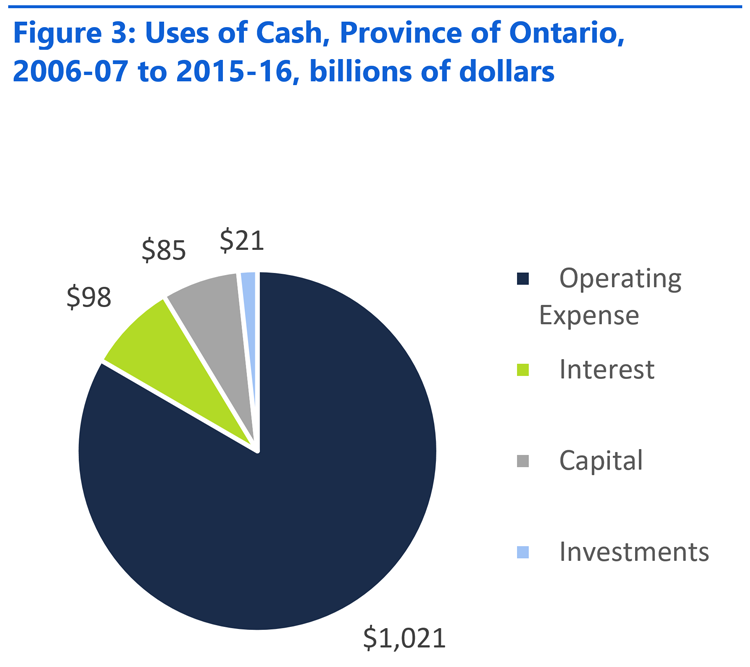
Figure 3 shows the FAO’s estimate of the uses of Provincial cash over the past 10 fiscal years. Overall, operating expenses[9] are the most significant use of cash ($1 trillion). All else equal, these expenses increase the annual deficit (reduce surplus) and include items such as supplies and equipment, transfer payments to municipalities and other organizations, and salaries and wages. For example, the Toronto Central Local Health Integration Network (LHIN) spent $3.6 billion on hospital operations in fiscal 2015-16.[10] The Province also used $98 billion in cash to pay interest on debt over the past 10 fiscal years. These interest payments also increase the deficit (reduce surplus), all else equal.
Capital spending is another use of Provincial cash, but unlike operating or interest expenses, capital spending does not immediately increase the annual deficit.[11] An example of capital spending is building a new school. The Province spent $85 billion on capital assets over the past 10 years.[12] Lastly, the Province spent $21 billion in cash to purchase investments, such as the Province’s temporary investment in General Motors.[13] Most of these investments were government bonds.[14]
Source: FAO analysis of the Public Accounts of Ontario
For an accessible version of this chart click here
How has this changed over time?
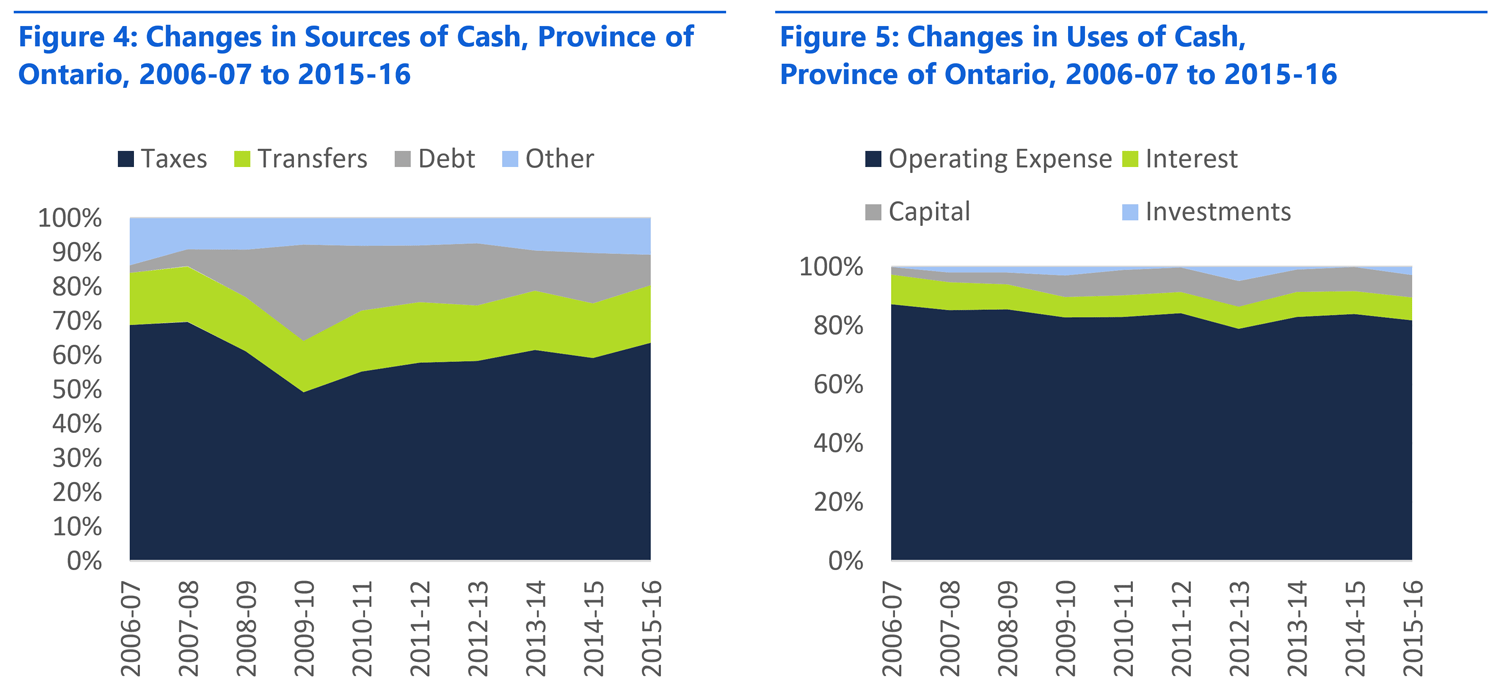
Figure 4 shows the FAO’s estimate of how the composition of Provincial cash sources has changed over the past 10 fiscal years. A greater portion of cash was sourced from issuing debt from 2006-07 to 2009-10. Since then, cash has been sourced more from taxes and less from debt. Within the $113 billion of “Other” cash sources, the miscellaneous category[15] had the most significant change, contributing about 43 per cent in 2006-07 but only 25 per cent in 2015-16. The contribution of dividends from GBEs increased by eight per cent over the period. Also within the Other category (Figure 4), the contribution from sales of investments increased in recent years, reflecting the Province’s sale of its shares in General Motors and Hydro One. Finally, within the Other category, the contribution of the electricity sector debt retirement charge will disappear with its elimination on April 1, 2018.[16] Figure 5 shows the FAO’s estimate of how Provincial cash use has changed over the past 10 fiscal years. The contribution of operating expenses declined by four per cent over the period, while the contribution of capital spending increased by four per cent. In dollar terms, capital spending rose from $2.5 billion in 2006-07 to $11 billion in 2015-16.
Source: FAO analysis of the Public Accounts of Ontario
For an accessible version of this chart click here

Key Messages
- After taking into account debt repayment, the Province has received about $1.2 trillion in cash over the past 10 fiscal years. Most of this cash has been sourced from taxes. Federal transfers are the next most significant source.
- Most of the Province’s cash has been spent on operating expenses.
- Provincial cash has been sourced more from taxes and less from debt in recent years, which, all else equal, reduces the annual deficit and slows the growth of debt.
- Provincial cash has increasingly been used to acquire capital in recent years. Because acquiring capital does not immediately affect the deficit (surplus), the Province’s net debt may continue to increase even after the budget is balanced.
Matthew Stephenson
Financial Analyst
mstephenson@fao-on.org
Peter Harrison
Chief Financial Analyst
pharrison@fao-on.org
Financial Accountability Office of Ontario
2 Bloor Street West, Suite 900
Toronto, Ontario M4W 3E2
Media queries, contact: Kismet Baun, 416.254.9232 or email kbaun@fao-on.org.
[2] Accrual accounting records revenues when earned and expenses when occurred; not when the actual cash is received or paid. For example, tax revenues are recorded immediately when the taxes are assessed, even though it may take several years for the associated cash payments to be received due to appeals and re-assessments.
[3] Public Accounts of Ontario, 2015-16. Page 51.
[4] Liquidity is how easily an asset can be converted into cash. For example, it is usually easier to convert short term investments into cash than capital assets such as vehicles. Solvency is the ability to pay for certain financial obligations. For example, it is usually easier to pay down debt or pay employees if there is more cash available.
[5] Public Accounts of Ontario, 2015-16. Page 51.
[6] FAO analysis of the Public Accounts of Ontario. The FAO estimates the total amount of cash received at $1.4 trillion. The difference between the $1.2 trillion is because the FAO has subtracted cash used for debt retirement from the cash raised from debt issuances. The FAO subtracts debt retirement from debt issuance, because the Province regularly pays down debt as the term of that debt expires.
[7] The Province’s capital, investing and financing cash flows were taken directly from the Public Accounts of Ontario. However, the FAO made some assumptions to reconcile the Province’s operating cash flows to the Consolidated Statement of Operations.
[8] The Province received about $360 billion from debt issuances and it retired about $184 billion in debt.
[9] The FAO defines operating expenses as all of the non-interest transactions that reduce the Province’s operating cash flow. A complete list of these expenses is provided in Schedule 3 of the Public Accounts of Ontario (2015-16), page 92. However, these include non-cash expenses. The FAO has adjusted these expenses to a cash-basis.
[10] Volume 1 of the Public Accounts of Ontario 2015-16, page 2-254. These expenses have not been adjusted to a cash-basis.
[11] The annual deficit is not immediately impacted. However, amortization expenses, which are related to capital spending, will increase the annual expenses and impact the surplus/deficit over time.
[12] This does not include transfers to non-consolidated entities for capital spending purposes. These transfers are included in operating expenses.
[13] Public Accounts of Ontario (2013-14), page 61
[14] Public Accounts of Ontario (2015-16), page 73
[15] The FAO has defined the miscellaneous category to include all the cash sources as defined on page 89 of the Public Accounts of Ontario 2015-16, with the exception of the following; sales and rentals, vehicle and driver registration fees and the electricity debt retirement charge.
[16] 2016 Ontario Budget, page 39.
Figure 1: Sources of Cash, Province of Ontario, 2006-07 to 2015-16, billions of dollars
This figure shows the different sources of Provincial cash over the past 10 fiscal years; from 2006-07 to 2015-16. This figure shows that overall, the FAO estimates that the Province has sourced a total of $1.2 trillion in cash. This figure shows that the most significant sources are taxes ($739 billion) and cash received from the federal government ($202 billion). This figure shows that the Province received $177 billion in cash from issuing bonds on a net basis and $113 billion from other sources.
Figure 2: $113 Billion in Other Sources of Cash, Province of Ontario, 2006-07 to 2015-16, billions of dollars
This figure shows the FAO’s estimate of the different sources of cash included in the other category. This figure shows that the most significant source of cash in this category is dividends received from government business enterprises (GBEs) ($39 billion). This figure shows that other sources of cash in this category include vehicle and driver registration fees ($12 billion) and the electricity sector debt retirement charge ($9 billion), among others.
Figure 3: Uses of Cash, Province of Ontario, 2006-07 to 2015-16, billions of dollars
This figure shows the different uses of Provincial cash over the past 10 fiscal years; from 2006-07 to 2015-16. This figure shows that the most significant use of Provincial cash was for operating expenses ($1 trillion). This figure shows that the Province spent $98 billion in cash on paying for interest expenses and $85 billion on capital assets. This figure shows that the Province spent $21 billion in cash on purchasing investments.
Figure 4: Changes in Sources of Cash, Province of Ontario, 2006-07 to 2015-16, billions of dollars
This figure shows the FAO’s estimate of how the composition of Provincial cash sources has changed over the past 10 fiscal years; from 2006-07 to 2015-16. This figure shows that a greater portion of cash was sources from issuing debt from 2006-07 to 2009-10. This figure shows that since 2009-10, cash has been sourced more from taxes and less so from debt.
Figure 5: Changes in Uses of Cash, Province of Ontario, 2006-07 to 2015-16, billions of dollars
This figure shows the FAO’s estimate of how the composition of Provincial cash uses has changed over the past 10 fiscal years; from 2006-07 to 2015-16. This figure shows that the contribution of operating expenses declined by four per cent over the period, while the contribution of capital spending increased by four per cent.


