


Ongoing budget surpluses expected for Ontario
1. Summary
This Economic and Budget Outlook report provides the FAO’s projection of the Ontario government’s fiscal position over the 2022-23 to 2027-28 period. The report compares the FAO’s outlook to the government’s plan presented in the 2022 Ontario Budget for the budget balance, key debt measures, revenues and program spending, and describes the FAO’s updated economic outlook. The FAO’s revenue and program spending projections are based on current and announced government policies.
Ontario’s economic growth set to slow
Ontario’s economy expanded rapidly in 2021 and 2022 as the province recovered from the pandemic. However, Ontario’s economic growth is projected to slow sharply in 2023, reflecting the impact of higher interest rates, ongoing inflation and the weaker global environment. Real GDP growth of 3.3 per cent is projected for 2022, slowing to just 0.7 per cent in 2023, then stabilizing at 1.9 per cent over the rest of the outlook.
FAO projects rising budget surpluses under current policies
With a strong economy driving extraordinary revenue growth, the Province recorded a $2.1 billion budget surplus in 2021-22. While revenue growth is projected to slow from its current pace, it will continue to outpace program spending increases over the FAO's outlook, leading to growing budget surpluses from $0.1 billion in 2022-23 to $8.5 billion in 2027-28. These surpluses are a substantial improvement compared to the deficits forecast in the 2022 Ontario Budget.
Budget surpluses would improve fiscal sustainability indicators
Ontario’s net debt-to-GDP ratio is projected to decline from 39.2 per cent in 2021-22 to 31.5 per cent by 2027-28, the lowest since 2008-09, as ongoing surpluses would slow the growth of net debt compared to nominal GDP. Interest on debt as a share of revenue is projected to decline from 6.8 per cent in 2021-22 to 5.8 per cent in 2027-28, the lowest share on record back to the early 1980s and 1.7 percentage points below the 2022 budget forecast.
Government spending plan contains funding shortfalls in every program sector, offset by historically high unallocated contingency funds
Compared to the FAO’s spending projection, the spending plan in the 2022 Ontario Budget contains funding shortfalls across all program sectors, which total an estimated $40.0 billion over six years. However, the FAO estimates that the government’s spending plan includes $44.0 billion in unallocated contingency funds. The Province will need to use these contingency funds to address the program sector shortfalls identified by the FAO, or make program changes to achieve its sector spending plan targets.
2. Budget and Debt Outlook
High inflation drives revenue strength and budget surpluses
In 2021-22, Ontario recorded a budget surplus of $2.1 billion – the ninth surplus since 1981-82. This surplus was a sharp reversal from the deficits projected by both the FAO and the government.[1] The 2021-22 budget surplus primarily reflected extraordinary growth in revenue,[2] as strong employment growth and high inflation pushed up incomes, household spending and tax revenues.[3]
The FAO projects budget surpluses growing from $0.1 billion in 2022-23 to $8.5 billion by 2027-28. While revenue growth is projected to slow from its current pace, the FAO projects that it will continue to outpace program spending increases over the outlook under current policies. These surpluses are a substantial improvement compared to the deficits forecast in the 2022 Ontario Budget.
Figure 2.1 The FAO is projecting growing budget surpluses over the outlook
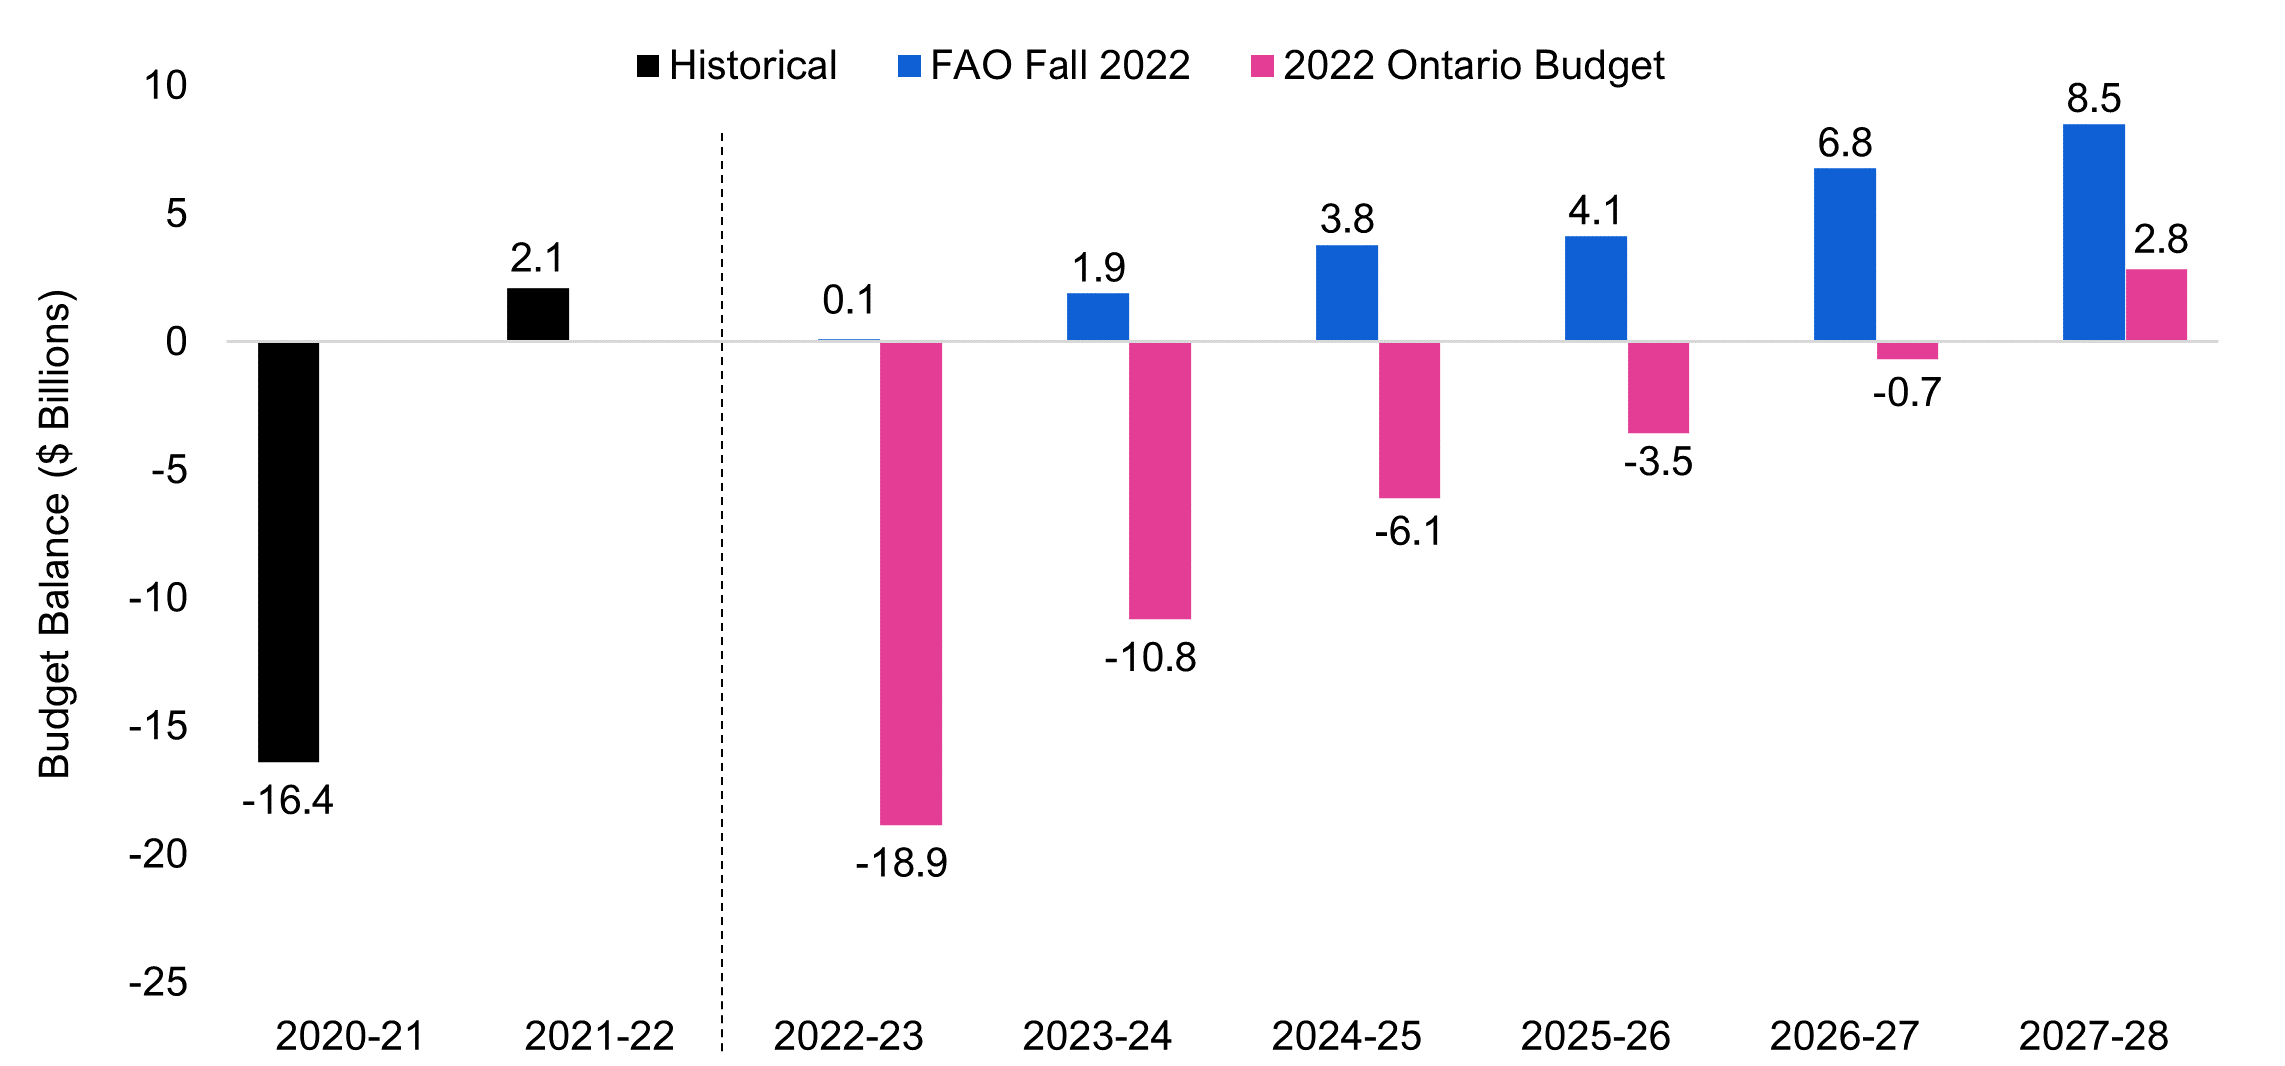
Note: The budget balance from the 2022 Ontario Budget is shown before the reserve.
Source: Ontario Public Accounts, 2022 Ontario Budget and FAO.
However, if the government makes future announcements, such as new tax cuts, spending initiatives or a combination of both, the FAO’s budget projection would deteriorate. There are also significant downside risks to the economic outlook that could negatively affect Ontario’s fiscal outlook.
Budget surpluses would improve Ontario's fiscal sustainability indicators significantly
Figure 2.2 Ontario’s debt burden would decline due to ongoing budget surpluses
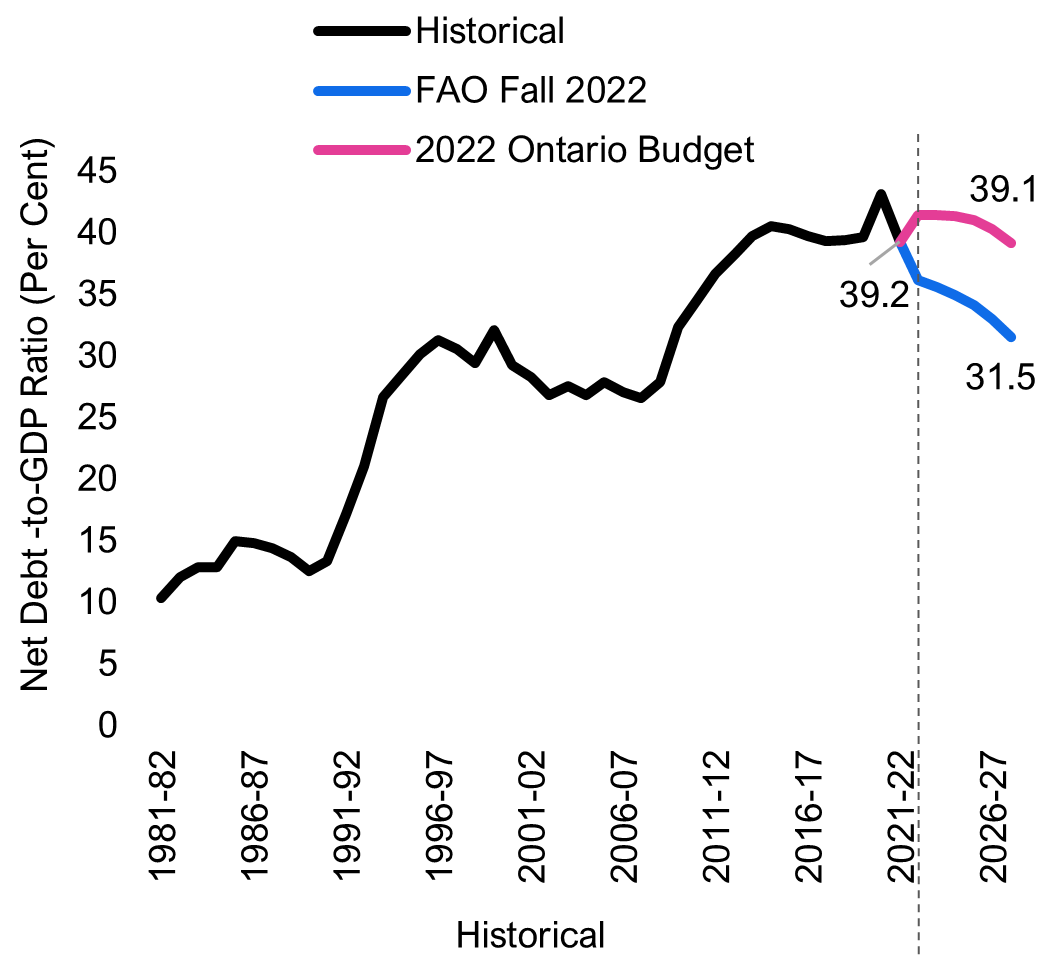
Source: Ontario Public Accounts, Ontario Economic Accounts, 2022 Ontario Budget and FAO.
Ontario’s net debt-to-GDP ratio declined from a record 43.1 per cent in 2020-21 to 39.2 per cent in 2021-22 – the lowest reading since 2012-13. The decline was the result of the budget surplus combined with historically high growth in Ontario’s nominal GDP.[4]
In the FAO's projection, ongoing budget surpluses would slow the accumulation of net debt over the outlook. As net debt grows slower than the rate of nominal GDP growth, Ontario’s net debt-to-GDP ratio is projected to decline to 31.5 per cent by 2027-28. This would mark the lowest ratio since 2008-09 and is 7.6 percentage points below the projection in Ontario’s 2022 budget.
Figure 2.3 Ontario’s interest expense as share of revenue projected to reach a 40-year low
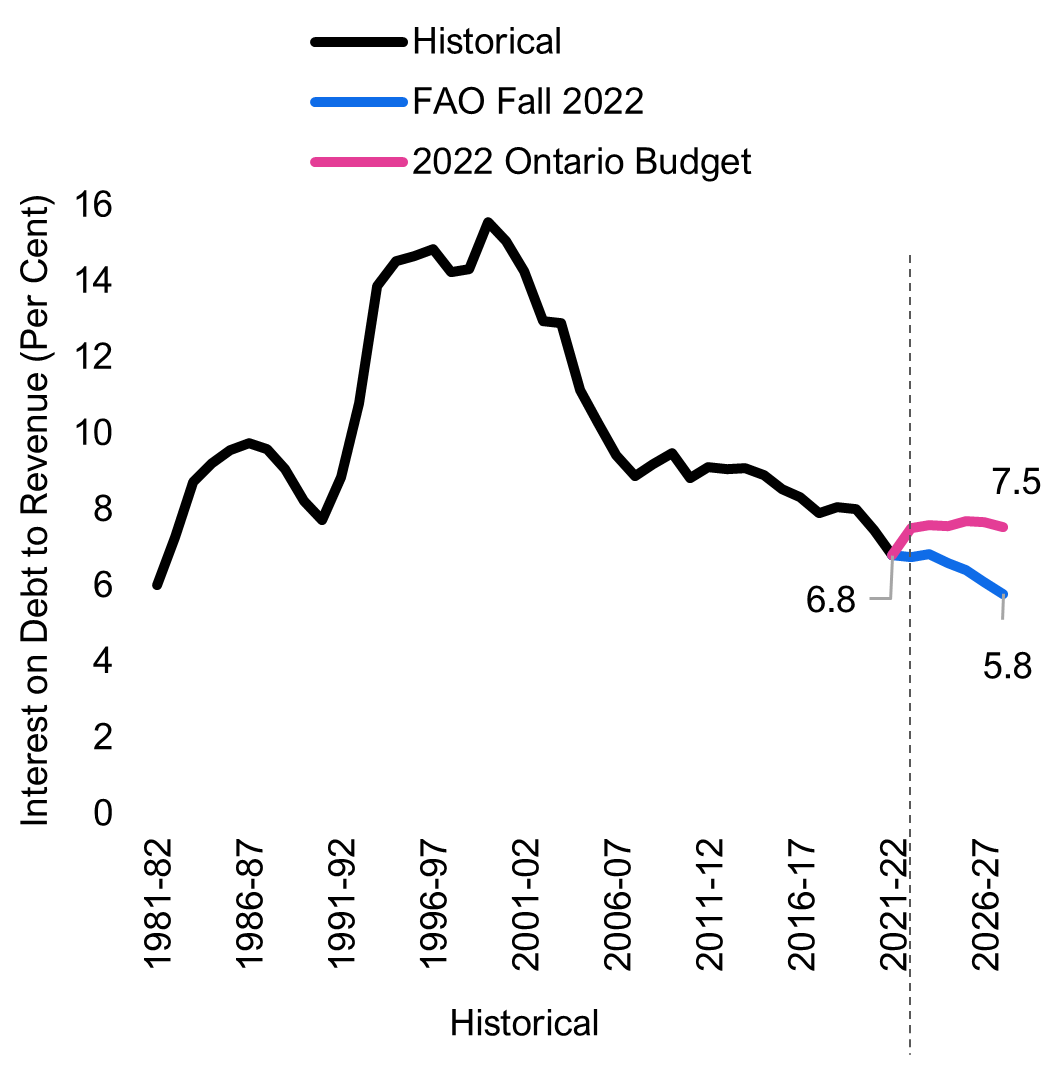
Source: Ontario Public Accounts, Ontario Economic Accounts, 2022 Ontario Budget and FAO.
Ontario’s interest payments declined from 7.4 per cent of total revenue in 2020-21 to 6.8 per cent in 2021-22, reflecting in part very strong growth in total revenues.
Over the outlook, ongoing budget surpluses mitigate the impact of rising interest rates on Ontario’s debt expense.[5] As a share of revenue, debt interest payments are projected to decline further to 5.8 per cent in 2027-28, the lowest share on record back to the early 1980s and 1.7 percentage points below the projection in Ontario’s 2022 budget.
3. Revenue Outlook
FAO projects higher revenues than the 2022 Ontario Budget
Total revenue grew by $20.2 billion (12.2 per cent) in 2021-22.[6] This was driven mainly by historically strong growth of 18.8 per cent in tax revenues,[7] as employment rebounded and higher inflation pushed up incomes and household spending, leading to extraordinary gains in personal income tax (15.9 per cent growth in 2021-21), corporations tax (41.9 per cent) and sales tax (14.2 per cent).
Figure 3.1 FAO projects higher revenue than the budget
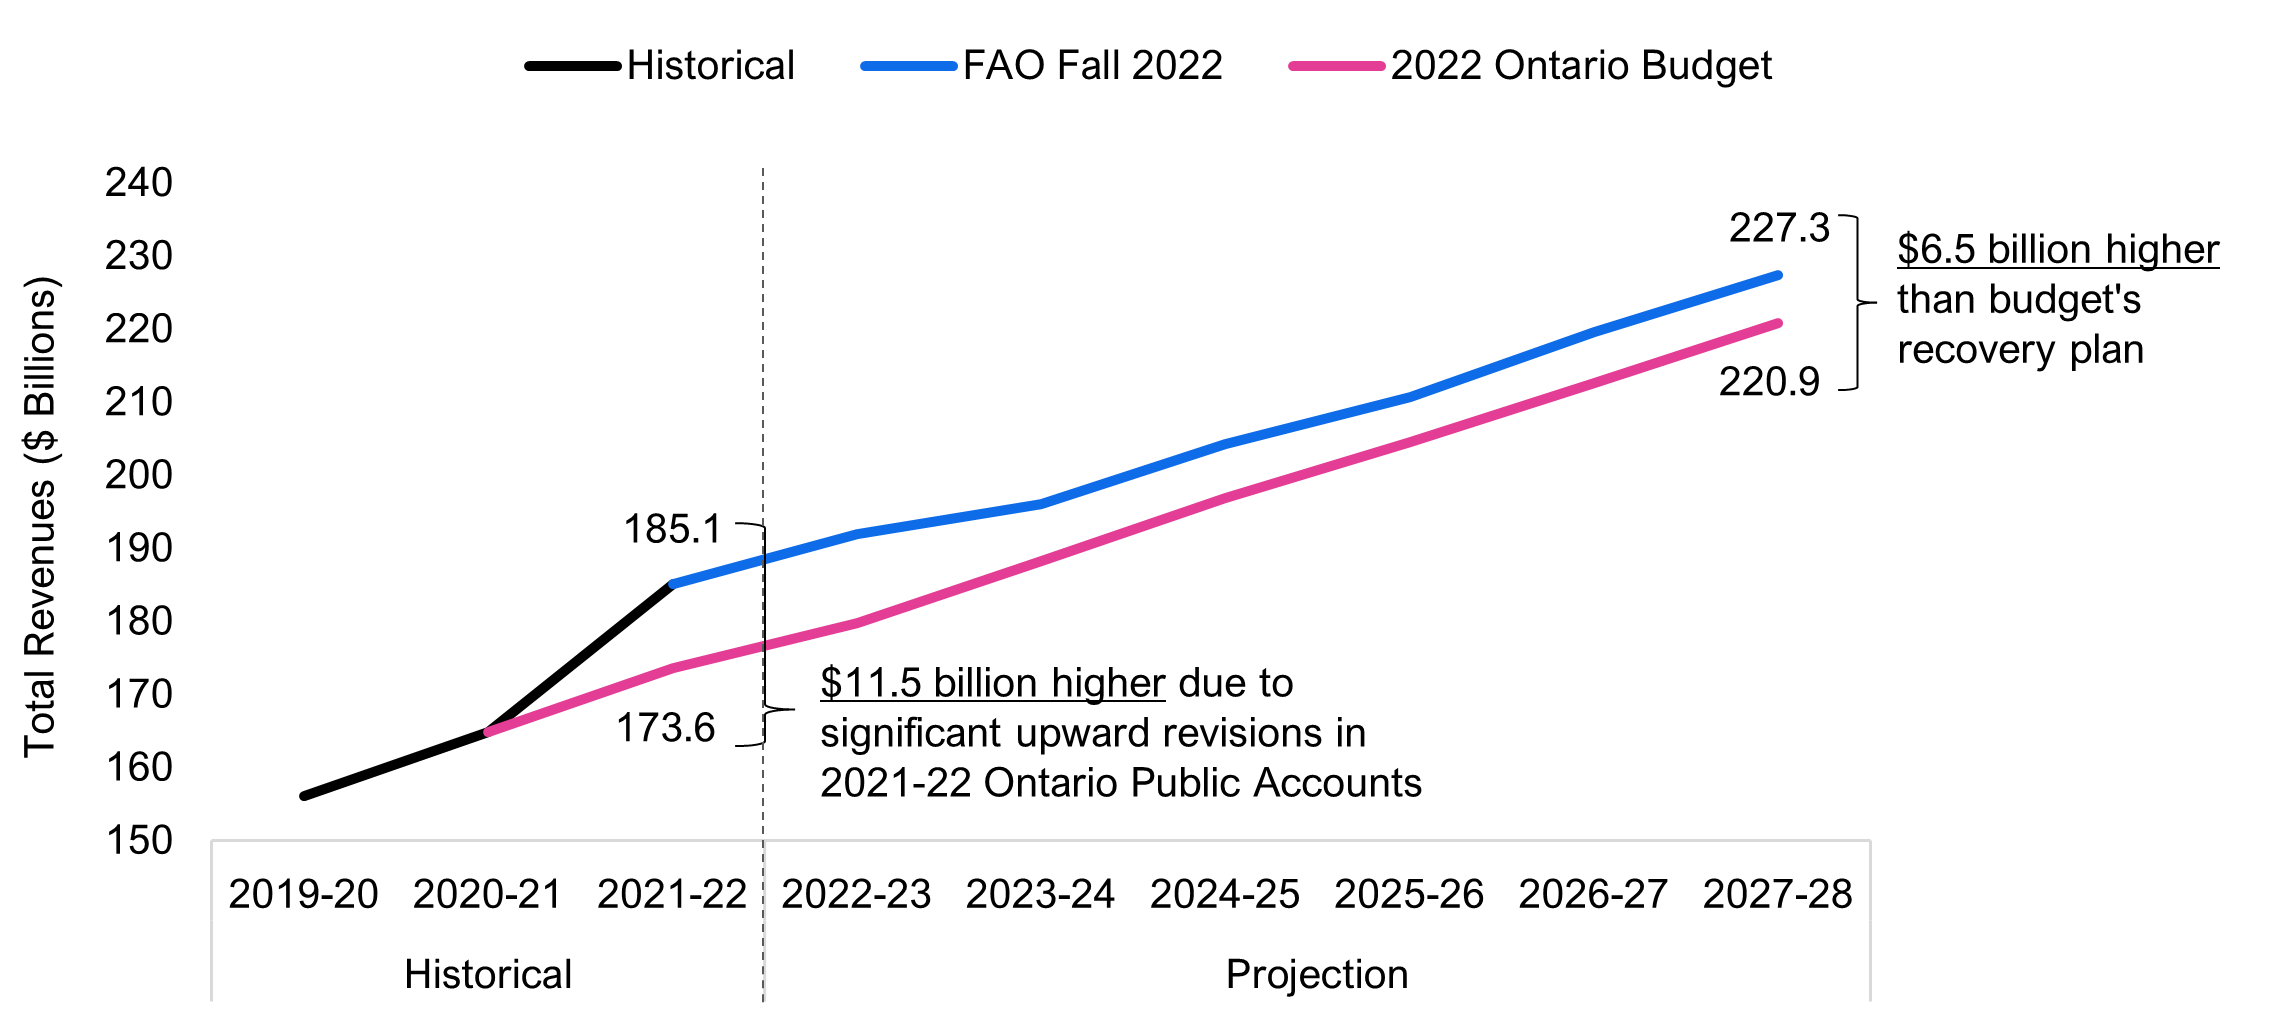
Note: 2022 Ontario Budget revenues in 2021-22 were estimates at the time of the budget’s release.
Source: Ontario Public Accounts, 2022 Ontario Budget and FAO.
Revenues are projected to grow at an average annual rate of 3.5 per cent over the 2022-23 to 2027-28 period, as increases in nominal GDP, the main driver of revenues, moderates in response to reduced household purchasing power and higher interest rates.
The FAO’s revenue projection is significantly higher than the 2022 Ontario Budget outlook. This is primarily due to the exceptional increase in 2021-22 revenue, which was $11.5 billion higher than projected in the budget. By 2027-28, this gap narrows to $6.5 billion, reflecting the FAO’s weaker projected economic growth relative to the budget.
The FAO’s revenue outlook is consistent with the economic outlook in Chapter 5, which projects a significant slowdown for Ontario’s economy in 2023 but does not anticipate a recession. However, numerous downside risks exist to the economic outlook that could negatively impact future revenue growth.
4. Program Spending Outlook
The FAO projects that the Province will spend $178.9 billion on programs in 2022-23, a 5.0 per cent increase from the $170.5 billion spent in 2021-22. Looking forward, the FAO estimates that program spending will grow at an average annual rate of 3.2 per cent, reaching $205.7 billion by 2027-28. Excluding the impact of the COVID-19 pandemic on provincial spending, the FAO projects that spending on programs will grow at an average annual rate of 3.9 per cent from 2020-21 to 2027-28.[8]
FAO’s program spending projection is lower than the government’s until 2024-25, but higher over the following three years
Over the first three years of the outlook, the FAO’s program spending projection is lower than the government’s spending plan in the 2022 Ontario Budget. The FAO expects that spending on programs will be $6.3 billion lower than planned by the Province in 2022-23, narrowing to $1.1 billion less than planned in 2024-25. However, over the next three years, from 2025-26 to 2027-28, the FAO’s program spending projection is higher than the government’s spending plan by $0.7 billion in 2025-26, rising to $4.3 billion in 2027-28.
Figure 4.1 FAO’s program spending projection is lower than the government’s until 2024-25, but higher over the following three years
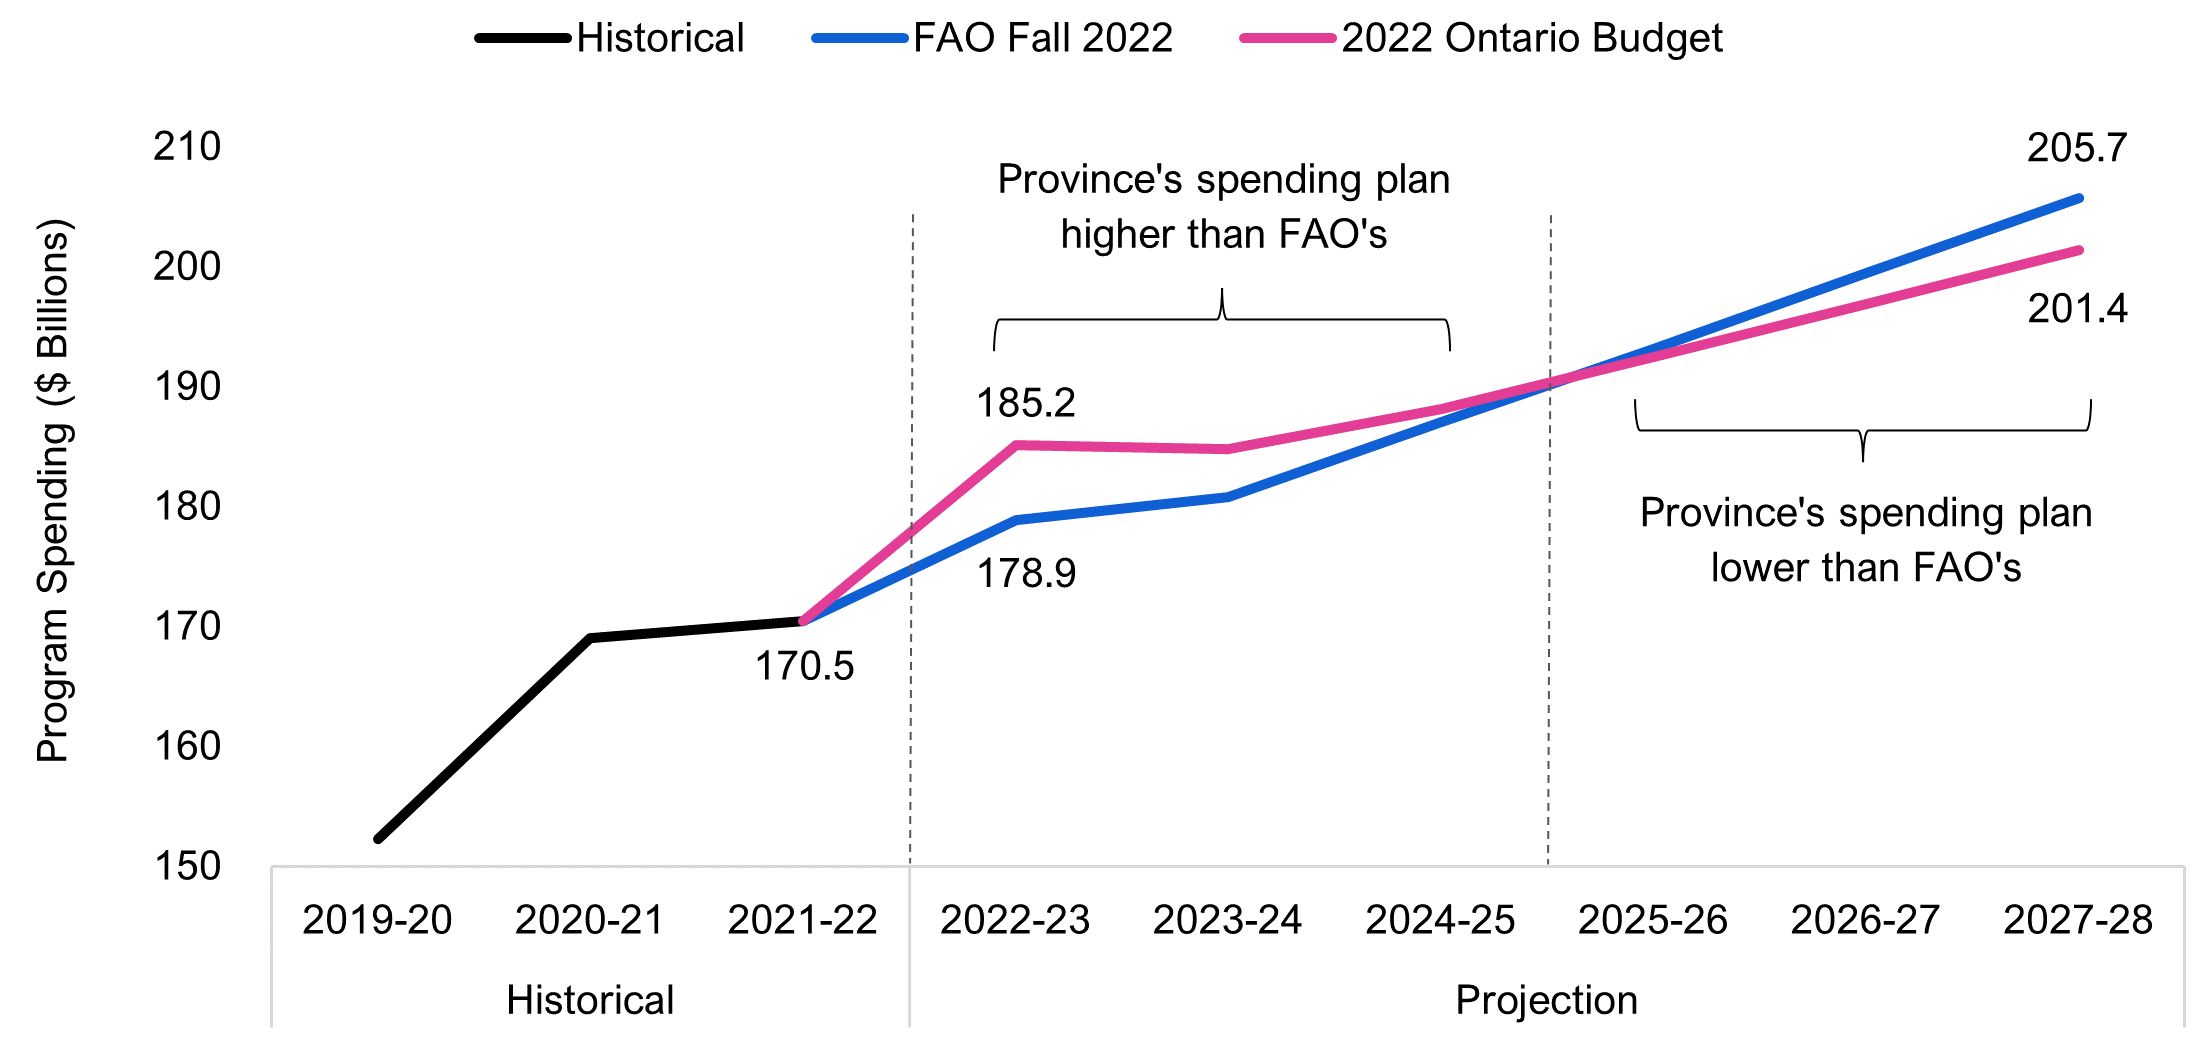
Source: Ontario Public Accounts and FAO analysis of the 2022 Ontario Budget and information provided by the Ministry of Finance.
Government spending plan contains funding shortfalls in every program sector, offset by historically high unallocated contingency funds
Compared to the FAO’s spending projection, the spending plan outlined in the 2022 Ontario Budget contains funding shortfalls across all program sectors. These shortfalls, which exclude unallocated contingency funds, total a combined $40.0 billion over the six-year period from 2022-23 to 2027-28. By sector, the largest shortfall is in health ($23.4 billion over six years), followed by education ($6.0 billion), children’s and social services ($4.3 billion), postsecondary education ($2.7 billion), justice ($2.3 billion) and ‘other programs’ ($1.4 billion).
However, the FAO estimates that the government’s spending plan also includes $44.0 billion in unallocated contingency funds over the six-year period.[9] The Province will need to use these contingency funds to address the program sector shortfalls identified by the FAO or, alternatively, make changes to lower program spending if the Province intends to achieve its sector spending plan targets in the 2022 budget. If the government addresses the projected spending shortfalls using $40.0 billion in contingency funds, then an estimated $3.9 billion in contingency funds would still be available to introduce new programs, enhance existing programs or improve the budget balance. The FAO’s outlook assumes that the Province uses the $3.9 billion in remaining contingency funds to improve the budget balance.
| Program Spending Difference, Province vs. FAO, $ millions | |||||||
|---|---|---|---|---|---|---|---|
| Sector | 2022-23 | 2023-24 | 2024-25 | 2025-26 | 2026-27 | 2027-28 | Total |
| Health | 502 | -2,014 | -4,879 | -5,233 | -6,232 | -5,526 | -23,382 |
| Education | -436 | -168 | -403 | -1,119 | -1,815 | -2,015 | -5,955 |
| Postsecondary Education | 47 | -245 | -262 | -505 | -728 | -959 | -2,651 |
| Children's and Social Services | 189 | -393 | -753 | -904 | -1,063 | -1,340 | -4,263 |
| Justice | -134 | -320 | -385 | -468 | -502 | -524 | -2,333 |
| Other Programs | 1,542 | 538 | -433 | -640 | -1,001 | -1,454 | -1,448 |
| Sum of Sector Differences | 1,710 | -2,601 | -7,115 | -8,868 | -10,636 | -12,523 | -40,033 |
| Contingency Funds (Excluded from FAO sector projections) | 4,550 | 6,600 | 8,200 | 8,200* | 8,200* | 8,200* | 43,950* |
| Total Program Spending Difference | 6,260 | 3,999 | 1,085 | -668 | -2,436 | -4,323 | 3,917 |
5. Economic Outlook
The global economic outlook has weakened
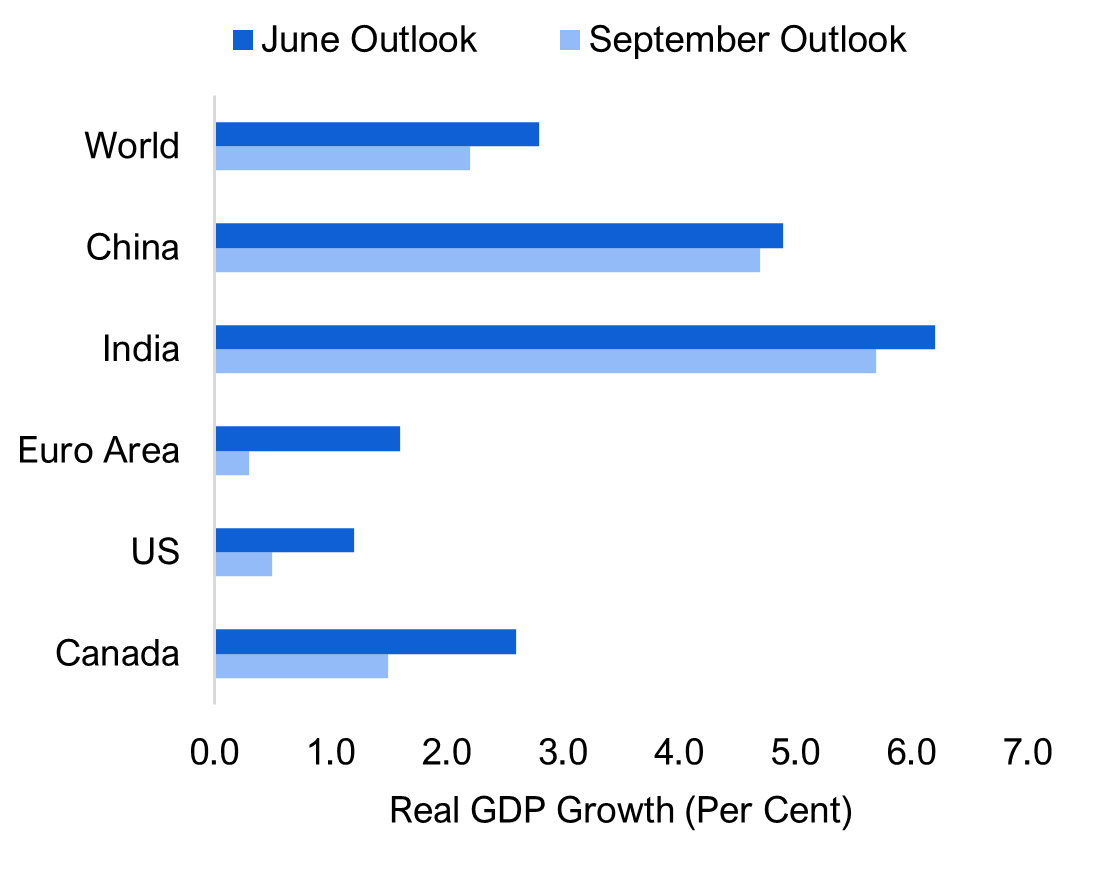
After the global economy grew by 6.0 per cent in 2021, both the International Monetary Fund (IMF) and the Organisation for Economic Co-operation and Development (OECD) are projecting that growth will slow in 2022 to around 3.0 per cent.[10]
For 2023, the OECD’s September outlook lowered expectations for global economic growth to 2.2 per cent, with notable weakness in the Euro area, the United States and Canada.[11] The IMF’s downgraded projection expects global growth of 2.7 per cent in 2023.[12]
Reduced household purchasing power coupled with central banks raising interest rates to slow inflation are the key drivers of the slowdown in global economic growth.
Many countries have seen rapid increases in the cost of living beginning in 2021. Supply chain challenges, regional COVID-19 related lockdowns in China, and high demand for goods and services (supported by government stimulus spending and historically low interest rates) have all contributed to rising costs globally. In addition, the war in Ukraine has caused energy prices in Europe to soar and fueled a steep rise in global food prices, aggravating inflationary pressures.
Ontario outlook: high inflation and rising interest rates to slow economy
Figure 5.2 Higher inflation projected in Ontario over the next two years
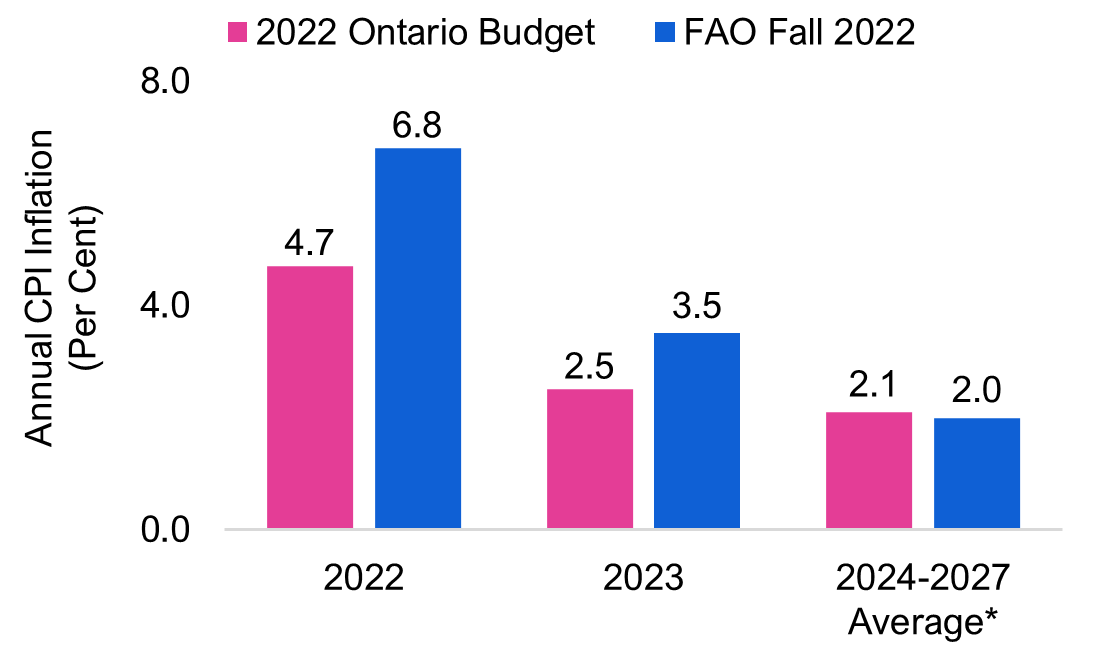
* 2024-2025 average for Ministry of Finance forecast.
Source: 2022 Ontario Budget and FAO.
Ontario’s annual average inflation rate is expected to reach a 40-year high of 6.8 per cent in 2022, reflecting rapid price increases for many components of the consumer price index (CPI), especially food, energy and shelter. Inflation is expected to trend lower in 2023, as higher interest rates slow demand and supply chains improve, alleviating shortages. As supply and demand factors become better balanced, inflation is expected to settle close to historical averages by 2024.
Figure 5.3 Interest rates to continue rising in 2023
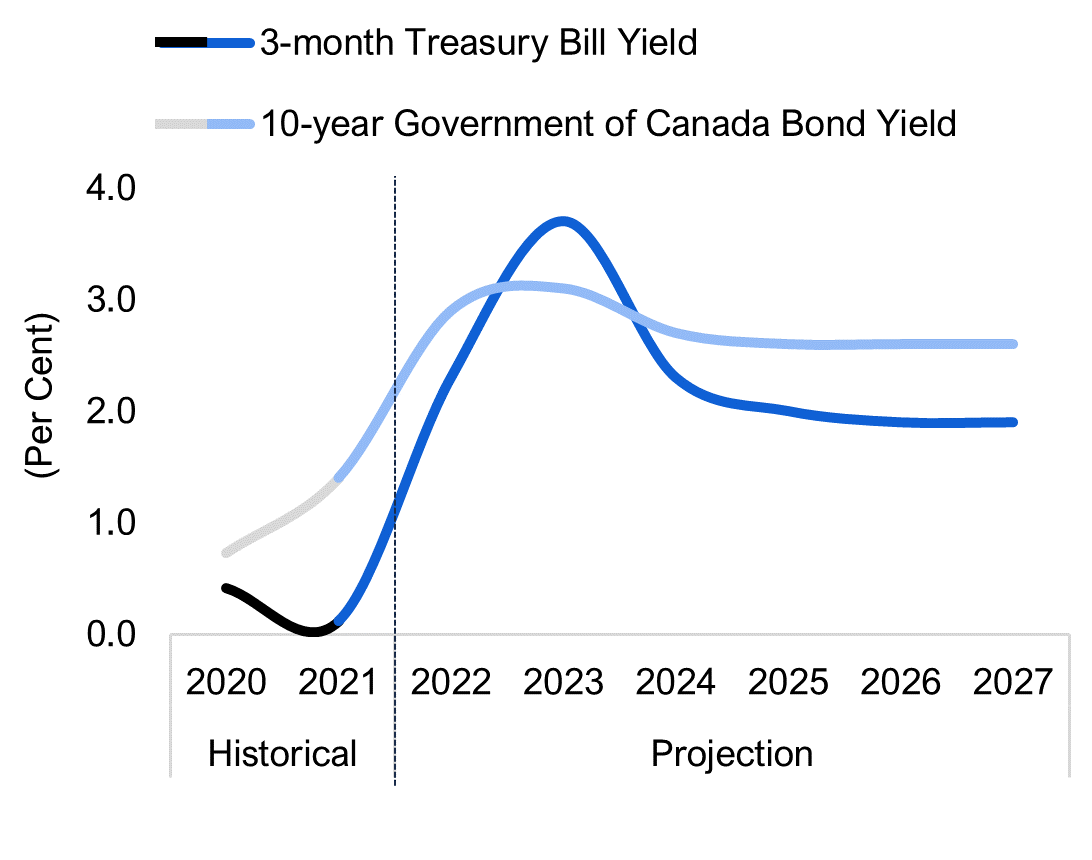
Source: Statistics Canada and FAO.
High inflation has caused the Bank of Canada to aggressively raise its policy interest rate in 2022 from 0.25 per cent to 3.25 per cent in September, the highest since April 2008.
The FAO expects interest rates will continue to rise, with the Bank of Canada increasing its policy interest rate to 3.75 per cent by the end of 2022. In line with most private sector economists, the FAO projects that short-term interest rates will rise higher than long-term rates in 2023, which has historically indicated the possibility of slower economic growth.
Ontario’s Real GDP growth projected to slow sharply in 2023
While recovering from the pandemic, Ontario’s real GDP expanded rapidly, rising by 4.3 per cent in 2021 and a projected 3.3 per cent in 2022.
Figure 5.4 Ontario’s economic outlook has deteriorated since the spring
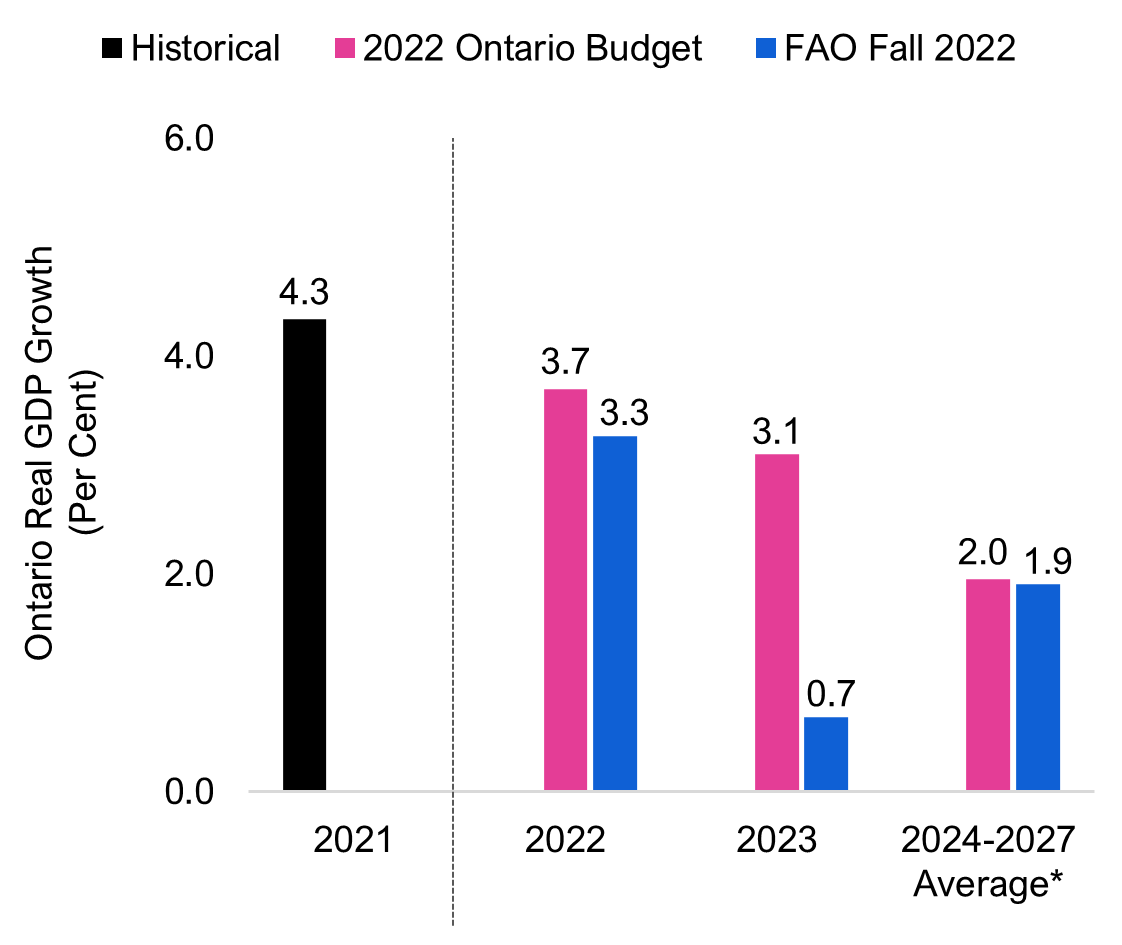
* 2024-2025 average for 2022 Ontario Budget forecast.
Source: Ontario Economic Accounts, 2022 Ontario Budget and FAO.
However, the pace of Ontario’s economic growth is projected to slow sharply to 0.7 per cent in 2023, reflecting the impact of higher interest rates, ongoing price pressures and the weaker global environment. While this updated outlook is significantly weaker than projected in the 2022 Ontario Budget, the FAO is not currently projecting a recession[13] in Ontario.
However, there are notable downside risks to the economic outlook. High inflation could persist, further eroding household purchasing power, despite excess savings built up during the pandemic. The rapid interest rate increases have already triggered a correction in the housing market, and the impacts on the broader economy could be more significant than expected. The unpredictability of Russia’s war in Ukraine and further pandemic-related shutdowns in China could disrupt global markets, add to inflationary pressures, and slow economic growth more than anticipated.
Ontario’s job market expected to slow
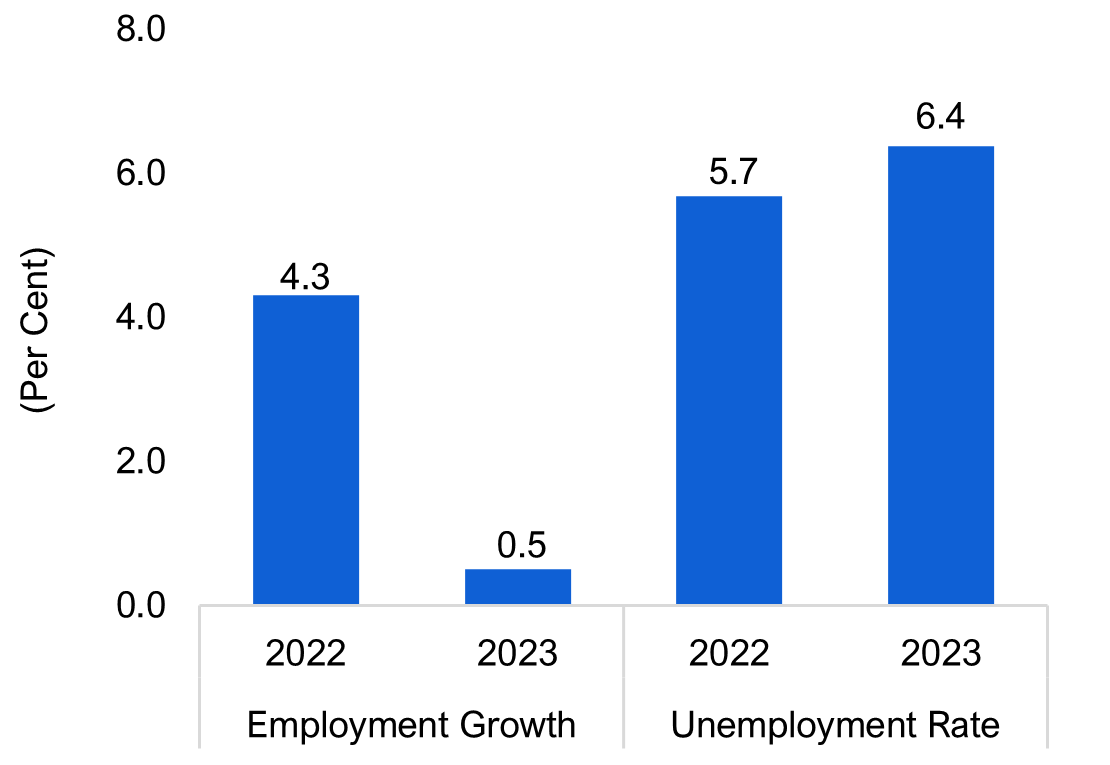
Ontario’s labour market is on pace to record another year of strong growth in 2022, pushing the annual unemployment rate down to an expected 5.7 per cent, similar to the rate prior to the pandemic.
As the economy slows, job growth in 2023 is expected to be weak, with employment rising by 0.5 per cent. The unemployment rate is projected to increase to 6.4 per cent next year, as employers slow their pace of hiring. As the economy recovers in 2024, the unemployment rate is expected to decline, averaging 6.2 per cent over the remainder of the outlook.
Inflation has boosted nominal GDP well above trend growth
Figure 5.6 Ontario’s nominal GDP continues to outpace the FAO’s pre-pandemic projection
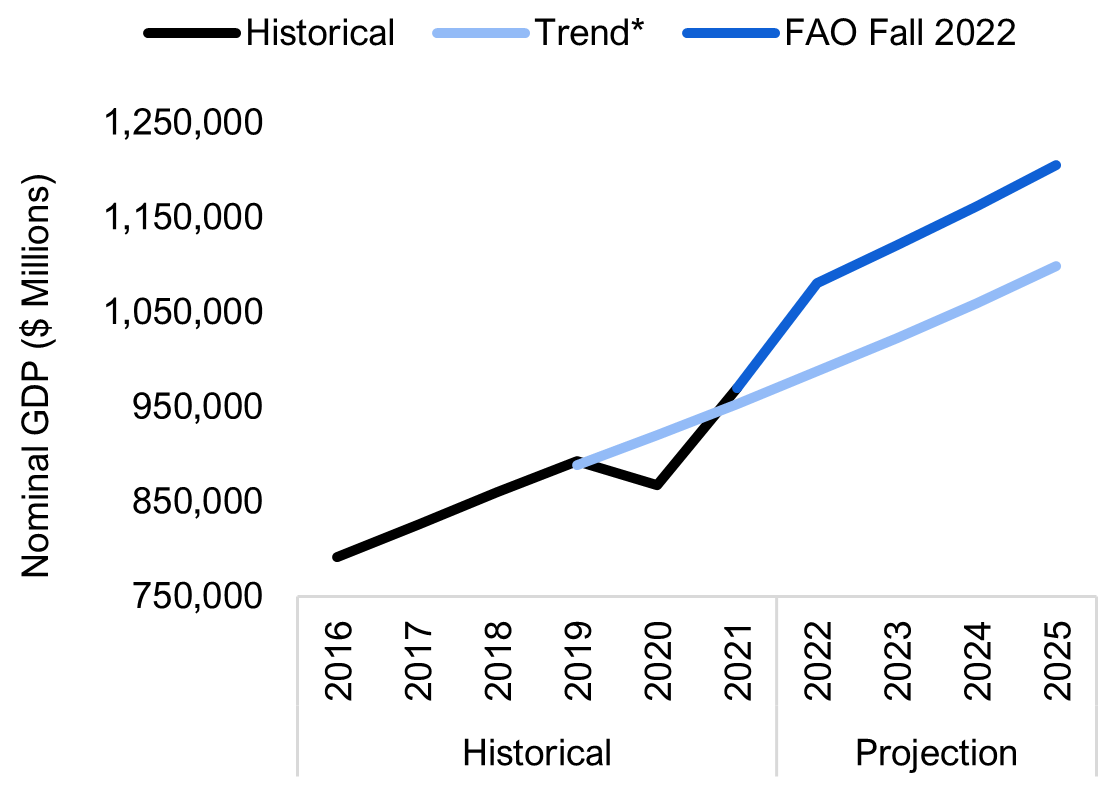
* The pre-pandemic trend is the projection from the 2019 Fall EBO.
Source: Ontario Economic Accounts and FAO.
Ontario’s nominal GDP, which provides a broad measure of the tax base, has rebounded rapidly following the reopening of the economy in mid-2020. The level of nominal GDP has risen well above the FAO’s pre-pandemic trend projection due to the acceleration in economy-wide prices. This is the primary driver of the large upward revisions to Ontario revenue growth over the past year, as tax rates are applied to significantly higher levels of economic activity.
Ontario’s nominal GDP growth is projected at 11.4 per cent in 2022, following a gain of 11.9 per cent in 2021. This would mark the strongest two-year pace of nominal GDP growth since 1983 to 1984. Over the 2024 to 2027 period, nominal GDP is expected to grow at an average annual rate of 3.7 per cent.
6. Appendix
| (Per Cent Growth) | 2020a | 2021a | 2022f | 2023f | 2024f-2027f Average* |
|---|---|---|---|---|---|
| Nominal GDP | |||||
| FAO | -2.8 | 11.9 | 11.4 | 3.7 | 3.7 |
| 2022 Ontario Budget** | -2.8 | 11.9 | 6.7 | 5.1 | 4.2 |
| Labour Income | |||||
| FAO | -0.3 | 9.3 | 9.5 | 3.4 | 3.7 |
| 2022 Ontario Budget | -0.3 | 9.3 | 5.6 | 4.6 | 4.4 |
| Corporate Profits | |||||
| FAO | 10.2 | 24.2 | 14.8 | 5.0 | 3.7 |
| 2022 Ontario Budget | 10.2 | 24.2 | 4.6 | 5.8 | 2.9 |
| Household Consumption | |||||
| FAO | -7.4 | 7.0 | 12.3 | 4.1 | 3.7 |
| 2022 Ontario Budget | -7.4 | 7.0 | 8.8 | 6.3 | 4.7 |
| (Per Cent Growth) | 2020a | 2021a | 2022f | 2023f | 2024f-2027f Average* |
|---|---|---|---|---|---|
| Real GDP | |||||
| FAO | -5.1 | 4.3 | 3.3 | 0.7 | 1.9 |
| 2022 Ontario Budget | -5.1 | 4.3 | 3.7 | 3.1 | 2.0 |
| Employment | |||||
| FAO | -4.8 | 4.9 | 4.3 | 0.5 | 1.2 |
| 2022 Ontario Budget | -4.8 | 4.9 | 3.9 | 2.0 | 1.5 |
| Unemployment Rate (Per Cent) | |||||
| FAO | 9.6 | 8.0 | 5.7 | 6.4 | 6.2 |
| 2022 Ontario Budget | 9.6 | 8.0 | 6.1 | 5.7 | 5.6 |
| CPI Inflation (Per Cent) | |||||
| FAO | 0.7 | 3.5 | 6.8 | 3.5 | 2.0 |
| 2022 Ontario Budget | 0.7 | 3.5 | 4.7 | 2.5 | 2.1 |
| Three-month Treasury Bill Rate (Per Cent) | |||||
| FAO | 0.4 | 0.1 | 2.3 | 3.7 | 2.0 |
| 2022 Ontario Budget | 0.4 | 0.1 | 0.9 | 1.7 | 2.1 |
| 10-year Government Bond Rate (Per Cent) | |||||
| FAO | 0.7 | 1.4 | 2.9 | 3.1 | 2.6 |
| 2022 Ontario Budget | 0.7 | 1.4 | 2.0 | 2.5 | 2.9 |
| ($ Billions) | 2019-20a | 2020-21a | 2021-22a | 2022-23f | 2023-24f | 2024-25f | 2025-26f | 2026-27f | 2027-28f |
|---|---|---|---|---|---|---|---|---|---|
| Revenue | |||||||||
| Personal Income Tax | 37.7 | 40.3 | 46.8 | 50.8 | 52.4 | 54.7 | 57.0 | 59.3 | 61.7 |
| Annual Growth (per cent) | - | 6.9 | 15.9 | 8.6 | 3.3 | 4.3 | 4.2 | 4.1 | 3.9 |
| Sales Tax | 28.6 | 26.6 | 30.4 | 32.1 | 33.2 | 34.5 | 35.8 | 37.2 | 38.6 |
| Annual Growth (per cent) | - | -7.1 | 14.2 | 5.9 | 3.3 | 4.0 | 3.8 | 3.8 | 3.8 |
| Corporations Tax | 15.4 | 17.8 | 25.2 | 25.7 | 25.2 | 26.5 | 26.4 | 27.3 | 28.2 |
| Annual Growth (per cent) | - | 15.3 | 41.9 | 2.0 | -1.9 | 5.0 | -0.3 | 3.3 | 3.3 |
| All Other Taxes | 26.5 | 26.2 | 29.3 | 28.6 | 28.8 | 29.7 | 30.6 | 31.6 | 32.6 |
| Annual Growth (per cent) | - | -1.1 | 12.0 | -2.6 | 0.8 | 3.1 | 3.1 | 3.1 | 3.2 |
| Total Taxation Revenue | 108.3 | 110.9 | 131.7 | 137.2 | 139.7 | 145.4 | 149.9 | 155.4 | 161.1 |
| Annual Growth (per cent) | - | 2.4 | 18.8 | 4.2 | 1.8 | 4.1 | 3.1 | 3.7 | 3.6 |
| Transfers from Government of Canada | 25.4 | 33.9 | 30.6 | 31.0 | 31.8 | 33.4 | 34.5 | 36.9 | 38.0 |
| Annual Growth (per cent) | - | 33.6 | -9.8 | 1.3 | 2.6 | 5.1 | 3.2 | 6.8 | 3.1 |
| Income from Government Business Enterprise | 5.9 | 5.0 | 6.4 | 7.0 | 7.3 | 7.6 | 7.9 | 8.1 | 8.4 |
| Annual Growth (per cent) | - | -15.1 | 28.6 | 9.3 | 3.7 | 3.7 | 3.7 | 3.7 | 3.7 |
| Other Non-Tax Revenue | 16.5 | 15.1 | 16.3 | 16.6 | 17.3 | 17.9 | 18.5 | 19.1 | 19.8 |
| Annual Growth (per cent) | - | -8.8 | 8.4 | 1.9 | 3.7 | 3.5 | 3.6 | 3.4 | 3.4 |
| Total Revenue | 156.1 | 164.9 | 185.1 | 191.9 | 196.0 | 204.3 | 210.8 | 219.6 | 227.3 |
| Annual Growth (per cent) | - | 5.6 | 12.2 | 3.7 | 2.1 | 4.2 | 3.2 | 4.2 | 3.5 |
| Expense | |||||||||
| Health Sector | 63.7 | 69.5 | 75.7 | 79.4 | 79.6 | 83.2 | 86.6 | 90.1 | 94.0 |
| Annual Growth (per cent) | - | 9.0 | 9.0 | 4.9 | 0.2 | 4.5 | 4.2 | 4.0 | 4.3 |
| Education Sector* | 31.7 | 32.9 | 31.5 | 35.1 | 36.1 | 37.2 | 38.6 | 40.0 | 40.9 |
| Annual Growth (per cent) | - | 3.6 | -4.2 | 11.4 | 2.8 | 3.0 | 3.9 | 3.6 | 2.2 |
| Children's and Social Services Sector | 17.1 | 17.5 | 17.1 | 18.2 | 18.8 | 19.4 | 19.8 | 20.3 | 20.7 |
| Annual Growth (per cent) | - | 2.3 | -2.2 | 6.3 | 3.8 | 2.7 | 2.3 | 2.3 | 2.4 |
| Postsecondary Education Sector | 10.5 | 9.8 | 10.6 | 10.7 | 11.3 | 11.7 | 12.1 | 12.5 | 13.0 |
| Annual Growth (per cent) | - | -6.6 | 8.0 | 1.2 | 5.7 | 3.2 | 3.4 | 3.5 | 3.4 |
| Justice Sector | 4.6 | 4.8 | 5.0 | 5.5 | 5.5 | 5.5 | 5.6 | 5.7 | 5.8 |
| Annual Growth (per cent) | - | 2.8 | 5.7 | 8.9 | -0.0 | -0.6 | 2.1 | 2.4 | 2.1 |
| Other Programs* | 24.6 | 34.6 | 30.5 | 30.0 | 29.4 | 30.2 | 30.4 | 30.8 | 31.2 |
| Annual Growth (per cent) | - | 40.8 | -11.9 | -1.6 | -1.9 | 2.5 | 0.7 | 1.2 | 1.5 |
| Total Program Expense | 152.3 | 169.0 | 170.5 | 178.9 | 180.8 | 187.1 | 193.2 | 199.4 | 205.7 |
| Annual Growth (per cent) | - | 11.0 | 0.8 | 5.0 | 1.1 | 3.5 | 3.3 | 3.2 | 3.2 |
| Interest on Debt | 12.5 | 12.3 | 12.6 | 12.9 | 13.3 | 13.4 | 13.5 | 13.4 | 13.1 |
| Annual Growth (per cent) | - | -1.8 | 2.3 | 2.9 | 3.2 | 0.7 | 0.3 | -0.9 | -1.9 |
| Total Expense | 164.8 | 181.3 | 183.0 | 191.8 | 194.1 | 200.5 | 206.6 | 212.8 | 218.8 |
| Annual Growth (per cent) | - | 10.0 | 0.9 | 4.8 | 1.2 | 3.3 | 3.1 | 3.0 | 2.8 |
| Budget Balance | -8.7 | -16.4 | 2.1 | 0.1 | 1.9 | 3.8 | 4.1 | 6.8 | 8.5 |
| ($ Billions) | 2019–20a | 2020–21a | 2021–22f | 2022–23f | 2023–24f | 2024-25f | 2025-26f | 2026-27f | 2027-28f |
|---|---|---|---|---|---|---|---|---|---|
| Budget Balance | -8.7 | -16.4 | 2.1 | 0.1 | 1.9 | 3.8 | 4.1 | 6.8 | 8.5 |
| Accumulated Deficit | 225.8 | 239.3 | 236.9 | 236.8 | 234.9 | 231.1 | 226.9 | 220.2 | 211.7 |
| Net Debt | 353.3 | 373.6 | 380.4 | 390.6 | 398.2 | 405.2 | 410.9 | 411.7 | 408.1 |
| Net Debt-to-GDP (Per Cent) | 39.6 | 43.1 | 39.2 | 36.2 | 35.6 | 34.9 | 34.1 | 32.9 | 31.5 |
Graphical Descriptions
Figure 2-1: The FAO is projecting growing budget surpluses over the outlook
Return to image
Budget Balance ($ Billions)
Year
Historical
FAO Fall 2022
2022 Ontario Budget
2020-21
-16.4
2021-22
2.1
2022-23
0.1
-18.9
2023-24
1.9
-10.8
2024-25
3.8
-6.1
2025-26
4.1
-3.5
2026-27
6.8
-0.7
2027-28
8.5
2.8
Figure 2-2: Ontario’s debt burden would decline due to ongoing budget surpluses
Return to image
Net Debt-to-GDP Ratio (Per Cent)
Historical
FAO Fall 2022
2022 Ontario Budget
Historical
1981-82
10.4
1982-83
12.1
1983-84
12.8
1984-85
12.9
1985-86
14.9
1986-87
14.8
1987-88
14.4
1988-89
13.6
1989-90
12.5
1990-91
13.4
1991-92
17.1
1992-93
21.1
1993-94
26.6
1994-95
28.3
1995-96
30.1
1996-97
31.2
1997-98
30.5
1998-99
29.4
1999-00
32.1
2000-01
29.3
2001-02
28.2
2002-03
26.8
2003-04
27.5
2004-05
26.8
2005-06
27.8
2006-07
27.1
2007-08
26.6
2008-09
27.8
2009-10
32.3
2010-11
34.5
2011-12
36.6
2012-13
38.2
2013-14
39.7
2014-15
40.5
2015-16
40.3
2016-17
39.7
2017-18
39.3
2018-19
39.4
2019-20
39.6
2020-21
43.1
2021-22
39.2
Projection
2022-23
36.2
41.4
2023-24
35.6
41.4
2024-25
34.9
41.3
2025-26
34.1
41.0
2026-27
32.9
40.3
2027-28
31.5
39.1
Figure 2-3: Ontario’s interest expense as share of revenue projected to reach a 40-year low
Return to image
Interest on Debt to Revenue (Per Cent)
Historical
FAO Fall 2022
2022 Ontario Budget
Historical
1981-82
6.0
1982-83
7.3
1983-84
8.7
1984-85
9.2
1985-86
9.5
1986-87
9.7
1987-88
9.6
1988-89
9.1
1989-90
8.2
1990-91
7.7
1991-92
8.8
1992-93
10.8
1993-94
13.9
1994-95
14.5
1995-96
14.6
1996-97
14.8
1997-98
14.2
1998-99
14.3
1999-00
15.5
2000-01
15.0
2001-02
14.2
2002-03
12.9
2003-04
12.9
2004-05
11.1
2005-06
10.3
2006-07
9.4
2007-08
8.9
2008-09
9.2
2009-10
9.5
2010-11
8.8
2011-12
9.1
2012-13
9.0
2013-14
9.1
2014-15
8.9
2015-16
8.5
2016-17
8.3
2017-18
7.9
2018-19
8.1
2019-20
8.0
2020-21
7.4
2021-22
6.8
Projection
2022-23
6.7
7.5
2023-24
6.8
7.6
2024-25
6.6
7.5
2025-26
6.4
7.7
2026-27
6.1
7.7
2027-28
5.8
7.5
Figure 3-1: FA projects higher revenues than the 2022 Ontario Budget
Return to image
Year
Total Revenues ($ Billions)
Historical
FAO Fall 2022
2022 Ontario Budget
Historical
2019-20
156.1
2020-21
164.9
2021-22
185.1
173.6
Projection
2022-23
191.9
179.8
2023-24
196.0
188.2
2024-25
204.3
196.9
2025-26
210.8
204.6
2026-27
219.6
212.6
2027-28
227.3
220.9
Figure 4-1: FAO’s program spending projection is lower than the government’s until 2024-25, but higher over the following three years
Return to image
Year
Program Spending ($ Billions)
Historical
FAO Fall 2022
2022 Ontario Budget
Historical
2019-20
152.3
2020-21
169.0
2021-22
170.5
Projection
2022-23
178.9
185.2
2023-24
180.8
184.8
2024-25
187.1
188.1
2025-26
193.2
192.5
2026-27
199.4
196.9
2027-28
205.7
201.4
Figure 5-1: The OECD lowered its global economic outlook for 2023
Return to image
World
China
India
Euro Area
US
Canada
June Outlook
3.0
4.4
6.9
2.6
2.5
3.8
September Outlook
3
4.7
6.9
3.1
1.5
3.4
Figure 5-2: Higher inflation projected in Ontario over the next two years
Return to image
Annual CPI Inflation (Per Cent)
2022
2023
2024-2027 Average *
FAO Spring 2022
5.4
3.2
1.9
FAO Fall 2022
6.8
3.5
2.0
Figure 5-3: Interest rates to continue rising in 2023
Return to image
(Per Cent)
Historical
Projection
2020
2021
2022
2023
2024
2025
3-month Treasury Bill Yield
0.4
0.1
2.3
3.7
2.3
2.0
10-year Government of Canada Bond Yield
0.7
1.4
2.9
3.1
2.7
2.6
Figure 5-4: Ontario’s economic outlook has deteriorated since the spring
Return to image
Ontario Real GDP Growth (Per Cent)
2021
2022
2023
2024-2027 Average*
Historical
4.3
2022 Ontario Budget
3.7
3.1
2.0
FAO Fall 2022
3.3
0.7
1.9
Figure 5-5: Unemployment rate expected to rise in 2023
Return to image
Per Cent
2022
2023
Employment Growth
4.3
0.5
Unemployment Rate
5.7
6.4
Figure 5-6: Ontario’s nominal GDP continues to outpace the FAO’s pre-pandemic projection
Return to image
Year
Nominal GDP ($ Millions)
Historical
Trend*
FAO Fall 2022
Historical
2016
790,749
2017
824,979
2018
860,104
2019
892,226
888,230
2020
866,940
919,689
2021
970,041
953,200
Projection
2022
987,237
1,080,338
2023
1,022,667
1,120,106
2024
1,059,702
1,161,750
2025
1,097,971
1,204,937
Footnotes
[1] The 2022 Ontario Budget projected a 2021-22 deficit of $13.5 billion. The FAO projected an $8.7 billion deficit in the April Spring Economic and Budget Outlook, and a revised $8.1 billion deficit in the July Expenditure Monitor 2021-22: Q4.
[2] Total revenue grew by $20.2 billion (12.2 per cent) in 2021-22, while program spending increased by only $1.4 billion (0.8 per cent), as higher base program spending was largely offset by a decline in temporary COVID-19-related spending. See Ontario Public Accounts: Annual Report and Consolidated Financial Statements 2021–2022, pages 22 and 51.
[3] Tax revenues grew by 18.8 per cent in 2021-22, the strongest growth recorded since 1988-89.
[4] See Chapter 5 for a discussion of nominal GDP growth, which has been exceptionally strong in 2021 and 2022.
[5] The impact of rising rates on interest on debt payments is also mitigated in part by the term structure of Ontario’s debt, which in 2021-22, had an average term to maturity of 10.9 years. See 2022 Ontario Budget, page 213.
[6] See Public Accounts 2021-22, page 7. Total revenue in 2021-22 was $185.1 billion, or 5.0 per cent higher than the FAO’s spring forecast, and 6.6 per cent higher than forecast in the 2022 Ontario Budget. This revenue surprise was not unique to Ontario. Based on an analysis of the 2021-22 public accounts of seven provinces, the FAO estimates that actual 2021-22 revenues averaged 5.3 per cent higher than budget projections made earlier in the year.
[7] The 18.8 per cent growth in tax revenues was the fastest pace of growth since 1988-89.
[8] As a general point of comparison, population and inflation are expected to increase by a combined average annual rate of 4.2 per cent over this period.
[9] Contingency funds are typically used to support existing programs with funding shortfalls, fund new programs or enhance existing programs. Alternatively, if the Province decides not to use the contingency funds, then these funds are applied to improve the budget balance and reduce the Province’s net debt. The Auditor General of Ontario noted that the $19.4 billion in contingency funds over the first three years of the outlook was significantly larger than any three-year amount set aside in previous Ontario budgets. For more information, see Office of the Auditor General of Ontario, Review of the Pre-Election 2022 Multi-Year Fiscal Plan.
[10] The OECD currently projects global real GDP growth of 3.0 per cent in 2022 (see OECD Economic Outlook, Interim Report September 2022: Paying thePrice ofWar) while the IMF projects 3.2 per cent (See: World Economic Outlook).
[11] Similarly, in its July outlook, the IMF made a 0.7 per cent downward revision to global economic growth in 2023.
[12] IMF, World Economic Outlook, October 2022.
[13] Defined as two consecutive quarters of declining real GDP.
| Budget Balance ($ Billions) | |||
|---|---|---|---|
| Year | Historical | FAO Fall 2022 | 2022 Ontario Budget |
| 2020-21 | -16.4 | ||
| 2021-22 | 2.1 | ||
| 2022-23 | 0.1 | -18.9 | |
| 2023-24 | 1.9 | -10.8 | |
| 2024-25 | 3.8 | -6.1 | |
| 2025-26 | 4.1 | -3.5 | |
| 2026-27 | 6.8 | -0.7 | |
| 2027-28 | 8.5 | 2.8 | |
| Net Debt-to-GDP Ratio (Per Cent) | Historical | FAO Fall 2022 | 2022 Ontario Budget | |
|---|---|---|---|---|
| Historical | 1981-82 | 10.4 | ||
| 1982-83 | 12.1 | |||
| 1983-84 | 12.8 | |||
| 1984-85 | 12.9 | |||
| 1985-86 | 14.9 | |||
| 1986-87 | 14.8 | |||
| 1987-88 | 14.4 | |||
| 1988-89 | 13.6 | |||
| 1989-90 | 12.5 | |||
| 1990-91 | 13.4 | |||
| 1991-92 | 17.1 | |||
| 1992-93 | 21.1 | |||
| 1993-94 | 26.6 | |||
| 1994-95 | 28.3 | |||
| 1995-96 | 30.1 | |||
| 1996-97 | 31.2 | |||
| 1997-98 | 30.5 | |||
| 1998-99 | 29.4 | |||
| 1999-00 | 32.1 | |||
| 2000-01 | 29.3 | |||
| 2001-02 | 28.2 | |||
| 2002-03 | 26.8 | |||
| 2003-04 | 27.5 | |||
| 2004-05 | 26.8 | |||
| 2005-06 | 27.8 | |||
| 2006-07 | 27.1 | |||
| 2007-08 | 26.6 | |||
| 2008-09 | 27.8 | |||
| 2009-10 | 32.3 | |||
| 2010-11 | 34.5 | |||
| 2011-12 | 36.6 | |||
| 2012-13 | 38.2 | |||
| 2013-14 | 39.7 | |||
| 2014-15 | 40.5 | |||
| 2015-16 | 40.3 | |||
| 2016-17 | 39.7 | |||
| 2017-18 | 39.3 | |||
| 2018-19 | 39.4 | |||
| 2019-20 | 39.6 | |||
| 2020-21 | 43.1 | |||
| 2021-22 | 39.2 | |||
| Projection | 2022-23 | 36.2 | 41.4 | |
| 2023-24 | 35.6 | 41.4 | ||
| 2024-25 | 34.9 | 41.3 | ||
| 2025-26 | 34.1 | 41.0 | ||
| 2026-27 | 32.9 | 40.3 | ||
| 2027-28 | 31.5 | 39.1 | ||
| Interest on Debt to Revenue (Per Cent) | Historical | FAO Fall 2022 | 2022 Ontario Budget | |
|---|---|---|---|---|
| Historical | 1981-82 | 6.0 | ||
| 1982-83 | 7.3 | |||
| 1983-84 | 8.7 | |||
| 1984-85 | 9.2 | |||
| 1985-86 | 9.5 | |||
| 1986-87 | 9.7 | |||
| 1987-88 | 9.6 | |||
| 1988-89 | 9.1 | |||
| 1989-90 | 8.2 | |||
| 1990-91 | 7.7 | |||
| 1991-92 | 8.8 | |||
| 1992-93 | 10.8 | |||
| 1993-94 | 13.9 | |||
| 1994-95 | 14.5 | |||
| 1995-96 | 14.6 | |||
| 1996-97 | 14.8 | |||
| 1997-98 | 14.2 | |||
| 1998-99 | 14.3 | |||
| 1999-00 | 15.5 | |||
| 2000-01 | 15.0 | |||
| 2001-02 | 14.2 | |||
| 2002-03 | 12.9 | |||
| 2003-04 | 12.9 | |||
| 2004-05 | 11.1 | |||
| 2005-06 | 10.3 | |||
| 2006-07 | 9.4 | |||
| 2007-08 | 8.9 | |||
| 2008-09 | 9.2 | |||
| 2009-10 | 9.5 | |||
| 2010-11 | 8.8 | |||
| 2011-12 | 9.1 | |||
| 2012-13 | 9.0 | |||
| 2013-14 | 9.1 | |||
| 2014-15 | 8.9 | |||
| 2015-16 | 8.5 | |||
| 2016-17 | 8.3 | |||
| 2017-18 | 7.9 | |||
| 2018-19 | 8.1 | |||
| 2019-20 | 8.0 | |||
| 2020-21 | 7.4 | |||
| 2021-22 | 6.8 | |||
| Projection | 2022-23 | 6.7 | 7.5 | |
| 2023-24 | 6.8 | 7.6 | ||
| 2024-25 | 6.6 | 7.5 | ||
| 2025-26 | 6.4 | 7.7 | ||
| 2026-27 | 6.1 | 7.7 | ||
| 2027-28 | 5.8 | 7.5 | ||
| Year | Total Revenues ($ Billions) | |||
|---|---|---|---|---|
| Historical | FAO Fall 2022 | 2022 Ontario Budget | ||
| Historical | 2019-20 | 156.1 | ||
| 2020-21 | 164.9 | |||
| 2021-22 | 185.1 | 173.6 | ||
| Projection | 2022-23 | 191.9 | 179.8 | |
| 2023-24 | 196.0 | 188.2 | ||
| 2024-25 | 204.3 | 196.9 | ||
| 2025-26 | 210.8 | 204.6 | ||
| 2026-27 | 219.6 | 212.6 | ||
| 2027-28 | 227.3 | 220.9 | ||
| Year | Program Spending ($ Billions) | |||
|---|---|---|---|---|
| Historical | FAO Fall 2022 | 2022 Ontario Budget | ||
| Historical | 2019-20 | 152.3 | ||
| 2020-21 | 169.0 | |||
| 2021-22 | 170.5 | |||
| Projection | 2022-23 | 178.9 | 185.2 | |
| 2023-24 | 180.8 | 184.8 | ||
| 2024-25 | 187.1 | 188.1 | ||
| 2025-26 | 193.2 | 192.5 | ||
| 2026-27 | 199.4 | 196.9 | ||
| 2027-28 | 205.7 | 201.4 | ||
| World | China | India | Euro Area | US | Canada | |
|---|---|---|---|---|---|---|
| June Outlook | 3.0 | 4.4 | 6.9 | 2.6 | 2.5 | 3.8 |
| September Outlook | 3 | 4.7 | 6.9 | 3.1 | 1.5 | 3.4 |
| Annual CPI Inflation (Per Cent) | 2022 | 2023 | 2024-2027 Average * | ||
|---|---|---|---|---|---|
| FAO Spring 2022 | 5.4 | 3.2 | 1.9 | ||
| FAO Fall 2022 | 6.8 | 3.5 | 2.0 | ||
| (Per Cent) | Historical | Projection | |||||
|---|---|---|---|---|---|---|---|
| 2020 | 2021 | 2022 | 2023 | 2024 | 2025 | ||
| 3-month Treasury Bill Yield | 0.4 | 0.1 | 2.3 | 3.7 | 2.3 | 2.0 | |
| 10-year Government of Canada Bond Yield | 0.7 | 1.4 | 2.9 | 3.1 | 2.7 | 2.6 | |
| Ontario Real GDP Growth (Per Cent) | 2021 | 2022 | 2023 | 2024-2027 Average* | ||
|---|---|---|---|---|---|---|
| Historical | 4.3 | |||||
| 2022 Ontario Budget | 3.7 | 3.1 | 2.0 | |||
| FAO Fall 2022 | 3.3 | 0.7 | 1.9 | |||
| Per Cent | 2022 | 2023 | |
|---|---|---|---|
| Employment Growth | 4.3 | 0.5 | |
| Unemployment Rate | 5.7 | 6.4 | |
| Year | Nominal GDP ($ Millions) | |||
|---|---|---|---|---|
| Historical | Trend* | FAO Fall 2022 | ||
| Historical | 2016 | 790,749 | ||
| 2017 | 824,979 | |||
| 2018 | 860,104 | |||
| 2019 | 892,226 | 888,230 | ||
| 2020 | 866,940 | 919,689 | ||
| 2021 | 970,041 | 953,200 | ||
| Projection | 2022 | 987,237 | 1,080,338 | |
| 2023 | 1,022,667 | 1,120,106 | ||
| 2024 | 1,059,702 | 1,161,750 | ||
| 2025 | 1,097,971 | 1,204,937 | ||
[1] The 2022 Ontario Budget projected a 2021-22 deficit of $13.5 billion. The FAO projected an $8.7 billion deficit in the April Spring Economic and Budget Outlook, and a revised $8.1 billion deficit in the July Expenditure Monitor 2021-22: Q4.
[2] Total revenue grew by $20.2 billion (12.2 per cent) in 2021-22, while program spending increased by only $1.4 billion (0.8 per cent), as higher base program spending was largely offset by a decline in temporary COVID-19-related spending. See Ontario Public Accounts: Annual Report and Consolidated Financial Statements 2021–2022, pages 22 and 51.
[3] Tax revenues grew by 18.8 per cent in 2021-22, the strongest growth recorded since 1988-89.
[4] See Chapter 5 for a discussion of nominal GDP growth, which has been exceptionally strong in 2021 and 2022.
[5] The impact of rising rates on interest on debt payments is also mitigated in part by the term structure of Ontario’s debt, which in 2021-22, had an average term to maturity of 10.9 years. See 2022 Ontario Budget, page 213.
[6] See Public Accounts 2021-22, page 7. Total revenue in 2021-22 was $185.1 billion, or 5.0 per cent higher than the FAO’s spring forecast, and 6.6 per cent higher than forecast in the 2022 Ontario Budget. This revenue surprise was not unique to Ontario. Based on an analysis of the 2021-22 public accounts of seven provinces, the FAO estimates that actual 2021-22 revenues averaged 5.3 per cent higher than budget projections made earlier in the year.
[7] The 18.8 per cent growth in tax revenues was the fastest pace of growth since 1988-89.
[8] As a general point of comparison, population and inflation are expected to increase by a combined average annual rate of 4.2 per cent over this period.
[9] Contingency funds are typically used to support existing programs with funding shortfalls, fund new programs or enhance existing programs. Alternatively, if the Province decides not to use the contingency funds, then these funds are applied to improve the budget balance and reduce the Province’s net debt. The Auditor General of Ontario noted that the $19.4 billion in contingency funds over the first three years of the outlook was significantly larger than any three-year amount set aside in previous Ontario budgets. For more information, see Office of the Auditor General of Ontario, Review of the Pre-Election 2022 Multi-Year Fiscal Plan.
[10] The OECD currently projects global real GDP growth of 3.0 per cent in 2022 (see OECD Economic Outlook, Interim Report September 2022: Paying thePrice ofWar) while the IMF projects 3.2 per cent (See: World Economic Outlook).
[11] Similarly, in its July outlook, the IMF made a 0.7 per cent downward revision to global economic growth in 2023.
[12] IMF, World Economic Outlook, October 2022.
[13] Defined as two consecutive quarters of declining real GDP.