


1. Summary
This Economic and Budget Outlook report provides the FAO’s projection of the Ontario government’s fiscal position over the 2022-23 to 2026-27 period. The report also compares the FAO’s budget outlook to the government’s plan presented in the 2022 Ontario Economic Outlook and Fiscal Review (Fall Economic Statement, or FES) from 2022-23 to 2024-25 and describes the FAO’s updated economic outlook. The FAO’s revenue and program spending projections are based on current and announced government policies.
Ontario’s economic growth to slow sharply
Ontario’s economy rebounded rapidly from the pandemic, with real GDP rising strongly by 5.2 per cent in 2021 and an estimated 3.7 per cent in 2022. However, facing elevated inflation, high interest rates and a weaker global environment, Ontario’s economic growth is projected to slow sharply to 0.5 per cent in 2023, and then return to close to historical averages over the rest of the outlook.
Budget improvements lead to growing surpluses
The FAO projects a budget deficit of $2.5 billion in 2022-23, significantly smaller than the government’s deficit projection of $12.9 billion in the FES. This $10.4 billion difference results mainly from the FAO’s lower spending projection, combined with a modestly higher revenue projection in that year. With revenue growth projected to exceed program spending growth over the outlook, the FAO projects a budget surplus of $1.0 billion in 2023-24 growing to $7.6 billion in 2026-27. The government projects improving deficits over its three-year outlook.
Revenue growth to moderate after historic gain
After total revenues grew by an exceptional 12.2 per cent in 2021-22, revenue growth is projected to moderate to 3.6 per cent per year over the outlook, in line with the slowing economy. Compared to the FES, the FAO’s revenue forecast is $1.7 billion higher in 2022-23, narrowing to $0.7 billion higher by 2024-25.
Program spending outlook below government forecast
Compared to the government’s three-year program spending projection in the FES, the FAO’s program spending projection is lower in each year. The FAO expects that spending on programs will be $6.8 billion lower than planned by the Province in 2022-23, narrowing to $4.5 billion lower in 2023-24, and $1.2 billion lower in 2024-25. In total, over the three-year period, the FAO projects that the Province has allocated a cumulative $12.5 billion in excess funds that are not currently required to support existing programs and announced commitments.
Although the FAO projects that the Province has allocated $12.5 billion in excess funds, differences arise by program sector. Notably, the FAO projects spending shortfalls in health (net $5.0 billion over three years), education ($1.1 billion) and justice ($0.8 billion). These shortfalls mean that the Province has not allocated sufficient funds to these sectors to support existing programs and announced commitments.
On the other hand, the Province has allocated excess funds to ‘other programs’ (net $19.7 billion over three years). The significant excess funds in the other programs sector are largely due to the contingency fund, which is excluded from the FAO’s projection as the purpose of the funds has not yet been announced.
2. Budget and Debt Outlook
FAO projects growing budget surpluses
Following a budget surplus of $2.1 billion in 2021-22,[1] the FAO projects that Ontario will post a $2.5 billion deficit in 2022-23 under current government policies.[2] The FAO expects improving budget surpluses over the outlook, growing from $1.0 billion in 2023-24 to $7.6 billion in 2026-27.
The FAO’s deficit projection of $2.5 billion in 2022-23 is considerably lower than the government's $12.9 billion deficit projection in the 2022 Fall Economic Statement. This $10.4 billion lower projected budget deficit compared to the government’s is comprised of:
- $6.8 billion lower projected program spending than in the government’s plan, due in part to the FAO’s exclusion of the government’s significant contingency funds as the purpose of the funds has not yet been announced;
- $1.7 billion higher revenue;
- $0.9 billion lower debt-interest payments; and
- the exclusion of the government’s $1.0 billion budget reserve.
By 2024-25, the last year of the FES outlook, the government projects a $0.7 billion deficit. In contrast, the FAO expects Ontario to record a surplus of $4.2 billion.
Figure 2.1FAO expects growing budget surpluses after 2022-23
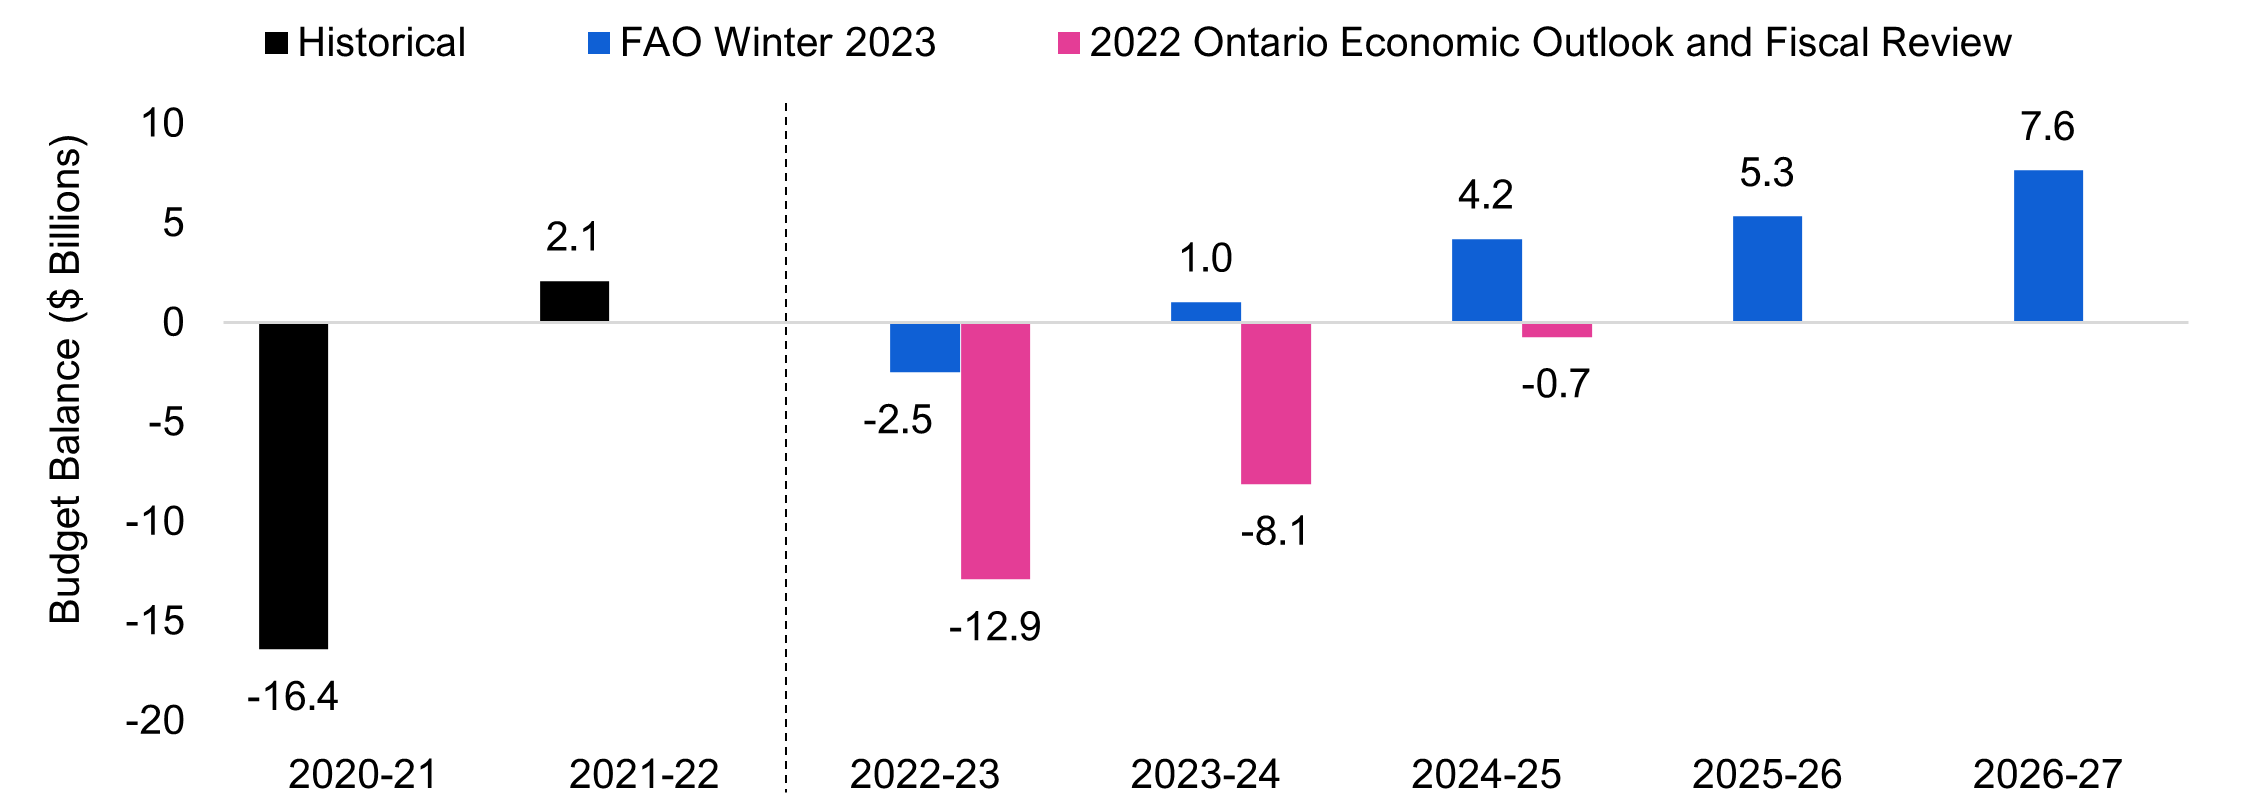
Note: The budget balance from the 2022 Ontario Economic Outlook and Fiscal Review is shown after the reserve.
Source: Ontario Public Accounts, 2022 Ontario Economic Outlook and Fiscal Review and FAO
However, if the government makes future announcements, such as new tax cuts, spending initiatives or a combination of both, the FAO’s budget projection would deteriorate. The FAO’s economic and budget outlook also faces significant external risks – see Chapter 6 for a discussion.
Budget surpluses would improve Ontario’s fiscal sustainability indicators
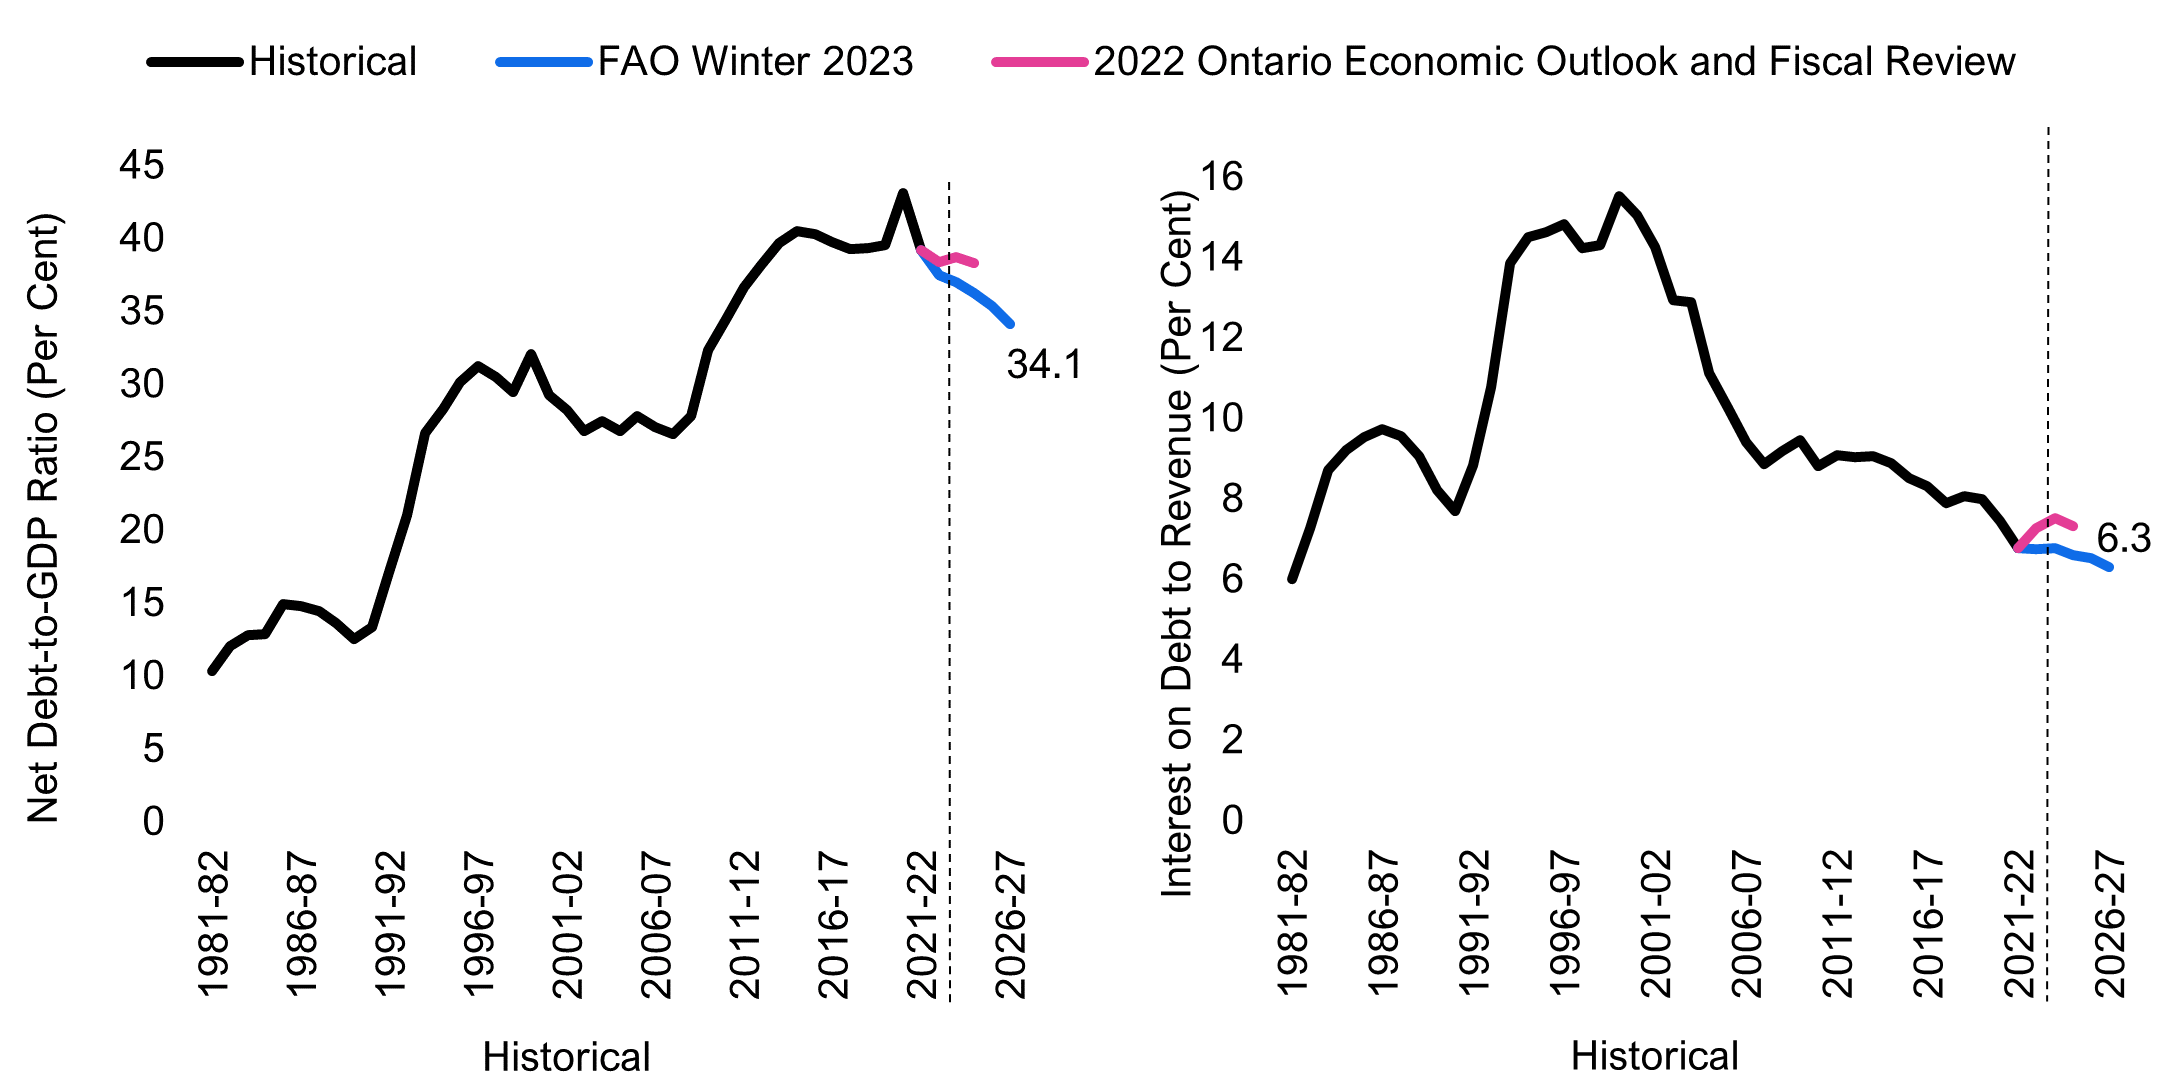
The Province’s net debt-to-GDP ratio is projected to decline from 39.2 per cent in 2021-22 to 36.3 per cent by 2024-25, which is 2.0 percentage points below the government’s projection in the FES. As the economy grows faster than the increase in debt, the FAO expects the net debt-to-GDP ratio to decline to 34.1 per cent by 2026-27 – the lowest ratio since 2010-11 and well below the government’s medium-term target of 42 per cent.[3]
Ontario’s debt interest payments as a share of revenues are projected to decline from 6.8 per cent in 2021-22 to 6.6 per cent in 2024-25, below the government’s projection of 7.3 per cent. By 2026-27, the ratio is projected to fall to 6.3 per cent – the lowest share on record going back to the early 1980s. Despite higher interest rates,[4] the projection for interest on debt as a share of revenues is expected to remain below the government’s target of eight per cent[5] in the medium term.
Figure 2.2Ontario’s fiscal sustainability indicators to improve and remain below government targets
Source: Ontario Public Accounts, Ontario Economic Accounts, 2022 Ontario Economic Outlook and Fiscal Review and FAO.
3. Revenue Outlook
FAO projects weak revenue growth in 2022-23 and 2023-24
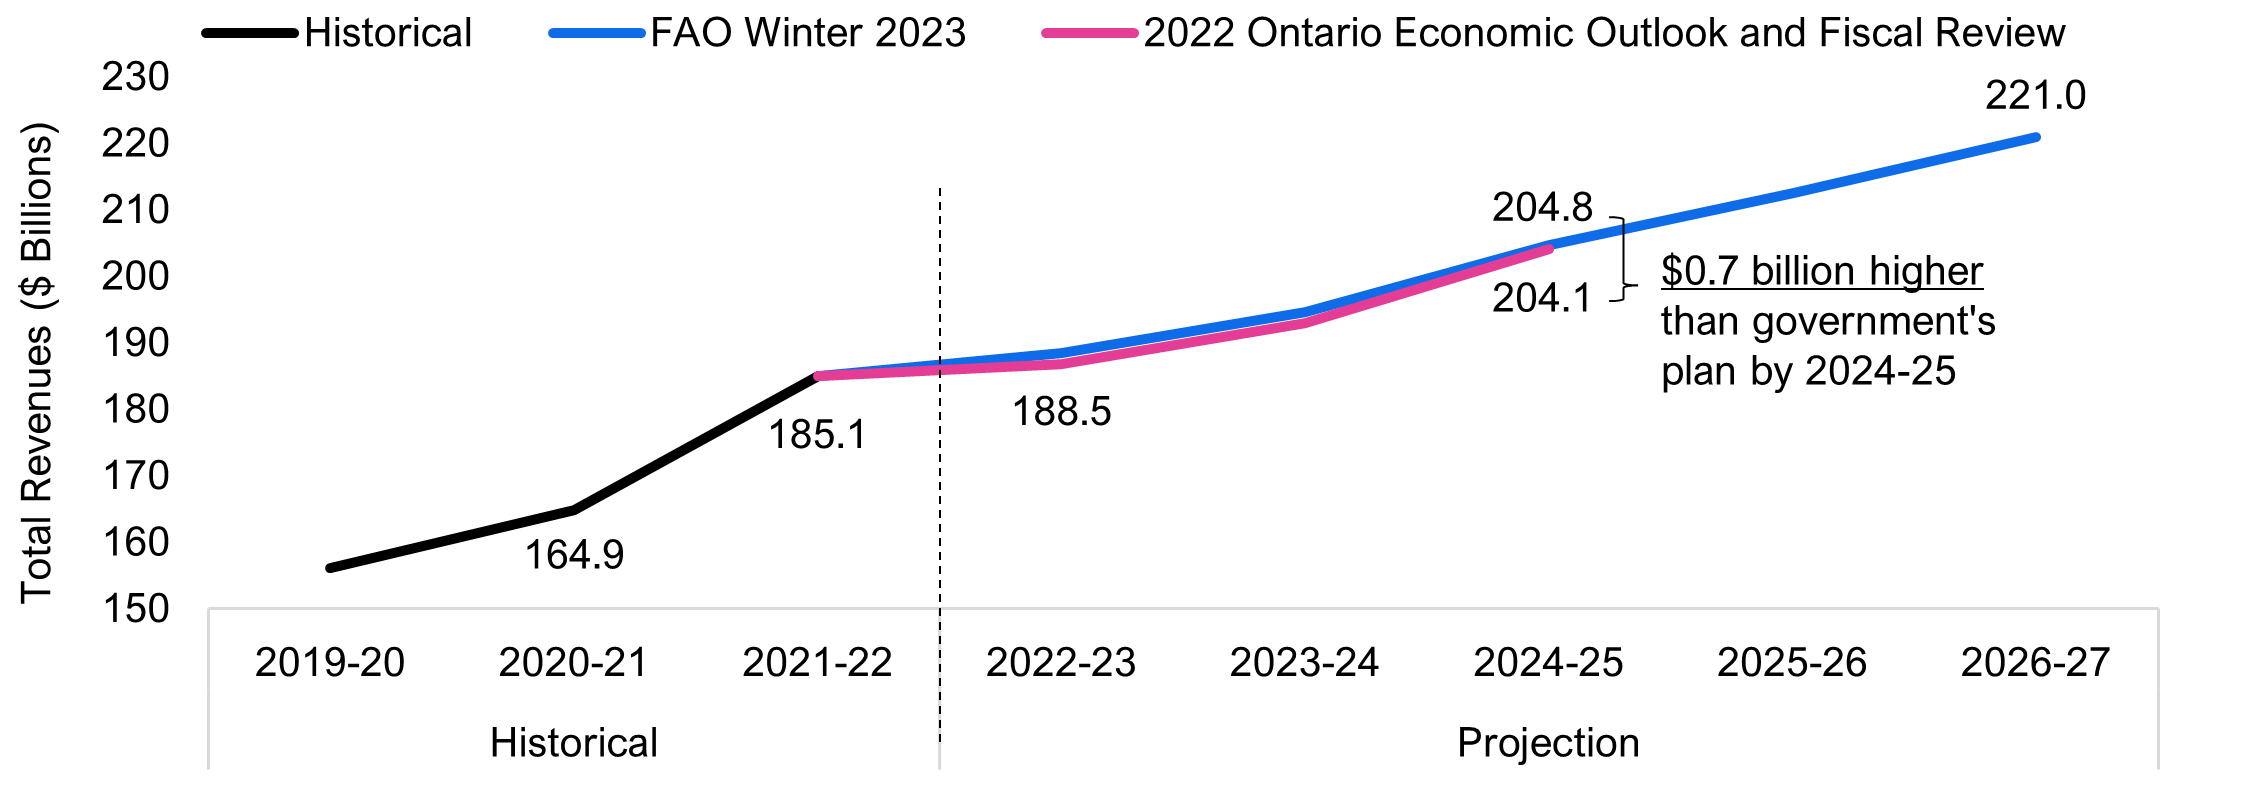
In 2021-22, revenues jumped by 12.2 per cent (+$20.2 billion), driven by historically strong growth in tax revenues, which reflected the rebound in economic activity as employment growth and rising inflation pushed up labour income, consumer spending and corporate profits.[6] This revenue gain was more than four times the average annual increase from 2011-12 to 2019-20.[7]
Despite strong economic growth and high inflation in 2022, total revenue growth is projected to slow to 1.9 per cent (+$3.5 billion) in 2022-23, reflecting the loss of one-time revenue, declines in housing market activity, the reduction in the Gasoline and Fuel Tax, and the enhanced Low-income Individuals and Families Tax (LIFT) Credit. Modest revenue growth is projected to continue in 2023-24 (3.3 per cent or +$6.2 billion) as economic growth weakens, moderating labour income gains and sharply slowing corporate profit growth. Over the entire outlook, total revenues are projected to grow by an average annual rate of 3.6 per cent as economic activity begins to recover in 2024.
FAO’s revenue projection is modestly higher than the government’s
The FAO’s revenue projection is moderately above the government’s outlook in the 2022 Fall Economic Statement in each year. The FAO expects total revenues to be $1.7 billion higher than the government’s forecast in 2022-23 and 2023-24, and $0.7 billion higher in 2024-25. The difference between the FAO’s projection over the three-year period and the government’s is largely due to the FAO’s slightly stronger outlook for tax revenues and the FAO's inclusion of equalization payments to Ontario.[8]
Figure 3.1Revenue growth to weaken after post-pandemic surge
Source: Ontario Public Accounts, 2022 Ontario Economic Outlook and Fiscal Review and FAO
The FAO’s revenue outlook is consistent with the economic outlook in Chapter 5, which projects a significant slowdown for Ontario’s economy in 2023. However, numerous risks exist to the economic outlook that could negatively impact future revenue growth. These risks are discussed in Chapter 6.
4. Program Spending Outlook
FAO’s program spending projection is lower than the government’s
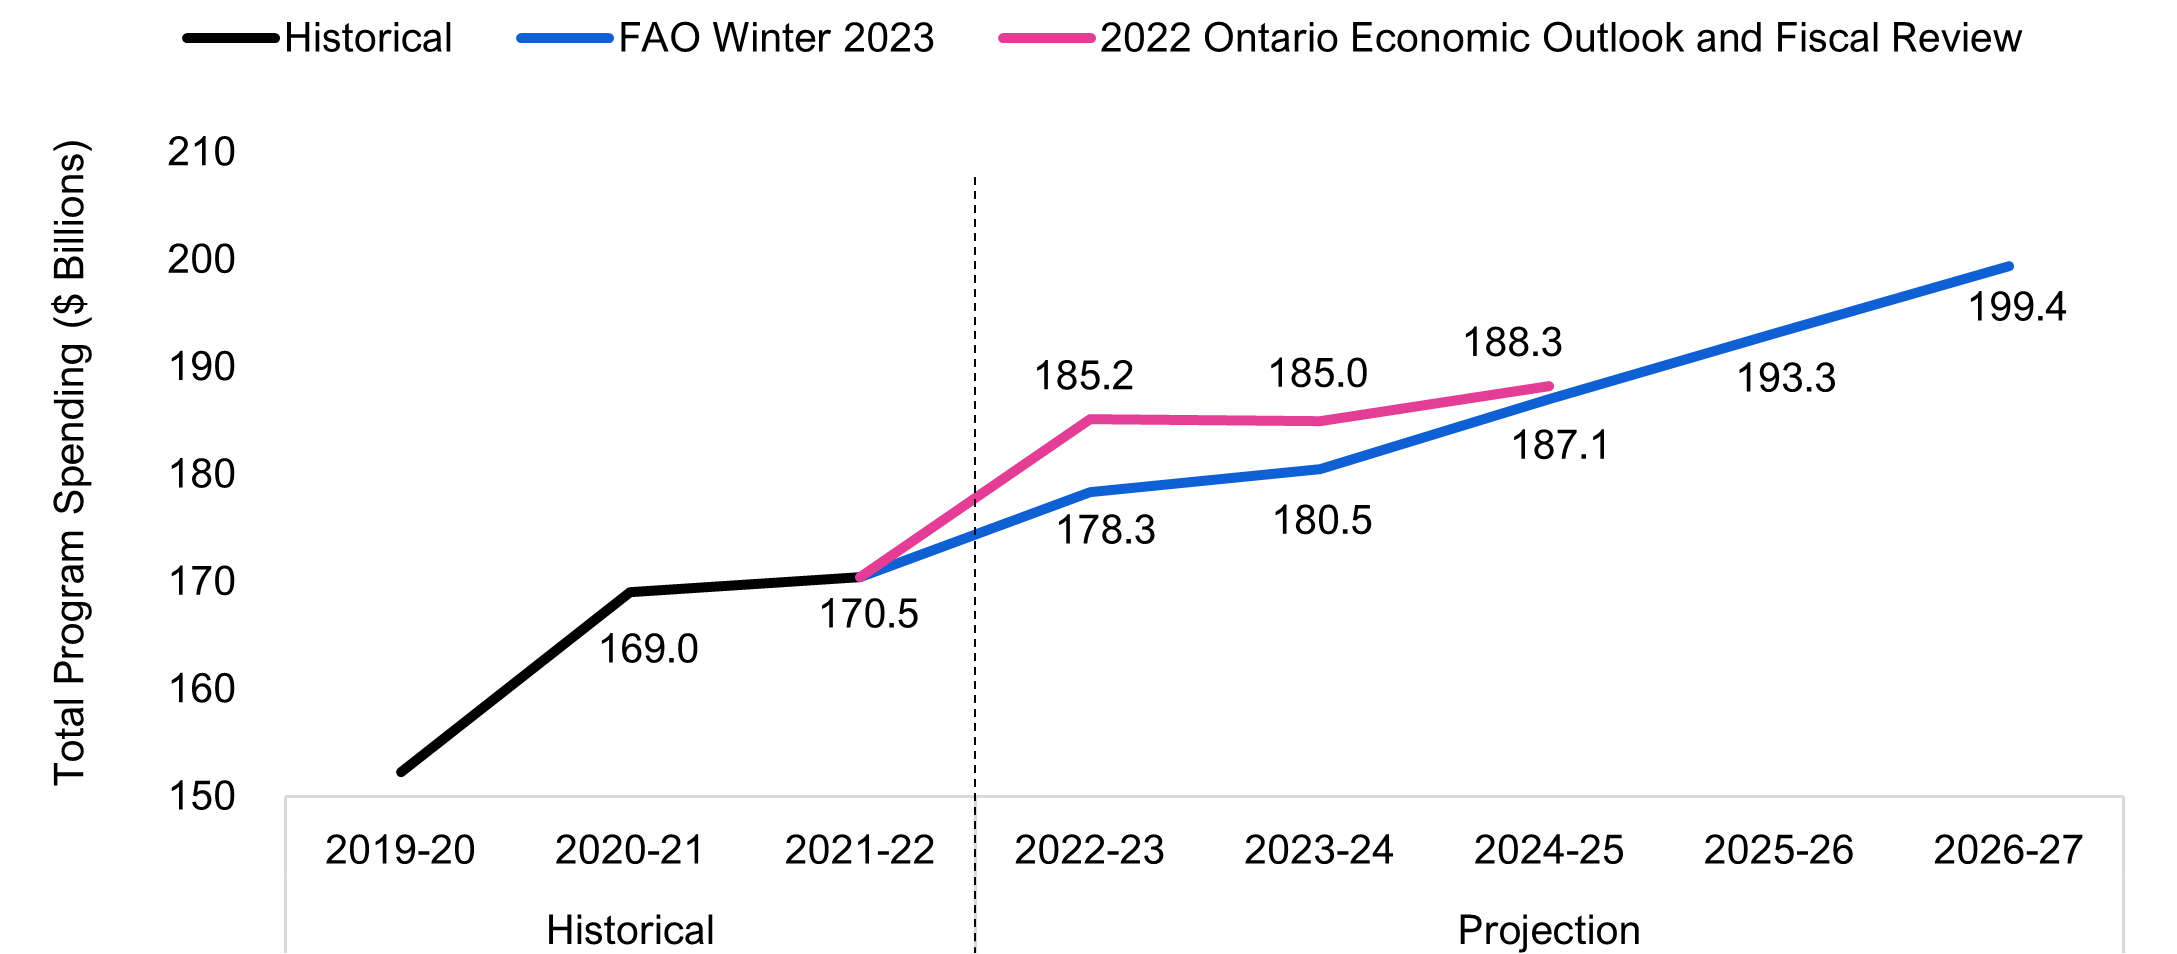
The FAO projects that the Province will spend $178.3 billion on programs in 2022-23, an increase of $7.9 billion (4.6 per cent) from the previous year. By 2026-27, the FAO projects program spending will reach $199.4 billion, with an average annual growth rate of 3.2 per cent over the five-year period.[9]
Compared to the government’s three-year program spending projection in the 2022 Fall Economic Statement, the FAO’s program spending projection is lower in each year. The FAO expects that spending on programs will be $6.8 billion lower than planned by the Province in 2022-23, narrowing to $4.5 billion lower in 2023-24, and $1.2 billion lower in 2024-25. In total, over the three-year period, the FAO projects that the Province has allocated a cumulative $12.5 billion in excess funds that are not currently required to support existing programs and announced commitments.
Figure 4.1FAO’s program spending projection is lower than the government’s through 2024-25
Source: FAO analysis of the 2022 Ontario Economic Outlook and Fiscal Review and information provided by the Ministry of Finance.
Despite excess funds, government spending plan includes shortfalls in some sectors
Although the FAO projects that the Province has allocated $12.5 billion in excess funds to support existing programs and announced commitments over the three-year period, differences arise by program sector. The FAO projects spending shortfalls in health (net $5.0 billion over three years), education ($1.1 billion), justice ($0.8 billion) and postsecondary education ($0.4 billion). These shortfalls mean that the Province has not allocated sufficient funds to these sectors to support existing programs and announced commitments over the three-year period.
On the other hand, the Province has allocated excess funds to ‘other programs’ (net $19.7 billion over three years) and children’s and social services ($0.2 billion). The significant excess funds in the other programs sector are largely due to the contingency fund.[10] Contingency funds are typically used to support existing programs with funding shortfalls, fund new programs or enhance existing programs. Alternatively, if the Province decides not to use the contingency funds, then these funds are applied to improve the budget balance and reduce the Province’s net debt.
| Sector | Program Spending Difference, Province vs. FAO, $ millions | |||
|---|---|---|---|---|
| 2022-23 | 2023-24 | 2024-25 | Total | |
| Health | 1,258 | -1,563 | -4,646 | -4,951 |
| Education | -129 | -325 | -659 | -1,112 |
| Postsecondary Education | 47 | -217 | -267 | -437 |
| Children's and Social Services | 388 | 35 | -253 | 170 |
| Justice | -69 | -407 | -362 | -837 |
| Sum of difference in 5 main sectors | 1,496 | -2,476 | -6,187 | -7,167 |
| Other Programs* | 5,347 | 6,966 | 7,403 | 19,716 |
| Total Program Spending Difference | 6,843 | 4,490 | 1,216 | 12,549 |
For the five main sectors combined, the FAO projects a total funding shortfall of $7.2 billion over three years, which is an improvement of $2.5 billion from the $9.7 billion projected shortfall as of the FAO’s Fall EBO. The decrease in the shortfall is due mainly to the government allocating an additional $2.2 billion in funding to these sectors as part of the FES,[11] largely from the contingency fund. This new funding went to children’s and social services ($1,460 million, primarily for enhancements to the Ontario Disability Support Program[12]), education ($376 million, for the Catch Up Payments program[13]), health ($278 million) and postsecondary education ($94 million).
5. Economic Outlook
Global economic outlook remains weak
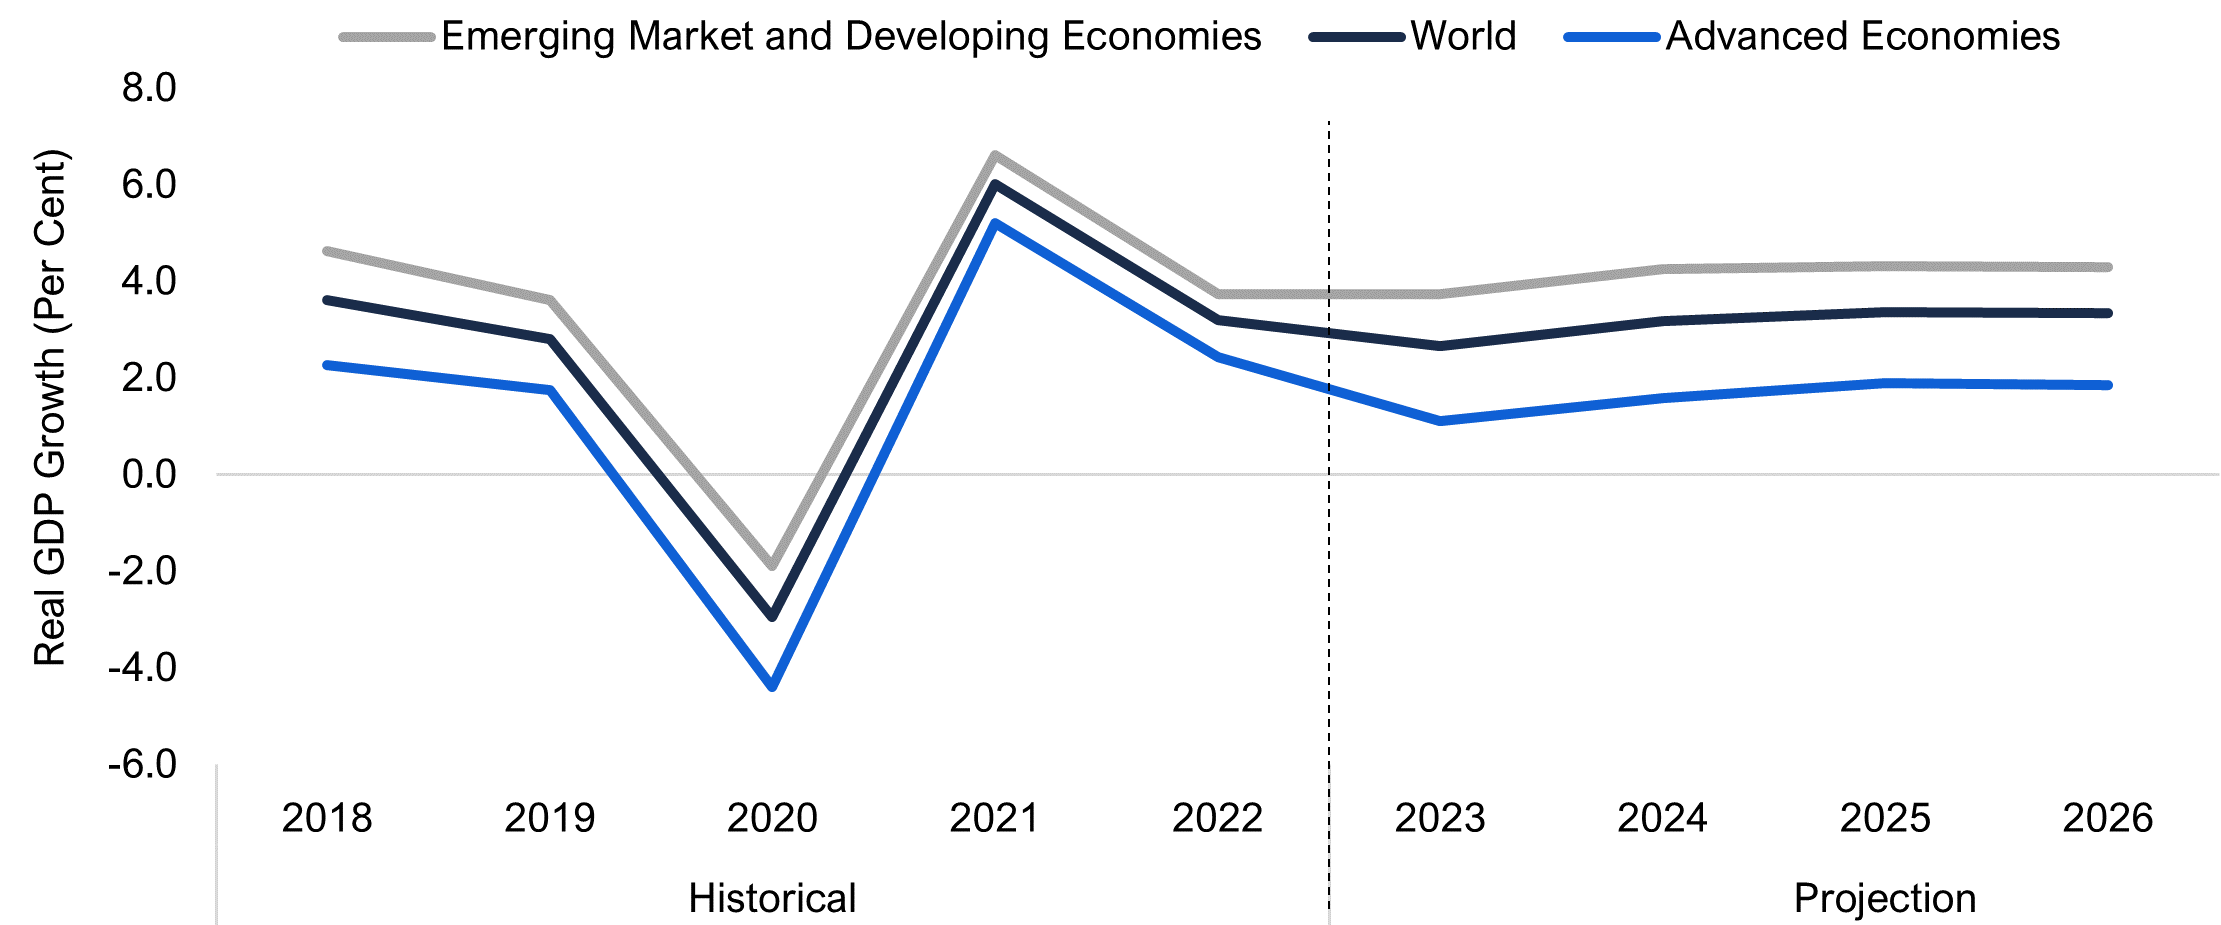
The global economy grew by an estimated 3.2 per cent in 2022, moderating from 6.0 per cent growth in 2021, as broad and persistent inflation, economic damage from the war in Ukraine, and COVID-19-related lockdowns in China created significant challenges.
With inflation likely remaining above the target of most central banks for much of 2023, interest rates are expected to be high throughout the year. As a result, both the International Monetary Fund (IMF) and the Organisation for Economic Co-operation and Development (OECD) expect global economic growth to slow further in 2023, with notable weakness in advanced economies.[14]
By 2024, a mild recovery in economic activity is projected in most countries as demand and supply imbalances fade and inflation slows. However, the end of China’s zero-COVID policy could help alleviate supply chain challenges, lower global inflationary pressures through improved product availability, and boost economic growth by more than anticipated. Other factors such as larger-than-expected negative impacts from higher interest rates and heightened geopolitical tensions particularly in Ukraine could stifle global economic growth during the next couple of years.
Figure 5.1Global economic outlook for 2023 remains weak
Source: International Monetary Fund.
Ontario outlook: elevated inflation and high interest rates to slow economic growth sharply
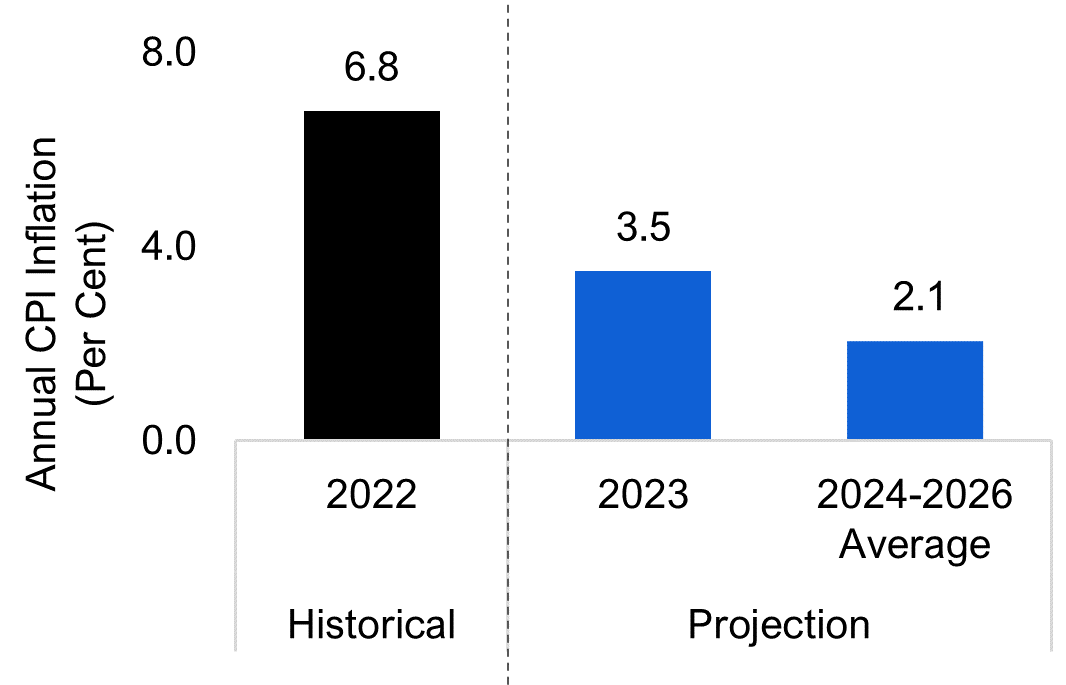
Figure 5.2Inflation projected to moderate gradually over the next two years
Source: Statistics Canada and FAO.
Ontario’s average annual inflation rate reached a 40-year high of 6.8 per cent in 2022, led by a 22.9 per cent increase in energy prices and a 9.1 per cent increase in food prices. Although supply chain challenges have eased somewhat, inflation is expected to stay above historical averages[15] in 2023 and moderate gradually as lower global commodity costs begin to affect consumer prices. By 2024, inflation is expected to settle close to two per cent as the economy fully adjusts to higher interest rates.
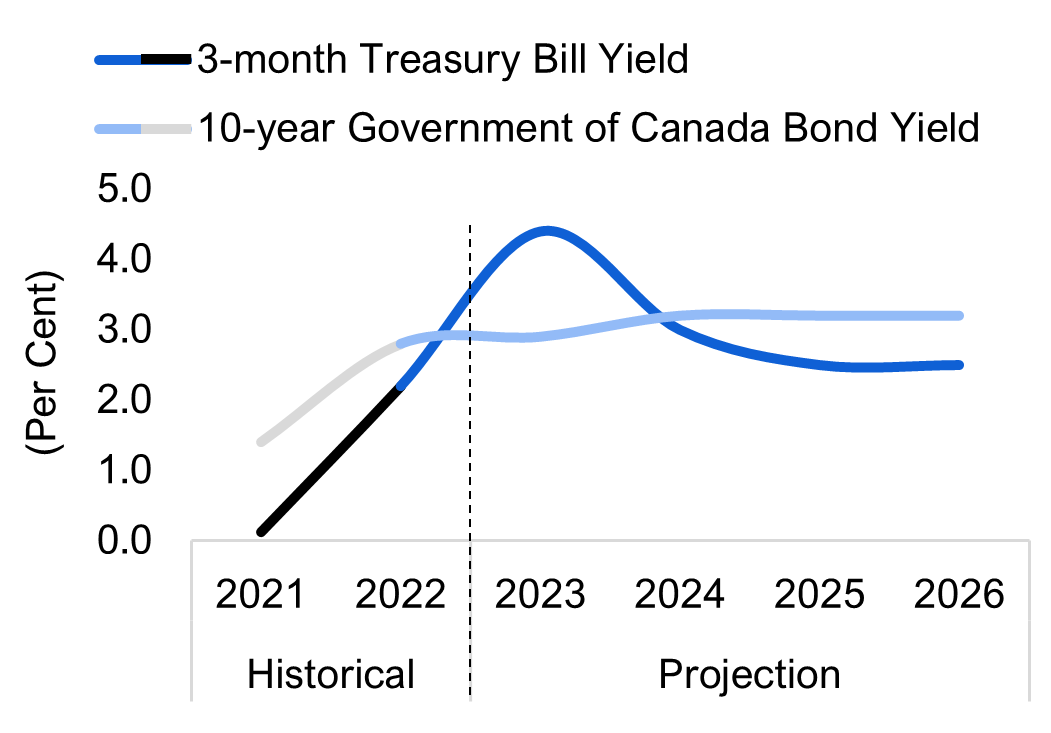
Figure 5.3Short-term interest rates to remain high in 2023 and 2024
Source: Statistics Canada and FAO.
In response to elevated inflation, the Bank of Canada aggressively raised its policy interest rate from 0.25 per cent in March 2022 to 4.50 per cent in January 2023, the highest in 16 years. With economic growth and inflation slowing, the FAO expects the Bank of Canada will keep its policy interest rate at 4.50 per cent for much of 2023.
In line with most private sector economists, the FAO projects that short-term interest rates will stay above long-term rates in 2023, which has historically indicated the possibility of weak economic growth. As inflation eases closer to the Bank’s two per cent target, short-term interest rates are projected to fall below long-term rates in 2024.
Ontario’s Real GDP growth projected to slow sharply in 2023
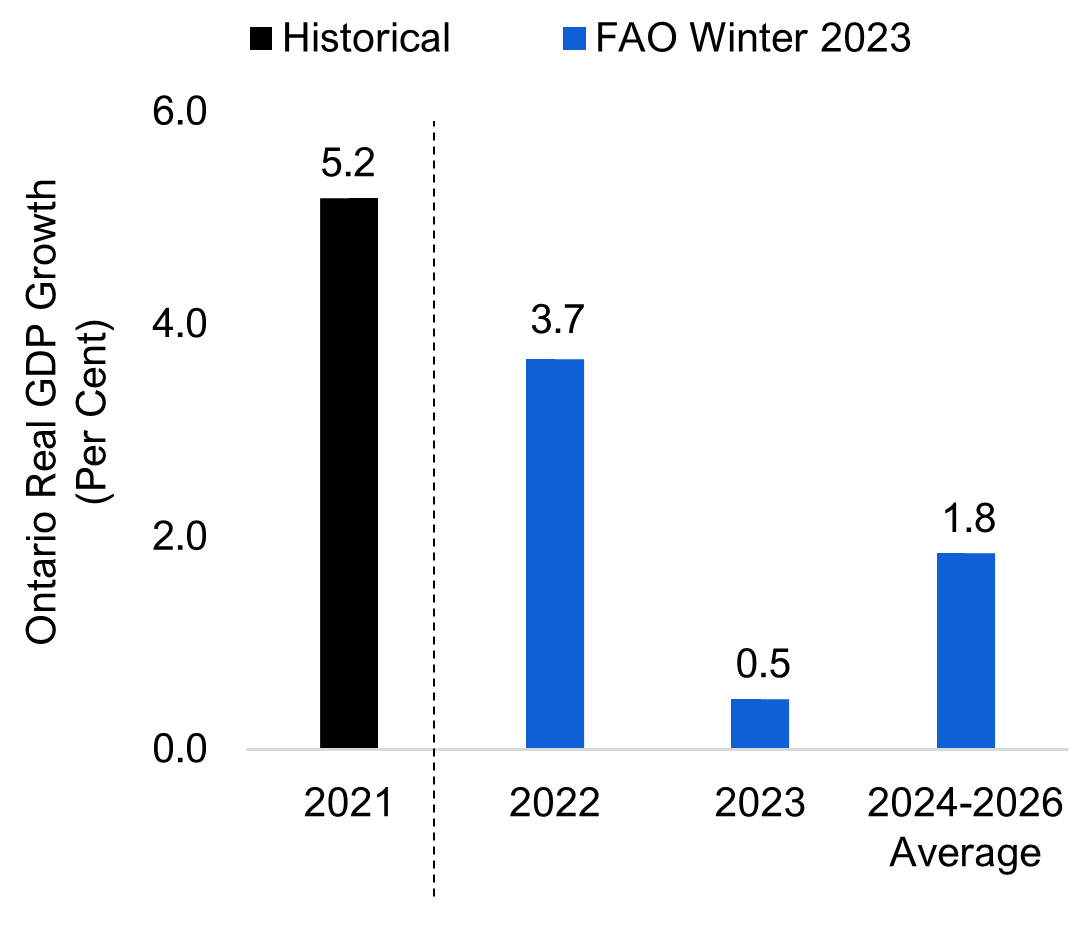
Figure 5.4Ontario’s economic growth to slow sharply in 2023
Source: Ontario Economic Accounts and FAO.
Ontario’s real GDP expanded by an estimated 3.7 per cent in 2022, moderating from 5.2 per cent growth in 2021, as high inflation, rising interest rates and the weaker global environment dampened the economic recovery from the pandemic.
The pace of Ontario’s economic growth is projected to slow sharply to 0.5 per cent in 2023, reflecting the impact of higher interest rates on household spending and the weakening housing market. A rebound in auto sector production and exports may boost Ontario’s economic growth but will depend on supply chain improvements and the health of consumer demand in Canada and the United States.
While the FAO is currently projecting a significant slowdown for Ontario’s economy in 2023, certain risks to the outlook could result in a slower or faster pace of economic growth. See discussion in Chapter 6.
Ontario’s job market expected to slow
Figure 5.5Unemployment rate expected to rise in 2023
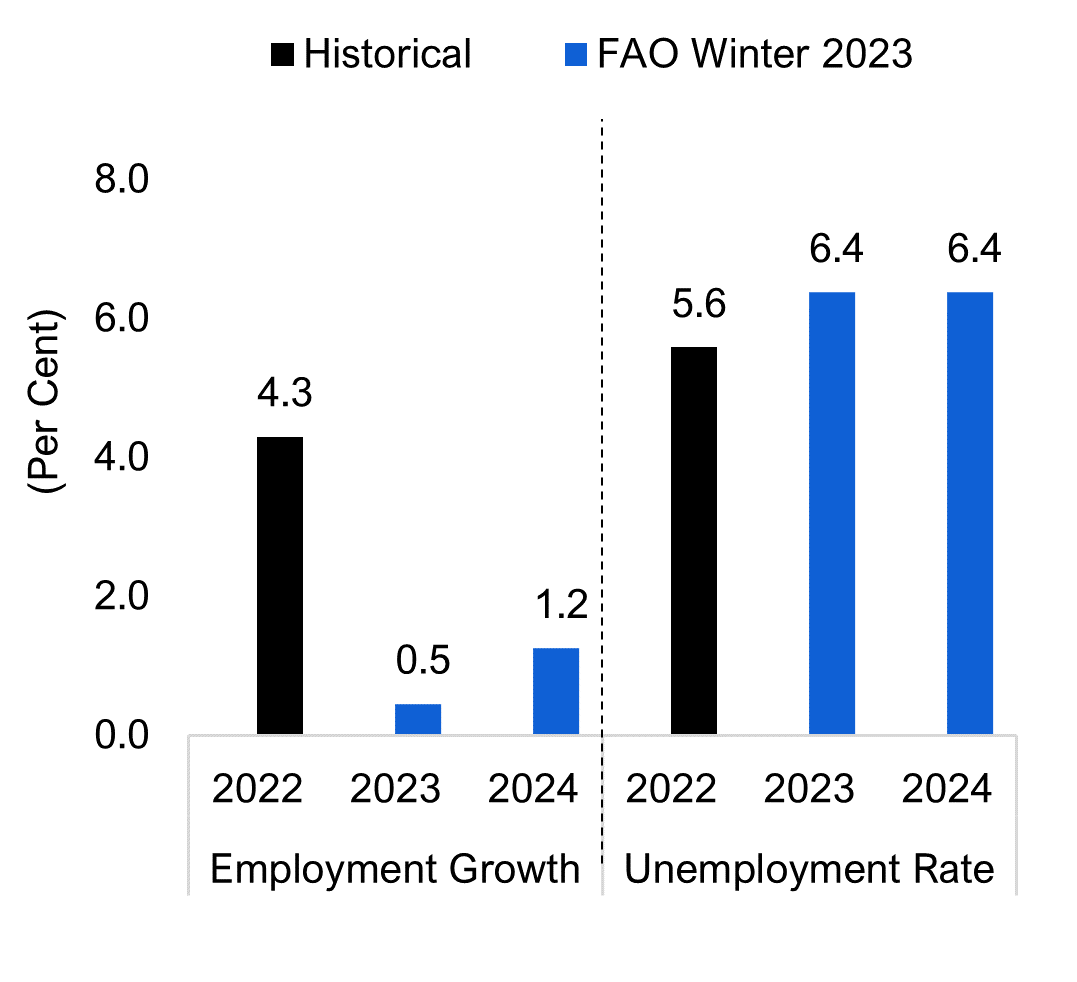
Source: Statistics Canada and FAO.
Ontario recorded another year of strong employment growth in 2022, pushing the annual unemployment rate down to 5.6 per cent, which matches the rate prior to the pandemic and is one of the lowest on record.
As the economy slows, job growth in 2023 is expected to weaken, with employment rising by 0.5 per cent. The unemployment rate is projected to rise to 6.4 per cent in 2023 as employers slow their pace of hiring and layoffs increase. In 2024, the unemployment rate is projected to stay at 6.4 per cent, with stronger job gains offset by solid growth in the labour force. Over the remainder of the outlook, the unemployment rate is projected to average 6.2 per cent.
Ontario’s nominal GDP growth to moderate
Figure 5.6Ontario’s nominal GDP growth to moderate in 2023
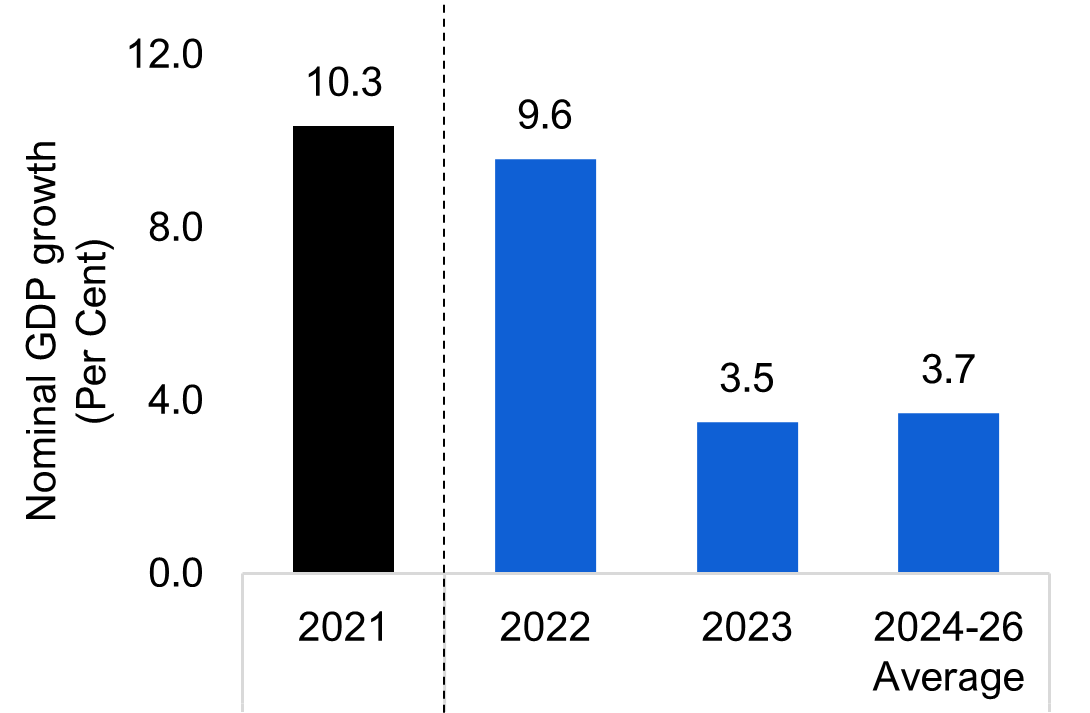
Source: Ontario Economic Accounts and FAO.
Ontario’s nominal GDP, which provides a broad measure of the tax base, extended its strong post-pandemic performance in 2022, rising by an estimated 9.6 per cent due to the acceleration in economy-wide prices.
Following two years of exceptional growth, Ontario’s nominal GDP growth is projected to moderate in 2023 to 3.5 per cent. Labour income growth is expected to soften as employers cut back on hiring and wage expense, while corporate profit growth is projected to slow sharply as consumer spending cools.
Over the 2024 to 2026 period, nominal GDP is expected to grow at an average annual rate of 3.7 per cent.
6. Risks to the Economic and Budget Outlook
Economic and budget uncertainties
Ontario’s economic growth has been resilient since the initial pandemic restrictions were lifted, but several domestic and global factors pose downside risks to the outlook. High inflation could persist, further eroding household purchasing power as savings decline. The impact of higher interest rates on the housing market could be more severe than expected as mortgage payments of many highly indebted households are reset to much larger amounts. If the Federal Reserve follows through on its intent to continue raising interest rates and the U.S. economy experiences a recession, this would create a larger setback to Ontario’s exports of intermediate and manufactured goods. Russia’s war in Ukraine and geopolitical tensions could further disrupt global markets and add to inflationary pressures.
On the upside, the loosening of pandemic lockdown measures in China could further reduce supply chain bottlenecks, lower global inflationary pressures through improved product availability, and provide a boost to economic growth. Fiscal policy targeted to combat the cost-of-living challenge in many countries including Canada, combined with high savings, could help mitigate cost pressures facing households. Some central banks have signalled that they are scaling back the pace of rate hikes, and if inflation continues to slow, expectations for a pause or a decline in interest rates would improve confidence in the economy. Sharply lower energy costs, notably for natural gas, could lessen the expected slowdown in European economic growth.
Ontario’s budget outlook is subject to the same risks affecting the economic outlook, in addition to various other uncertainties. The following notable risks to the budget outlook could result in a deterioration of the Province’s finances:
- Wage settlements above the historical average. The FAO’s program spending forecast assumes wage growth is consistent with existing collective agreements and, for new collective agreements, historical long-term average growth in wages. However, given the forecast for elevated inflation, potential exists for above-average wage settlements.[16] Under an inflation scenario recently developed by the FAO, elevated inflation could add $6.8 billion in additional provincial spending on wages over the five-year forecast period to 2026-27.[17]
- The legal challenge to Bill 124.[18] On November 29, 2022, the Ontario Superior Court of Justice ruled that Bill 124, which limits base salary increases for most provincial employees to one per cent per year for a period of three years, was in violation of the Canadian Charter of Rights and Freedoms and was declared to be void and of no effect. The government has appealed this decision. If the government is unsuccessful in its appeal, then the FAO estimates that provincial spending on wages could increase by $8.4 billion over the five-year period to 2026-27.[19]
- Future policy announcements, such as new tax cuts, spending initiatives or a combination of both.
Increased transfer revenue could also impact Ontario's budget outlook as health care agreements between the federal government and the provinces and territories are finalized.
Budget sensitivities
To illustrate the impact of potential policy changes on Ontario’s fiscal projection, the FAO estimated the sensitivity of key budget indicators to changes in three main policy areas: tax revenues, federal transfers and program expenditures. For each policy item, Table 6-1 provides an estimate of the in-year and 2026-27 change in the budget balance, the total change in net debt by 2026-27, and the change in the net debt-to-GDP ratio in 2026-27.
| Change in budget balance in: | Change in net debt by 2026-27 | Change in net debt to GDP ratio by 2026-27 | ||
|---|---|---|---|---|
| 2022–23 | 2026–27 | |||
| Tax Policy* | ||||
| Decreasing/ increasing annual income taxes payable by $500 for the average taxpayer | +/-$4.5 billion | +/-$6.3 billion | +/-$27.2 billion | +/- 2.2 ppt |
| A one percentage point decrease/ increase to the 11.5 per cent provincial corporate tax rate | +/-$2.2 billion | +/-$2.9 billion | +/-$12.9 billion | +/- 1.1 ppt |
| A one percentage point decrease/ increase to the 8 per cent provincial HST rate | +/-$4.2 billion | +/-$5.7 billion | +/-$24.8 billion | +/- 2.0 ppt |
| Federal Transfers | ||||
| A sustained one percentage point decrease/ increase in the growth rate of the Canada Health Transfer | +/-$0.2 billion | +/-$1.1 billion | +/-$ 3.2 billion | +/- 0.3 ppt |
| A sustained one percentage point decrease/ increase in the growth rate of the Canada Social Transfer | +/-$0.1 billion | +/-$0.4 billion | +/-$1.1 billion | +/- 0.1ppt |
| A $1 billion decrease/ increase in federal transfers in each year of the projection | +/-$1.0 billion | +/-$1.2 billion | +/-$5.6 billion | +/- 0.5 ppt |
| Program Spending | ||||
| A permanent $1 billion program spending change in 2022-23** | +/-$1.0 billion | +/-$1.2 billion | +/-$5.5 billion | +/- 0.5 ppt |
| A sustained one percentage point change in the growth rate of health sector spending over the projection | +/-$0.8 billion | +/-$4.9 billion | +/-$13.4 billion | +/- 1.1 ppt |
| A sustained one percentage point change in the growth rate of education sector spending over the projection | +/-$0.3 billion | +/-$2.1 billion | +/-$5.9 billion | +/- 0.5 ppt |
| A sustained one percentage point change in broader public sector salaries and wages over the projection | +/-$0.5 billion | +/-$2.8 billion | +/-$8.1 billion | +/- 0.7 ppt |
7. Appendix
| (Per Cent Growth) | 2020a | 2021a | 2022f | 2023f | 2024f-2026f Average* |
|---|---|---|---|---|---|
| Nominal GDP | |||||
| FAO | -2.9 | 10.3 | 9.6 | 3.5 | 3.7 |
| 2022 Ontario FES** | -2.9 | 10.3 | 9.2 | 3.5 | 4.0 |
| Labour Income | |||||
| FAO | -0.4 | 9.2 | 9.7 | 3.8 | 3.8 |
| 2022 Ontario FES | -0.4 | 9.2 | 8.9 | 5.1 | 5.0 |
| Corporate Profits | |||||
| FAO | 9.3 | 13.7 | 4.5 | 1.0 | 3.6 |
| 2022 Ontario FES | 9.3 | 13.7 | 4.8 | 1.0 | 1.9 |
| Household Consumption | |||||
| FAO | -7.5 | 7.3 | 12.6 | 3.7 | 3.7 |
| 2022 Ontario FES | -7.5 | 7.3 | 11.5 | 4.9 | 4.5 |
| 2020a | 2021a | 2022a | 2023f | 2024f-2026f Average* | |
|---|---|---|---|---|---|
| Real GDP (Per Cent Growth) | |||||
| FAO | -4.7 | 5.2 | 3.7 | 0.5 | 1.8 |
| 2022 Ontario FES | -4.7 | 5.2 | 2.6 | 0.5 | 1.9 |
| Employment (Per Cent Growth) | |||||
| FAO | -4.8 | 4.9 | 4.3 | 0.5 | 1.3 |
| 2022 Ontario FES | -4.8 | 4.9 | 4.3 | 0.5 | 1.4 |
| Unemployment Rate (Per Cent) | |||||
| FAO | 9.6 | 8.0 | 5.6 | 6.4 | 6.2 |
| 2022 Ontario FES | 9.6 | 8.0 | 5.6 | 6.3 | 6.2 |
| CPI Inflation (Per Cent) | |||||
| FAO | 0.7 | 3.5 | 6.8 | 3.5 | 2.1 |
| 2022 Ontario FES | 0.7 | 3.5 | 6.8 | 3.4 | 2.2 |
| 3-month Treasury Bill Rate (Per Cent) | |||||
| FAO | 0.4 | 0.1 | 2.2 | 4.4 | 2.7 |
| 2022 Ontario FES | 0.4 | 0.1 | 2.2 | 3.7 | 2.7 |
| 10-year Government Bond Rate (Per Cent) | |||||
| FAO | 0.7 | 1.4 | 2.8 | 2.9 | 3.2 |
| 2022 Ontario FES | 0.7 | 1.4 | 2.8 | 3.2 | 3.2 |
| ($ Billions) | 2019-20a | 2020-21a | 2021-22a | 2022-23f | 2023-24f | 2024-25f | 2025-26f | 2026-27f |
|---|---|---|---|---|---|---|---|---|
| Revenue | ||||||||
| Personal Income Tax | 37.7 | 40.3 | 46.8 | 50.4 | 52.6 | 55.1 | 57.4 | 59.8 |
| Annual Growth (per cent) | - | 6.9 | 15.9 | 7.8 | 4.4 | 4.6 | 4.3 | 4.1 |
| Sales Tax | 28.6 | 26.6 | 30.4 | 32.1 | 33.2 | 34.6 | 35.9 | 37.3 |
| Annual Growth (per cent) | - | -7.1 | 14.2 | 5.8 | 3.4 | 4.3 | 3.8 | 3.8 |
| Corporations Tax | 15.4 | 17.8 | 25.2 | 24.5 | 25.0 | 26.3 | 26.6 | 27.5 |
| Annual Growth (per cent) | - | 15.3 | 41.9 | -2.9 | 1.9 | 5.4 | 1.2 | 3.3 |
| All Other Taxes | 26.5 | 26.2 | 29.3 | 27.9 | 27.7 | 30.1 | 31.1 | 32.2 |
| Annual Growth (per cent) | - | -1.1 | 12.0 | -4.9 | -0.8 | 8.7 | 3.4 | 3.5 |
| Total Taxation Revenue | 108.3 | 110.9 | 131.7 | 134.9 | 138.5 | 146.1 | 151.1 | 156.8 |
| Annual Growth (per cent) | - | 2.4 | 18.8 | 2.5 | 2.6 | 5.5 | 3.4 | 3.8 |
| Transfers from Government of Canada | 25.4 | 33.9 | 30.6 | 30.6 | 32.5 | 34.1 | 35.9 | 37.8 |
| Annual Growth (per cent) | - | 33.6 | -9.8 | 0.1 | 5.9 | 5.0 | 5.3 | 5.4 |
| Income from Government Business Enterprise | 5.9 | 5.0 | 6.4 | 6.5 | 6.7 | 7.0 | 7.2 | 7.5 |
| Annual Growth (per cent) | - | -15.1 | 28.6 | 0.5 | 3.6 | 3.7 | 3.7 | 3.7 |
| Other Non-Tax Revenue | 16.5 | 15.1 | 16.3 | 16.5 | 17.0 | 17.6 | 18.3 | 18.9 |
| Annual Growth (per cent) | - | -8.8 | 8.4 | 0.8 | 3.4 | 3.5 | 3.6 | 3.4 |
| Total Revenue | 156.1 | 164.9 | 185.1 | 188.5 | 194.7 | 204.8 | 212.5 | 221.0 |
| Annual Growth (per cent) | - | 5.6 | 12.2 | 1.9 | 3.3 | 5.2 | 3.8 | 4.0 |
| Expense | ||||||||
| Health Sector | 63.7 | 69.5 | 75.7 | 78.6 | 79.4 | 83.0 | 86.4 | 89.9 |
| Annual Growth (per cent) | - | 9.0 | 9.0 | 3.8 | 0.9 | 4.5 | 4.1 | 4.0 |
| Education Sector* | 31.7 | 32.9 | 31.5 | 35.2 | 36.3 | 37.4 | 39.0 | 40.5 |
| Annual Growth (per cent) | - | 3.6 | -4.2 | 11.6 | 3.1 | 3.3 | 4.2 | 3.7 |
| Children's and Social Services Sector | 17.1 | 17.5 | 17.1 | 18.1 | 18.9 | 19.6 | 20.2 | 20.7 |
| Annual Growth (per cent) | - | 2.3 | -2.1 | 5.9 | 4.6 | 3.8 | 2.8 | 2.4 |
| Postsecondary Education Sector | 10.5 | 9.8 | 10.6 | 10.7 | 11.4 | 11.7 | 12.1 | 12.5 |
| Annual Growth (per cent) | - | -6.6 | 8.0 | 1.2 | 6.3 | 2.7 | 3.4 | 3.5 |
| Justice Sector | 4.6 | 4.8 | 5.0 | 5.4 | 5.5 | 5.5 | 5.6 | 5.7 |
| Annual Growth (per cent) | - | 2.8 | 4.3 | 9.1 | 1.6 | -0.5 | 2.2 | 2.5 |
| Other Programs* | 24.6 | 34.6 | 30.5 | 30.2 | 29.0 | 29.8 | 30.0 | 30.1 |
| Annual Growth (per cent) | - | 40.8 | -11.8 | -0.9 | -4.2 | 2.8 | 0.7 | 0.4 |
| Total Program Expense | 152.3 | 169.0 | 170.5 | 178.3 | 180.5 | 187.1 | 193.3 | 199.4 |
| Annual Growth (per cent) | - | 11.0 | 0.8 | 4.6 | 1.2 | 3.6 | 3.3 | 3.2 |
| Interest on Debt | 12.5 | 12.3 | 12.6 | 12.7 | 13.2 | 13.5 | 13.9 | 14.0 |
| Annual Growth (per cent) | - | -1.8 | 2.3 | 1.2 | 3.7 | 2.6 | 2.5 | 0.7 |
| Total Expense | 164.8 | 181.3 | 183.0 | 191.0 | 193.7 | 200.6 | 207.2 | 213.4 |
| Annual Growth (per cent) | - | 10.0 | 0.9 | 4.4 | 1.4 | 3.6 | 3.3 | 3.0 |
| Budget Balance | -8.7 | -16.4 | 2.1 | -2.5 | 1.0 | 4.2 | 5.3 | 7.6 |
| ($ Billions) | 2019–20a | 2020–21a | 2021–22a | 2022–23f | 2023–24f | 2024-25f | 2025-26f | 2026-27f |
|---|---|---|---|---|---|---|---|---|
| Budget Balance | -8.7 | -16.4 | 2.1 | -2.5 | 1.0 | 4.2 | 5.3 | 7.6 |
| Accumulated Deficit | 225.8 | 239.3 | 236.9 | 239.4 | 238.3 | 234.1 | 228.8 | 221.1 |
| Net Debt | 353.3 | 373.6 | 380.4 | 393.0 | 401.5 | 408.3 | 412.8 | 412.9 |
| Net Debt-to-GDP (Per Cent) | 39.6 | 43.1 | 39.8 | 37.5 | 37.0 | 36.3 | 35.4 | 34.1 |
| FAO Revenue Projection Changes, $ billions | |||||
|---|---|---|---|---|---|
| 2022-23 | 2023-24 | 2024-25 | 2025-26 | 2026-27 | |
| Fall EBO | 191.9 | 196.0 | 204.3 | 210.8 | 219.6 |
| New Government Measures | -0.7 | -0.9 | 0.2 | 0.3 | 0.4 |
| Forecast Updates | -2.7 | -0.4 | 0.2 | 1.4 | 1.1 |
| Total Changes | -3.4 | -1.3 | 0.5 | 1.7 | 1.4 |
| Winter EBO | 188.5 | 194.7 | 204.8 | 212.5 | 221.0 |
| FAO Program Spending Projection Changes, $ billions | |||||
|---|---|---|---|---|---|
| 2022-23 | 2023-24 | 2024-25 | 2025-26 | 2026-27 | |
| Fall EBO | 178.9 | 180.8 | 187.1 | 193.2 | 199.4 |
| New Government Measures | 0.6 | 0.4 | 0.3 | 0.4 | 0.5 |
| Forecast Updates | -1.2 | -0.7 | -0.3 | -0.3 | -0.5 |
| Total Changes | -0.6 | -0.3 | 0.0 | 0.1 | 0.0 |
| Winter EBO | 178.3 | 180.5 | 187.1 | 193.3 | 199.4 |
Graphical Descriptions
| Budget Balance ($ Billions) | |||
|---|---|---|---|
| Historical | FAO Winter 2023 | 2022 Ontario Economic Outlook and Fiscal Review | |
| 2020-21 | -16.4 | ||
| 2021-22 | 2.1 | ||
| 2022-23 | -2.5 | -12.9 | |
| 2023-24 | 1.0 | -8.1 | |
| 2024-25 | 4.2 | -0.7 | |
| 2025-26 | 5.3 | - | |
| 2026-27 | 7.6 | - | |
| Net Debt-to-GDP Ratio (Per Cent) | Historical | FAO Winter 2023 | 2022 Ontario Economic Outlook and Fiscal Review | |
|---|---|---|---|---|
| Historical | 1981-82 | 10.4 | ||
| 1982-83 | 12.1 | |||
| 1983-84 | 12.8 | |||
| 1984-85 | 12.9 | |||
| 1985-86 | 14.9 | |||
| 1986-87 | 14.8 | |||
| 1987-88 | 14.4 | |||
| 1988-89 | 13.6 | |||
| 1989-90 | 12.5 | |||
| 1990-91 | 13.4 | |||
| 1991-92 | 17.1 | |||
| 1992-93 | 21.1 | |||
| 1993-94 | 26.6 | |||
| 1994-95 | 28.3 | |||
| 1995-96 | 30.1 | |||
| 1996-97 | 31.2 | |||
| 1997-98 | 30.5 | |||
| 1998-99 | 29.4 | |||
| 1999-00 | 32.1 | |||
| 2000-01 | 29.3 | |||
| 2001-02 | 28.2 | |||
| 2002-03 | 26.8 | |||
| 2003-04 | 27.5 | |||
| 2004-05 | 26.8 | |||
| 2005-06 | 27.8 | |||
| 2006-07 | 27.1 | |||
| 2007-08 | 26.6 | |||
| 2008-09 | 27.8 | |||
| 2009-10 | 32.3 | |||
| 2010-11 | 34.5 | |||
| 2011-12 | 36.6 | |||
| 2012-13 | 38.2 | |||
| 2013-14 | 39.7 | |||
| 2014-15 | 40.5 | |||
| 2015-16 | 40.3 | |||
| 2016-17 | 39.7 | |||
| 2017-18 | 39.3 | |||
| 2018-19 | 39.4 | |||
| 2019-20 | 39.6 | |||
| 2020-21 | 43.1 | |||
| 2021-22 | 39.2 | |||
| Projection | 2022-23 | 37.5 | 38.4 | |
| 2023-24 | 37.0 | 38.7 | ||
| 2024-25 | 36.3 | 38.3 | ||
| 2025-26 | 35.4 | - | ||
| 2026-27 | 34.1 | - | ||
| Interest on Debt to Revenue (Per Cent) | Historical | FAO Winter 2023 | 2022 Ontario Economic Outlook and Fiscal Review | |
| Historical | 1981-82 | 6.0 | ||
| 1982-83 | 7.3 | |||
| 1983-84 | 8.7 | |||
| 1984-85 | 9.2 | |||
| 1985-86 | 9.5 | |||
| 1986-87 | 9.7 | |||
| 1987-88 | 9.6 | |||
| 1988-89 | 9.1 | |||
| 1989-90 | 8.2 | |||
| 1990-91 | 7.7 | |||
| 1991-92 | 8.8 | |||
| 1992-93 | 10.8 | |||
| 1993-94 | 13.9 | |||
| 1994-95 | 14.5 | |||
| 1995-96 | 14.6 | |||
| 1996-97 | 14.8 | |||
| 1997-98 | 14.2 | |||
| 1998-99 | 14.3 | |||
| 1999-00 | 15.5 | |||
| 2000-01 | 15.0 | |||
| 2001-02 | 14.2 | |||
| 2002-03 | 12.9 | |||
| 2003-04 | 12.9 | |||
| 2004-05 | 11.1 | |||
| 2005-06 | 10.3 | |||
| 2006-07 | 9.4 | |||
| 2007-08 | 8.9 | |||
| 2008-09 | 9.2 | |||
| 2009-10 | 9.5 | |||
| 2010-11 | 8.8 | |||
| 2011-12 | 9.1 | |||
| 2012-13 | 9.0 | |||
| 2013-14 | 9.1 | |||
| 2014-15 | 8.9 | |||
| 2015-16 | 8.5 | |||
| 2016-17 | 8.3 | |||
| 2017-18 | 7.9 | |||
| 2018-19 | 8.1 | |||
| 2019-20 | 8.0 | |||
| 2020-21 | 7.4 | |||
| 2021-22 | 6.8 | |||
| Projection | 2022-23 | 6.7 | 7.3 | |
| 2023-24 | 6.8 | 7.5 | ||
| 2024-25 | 6.6 | 7.3 | ||
| 2025-26 | 6.5 | - | ||
| 2026-27 | 6.3 | - | ||
| Year | Program Spending ($ Billions) | |||
|---|---|---|---|---|
| Historical | FAO Winter 2023 | 2022 Ontario Economic Outlook and Fiscal Review | ||
| Historical | 2019-20 | 156.1 | ||
| 2020-21 | 164.9 | |||
| 2021-22 | 185.1 | |||
| Projection | 2022-23 | 188.5 | 186.8 | |
| 2023-24 | 194.7 | 192.9 | ||
| 2024-25 | 204.8 | 204.1 | ||
| 2025-26 | 212.5 | - | ||
| 2026-27 | 221.0 | - | ||
| Year | Program Spending ($ Billions) | |||
|---|---|---|---|---|
| Historical | FAO Winter 2023 | 2022 Ontario Economic Outlook and Fiscal Review | ||
| Historical | 2019-20 | 152.3 | ||
| 2020-21 | 169.0 | |||
| 2021-22 | 170.5 | |||
| Projection | 2022-23 | 178.3 | 185.2 | |
| 2023-24 | 180.5 | 185.0 | ||
| 2024-25 | 187.1 | 188.3 | ||
| 2025-26 | 193.3 | - | ||
| 2026-27 | 199.4 | - | ||
| Year | Real GDP Growth (Per Cent) | ||
|---|---|---|---|
| World | Advanced Economies | Emerging Market and Developing Economies | |
| 2018 | 3.6 | 2.3 | 4.6 |
| 2019 | 2.8 | 1.7 | 3.6 |
| 2020 | -3.0 | -4.4 | -1.9 |
| 2021 | 6.0 | 5.2 | 6.6 |
| 2022 | 3.2 | 2.4 | 3.7 |
| 2023 | 2.7 | 1.1 | 3.7 |
| 2024 | 3.2 | 1.6 | 4.3 |
| 2025 | 3.4 | 1.9 | 4.3 |
| 2026 | 3.3 | 1.9 | 4.3 |
| 2022 | 2023 | 2024-2026 Average | |
|---|---|---|---|
| Annual CPI Inflation (Per Cent) | 6.8 | 3.5 | 2.1 |
| (Per Cent) | Historical | Projection | ||||
|---|---|---|---|---|---|---|
| 2021 | 2022 | 2023 | 2024 | 2025 | 2026 | |
| 3-month Treasury Bill Yield | 0.1 | 2.2 | 4.4 | 3.0 | 2.5 | 2.5 |
| 10-year Government of Canada Bond Yield | 1.4 | 2.8 | 2.9 | 3.2 | 3.2 | 3.2 |
| Ontario Real GDP Growth (Per Cent) | 2021 | 2022 | 2023 | 2024-2026 Average |
|---|---|---|---|---|
| Historical | 5.2 | |||
| FAO Winter 2023 | 3.7 | 0.5 | 1.8 |
| Per Cent | Historical | FAO Winter 2023 | |
|---|---|---|---|
| 2022 | 2023 | 2024 | |
| Employment Growth | 4.3 | 0.5 | 1.2 |
| Unemployment Rate | 5.6 | 6.4 | 6.4 |
| Year | Nominal GDP growth (Per Cent) | |
|---|---|---|
| Historical | 2021 | 10.3 |
| Projection | 2022 | 9.6 |
| 2023 | 3.5 | |
| 2024-26 Average | 3.7 | |
Footnotes
[1] The 2021-22 budget surplus primarily reflected extraordinary growth in revenues as strong employment growth and high inflation pushed up incomes, household spending and tax revenues.
[2] Appendix tables A-5 and A-6 outline the FAO’s revenue and spending revisions since the Fall 2022 Economic and Budget Outlook (EBO).
[3] The 2022 Ontario Budget updated the target for the net debt-to-GDP ratio to stay below 42 per cent, compared to a target of 50.5 per cent in the 2021 Ontario Budget. See 2022 Ontario Budget, page 215.
[4] The impact of rising rates on interest on debt payments is also mitigated in part by the term structure of Ontario’s debt, which in 2021-22 had an average term to maturity of 10.9 years. See 2022 Ontario Budget, page 213.
[5] The 2022 Ontario Budget set a target for interest on debt as a share of revenues to stay below eight per cent, compared to the commitment in the 2021 Ontario Budget to slow the rate of increase. See 2022 Ontario Budget, page 215.
[6] 2021-22 revenues also reflected substantial one-time revenue gains. For example, Corporations Tax revenue in 2021-22 included $3.8 billion in one-time revenue that was processed after the finalization of 2020-21 Public Accounts. Federal government transfer revenues in 2021-22 included $3.7 billion in time-limited COVID-19 support. For more details, see page 101 of the 2022 Ontario Economic Outlook and Fiscal Review.
[7] On average, total revenues increased by $4.7 billion per year over the 2011-12 to 2019-20 period.
[8] In December 2022, the federal government announced that Ontario will receive $421 million in equalization payments in 2023-24 based on strong growth in Canada’s nominal GDP over the past three years. The FAO’s projection includes equalization payments in 2023-24 and 2024-25, based on the federal government’s equalization formula, which relies on a three-year moving average of Canadian economic growth.
[9] For information on changes to the FAO’s spending projection compared to the Fall EBO, see the appendix.
[10] As of the 2022 Ontario Economic Outlook and Fiscal Review, $3.5 billion remained in the contingency fund in 2022-23. For 2023-24 and 2024-25, the Ministry of Finance has asserted that disclosure of the contingency fund balance would reveal a Cabinet record. The FAO has agreed not to disclose Cabinet record information as per paragraph 2(f) of Order in Council 1086/2022.
[11] There was also a net $0.3 billion reduction to the FAO’s program spending projection for these sectors.
[12] See 2022 Ontario Economic Outlook and Fiscal Review, page 70. The cost of most of the program enhancements was included in the FAO’s Fall EBO.
[13] See 2022 Ontario Economic Outlook and Fiscal Review, page 61 and “Catch Up Payments”. The cost of this program was included in the FAO’s Fall EBO.
[14] The OECD currently projects global real GDP growth of 2.2 per cent in 2023 (see OECD Economic Outlook, November 2022: Confronting the Crisis), while the IMF projects 2.7 per cent (See: World Economic Outlook, October 2022).
[15] Since the Bank of Canada began inflation targeting in 1992, annual inflation in Ontario averaged 1.9 per cent.
[16] For example, the Province recently reached new tentative agreements with approximately 55,000 education workers who are members of the Canadian Union of Public Employees (CUPE) and approximately 7,000 education workers represented by the Ontario Council of Educational Workers (OCEW). The FAO estimates that CUPE workers received an average annual wage increase of approximately 3.6 per cent per year for four years, which is above the long-term historical average of 2.2 per cent.
[17] See Ontario Public Sector Employment and Compensation, 2022.
[18] Bill 124 refers to the Protecting a Sustainable Public Sector for Future Generations Act, 2019.
[19] See Ontario Public Sector Employment and Compensation, 2022.