


Table of Abbreviations
|
Abbreviation |
Long Form |
|---|---|
|
CCAC |
Community Care Access Centre |
|
CHC |
Community Health Centre |
|
CHSRF |
Canadian Health Services Research Foundation |
|
CIHI |
Canadian Institute for Health Information |
|
CPI |
Consumer Price Index |
|
FAO |
Financial Accountability Office |
|
LHIN |
Local Health Integration Network |
|
LOC |
Level-of-Care |
|
LTC |
Long-Term Care |
|
MOHLTC |
Ministry of Health and Long-Term Care |
|
ODB |
Ontario Drug Benefit |
|
OECD |
Organisation for Economic Co-operation and Development |
|
OHIP |
Ontario Health Insurance Plan |
|
pCPA |
pan-Canadian Pharmaceutical Alliance |
|
TBS |
Treasury Board Secretariat |
1. Essential Points
- As part of its plan to balance the budget by 2017-18, the Government of Ontario (the Province) is restraining the growth rate of health sector expense.
- Starting in 2012-13, the Province reduced the annual growth rate of health sector expense to around 2%, largely by slowing growth in the hospitals and OHIP program areas. Key program changes included a freeze in base operating funding to hospitals from 2012-13 to 2015-16 and reductions in physician payment rates in 2013 and 2015.
- Based on the FAO’s review of the health sector program changes implemented by the Province to date, if the Province is to meet its 2016 Ontario Budget health sector expense targets, the Province will need to implement additional program changes that result in health sector expense savings of $0.4 billion in 2016-17, $0.9 billion in 2017-18 and $1.5 billion in 2018-19.
- The FAO’s analysis of health sector expense growth rate trends and cost drivers raises questions about the sustainability of 2% average annual growth beyond 2018-19, if health care quality and level of service are to be maintained.
2. Executive Summary
Background
The health sector is the largest expense category in Ontario’s budget, $51.8 billion in 2016-17, accounting for 42.4% of program expense and 38.7% of total expense (including interest on debt). Managing the rate of growth in the health sector is a critical part of the Province’s plan to return its budget to balance in 2017-18. The 2016 Ontario Budget projects average annual growth in health sector expense of 1.7% from 2015-16 to 2018-19, below the growth rate for the last four years and substantially below the rate of 6.8% from 2001-02 to 2011-12 (Figure A).
Figure A: Ontario Health Sector Expense: Average Annual Growth Rate
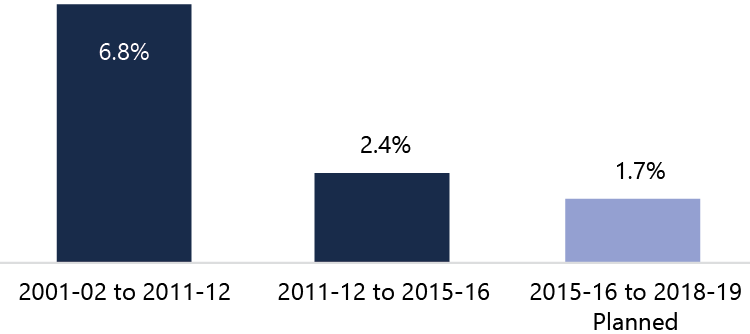
Source: FAO analysis of data from MOHLTC, TBS and the 2016 Ontario Budget.
Purpose of the Report
This report reviews how the Province plans to achieve the health sector expense targets from 2016-17 to 2018-19 presented in the 2016 Ontario Budget, and whether the growth rate required to achieve the targets is sustainable after 2018-19.
Health Sector Expense Growth Rates by Program Area
The reduction in the average annual growth rate of health sector expense from 6.8% (2001-02 to 2011-12) to 2.4% (2011-12 to 2015-16) was achieved by reducing the growth rate in all of the program areas (Figure B).
Figure B: Ontario Health Sector Expense: Average Annual Growth Rates by Program Area, 2001-02 to 2011-12 and 2011-12 to 2015-16
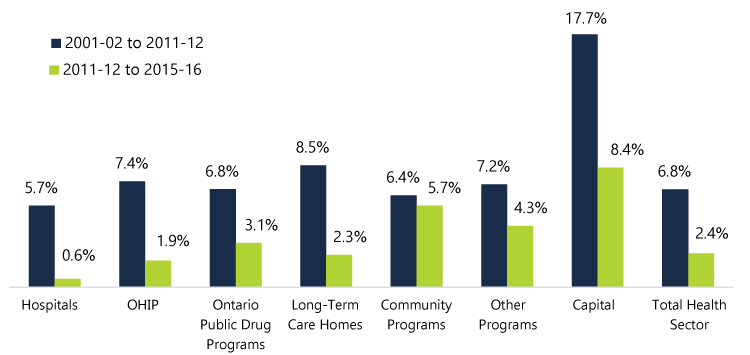
Source: FAO analysis of data from MOHLTC, TBS and the Public Accounts of Ontario.
Note: In 2005-06, the Province’s financial reporting was expanded to include hospital assets, which impacted the growth rate of capital program expense. As a comparison, the annual growth rate of capital program expense from 2005-06 to 2011-12 averaged 12.7%, rather than the 17.7% annual average from 2001-02 to 2011-12. However, the slowdown in the growth rate of health sector expense was not uniform across program areas. The hospitals and OHIP (Ontario Health Insurance Plan, primarily payments to physicians) program areas accounted for approximately three-quarters of the change in the overall health sector expense growth rate.
However, the slowdown in the growth rate of health sector expense was not uniform across program areas. The hospitals and OHIP (Ontario Health Insurance Plan, primarily payments to physicians) program areas accounted for approximately three-quarters of the change in the overall health sector expense growth rate.
The 2016 budget projects another significant reduction in the growth rate of health sector expense, declining from 2.4% to 1.7% for the 2015-16 to 2018-19 period. This represents a reduction of almost one-third in the growth rate of health sector expense.
In 2016-17, the 2016 budget projects health sector expense to grow by only 1.4%. If this growth rate is achieved, it will be the first year that health sector expense has grown by less than 2% since 1997-98.[1] In 2016-17, only long-term care homes and community programs are projected to have growth rates higher than their 2011-12 to 2015-16 average (Figure C).
Figure C: Ontario Health Sector Expense: Average Annual Growth Rate by Program Area, 2011-12 to 2015-16 vs. Planned Growth Rate in 2016-17
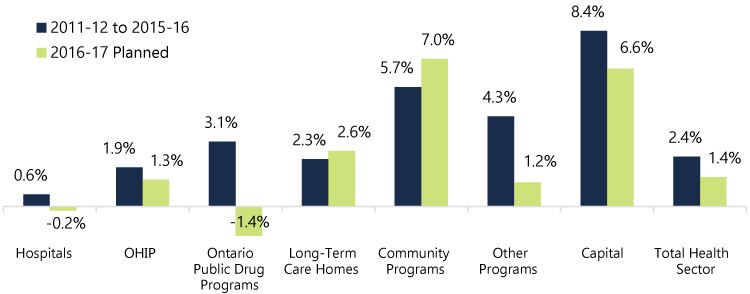
Source: FAO analysis of data from MOHLTC, TBS and the 2016 Ontario Budget.
Health Sector Program Changes
The FAO identified a number of health sector program changes that had (or will have) a material impact on health sector expense. The three most significant are:
- In the hospitals program area, the Province’s decision to hold the growth rate in base operating funding for hospitals[2] to 0% from 2012-13 to 2015-16 and 1% in 2016-17 achieved significant expense savings.[3]
- In the OHIP program area, reductions to physician payments in 2013 and 2015 temporarily slowed the growth rate of OHIP expense. However, without further program changes, the FAO expects that after 2016-17 demand factors, such as population growth and aging, and utilization (an increase in the per capita demand for services), will return OHIP program area expense growth to approximately 3.5% per year.
- In the long-term care (LTC) homes program area, the FAO estimates that, after accounting for inflation, approximately 25% of the increase in program expense from 2003-04 to 2011-12 was the result of an increase in the number of LTC beds in operation. After 2011-12, the number of LTC beds in operation remained relatively constant, which significantly lowered the overall LTC homes program expense growth rate.
Will the Province Meet the 2016 Budget Health Sector Expense Targets?
The FAO estimates that there is an expense gap between the status quo (assumes Provincial program changes implemented to date are continued to 2018-19) and the Province’s 2016 budget health sector expense targets of approximately $0.4 billion in 2016-17, $0.9 billion in 2017-18 and $1.5 billion in 2018-19 (Figure D). The FAO’s analysis indicates that the Province will need to introduce additional program changes in order to meet its health sector expense targets to 2018-19.[4]
Figure D: Estimate of Health Sector Expense Gap between 2016 Ontario Budget Targets and the FAO’s Status Quo Forecast
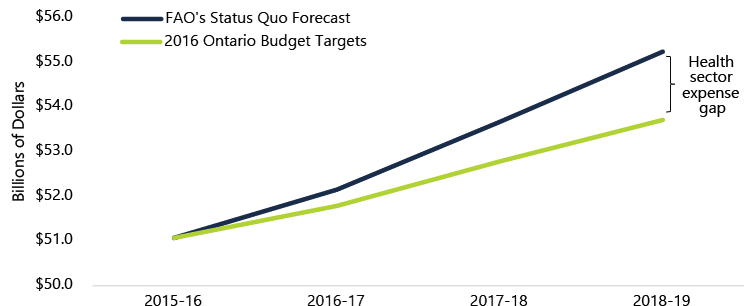 Sources: “FAO’s Status Quo Forecast”: see Table 5‑2. “2016 Ontario Budget Targets”: see 2016 Ontario Budget, p. 275.
Sustainability after 2018-19
If the 2016 Ontario Budget’s health sector expense targets are achieved, health sector expense will average 2.1% annual growth from 2011-12 to 2018-19. The FAO’s review of health sector expense growth rate trends and cost drivers raises questions about whether 2.1% growth after 2018-19 is sustainable if the current level of health care quality and service are to be maintained. The FAO estimates that health sector expense cost drivers (population growth and aging, inflation and income growth) will lead to health sector expense growth rate pressures of 5.3% per year to 2020.
Evaluating the impact of the Province’s health sector program changes on health care quality and performance is an important area of future work and will be a key factor in determining the sustainable health sector expense growth rate. Ultimately, the growth rate of health sector expense after 2018-19 will depend on whether program changes made to date have resulted in efficiencies and quality improvements or simply delayed expenses that will need to be incurred to maintain quality and service levels.
Questions for the Province
On the basis of the analysis presented in this report, Members of Provincial Parliament may wish to ask the Province the following questions to gain a better understanding of how the Province plans to achieve the health sector expense targets in the 2016 Ontario Budget and the expected health sector expense growth rate after 2018-19.
|
Issue and Importance |
Questions |
|---|---|
|
Health Sector Expense Targets to 2018-19: The FAO has identified a number of health sector program changes which slowed the growth rate in health sector expense starting in 2012-13. However, based on information available to the FAO, in order to meet the health sector expense targets in the 2016 budget, the FAO estimates that the Province will need to implement additional program changes resulting in health sector expense savings of $0.4 billion in 2016-17, $0.9 billion in 2017-18 and $1.5 billion in 2018-19. |
What additional program changes will be implemented to meet the 2016 budget health sector expense targets in 2016-17, 2017-18 and 2018-19? |
|
Sustainability after 2018-19: If the health sector expense targets in the 2016 budget are achieved, the annual growth rate in health sector expense will average 2.1% from 2011-12 to 2018-19. The FAO’s review of health sector expense growth rate trends and cost drivers raises questions about whether 2.1% annual growth is a sustainable health sector expense growth rate necessary to maintain health care quality and service levels. |
What is the expected impact of the health sector program changes implemented by the Province on health care system quality, efficiency and service level? What is the Province’s estimate of the sustainable annual health sector expense growth rate beyond 2018-19, in order to maintain the current level of health care quality and type of services provided? |
3. Introduction
The health sector is the largest expense item in Ontario’s 2016 budget, $51.8 billion in 2016-17, accounting for 42.4% of program expense and 38.7% of total expense (including interest on debt).[5]
Due to the size of the health sector, limiting its rate of growth is a critical part of the Government of Ontario’s (the Province’s) plan to return its budget to balance starting in 2017-18. In order to achieve balanced budgets in 2017-18 and 2018-19, the 2016 Ontario Budget projects an average annual growth rate[6] in health sector expense of 1.7% from 2015-16 to 2018-19. If achieved, this projected rate of growth would be below the average annual growth rate for the last four years and substantially below the growth rate from the 2001-02 to 2011-12 period.
Chart 3‑1: Ontario Health Sector Expense: Average Annual Growth Rate
Source: FAO analysis of data from MOHLTC, TBS and the 2016 Ontario Budget.
In fact, if the Province’s 2016 budget plan is achieved, it would mean seven consecutive years of health sector expense growth lower than any year since 1997-98.
Chart 3‑2: Ontario Health Sector Expense: Annual Growth Rate, 1997-98 to 2018-19
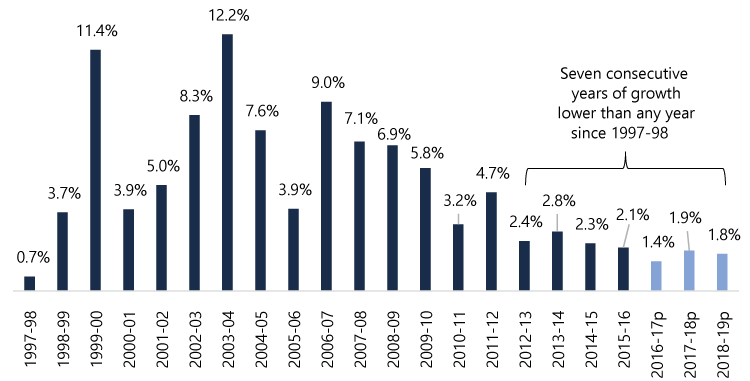
Source: FAO analysis of data from MOHLTC, TBS, the 2016 Ontario Budget and Kneebone, Ronald and Margarita Wilkins, “Canadian Provincial Government Budget Data, 1980/81 to 2013/14,” Canadian Public Policy, volume 42, Issue 1, March 2016.
Note: “2016-17p”, “2017-18p” and “2018-19p” are the health sector expense targets in the 2016 Ontario Budget.
This report reviews how the Province plans to achieve the 2016 Ontario Budget health sector expense targets from 2016-17 to 2018-19, and whether the growth rate required to achieve the targets is sustainable after 2018-19. As part of this analysis, the report reviews how the Province slowed the growth rate of health sector expense starting in 2012-13.
This report does not suggest alternative ways of meeting the 2016 budget’s health sector expense targets or assess the policy implications of any health sector program decisions implemented or planned by the Province.
Appendix B provides more information on the development of this report.
4. Growth Rates for Health Sector Program Areas
This chapter reviews the Province’s health sector expense by seven program areas. Analysis shows how the growth rates in the program areas have changed from 2001-02 to 2016-17.
Program Areas and Spending
The Province categorizes health sector expense into seven program areas. The 2016 Ontario Budget’s 2016-17 health sector expense target of $51.8 billion is set out by program area in Figure 4‑1.
Figure 4‑1: 2016-17 Planned Health Sector Expense by Program Area($ billions)
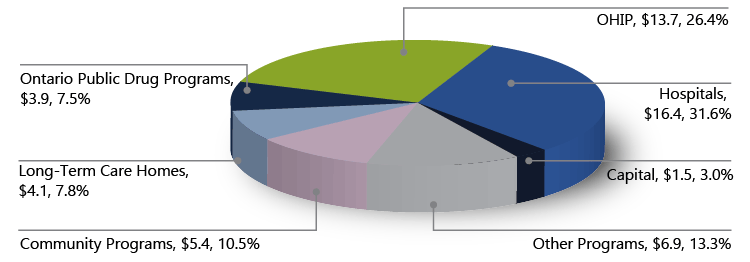
Source: FAO analysis of data from MOHLTC, TBS and the 2016 Ontario Budget.
Note: the 2016 Ontario Economic Outlook and Fiscal Review, released November 14, 2016, reports that the “Current Outlook” for health sector expense in 2016-17 has increased to $51.9 billion (pp. 145 and 146).
Expense associated with hospitals and the Ontario Health Insurance Plan (OHIP) accounts for $30.0 billion or 58.0% of planned health sector expense in 2016-17. Other programs is the third largest area at $6.9 billion (13.3% of total), followed by community programs at $5.4 billion (10.5%). The next two program areas, long-term care (LTC) homes and Ontario public drug programs, account for $4.1 billion (7.8%) and $3.9 billion (7.5%), respectively. Finally, the smallest program area is capital, which accounts for $1.5 billion or 3.0% of planned health sector expense in 2016-17.
Appendix A provides background information on each of the program areas.
Growth Rates from 2001-02 to 2015-16
Chart 4‑1 shows annual health sector expense growth from 2002-03 to 2015-16. Health sector expense grew by an average annual rate of 6.8% from 2001-02 to 2011-12 but only 2.4% from 2011-12 to 2015-16. 2012-13 marks a significant change in the growth rate of health sector expense. From 2012-13 to 2015-16, the annual growth rate of health sector expense was 2.8% or less compared to 3.2% or higher from 2002-03 to 2011-12. This observation aligns with the Province’s stated goal in the 2013 Ontario Budget to keep the growth rate in health sector expense to an annual average of 2% over the medium term.[7]
Chart 4‑1: Ontario Health Sector Expense Growth Rates from 2002-03 to 2015-16
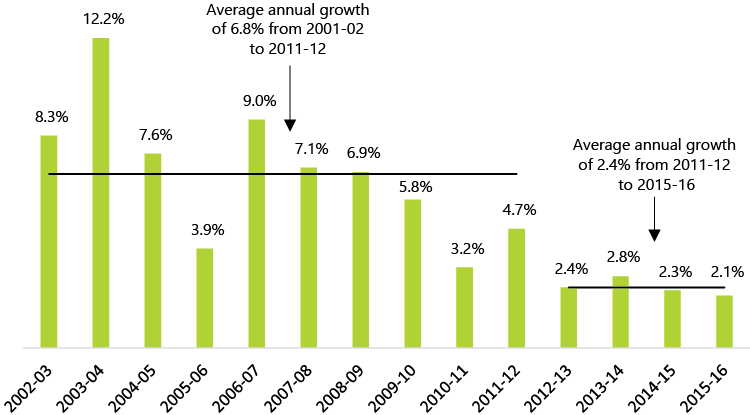
Source: FAO analysis of data from MOHLTC, TBS and the Public Accounts of Ontario.
The reduction in the average annual growth rate of health sector expense was achieved by reducing the growth rates in all of the program areas (Chart 4‑2).
Chart 4‑2: Ontario Health Sector Expense: Average Annual Growth Rates by Program Area, 2001-02 to 2011-12 vs. 2011-12 to 2015-16
Source: FAO analysis of data from MOHLTC, TBS and the Public Accounts of Ontario.
Note: In 2005-06, the Province’s financial reporting was expanded to include hospital assets, which impacted the growth rate of capital program expense. As a comparison, the annual growth rate of capital program expense from 2005-06 to 2011-12 averaged 12.7%, rather than the 17.7% annual average from 2001-02 to 2011-12.
The hospitals program area experienced the steepest decline in average annual growth, moving from 5.7% to 0.6%, followed by the OHIP and LTC homes program areas which moved from average annual growth rates of 7.4% and 8.5% to 1.9% and 2.3%, respectively.
The FAO also estimated the relative contribution of each program area to the slowdown in health sector expense, from 6.8% to 2.4% average annual growth, using a weighted average of each program area over the time period. Hospitals and OHIP accounted for approximately three-quarters of the overall slowdown in the average annual health sector expense growth rate (Chart 4‑3).
Chart 4‑3: Contribution by Program Area to the Change in Average Annual Growth Rate of Ontario Health Sector Expense from 6.8% (2001-02 to 2011-12) to 2.4% (2011-12 to 2015-16)
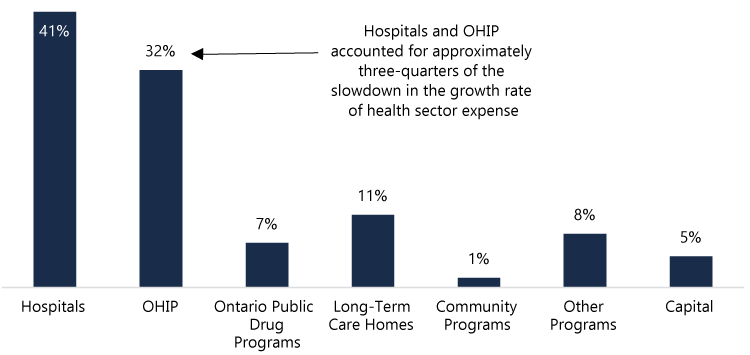
Source: FAO calculation based on data from MOHLTC, TBS and the Public Accounts of Ontario.
This analysis reveals the importance of the hospitals and OHIP programs in the Province’s achievement in constraining the growth rate of health sector expense during the 2011-12 to 2015-16 period. It also shows that the slowdown in the growth rate of health sector expense was not uniform across program areas.
Growth Rates from 2015-16 to 2018-19
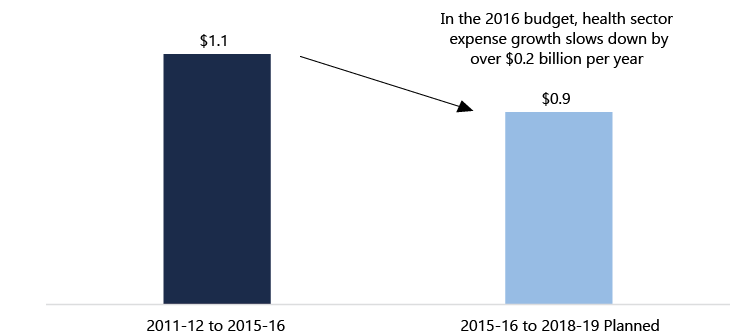
From 2011-12 to 2015-16, health sector expense averaged annual growth of 2.4%. This is a sharp decline from the 6.8% average annual growth rate from the 2001-02 to 2011-12 period. The 2016 Ontario Budget projects another significant reduction in the growth rate of health sector expense moving from 2.4% to 1.7% for the 2015-16 to 2018-19 period. This represents a reduction of almost one-third in the growth rate of health sector expense. In dollar terms, health sector expense increased by an average of $1.1 billion each year from 2011-12 to 2015-16 but is projected to increase by only $0.9 billion per year from 2015-16 to 2018-19.
Chart 4‑4: Average Annual Increase in Health Sector Expense, 2011-12 to 2015-16 vs. 2015-16 to 2018-19 ($ billions)
Source: FAO calculation based on data from MOHLTC, TBS and the 2016 Ontario Budget.
Looking at the 2016-17 fiscal year, the 2016 budget calls for health sector expense to grow by only 1.4%. If this growth rate is achieved, it will be the first year that health sector expense has grown by less than 2% since 1997-98 (see Chart 3‑2).[8]
Chart 4‑5 below shows the planned growth rates for the program areas for 2016-17 compared to the average growth rates from 2011-12 to 2015-16.
Chart 4‑5: Ontario Health Sector Expense: Average Annual Growth Rate by Program Area, 2011-12 to 2015-16 vs. Planned Growth Rate in 2016-17
Hospitals and Ontario public drug programs expense are both projected to decline in 2016-17 at rates of 0.2% and 1.4%, respectively.[9] In addition, OHIP, other programs and capital program areas all have projected growth rates in 2016-17 that are below their average growth rates from 2011-12 to 2015-16. Only LTC homes and community programs are projected to have growth rates in 2016-17 that are higher than their 2011-12 to 2015-16 averages, moving from 2.3% and 5.7% to 2.6% and 7.0%, respectively.
5. Health Sector Program Changes
This chapter reviews the program changes which allowed the Province to achieve the health sector expense growth rate from 2011-12 to 2015-16 and are part of the Province’s plan to achieve the 2016 budget’s health sector expense targets from 2016-17 to 2018-19. Through a review of the information provided by the Province and publicly available information, the FAO has identified a number of program changes that have had, or are expected to have, a material impact on health sector expense. The chapter concludes with an assessment of whether the program changes identified by the FAO are sufficient to achieve the health sector expense targets to 2018-19 or if the Province will need to introduce additional program changes to meet these targets.
Key Program Changes
The following table lists the program changes that the FAO estimates had (or will have) a material impact on the health sector expense growth rate. The approximate materiality cut-off used by the FAO was $250 million or 0.5% of the $51.8 billion health sector expense plan in 2016-17.
Table 5‑1: Program Changes with a Material Impact on Health Sector Expense
|
Program Area / Program Change |
Analysis |
|
|---|---|---|
|
Hospitals |
||
|
Base operating funding restraint[1a] |
Growth rate in base operating funding to hospitals held to 0% from 2012-13 to 2015-16. In 2016-17, base operating funding increased by 1%.[2a] |
|
|
OHIP |
||
|
2012 Physician Services Agreement[3a] |
Agreement included a 0.5% reduction on all physician payments effective April 1, 2013 and amendments to the OHIP schedule of benefits. |
|
|
2015 physician service fee changes and other program amendments[4a] |
The Province reduced physician payments by 2.65% in February 2015 and 1.3% in October 2015, and made other changes to the OHIP schedule of benefits. |
|
|
Ontario Public Drug Programs |
||
|
Prescription drugs pricing reforms[5a] |
Through Provincial efforts and the pan-Canadian Pharmaceutical Alliance (pCPA), the Province reduced the prices paid for prescription drugs (generic and brand name) for its public drug programs. |
|
|
2015 Ontario Drug Benefit (ODB) program changes[6a] |
Reforms to the ODB program included reductions in dispensing payments and fees paid to pharmacists, and changes to quantities of medication dispensed. |
|
|
2016 Low-Income Seniors Co-Payment Drug Program eligibility changes[7a] |
Low-income thresholds raised in August 2016 so more participating seniors qualified to have the deductible waived under the ODB program. |
|
|
Long-Term Care Homes |
||
|
No change to number of long-term care home beds in operation[8a] |
From March 2003 to March 2012, 9,718 LTC beds were added to the Province’s stock of beds in operation. From March 2012 to March 2016, only 537 beds were added. |
|
|
Enhanced Long-Term Care Home Renewal Strategy[9a] |
Announced in 2014, the strategy is a $6 billion program to redevelop approximately 31,000 LTC home beds. |
|
|
Community Programs |
||
|
Program area funding commitment[10a] |
The Province committed to increase funding to community programs by 4% in 2012-13 and 5% per year from 2013-14 to 2017-18. |
|
|
Other Programs |
||
|
No material program changes identified |
||
|
Capital |
||
|
Hospital expansion and redevelopment projects[11a] |
Planned investment of approximately $11 to $12 billion over 10 years, first announced in 2014. |
|
[1a] 2012 Ontario Budget, p. 27; 2013 Ontario Budget, p. 120; 2014 Ontario Budget, p. 158; 2016 Ontario Budget, p. 116 and the Public Accounts of Ontario.
[2a] The 2016 Ontario Economic Outlook and Fiscal Review, released November 14, 2016, announced new funding for hospitals in 2016-17 of $140.3 million, in addition to the 1% increase in base operating funding.
[3a] 2012 Physician Services Agreement between Ontario Medical Association and Her Majesty the Queen in Right of Ontario, as represented by the Minister of Health and Long-Term Care, dated November 7, 2012.
[4a] “Physician Services: Ten-Point Plan for Saving and Improving Service,” accessed on Government of Ontario website on August 29, 2016: https://news.ontario.ca/mohltc/en/2015/01/physician-services-ten-point-plan-for-saving-and-improving-service.html; and “Ontario Doctors Launch Charter Challenge Over Fee Cuts,” accessed on the Toronto Star website on August 29, 2016: https://www.thestar.com/news/canada/2015/10/29/ontario-doctors-launch-charter-challenge-over-fee-cuts.html.
[5a] 2012 Ontario Budget, p. 30 and Canada’s Premiers’ website accessed on August 29, 2016: http://www.pmprovincesterritoires.ca/en/initiatives/358-pan-canadian-pharmaceutical-alliance.
[6a] 2015 Ontario Budget, p. 208.
[7a] “Ontario Lowers Drug Costs for over 170,000 More Low-Income Seniors,” April 4, 2016, accessed on Government of Ontario website on November 4, 2016: https://news.ontario.ca/mohltc/en/2016/04/ontario-lowers-drug-costs-for-over-170000-more-low-income-seniors.html.
[8a] Information provided by MOHLTC.
[9a] ibid.
[10a] 2012 Ontario Budget, p. 28; 2013 Ontario Budget, p. 121; 2015 Ontario Budget, p. 166; 2016 Ontario Budget, p. 118.
[11a] 2014 Ontario Budget, p. 53; 2015 Ontario Budget, p. 61; 2016 Ontario Budget, p. 80.
Hospitals
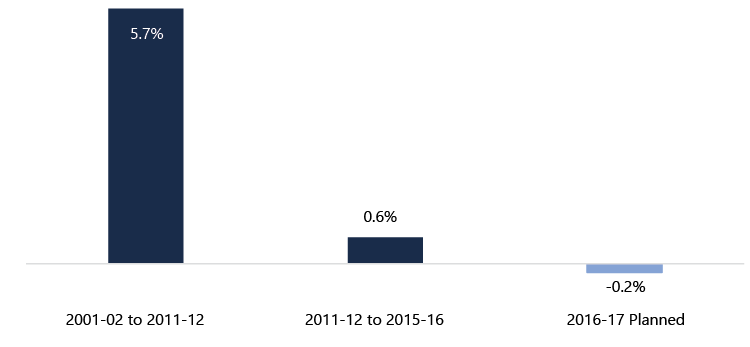
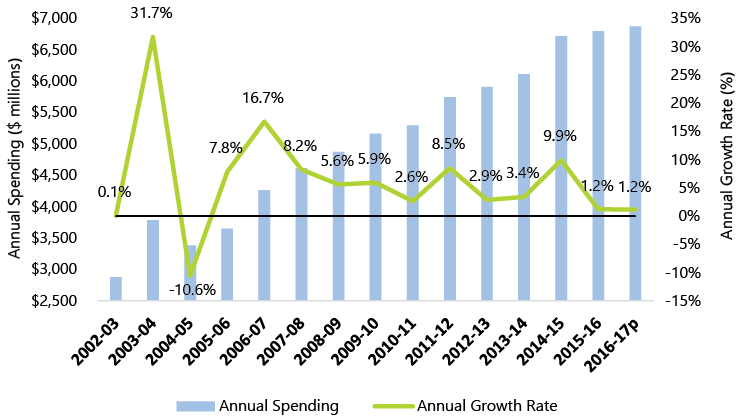
At $16.4 billion in 2016-17, the hospitals program area is the largest component of health sector expense. Restraining average annual growth in hospitals program expense to less than 1% from 2011-12 to 2015-16 was the most important factor in reducing overall health sector expense growth.[10]
Chart 5‑1: Average Annual Growth Rate: Hospitals
Source: FAO analysis of data from MOHLTC and TBS.
Note: “2016-17 Planned” is based on planned spending reported in the 2016 Ontario Budget and 2016-17 Expenditure Estimates. The 2016 Ontario Economic Outlook and Fiscal Review, released November 14, 2016, announced new funding for hospitals in 2016-17 of $140.3 million (p. 136). This funding could increase the 2016-17 growth rate for hospitals program area expense from a decline of 0.2% to an increase of 0.7%.
Hospitals program area expense reflects the financial results of the Province’s hospitals, which includes direct funding from the Province and other sources of revenue, and funding for specialty psychiatric hospitals.[11] Direct Provincial funding for hospitals is provided through a number of programs, the largest of which is base operating funding. In 2014-15, base operating funding accounted for 76% of total hospitals program area expense.
As noted in Table 5‑1, the key change in the hospitals program area was the Province’s decision to hold the growth rate in base operating funding to 0% from 2012-13 to 2015-16 and 1% in 2016-17.[12] This decision achieved significant expense savings for the Province.
The Province also introduced reforms in how base operating funding was allocated among Ontario’s hospitals in an effort to improve efficiency and service delivery.[13] Starting in 2012, the Province began a move from a global funding approach, where each hospital received a similar, lump-sum share of the base operating budget, to a model where hospitals received shares of the base operating funding according to three factors:
- a lump-sum amount, based on historic funding and not tied to outcomes, complexity of patients or services offered;
- a patient-based amount, tied to estimates of health care expenses from an analysis of regional demographic factors and complexity and type of care for each hospital; and
- a service-based amount, where funding is provided for the delivery of certain services (e.g. hip replacements and cataract surgeries) at rates set according to best practices and expected level of efficiency.
For 2012-13, 54% of base operating funding was allocated to hospitals through a lump-sum amount while 46% of the budget was allocated through a patient-based and service-based amount.[14] In 2015-16, the planned allocation of base operating funding shifted to 30% lump-sum amount and 70% patient-based and service-based amount.[15]
OHIP
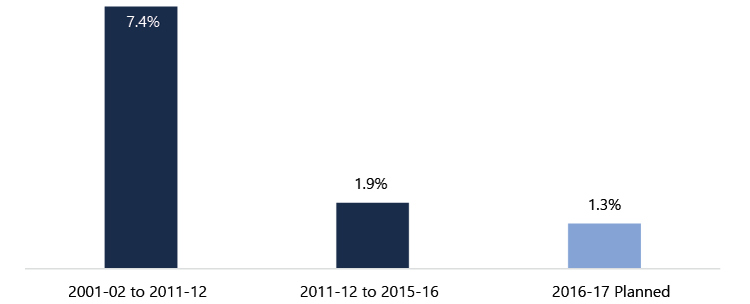
The growth rate in OHIP program area expense slowed from an annual average of 7.4% from 2001-02 to 2011-12, to 1.9% from 2011-12 to 2015-16. In 2016-17, OHIP program area expense is forecast to increase by 1.3% to $13.7 billion. Payments to physicians make up the majority of the expense in the OHIP program area. In 2014-15, OHIP program area expense was $13.4 billion, of which $11.1 billion (82.8%) was paid to physicians either through fee-for-service payments or other alternative payment methods.[16]
Chart 5‑2: Average Annual Growth Rate: OHIP
Source: FAO analysis of data from MOHLTC and TBS.
Note: “2016-17 Planned” is based on planned spending reported in the 2016 Ontario Budget and 2016-17 Expenditure Estimates.
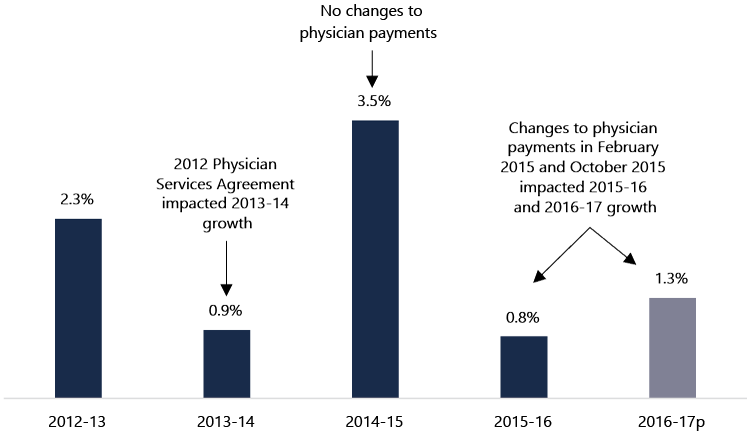
The FAO’s review identified the 2012 Physician Services Agreement, and physician service fee changes and other program amendments made in 2015 as the key program changes in the OHIP program area. The 2012 Physician Services Agreement included a 0.5% reduction in all physician payments starting on April 1, 2013 as well as other changes to the OHIP schedule of benefits. In 2015, after the 2012 Physician Services Agreement expired, and without a new agreement, the Province made changes to physician payments and other physician compensation programs. Physician payments were reduced by 2.65% in February 2015 and by another 1.3% in October 2015. Program changes included a reduction in the fee paid to physicians for patient visits at a weekend or holiday walk-in clinic, updates on some premium payments to specialists and the elimination of funding to physicians for attending courses and events for continuing medical education.[17]
A review of the OHIP program area annual growth rate indicates that the two changes likely contributed to significant OHIP program area savings. Chart 5‑3 shows annual growth rates for the OHIP program area from 2012-13 to 2016-17. The impact of the 2012 Physician Services Agreement, including the reduction on all physician payments effective April 1, 2013, contributed to overall OHIP program area growth of less than 1% in 2013-14. After the changes took effect, a higher growth rate resumed, moving from 0.9% in 2013-14 to 3.5% in 2014-15. Then, in 2015, the Province reduced physician payments again, in February and October. These two changes impacted both the 2015-16 and 2016-17 fiscal years, resulting in OHIP program area growth rates of 0.8% and 1.3%, respectively.[18]
Chart 5‑3: OHIP Program Area Annual Growth Rates, 2012-13 to 2016-17
Source: FAO analysis of data from MOHLTC and TBS.
Note: “2016-17p” is based on planned spending reported in the 2016 Ontario Budget and 2016-17 Expenditure Estimates.
Based on this analysis, without further program changes by the Province, the FAO expects that after 2016-17 demand factors, such as population growth and aging, and utilization (an increase in the per capita demand for services), will return OHIP program area expense growth to approximately 3.5% per year.
Ontario Public Drug Programs
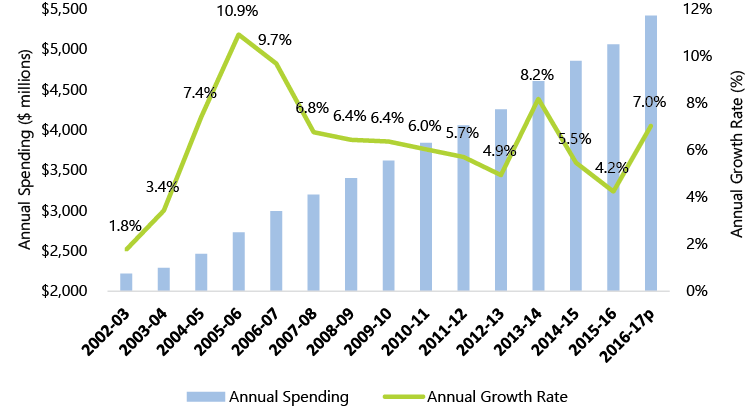
From 2011-12 to 2015-16, Ontario public drug programs expense averaged annual growth of 3.1%, a slowdown from average annual growth of 6.8% from 2001-02 to 2011-12. In 2016-17, the 2016 budget projects a decline in Ontario public drug programs expense of 1.4% to $3.9 billion.
Chart 5‑4: Average Annual Growth Rate: Ontario Public Drug Programs
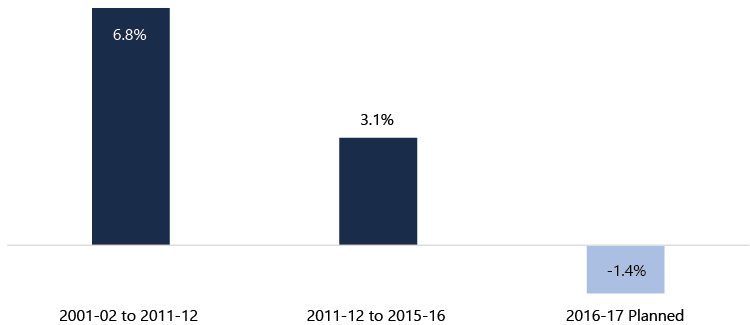
Source: FAO analysis of data from MOHLTC and TBS.
Note: “2016-17 Planned” is based on planned spending reported in the 2016 Ontario Budget and 2016-17 Expenditure Estimates.
The Province operates six programs under the Ontario public drug programs area, the most costly of which is the Ontario drug benefit (ODB) program which primarily supports Ontario seniors. The ODB program accounted for 75% of Ontario public drug programs expense in 2014-15.[19]
The FAO has identified three program changes that impacted the growth rate of Ontario public drug programs expense. The first was prescription drugs pricing reforms. The Province was able to reduce the cost of generic and brand-name prescription drugs, through its own efforts[20] and also through the pan-Canadian Pharmaceutical Alliance (pCPA).[21] As reported by the Province and the pCPA, changes to prescription drugs pricing has resulted in significant expense savings for the Province. The 2012 Ontario Budget noted annual savings of approximately $500 million and the pCPA reports estimated combined annual savings of $712 million across Canada.[22]
The second key program change was reform to the ODB program in 2015. The Province made a number of changes which it estimates will result in expense savings of over $200 million per year. The changes to the ODB program primarily impacted the payments and fees paid to pharmacies and included: a reduction in the mark-up for high-cost drugs, a dispensing fee reduction for prescriptions filled for LTC home residents, limits on the number of dispensing fees paid per year for chronic-use medications, and new limits on “no substitution” requests for brand name rather than generic brand drugs.[23]
Lastly, in 2016, the Province made changes to the income eligibility thresholds for the low-income seniors co-payment drug program, which allows low-income seniors to pay no deductible and a lower co-payment under the ODB program. The income eligibility thresholds were increased and indexed to inflation so that more seniors would qualify for the program.
These changes to the income eligibility thresholds increased ODB program expense starting in 2016-17. In the 2016 budget, the Province planned to offset the expense increase by increasing the annual ODB program deductible charged to seniors who did not qualify for the low-income exemption. However, the Province announced that it was “pausing” the planned increase to the deductible leaving a shortfall in the Ontario public drug programs expense targets of approximately $65 million in 2016-17 and $100 million in 2017-18.[24]
Going forward, Ontario public drug programs expense will be impacted by a number of factors. As noted above, the largest component of the Ontario public drug programs is the ODB program, which is primarily aimed at seniors. As the population ages, the ODB program will experience a direct impact of more individuals being enrolled, leading to higher costs, all else being equal. The pattern of drug development (the mix between brand name and generic drugs)[25] and the decision of when to add new drugs to the approximately 4,400 drug products covered by the Ontario public drug programs will also impact program expense. Finally, the efforts of the Province and the pCPA may continue to reduce the price of prescription drugs.
Long-Term Care Homes
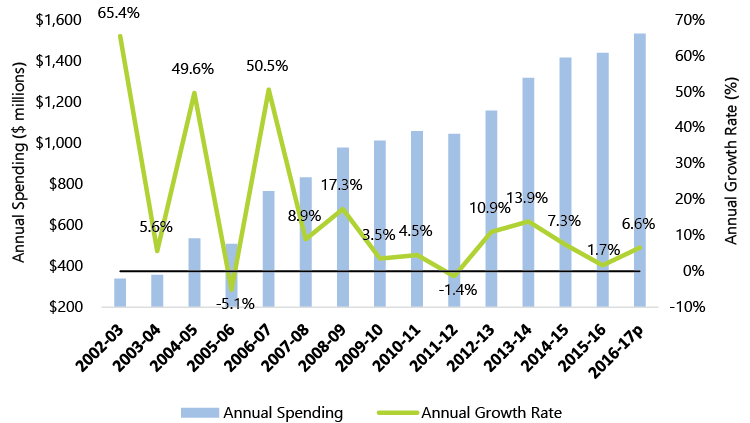
The LTC homes program expense growth rate moved from an annual average of 8.5% (2001-02 to 2011-12) to 2.3% (2011-12 to 2015-16). In 2016-17, the LTC homes program area expense is forecast to increase by 2.6% to $4.1 billion.
Chart 5‑5: Average Annual Growth Rate: Long-Term Care Homes
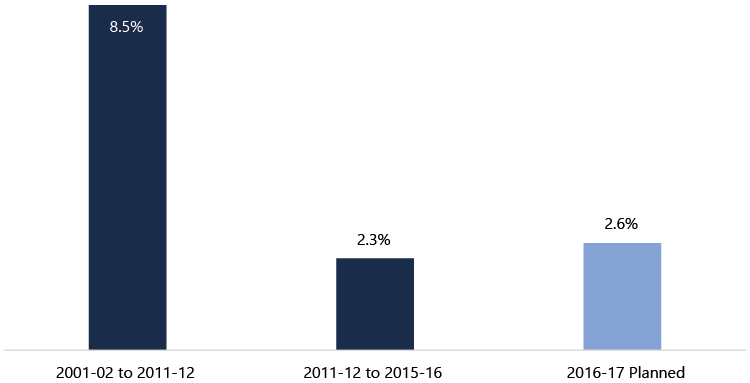
Source: FAO analysis of data from MOHLTC and TBS.
Note: “2016-17 Planned” is based on planned spending reported in the 2016 Ontario Budget and 2016-17 Expenditure Estimates.
An important change which allowed the Province to reduce the LTC homes growth rate from 8.5% to 2.3% was maintaining the level of LTC beds in operation after 2011-12 at a relatively constant level. The FAO estimates that, after accounting for inflation, approximately 25% of the increase in LTC homes program expense from 2003-04 to 2011-12 was the result of an increase in the number of LTC beds in operation.[26] After 2011-12, the number of LTC beds in operation remained relatively constant, which significantly lowered the LTC homes program expense growth rate.
Going forward, the $6 billion Enhanced Long-Term Care Home Renewal Strategy may lead to increased program expense, however, the timing is uncertain as the cost of the strategy will be spread over approximately 35 years.[27]
Community Programs
Unlike the other health sector program areas, the community programs area has maintained a relatively consistent average annual growth rate since 2001-02. Annual growth averaged 6.4% from 2001-02 to 2011-12 and 5.7% from 2011-12 to 2015-16. For 2016-17, the growth rate is projected to be 7.0%, resulting in community programs expense of $5.4 billion. The Province has committed to increase funding for community programs by 5% in 2017-18.
Chart 5‑6: Average Annual Growth Rate: Community Programs
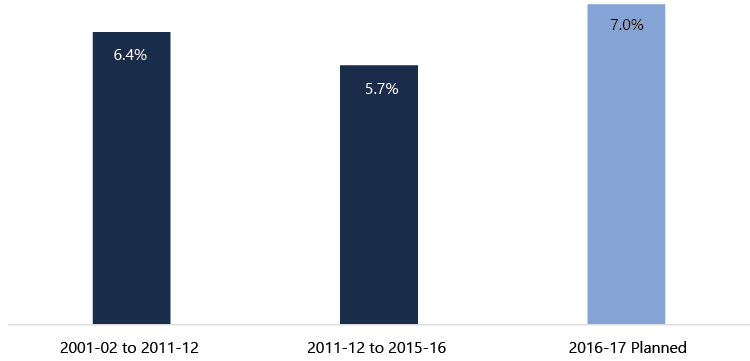
Source: FAO analysis of data from MOHLTC and TBS.
Note: “2016-17 Planned” is based on planned spending reported in the 2016 Ontario Budget and 2016-17 Expenditure Estimates.
The high growth rate for community programs from 2011-12 to 2015-16, relative to overall health sector expense growth, is the result of the Province’s strategy to move acute care from high-cost settings (hospitals and LTC homes) to “more cost-effective settings” (e.g. the home) while providing “quality and appropriate care.”[28] This strategy has led to increased demand for home care services which has been supported by increased funding from the Province. For example, in 2016-17, the Province reports that increased funding for community programs will result in 350,000 additional hours of nursing care, 1.3 million additional hours of personal support, 600,000 additional hours of respite services for caregivers and 100,000 additional hours of rehabilitation.[29]
The Province is also moving to reform how home and community care services are organized and delivered.[30] For example, the Province is proposing to transfer responsibility for service management and delivery of home and community care from Community Care Access Centres (CCACs) to the Province’s Local Health Integration Networks (LHINs) with the goal to better integrate home and community care with other parts of the health care system.[31]
Overall, reform to the community programs area is an important part of the Province’s health sector expense strategy. Future work will be required to determine if expanding home and community care has resulted in efficiencies in health sector service delivery (i.e. moving acute care services from high-cost hospital settings to lower-cost home care settings) while maintaining quality and access to care.
Other Programs
Other programs expense, at $6.9 billion in 2016-17, includes over 40 programs and funding categories.[32] Average annual growth in other programs expense slowed from 7.2% (2001-02 to 2011-12) to 4.3% (2011-12 to 2015-16). In 2016-17, the Province projects other programs expense to increase by 1.2%.
Chart 5‑7: Average Annual Growth Rate: Other Programs
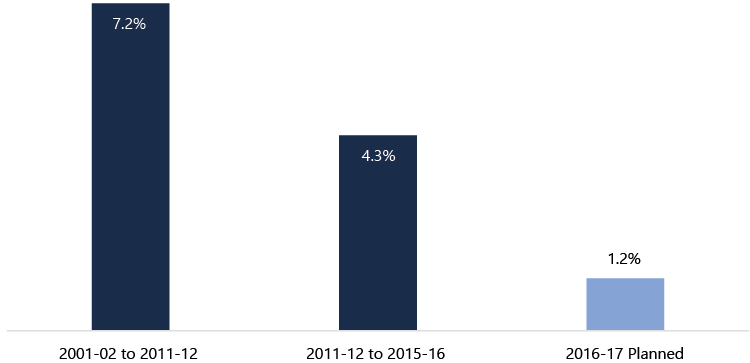
Source: FAO analysis of data from MOHLTC and TBS.
Note: “2016-17 Planned” is based on planned spending reported in the 2016 Ontario Budget and 2016-17 Expenditure Estimates.
The FAO’s review did not identify significant program changes that would account for the observed growth rates over the time period.
Capital
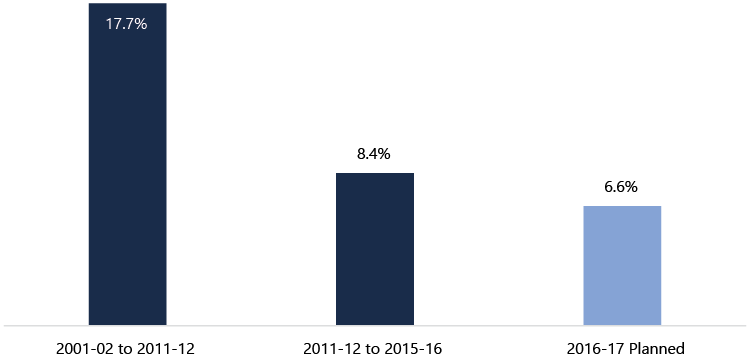
At $1.5 billion in 2016-17, the capital program area is the smallest component of health sector expense, but had the highest average annual growth rates up to 2015-16. From 2001-02 to 2011-12, capital program area annual growth averaged 17.7%, while the next highest program area was long-term care homes at 8.5%. From 2011-12 to 2015-16, capital program area annual growth averaged 8.4% (the next highest was community programs at 5.7%). For 2016-17, capital program area expense is forecast to increase by 6.6%.
Chart 5‑8: Average Annual Growth Rate: Capital
Source: FAO analysis of data from MOHLTC and TBS.
Notes: “2016-17 Planned” is based on planned spending reported in the 2016 Ontario Budget and 2016-17 Expenditure Estimates. In 2005-06, the Province’s financial reporting was expanded to include hospital assets, which impacted the growth rate of capital program expense. As a comparison, the annual growth rate of capital program expense from 2005-06 to 2011-12 averaged 12.7%, rather than the 17.7% annual average from 2001-02 to 2011-12.
After 2016-17, the FAO expects that the high rate of growth for the capital program area will continue as a result of the Province’s commitment to invest approximately $11 to $12 billion over 10 years in hospital expansion and redevelopment projects.
Will the Province meet the 2016 Budget Health Sector Expense Targets?
The previous section reviewed the key health sector program changes identified by the FAO that had a material impact on the health sector expense growth rate from 2011-12 to 2015-16 and will impact the health sector expense outlook from 2016-17 to 2018-19.
In this section, the FAO develops a health sector expense forecast (a “status quo forecast”) for 2016-17 to 2018-19 that reflects the program changes identified by the FAO. The difference between the FAO’s status quo forecast and the Province’s 2016 budget targets will indicate whether additional program changes are required for the Province to meet the health sector expense targets in the 2016 budget.
Table 5‑2 lists the assumptions and growth rates underlying the FAO’s status quo forecast for each health sector program area from 2016-17 to 2018-19. Generally, the FAO’s status quo forecast assumes that the key program changes implemented by the Province to date (as reviewed in the previous section) continue through to 2018-19.
Table 5‑2: Assumptions Underlying the FAO’s Status Quo Forecast for Health Sector Expense to 2018-19
|
Program Area / FAO’s Assumptions |
Growth Rate Estimates, 2016-17 to 2018-19 |
|
|---|---|---|
|
Hospitals |
||
|
2016-17: 1.6% |
|
|
OHIP |
||
|
2016-17: 1.3% |
|
|
Ontario Public Drug Programs |
||
|
2016-17: 0.3% |
|
|
Long-Term Care Homes |
||
|
2016-17: 2.6% |
|
|
Community Programs |
||
|
2016-17: 7.0% |
|
|
Other Programs |
||
|
2016-17: 1.2% |
|
|
Capital |
||
|
2016-17: 6.6% |
|
*CIHI estimates that Canada-wide, the impact on physician expenditures from 2003 to 2008 from demand factors (population aging, population growth and increased utilization per capita) was 3.74% per year. See “Health Care Cost Drivers: Physician Expenditure – Technical Report,” Canadian Institute for Health Information, 2012, p. 14.
Sources: FAO analysis of key program changes and growth rates identified in chapters 4 and 5.
The assumptions and growth rates in Table 5‑2 result in a FAO status quo forecast for health sector expense that reflects the program changes implemented by the Province to date and maintained through to 2018-19.
Chart 5‑9 compares the FAO’s status quo forecast against the Province’s 2016 budget health sector expense targets and shows there is a gap of approximately $0.4 billion in 2016-17, $0.9 billion in 2017-18 and $1.5 billion in 2018-19. The estimate of the expense gap means that the program changes implemented by the Province to date are unlikely to be sufficient for the Province to meet the 2016 budget health sector expense targets from 2016-17 to 2018-19. If the Province is to meet its 2016 budget health sector expense targets, then additional program changes, beyond those identified by the FAO, will be required.[33]
Chart 5‑9: Estimate of Health Sector Expense Gap between 2016 Ontario Budget Targets and the FAO’s Status Quo Forecast
Source: “FAO’s Status Quo Forecast”: see Table 5‑2. “2016 Ontario Budget Targets”: see 2016 Ontario Budget, p. 275.
6. Sustainability after 2018-19
If the 2016 Ontario Budget’s health sector expense targets are achieved, health sector expense will average 2.1% annual growth from 2011-12 to 2018-19. This chapter asks whether 2.1% is a sustainable growth rate after 2018-19. For the purposes of this chapter, “sustainable” means the health sector expense growth rate necessary to maintain the current level of health care quality and type of services provided. To support this analysis, the FAO undertook a review of long-term health sector expense growth rate trends and cost drivers.
Nominal and Real Per Capita Growth Rate Trends
A review of Ontario health sector expense growth rates from 1980-81 shows periods of high and low growth (Chart 6‑1). From 1980-81 to 1991-92 and 1997-98 to 2011-12, health sector expense grew by average annual rates of 12.4% and 6.6%, respectively. From 1991-92 to 1997-98 health sector expense grew by an average annual rate of 1.3%. For 2011-12 to 2018-19, which includes three years of projected health sector expense from the 2016 Ontario Budget, the Province expects health sector expense to grow by an average annual rate of 2.1%.
Chart 6‑1: Ontario Health Sector Expense Growth Rates from 1980-81 to 2018-19
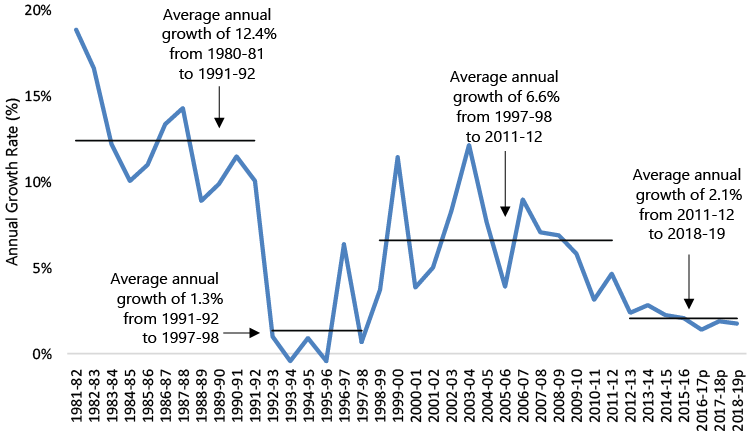
Source: FAO analysis of data from MOHLTC, TBS, the 2016 Ontario Budget and Kneebone, Ronald and Margarita Wilkins, “Canadian Provincial Government Budget Data, 1980/81 to 2013/14,” Canadian Public Policy, volume 42, Issue 1, March 2016. Note: “2016-17p”, “2017-18p” and “2018-19p” are the health sector expense targets in the 2016 Ontario Budget.
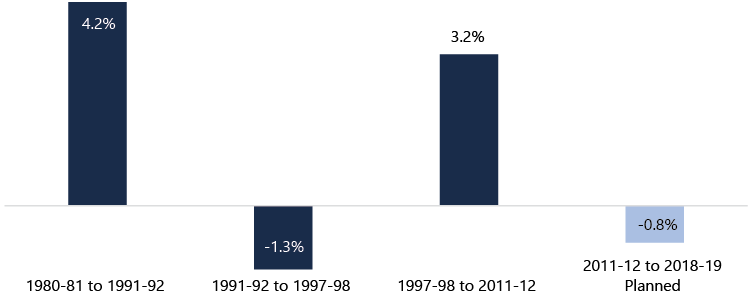
Chart 6‑1 shows the health sector expense growth rate in nominal dollars. Chart 6‑2 removes the impact of population growth and inflation from the calculation of health sector expense growth to show how expense has grown on a per person basis in real terms (in dollars of comparable purchasing power across years). This chart confirms that health sector expense in Ontario has gone through periods of growth and then restraint. In real per capita dollars, health sector expense in Ontario grew by an average annual rate of 4.2% from 1980-81 to 1991-92 and 3.2% from 1997-98 to 2011-12, but declined by an average annual rate of 1.3% from 1991-92 to 1997-98 and 0.8% from 2011-12 to 2018-19.[34]
If the 2016 budget health sector expense targets are achieved, by 2018-19 health sector expense, in real per capita terms, will have declined, on average, for seven consecutive years. This raises questions about whether the 2016 budget growth rate targets are sustainable beyond 2018-19 and, if not, what the growth rate after 2018-19 will be. For example, the decline in real per capita health sector expense from 1991-92 to 1997-98 was followed by high growth from 1997-98 to 2011-12.
Chart 6‑2: Average Annual Real Per Capita Ontario Health Sector Expense Growth Rates from 1980-81 to 2018-19
Source: FAO analysis of data from MOHLTC, TBS, the 2016 Ontario Budget, Kneebone, Ronald and Margarita Wilkins, “Canadian Provincial Government Budget Data, 1980/81 to 2013/14,” Canadian Public Policy, volume 42, Issue 1, March 2016, Statistics Canada and Ontario Ministry of Finance.
Note: 2011-12 to 2018-19 Planned” includes the health sector expense targets in the 2016 Ontario Budget.
What are the Health Sector Expense Cost Drivers?
Analyzing health sector expense cost drivers is another way to estimate expected growth rates over the long-term. In general, researchers have been able to measure the contribution to health sector expense of population growth, population aging, income growth and inflation, with a remaining residual amount referred to as the enrichment factor. The following discussion summarizes the literature and estimates the various health sector expense cost drivers for Ontario.[35]
Demographics: Population Growth and Population Aging
Demographics impact health sector expense in two ways. First, as the population grows, there are more Ontarians who require health services. Second, health care spending for older Ontarians is higher than younger age groups (excluding infants),[36] especially during an individual’s last two years of life.[37] As a result, as a general rule, the older the population, the greater the demand for health care, which results in higher health care expense.
Table 6‑1: Health Sector Expense Cost Driver: Demographics
|
Contribution of Demographics to Health Sector Expense (Average Annual Growth Rate) |
||
|---|---|---|
|
FAO Estimate for Ontario to 2020 |
|
|
|
Population Growth |
1.2% |
|
|
Population Aging |
1.1% |
|
|
Canadian Health Services Research Foundation’s (CHSRF) Estimate for Canada to 2030 |
||
|
Population Growth |
0.4% to 1.3% |
|
|
Population Aging |
1.0% to 1.3% |
|
Source: FAO calculations based on data from Statistics Canada, CIHI’s National Health Expenditure Database and the Ontario Ministry of Finance. CHSRF’s estimate from “Research Synthesis on Cost Drivers in the Health Sector and Proposed Policy Options,” Canadian Health Services Research Foundation, 2011, pp. 8-9.
Income Growth
There is a positive relationship between income growth and per capita spending on health care. In other words, as incomes rise, individuals are willing to spend more on health care. The FAO assumes that a 1% increase in real per capita income will lead to a 0.8% increase in real per capita health sector expense, which is the same relationship used by the Organisation for Economic Co-operation and Development (OECD).[38]
Table 6‑2: Health Sector Expense Cost Driver: Income Growth
|
Contribution of Income Growth to Health Sector Expense (Average Annual Growth Rate) |
|
|---|---|
|
FAO Estimate for Ontario to 2020 |
|
|
Income Growth |
0.9% |
Source: FAO forecast for real per capita GDP growth in the FAO’s “Economic and Fiscal Outlook,” Fall 2016. Calculation assumes average real per capita GDP growth of 1.2% resulting in a health sector expense income growth cost driver of 0.9%.
Inflation
Inflation, an increase in the price of goods and services not related to changes in the quality of those goods and services, impacts annual health sector expense. For this report, the FAO used its Consumer Price Index (CPI) forecast for Ontario as its measure of the inflation cost driver for health sector expense.
Table 6‑3: Health Sector Expense Cost Driver: Inflation
|
Contribution of Inflation (CPI) to Health Sector Expense (Average Annual Growth Rate) |
|
|---|---|
|
FAO Estimate for Ontario to 2020 |
|
|
Inflation |
2.1% |
Source: FAO calculation based on CPI forecast in the FAO’s “Economic and Fiscal Outlook,” Fall 2016.
There will also be health sector specific inflation that differs from the inflation rate as measured by CPI (e.g. health sector wage inflation). This health sector specific inflation is accounted for in the enrichment cost driver in the next subsection.
Enrichment
Enrichment (or the residual) is the general term used to describe the remaining component of health care expense growth after taking into account growth related to demographics, income and inflation. Enrichment reflects changes in medical technology (innovation), patterns of disease (e.g. managing chronic diseases over a long period of time), overall population health (e.g. smoking rates), patient preferences (e.g. home care, private rooms), and productivity changes. Enrichment also captures program changes, such as expense reductions or investments that can impact the growth rate of health care expense (see chapter 5).
Overall, enrichment can have a positive or negative impact on health sector expense growth rates. If the actual growth rate in health sector expense is higher than predicted from demographics, income growth and inflation, then enrichment is positive; if lower, then enrichment is negative.[39]
Ontario Health Sector Expense Cost Driver Summary
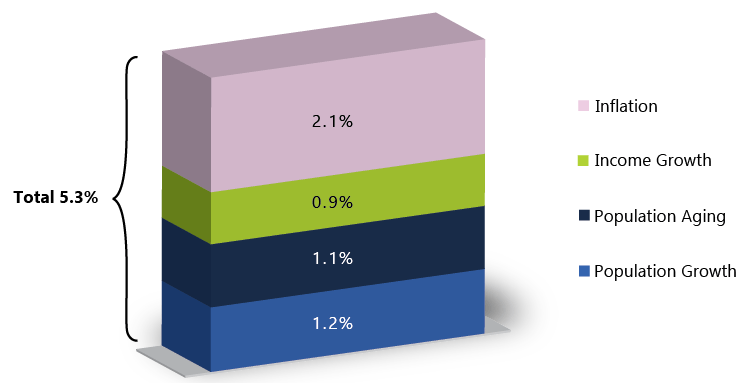
Cost driver estimates are not a precise forecast, but rather an indication of factors that will influence health sector expense growth rates. The FAO estimates that demographic changes, income growth and inflation will lead to health sector expense pressures of approximately 5.3% annually over the next five years (Chart 6‑3).[40] This analysis raises further questions about whether a health sector expense growth rate around 2% is sustainable beyond 2018-19.
Chart 6‑3: FAO Estimate of Health Sector Expense Cost Drivers to 2020
Summary: Health Sector Expense after 2018-19
The FAO’s review of health sector expense growth rate trends and cost drivers raises questions about the expected health sector expense growth rate after 2018-19. Evaluating the impact of the Province’s program changes on health sector quality and performance is an important area of future work and will be a key factor in determining the sustainable health sector expense growth rate after 2018-19. Health Quality Ontario, the Provincial agency tasked with advising the Province on the quality of health care, notes that during the current period of health sector expense restraint, “a critical challenge is to ensure that quality of care is not compromised and continues to improve.”[41] Health Quality Ontario’s latest report measuring health outcomes only reports on data up to 2014-15 which reflects just the first three years of the Province’s planned seven years of health sector expense restraint.[42]
More time will be required to measure and evaluate the impact of the program changes implemented by the Province in order to meet the health sector expense targets to 2018-19. Ultimately, the growth rate of health sector expense after 2018-19 will depend on whether the Province’s health sector program changes have resulted in efficiencies and quality improvements or simply delayed expenses that will need to be incurred to maintain quality and service levels.
7. Conclusions and Questions
Conclusions
The purpose of this report was to analyze how the Province plans to achieve the health sector expense targets presented in the 2016 Ontario Budget, and to determine whether the growth rate required to achieve these targets is sustainable after 2018-19.
The Province was able to reduce the annual growth rate in health sector expense, starting in 2012-13, primarily by slowing the growth rate of the hospitals and OHIP program areas. The FAO’s analysis of health sector program changes indicated that a freeze to base operating funding for hospitals and reductions to physician payments in 2013 and 2015 achieved significant expense savings.
The FAO developed a health sector expense forecast (a “status quo forecast”) for 2016-17 to 2018-19 that reflects the health sector program changes implemented by the Province to date and maintained through to 2018-19 to determine if the Province is on track to meet its 2016 budget health sector expense targets. The FAO estimates that additional program changes totaling expense savings of approximately $0.4 billion in 2016-17, $0.9 billion in 2017-18 and $1.5 billion in 2018-19 are required in order to meet the Province’s 2016 budget health sector expense targets.
If the 2016 budget’s health sector expense targets are achieved, health sector expense will average 2.1% annual growth from 2011-12 to 2018-19. The FAO undertook a review of long-term health sector expense trends and health sector expense cost drivers to investigate if 2.1% annual growth is a sustainable growth rate that will allow the Province to maintain current health care quality and level of service. Analysis shows that since 2011-12, health sector expense on a real per capita basis has declined. Going forward, the FAO estimates that demographic changes, income growth and inflation will lead to health sector expense growth rate pressures of approximately 5.3% per year. This raises questions about whether the 2016 budget’s health sector expense growth rate is sustainable beyond 2018-19.
Ultimately, the sustainable health sector expense growth rate after 2018-19 will depend on the impact of the Province’s program changes on health sector quality and performance. More work will be required to determine whether the health sector program changes implemented by the Province have resulted in efficiency and quality improvements or simply delayed expenses that will need to be incurred to maintain health sector quality and service levels.
Questions for the Province
On the basis of the analysis presented in this report, Members of Provincial Parliament may wish to ask the Province the following questions to gain a better understanding of how the Province plans to achieve the health sector expense targets in the 2016 Ontario Budget and the expected health sector expense growth rate after 2018-19.
Table 7‑1: Questions
|
Issue and Importance |
Questions |
|---|---|
|
Health Sector Expense Targets to 2018-19: The FAO has identified a number of health sector program changes which slowed the growth rate in health sector expense starting in 2012-13. However, based on information available to the FAO, in order to meet the health sector expense targets in the 2016 budget, the FAO estimates that the Province will need to implement additional program changes resulting in health sector expense savings of $0.4 billion in 2016-17, $0.9 billion in 2017-18 and $1.5 billion in 2018-19. |
What additional program changes will be implemented to meet the 2016 budget health sector expense targets in 2016-17, 2017-18 and 2018-19? |
|
Sustainability after 2018-19: If the health sector expense targets in the 2016 budget are achieved, the annual growth rate in health sector expense will average 2.1% from 2011-12 to 2018-19. The FAO’s review of health sector expense growth rate trends and cost drivers raises questions about whether 2.1% annual growth is a sustainable health sector expense growth rate necessary to maintain health care quality and service levels. |
What is the expected impact of the health sector program changes implemented by the Province on health care system quality, efficiency and service level? What is the Province’s estimate of the sustainable annual health sector expense growth rate beyond 2018-19, in order to maintain the current level of health care quality and type of services provided? |
8. Appendices
Appendix A provides background information on each of the health sector program areas, including annual expense and growth rates from 2002-03 to 2016-17.
Appendix B provides background information concerning the development of this report.
Appendix A: Program Area Funding and Composition
Hospitals
The hospitals program area includes funding from the Province to support the operation of the Province’s hospitals, funding for specialty psychiatric hospital services, and a consolidation adjustment to account for hospitals’ net operating expense.
The hospitals program area does not include funding provided to physicians for the hospital component of their practice. This funding is included in the OHIP program. As well, the hospitals program area does not include capital funding for hospitals, which is included in the capital program.
The Province is the major source of revenue for hospitals, typically accounting for approximately 85% to 100% of operating revenue.[43] Other sources of revenue for hospitals include revenue-generating activities (e.g. cafeteria and parking income), grants, donations, and charitable giving, the net impact of which is reflected in the hospitals program area through a consolidation adjustment to account for hospitals’ net operating expense (as noted above).
Chart 8‑1: Hospitals Expense ($ millions) and Annual Growth Rate, 2002-03 to 2016-17
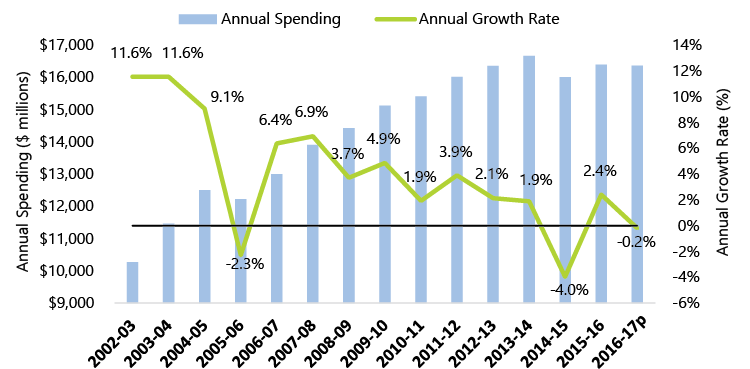
Source: FAO analysis of data from MOHLTC and TBS.
Note: “2016-17p” is based on planned spending reported in the 2016 Ontario Budget and 2016-17 Expenditure Estimates.
In 2014-15, $16.0 billion in hospitals program area expense was allocated as follows:
Table 8‑1: Hospitals: Funding by Program in 2014-15
|
Program |
Funding ($ millions) |
|---|---|
|
Base operating funding |
$12,216.0 |
|
Post-Construction Operating Plan |
$1,818.6 |
|
Priority Services and Critical Care |
$2,029.9 |
|
Wait Times Strategy |
$237.7 |
|
Hospitals Working Funds Deficit Initiative |
$75.2 |
|
Specialty Psychiatric Hospitals |
$620.1 |
|
Hospitals Prior Year Recovery |
($197.3) |
|
Hospital sector consolidation adjustment |
($788.0) |
|
Total Hospitals Program |
$16,012.1 |
Source: MOHLTC and TBS.
Description of programs:
- Base operating funding: funding to support general hospital operations. Funding is divided into three main components.
- A lump-sum amount (the global budget), based on historic funding and not tied to outcomes, complexity of patients or services offered.
- A patient-based amount (the Health Based Allocation Model), tied to estimates of health care expenses from an analysis of regional demographic factors and complexity and type of care for each hospital.
- A service-based amount (Quality-Based Procedures), where funding is provided for the delivery of certain services (e.g. hip replacements and cataract surgeries) at rates set according to best practices and expected level of efficiency.
- Post-Construction Operating Plan: funding provided to support the operation of newly completed eligible hospital capital projects.
- Priority Services and Critical Care: funding for services such as cardiac, neurological and organ transplant procedures.
- Wait Times Strategy: funding to reduce surgical, diagnostic and emergency room wait times, including five key areas: cancer, cardiac, cataract, hip and knee, and MRI/CT scans.
- Hospitals Working Funds Deficit Initiative: funding to support hospitals with working funds deficits and the overall hospital sector’s total working funds deficit.
- Specialty Psychiatric Hospitals: a provincial program that provides a variety of mental health services, including acute in-patient care, longer-term rehabilitation, specialized treatment programs, research and community-focused support services.
OHIP
OHIP provides funding for more than 6,000 insured services to eligible Ontario residents from various providers including physicians, hospitals, community laboratories, independent health facilities and other clinics. Eligible services are prescribed by regulation through the Health Insurance Act, and include: physician services, hospital services, laboratory services, eye care services and dental services that require hospitalization.
Chart 8‑2: OHIP Expense ($ millions) and Annual Growth Rate, 2002-03 to 2016-17
Source: FAO analysis of data from MOHLTC and TBS.
Note: “2016-17p” is based on planned spending reported in the 2016 Ontario Budget and 2016-17 Expenditure Estimates.
Note: all funding for OHIP services is included in the OHIP program area expense budget except for prescribed hospital services which the Province funds through hospital base operating funding and is included in the hospitals program area, not the OHIP program area.
In 2014-15, $13.4 billion in OHIP program expense was divided as follows:[44]
- $7.8 billion (58.4%) for fee-for-service physician billing, including:
- claims-based funding to physicians and diagnostic facilities;
- medical protection liability reimbursement program; and
- mental health psychiatric stipend and hospital pediatric stabilization program.
- $3.3 billion (24.4%) for non-fee-for-service physician billing, including:
- alternate payment programs;
- academic health sciences centres;
- divested Provincial psychiatric hospitals;
- physician benefit program;
- laboratory physicians;
- primary care blended models, specialized models; and
- health care connect and aboriginal health.
- $2.3 billion (17.2%) for other OHIP care and services, including:
- nurse practitioner and Family Health Teams;
- other practitioners: physiotherapy, optometry, dentistry and podiatry;
- community laboratories; and
- out-of-province / out-of-country programs.
Ontario Public Drug Programs
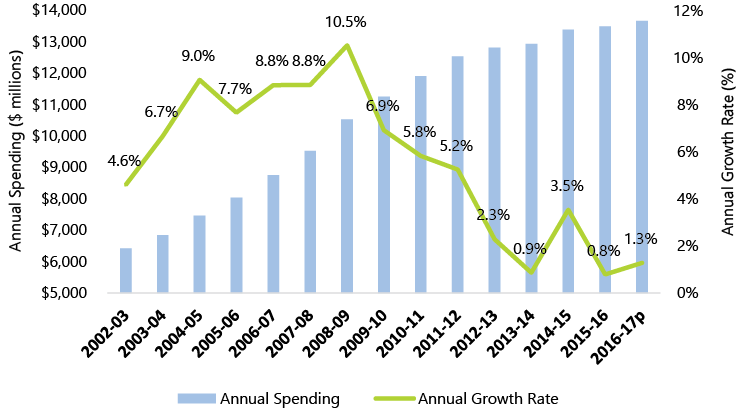
Chart 8‑3: Ontario Public Drug Programs Expense ($ millions) and Annual Growth Rate, 2002-03 to 2016-17
Source: FAO analysis of data from MOHLTC and TBS.
Note: “2016-17p” is based on planned spending reported in the 2016 Ontario Budget and 2016-17 Expenditure Estimates.
The Ontario public drug programs program area provides funding for the cost of over 4,400 drug products through the following programs:
- Ontario Drug Benefit (ODB) Program: available primarily to Ontarians 65 years of age and older with a valid Ontario health card.
- Special Drugs Program: provides funding for the full cost of certain out-patient drugs used long-term for the treatment of specific diseases or conditions. The drugs must be obtained on an out-patient basis from an authorized hospital as legislated through the Health Insurance Act.
- Trillium Drug Program: a sub-program of the ODB program, provides drug benefits to households that have high drug costs in relation to their income. The benefits are provided once enrolled applicants have paid prescription drug costs equal to the program deductible amount. The deductible is based on household net income and the number of household members. Households who have met their deductible pay up to $2 per eligible prescription.
- New Drug Funding Program: provides funding for new and approved injectable cancer drugs administered in hospitals. Cancer treatments taken orally are funded through the ODB Program for eligible recipients.
- Inherited Metabolic Diseases: provides funding for the full cost of certain out-patient drugs, supplements and specialty foods used in the treatment of specific inherited metabolic disorders.
- Visudyne Program: is legislated through the Health Insurance Act and covers the cost of Visudyne (verteporfin) for patients who meet specific criteria related to vision loss.
- Respiratory Syncytial Virus Prophylaxis Program: funds treatment for certain high-risk infants who satisfy the clinical and funding criteria for the drug Synagis.
In 2014-15, Ontario public drug programs expense was $3.8 billion as follows:
Table 8‑2: Ontario Public Drug Programs: Funding by Program in 2014-15
|
Program |
Funding ($ millions) |
% of Total |
|---|---|---|
|
Ontario Drug Benefit Program |
$2,834.8 |
74.9% |
|
Special Drugs Program |
$142.4 |
3.8% |
|
Trillium Drug Program |
$420.3 |
11.1% |
|
New Drug Funding Program |
$329.3 |
8.7% |
|
Inherited Metabolic Diseases |
$32.4 |
0.9% |
|
Visudyne Program |
$0.2 |
0.0% |
|
Respiratory Syncytial Virus Prophylaxis Program |
$22.8 |
0.6% |
|
Total Ontario Public Drug Programs |
$3,782.3 |
100.0% |
Source: MOHLTC and TBS.
Long-Term Care Homes
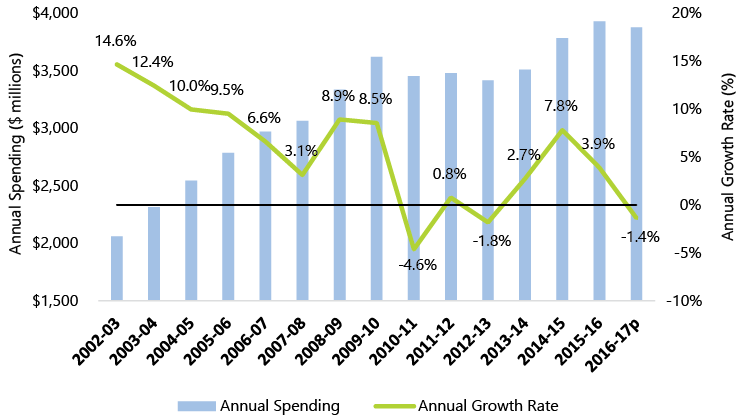
The LTC homes program area provides funding to support close to 78,000 residents in 627 LTC homes in Ontario.[45] Funding is provided through two channels, a per diem subsidy paid to LTC home operators and supplementary funding streams. In 2014-15, total LTC home program area expense of $3.9 billion was comprised of $3.2 billion for the per diem subsidy and $0.7 billion for the supplementary funding streams.[46]
Chart 8‑4: Long-Term Care Homes Expense ($ millions) and Annual Growth Rate, 2002-03 to 2016-17
Source: FAO analysis of data from MOHLTC and TBS.
Note: “2016-17p” is based on planned spending reported in the 2016 Ontario Budget and 2016-17 Expenditure Estimates.
Per Diem Subsidy
The per diem subsidy (known as the Level-of-Care (LOC) per diem) is the base amount paid by the Province to LTC home operators per resident per day. As of July 1, 2016, the LOC per diem was $166.63.[47] The Province adjusts the LOC per diem paid to LTC home operators to reflect resident acuity and overall occupancy levels at each LTC home (LTC home operators are expected to maintain occupancy levels of at least 97% in order to avoid a reduction in the LOC per diem).
Residents of LTC homes are required to make a co-payment to offset some of the Province’s cost for the LOC per diem. As of July 1, 2016, the resident co-payment was $58.99 per day,[48] resulting in a net LOC per diem cost to the Province of $107.64.
Residents of LTC homes have a choice between basic or preferred accommodation (semi-private or private rooms). Residents who choose preferred accommodation are required to pay the $58.99 daily co-payment plus an additional daily charge between $8.09 and $25.28 depending on the type of preferred accommodation and when the resident began to occupy his or her bed.[49] The additional daily charge is paid to the LTC home operator and does not offset net LOC per diem Provincial funding.
Finally, the Province offers a rate reduction program for low-income residents in basic accommodation who are unable to afford the co-payment rate. Approximately 33,000 residents receive a reduction to the $58.99 per day co-payment.[50]
Supplementary Funding Streams
In addition to the LOC per diem, the Province makes payments through supplementary funding programs. Examples of supplementary programs include:
- the Province’s plan to redevelop approximately 31,000 LTC home beds to meet current design standards (the Enhanced Long-Term Care Home Renewal Strategy) through the payment of a daily per bed subsidy to LTC home operators of up to $23.03 for 25 years once redevelopment construction is completed[51]; and
- a subsidy paid to for-profit LTC home operators to compensate these operators for the cost of municipal property taxes.
Community Programs
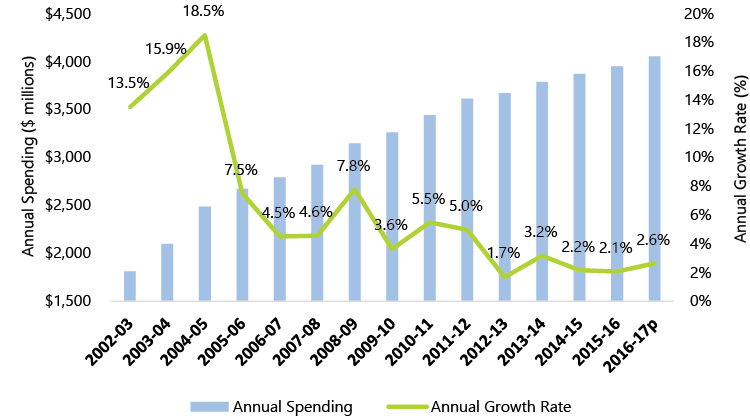
Chart 8‑5: Community Programs Expense ($ millions) and Annual Growth Rate, 2002-03 to 2016-17
Source: FAO analysis of data from MOHLTC and TBS.
Note: “2016-17p” is based on planned spending reported in the 2016 Ontario Budget and 2016-17 Expenditure Estimates.
The community programs program area provides community and home-based supports through the following programs:
- Community Care Access Centres. The Province’s 14 CCACs co-ordinate and provide a wide range of home care services, including nursing, case management, personal support, physiotherapy, occupational therapy, social work, nutritional counselling and medical supplies.[52]
- Community support services. Over 800 agencies provide 19 different services, including meal services (e.g. meals-on-wheels and community dining programs), transportation services, caregiver support services (e.g. counseling and group support programs), visiting services (e.g. trained volunteers visit clients in their homes), palliative care education and consultation services, services for persons with blindness or visual impairment, and services for persons with deafness, congenital hearing loss or acquired hearing loss.
- Assisted living services in supportive housing. Provides on-site personal support or attendant services to frail elderly, persons with physical disabilities, persons with acquired brain injuries, or persons living with HIV/AIDS who do not need 24-hour nursing care and can reside at home with support, but whose care requirements cannot be met solely on a scheduled visitation basis. This program provides a combination of personal support and essential homemaking services, security checks or reassurance services, and care coordination. The services are provided in permanent, preferably not-for-profit community residential settings.
- Community health centres (CHCs). Not-for-profit health service providers that offer community health services to populations that traditionally face barriers, including poverty, language, geography, culture, housing, childcare and transportation. CHCs focus on primary care, illness prevention, health promotion, community building and service integration.
- Community mental health and addictions program. Supports people (and their families) with serious mental illness, and people who have problems related to gambling and/or substance use.
- Community services for persons with acquired brain injury. Specialized community behavioral support services for adults. Services include specialized day programs, independence training, and outreach services.
In 2014-15, community programs expense of $4.9 billion was allocated as follows:
Table 8‑3: Community Programs: Funding by Program in 2014-15
|
Program |
Funding ($ millions) |
% of Total |
|---|---|---|
|
Community Care Access Centres |
$2,509.1 |
51.7% |
|
Community support services |
$546.8 |
11.3% |
|
Assisted living services in supportive housing |
$274.8 |
5.7% |
|
Community health centres |
$382.9 |
7.9% |
|
Community mental health and addictions program |
$1,065.0 |
21.9% |
|
Community services for persons with acquired brain injury |
$74.9 |
1.5% |
|
Total Community Programs |
$4,853.6 |
100.0% |
Source: MOHLTC and TBS.
Other Programs
Chart 8‑6: Other Programs Expense ($ millions) and Annual Growth Rate, 2002-03 to 2016-17
Source: FAO analysis of data from MOHLTC and TBS.
Note: “2016-17p” is based on planned spending reported in the 2016 Ontario Budget and 2016-17 Expenditure Estimates.
Other programs includes over 40 programs and funding categories. In 2014-15, other programs expense of $6.7 billion was allocated as follows:
Table 8‑4: Other Programs: Funding by Program in 2014-15
|
Program |
Funding ($ millions) |
% of Total |
|---|---|---|
|
Clinical Education |
$733.7 |
10.9% |
|
eHealth Ontario (transfer payment) |
$314.8 |
4.7% |
|
Midwifery Services |
$120.8 |
1.8% |
|
Assistive Devices and Supplies Program |
$458.7 |
6.8% |
|
Outbreaks of Diseases |
$135.9 |
2.0% |
|
Public Health Ontario |
$156.1 |
2.3% |
|
Cancer Care Ontario (transfer payment) |
$1,302.0 |
19.4% |
|
Canadian Blood Services |
$482.7 |
7.2% |
|
LHIN Operations |
$97.6 |
1.5% |
|
Municipal Ambulance |
$590.2 |
8.8% |
|
Air Ambulance (Ornge) (transfer payment) |
$162.7 |
2.4% |
|
Official Local Health Agencies (including Health Promotion) |
$668.1 |
9.9% |
|
Direct operating expenditures (ministry administration) |
$569.5 |
8.5% |
|
All other programs |
$923.6 |
13.8% |
|
Total Other Programs |
$6,716.4 |
100.0% |
Source: MOHLTC and TBS.
Capital
Chart 8‑7: Capital Expense ($ millions) and Annual Growth Rate, 2002-03 to 2016-17
Source: FAO analysis of data from MOHLTC and TBS.
Notes: “2016-17p” is based on planned spending reported in the 2016 Ontario Budget and 2016-17 Expenditure Estimates. In 2005-06, the Province’s financial reporting was expanded to include hospital assets, which impacted the growth rate of capital program expense.
Capital program area expense includes health sector capital funding for hospitals, community programs and I&IT projects. Expense for this area is reported on an accrual basis where cash grants for capital projects (e.g. major hospital projects) are recorded as capital expense over the useful life of the asset, rather than when the payment is made. Capital program area expense of $1.5 billion in 2016-17 includes the following programs:[53]
- $1,344 million for hospital capital, including major hospital projects, infrastructure renewal, equipment funding for Cancer Care Ontario and a consolidation adjustment to reflect the financial results of the hospital sector;
- $104 million for community programs, including the community health program and public health laboratories;
- $56 million for eHealth capital; and
- $27 million for other programs and adjustments, including corporate I&IT projects and the consolidation of the Ministry of Health and Long-Term Care (MOHLTC) agencies.
Appendix B: Development of this Report
Authority
The Financial Accountability Officer decided to undertake the analysis presented in this report under section 10(1)(a) of the Financial Accountability Officer Act, 2013.
Key Questions
The following key questions were used as a guide while undertaking research for this report:
- How does the Province plan to achieve the health sector medium-term expense outlook included in the 2016 Ontario Budget?
- What is the growth rate for the main health sector spending areas (e.g. hospitals, doctors, drugs, long-term care homes, etc.) from 2001-02 to 2018-19?
- What accounts for the health sector compound average growth rate of 2.4% observed from 2011-12 to 2015-16?
- What program changes were implemented?
- What plans are in place to achieve the projected health sector growth rate from 2015-16 to 2018-19?
- What additional program changes are required?
- What is the estimated impact of implemented and planned program changes on projected health sector expense from 2015-16 to 2018-19?
- How sustainable are the implemented and planned program changes?
- What is the expected health sector growth rate after 2018-19?
Methodology
This report has been prepared with the benefit of information provided by the Province, meetings with staff from MOHLTC and Treasury Board Secretariat (TBS), a review of relevant literature, as well as other publicly available information. Specific sources are referenced throughout.
This report reviews the Province’s health sector expense as reflected in the Province’s Public Accounts and the 2016 Ontario Budget. Health sector expense is determined in accordance with public sector accounting standards. The data presented in this report and the categorization of the data (e.g. by health sector program area) may not be easily comparable to other commonly referenced data sources such as the Canadian Institute for Health Information’s (CIHI’s) National Health Expenditure Database.
All dollar amounts are in Canadian, current dollars (i.e. not adjusted for inflation) unless otherwise noted.
All average growth calculations in this report are derived using the compound annual growth rate.
9. About this document
Established by the Financial Accountability Officer Act, 2013, the Financial Accountability Office (FAO) provides independent analysis on the state of the Province’s finances, trends in the provincial economy and related matters important to the Legislative Assembly of Ontario.
The FAO produces independent analysis on the initiative of the Financial Accountability Officer. Upon request from a member or committee of the Assembly, the Officer may also direct the FAO to undertake research to estimate the financial costs or financial benefits to the Province of any bill or proposal under the jurisdiction of the legislature.
This report was prepared on the initiative of the Financial Accountability Officer. In keeping with the FAO’s mandate to provide the Legislative Assembly of Ontario with independent economic and financial analysis, this report makes no recommendations.
The analysis was prepared by Jeffrey Novak under the direction of Peter Harrison, with a contribution by Luan Ngo.
An external reviewer reviewed this report. The assistance of the external reviewer implies no responsibility for the final product, which rests solely with the FAO.
[1] The 2016 Ontario Economic Outlook and Fiscal Review, released November 14, 2016, reports that the “Current Outlook” for health sector expense in 2016-17 is $51.9 billion, an increase of $0.2 billion from the 2016 budget target. If the “Current Outlook” is maintained, then health sector expense in 2016-17 would increase by 1.7%, rather than the 2016 budget target of 1.4%.
[2] Base operating funding for hospitals represents approximately three-quarters of total hospitals program area expense. See appendix A for more information.
[3] The 2016 Ontario Economic Outlook and Fiscal Review, released November 14, 2016, announced new funding for hospitals in 2016-17 of $140.3 million, in addition to the 1% increase in base operating funding.
[4] The 2016 Ontario Economic Outlook and Fiscal Review, released November 14, 2016, reports that the “Current Outlook” for health sector expense in 2016-17 is above the 2016 budget target by $0.2 billion. No information was provided for 2017-18 and 2018-19.
[5] 2016 Ontario Budget, pp. 283 and 287-288.
[6] All average growth rate calculations in this report are derived using the compound annual growth rate.
[7] 2013 Ontario Budget, p. 119.
[8] The 2016 Ontario Economic Outlook and Fiscal Review, released November 14, 2016, reports that the “Current Outlook” for health sector expense in 2016-17 is $51.9 billion, an increase of $0.2 billion from the 2016 budget target. If the “Current Outlook” is maintained, then health sector expense in 2016-17 would increase by 1.7%, rather than the 2016 budget target of 1.4%.
[9] The 2016 Ontario Economic Outlook and Fiscal Review, released November 14, 2016, announced new funding for hospitals in 2016-17 of $140.3 million (p. 136). This funding could increase the 2016-17 growth rate for hospitals program area expense from a decline of 0.2% to an increase of 0.7%.
[10] See chapter 4.
[11] See appendix A for more details.
[12] The 2016 Ontario Economic Outlook and Fiscal Review, released November 14, 2016, announced new funding for hospitals in 2016-17 of $140.3 million, in addition to the 1% increase in base operating funding.
[13] 2013 Ontario Budget, p. 112.
[14] “Patient-Based Funding Overview,” Ministry of Health and Long-Term Care, slide 13, accessed on August 30, 2016: http://www.drdh.org/Documents/4_MOHLTC_Patient_Based_Funding_Overview.pdf.
[15] As reported by MOHLTC website accessed on August 30, 2016: http://www.health.gov.on.ca/en/pro/programs/ecfa/funding/hs_funding.aspx. The FAO has not undertaken an analysis of the impact of base operating funding restraint and changes in funding allocation on the efficiency and quality of the hospitals program area as it was beyond the scope of this report.
[16] See appendix A for more information.
[17] “Physician Services: Ten-Point Plan for Saving and Improving Service,” accessed on Ontario government website on August 30, 2016: https://news.ontario.ca/mohltc/en/2015/01/physician-services-ten-point-plan-for-saving-and-improving-service.html.
[18] Note that the reduction in physician fees in October 2015 would show a partial impact in both 2015-16 and 2016-17. Full OHIP program area growth would be expected to resume in 2017-18.
[19] Excluding the Trillium Drug Program. See appendix A for more details.
[20] The Province’s changes primarily impacted generic drug pricing but also made reforms to the prescription drugs system. See the news release “Expanding Access to Affordable Drugs,” April 7, 2010, accessed on November 10, 2016: https://news.ontario.ca/mohltc/en/2010/04/expanding-access-to-affordable-drugs.html.
[21] The pCPA is a joint working group of all 13 provinces, territories and the federal government, which uses their combined purchasing power to lower the prices paid for brand name and generic drugs.
[22] 2012 Ontario Budget, p. 30. See the pCPA website, accessed on August 30, 2016: http://www.pmprovincesterritoires.ca/en/initiatives/358-pan-canadian-pharmaceutical-alliance.
[23] “Regulation Amendments in Support of Sustainability and Access for the Ontario Drug Benefit Program,” Ministry of Health and Long-Term Care, accessed on November 6, 2016: http://www.health.gov.on.ca/en/pro/programs/drugs/opdp_eo/notices/fq_exec_office_20150917_1.pdf.
[24] FAO calculation based on information provided by MOHLTC. The shortfall for 2018-19, if any, was not provided. See also “Ontario Lowers Drug Costs for Over 170,000 more Low-income Seniors,” accessed on November 6, 2016: https://news.ontario.ca/mohltc/en/2016/04/ontario-lowers-drug-costs-for-over-170000-more-low-income-seniors.html. This is the second time that the Province has announced changes to income-testing rules for the ODB program in order to reduce program costs only to decide not to implement the proposed changes. In the 2012 Ontario Budget (pp. 30-32), the Province announced that high-income seniors would pay a new income-tested deductible, effective August 2014, to offset some of the cost of the ODB program. This change was never implemented.
[25] “Drivers of Prescription Drug Spending in Canada,” Canadian Institute for Health Information, 2012, p. 14.
[26] FAO calculations based on information provided by MOHLTC. Inflation rate from Statistics Canada.
[27] See appendix A for more information on the Enhanced Long-Term Care Home Renewal Strategy.
[28] 2014 Ontario Budget, p. 157; 2015 Ontario Budget, p. 165.
[29] See Provincial news release “Ontario Investing an Additional $100 Million this Year in Home and Community Care,” July 19, 2016, accessed on September 26, 2016: https://news.ontario.ca/mohltc/en/2016/07/ontario-investing-an-additional-100-million-this-year-in-home-and-community-care.html.
[30] A number of reports have provided recommendations on how to improve service delivery and efficiency. For example, see “Bringing Care Home,” Report of the Expert Group on Home and Community Care, 2015 and “CCACs – Community Care Access Centres – Home Care Program,” 2015 Annual Report of the Office of the Auditor General of Ontario, pp. 70-115.
[31] “Patients First: A Proposal to Strengthen Patient-Centred Health Care in Ontario,” Ministry of Health and Long-Term Care, 2015, p. 18 and proposed legislation.
[32] See appendix A for more details.
[33] The 2016 Ontario Economic Outlook and Fiscal Review, released November 14, 2016, reports that the “Current Outlook” for health sector expense in 2016-17 is above the 2016 budget target by $0.2 billion. No information was provided for 2017-18 and 2018-19.
[34] The annual average from 2011-12 to 2018-19 includes the health sector expense targets in the 2016 Ontario Budget.
[35] The FAO’s cost driver estimates are based on work first presented in the FAO’s “Economic and Fiscal Outlook,” Spring 2016, pp. 39-40. The literature review of the health sector cost drivers is largely taken from “Research Synthesis on Cost Drivers in the Health Sector and Proposed Policy Options,” Canadian Health Services Research Foundation, 2011.
[36] Per capita health care spending is highest for seniors and children under the age of one. See “National Health Expenditure Trends, 1975 to 2015,” Canadian Institute for Health Information, 2015, p. 19.
[37] See “Research Synthesis on Cost Drivers in the Health Sector and Proposed Policy Options,” Canadian Health Services Research Foundation, 2011, p. 8.
[38] An income elasticity of 0.8 is used by the OECD based on its literature review. See “A Projection Method for Public Health and Long-Term Care Expenditures,” Organisation for Economic Co-operation and Development, 2013, pp. 14 and 48.
[39] See the FAO’s “Economic and Fiscal Outlook,” Spring 2016, p. 40 for estimates of the contribution of enrichment to the growth in health sector expense from 2006-07 to 2020-21.
[40] For the purpose of this report the FAO has not developed an updated forecast for enrichment, which will depend on the Province’s program decisions and other factors.
[41] “Measuring Up: A Yearly Report on how Ontario’s Health System is Performing,” Health Quality Ontario, 2015, p. 7.
[42] “Measuring Up: A Yearly Report on how Ontario’s Health System is Performing,” Health Quality Ontario, 2016. While most of the health sector performance indicators in the report are to 2014-15, some of the indicators include 2015-16 results, while some indicators only include results to 2013-14 or earlier.
[43] “Physician Leadership Resource Manual,” Ontario Hospital Association, p. 4. Accessed on August 8, 2016 at: https://www.oha.com/CurrentIssues/keyinitiatives/PhysicianandProfessionalIssues/QPSGT/Documents/Module%201%20-%201.3%20(Mar%2025%202013).pdf.
[44] Source: MOHLTC.
[45] Source: MOHLTC.
[46] ibid.
[47] “Long-Term Care Homes Financial Policy: LTCH Level-of-Care Per Diem Funding Summary,” Ministry of Health and Long-Term Care, July 2016.
[48] “Bulletin to Residents of Long-Term Care Homes,” Ministry of Health and Long-Term Care, May 2016.
[49] ibid.
[50] Source: MOHLTC.
[51] ibid.
[52] “Measuring Up: A Yearly Report on how Ontario’s Health System is Performing,” Health Quality Ontario, 2015, p. 64. Note that the Province is proposing to transfer responsibility for service management and delivery of home and community care from the CCACs to the LHINs. The LHINs would also be responsible for the LTC home placement process currently administered by the CCACs. See “Patients First: Action Plan for Health Care,” Ministry of Health and Long-Term Care, 2015, and proposed legislation.
[53] Source: MOHLTC and the 2016-17 Expenditure Estimates.
Figure A
This graphic shows the average annual growth rate in Ontario health sector expense over three time periods. Ontario health sector expense averaged 6.8% annual growth from 2001-02 to 2011-12, 2.4% annual growth from 2011-12 to 2015-16 and is projected to average 1.7% annual growth from 2015-16 to 2018-19.
Figure B
This graphic compares the average annual growth rate for Ontario health sector expense by program area from 2001-02 to 2011-12 and 2011-12 to 2015-16. The hospitals program area averaged 5.7% annual growth from 2001-02 to 2011-12 and 0.6% annual growth from 2011-12 to 2015-16. The OHIP program area averaged 7.4% annual growth from 2001-02 to 2011-12 and 1.9% annual growth from 2011-12 to 2015-16. The Ontario public drug programs area averaged 6.8% annual growth from 2001-02 to 2011-12 and 3.1% annual growth from 2011-12 to 2015-16. The long-term care homes program area averaged 8.5% annual growth from 2001-02 to 2011-12 and 2.3% annual growth from 2011-12 to 2015-16. The community programs area averaged 6.4% annual growth from 2001-02 to 2011-12 and 5.7% annual growth from 2011-12 to 2015-16. The other programs area averaged 7.2% annual growth from 2001-02 to 2011-12 and 4.3% annual growth from 2011-12 to 2015-16. The capital program area averaged 17.7% annual growth from 2001-02 to 2011-12 and 8.4% annual growth from 2011-12 to 2015-16. Overall, total health sector expense averaged 6.8% annual growth from 2001-02 to 2011-12 and 2.4% annual growth from 2011-12 to 2015-16.
Figure C
This graphic compares the average annual growth rate for Ontario health sector expense by program area from 2011-12 to 2015-16 versus the planned growth rate in 2016-17. The hospitals program area averaged 0.6% annual growth from 2011-12 to 2015-16. In 2016-17, the planned growth rate is negative 0.2%. The OHIP program area averaged 1.9% annual growth from 2011-12 to 2015-16. In 2016-17, the planned growth rate is 1.3%. The Ontario public drug programs area averaged 3.1% annual growth from 2011-12 to 2015-16. In 2016-17, the planned growth rate is negative 1.4%. The long-term care homes program area averaged 2.3% annual growth from 2011-12 to 2015-16. In 2016-17, the planned growth rate is 2.6%. The community programs area averaged 5.7% annual growth from 2011-12 to 2015-16. In 2016-17, the planned growth rate is 7.0%. The other programs area averaged 4.3% annual growth from 2011-12 to 2015-16. In 2016-17, the planned growth rate is 1.2%. The capital program area averaged 8.4% annual growth from 2011-12 to 2015-16. In 2016-17, the planned growth rate is 6.6%. Overall, total health sector expense averaged 2.4% annual growth from 2011-12 to 2015-16. In 2016-17, the planned growth rate is 1.4%.
Figure D
This graphic shows the difference between the FAO’s status quo forecast for health sector expense and the Province’s 2016 Ontario Budget health sector expense targets from 2016-17 to 2018-19. The difference shows a health sector expense gap of $0.4 billion in 2016-17, $0.9 billion in 2017-18 and $1.5 billion in 2018-19.
Chart 3-1
This chart shows the average annual growth rate in Ontario health sector expense over three time periods. Ontario health sector expense averaged 6.8% annual growth from 2001-02 to 2011-12, 2.4% annual growth from 2011-12 to 2015-16 and is projected to average 1.7% annual growth from 2015-16 to 2018-19.
Chart 3-2
This chart shows the annual growth rate for Ontario health sector expense from 1997-98 to 2018-19, as follows: 1997-98: 0.7%, 1998-99: 3.7%, 1999-00: 11.4%, 2000-01: 3.9%, 2001-02: 5.0%, 2002-03: 8.3%, 2003-04: 12.2%, 2004-05: 7.6%, 2005-06: 3.9%, 2006-07: 9.0%, 2007-08: 7.1%, 2008-09: 6.9%, 2009-10: 5.8%, 2010-11: 3.2%, 2011-12: 4.7%, 2012-13: 2.4%, 2013-14: 2.8%, 2014-15: 2.3%, 2015-16: 2.1%, 2016-17p: 1.4%, 2017-18p: 1.9%, and 2018-19p: 1.8%. The chart also shows that the annual growth rate for health sector expense from 2012-13 to 2018-19 (seven consecutive years), will be lower than any year since 1997-98.
Figure 4-1
This figure shows the 2016-17 planned health sector expense by program area. Planned hospitals program expense is $16.4 billion (31.6% of total), OHIP program expense is $13.7 billion (26.4% of total), Ontario public drug programs expense is $3.9 billion (7.5% of total), long-term care homes is $4.1 billion (7.8% of total), community programs is $5.4 billion (10.5% of total), other programs is $6.9 billion (13.3% of total) and capital is $1.5 billion (3.0% of total).
Chart 4-1
This chart shows the annual growth rate for Ontario health sector expense from 2002-03 to 2015-16, as follows: 2002-03: 8.3%, 2003-04: 12.2%, 2004-05: 7.6%, 2005-06: 3.9%, 2006-07: 9.0%, 2007-08: 7.1%, 2008-09: 6.9%, 2009-10: 5.8%, 2010-11: 3.2%, 2011-12: 4.7%, 2012-13: 2.4%, 2013-14: 2.8%, 2014-15: 2.3%, and 2015-16: 2.1%. The chart also shows that health sector expense averaged annual growth of 6.8% from 2001-02 to 2011-12 and 2.4% from 2011-12 to 2015-16.
Chart 4-2
This chart compares the average annual growth rate for Ontario health sector expense by program area from 2001-02 to 2011-12 and 2011-12 to 2015-16. The hospitals program area averaged 5.7% annual growth from 2001-02 to 2011-12 and 0.6% annual growth from 2011-12 to 2015-16. The OHIP program area averaged 7.4% annual growth from 2001-02 to 2011-12 and 1.9% annual growth from 2011-12 to 2015-16. The Ontario public drug programs area averaged 6.8% annual growth from 2001-02 to 2011-12 and 3.1% annual growth from 2011-12 to 2015-16. The long-term care homes program area averaged 8.5% annual growth from 2001-02 to 2011-12 and 2.3% annual growth from 2011-12 to 2015-16. The community programs area averaged 6.4% annual growth from 2001-02 to 2011-12 and 5.7% annual growth from 2011-12 to 2015-16. The other programs area averaged 7.2% annual growth from 2001-02 to 2011-12 and 4.3% annual growth from 2011-12 to 2015-16. The capital program area averaged 17.7% annual growth from 2001-02 to 2011-12 and 8.4% annual growth from 2011-12 to 2015-16. Overall, total health sector expense averaged 6.8% annual growth from 2001-02 to 2011-12 and 2.4% annual growth from 2011-12 to 2015-16.
Chart 4-3
This chart shows the contribution by program area to the change in the average annual growth rate of Ontario health sector expense from 6.8% (2001-02 to 2011-12) to 2.4% (2011-12 to 2015-16). Hospitals accounted for 41% of the growth rate change, OHIP 32%, Ontario public drug programs 7%, long-term care homes 11%, community programs 1%, other programs 8%, and capital 5%. Overall, hospitals and OHIP accounted for approximately three-quarters of the slowdown in the growth rate of health sector expense.
Chart 4-4
This chart compares the average annual increase in health sector expense from 2011-12 to 2015-16 versus 2015-16 to 2018-19. From 2011-12 to 2015-16 health sector expense increased by an average of $1.1 billion per year. From 2015-16 to 2018-19 health sector expense is projected to increase by an average of $0.9 billion per year, representing a slowdown in health sector expense growth of over $0.2 billion per year.
Chart 4-5
This chart compares the average annual growth rate for Ontario health sector expense by program area from 2011-12 to 2015-16 versus the planned growth rate in 2016-17. The hospitals program area averaged 0.6% annual growth from 2011-12 to 2015-16. In 2016-17, the planned growth rate is negative 0.2%. The OHIP program area averaged 1.9% annual growth from 2011-12 to 2015-16. In 2016-17, the planned growth rate is 1.3%. The Ontario public drug programs area averaged 3.1% annual growth from 2011-12 to 2015-16. In 2016-17, the planned growth rate is negative 1.4%. The long-term care homes program area averaged 2.3% annual growth from 2011-12 to 2015-16. In 2016-17, the planned growth rate is 2.6%. The community programs area averaged 5.7% annual growth from 2011-12 to 2015-16. In 2016-17, the planned growth rate is 7.0%. The other programs area averaged 4.3% annual growth from 2011-12 to 2015-16. In 2016-17, the planned growth rate is 1.2%. The capital program area averaged 8.4% annual growth from 2011-12 to 2015-16. In 2016-17, the planned growth rate is 6.6%. Overall, total health sector expense averaged 2.4% annual growth from 2011-12 to 2015-16. In 2016-17, the planned growth rate is 1.4%.
Chart 5-1
This chart compares the average annual growth rate in hospitals program expense over three time periods. From 2001-02 to 2011-12, annual growth averaged 5.7%. From 2011-12 to 2015-16, annual growth averaged 0.6%. For 2016-17, the planned growth rate is negative 0.2%.
Chart 5-2
This chart compares the average annual growth rate in OHIP program expense over three time periods. From 2001-02 to 2011-12, annual growth averaged 7.4%. From 2011-12 to 2015-16, annual growth averaged 1.9%. For 2016-17, the planned growth rate is 1.3%.
Chart 5-3
This chart shows the annual growth rate in OHIP program expense from 2012-13 to 2016-17. In 2012-13, the growth rate was 2.3%, in 2013-14: 0.9%, in 2014-15: 3.5%, in 2015-16: 0.8%, and in 2016-17, the planned growth rate is 1.3%. The chart also notes that the 2012 Physician Services Agreement impacted 2013-14 growth, and changes to physician payments in February 2015 and October 2015 impacted 2015-16 and 2016-17 growth.
Chart 5-4
This chart compares the average annual growth rate in Ontario public drug programs expense over three time periods. From 2001-02 to 2011-12, annual growth averaged 6.8%. From 2011-12 to 2015-16, annual growth averaged 3.1%. For 2016-17, the planned growth rate is negative 1.4%.
Chart 5-5
This chart compares the average annual growth rate in long-term care homes program expense over three time periods. From 2001-02 to 2011-12, annual growth averaged 8.5%. From 2011-12 to 2015-16, annual growth averaged 2.3%. For 2016-17, the planned growth rate is 2.6%.
Chart 5-6
This chart compares the average annual growth rate in community programs expense over three time periods. From 2001-02 to 2011-12, annual growth averaged 6.4%. From 2011-12 to 2015-16, annual growth averaged 5.7%. For 2016-17, the planned growth rate is 7.0%.
Chart 5-7
This chart compares the average annual growth rate in other programs expense over three time periods. From 2001-02 to 2011-12, annual growth averaged 7.2%. From 2011-12 to 2015-16, annual growth averaged 4.3%. For 2016-17, the planned growth rate is 1.2%.
Chart 5-8
This chart compares the average annual growth rate in capital program expense over three time periods. From 2001-02 to 2011-12, annual growth averaged 17.7%. From 2011-12 to 2015-16, annual growth averaged 8.4%. For 2016-17, the planned growth rate is 6.6%.
Chart 5-9
This chart shows the difference between the FAO’s status quo forecast for health sector expense and the Province’s 2016 Ontario Budget health sector expense targets from 2016-17 to 2018-19. The difference shows a health sector expense gap of $0.4 billion in 2016-17, $0.9 billion in 2017-18 and $1.5 billion in 2018-19.
Chart 6-1
This chart shows the average Ontario health sector expense growth rates over four time periods. From 1980-81 to 1991-92, health sector expense averaged annual growth of 12.4%, from 1991-92 to 1997-98: 1.3% and from 1997-98 to 2011-12: 6.6%. From 2011-12 to 2018-19, growth is projected to increase by an average of 2.1% per year.
Chart 6-2
This chart shows the average annual real per capita growth rate in Ontario health sector expense over four time periods. From 1980-81 to 1991-92, real per capita health sector expense averaged annual growth of 4.2%, from 1991-92 to 1997-98: negative 1.3% and from 1997-98 to 2011-12: 3.2%. From 2011-12 to 2018-19, real per capita growth is projected to decrease by an average of negative 0.8% per year.
Chart 6-3
This chart shows the FAO’s estimate of health sector expense cost drivers to 2020. For the next five years the population growth cost driver is estimated to average 1.2% annual growth, the population aging cost driver: 1.1%, the income growth cost driver: 0.9%, and the inflation cost driver: 2.1%. Combined, the four cost drivers are estimated to average 5.3% annual growth to 2020.
Chart 8-1
This chart shows the annual expense and annual growth rate from 2002-03 to 2016-17 for the hospitals program area. For 2002-03 expense was $10,278 million and annual growth was 11.6%, for 2003-04: $11,465 million and 11.6%, 2004-05: $12,506 million and 9.1%, 2005-06: $12,221 million and negative 2.3%, 2006-07: $13,003 million and 6.4%, 2007-08: $13,906 million and 6.9%, 2008-09: $14,424 million and 3.7%, 2009-10: $15,126 million and 4.9%, 2010-11: $15,419 million and 1.9%, 2011-12: $16,021 million and 3.9%, 2012-13: $16,362 million and 2.1%, 2013-14: $16,672 million and 1.9%, 2014-15: $16,012 million and negative 4.0%, 2015-16: $16,399 million and 2.4%, 2016-17p: $13,367 million and negative 0.2%.
Chart 8-2
This chart shows the annual expense and annual growth rate from 2002-03 to 2016-17 for the OHIP program area. For 2002-03 expense was $6,422 million and annual growth was 4.6%, for 2003-04: $6,850 million and 6.7%, 2004-05: $7,470 million and 9.0%, 2005-06: $8,042 million and 7.7%, 2006-07: $8,752 million and 8.8%, 2007-08: $9,526 million and 8.8%, 2008-09: $10,529 million and 10.5%, 2009-10: $11,257 million and 6.9%, 2010-11: $11,913 million and 5.8%, 2011-12: $12,537 million and 5.2%, 2012-13: $12,823 million and 2.3%, 2013-14: $12,935 million and 0.9%, 2014-15: $13,392 million and 3.5%, 2015-16: $13,497 million and 0.8%, 2016-17p: $13,670 million and 1.3%.
Chart 8-3
This chart shows the annual expense and annual growth rate from 2002-03 to 2016-17 for the Ontario public drug programs program area. For 2002-03 expense was $2,058 million and annual growth was 14.6%, for 2003-04: $2,314 million and 12.4%, 2004-05: $2,545 million and 10.0%, 2005-06: $2,786 million and 9.5%, 2006-07: $2,970 million and 6.6%, 2007-08: $3,063 million and 3.1%, 2008-09: $3,335 million and 8.9%, 2009-10: $3,620 million and 8.5%, 2010-11: $3,452 million and negative 4.6%, 2011-12: $3,478 million and 0.8%, 2012-13: $3,415 million and negative 1.8%, 2013-14: $3,509 million and 2.7%, 2014-15: $3,782 million and 7.8%, 2015-16: $3,929 million and 3.9%, 2016-17p: $3,875 million and negative 1.4%.
Chart 8-4
This chart shows the annual expense and annual growth rate from 2002-03 to 2016-17 for the long-term care homes program area. For 2002-03 expense was $1,811 million and annual growth was 13.5%, for 2003-04: $2,098 million and 15.9%, 2004-05: $2,486 million and 18.5%, 2005-06: $2,672 million and 7.5%, 2006-07: $2,793 million and 4.5%, 2007-08: $2,920 million and 4.6%, 2008-09: $3,147 million and 7.8%, 2009-10: $3,261 million and 3.6%, 2010-11: $3,440 million and 5.5%, 2011-12: $3,611 million and 5.0%, 2012-13: $3,672 million and 1.7%, 2013-14: $3,788 million and 3.2%, 2014-15: $3,869 million and 2.2%, 2015-16: $3,949 million and 2.1%, 2016-17p: $4,054 million and 2.6%.
Chart 8-5
This chart shows the annual expense and annual growth rate from 2002-03 to 2016-17 for the community programs program area. For 2002-03 expense was $2,216 million and annual growth was 1.8%, for 2003-04: $2,292 million and 3.4%, 2004-05: $2,461 million and 7.4%, 2005-06: $2,730 million and 10.9%, 2006-07: $2,994 million and 9.7%, 2007-08: $3,196 million and 6.8%, 2008-09: $3,402 million and 6.4%, 2009-10: $3,618 million and 6.4%, 2010-11: $3,836 million and 6.0%, 2011-12: $4,055 million and 5.7%, 2012-13: $4,255 million and 4.9%, 2013-14: $4,602 million and 8.2%, 2014-15: $4,854 million and 5.5%, 2015-16: $5,059 million and 4.2%, 2016-17p: $5,414 million and 7.0%.
Chart 8-6
This chart shows the annual expense and annual growth rate from 2002-03 to 2016-17 for the other programs program area. For 2002-03 expense was $2,876 million and annual growth was 0.1%, for 2003-04: $3,788 million and 31.7%, 2004-05: $3,387 million and negative 10.6%, 2005-06: $3,652 million and 7.8%, 2006-07: $4,263 million and 16.7%, 2007-08: $4,614 million and 8.2%, 2008-09: $4,872 million and 5.6%, 2009-10: $5,160 million and 5.9%, 2010-11: $5,296 million and 2.6%, 2011-12: $5,746 million and 8.5%, 2012-13: $5,910 million and 2.9%, 2013-14: $6,111 million and 3.4%, 2014-15: $6,716 million and 9.9%, 2015-16: $6,797 million and 1.2%, 2016-17p: $6,875 million and 1.2%.
Chart 8-7
This chart shows the annual expense and annual growth rate from 2002-03 to 2016-17 for the capital program area. For 2002-03 expense was $339 million and annual growth was 65.4%, for 2003-04: $358 million and 5.6%, 2004-05: $536 million and 49.6%, 2005-06: $508 million and negative 5.1%, 2006-07: $765 million and 50.5%, 2007-08: $832 million and 8.9%, 2008-09: $976 million and 17.3%, 2009-10: $1,011 million and 3.5%, 2010-11: $1,057 million and 4.5%, 2011-12: $1,043 million and negative 1.4%, 2012-13: $1,156 million and 10.9%, 2013-14: $1,317 million and 13.9%, 2014-15: $1,414 million and 7.3%, 2015-16: $1,437 million and 1.7%, 2016-17p: $1,531 million and 6.6%.


