


Key Points
- The FAO is forecasting a moderate increase in Ontario house prices in 2017 followed by slightly lower prices over the next three years, as higher expected interest rates dampen housing demand. However, there is a risk that Ontario could face a sharper decline in house prices that would negatively impact the broader economy and the Province’s fiscal position.
- A decline in house prices and housing market activity would directly reduce Land Transfer Tax and Harmonized Sales Tax (HST) revenues. The impacts on the broader economy would also reduce Personal Income Tax and Corporations Income Tax revenues and further reduce HST revenues.[1]
- To assess the impact of a potential housing market correction on the Province’s fiscal plan, the FAO constructed three scenarios that lead to a 10 to 20 per cent decline in average house prices over the next four years.
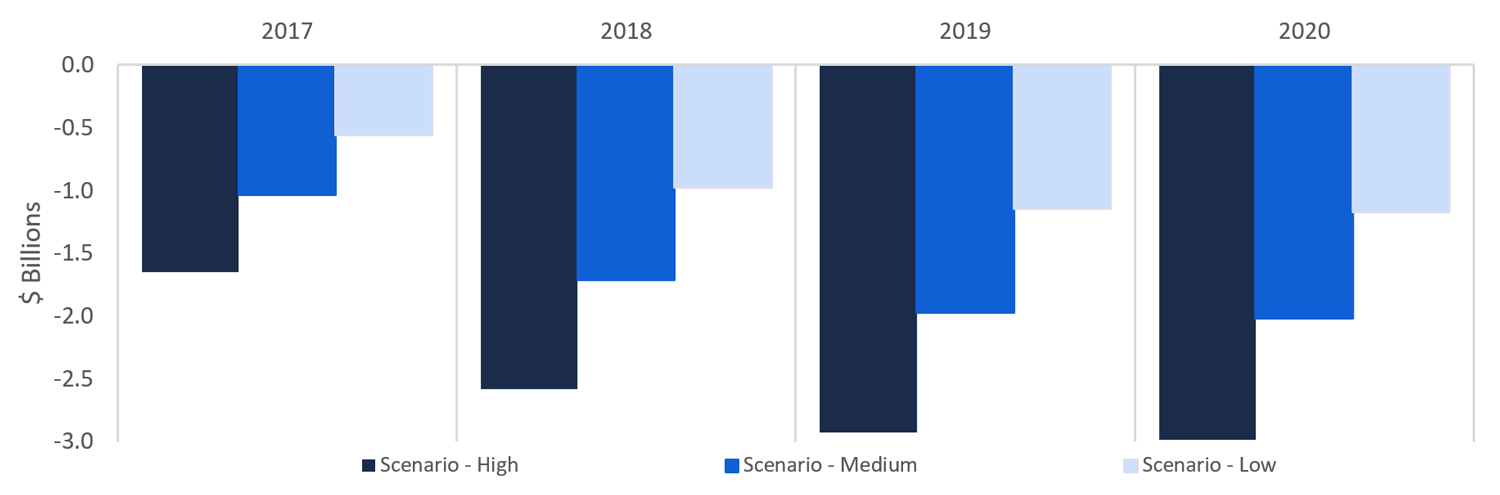
- Under these housing market correction scenarios, the FAO estimates Ontario revenues could fall by $0.6 to $1.2 billion in 2017-18 and by $1.2 to $2.2 billion by 2020 compared to the FAO’s fiscal projections presented in the Fall 2016 Economic and Fiscal Outlook.
Estimated Impact to Provincial Revenue
Source: FAO
Note: Impacts are relative to the FAO’s 2016 Fall EFO forecast.
Overview
The Financial Accountability Office’s (FAO) Economic and Fiscal Outlook (EFO)[2] cited elevated housing prices as a key risk for the Ontario economy and the Province’s finances. A number of independent studies have also indicated that housing prices in Ontario, and the Greater Toronto Area in particular, are overvalued by 15 per cent or more.[3] The EFO report noted that a sharp correction in housing prices would negatively impact household spending and residential construction, and potentially lead to broader, economy-wide impacts on growth and employment. While the EFO outlook anticipates a leveling out in residential investment over the next several years, consistent with a modest decline in housing prices, a sharper housing price correction remains a significant risk, both for the economy and the Province’s tax revenues.
To assess the impact of a housing market correction on the Province’s fiscal plan, the FAO constructed three hypothetical scenarios where a steeper than predicted rise in interest rates combined with a shift in consumer sentiment away from housing investment results in a 10 to 20 per cent decline in average house prices over the next four years[4]. The decline in house prices, along with higher interest rates and the shift in consumer behaviour, would lead to a decline in housing activity which would negatively impact the broader economy.
Under these scenarios, the FAO estimates Ontario revenues would be reduced by $0.6 to $1.2 billion in 2017-18 and by $1.2 to $2.2 billion by 2020 compared to the FAO’s Fall 2016 EFO baseline forecast.
Assuming no change in government spending, the drop in revenues would lead to an equivalent deterioration in the Province’s fiscal balance.
The Housing Market Correction Scenarios
The primary trigger for a housing market correction under the FAO’s hypothetical scenarios is a relatively sharp one-percentage-point increase in interest rates above the EFO baseline forecast.[5] Higher interest rates would negatively impact housing affordability and discourage buyers from entering the market.[6]
In addition, the FAO’s scenarios assume that there is a shift in household expectations on the pace of future house price gains. Recent gains in average house prices (15 per cent in 2016) have significantly outpaced growth in personal income and other measures of affordability. Given this exceptionally strong and likely unsustainable pace of recent house price gains, it is reasonable to assume that households may begin to expect that future price growth will moderate. This expectation of moderating prices could lead to actual declines in prices because:
- Some homeowners might choose to list their homes for sale in order to capture recent price gains; and
- Some potential buyers might decide to delay purchasing a new home to take advantage of lower expected prices in the future.
Given the uncertainty associated with modelling consumer expectations, the FAO developed a range for the estimated decline in house prices based on alternative assumptions about household expectations of future house price gains.
Housing Market Correction Scenarios
|
Scenario |
Consumer Expectation Assumptions |
Interest Rate Assumptions |
FAO’s Estimated Impact on Home Prices |
|---|---|---|---|
|
Base Case (Fall 2016 EFO) |
Households expect house prices to rise by seven per cent in 2017 – a growth rate consistent with recent trends[7]. |
Interest rates rise gradually beginning in 2018 as outlined in the Fall 2016 EFO. |
Household expectations for moderately higher house prices are tempered by a gradual increase in interest and mortgage rates, resulting in house prices increasing moderately in 2017, and then trending modestly lower over the next three years. |
|
Low Impact |
Households expect house prices to rise by a more modest three per cent in 2017. |
Interest rates jump by 100 basis points in 2017 above the EFO baseline forecast. |
The steeper rise in mortgage rates would offset the expectation for modestly higher house prices in 2017, resulting in a 10 per cent decline in actual home resale prices from 2016 to 2020. |
|
Medium Impact |
Households expect prices to remain unchanged in 2017 compared to 2016. |
Interest rates jump by 100 basis points in 2017 above the EFO baseline forecast. |
Households’ expectation of no gain in house prices in 2017 combined with the assumed 100 basis point rise in mortgage rates would result in actual home resale prices declining by 13.5 per cent from 2016 to 2020. |
|
High Impact |
Households expect prices to fall by seven per cent in 2017. |
Interest rates jump by 100 basis points in 2017 above the EFO baseline forecast. |
Households’ expectation of lower house prices in 2017 combined with the sharp rise in mortgage rates, results in actual home prices falling by 20 per cent from 2016 to 2020. |
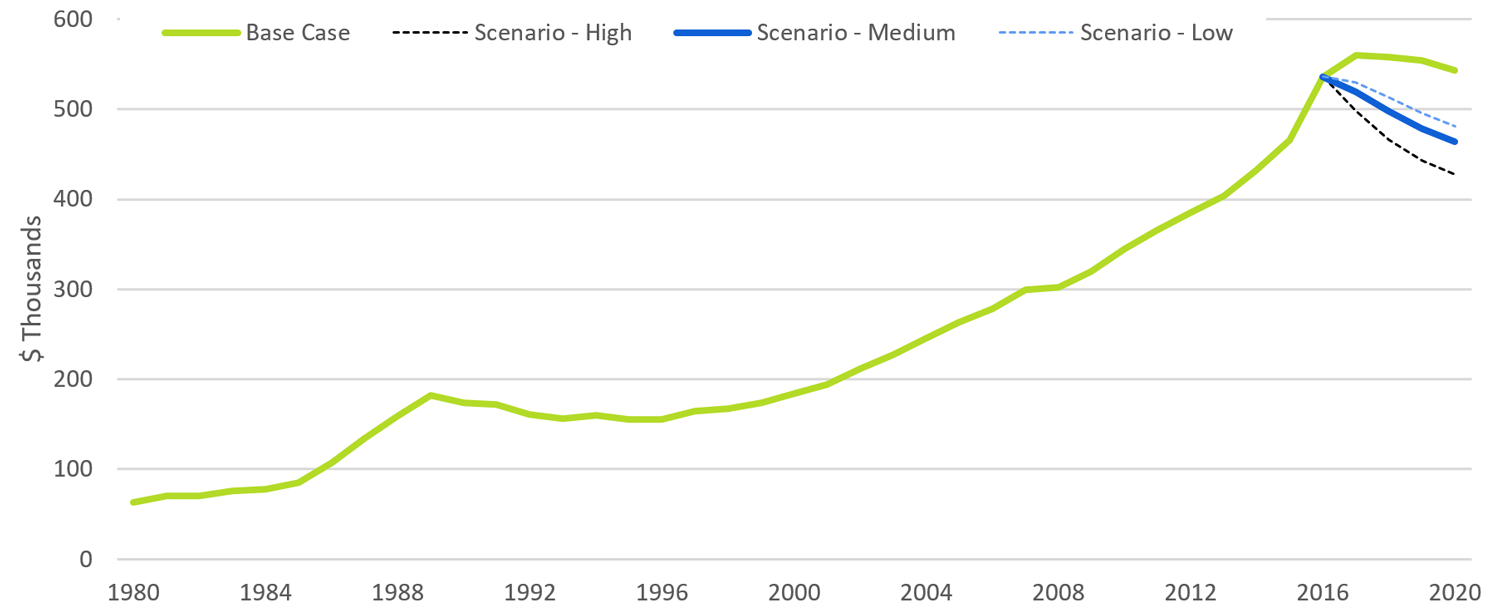
In the FAO’s base case forecast, housing prices are projected to increase by about 4 per cent in 2017 before falling gradually over the next three years. Under the FAO’s housing market correction scenarios, average home resale prices would be expected to decline by 10 to 20 per cent from 2016 to 2020.
Estimated Impact to Average Home Resale Prices
Source: FAO and the Canadian Real Estate Association
Under the FAO’s housing market correction scenarios, the sharp increase in interest rates combined with lower house prices would lead to lower housing starts, home resales and home renovations. As a result, gross output in the residential construction and real estate sectors would be expected to be 9 to 16 per cent lower by 2020 relative to the EFO’s baseline forecast.
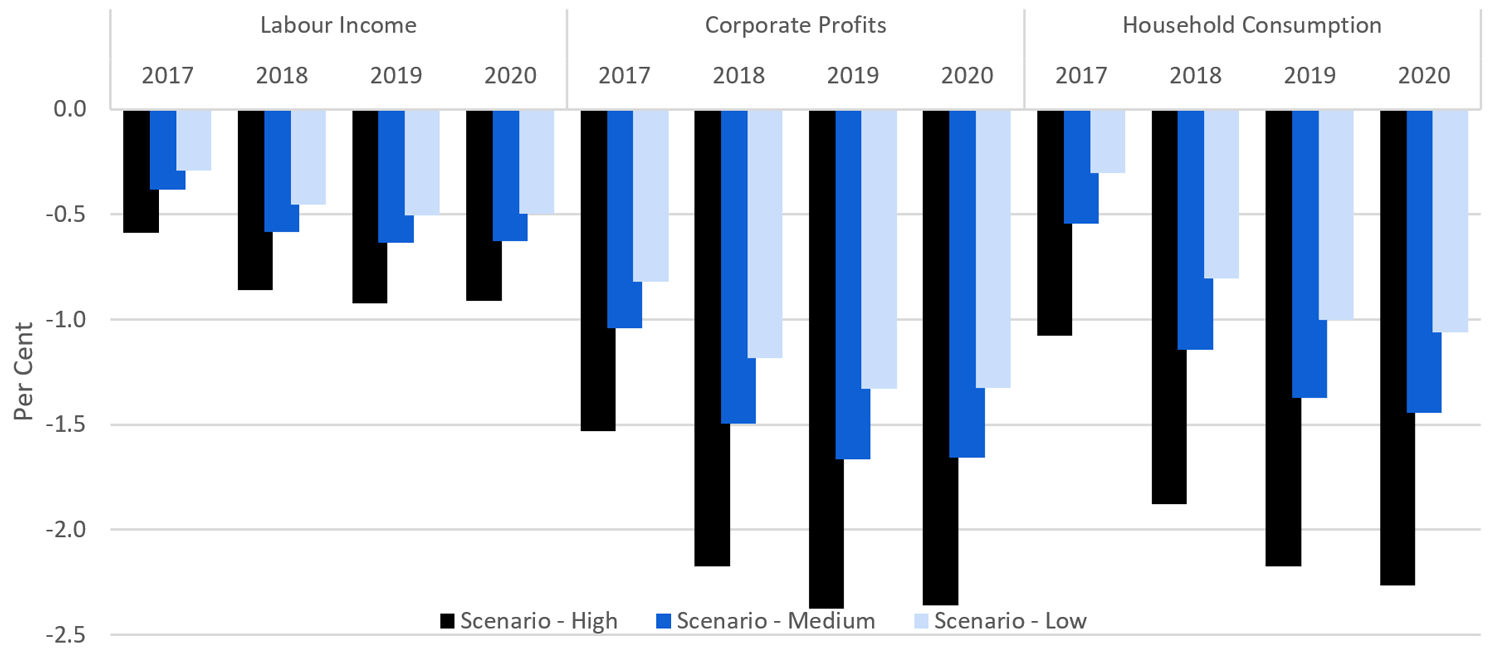
Lower housing sector activity would also have broader, economy-wide impacts. The FAO estimates that under these housing market correction scenarios, economy-wide labour income would decline by 0.5 to 0.9 per cent by 2020 while corporate profits would be down by 1.3 to 2.4 per cent by 2020. These impacts on economy-wide incomes would exacerbate the impact on the housing sector by further reducing housing demand.
The impact on home prices would also reduce household wealth. The FAO estimates that households, faced with lower wealth and income, would reduce spending by 1.1 to 2.3 per cent by 2020.
Estimated Economic Impact of Housing Market Correction Scenarios
Source: FAO
Fiscal Impacts of a Housing Market Correction
To estimate the fiscal implications of the housing market correction scenarios, the FAO applied revenue sensitivities from the 2016 Ontario Budget to the economic impacts discussed above. Based on these sensitivities and given the estimated economic impacts, the FAO estimates that Ontario total tax revenue would decline by $0.6 to $1.2 billion in 2017-18 and by $1.2 to $2.2 billion by 2020-21, compared to the Fall 2016 EFO base line forecast.
The decline in average house prices and number of home resales would have an especially large impact on Ontario’s Land Transfer Tax (LTT). From 2012 to 2015, LTT revenue increased sharply by over 40 per cent or $0.6 billion to $2.1 billion. Under the housing market correction scenarios, LTT revenue would decline by $0.4 to $0.7 billion by 2020 compared to the base line forecast.
Impact to Land Transfer Tax
![]()
Source: FAO and Ontario Public Accounts
Since the Harmonized Sales Tax (HST) is applied to both the value of newly constructed homes sold as well as real estate agents’ commissions and legal fees, a housing market correction would also have a significant direct impact on HST revenues.
Impact to Harmonized Sales Tax Revenue
|
|
A decline in housing market activity would also have broader economy-wide impacts beyond the housing market. In particular, lower personal income and household wealth would result in a decline in household spending, which would further reduce HST revenues.
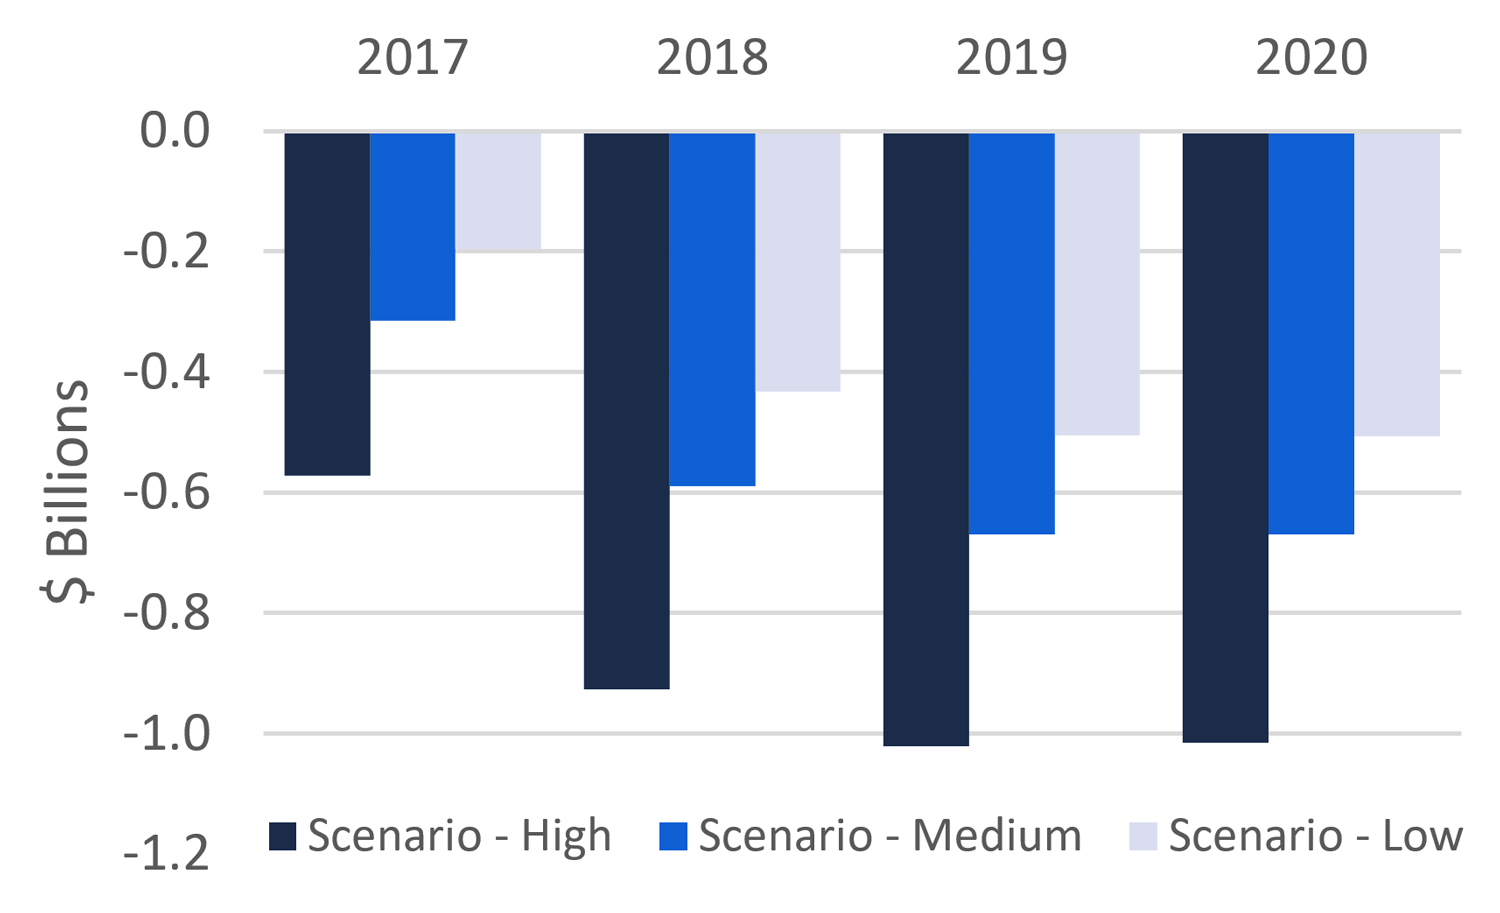
Compared to the EFO baseline forecast, the impact of fewer house sales and lower household consumption would reduce HST revenues by $0.5 to $1.0 billion by 2020.
Other economy-wide impacts would include lower labour income and corporate profits, which would result in lower personal income and corporations tax revenues. Compared to the EFO baseline forecast, the housing market correction scenarios would lower personal income tax revenues by $170 million to $310 million by 2020 and corporations tax revenues by $130 million to $230 million.
Impact to Personal Income Tax and Corporations Tax Revenue
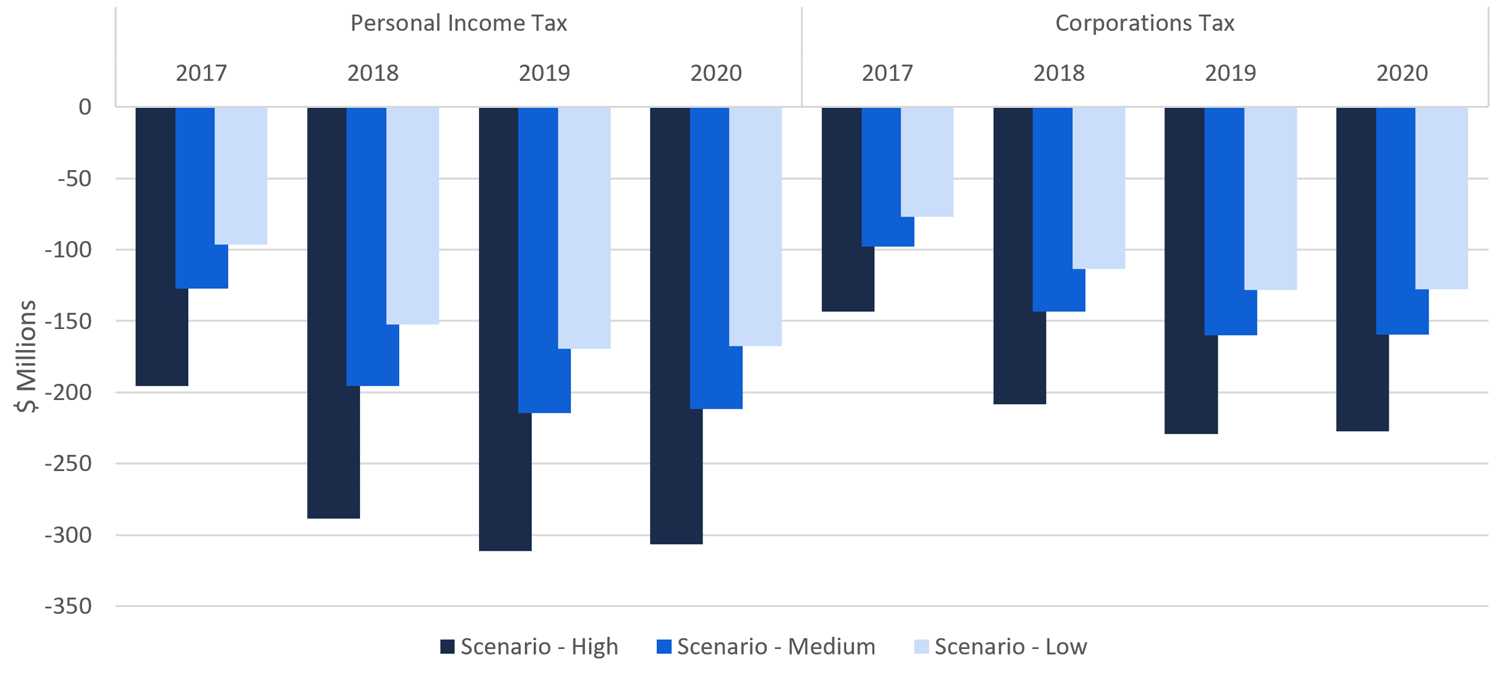
Source: FAO
Finally, a housing market correction could also have an impact on Ontario government spending. For example, a housing market correction which lowers labour income could place increased pressure on social assistance programs. Conversely, the decline in revenues as a result of a housing market correction could force the government to further restrain spending to achieve its fiscal balance targets. However, given the significant uncertainty about the government’s response to a housing market correction, the FAO did not include any spending impact in this assessment.
Luan Ngo
Senior Economist
lngo@fao-on.org
Mario Angastiniotis
Senior Director
mangastiniotis@fao-on.org
David West
Chief Economist
dwest@fao-on.org
Financial Accountability Office of Ontario
2 Bloor Street West, Suite 900
Toronto, Ontario M4W 3E2
Media queries, contact: Kismet Baun, 416.254.9232 or email kbaun@fao-on.org.
A technical appendix containing the calculations and background data used in this report is available upon request.
Appendix: Estimated Revenue Impacts of Housing Market Corrections Scenarios ($ Millions)
High-Impact Scenario
|
Personal Income Tax |
Corporations Tax |
Harmonized Sales Tax |
Land Transfer Tax |
Total |
|
|---|---|---|---|---|---|
|
2017 |
-200 |
-140 |
-570 |
-330 |
-1,240 |
|
2018 |
-290 |
-210 |
-930 |
-510 |
-1,940 |
|
2019 |
-310 |
-230 |
-1,020 |
-620 |
-2,180 |
|
2020 |
-310 |
-230 |
-1,020 |
-670 |
-2,210 |
|
% Impact in 2020 |
-0.8 |
-2.0 |
-3.7 |
-24.6 |
-1.5 |
Medium-Impact Scenario
|
Personal Income Tax |
Corporations Tax |
Harmonized Sales Tax |
Land Transfer Tax |
Total |
|
|---|---|---|---|---|---|
|
2017 |
-130 |
-100 |
-310 |
-230 |
-770 |
|
2018 |
-200 |
-140 |
-590 |
-350 |
-1,280 |
|
2019 |
-210 |
-160 |
-670 |
-430 |
-1,470 |
|
2020 |
-210 |
-160 |
-670 |
-460 |
-1,500 |
|
% Impact in 2020 |
-0.5 |
-1.4 |
-2.5 |
-17.0 |
-1.0 |
Low-Impact Scenario
|
Personal Income Tax |
Corporations Tax |
Harmonized Sales Tax |
Land Transfer Tax |
Total |
|
|---|---|---|---|---|---|
|
2017 |
-100 |
-80 |
-200 |
-190 |
-560 |
|
2018 |
-150 |
-110 |
-430 |
-280 |
-980 |
|
2019 |
-170 |
-130 |
-500 |
-340 |
-1,140 |
|
2020 |
-170 |
-130 |
-510 |
-370 |
-1,170 |
|
% Impact in 2020 |
-0.4 |
-1.1 |
-1.9 |
-13.6 |
-0.8 |
Source: FAO
[1] Lower house prices would also eventually impact the Education Property Tax (EPT). EPT is based on the assessed value of properties, as established by the Municipal Property Assessment Corporation every four years. Since the most recent assessment occurred on January 1, 2016, the next MPAC assessment will occur on January 1, 2020 and would not impact EPT payments until 2021.
[2] Economic and Fiscal Outlook, Fall 2016 Update, Financial Accountability Office of Ontario, November 2016.
[3] TD Bank estimated that Ontario house prices were overvalued by between 10 to 15 per cent in 2015 (Regional Housing Report, TD Economics, August 2015). In particular, TD bank noted that the housing market in the Greater Toronto Area is vulnerable to a significant correction given the elevated house price-to-income ratio and the high levels of newly constructed houses that remain unsold. Similarly, the Bank of Canada has reported that the increase in Canadian housing prices has been faster than would be expected based on housing market fundamentals (such as household incomes and interest rates). Based on its analysis, the Bank estimated that the Canadian housing market was overvalued between 10 to 30 per cent in 2014 (Financial System Review, Bank of Canada, December 2014). The Ontario government has also noted that the sharp rise in resale home prices relative to household incomes represents a risk to the economic outlook (2016 Ontario Budget, p 242).
[4] The FAO’s scenarios represent declines in average house prices across Ontario. Within Ontario, regions with high levels of overvaluation, such as the Greater Toronto Area (GTA), could potentially see greater declines in house prices. In addition, a housing market correction would likely have different impacts on prices depending on the type of property (e.g. single house versus condominium).
[5] The FAO’s baseline forecast presented in the Fall 2016 EFO report anticipates a modest rise in interest rates beginning in 2018. The sharper rise in interest rates anticipated in these scenarios could be triggered by an external financial market shock that impacts global interest rates.
[6] A sharp rise in interest rates would have impacts on the economy beyond the housing sector, including dampening growth in household consumption and business investment. However, to illustrate the magnitude and channels through which a housing correction would impact the Province’s revenue, the FAO’s analysis isolated the impact of higher interest rates to the housing market.
[7] In 2016, home resale prices grew by an unusually strong 15 per cent after growing seven per cent on average the prior two years. Given this, the FAO adopted a more reasonable assumption that households expect prices to increase seven per cent in 2017.
Estimated Impact to Provincial Revenue
This graph presents the FAO’s estimated impact to total provincial revenue from 2017 to 2020 under three housing market correction scenarios. In the low impact scenario, provincial revenues are estimated to be $0.6 billion lower in 2017 than the Fall 2016 EFO baseline forecast. By 2020, the impact in the low scenario is estimated to grow to $1.2 billion. In the medium-impact scenario, the provincial revenues are estimated to be reduced by $0.8 billion in 2017, growing to $1.5 billion in 2020. Lastly, the high scenario has Ontario’s revenue impacted by $1.2 billion in 2017, growing to $2.5 billion by 2020.
Estimated Impact to Average Home Resale Prices
This chart shows average resale prices from 1980 to 2020. Resale prices increased sharply in the 1980s . However, a housing correction in 1990 halted the appreciation in house prices, and dampened the housing market for five years. Resale prices began to appreciate once again beginning 1995 nearly uninterrupted until 2016. In the base case, the FAO forecasts resale prices to increase moderately in 2017, and then trend modestly lower over the next three years as higher expected interest rates dampen housing demand. In the FAO’s housing correction scenarios, average resale prices begin to decline immediately and continue to fall to 2020. In the low scenario, resale prices fall 10 per cent from 2016 to 2020 while the medium-impact scenario shows resale prices falling by 13.5 per cent. Finally, resale prices fall 20 per cent over the same period in the high-impact scenario.
Estimated Economic Impact of Housing Market Correction Scenarios
This chart presents the FAO’s estimated impact to labour income, corporate profits and household consumption under the FAO’s three housing correction scenarios. In 2017, labour income is estimated to fall between 0.3 to 0.6 per cent, corporate profits are estimated to drop between 0.8 and 1.5 per cent, and household consumption is estimated to decline by 0.3 to 1.1 per cent. In 2018, all three measures are estimated to drop further before beginning to stabilize in 2019. By 2020, labour income, corporate profits and household consumption is expected to be lower than the base case by 0.5 to 0.9 per cent, 1.3 to 2.4 per cent, and 1.1 to 2.3 per cent respectively.
Impact to Land Transfer Tax
This figure shows Land Transfer Tax (LTT) revenue from 2003 to 2020. The LTT peaked in 2007 when the recession severely cut LTT revenue. Land Transfer Tax revenue began to increase in 2010, recovering in 2011 to its prerecession peak. Beginning 2012, LTT revenue growth picked up pace, with growth averaging 7 per cent in 2014 and 2015, and jumping to 15 per cent in 2016. The FAO’s base case forecast has the LTT’s growth beginning to stabilize in 2016 and plateauing to 2020, as the rise in housing prices slow. In the housing correction scenarios, Land Transfer Tax revenue begin to decline in 2016 and further falling to 2020. In the low scenario, LTT revenues fall by $0.4 billion by 2020. LTT revenues fall by $0.5 billion in the medium scenario and by $0.7 billion in the high scenario.
Impact to Harmonized Sales Tax Revenue
This chart shows the FAO’s estimated impact to Harmonized Sales Tax (HST) revenues from 2017 to 2020. In 2017, the FAO estimates that HST revenue would be reduced by $0.2 billion in the low-scenario, $0.3 billion in the medium-impact scenario and $0.6 billion in the high scenario. The magnitude of these impacts grow in 2018 but begin to stabilize in 2019. By 2020, the impact to HST revenue is estimated to be $0.5 billion, $0.7 billion and $1.1 billion in the low, medium and high scenarios, respectively.
Impact to Personal Income Tax and Corporations Tax Revenue
This chart presents the estimated impact to the Personal Income Tax (PIT) and Corporations Tax (CT) under the three housing correction scenarios. In 2017, revenue from the PIT are estimated to fall between $0.1 to $0.2 billion, growing to $0.2 to $0.3 billion by 2020. For the CT, revenue is estimated to decline $0.1 billion in 2017, growing to $0.1 to $0.2 billion by 2020.

