


Comparing Ontario’s Revenues, Spending, Budget Balance and Net Debt with Other Provinces
Highlights
This report provides a comparison of Ontario government revenues, spending, budget balance and net debt with the other Canadian provinces based on Statistics Canada’s Government Finance Statistics (GFS). Financial information is reviewed for the 2022-23 fiscal year and is referred to as 2022 throughout the report.
Ontario’s total revenue per capita was the lowest in Canada
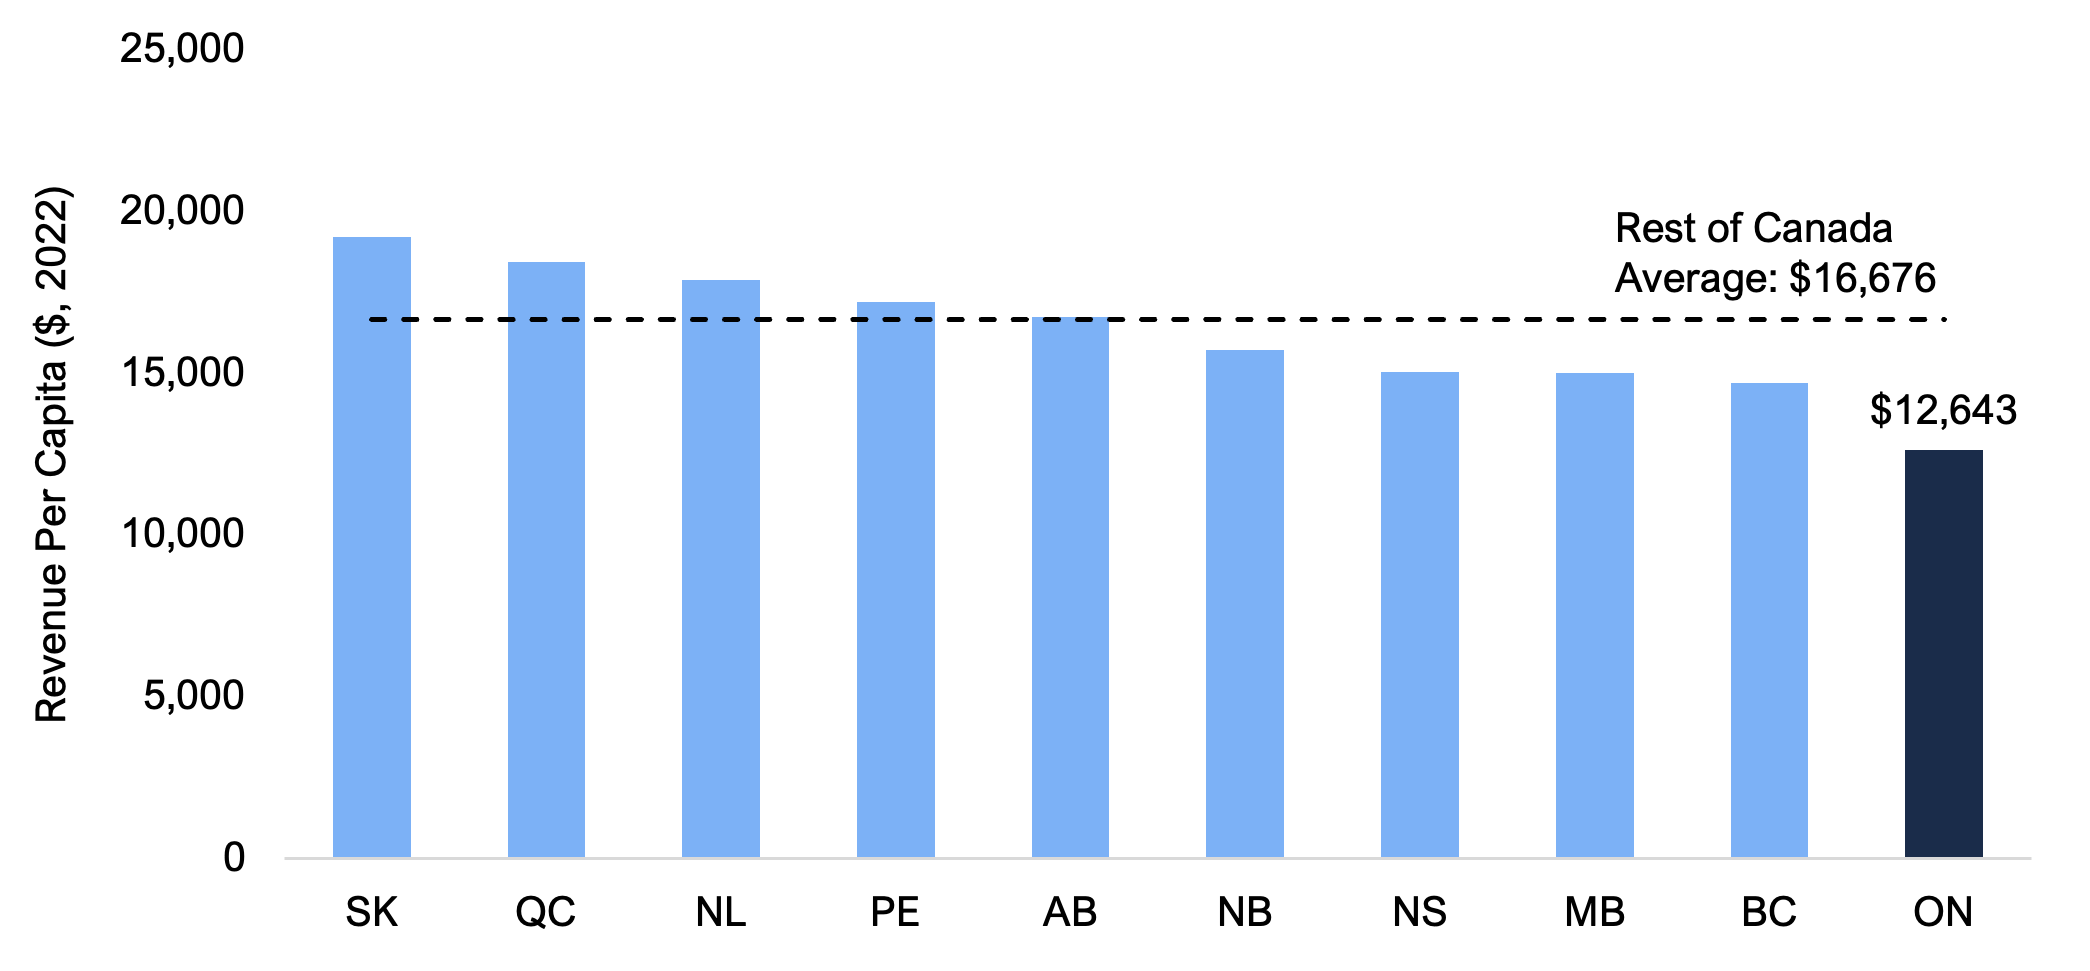
- In 2022, Ontario received $12,643 in total revenue per capita, the lowest among the provinces and $4,034 (24.2 per cent) below the average for the rest of Canada ($16,676), reflecting slightly lower tax revenue per capita and much lower federal transfers and other non-tax revenues per capita.
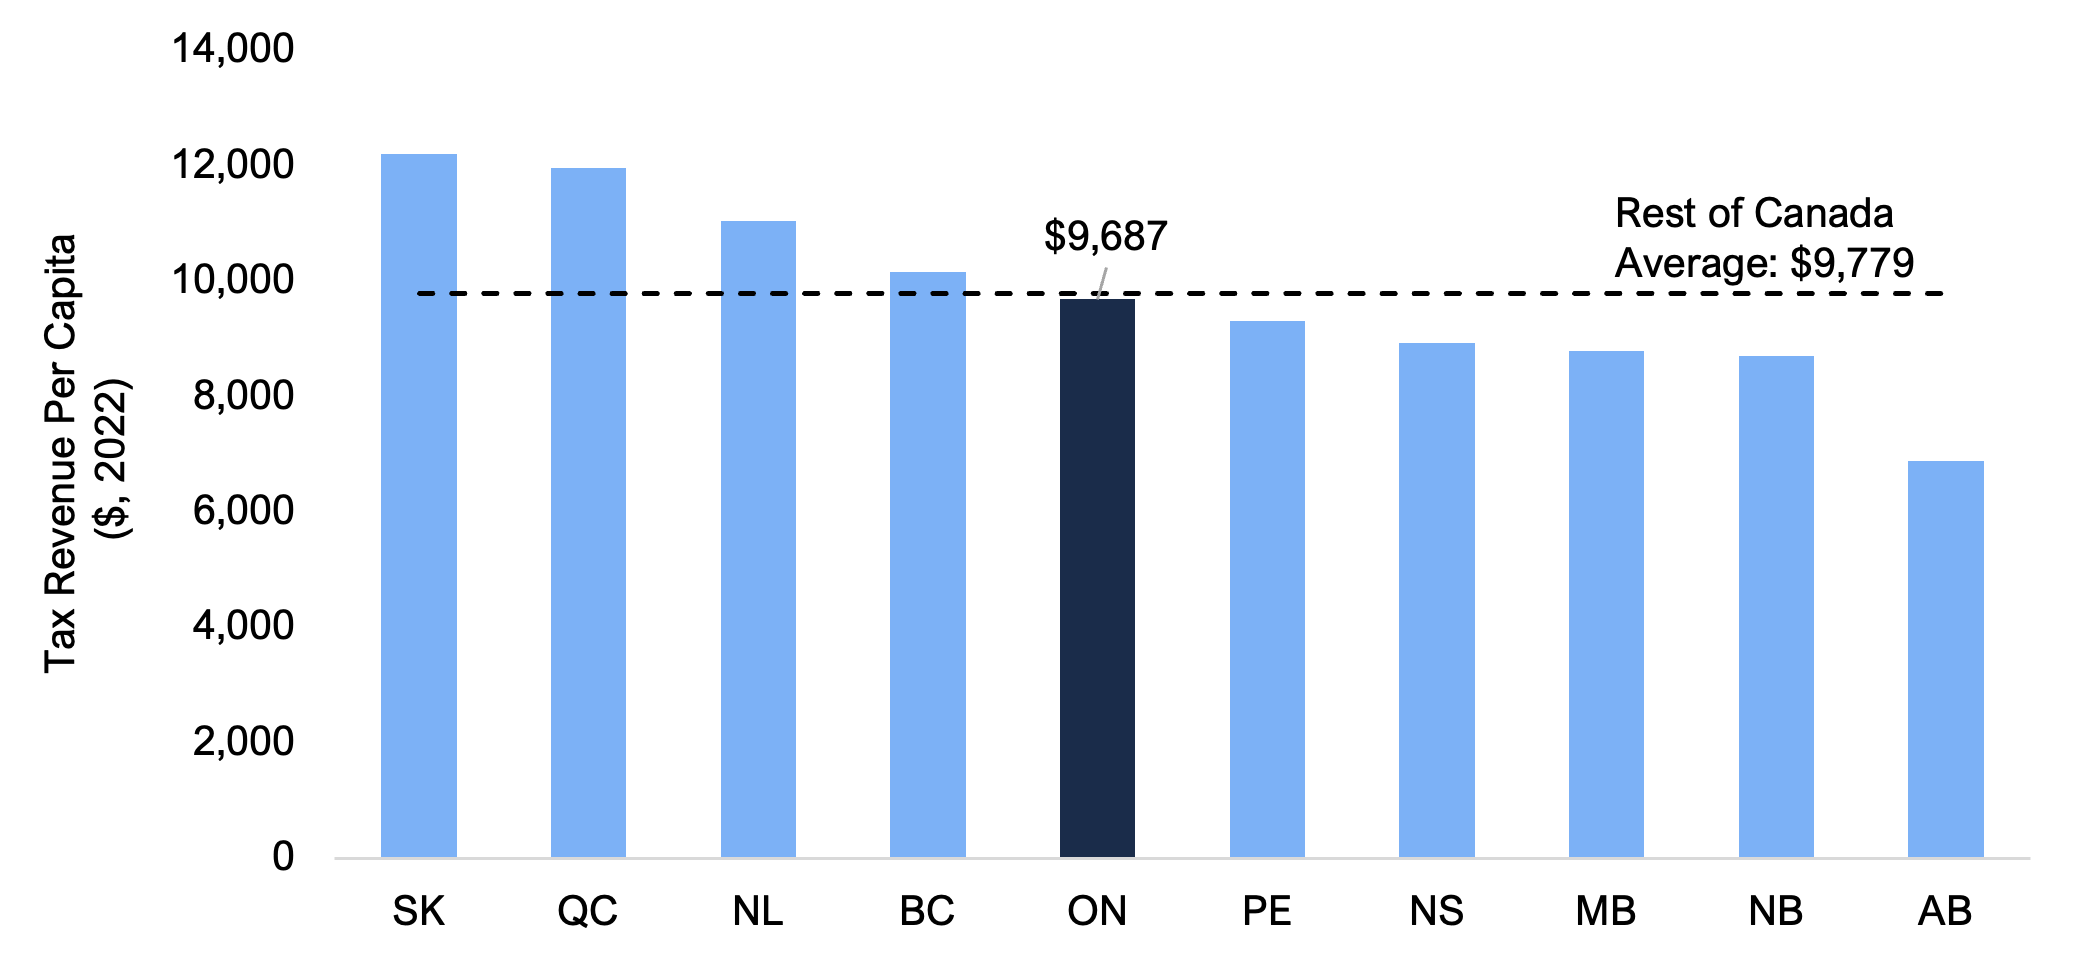
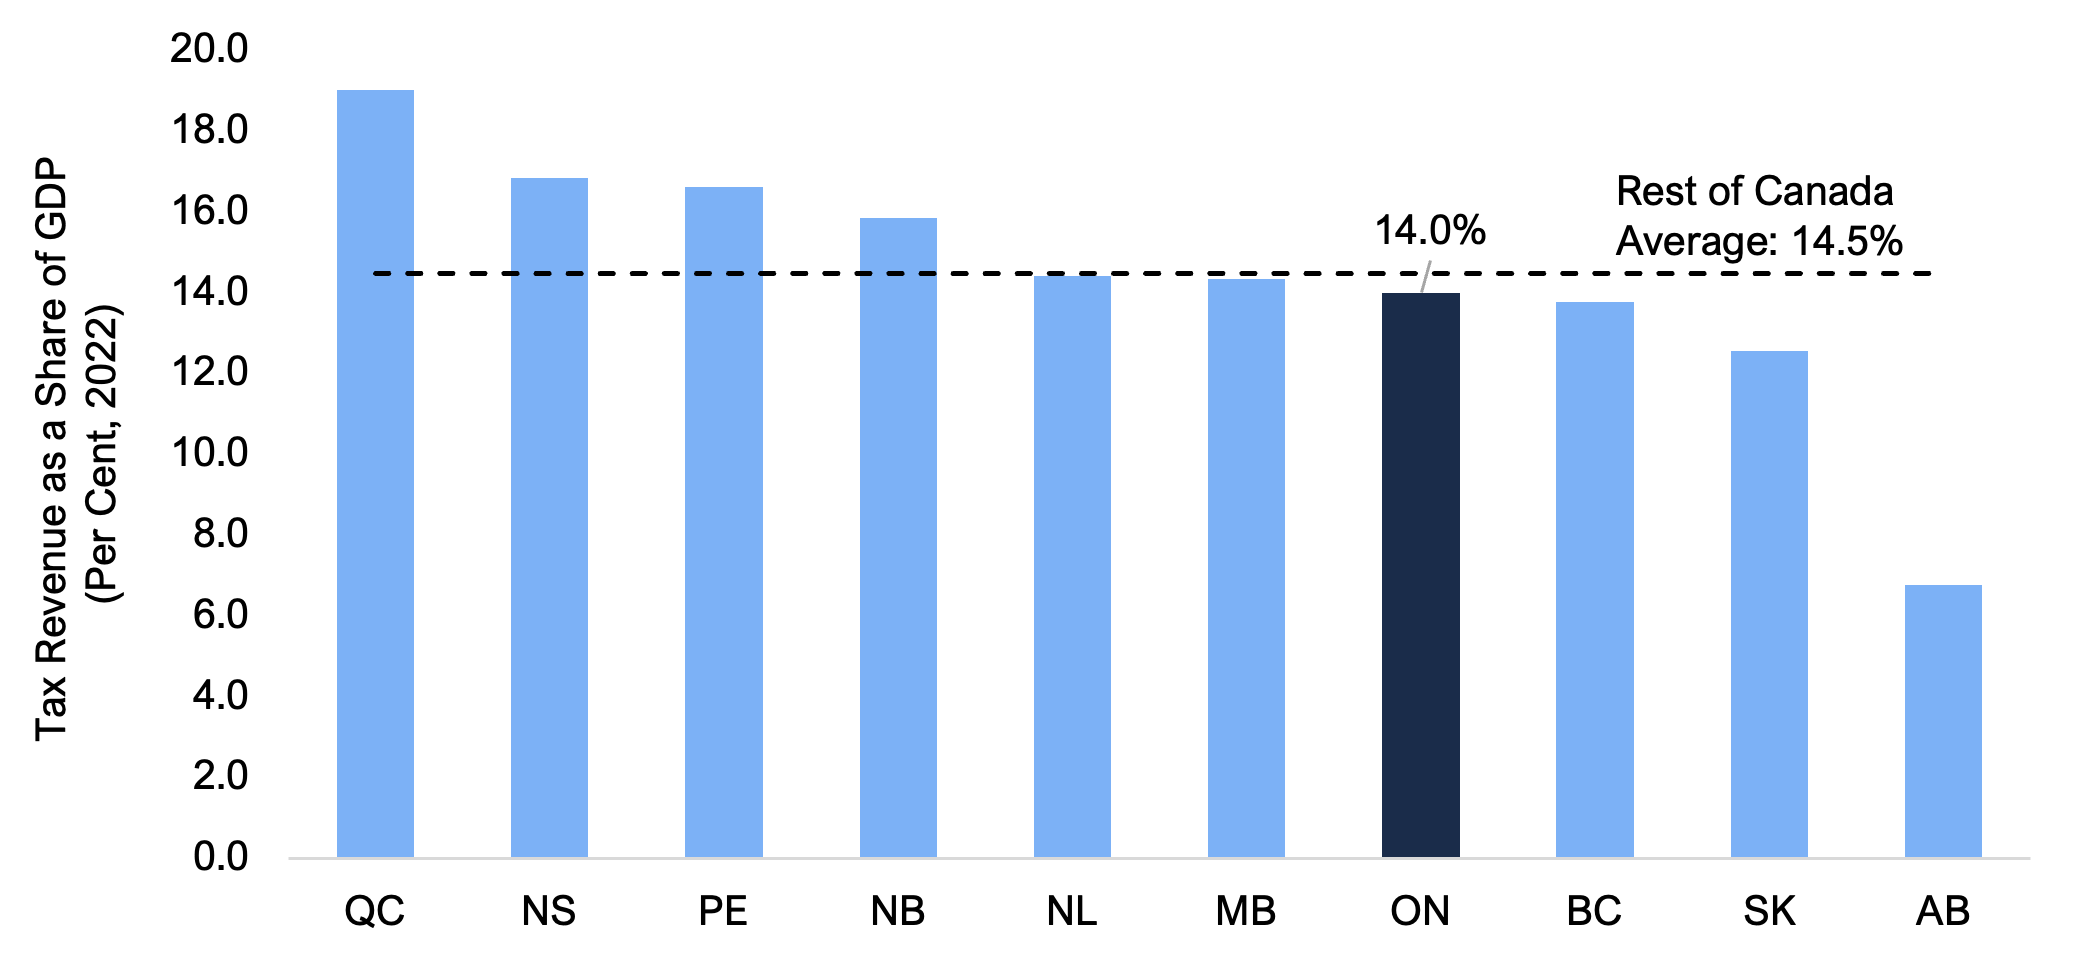
- Ontario collected $9,687 in tax revenue per capita, $92 (0.9 per cent) below the rest of Canada average of $9,779. Measured against economic activity, Ontario’s tax revenue (14.0 per cent of GDP) was also below the average of the other provinces (14.5 per cent of GDP).
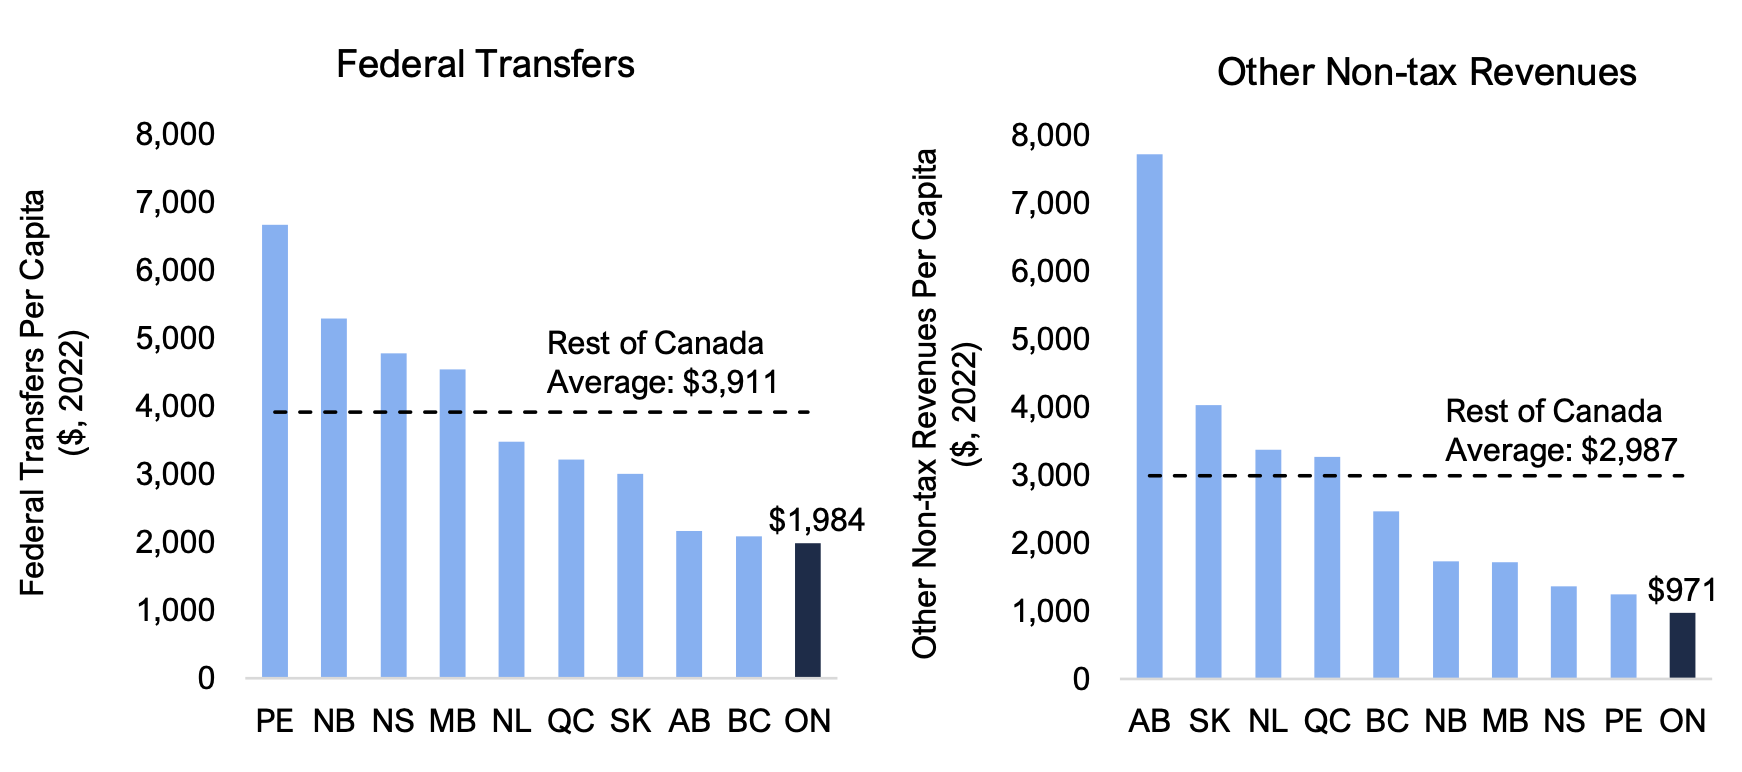
- Ontario received $1,984 per capita in federal transfers, the lowest among the provinces and $1,927 (49.3 per cent) below the rest of Canada average ($3,911).
- Ontario collected $971 per capita in other non-tax revenue, the lowest among the provinces and $2,015 (67.5 per cent) below the rest of Canada average ($2,987).
- Since 2008, Ontario has consistently collected the lowest or second lowest revenue per capita among the provinces.
Ontario’s total spending per capita was the lowest in Canada
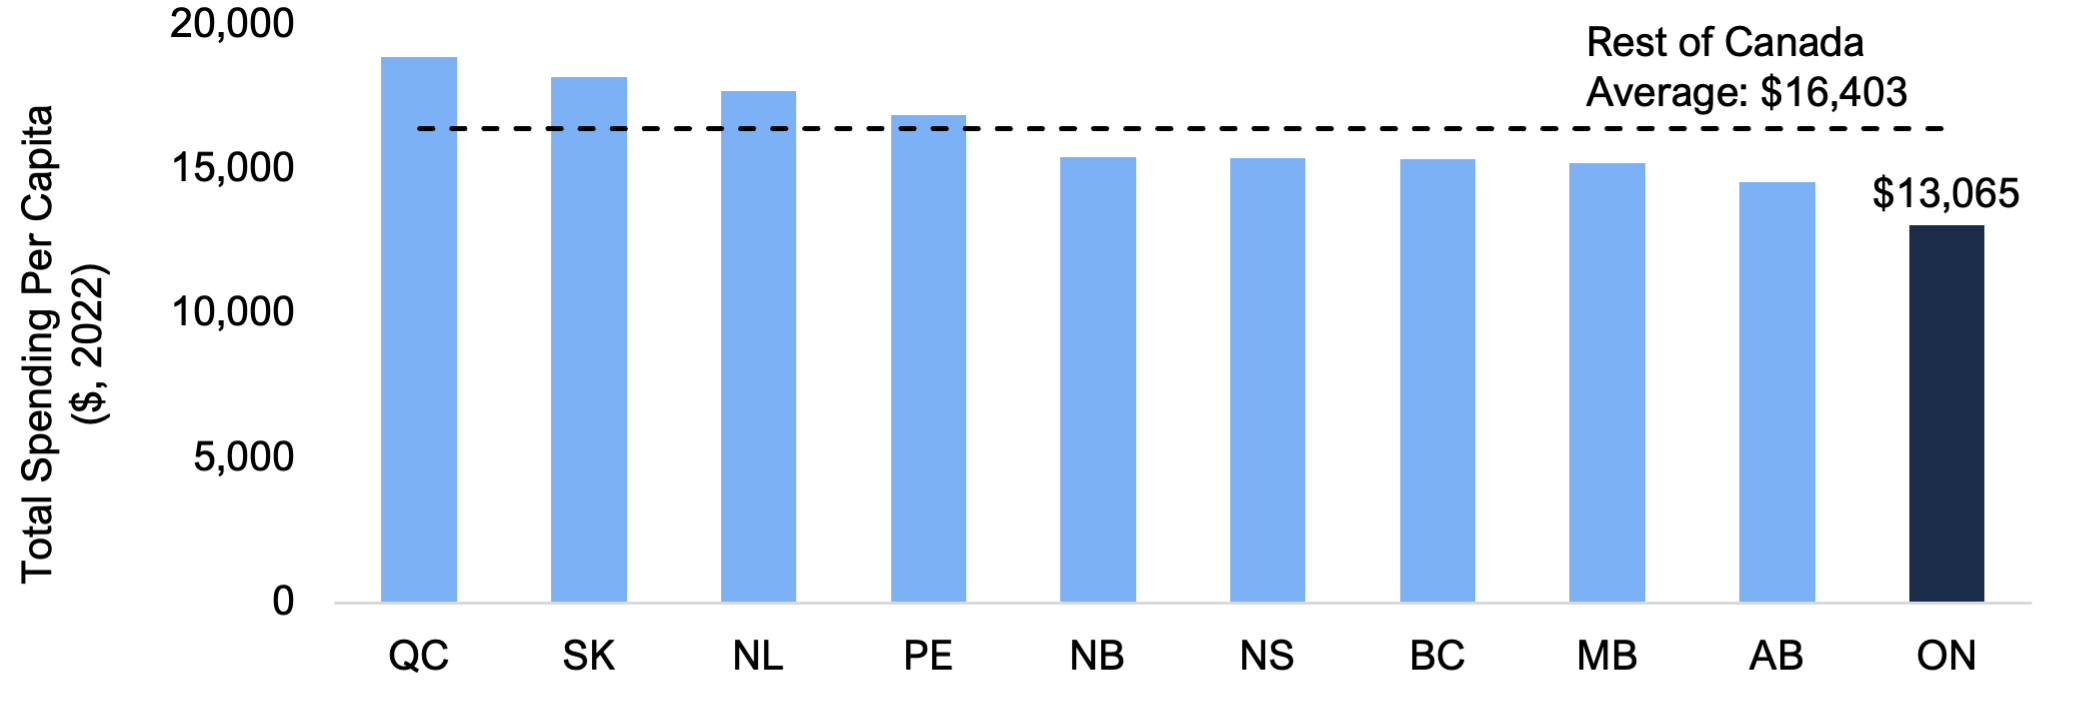
- In 2022, Ontario’s total spending per capita of $13,065 was the lowest among the provinces and $3,338 (20.4 per cent) below the rest of Canada average ($16,403).
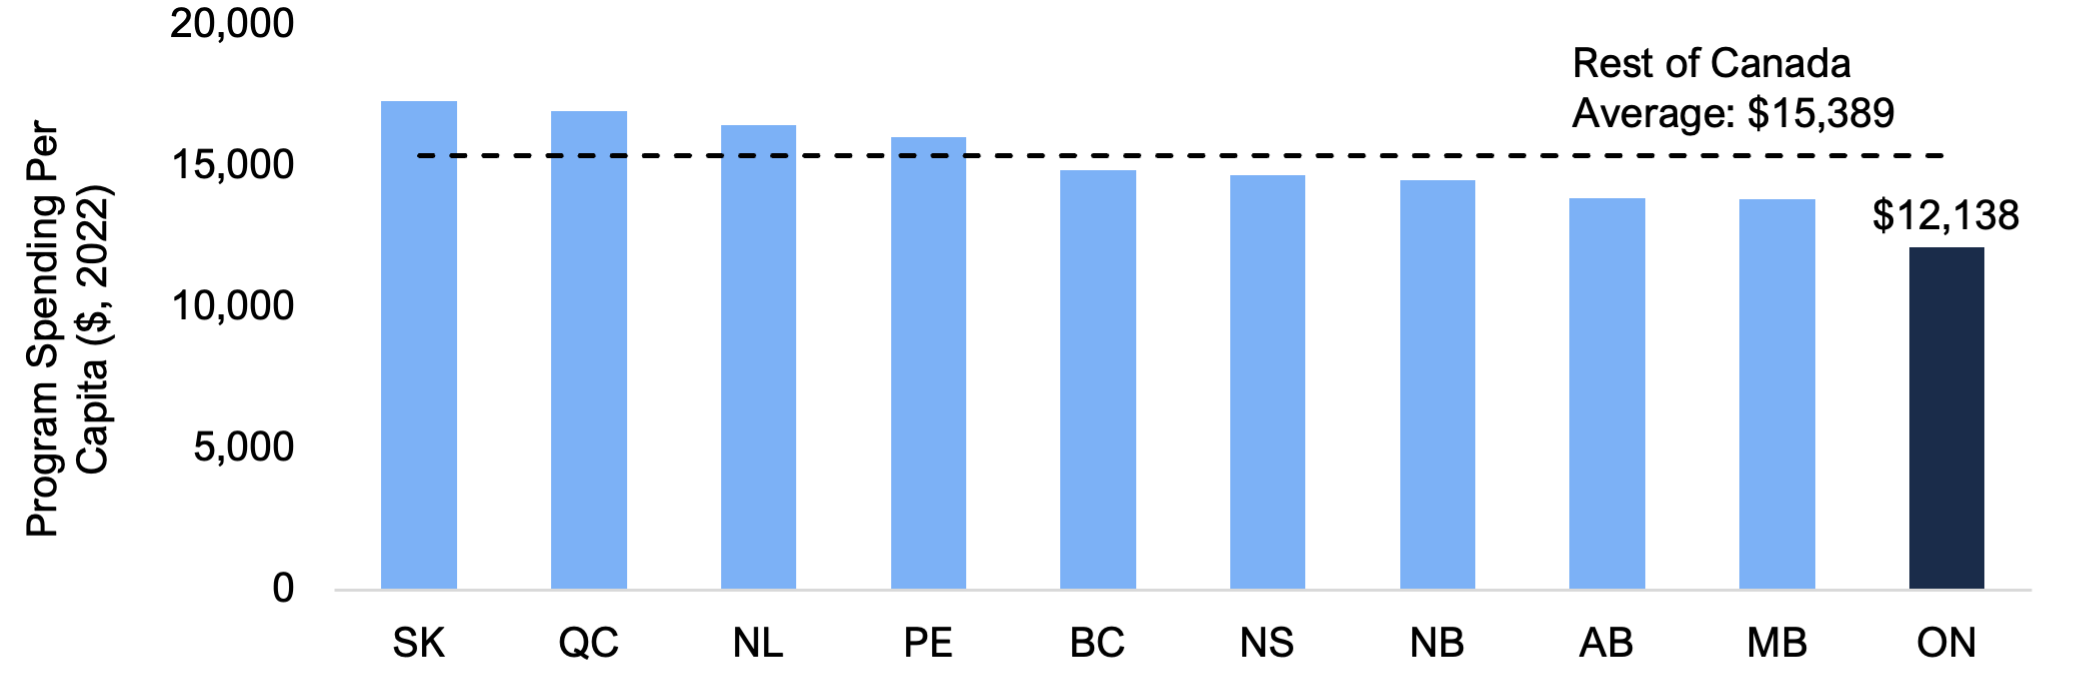
- Ontario’s program spending of $12,138 per capita in 2022 was the lowest among the provinces and $3,251 (21.1 per cent) lower than the rest of Canada average ($15,389), reflecting relatively low spending on health and all other programs per capita.
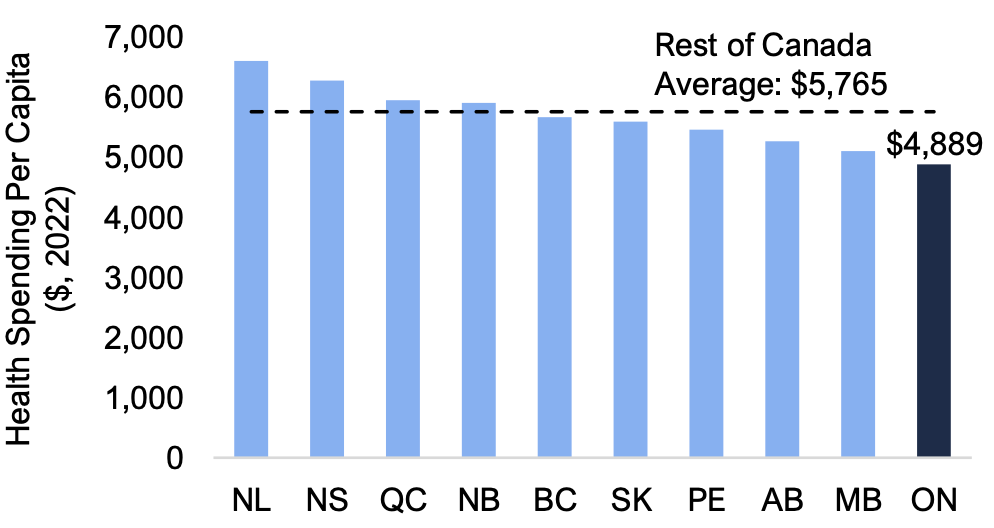
- Health spending per capita in Ontario was $4,889 in 2022, the lowest in Canada and $876 (15.2 per cent) below the average of the other provinces.
- Education spending in Ontario, which includes spending on primary, secondary and postsecondary education programs, was $2,843 per capita in 2022, the fifth highest among the provinces and $71 (2.6 per cent) above the average of the other provinces.
- All other program spending per capita in Ontario was $4,406 in 2022, the lowest among the provinces and $2,446 (35.7 per cent) below the average in the rest of Canada.
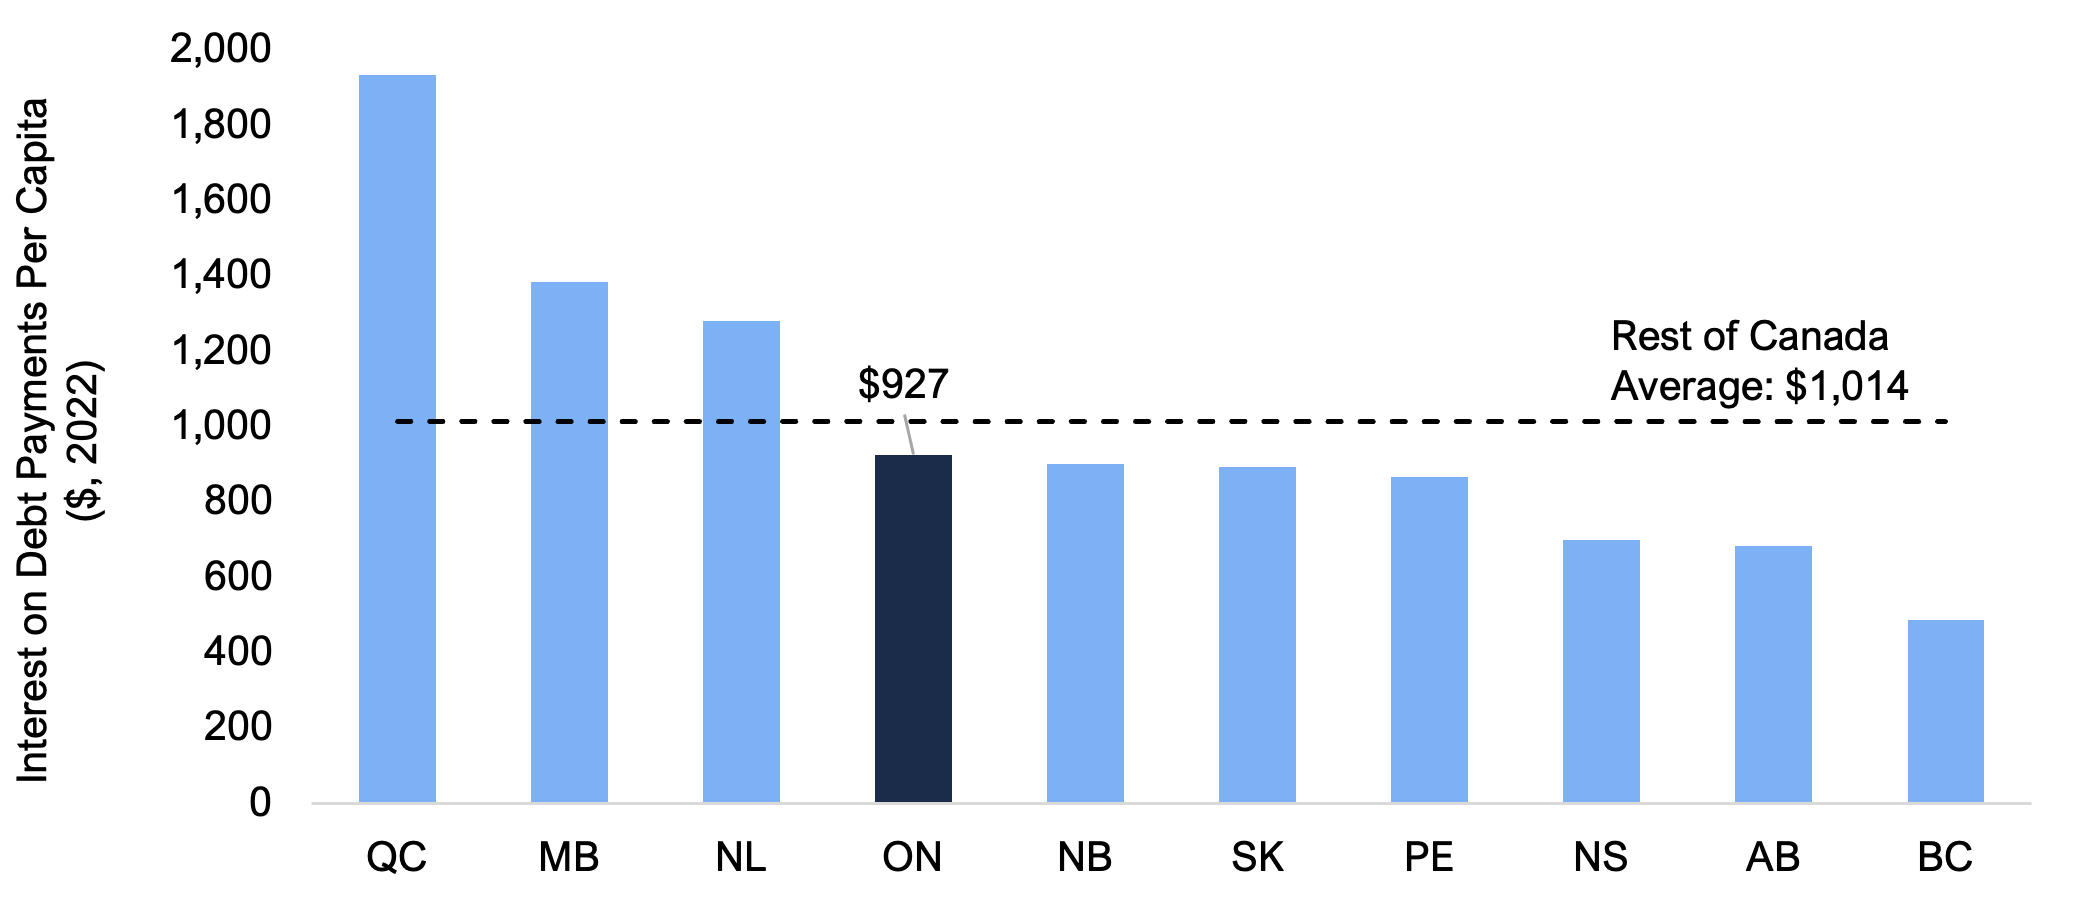
- Interest on debt payments were $927 per capita in 2022, the fourth highest among the provinces but $88 (8.6 per cent) below the rest of Canada average ($1,014), reflecting Ontario’s below-average effective interest rate on its debt.
- Since 2008, Ontario’s total spending per capita has consistently ranked at or near the lowest among the provinces.
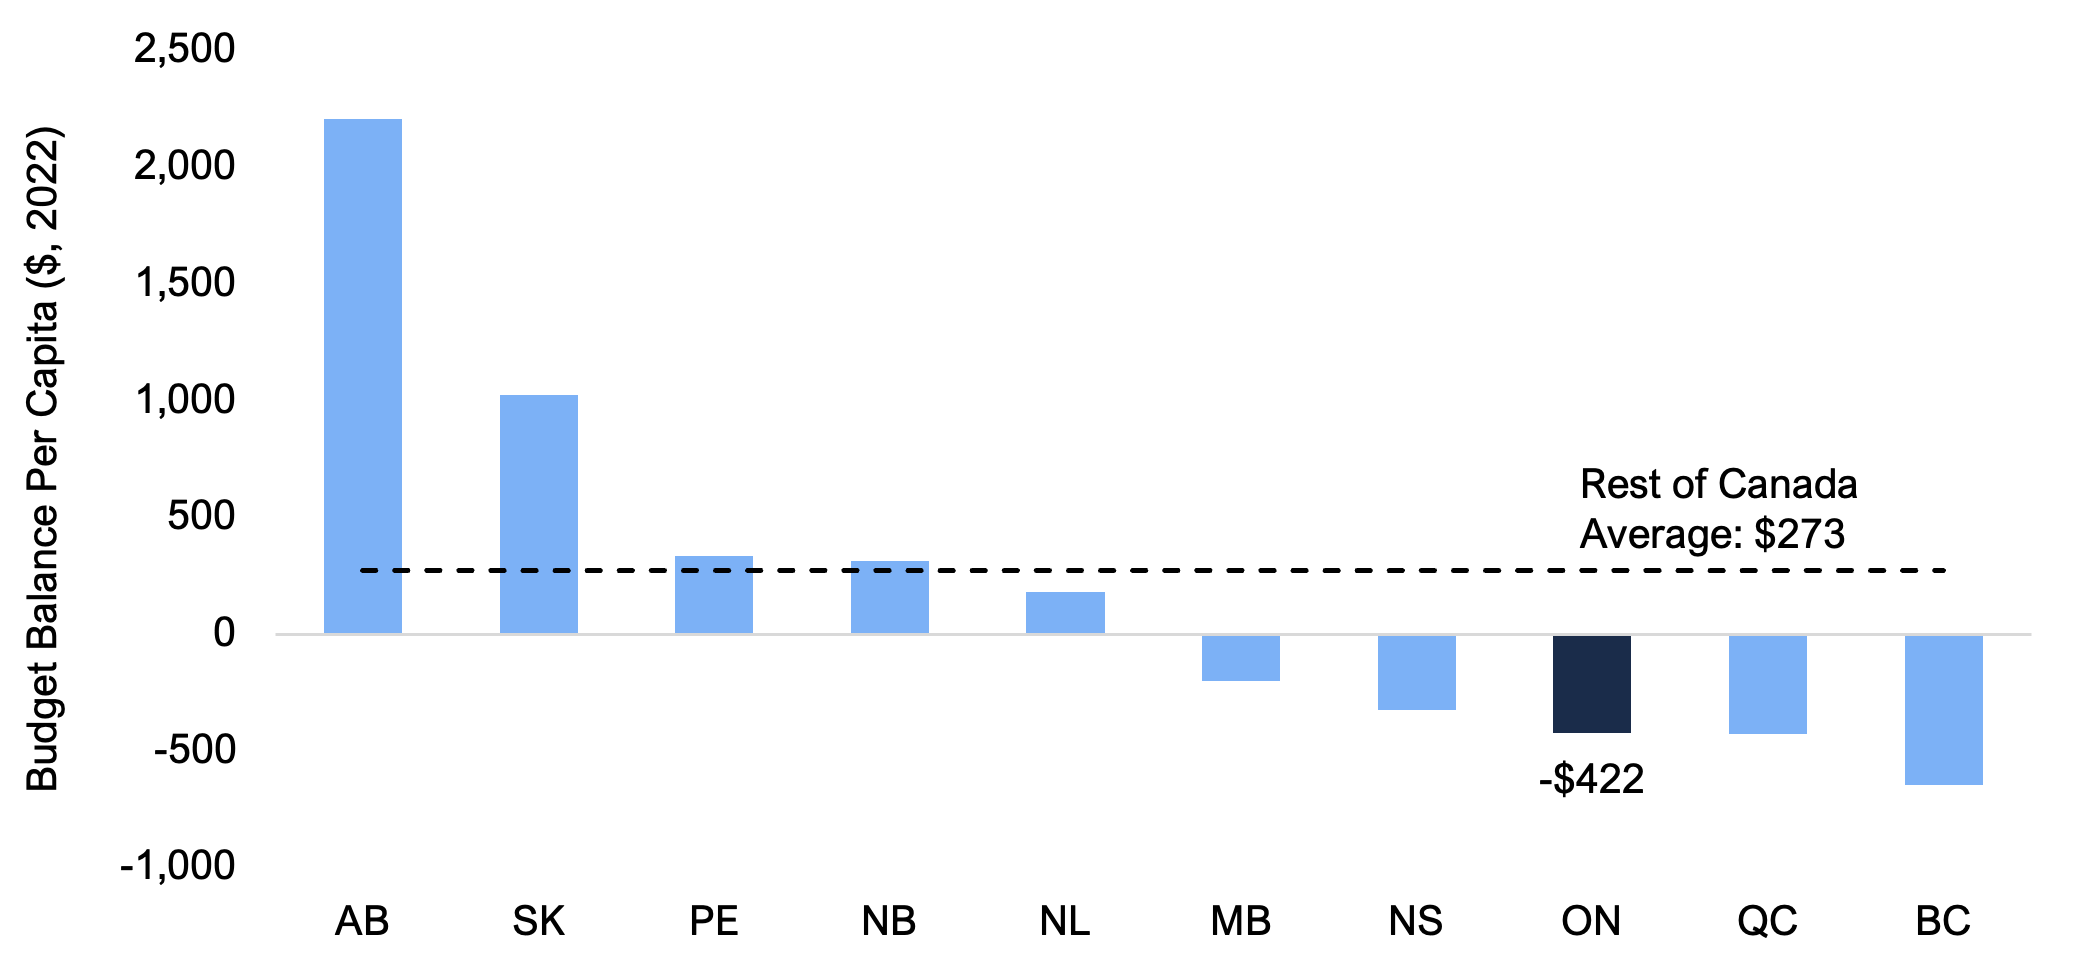
Ontario was one of five provinces to record a deficit in 2022
- According to the GFS, Ontario recorded a budget deficit of $422 per capita in 2022. Excluding Ontario, the average budget position of the other provinces was a $273 per capita surplus.
- Alberta, Saskatchewan, Prince Edward Island, New Brunswick, and Newfoundland and Labrador recorded budget surpluses in 2022, while Manitoba, Nova Scotia, Ontario, Quebec and British Columbia recorded budget deficits.
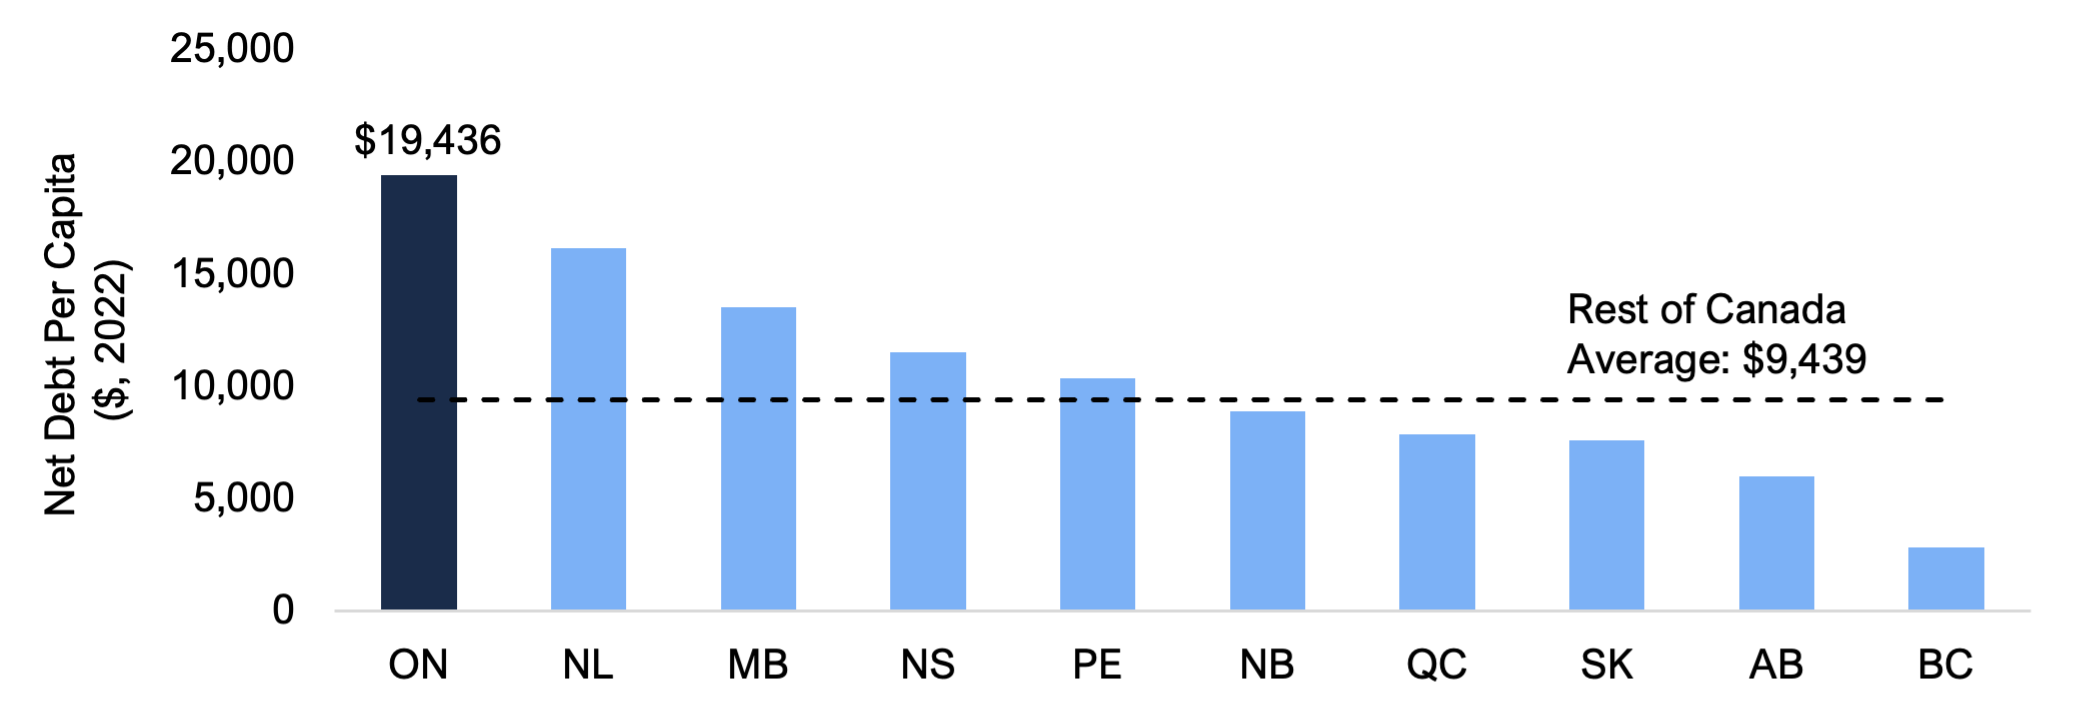
Ontario’s debt burden per capita was the highest in Canada
- Ontario’s net debt per capita was $19,436 in 2022, the highest among the provinces and $9,997 (105.9 per cent) above the rest of Canada average ($9,439). Ontario’s higher relative net debt results from its frequent budget deficits, which have typically been larger than the average budget deficit in the rest of Canada.
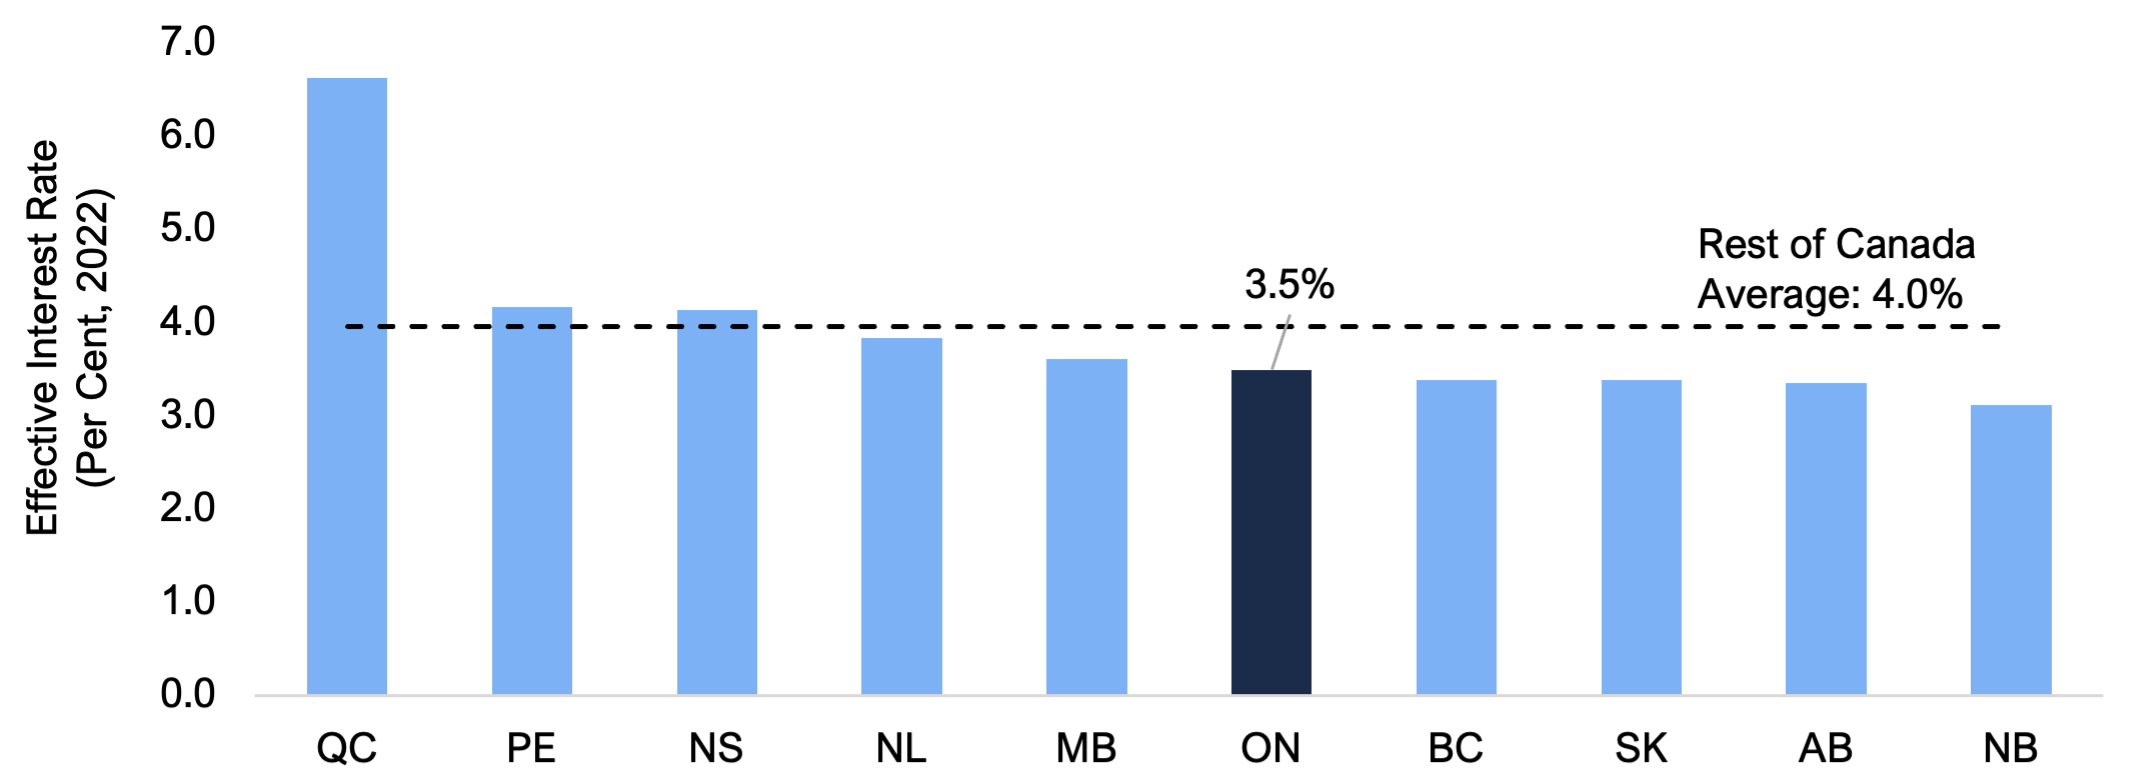
- Despite its high debt burden, Ontario had a below-average effective interest rate of 3.5 per cent in 2022, which helped limit the impact of the province’s relatively high debt levels on the size of its interest on debt payments.
Introduction and Background
This report provides a comparison of Ontario government revenues, spending, budget balance and net debt with the other Canadian provinces based on Statistics Canada’s Government Finance Statistics (GFS). The GFS data, published since 2008,[1] adjust for differences in each province’s organizational structure and accounting practices, providing a standardized framework for comparing provincial budgetary results.[2]
This report reviews financial information for the 2022-23 fiscal year, which is referred to as 2022 throughout the report. The report provides interprovincial comparisons for:
- revenues, including tax revenues, federal transfers and other non-tax revenues;
- spending, including program spending and interest on debt payments;
- budget balances; and
- net debt and effective interest rates.
Methodology
This report uses data from the provincial and territorial governments GFS Tables 10-10-0017-01 and 10-10-0024-01. Adjustments to include school boards' property tax revenue and tuition fees generated by colleges and school boards were also made to better align with how Ontario presents its financial statements. To ensure comparability among provinces, the same adjustments were made to all provinces.
Data are presented primarily on a per capita basis to account for the impact of the size of each province’s population on financial results. Appendix A provides per capita results shown throughout this report as well as financial results as a share of economic activity.
For comparison purposes, Appendix B presents the provincial financial results from Appendix A combined with the financial results of municipal and local governments, health and social service institutions, school boards, colleges and universities. On this basis, Ontario’s relative financial performance compared to other provinces is broadly similar to its provincial performance presented throughout this report.
Revenues
Canadian provinces receive revenue from taxation, federal transfers and other non-tax sources. In 2022, Ontario generated $12,643 in total revenue per person, the lowest amount among the provinces and $4,034 (24.2 per cent) below the average for the rest of Canada ($16,676). Ontario’s low revenue per capita relative to other provinces reflects Ontario’s below-average federal transfers and other non-tax revenues. Since 2008, Ontario’s total revenue per capita has consistently ranked lowest or second lowest among the provinces.
Figure 1 Ontario’s revenue per capita was the lowest in Canada in 2022
Sources: Statistics Canada Tables 10-10-0017-01, 17-10-0005-01, 10-10-0019-01 and FAO
Tax revenues
Ontario received $9,687 in tax revenue per capita in 2022, modestly below the rest of Canada average of $9,779. Saskatchewan collected the highest tax revenue per capita ($12,197), while Alberta collected the lowest ($6,891). Ontario has historically had relatively higher tax revenue per capita compared to the rest of Canada average, however, slow tax revenue per capita growth in Ontario in 2022 (+1.5 per cent) compared to the rest of Canada (+13.7 per cent) brought Ontario below the rest of Canada average.[3]
Figure 2 Ontario’s tax revenue per capita was below the average of other provinces in 2022
Sources: Statistics Canada Tables 10-10-0017-01, 17-10-0005-01, 10-10-0019-01 and FAO
When measured against the province’s economic output, Ontario’s tax revenues represented 14.0 per cent of Gross Domestic Product (GDP) in 2022, below the 14.5 per cent average among the other provinces. On this basis, Ontario’s tax revenues were 5.0 percentage points below Quebec (the highest ranked province at 19.0 per cent of GDP) and 7.2 percentage points above Alberta (the lowest ranked province at 6.8 per cent of GDP).
Figure 3 Ontario’s tax revenue as a share of GDP was below the average of other provinces in 2022
Sources: Statistics Canada Tables 10-10-0017-01, 36-10-0222-01, 10-10-0019-01 and FAO
Dividing tax revenue categories by their corresponding economic bases provides an indication of the amount of tax revenue collected relative to economic activity. The economic bases of personal income tax, corporations tax and sales tax revenues are labour income, corporate profits and household spending, respectively.[4] While these economic bases are not complete measures of the actual tax base, they can be used as proxies to evaluate each province on a common basis.[5]
- Personal income tax revenue represented 8.7 per cent of labour income in Ontario, the second lowest among the provinces and below the rest of Canada average of 11.0 per cent.
- Corporations tax revenue represented 20.2 per cent of corporate profits in Ontario, the second highest among the provinces and higher than the rest of Canada average of 16.1 per cent.
- Sales tax revenue represented 6.6 per cent of household spending in Ontario, the sixth highest among the provinces and above the rest of Canada average of 5.9 per cent.
- All other tax revenue represented 3.3 per cent of GDP[6] in Ontario, the fourth lowest among the provinces and below the rest of Canada average of 3.7 per cent.
Figure 4 Ontario’s tax revenue as a share of economic bases compared to the average of other provinces in 2022
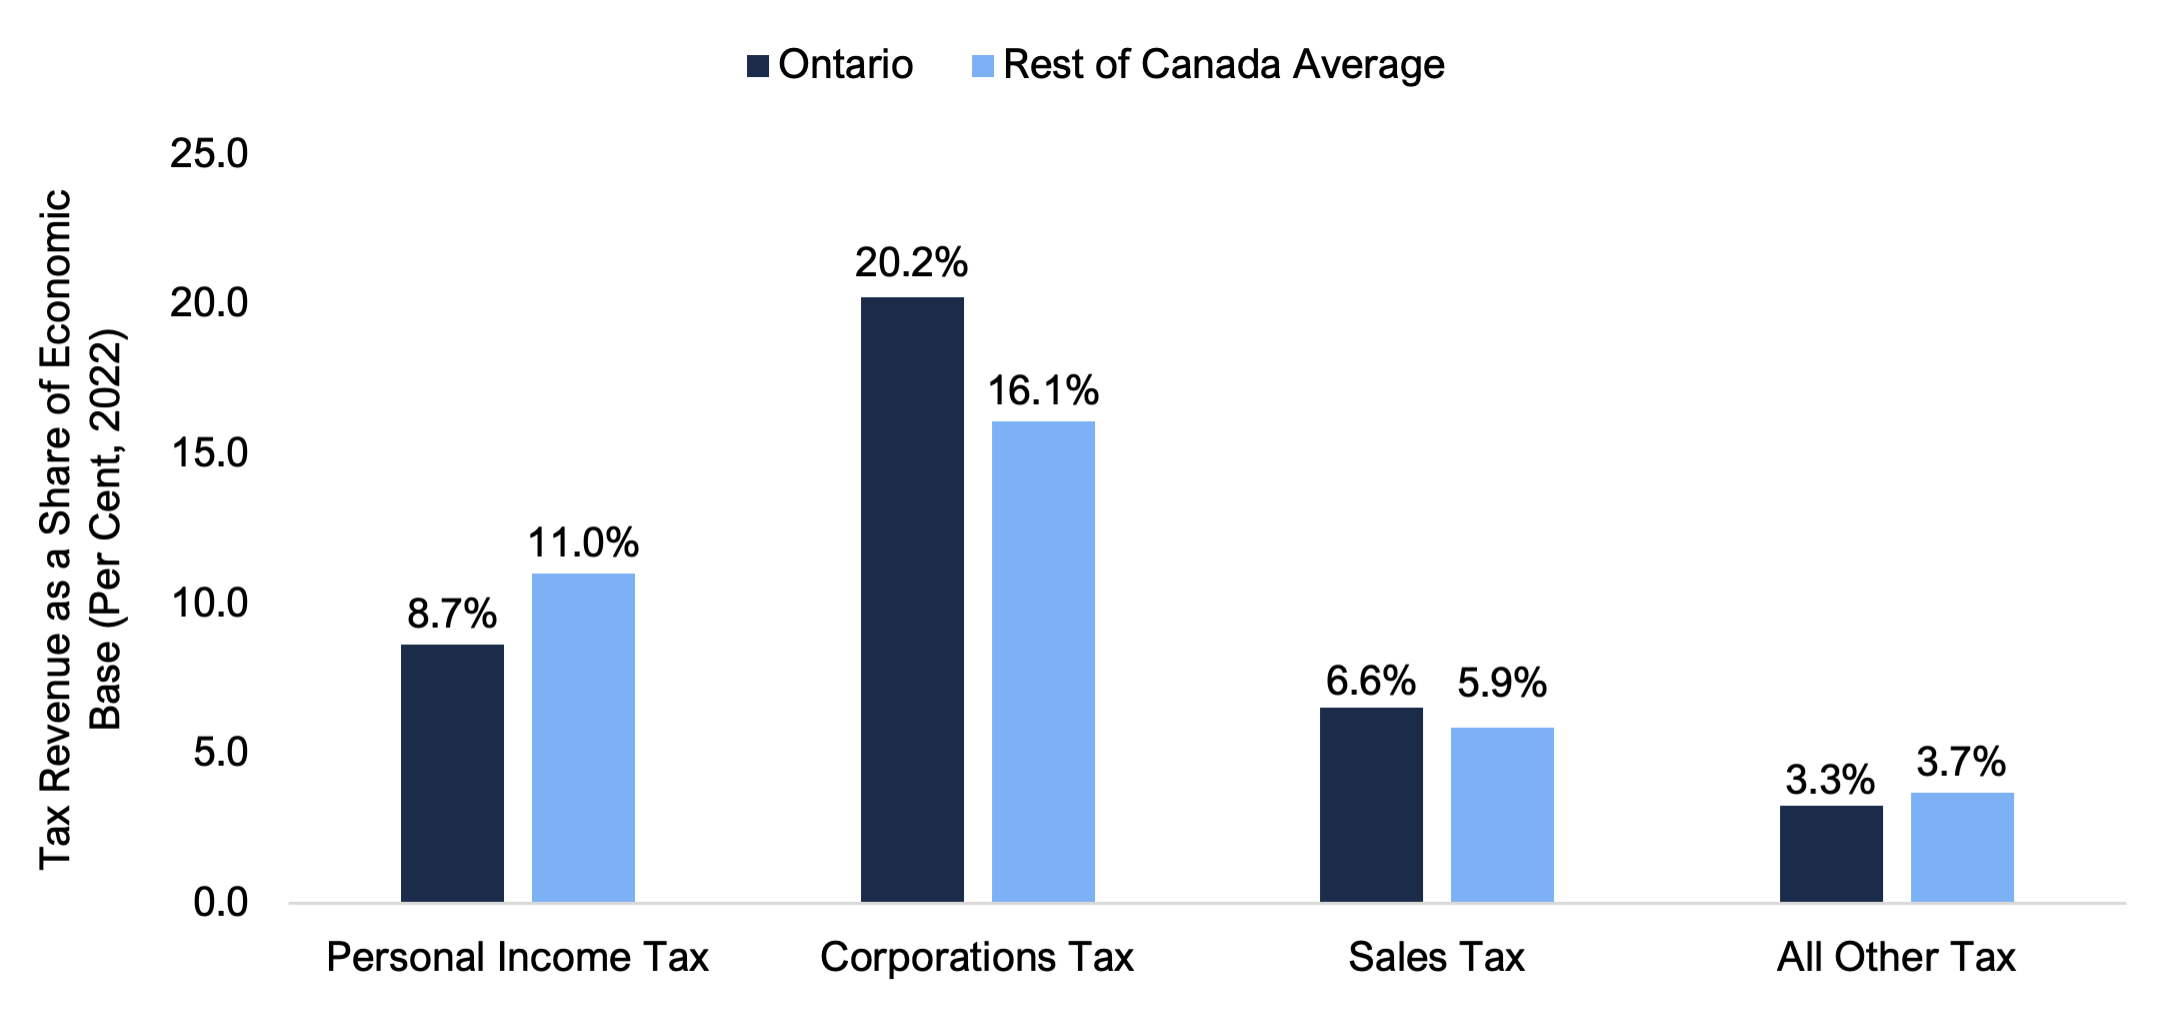
Note: The economic bases of personal income tax, corporations tax and sales tax revenues are labour income (total compensation of employees), corporate profits (net operating surplus of corporations) and household spending (household final consumption expenditure), respectively. All other tax revenue is compared against overall economic activity as measured by GDP.
Sources: Statistics Canada Tables 10-10-0017-01, 36-10-0221-01, 36-10-0222-01, 10-10-0019-01 and FAO
Although these shares vary over time, since 2008 Ontario’s tax revenues as shares of their economic base for personal income tax and all other tax revenue have generally been below the average in the rest of Canada, while corporations tax and sales tax shares have generally been above the average in the rest of Canada.
Federal transfers and other non-tax revenues
Provincial governments receive transfers from the federal government through the Canada Health Transfer, Canada Social Transfer, the Equalization Program and other federal transfer programs, including those for infrastructure and labour market programs. In 2022, Ontario received $1,984 per capita in federal transfers, the lowest among the provinces and $1,927 (49.3 per cent) below the rest of Canada average ($3,911). Ontario’s lower federal transfers in 2022 reflect its lack of Equalization Program payments[7] and its below-average revenue from other federal transfer programs.[8]
Provinces also collect revenues from other non-tax sources,[9] such as resource royalties, service fees, fines and penalties, among others. Ontario collected the lowest amount of other non-tax revenues in the country ($971 per capita in Ontario versus the $2,987 average in the rest of Canada), largely reflecting its limited resource royalties[10] and lower revenues generated from the Province’s ownership of assets and from the sale of goods and services.[11]
Figure 5 Ontario had the lowest federal transfers and other non-tax revenues per capita in 2022
Sources: Statistics Canada Tables 10-10-0017-01, 17-10-0005-01, 10-10-0019-01 and FAO.
Spending
Canadian provinces’ spending includes expenditures on programs and interest on debt payments. In 2022, total spending per capita in Ontario was $13,065, the lowest among the provinces and $3,338 (20.4 per cent) lower than the rest of Canada average ($16,403). Ontario’s relatively low level of total spending reflects its low program spending per capita and below-average interest on debt payments. Since 2008, Ontario’s spending per capita has consistently ranked at or near the lowest among the provinces.
Figure 6 Ontario’s total spending per capita was the lowest in Canada in 2022
Sources: Statistics Canada Tables 10-10-0017-01, 17-10-0005-01, 10-10-0019-01 and FAO
Program spending
In 2022, program spending per capita in Ontario was $12,138, the lowest among the provinces and $3,251 (21.1 per cent) lower than the rest of Canada average ($15,389). Since 2008, Ontario’s program spending per capita has consistently ranked at or near the lowest among the provinces. Examining the causes of differences in rankings between provinces is beyond the scope of this report, but could reflect differences in economies of scale, the quality or quantity of services provided and the provinces’ different age structures, among other factors.
Figure 7 Ontario’s program spending per capita was the lowest in Canada in 2022
Sources: Statistics Canada Tables 10-10-0017-01,17-10-0005-01, 10-10-0019-01 and FAO
Ontario’s low level of program spending results from lower-than-average health and all other program spending, which outweighs above-average per capita spending on education.
Health
- Health spending includes hospital and outpatient services, medical products and equipment, and public health services, among others.
- Health spending per capita in Ontario was $4,889 in 2022, the lowest in Canada and $876 (15.2 per cent) below the average of the other provinces.
- Since 2008, Ontario’s health spending per capita has consistently ranked at or near the lowest in Canada.
Education
- Education spending includes primary, secondary and postsecondary expenses, among others.
- Education spending in Ontario was $2,843 per capita in 2022, the fifth highest among the provinces and $71 (2.6 per cent) above the average of the other provinces.
- Since 2010, Ontario has consistently had above-average education spending.
Figure 9 Education spending in 2022
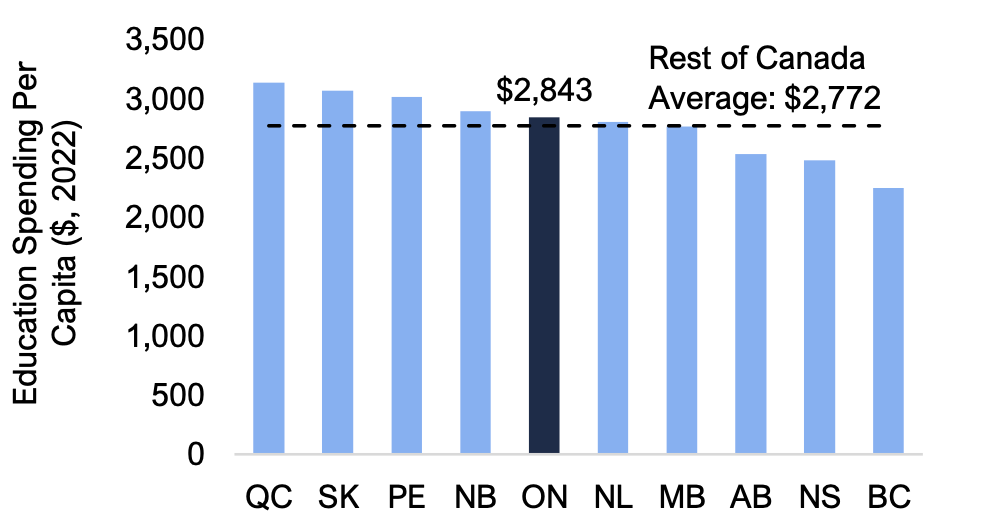
Note: Education spending includes primary, secondary and postsecondary expenses, among others.
Sources: Statistics Canada Tables 10-10-0024-01, 17-10-0005-01, 10-10-0019-01 and FAO.
All other program spending
- All other program spending includes expenses for police services, prisons, transportation, housing, old age, unemployment, sickness and disability, and children services, among others.
- All other program spending per capita in Ontario was $4,406 in 2022, the lowest among the provinces and $2,446 (35.7 per cent) below the average in the rest of Canada.
- Since 2008, Ontario has consistently spent the lowest or second lowest per capita on all other programs.
Figure 10 All other program spending in 2022
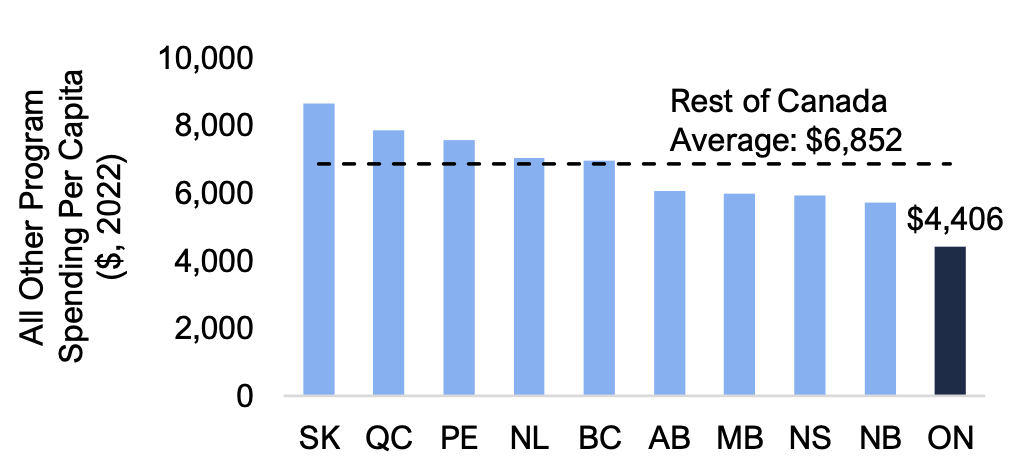
Note: All other program spending is calculated by subtracting health and education expenses from overall program expense.
Sources: Statistics Canada Tables 10-10-0024-01, 17-10-0005-01, 10-10-0019-01 and FAO.
Interest on debt payments
In 2022, interest on debt payments per capita in Ontario were $927, the fourth highest among the provinces. Over the last five years, Ontario’s interest on debt payments per capita have increased at an average annual rate of 1.6 per cent, in line with the increase in the rest of Canada average of 1.5 per cent. However, due to declines in the interest on debt payments per capita of some other provinces, Ontario’s ranking has changed from seventh highest in 2017[12] to its current ranking of fourth highest.
Although Ontario is the most highly indebted province, its interest on debt payments per capita of $927 were $88 (8.6 per cent) lower than the rest of Canada average ($1,014). The below-average interest on debt payments per capita reflect Ontario’s lower-than-average borrowing rates compared to the other provinces (see discussion below for more information on net debt and effective interest rates).
Figure 11 Ontario’s interest on debt payments per capita below the average of other provinces in 2022
Sources: Statistics Canada Tables 10-10-0017-01,17-10-0005-01 and FAO
Budget Balance
According to the GFS, Ontario recorded a budget deficit of $422 per person in 2022, the third largest deficit among the provinces. British Columbia, Quebec, Nova Scotia and Manitoba also had deficits, while the remaining provinces recorded surpluses.
Excluding Ontario, the average budget position of the other provinces was a $273 per capita surplus[13] in 2022, a difference of $695 from Ontario’s $422 per capita deficit. Since 2009, Ontario has generally had larger per capita deficits than the rest of Canada, except for the 2015 to 2017 period.[14]
Figure 12 Ontario’s budget position was below the average of other provinces in 2022
Sources: Statistics Canada Tables 10-10-0017-01,17-10-0005-01 and FAO
Net Debt
Ontario’s net debt per capita was $19,436 in 2022, the highest among the provinces and $9,997 (105.9 per cent) above the rest of Canada average ($9,439). Apart from 2008, Ontario has consistently had the highest or second highest net debt per capita. Ontario’s relatively high net debt levels compared to other provinces reflect its frequent budget deficits, which have typically been larger than the average budget deficit in the rest of Canada.
Figure 13 Ontario’s net debt per capita above the rest of Canada average in 2022
Sources: Statistics Canada Tables 10-10-0017-01,17-10-0005-01, 36-10-0222-01 and FAO
Despite Ontario's relatively higher debt levels, interest on debt payments are partially mitigated by the Province’s below-average borrowing rates. Ontario’s effective interest rate on debt[15] was 3.5 per cent in 2022, below the 4.0 per cent average effective interest rate of the other provinces.[16]
Figure 14 Ontario’s effective interest rate on debt was below the rest of Canada average in 2022
Sources: Statistics Canada Tables 10-10-0017-01 and FAO.
Appendix A – Provincial Government Finance Statistics
The tables in Appendix A reflect financial information published in the provincial GFS tables and presented throughout this report. Adjustments to include school boards' property tax revenue and tuition fees generated by colleges and school boards were also made to better align with how Ontario presents its financial statements. To ensure comparability among provinces, the same adjustments were made to all provinces.
| NL | PE | NS | NB | QC | ON | MB | SK | AB | BC | Provincial Average | Rest of Canada Average* | ||||||||||||||||||||
|---|---|---|---|---|---|---|---|---|---|---|---|---|---|---|---|---|---|---|---|---|---|---|---|---|---|---|---|---|---|---|---|
| Budget Balance | 179 | 335 | -324 | 311 | -430 | -422 | -200 | 1,026 | 2,208 | -646 | 204 | 273 | |||||||||||||||||||
| Net Debt | 16,195 | 10,390 | 11,535 | 8,902 | 7,899 | 19,436 | 13,574 | 7,605 | 6,007 | 2,847 | 10,439 | 9,439 | |||||||||||||||||||
| Total Revenue | 17,895 | 17,231 | 15,065 | 15,730 | 18,447 | 12,643 | 15,032 | 19,215 | 16,762 | 14,711 | 16,273 | 16,676 | |||||||||||||||||||
| Taxes | 11,050 | 9,313 | 8,937 | 8,711 | 11,965 | 9,687 | 8,784 | 12,197 | 6,891 | 10,163 | 9,770 | 9,779 | |||||||||||||||||||
| Federal Transfers | 3,475 | 6,669 | 4,772 | 5,290 | 3,216 | 1,984 | 4,537 | 2,998 | 2,159 | 2,083 | 3,718 | 3,911 | |||||||||||||||||||
| Other Non-tax Revenue | 3,371 | 1,249 | 1,356 | 1,728 | 3,266 | 971 | 1,711 | 4,020 | 7,712 | 2,465 | 2,785 | 2,987 | |||||||||||||||||||
| Total Spending | 17,718 | 16,896 | 15,388 | 15,418 | 18,877 | 13,065 | 15,232 | 18,189 | 14,554 | 15,357 | 16,070 | 16,403 | |||||||||||||||||||
| Program Spending | 16,437 | 16,029 | 14,689 | 14,518 | 16,943 | 12,138 | 13,847 | 17,295 | 13,871 | 14,870 | 15,064 | 15,389 | |||||||||||||||||||
| Health** | 6,605 | 5,461 | 6,291 | 5,906 | 5,953 | 4,889 | 5,117 | 5,596 | 5,279 | 5,675 | 5,677 | 5,765 | |||||||||||||||||||
| Education** | 2,804 | 3,014 | 2,479 | 2,895 | 3,136 | 2,843 | 2,766 | 3,071 | 2,536 | 2,247 | 2,779 | 2,772 | |||||||||||||||||||
| All Other Program Spending** | 7,028 | 7,554 | 5,919 | 5,718 | 7,855 | 4,406 | 5,965 | 8,628 | 6,056 | 6,948 | 6,608 | 6,852 | |||||||||||||||||||
| Interest on Debt Payments | 1,281 | 867 | 699 | 900 | 1,934 | 927 | 1,385 | 894 | 683 | 487 | 1,006 | 1,014 | |||||||||||||||||||
| NL | PE | NS | NB | QC | ON | MB | SK | AB | BC | Provincial Average | Rest of Canada Average* | ||||
|---|---|---|---|---|---|---|---|---|---|---|---|---|---|---|---|
| Budget Balance | 0.2 | 0.6 | -0.6 | 0.6 | -0.7 | -0.6 | -0.3 | 1.1 | 2.2 | -0.9 | 0.2 | 0.2 | |||
| Net Debt | 21.1 | 18.5 | 21.8 | 16.2 | 12.6 | 28.1 | 22.2 | 7.8 | 5.9 | 3.9 | 15.8 | 14.4 | |||
| Total Revenue | 23.4 | 30.7 | 28.4 | 28.6 | 29.3 | 18.3 | 24.6 | 19.8 | 16.5 | 19.9 | 23.9 | 24.6 | |||
| Taxes | 14.4 | 16.6 | 16.9 | 15.8 | 19.0 | 14.0 | 14.3 | 12.6 | 6.8 | 13.8 | 14.4 | 14.5 | |||
| Federal Transfers | 4.5 | 11.9 | 9.0 | 9.6 | 5.1 | 2.9 | 7.4 | 3.1 | 2.1 | 2.8 | 5.8 | 6.2 | |||
| Other Non-tax Revenue | 4.4 | 2.2 | 2.6 | 3.1 | 5.2 | 1.4 | 2.8 | 4.1 | 7.6 | 3.3 | 3.7 | 3.9 | |||
| Total Spending | 23.1 | 30.1 | 29.0 | 28.0 | 30.0 | 18.9 | 24.9 | 18.7 | 14.3 | 20.8 | 23.8 | 24.3 | |||
| Program Spending | 21.5 | 28.6 | 27.7 | 26.4 | 26.9 | 17.5 | 22.6 | 17.8 | 13.6 | 20.2 | 22.3 | 22.8 | |||
| Health** | 8.6 | 9.7 | 11.9 | 10.7 | 9.5 | 7.1 | 8.4 | 5.8 | 5.2 | 7.7 | 8.4 | 8.6 | |||
| Education** | 3.7 | 5.4 | 4.7 | 5.3 | 5.0 | 4.1 | 4.5 | 3.2 | 2.5 | 3.0 | 4.1 | 4.1 | |||
| All Other Program Spending** | 9.2 | 13.5 | 11.2 | 10.4 | 12.5 | 6.4 | 9.7 | 8.9 | 5.9 | 9.4 | 9.7 | 10.1 | |||
| Interest on Debt Payments | 1.7 | 1.5 | 1.3 | 1.6 | 3.1 | 1.3 | 2.3 | 0.9 | 0.7 | 0.7 | 1.5 | 1.5 | |||
| NL | PE | NS | NB | QC | ON | MB | SK | AB | BC | Provincial Average | Rest of Canada Average* | ||||
|---|---|---|---|---|---|---|---|---|---|---|---|---|---|---|---|
| Personal Income Tax | 11.8 | 12.2 | 14.2 | 10.4 | 14.4 | 8.7 | 10.6 | 8.8 | 7.7 | 9.2 | 10.8 | 11.0 | |||
| Corporations Tax | 14.4 | 13.5 | 31.6 | 19.6 | 18.4 | 20.2 | 11.3 | 10.7 | 6.2 | 19.2 | 16.5 | 16.1 | |||
| Sales Tax | 7.9 | 7.6 | 7.0 | 6.6 | 7.7 | 6.6 | 5.3 | 6.5 | 0.0 | 4.3 | 5.9 | 5.9 | |||
| All Other Taxes | 2.9 | 4.4 | 2.6 | 4.0 | 4.6 | 3.3 | 4.7 | 3.8 | 1.9 | 4.3 | 3.7 | 3.7 | |||
Appendix B – Combined Provincial and Municipal Government Finance Statistics
The tables in Appendix B present the provincial financial results in Appendix A combined with the financial results of municipal and local governments, health and social service institutions, school boards, colleges and universities, among others.
| NL | PE | NS | NB | QC | ON | MB | SK | AB | BC | Provincial Average | Rest of Canada Average* | ||||
|---|---|---|---|---|---|---|---|---|---|---|---|---|---|---|---|
| Budget Balance | -105 | 1,232 | 672 | -363 | -235 | -115 | -723 | 1,133 | 1,702 | 1,025 | 422 | 482 | |||
| Net Debt | 17,664 | 10,539 | 9,255 | 8,472 | 15,674 | 17,961 | 15,197 | 5,802 | 5,373 | -1,144 | 10,479 | 9,648 | |||
| Total Revenue | 20,509 | 19,212 | 18,790 | 18,022 | 21,022 | 17,045 | 17,868 | 22,959 | 20,625 | 19,144 | 19,520 | 19,794 | |||
| Taxes | 12,023 | 9,767 | 10,439 | 9,699 | 13,358 | 11,699 | 9,817 | 13,555 | 8,999 | 11,905 | 11,126 | 11,063 | |||
| Federal Transfers | 3,621 | 6,896 | 4,978 | 5,400 | 3,347 | 2,176 | 4,699 | 3,360 | 2,302 | 2,224 | 3,900 | 4,092 | |||
| Other Non-tax Revenue | 4,865 | 2,548 | 3,372 | 2,923 | 4,317 | 3,171 | 3,352 | 6,043 | 9,324 | 5,014 | 4,493 | 4,640 | |||
| Total Spending | 20,614 | 17,980 | 18,119 | 18,385 | 21,256 | 17,160 | 18,592 | 21,826 | 18,924 | 18,119 | 19,097 | 19,313 | |||
| Program Spending | 19,265 | 17,053 | 17,415 | 17,466 | 19,291 | 16,129 | 17,098 | 20,895 | 18,348 | 17,570 | 18,053 | 18,267 | |||
| Health** | 7,143 | 5,383 | 7,001 | 6,869 | 6,148 | 5,379 | 6,319 | 5,837 | 5,538 | 5,859 | 6,147 | 6,233 | |||
| Education** | 2,842 | 3,260 | 3,101 | 3,134 | 2,674 | 2,987 | 2,869 | 3,508 | 3,013 | 2,483 | 2,987 | 2,987 | |||
| All Other Program Spending** | 9,280 | 8,410 | 7,313 | 7,463 | 10,469 | 7,763 | 7,910 | 11,550 | 9,797 | 9,228 | 8,918 | 9,047 | |||
| Interest on Debt Payments | 1,349 | 927 | 704 | 919 | 1,965 | 1,031 | 1,494 | 931 | 575 | 549 | 1,045 | 1,046 | |||
| NL | PE | NS | NB | QC | ON | MB | SK | AB | BC | Provincial Average | Rest of Canada Average* | ||||||||||||||||||||
|---|---|---|---|---|---|---|---|---|---|---|---|---|---|---|---|---|---|---|---|---|---|---|---|---|---|---|---|---|---|---|---|
| Budget Balance | -0.1 | 2.2 | 1.3 | -0.7 | -0.4 | -0.2 | -1.2 | 1.2 | 1.7 | 1.4 | 0.5 | 0.6 | |||||||||||||||||||
| Net Debt | 23.1 | 18.8 | 17.5 | 15.4 | 24.9 | 25.9 | 24.8 | 6.0 | 5.3 | -1.6 | 16.0 | 14.9 | |||||||||||||||||||
| Total Revenue | 26.8 | 34.3 | 35.4 | 32.8 | 33.4 | 24.6 | 29.2 | 23.6 | 20.3 | 25.9 | 28.6 | 29.1 | |||||||||||||||||||
| Taxes | 15.7 | 17.4 | 19.7 | 17.6 | 21.2 | 16.9 | 16.0 | 14.0 | 8.8 | 16.1 | 16.4 | 16.3 | |||||||||||||||||||
| Federal Transfers | 4.7 | 12.3 | 9.4 | 9.8 | 5.3 | 3.1 | 7.7 | 3.5 | 2.3 | 3.0 | 6.1 | 6.4 | |||||||||||||||||||
| Other Non-tax Revenue | 6.4 | 4.5 | 6.4 | 5.3 | 6.9 | 4.6 | 5.5 | 6.2 | 9.2 | 6.8 | 6.2 | 6.3 | |||||||||||||||||||
| Total Spending | 26.9 | 32.1 | 34.2 | 33.4 | 33.8 | 24.8 | 30.4 | 22.5 | 18.6 | 24.6 | 28.1 | 28.5 | |||||||||||||||||||
| Program Spending | 25.1 | 30.4 | 32.8 | 31.8 | 30.7 | 23.3 | 27.9 | 21.5 | 18.0 | 23.8 | 26.5 | 26.9 | |||||||||||||||||||
| Health** | 9.3 | 9.6 | 13.2 | 12.5 | 9.8 | 7.8 | 10.3 | 6.0 | 5.4 | 7.9 | 9.2 | 9.3 | |||||||||||||||||||
| Education** | 3.7 | 5.8 | 5.8 | 5.7 | 4.3 | 4.3 | 4.7 | 3.6 | 3.0 | 3.4 | 4.4 | 4.4 | |||||||||||||||||||
| All Other Program Spending** | 12.1 | 15.0 | 13.8 | 13.6 | 16.6 | 11.2 | 12.9 | 11.9 | 9.6 | 12.5 | 12.9 | 13.1 | |||||||||||||||||||
| Interest on Debt Payments | 1.8 | 1.7 | 1.3 | 1.7 | 3.1 | 1.5 | 2.4 | 1.0 | 0.6 | 0.7 | 1.6 | 1.6 | |||||||||||||||||||
Graphical Descriptions
| Revenue Per Capita ($,2022) | ||
|---|---|---|
| Province | Revenue Per Capita | Rest of Canada Average |
| SK | 19,215 | 16,676 |
| QC | 18,447 | 16,676 |
| NL | 17,895 | 16,676 |
| PE | 17,231 | 16,676 |
| AB | 16,762 | 16,676 |
| NB | 15,730 | 16,676 |
| NS | 15,065 | 16,676 |
| MB | 15,032 | 16,676 |
| BC | 14,711 | 16,676 |
| ON | 12,643 | 16,676 |
| Tax Revenue Per Capita ($,2022) | ||
|---|---|---|
| Province | Tax Revenue Per Capita | Rest of Canada Average |
| SK | 12,197 | 9,779 |
| QC | 11,965 | 9,779 |
| NL | 11,050 | 9,779 |
| BC | 10,163 | 9,779 |
| ON | 9,687 | 9,779 |
| PE | 9,313 | 9,779 |
| NS | 8,937 | 9,779 |
| MB | 8,784 | 9,779 |
| NB | 8,711 | 9,779 |
| AB | 6,891 | 9,779 |
| Tax Revenue as a Share of GDP (Per Cent, 2022) | ||
|---|---|---|
| Province | Tax Revenue as a Share of GDP | Rest of Canada Average |
| QC | 19.0 | 14.5 |
| NS | 16.9 | 14.5 |
| PE | 16.6 | 14.5 |
| NB | 15.8 | 14.5 |
| NL | 14.4 | 14.5 |
| MB | 14.3 | 14.5 |
| ON | 14.0 | 14.5 |
| BC | 13.8 | 14.5 |
| SK | 12.6 | 14.5 |
| AB | 6.8 | 14.5 |
| Tax Revenue as a Share of Economic Base (Per Cent, 2022) | ||
|---|---|---|
| Tax Revenue Category | Ontario | Rest of Canada Average |
| Personal Income Tax | 8.7 | 11.0 |
| Corporations Tax | 20.2 | 16.1 |
| Sales Tax | 6.6 | 5.9 |
| All Other Tax | 3.3 | 3.7 |
| Federal Transfers Per Capita ($, 2022) | Other Non-tax Revenues Per Capita($, 2022) | ||||
|---|---|---|---|---|---|
| Province | Federal Transfers Per Capita | Rest of Canada Average | Province | Other Non-tax Revenues Per Capita | Rest of Canada Average |
| PE | 6,669 | 3,911 | AB | 7,712 | 2,987 |
| NB | 5,290 | 3,911 | SK | 4,020 | 2,987 |
| NS | 4,772 | 3,911 | NL | 3,371 | 2,987 |
| MB | 4,537 | 3,911 | QC | 3,266 | 2,987 |
| NL | 3,475 | 3,911 | BC | 2,465 | 2,987 |
| QC | 3,216 | 3,911 | NB | 1,728 | 2,987 |
| SK | 2,998 | 3,911 | MB | 1,711 | 2,987 |
| AB | 2,159 | 3,911 | NS | 1,356 | 2,987 |
| BC | 2,083 | 3,911 | PE | 1,249 | 2,987 |
| ON | 1,984 | 3,911 | ON | 971 | 2,987 |
| Total Spending Per Capita ($, 2022) | ||
|---|---|---|
| Province | Total Spending Per Capita | Rest of Canada Average |
| QC | 18,877 | 16,403 |
| SK | 18,189 | 16,403 |
| NL | 17,718 | 16,403 |
| PE | 16,896 | 16,403 |
| NB | 15,418 | 16,403 |
| NS | 15,388 | 16,403 |
| BC | 15,357 | 16,403 |
| MB | 15,232 | 16,403 |
| AB | 14,554 | 16,403 |
| ON | 13,065 | 16,403 |
| Program Spending Per Capita ($, 2022) | ||
|---|---|---|
| Province | Program Spending Per Capita | Rest of Canada Average |
| SK | 17,295 | 15,389 |
| QC | 16,943 | 15,389 |
| NL | 16,437 | 15,389 |
| PE | 16,029 | 15,389 |
| BC | 14,870 | 15,389 |
| NS | 14,689 | 15,389 |
| NB | 14,518 | 15,389 |
| AB | 13,871 | 15,389 |
| MB | 13,847 | 15,389 |
| ON | 12,138 | 15,389 |
| Health Spending Per Capita ($, 2022) | ||
|---|---|---|
| Province | Health Spending Per Capita | Rest of Canada Average |
| NL | 6,605 | 5,765 |
| NS | 6,291 | 5,765 |
| QC | 5,953 | 5,765 |
| NB | 5,906 | 5,765 |
| BC | 5,675 | 5,765 |
| SK | 5,596 | 5,765 |
| PE | 5,461 | 5,765 |
| AB | 5,279 | 5,765 |
| MB | 5,117 | 5,765 |
| ON | 4,889 | 5,765 |
| Education Spending Per Capita ($, 2022) | ||
|---|---|---|
| Province | Education Spending Per Capita | Rest of Canada Average |
| QC | 3,136 | 2,772 |
| SK | 3,071 | 2,772 |
| PE | 3,014 | 2,772 |
| NB | 2,895 | 2,772 |
| ON | 2,843 | 2,772 |
| NL | 2,804 | 2,772 |
| MB | 2,766 | 2,772 |
| AB | 2,536 | 2,772 |
| NS | 2,479 | 2,772 |
| BC | 2,247 | 2,772 |
| All Other Program Spending Per Capita ($, 2022) | ||
|---|---|---|
| Province | All Other Program Spending Per Capita | Rest of Canada Average |
| SK | 8,628 | 6,852 |
| QC | 7,855 | 6,852 |
| PE | 7,554 | 6,852 |
| NL | 7,028 | 6,852 |
| BC | 6,948 | 6,852 |
| AB | 6,056 | 6,852 |
| MB | 5,965 | 6,852 |
| NS | 5,919 | 6,852 |
| NB | 5,718 | 6,852 |
| ON | 4,406 | 6,852 |
| Interest on Debt Payments Per Capita ($, 2022) | ||
|---|---|---|
| Province | Interest on Debt Payments Per Capita | Rest of Canada Average |
| QC | 1,934 | 1,014 |
| MB | 1,385 | 1,014 |
| NL | 1,281 | 1,014 |
| ON | 927 | 1,014 |
| NB | 900 | 1,014 |
| SK | 894 | 1,014 |
| PE | 867 | 1,014 |
| NS | 699 | 1,014 |
| AB | 683 | 1,014 |
| BC | 487 | 1,014 |
| Budget Balance Per Capita ($, 2022) | ||
|---|---|---|
| Province | Budget Balance Per Capita | Rest of Canada Average |
| AB | 2,208 | 273 |
| SK | 1,026 | 273 |
| PE | 335 | 273 |
| NB | 311 | 273 |
| NL | 179 | 273 |
| MB | -200 | 273 |
| NS | -324 | 273 |
| ON | -422 | 273 |
| QC | -430 | 273 |
| BC | -646 | 273 |
| Net Debt Per Capita ($, 2022) | ||
|---|---|---|
| Province | Net Debt Per Capita | Rest of Canada Average |
| ON | 19,436 | 9,439 |
| NL | 16,195 | 9,439 |
| MB | 13,574 | 9,439 |
| NS | 11,535 | 9,439 |
| PE | 10,390 | 9,439 |
| NB | 8,902 | 9,439 |
| QC | 7,899 | 9,439 |
| SK | 7,605 | 9,439 |
| AB | 6,007 | 9,439 |
| BC | 2,847 | 9,439 |
| Effective Interest Rate (Per Cent, 2022) | ||
|---|---|---|
| Province | Effective Interest Rate | Rest of Canada Average |
| QC | 6.6 | 4.0 |
| PE | 4.2 | 4.0 |
| NS | 4.1 | 4.0 |
| NL | 3.8 | 4.0 |
| MB | 3.6 | 4.0 |
| ON | 3.5 | 4.0 |
| BC | 3.4 | 4.0 |
| SK | 3.4 | 4.0 |
| AB | 3.3 | 4.0 |
| NB | 3.1 | 4.0 |
Footnotes
[1] Some GFS data are available from 2007; however, the majority of provincial data are only available from 2008.
[2] When the latest GFS data are released, data from previous years are also revised to reflect information not available at the time of the previous release. As a result, figures in this report may not align with those presented in previous reports.
[3] Ontario’s slower growth in 2022 was largely driven by a 6.8 per cent decline in personal income tax revenue per capita, which tempered a 5.4 per cent gain in corporations tax revenue per capita and a 14.4 per cent increase in sales tax revenue per capita. The stronger tax revenue per capita growth in the rest of Canada average resulted from increases in personal income tax revenue per capita of 9.3 per cent, corporations tax revenue per capita of 63.0 per cent and sales tax revenue per capita of 9.1 per cent.
[4] In the provincial economic accounts, labour income corresponds to total compensation of employees, corporate profits to net operating surplus of corporations and household spending to household final consumption expenditure.
[5] The actual tax bases for personal income tax and corporations tax are personal taxable income and corporate taxable income, respectively. These tax bases were not available for 2022 at the time of this report’s publication. The actual tax base for sales tax includes household spending in addition to taxes generated on expenditures from residential construction, businesses and governments. For simplicity, only household consumption is shown.
[6] Because there are many different bases for all other tax revenue, this category is compared against overall economic activity measured by GDP.
[7] Equalization payments are determined by a province’s fiscal capacity to raise revenues through five broad revenue categories: personal income taxes, business taxes, consumption taxes, property taxes and natural resource revenues. As of 2022-23, Ontario has received Equalization payments in only 10 years since the program’s inception in 1957.
[8] Other federal transfers were much lower in Ontario on a per capita basis ($414) compared to the rest of Canada average ($1,011). The FAO calculates other federal transfers in this report by subtracting the Canada Health Transfer, Canada Social Transfer and the Equalization Program (see Major Federal Transfers) from total transfers published in the GFS.
[9] The FAO calculates ‘other non-tax revenues’ in this report as the sum of the Social Contributions and Other Revenue categories in the GFS. These items comprise revenue from social security contributions, resource royalties, the ownership of assets, in addition to revenue generated from the sales of goods and services (including services fees), fines and penalties, and voluntary transfers as well as other miscellaneous revenues. For more information on GFS categories, see the Government Financial Statistics Manual 2014.
[10] In 2022, Ontario collected $20 in resource revenues per capita, well below the rest of Canada average of $1,169.
[11] Ontario’s ownership of assets generated $154 in revenue per capita, below the average of $537 generated in the rest of Canada. The sale of goods and services generated $462 per capita in Ontario, lower than the rest of Canada average of $734.
[12] Ontario’s interest on debt payments per capita ranked seventh highest among the provinces for the 2009 to 2017 period.
[13] The per capita surplus among the average of the rest of Canada was largely driven by Alberta which had a surplus per capita of $2,208 in 2022. Removing Alberta from the rest of Canada average results in a budget surplus of $32 per capita.
[14] During 2015 to 2017, Ontario recorded budget deficits that were smaller than the average deficit recorded in the rest of Canada.
[15] The effective interest rate is calculated as total interest paid divided by gross debt. Gross debt is calculated as the sum of debt securities and loans in Statistics Canada’s GFS Table 10-10-0017-01.
[16] Ontario’s lower effective interest rate may reflect Ontario’s large and diversified economy, high liquidity and debt management program, which are seen as credit strengths that may result in lower borrowing rates. See the FAO’s most recent credit rating report for more discussion on Ontario’s credit quality and borrowing rates.