


Key Points
- Ontario employment declined by a record 403,000 jobs (or -5.3 per cent) in March, more than four times greater than the previous largest monthly job loss.
- Ontario’s unemployment rate jumped to 7.6 per cent in March from 5.5 per cent in February, the largest monthly increase in the jobless rate on record.[1]
- Almost all the job losses were related to the COVID-19 pandemic that prompted a progressive province-wide shutdown of most non-essential activities beginning in mid-March. The FAO estimates that about 1.2 million Ontario workers were directly affected by the shutdowns through either job losses or sharply reduced hours, representing almost one in six jobs in the province.
- Given that government mandated restrictions widened following the March Labour Force Survey, Ontario would be expected to experience significant additional job losses in April.
- In a forthcoming report to be released in May, the Financial Accountability Office (FAO) will provide an economic and fiscal outlook for the province which will incorporate impacts related to the COVID-19 pandemic as well as government policies responding to the crisis.
Snapshot of the Ontario Labour Market in March 2020
Source: Statistics Canada and FAO.
Accessible version
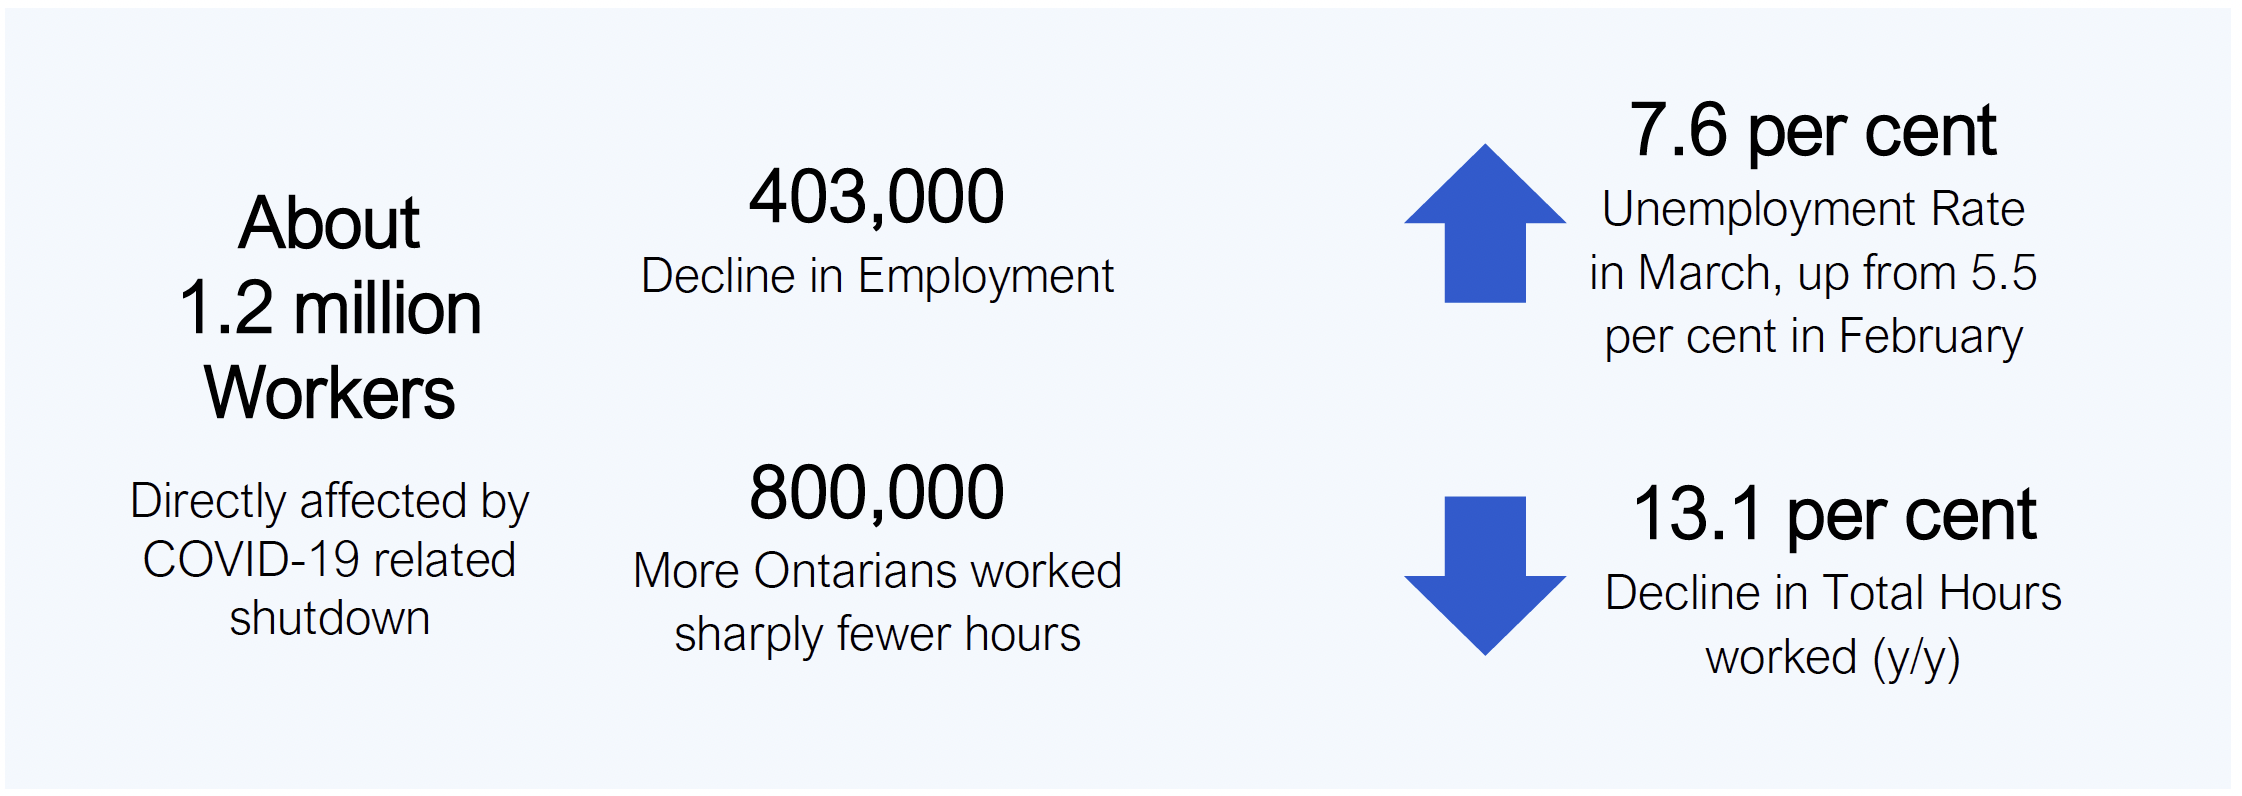
The infographic presents the following information:
- About 1.2 million workers were directly affected by COVID-19 related shutdown
- 403,000 decline in Employment
- 800,000 more employees worked sharply fewer hours
- Unemployment rate increased to 7.6 per cent in March, from 5.5. per cent in February
- Total hours worked declined 13.1 per cent year-over-year in March
Ontario Experiences Record Monthly Job Loss in March
According to Statistics Canada’s Labour Force Survey, Ontario employment fell sharply in March, down a record 403,000 jobs (or -5.3 per cent). This decline was more than four times the previous largest single-month job loss of -95,700 (-1.5 per cent) recorded in January 2009. The collapse of employment in March brings the number of jobs in the province down to levels not seen since mid-2017.
Chart 1 Ontario records largest monthly job loss in March
Source: Statistics Canada and FAO.
Accessible version
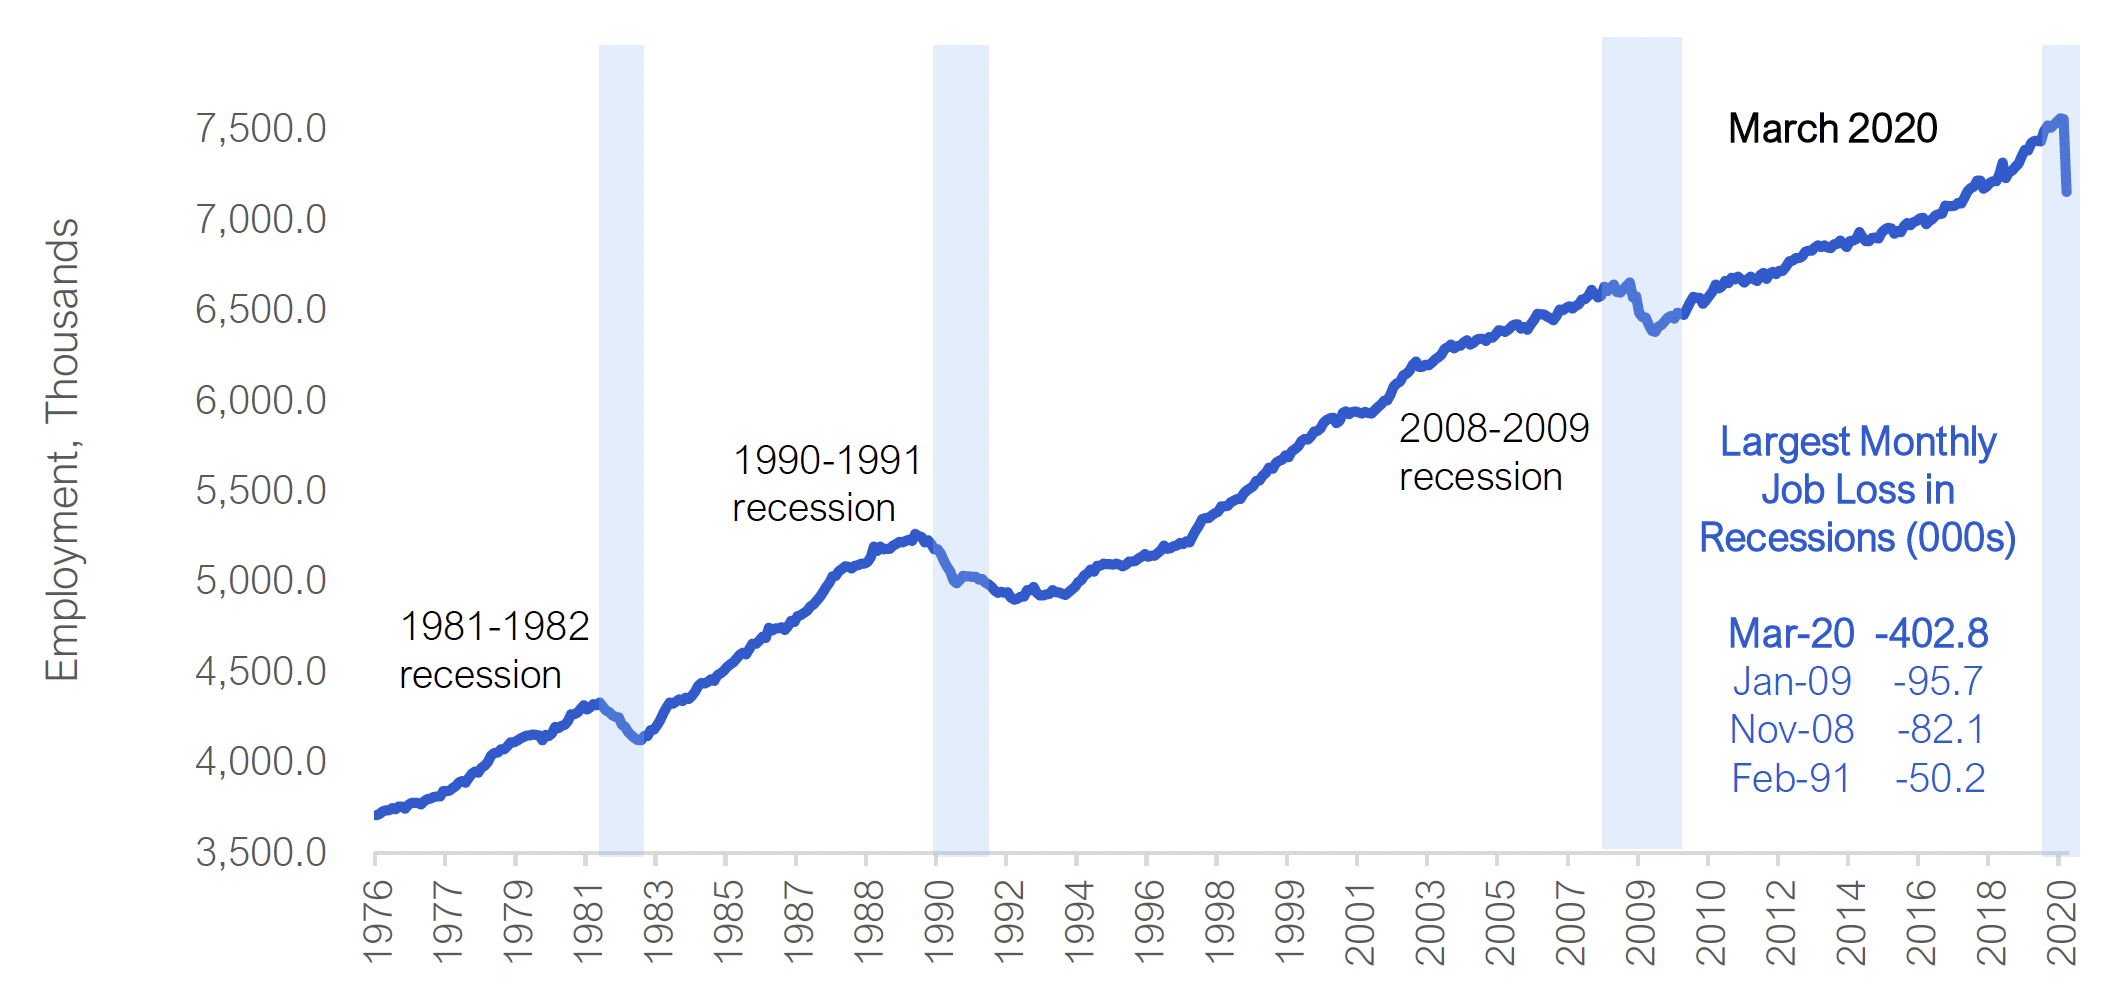
The chart presents monthly employment in Ontario from January 1976 to March 2020. The chart shows that Ontario had a record monthly decline in employment in March 2020, compared to job losses in past recessions (2008-2009 recession, 1990-1991 recession, and 1981-1982 recession).
The chart also presents Ontario’s largest monthly declines in jobs in past recessions.
| Largest Monthly Job Loss in Recessions | Thousands |
|---|---|
| Mar-20 | -402.8 |
| Jan-09 | -95.7 |
| Nov-08 | -82.1 |
| Feb-91 | -50.2 |
As a result of the sharp job loss, Ontario’s unemployment rate jumped to 7.6 per cent in March, up from 5.5 per cent in February. The 2.1 percentage point jump in the unemployment rate was the largest single-month increase on record, bringing the jobless rate to its highest point since December 2013. The rise in the unemployment rate in March would have been even higher if many laid-off workers had not decided to give up looking for work.[2]
Both full-time (-249,000) and part-time (-154,000) employment declined sharply in March. Almost 80 per cent of the job losses occurred in the private sector (-320,000), while self-employment (-40,000) and public sector employment (-44,000) also declined.
Impact of the COVID-19 Pandemic on Employment
The dramatic deterioration in Ontario’s labour market in March reflects the impact of the COVID-19 pandemic which resulted in a broad, mandated shutdown of non-essential activity throughout the province beginning in mid-March and extending through April.[3] However, the labour market results in March stand in contrast to previous periods of sharp job losses. During past recessionary periods, significant declines in household spending, foreign exports and investment forced businesses to reduce production and employment. In the current downturn, businesses were directed to temporarily close their operations, forcing some of them to lay off employees.
The FAO estimates that about 1.2 million workers – representing nearly one in six jobs across the province – were directly affected by the shutdowns, through either job losses, temporary layoffs or sharply reduced hours. In addition to the net decline in employment of 403,000, the FAO estimates that nearly 500,000 more employees had essentially no hours worked, while a further 300,000 others worked less than half their usual hours during the reference week[4], largely due to COVID-19 related reasons.
Workers in public-facing roles were severely impacted by the crisis in March, with sharp job losses in accommodation and food services (-119,600 jobs or -26.7 per cent), wholesale and retail trade (-87,600 jobs, or -7.9 per cent) and information, culture and recreation (-30,200, or -9.8 per cent).
Vulnerable workers were particularly hard hit by pandemic-related shutdowns. Temporary workers experienced job losses at a much higher rate (-14.0 per cent) compared to permanent employees (-5.6 per cent).[5] For young workers (ages 15-24), many of whom are employed in temporary or part-time positions, employment dropped sharply by 158,800 jobs (or -15.8 per cent).
Part-time workers (-11.3 per cent) lost jobs at nearly three times the pace of full-time workers (-4.0 per cent). Female part-time workers were also more affected by the job losses in March, with employment down 109,100 (or -12.4 per cent).
With the Province mandating closures of non-essential activities starting in mid-March, the total number of hours worked in Ontario dropped dramatically, falling 13.1 per cent in March compared to a year earlier, and marking the lowest number of hours worked since late 2009.
Almost all the increase in unemployment was driven by temporary layoffs in March. The number of unemployed individuals on temporary layoffs increased eight times in March from a year earlier, the highest on record since 1976.
| 2019 | 2020 | Annual Average | ||||||
|---|---|---|---|---|---|---|---|---|
| Oct | Nov | Dec | Jan | Feb | Mar | 2018 | 2019 | |
| Total Employment Change, thousands | -11.9 | 17.9 | 17.1 | 15.9 | -3.2 | -402.8 | 114.4 | 210.2 |
| Unemployment rate (per cent) |
5.3 | 5.5 | 5.3 | 5.2 | 5.5 | 7.6 | 5.6 | 5.6 |
| Employment Change by Category, thousands | ||||||||
| Full-time | -17.5 | 32.5 | 35.5 | 10.0 | 20.3 | -248.5 | 130.3 | 156.8 |
| Part-time | 5.6 | -14.6 | -18.5 | 6.0 | -23.5 | -154.3 | -15.9 | 53.4 |
| Public sector employees | 20.2 | 6.4 | -3.5 | -6.0 | 5.3 | -43.5 | 47.6 | 9.2 |
| Private sector employees | -36.1 | 37.4 | 34.3 | 9.3 | -18.1 | -319.5 | 50.0 | 122.8 |
| Self-employed | 3.9 | -25.9 | -13.8 | 12.7 | 9.5 | -39.7 | 16.8 | 78.2 |
Almost All Industry Sectors Experienced Job Losses in March
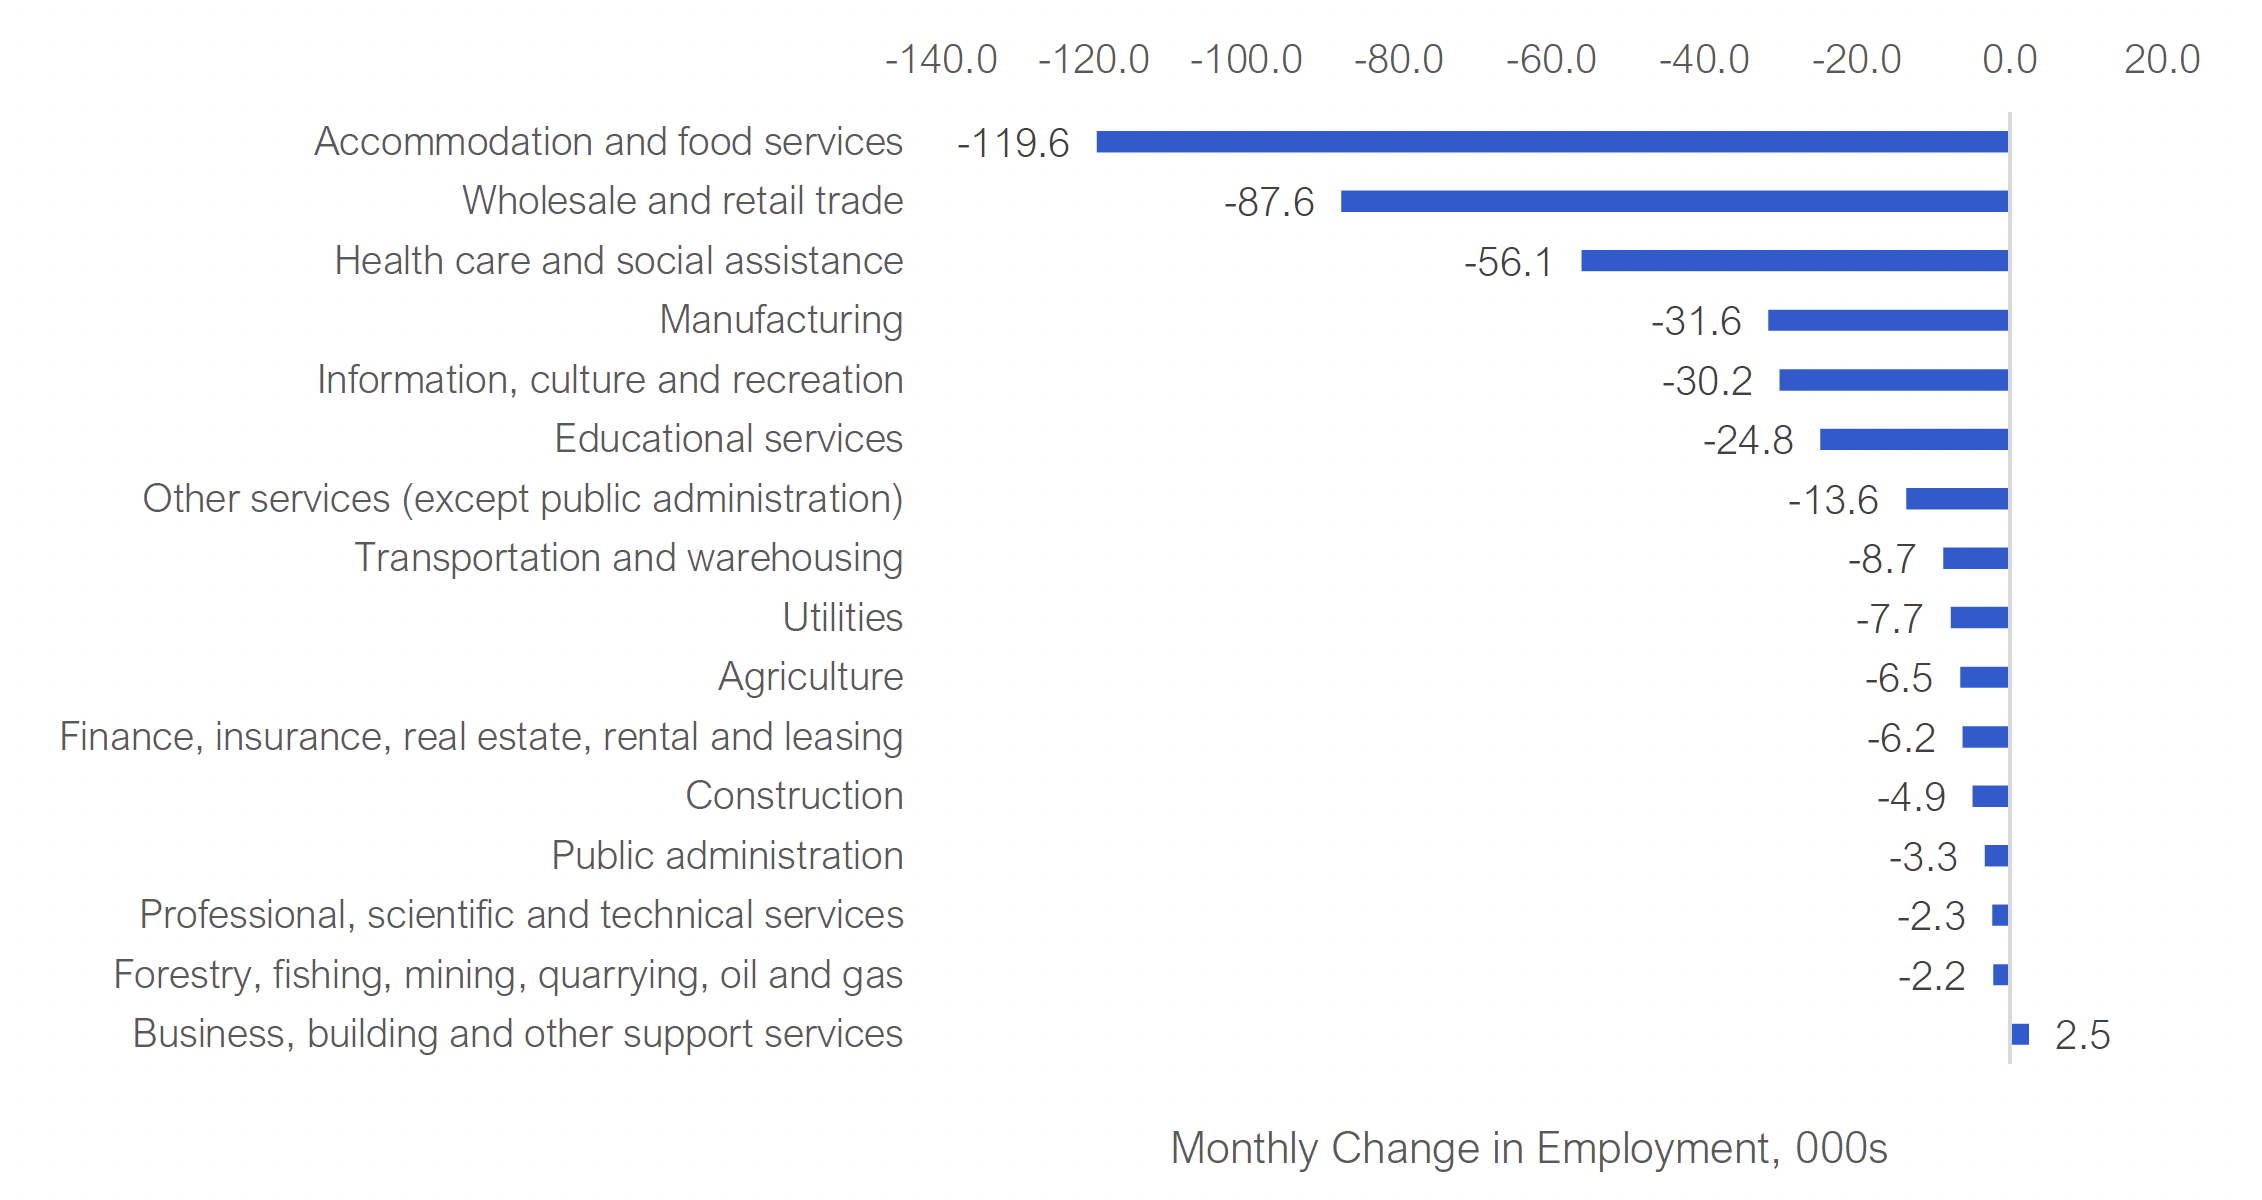
Almost all major industry groups experienced lower employment in March. Job losses were particularly large in public-facing industries, including accommodation and food services (-119,600, or -26.7%), wholesale and retail trade (-87,600, or -7.9%), information, culture and recreation services (-30,200, or -9.8 per cent) and healthcare and social assistance (-56,100, or -6.1%).
Industries that are more likely to be able to support employees working from home experienced more modest employment declines in March, including professional and scientific services (-2,300), public administration (-3,300) and finance, insurance and real estate (-6,200).
Chart 2 Employment declined across most industries in March
Source: Statistics Canada and FAO.
Accessible version
| Industry (In Thousands) | Mar 20 |
|---|---|
| Business, building and other support services | 2.5 |
| Forestry, fishing, mining, quarrying, oil and gas | -2.2 |
| Professional, scientific and technical services | -2.3 |
| Public administration | -3.3 |
| Construction | -4.9 |
| Finance, insurance, real estate, rental and leasing | -6.2 |
| Agriculture | -6.5 |
| Utilities | -7.7 |
| Transportation and warehousing | -8.7 |
| Other services (except public administration) | -13.6 |
| Educational services | -24.8 |
| Information, culture and recreation | -30.2 |
| Manufacturing | -31.6 |
| Health care and social assistance | -56.1 |
| Wholesale and retail trade | -87.6 |
| Accommodation and food services | -119.6 |
All Provinces Experienced Labour Market Weakness
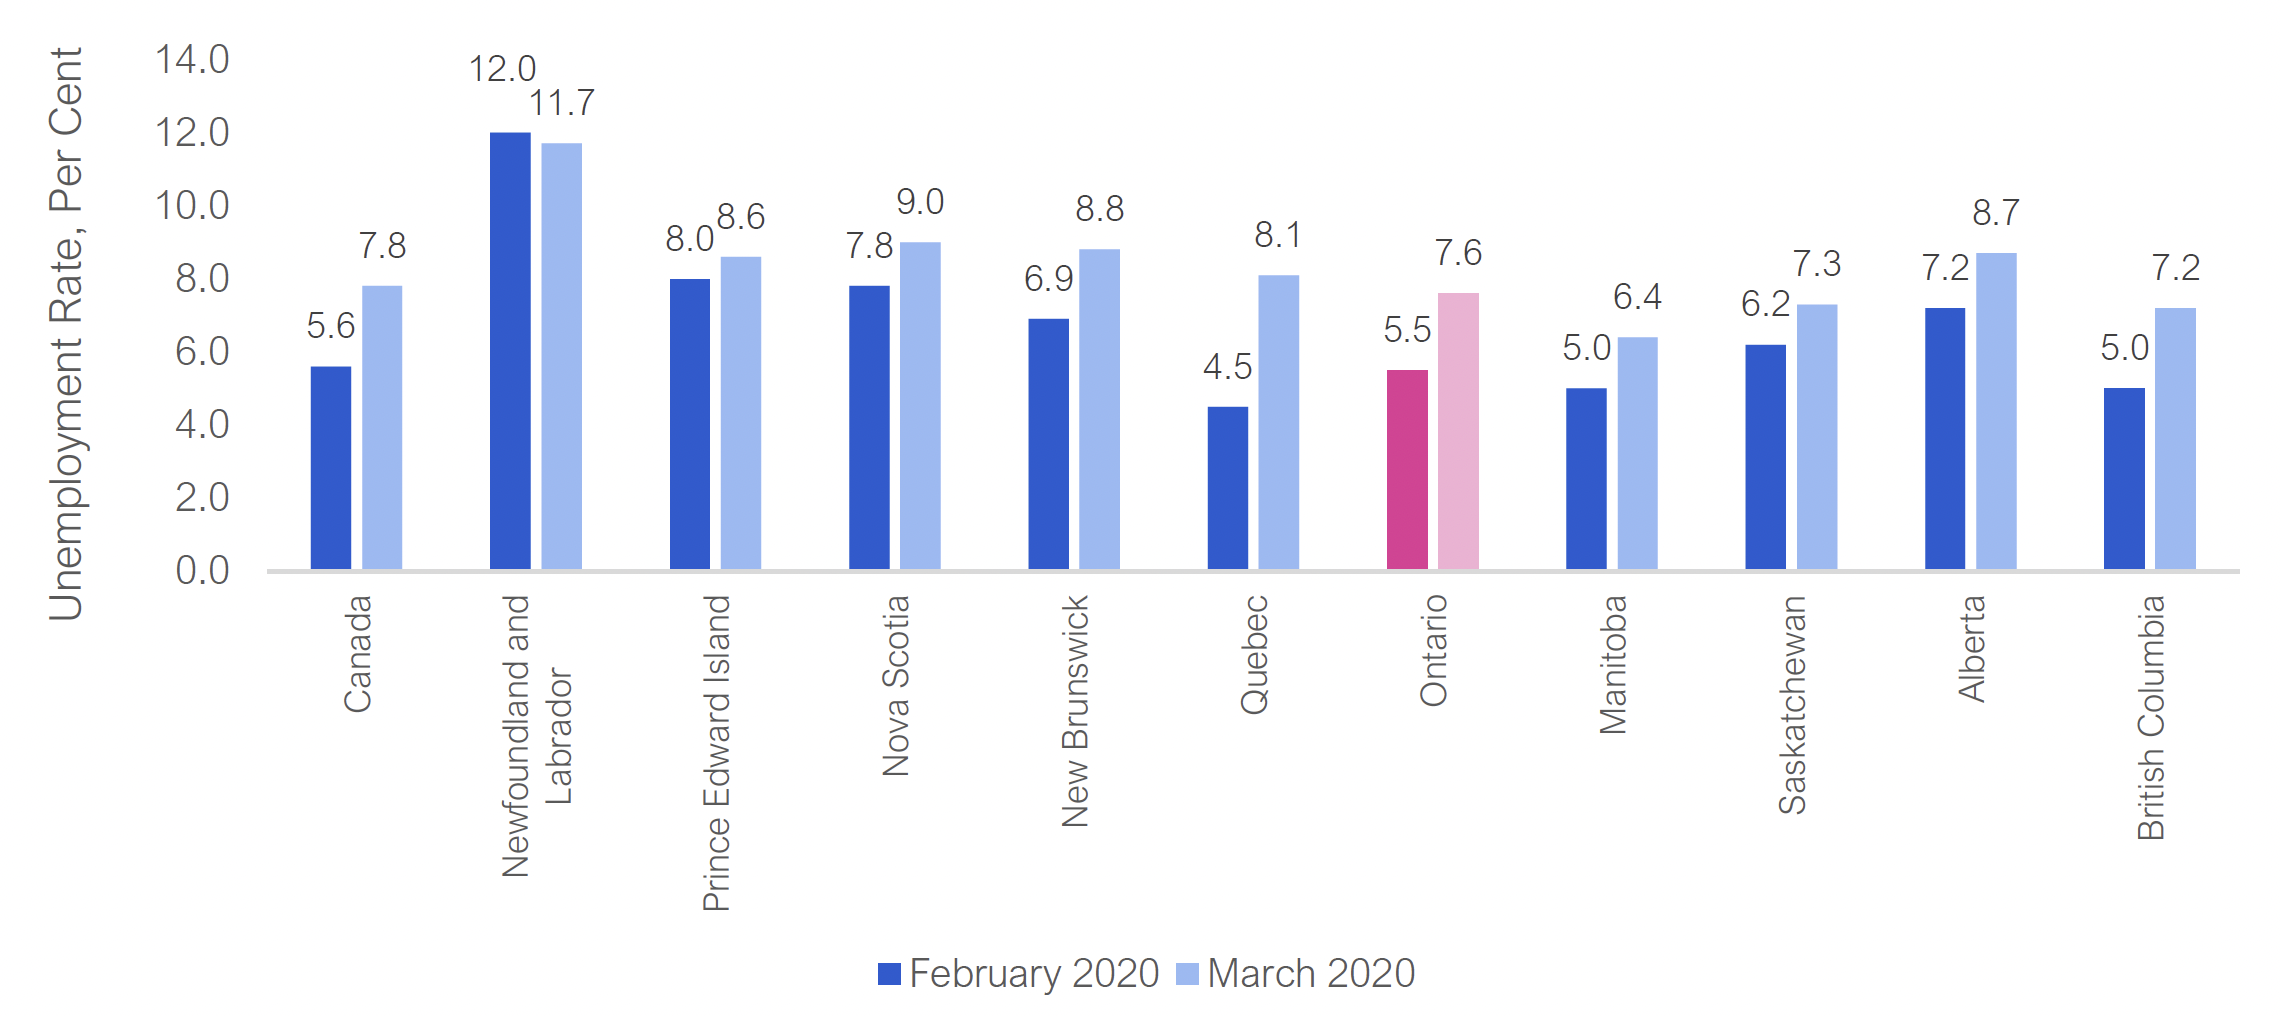
Nationally, Canadian employment dropped by 1 million workers (-5.3 per cent) in March, a record monthly job loss. The national unemployment rate rose sharply to 7.8 per cent, up from 5.6 per cent in February. All provinces experienced significant labour market impacts from the COVID-19 crisis in March, with Quebec (-6.0 per cent) and British Columbia (-5.2 per cent) posting large employment declines and sharp increases in unemployment rates.
Chart 3 Unemployment rate increased in almost all the provinces
Source: Statistics Canada.
Accessible version
| Feb 20 | Mar 20 | |
|---|---|---|
| Canada | 5.6 | 7.8 |
| Newfoundland and Labrador | 12 | 11.7 |
| Prince Edward Island | 8 | 8.6 |
| Nova Scotia | 7.8 | 9 |
| New Brunswick | 6.9 | 8.8 |
| Quebec | 4.5 | 8.1 |
| Ontario | 5.5 | 7.6 |
| Manitoba | 5 | 6.4 |
| Saskatchewan | 6.2 | 7.3 |
| Alberta | 7.2 | 8.7 |
| British Columbia | 5 | 7.2 |
Looking Ahead
Actions taken by the federal and provincial governments during the COVID-19 crisis are expected to provide support for labour markets going forward. However, at the same time, the on-going containment measures to stem the spread of the COVID-19 virus will continue to negatively affect employment in the months ahead.
Statistics Canada’s next Labour Force Survey is scheduled for release on May 8 and will likely report additional significant job losses occurring in April. Some Ontario industries that experienced relatively small job losses in March have been more severely affected by recent measures to further restrict activity, likely leading to lower employment in April. However, the new Canada Emergency Wage Subsidy program may encourage some employers to rehire workers.
Timeline of provincial measures responding to the COVID-19 pandemic
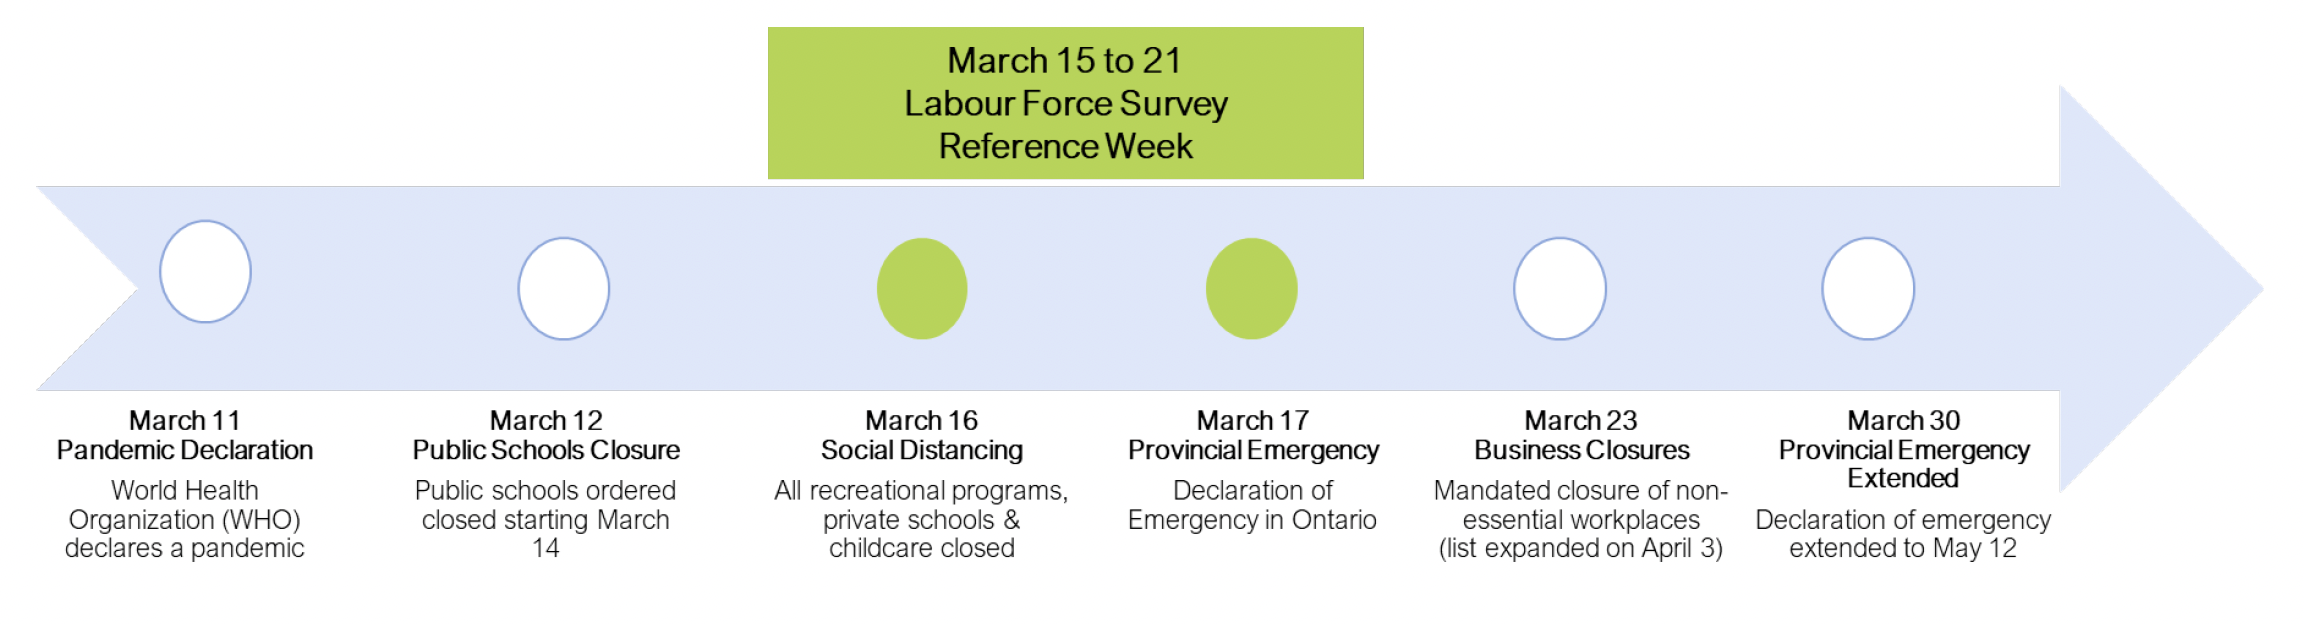
Source: Ontario.ca and FAO.
Accessible version
- March 11, Pandemic Declaration: World Health Organization (WHO) declares a pandemic
- March 12, Public Schools Closure: Public schools ordered closed starting March 14
- March 15: Beginning of Labour Force Survey reference week
- March 16, Social Distancing: All recreational programs, private schools & childcare closed
- March 17, Provincial Emergency: Declaration of Emergency in Ontario
- March 21: End of Labour Force Survey reference week
- March 23, Business Closures: Mandated closure of non-essential workplaces (list expanded on April 3)
- March 30, Provincial Emergency Extended: Declaration of emergency extended to May 12
Although job losses were anticipated to be severe in the early stages of the pandemic, most economic forecasters expect employment to recover as restrictions related to COVID-19 crisis are eased in the coming months.
The Financial Accountability Office (FAO) will be releasing an economic and budget outlook report in May which will incorporate the economic and fiscal impacts of the COVID-19 pandemic as well as government policies responding to the crisis.
Footnotes
[1] The Labour Force Survey (LFS) is conducted monthly by Statistics Canada and is based on a sample of about 15,000 Ontario households who are questioned about their employment status, hours worked, and income received. The LFS is the most closely monitored employment report in Canada because it is available quickly and on a frequent basis. The survey provides broad coverage of labour market information, including industry, demographic and regional data. The monthly data used in this report is seasonally adjusted, unless otherwise stated. Statistics Canada’s current Labour Force Survey was introduced in 1976.
[2] Individuals who have lost their jobs and decide not to search for work are not classified as unemployed and are not included in the labour force.
[3] For a timeline of measures related to the COVID-19 pandemic in Ontario, see page 5.
[4] The LFS reference week was March 15 to March 21.
[5] Not adjusted for seasonality.