


Summary
This report provides a review of Ontario's labour market performance in 2023. It presents a summary of the overall labour market in the province, followed by information for demographic groups, industries, occupations, major cities and other provinces. The report also provides information on wage growth compared to inflation.
Ontario’s labour market moderated in 2023 following two years of record job gains
- After recording record gains in 2021 and 2022, the pace of Ontario's job creation moderated in 2023 with employment rising by 183,200 jobs (or 2.4 per cent). The annual unemployment rate in the province inched up from 5.6 per cent in 2022 to 5.7 per cent in 2023.
- Although Ontario’s working age population (age 15 and over) increased at the fastest pace on record at 2.3 per cent in 2023, the rise in the province’s labour force was even larger (2.5 per cent). As a result, the labour market participation rate[1] edged up to 65.5 per cent, the highest rate since 2015.
Most groups of workers saw job gains
- Core-aged workers (25-54) experienced employment growth of 2.7 per cent in 2023, with job gains for females modestly faster than for males. The employment rate (84.1 per cent) and labour force participation rate (88.3 per cent) of core-aged workers reached record highs in 2023.
- Among all broad age groups, young workers saw the slowest pace of job growth in 2023 at 1.8 per cent, as employment of male youth increased by 4.7 per cent, partially offset by a 1.2 per cent decline in female youth employment.
- Public sector employment increased at a slower pace than in the private sector in 2023 (1.6 per cent versus 3.3 per cent), after recording faster job gains in the previous two years.
- The number of self-employed Ontarians declined by 9,800 (-0.9 per cent) in 2023, marking the third drop in the past four years. Self-employed workers accounted for 13.6 per cent of total employment, the lowest share since 1991, and reflecting rapid increases in paid employment in permanent positions.
- Fourteen of the 16 major industries in Ontario saw an increase in employment in 2023. Health care and social assistance recorded the largest increase in employment (37,600 or 4.0 per cent), while wholesale and retail trade saw a decrease in employment (-24,300 or -2.1 per cent).
- Job vacancies trended lower in 2023, declining 24.9 per cent compared to the previous year, with declines in all industries except utilities.
- All but two census metropolitan areas (CMAs) in Ontario saw an increase in employment in 2023. Windsor had the fastest pace of job creation (8.2 per cent), while Hamilton (-1.1 per cent) and Oshawa (-1.0 per cent) experienced job losses.
Wage growth in Ontario outpaced inflation in 2023 for most groups of workers
- Following two years of wage growth lagging inflation, the average hourly wage of Ontarians increased 5.1 per cent to $34.63 in 2023, above the 3.8 per cent average annual consumer price index (CPI) inflation rate. Wages in 12 out of 16 industry groups and 18 out of 34 occupation groups grew above inflation.
Ontario’s labour market moderated in 2023 following two years of record job gains
After recording record gains in 2021 and 2022, the pace of Ontario's job creation moderated in 2023 with employment rising by 183,200 jobs (or 2.4 per cent).[2] The annual unemployment rate in the province inched up from 5.6 per cent in 2022 to 5.7 per cent in 2023. Although Ontario’s working age population[3] increased at the fastest pace on record at 2.3 per cent in 2023, the rise in the province’s labour force was even larger (2.5 per cent). As a result, the labour market participation rate[4] edged up to 65.5 per cent, the highest rate since 2015.
Figure 1 Ontario gained 183,200 jobs in 2023
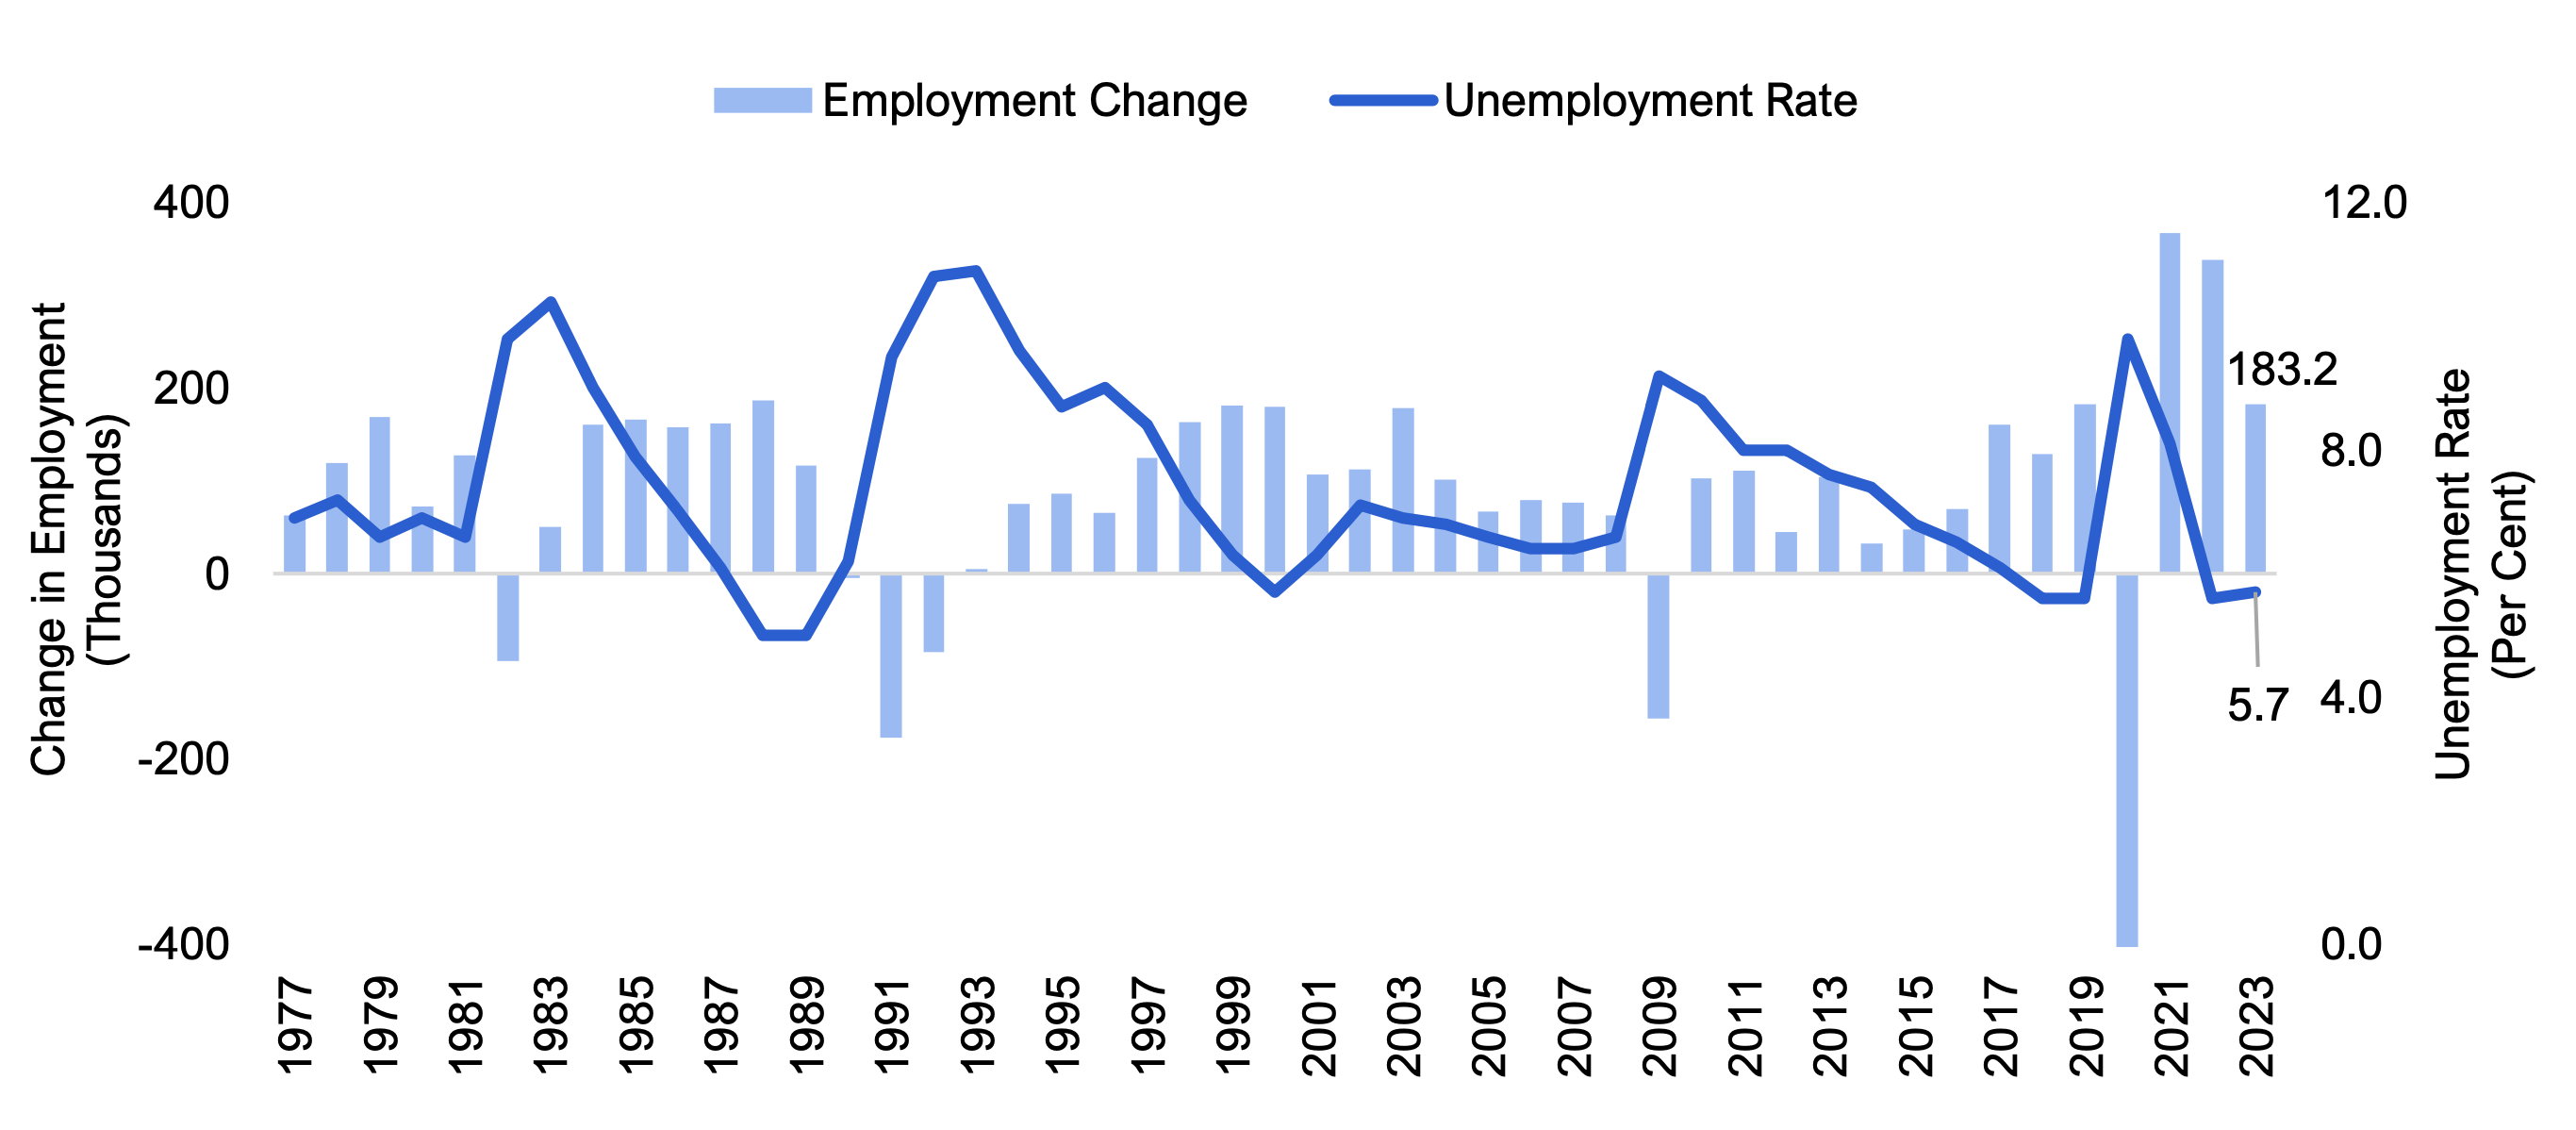
Source: Statistics Canada: Labour Force Survey: Table 14-10-0327-01
Ontario experienced job losses in the second half of 2023
On a monthly basis, Ontario’s labour market softened in the second half of 2023 with 32,800 jobs lost during July to December. The unemployment rate rose from a low of 5.1 per cent in April to 6.3 per cent in December. This 1.2 percentage point rise in the unemployment rate marked the largest increase over an eight-month period since December 2008 to August 2009 (+2.0 percentage points) excluding the pandemic.
Core-aged workers experienced strong pace of job gains while female youth saw job losses
In 2023, employment increased across all broad age and gender categories except female youth (aged 15-24). Core-aged workers (25-54) experienced employment growth of 2.7 per cent in 2023, with job gains for females (3.0 per cent) modestly faster than for males (2.4 per cent). The employment rate[5] and labour force participation rate of core-aged workers reached record highs in 2023, at 84.1 per cent and 88.3 per cent, respectively, as both rates for female workers also climbed to all-time highs.
Among all age groups, young workers saw the slowest pace of job growth in 2023, at 1.8 per cent, as male youth employment growth of 4.7 per cent was partially offset by a 1.2 per cent decline in female youth employment. The drop in female youth employment in 2023 was led by a 20,400 decline in part-time employment in the wholesale and retail trade industry and followed the group’s exceptionally strong job growth in 2021 and 2022 (11.6 and 10.4 per cent, respectively). Workers aged 55 and over recorded job growth of 1.9 per cent, with similar gains for older males (2.0 per cent) and females (1.8 per cent).
The unemployment rate of core-aged workers rose slightly from 4.6 per cent in 2022 to 4.7 per cent in 2023, while for young workers the unemployment rate increased by a full percentage point to 12.5 per cent. Older workers saw their unemployment rate decline from 4.6 per cent in 2022 to 4.1 in 2023.
| Age and Gender | Annual Employment Change in 2023 (Thousands) | Annual Employment Change in 2023 (Per Cent) | Unemployment Rate (Per Cent) | ||
|---|---|---|---|---|---|
| 2021 | 2022 | 2023 | |||
| Youth (15-24 years) | 18.4 | 1.8 | 15.9 | 11.5 | 12.5 |
| Males | 24.4 | 4.7 | 16.5 | 12.4 | 12.8 |
| Females | -5.9 | -1.2 | 15.2 | 10.6 | 12.2 |
| Core (25-54 years) | 132.9 | 2.7 | 6.7 | 4.6 | 4.7 |
| Males | 61.8 | 2.4 | 6.6 | 4.3 | 4.5 |
| Females | 71.2 | 3.0 | 6.8 | 5.0 | 5.0 |
| Older (55 years and over) | 31.8 | 1.9 | 7.4 | 4.6 | 4.1 |
| Males | 18.4 | 2.0 | 7.2 | 4.5 | 4.1 |
| Females | 13.4 | 1.8 | 7.8 | 4.7 | 4.0 |
| Total | 183.2 | 2.4 | 8.1 | 5.6 | 5.7 |
Ontario saw job gains across most types of employment categories
Employment grew across most major categories except for self-employed workers. Employment in full-time positions (2.7 per cent) grew at a faster pace in 2023 than part-time positions (1.0 per cent) for the second consecutive year. Employment growth in permanent positions (3.1 per cent) outpaced temporary jobs (1.7 per cent). In the public sector, employment increased at a slower pace than in the private sector in 2023 (1.6 per cent versus 3.3 per cent), after recording faster job gains in the previous two years.
The number of self-employed Ontarians declined by 9,800 (-0.9 per cent) in 2023, marking the third drop in the past four years. Since 2019, 87.6 per cent of the decline in self-employment was driven by self-employed individuals who were unincorporated and had no paid help, which may reflect increased opportunities for paid employment in permanent jobs, which increased at a record pace in 2021 and 2022.[6] The share of workers employed in permanent positions increased to a record high of 76.6 per cent in 2023, while the share of self-employed workers fell to 13.6 per cent, the lowest since 1991.
| Job Category | Annual Employment Change in 2023 (Thousands) | Annual Employment Change in 2023 (Per Cent) |
|---|---|---|
| Type of Employment | ||
| Full-time | 169.8 | 2.7 |
| Part-time | 13.4 | 1.0 |
| Class of Workers | ||
| Private | 168.8 | 3.3 |
| Public | 24.2 | 1.6 |
| Self-employed | -9.8 | -0.9 |
| Job Permanency of Paid Employment* | ||
| Permanent | 180.4 | 3.1 |
| Temporary | 12.6 | 1.7 |
| Total | 183.2 | 2.4 |
Most industries in Ontario saw job growth in 2023
Of the 16 major industries in Ontario, 14 saw an increase in employment in 2023. Health care and social assistance recorded the largest increase in employment (37,600 or 4.0 per cent), followed by accommodation and food services (28,100 or 7.0 per cent) and professional, scientific and technical services (27,800 or 3.5 per cent). At the opposite end, wholesale and retail trade saw a decrease in employment (-24,300 or -2.1 per cent) in 2023 following two years of strong growth. Three industries – accommodation and food services, business, building and other support services, and other services[7] – continued to operate with fewer employees in 2023 compared to before the pandemic in 2019.
| Industry | Annual Employment Change in 2023 (Thousands) | Annual Employment Change in 2023 (Per Cent) |
|---|---|---|
| Health care and social assistance | 37.6 | 4.0 |
| Accommodation and food services | 28.1 | 7.0 |
| Professional, scientific and technical services | 27.8 | 3.5 |
| Manufacturing | 20.9 | 2.7 |
| Other services | 20.0 | 7.9 |
| Transportation and warehousing | 18.7 | 4.9 |
| Public administration | 15.0 | 3.4 |
| Information, culture and recreation | 11.6 | 3.7 |
| Construction | 8.0 | 1.4 |
| Agriculture | 7.5 | 10.5 |
| Educational services | 4.5 | 0.8 |
| Forestry, fishing, mining, quarrying, oil and gas | 3.2 | 8.6 |
| Utilities | 3.2 | 5.3 |
| Finance, insurance, real estate, rental and leasing | 3.0 | 0.4 |
| Business, building and other support services | -1.6 | -0.6 |
| Wholesale and retail trade | -24.3 | -2.1 |
Job vacancies trended lower in 2023
In tandem with the slower pace of employment gains, job vacancies trended lower in 2023, declining 24.9 per cent compared to the previous year.[8] Job vacancies declined in all industries except utilities (43.9 per cent increase). Long-term job vacancies, defined as positions that remained unfilled for 90 days or more, represented 34.2 per cent of all job vacancies in the third quarter of 2023, down from a peak of 37.2 per cent in the fourth quarter of 2022.[9] However, the share of long-term job vacancies remained higher in 2023 in all major occupation groups than before the pandemic in 2019.
| Industry | Annual Change in Job Vacancies in 2023* (Thousands) | Annual Change in Job Vacancies in 2023* (Per Cent) | Job Vacancies in 2023** (Thousands) |
|---|---|---|---|
| Accommodation and food services | -19.3 | -38.4 | 31.0 |
| Wholesale and retail trade | -13.9 | -27.3 | 37.1 |
| Manufacturing | -11.0 | -34.8 | 20.7 |
| Professional, scientific and technical services | -10.8 | -37.0 | 18.4 |
| Finance, insurance, real estate, rental and leasing | -8.1 | -34.0 | 15.7 |
| Construction | -7.8 | -29.1 | 19.1 |
| Business, building and other support services | -6.9 | -22.7 | 23.3 |
| Information, culture and recreation | -5.0 | -30.3 | 11.4 |
| Transportation and warehousing | -2.6 | -16.5 | 13.0 |
| Other services | -2.5 | -17.7 | 11.6 |
| Agriculture, forestry, fishing, hunting | -1.6 | -30.3 | 3.6 |
| Educational services | -0.8 | -7.6 | 9.2 |
| Health care and social assistance | -0.6 | -1.1 | 52.5 |
| Public administration | -0.4 | -7.5 | 5.3 |
| Mining, quarrying, and oil and gas extraction | -0.1 | -11.8 | 1.0 |
| Utilities | 0.5 | 43.9 | 1.6 |
| All Industries | -90.9 | -24.9 | 274.5 |
Employment grew across most Census Metropolitan Areas
All but two census metropolitan areas (CMAs) in Ontario saw an increase in employment in 2023. Windsor (8.2 per cent), Ottawa-Gatineau (5.7 per cent), and Kingston (5.1 per cent) had the fastest pace of job creation. In contrast, Hamilton experienced a decline in employment (-1.1 per cent), driven by job losses in its accommodation and food services, and wholesale and retail trade industries. Employment in Oshawa also declined (-1.0 per cent) as its other services, construction and manufacturing sectors shed jobs. In 2023, employment in Brantford, Greater Sudbury and Hamilton remained below their pre-pandemic 2019 levels.
The unemployment rate increased in nine of the 16 CMAs as their labour force grew faster than employment. Most notably, the unemployment rate in Belleville increased from the lowest among all CMAs in 2022 (3.7 per cent) to the highest in 2023 (6.5 per cent) as its labour force growth (5.7 per cent) more than doubled the rise in employment (2.6 per cent). Across the CMAs, the lowest unemployment rates in 2023 were recorded in Thunder Bay (4.2 per cent), Ottawa-Gatineau (4.5 per cent) and Brantford (4.6 per cent).
| Census Metropolitan Area | Annual Change in Employment, 2023 (Per Cent) | Unemployment Rate (Per Cent) | ||
|---|---|---|---|---|
| 2021 | 2022 | 2023 | ||
| Windsor | 8.2 | 9.7 | 7.7 | 6.4 |
| Ottawa-Gatineau, Ontario part | 5.7 | 6.1 | 4.2 | 4.5 |
| Kingston | 5.1 | 7.5 | 5.5 | 4.7 |
| Barrie | 4.3 | 8.1 | 5.5 | 4.9 |
| London | 3.9 | 7.9 | 5.7 | 5.3 |
| Guelph | 3.6 | 6.8 | 4.2 | 4.7 |
| Thunder Bay | 3.4 | 7.3 | 4.9 | 4.2 |
| Kitchener-Cambridge-Waterloo | 3.0 | 6.3 | 5.7 | 6.0 |
| Toronto | 2.9 | 9.3 | 6.4 | 6.3 |
| Belleville | 2.6 | 8.4 | 3.7 | 6.5 |
| Greater Sudbury | 1.8 | 7.5 | 4.3 | 4.9 |
| Peterborough | 0.8 | 7.8 | 4.5 | 4.7 |
| Brantford | 0.6 | 7.1 | 5.1 | 4.6 |
| St. Catharines-Niagara | 0.4 | 10.3 | 5.2 | 5.8 |
| Oshawa | -1.0 | 7.8 | 5.3 | 5.7 |
| Hamilton | -1.1 | 6.9 | 4.9 | 5.5 |
Employment growth slowed in most provinces in 2023
All provinces experienced job gains in 2023, but at a slower pace compared to 2022 except in New Brunswick and Prince Edward Island. In 2023, Prince Edward Island had the fastest pace of job creation (5.7 per cent) while British Columbia’s employment growth was the slowest (1.6 per cent). Ontario's employment growth (2.4 per cent) was the sixth highest among all provinces.
The unemployment rate dropped in all four Atlantic provinces in 2023 but remained higher than the rest of the country. Newfoundland and Labrador had the highest unemployment rate among the provinces (10.0 per cent), while Quebec had the lowest (4.5 per cent) for the third year in a row. Ontario recorded the fifth lowest unemployment rate in the country, trailing Quebec, Manitoba, Saskatchewan and British Columbia.
| Province | Annual Change in Employment, 2023 (Per Cent) | Unemployment Rate (Per Cent) | ||
|---|---|---|---|---|
| 2021 | 2022 | 2023 | ||
| Prince Edward Island | 5.7 | 9.7 | 7.6 | 7.3 |
| Alberta | 3.6 | 8.6 | 5.8 | 5.9 |
| New Brunswick | 3.5 | 9.2 | 7.2 | 6.6 |
| Nova Scotia | 2.7 | 8.6 | 6.5 | 6.3 |
| Manitoba | 2.5 | 6.5 | 4.6 | 4.8 |
| Ontario | 2.4 | 8.1 | 5.6 | 5.7 |
| Quebec | 2.3 | 6.1 | 4.3 | 4.5 |
| Saskatchewan | 1.8 | 6.6 | 4.7 | 4.8 |
| Newfoundland and Labrador | 1.8 | 13.1 | 11.3 | 10.0 |
| British Columbia | 1.6 | 6.6 | 4.6 | 5.2 |
| Canada | 2.4 | 7.5 | 5.3 | 5.4 |
Wage growth in Ontario outpaced inflation in 2023
Following two years of wage growth lagging inflation, the average hourly wage of Ontarians increased 5.1 per cent to $34.63 in 2023, above the 3.8 per cent average annual CPI inflation rate.
Figure 2 Average hourly wage growth outpaced inflation in 2023
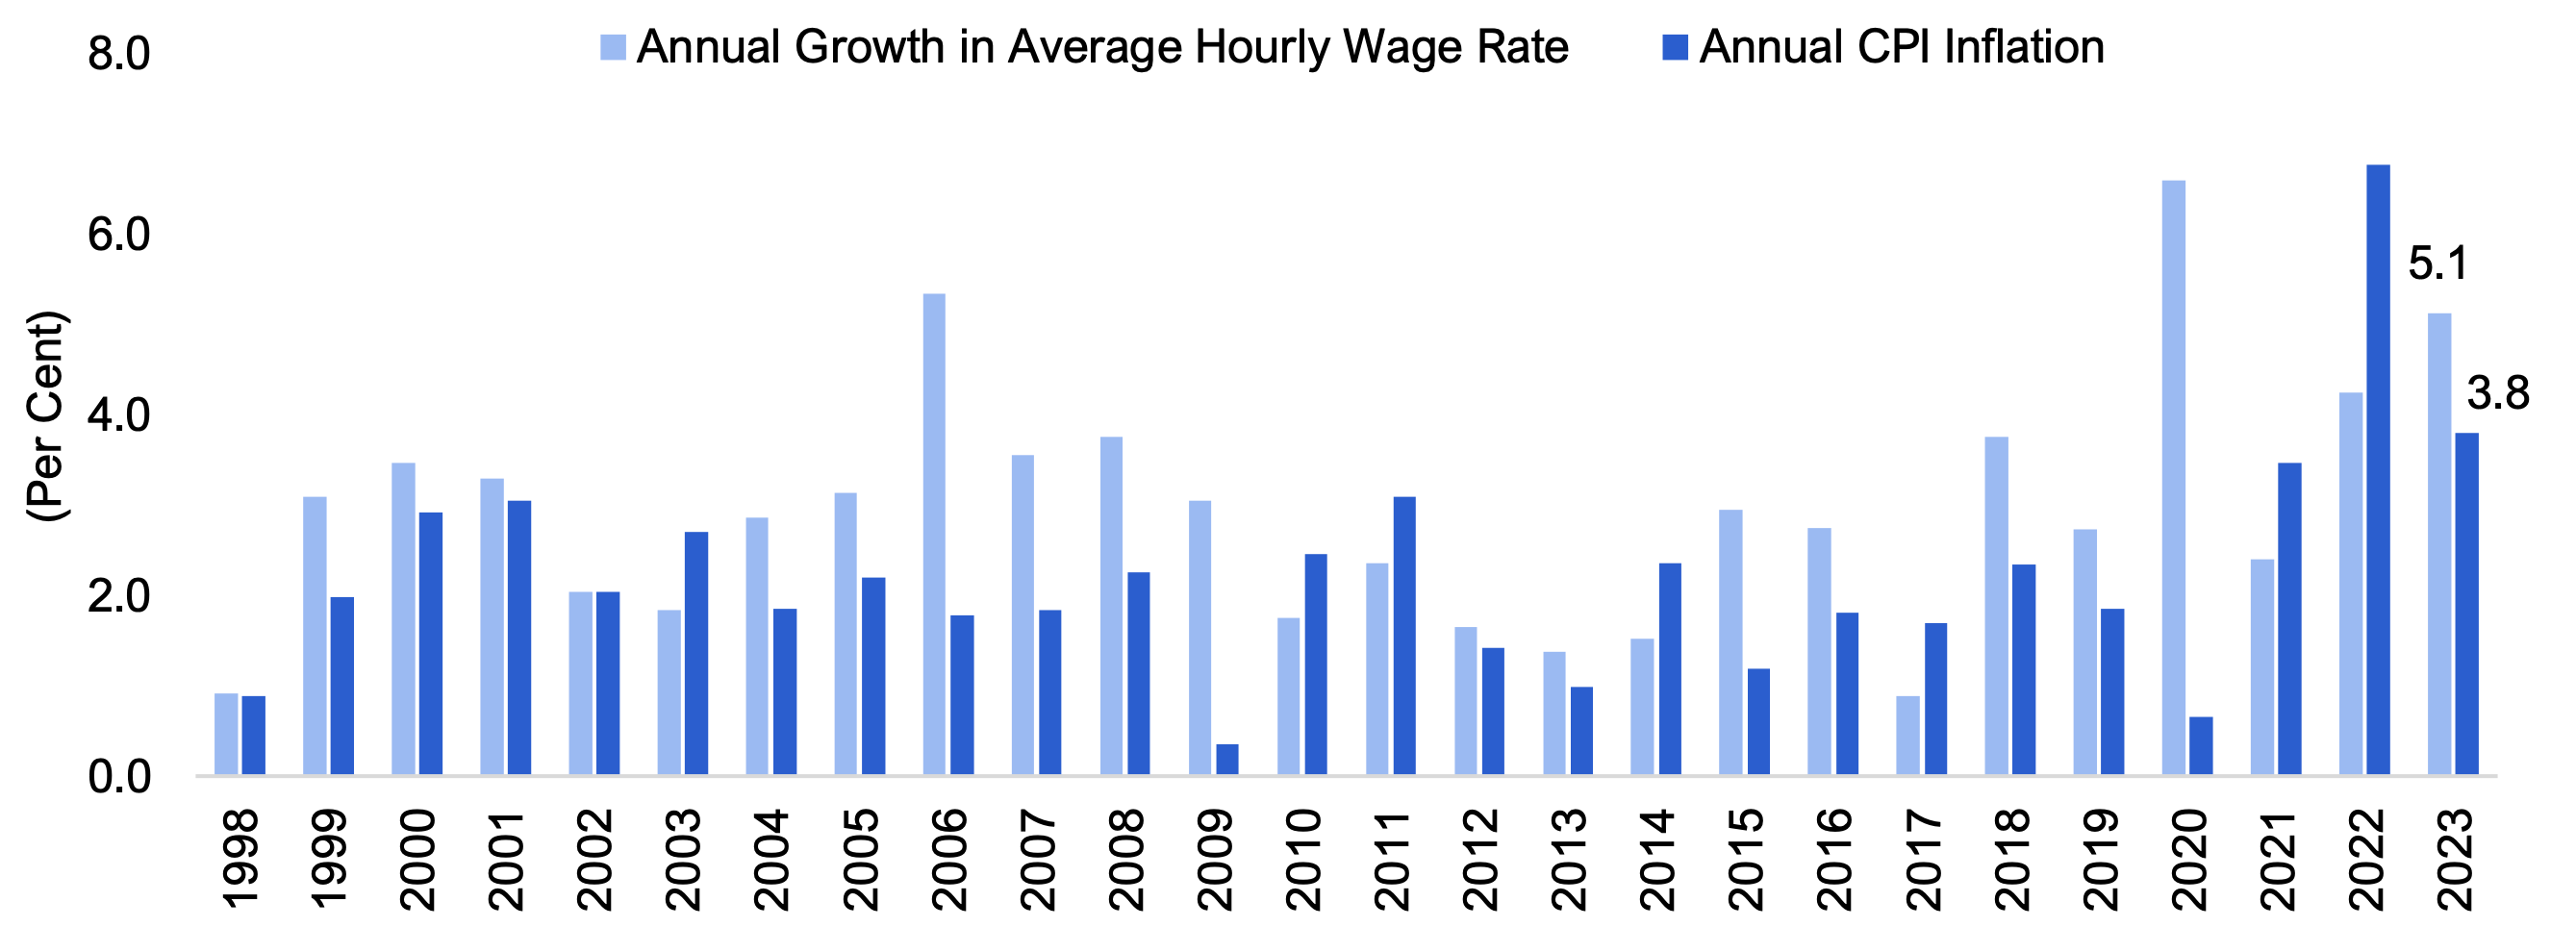
Source: Statistics Canada: Labour Force Survey: Table 14-10-0064-01 and Consumer Price Index: Table 18-10-0005-01
Wage growth was above the 3.8 per cent inflation rate for all major groups except part-time workers. Wages for full-time employees increased 5.4 per cent, almost double the 2.8 per cent growth for part-time workers. Across the broader age groups, core-aged workers saw average wage gains of 5.3 per cent, while both young and older workers had average hourly wage growth of 4.6 per cent. Average wage growth for female workers (5.4 per cent) outpaced that for male workers (4.8 per cent).
Figure 3 Average hourly wage growth was above inflation for most major groups
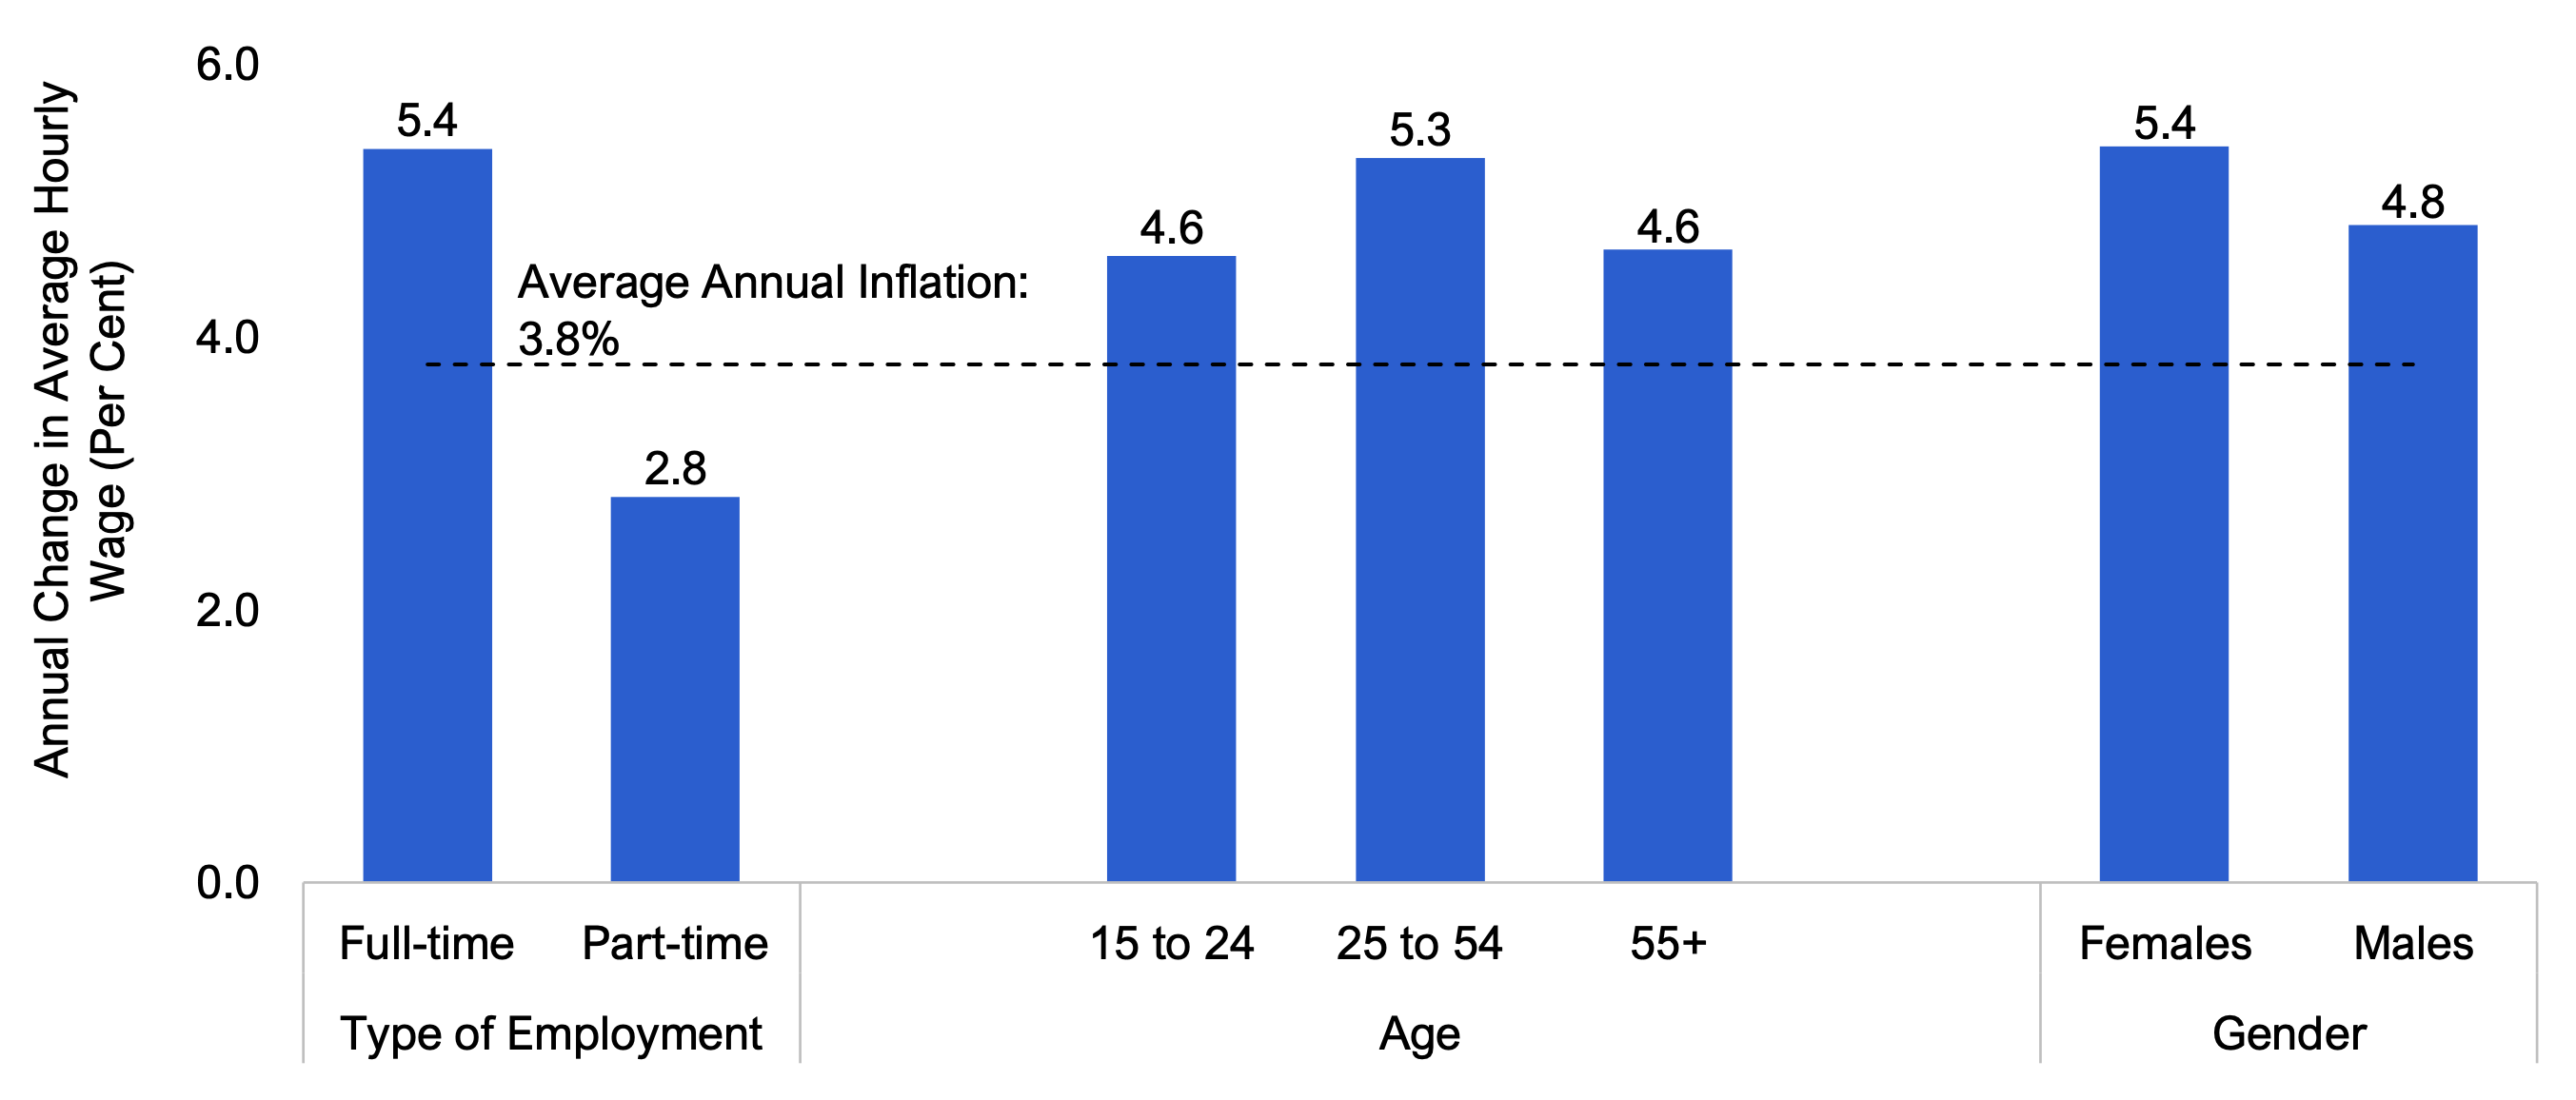
Source: Statistics Canada: Labour Force Survey: Table 14-10-0064-01
Wage growth in majority of industries and occupation groups exceeded inflation
Of the 16 major industry groups, 12 industries saw their average hourly wage rate increase faster than inflation. Agriculture — the industry with the fastest pace of job gains in 2023 — recorded the strongest annual wage growth. The second highest wage growth was recorded in forestry, fishing, mining, quarrying, oil and gas, which also had the second fastest pace of job gains. Wages in health care and social assistance, one of the largest sources of employment in Ontario, increased slightly above inflation at 4.0 per cent. Accommodation and food services, which historically has the lowest average hourly wage rate among all industries, saw their wages increase less than inflation at 3.1 per cent, while wages for workers in the information, culture and recreation industry declined by 1.0 per cent.
| Industry | Average Hourly Wage Rate, 2023 ($) | Annual Change in Average Hourly Wage Rate in 2023 (Per Cent) |
|---|---|---|
| Agriculture | 25.9 | 19.6 |
| Forestry, fishing, mining, quarrying, oil and gas | 44.6 | 10.1 |
| Manufacturing | 33.3 | 7.8 |
| Professional, scientific and technical services | 46.5 | 6.7 |
| Transportation and warehousing | 31.7 | 5.9 |
| Public administration | 44.7 | 5.8 |
| Construction | 35.9 | 5.7 |
| Finance, insurance, real estate, rental and leasing | 43.3 | 5.4 |
| Wholesale and retail trade | 26.7 | 5.4 |
| Other services | 29.3 | 5.1 |
| Business, building and other support services | 26.6 | 5.0 |
| Health care and social assistance | 32.5 | 4.0 |
| Utilities | 50.8 | 3.2 |
| Accommodation and food services | 19.5 | 3.1 |
| Education | 39.8 | 1.2 |
| Information, culture and recreation | 32.2 | -1.0 |
| Total employees, all industries | 34.6 | 5.1 |
Across 34 different occupation groups, the average hourly wage for 18 occupations increased above inflation in 2023. Occupation groups with the strongest wage growth were middle management occupations in trades, transportation, production and utilities (11.9 per cent), occupations and support occupations in art, culture and sport (10.6 and 8.4 per cent) and workers and labourers in natural resources, agriculture and related production (7.7 per cent). Wages in technical occupations in art, culture and sport[10] declined slightly (-0.1 per cent). Wage growth in middle management occupations in retail and wholesale trade and customer services (0.7 per cent), front-line public protection services and paraprofessional occupations in legal, social, community, education services (1.2 per cent), labourers in processing, manufacturing and utilities (1.6 per cent) and professional occupations in health (1.6 per cent) were all below inflation.
| National Occupational Classification (NOC) | Average Hourly Wage Rate, 2023 ($) | Annual Change in Average Hourly Wage Rate (Per Cent) |
|---|---|---|
| Management occupations | 59.8 | 5.6 |
| Legislative and senior management occupations | 93.7 | 7.1 |
| Specialized middle management occupations | 62.5 | 4.5 |
| Middle management occupations in retail and wholesale trade and customer services | 45.8 | 0.7 |
| Middle management occupations in trades, transportation, production and utilities | 55.6 | 11.9 |
| Business, finance and administration occupations except management | 34.1 | 4.8 |
| Professional occupations in finance and business | 43.7 | 4.7 |
| Administrative and financial supervisors and specialized administrative occupations | 34.4 | 3.9 |
| Administrative occupations and transportation logistics occupations | 30.1 | 4.7 |
| Administrative and financial support and supply chain logistics occupations | 24.8 | 3.0 |
| Natural and applied sciences and related occupations except management | 45.8 | 5.5 |
| Professional occupations in natural and applied sciences | 50.2 | 5.1 |
| Technical occupations related to natural and applied sciences | 34.6 | 3.0 |
| Health occupations except management | 34.7 | 3.8 |
| Professional occupations in health | 43.0 | 1.6 |
| Technical occupations in health | 34.4 | 6.2 |
| Assisting occupations in support of health services | 23.9 | 3.1 |
| Occupations in education, law and social, community and government services except management | 40.4 | 3.7 |
| Professional occupations in law, education, social, community and government services | 46.2 | 4.9 |
| Front-line public protection services and paraprofessional occupations in legal, social, community, education services | 31.2 | 1.2 |
| Assisting occupations in education and in legal and public protection | 29.0 | 5.4 |
| Care providers and public protection support occupations and student monitors, crossing guards and related occupations | 21.5 | 2.8 |
| Occupations in art, culture, recreation and sport except management | 29.4 | 3.6 |
| Professional occupations in art and culture | 36.0 | 3.3 |
| Technical occupations in art, culture and sport | 33.2 | -0.1 |
| Occupations in art, culture and sport | 27.1 | 10.6 |
| Support occupations in art, culture and sport | 21.7 | 8.4 |
| Sales and service occupations except management | 22.2 | 3.0 |
| Retail sales and service supervisors and specialized occupations in sales and services | 28.1 | 3.3 |
| Occupations in sales and services | 25.4 | 2.4 |
| Sales and service representatives and other customer and personal services occupations | 23.1 | 3.2 |
| Sales and service support occupations | 18.1 | 3.0 |
| Trades, transport and equipment operators and related occupations except management | 30.7 | 3.8 |
| Technical trades and transportation officers and controllers | 35.6 | 3.5 |
| General trades | 27.5 | 2.6 |
| Mail and message distribution, other transport equipment operators and related maintenance workers | 27.4 | 4.2 |
| Helpers and labourers and other transport drivers, operators and labourers | 24.1 | 5.6 |
| Natural resources, agriculture and related production occupations except management | 26.5 | 8.0 |
| Supervisors and occupations in natural resources, agriculture and related production | 37.0 | 3.8 |
| Workers and labourers in natural resources, agriculture and related production | 23.0 | 7.7 |
| Occupations in manufacturing and utilities except management | 27.2 | 6.3 |
| Supervisors, central control and process operators in processing, manufacturing and utilities and aircraft assemblers and inspectors | 39.3 | 6.6 |
| Machine operators, assemblers and inspectors in processing, manufacturing and printing | 24.6 | 5.4 |
| Labourers in processing, manufacturing and utilities | 21.1 | 1.6 |
| Total employees, all occupations | 34.6 | 5.1 |
Graphical Descriptions
| Year | Change in Employment (Thousands) | Unemployment Rate (Per Cent) |
|---|---|---|
| 1977 | 63.2 | 6.9 |
| 1978 | 119.7 | 7.2 |
| 1979 | 169.2 | 6.6 |
| 1980 | 72.3 | 6.9 |
| 1981 | 127.4 | 6.6 |
| 1982 | -93.9 | 9.8 |
| 1983 | 50.4 | 10.4 |
| 1984 | 161.2 | 9.0 |
| 1985 | 166.4 | 7.9 |
| 1986 | 157.3 | 7.0 |
| 1987 | 161.7 | 6.1 |
| 1988 | 187.5 | 5.0 |
| 1989 | 115.9 | 5.0 |
| 1990 | -4.9 | 6.2 |
| 1991 | -177.0 | 9.5 |
| 1992 | -84.2 | 10.8 |
| 1993 | 5.1 | 10.9 |
| 1994 | 75.6 | 9.6 |
| 1995 | 86.4 | 8.7 |
| 1996 | 65.9 | 9.0 |
| 1997 | 124.8 | 8.4 |
| 1998 | 163.2 | 7.2 |
| 1999 | 181.4 | 6.3 |
| 2000 | 179.6 | 5.7 |
| 2001 | 106.4 | 6.3 |
| 2002 | 112.9 | 7.1 |
| 2003 | 178.7 | 6.9 |
| 2004 | 101.4 | 6.8 |
| 2005 | 66.7 | 6.6 |
| 2006 | 79.5 | 6.4 |
| 2007 | 76.8 | 6.4 |
| 2008 | 63.4 | 6.6 |
| 2009 | -156.0 | 9.2 |
| 2010 | 102.7 | 8.8 |
| 2011 | 110.6 | 8.0 |
| 2012 | 44.9 | 8.0 |
| 2013 | 104.0 | 7.6 |
| 2014 | 33.1 | 7.4 |
| 2015 | 47.0 | 6.8 |
| 2016 | 69.4 | 6.5 |
| 2017 | 160.9 | 6.1 |
| 2018 | 128.6 | 5.6 |
| 2019 | 183.3 | 5.6 |
| 2020 | -403.3 | 9.8 |
| 2021 | 367.4 | 8.1 |
| 2022 | 338.3 | 5.6 |
| 2023 | 183.2 | 5.7 |
| Year | Annual Growth in Average Hourly Wage Rate (Per Cent) | Annual CPI Inflation (Per Cent) |
|---|---|---|
| 1998 | 0.9 | 0.9 |
| 1999 | 3.1 | 2.0 |
| 2000 | 3.5 | 2.9 |
| 2001 | 3.3 | 3.0 |
| 2002 | 2.0 | 2.0 |
| 2003 | 1.8 | 2.7 |
| 2004 | 2.9 | 1.9 |
| 2005 | 3.1 | 2.2 |
| 2006 | 5.3 | 1.8 |
| 2007 | 3.6 | 1.8 |
| 2008 | 3.8 | 2.3 |
| 2009 | 3.0 | 0.4 |
| 2010 | 1.8 | 2.5 |
| 2011 | 2.4 | 3.1 |
| 2012 | 1.6 | 1.4 |
| 2013 | 1.4 | 1.0 |
| 2014 | 1.5 | 2.4 |
| 2015 | 2.9 | 1.2 |
| 2016 | 2.7 | 1.8 |
| 2017 | 0.9 | 1.7 |
| 2018 | 3.8 | 2.4 |
| 2019 | 2.7 | 1.9 |
| 2020 | 6.6 | 0.7 |
| 2021 | 2.4 | 3.5 |
| 2022 | 4.2 | 6.8 |
| 2023 | 5.1 | 3.8 |
| Annual Change in Average Hourly Wage (Per Cent) | Average Annual Inflation (Per Cent) | ||
|---|---|---|---|
| Type of Employment | Full-time | 5.4 | 3.8 |
| Part-time | 2.8 | 3.8 | |
| Age | 15 to 24 | 4.6 | 3.8 |
| 25 to 54 | 5.3 | 3.8 | |
| 55+ | 4.6 | 3.8 | |
| Gender | Females | 5.4 | 3.8 |
| Males | 4.8 | 3.8 |
Footnotes
[1] Defined as the percentage of the working-age population who are participating in the labour market whether employed or unemployed and looking for work.
[2] As the economy recovered from the COVID-19 pandemic shutdowns, employment in Ontario increased by 367,400 (5.2 per cent) in 2021 and 338,300 (4.6 per cent) in 2022, marking the fastest two-year job gain on record back to 1976.
[3] Defined at those aged 15 and over.
[4] Defined as the percentage of the working-age population who are participating in the labour market whether employed or unemployed and looking for work.
[5] Defined as the percentage of the working-age population who are employed.
[6] The annual increase in permanent jobs in 2021 (5.5 per cent) and 2022 (5.3 per cent) were the fastest pace on record.
[7] Other services include industries related to repair and maintenance of motor vehicles, machinery and equipment and other products, personal care services, funeral services, laundry services, and other services to individuals, religious, grant-making, civic, and professional and similar organizations, as well as private households engaged in employing workers, such as cooks, maids, gardeners or caretakers, and babysitting. For details, see North American Industry Classification System (NAICS) Canada 2017 Version 3.0.
[8] Change in the average number of job vacancies in the first three quarters of 2023 compared to the average over the same period in 2022.
[9] Statistics Canada: Job Vacancy and Wage Survey: Table 14-10-0328-01.
[10] According to Statistics Canada’s National Occupation Classification 2021, technical occupations in art, culture and sport are TEER (Training, Education, Experience and Responsibility) 2 occupations that usually require a college diploma or apprenticeship training of two or more years, or supervisory occupations. Occupations in art, culture and sport are TEER 3 occupations that usually require a college diploma or apprenticeship training of less than two years, or more than six months of on-the-job training. Support occupations in art, culture and sport are TEER 4 and 5 occupations that usually require a secondary school diploma, several weeks of on-the-job training, or short-term work demonstration and no formal education.