


Progress, challenges and potential impacts of $10 a day child care
1. Purpose and Scope
This report examines the historical trends in labour market participation and outcomes for women in Ontario and assesses how women compare to men. Despite government initiatives and policies to advance gender equality, large gaps remain in labour market participation and outcomes between men and women. Analyzing these disparities helps to assess the extent to which everyone has an equal opportunity to take part in Ontario’s labour market and derive equivalent economic benefits for comparable work regardless of gender.
This topic has many interconnected issues, such as the motherhood penalty women face after having children, which is revealed in the differences in labour market outcomes between mothers and women without young children. Understanding the motherhood penalty and its measurable impacts on women with young children is an important part of evaluating gender equity policies such as subsidized child care.
The report uses several publicly available and custom data sources from Statistics Canada, which are listed and described in the Appendix. Note these data sources rely on Statistics Canada’s two main classifications of sex at birth, male and female; a transgender or non-binary option is not included.[1]
The FAO welcomes feedback on this report and any suggestions for related work in the future.
2. Summary
This report analyzes labour market trends for women in Ontario, with a specific focus on the differences in participation rates, earnings and access to opportunities between men and women, as well as between mothers and women who do not have young children. It also explores the potential labour market impacts of $10 a day child care in Ontario.
Participation of women in Ontario’s labour market
Labour participation is the proportion of the population that is engaged in the job market, either employed or unemployed but actively looking for work. Since the mid-1970s, the gap in overall labour market participation between men and women has narrowed but there continues to be large differences among core age (25-54 years) and older (55+ years) workers. For example, women 35 to 39 years of age had a labour participation rate nearly 10 percentage points lower than men of the same age in 2022.
Participation in the labour market is significantly impacted by parenthood. While the core-age labour market participation gap between men and women without young children has significantly narrowed over time, the gap between mothers and fathers with young children is much wider and has not narrowed in nearly two decades. In 2022, the labour participation rate of these mothers was 14.1 percentage points lower than fathers, more than four times the gender gap for workers without young children.
Figure 2.1 Gender participation rate gap for men and women without young children almost closed, still wide for parents
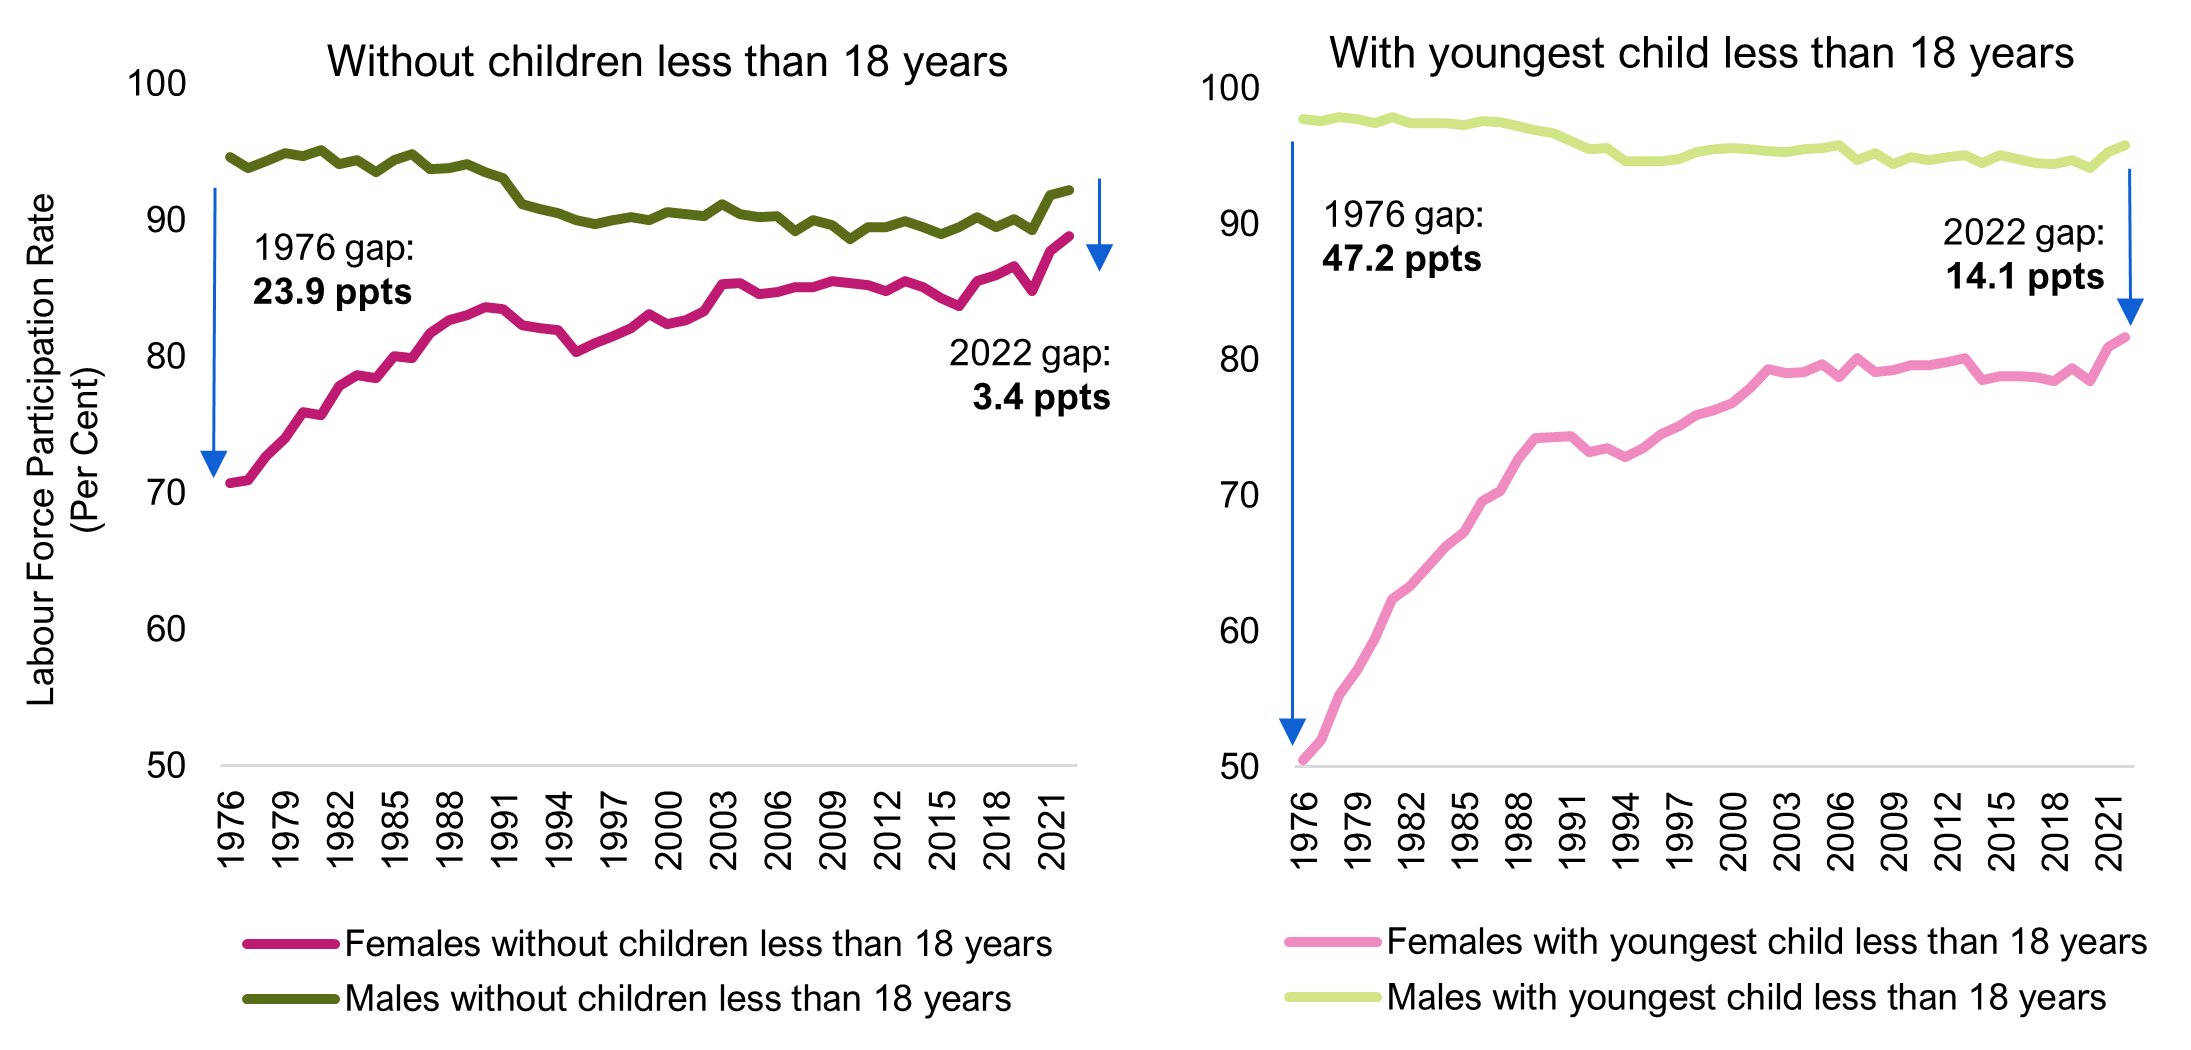
Note: Labour force participation rate gap is shown for core-age group (25-54 years).
Source: Statistics Canada and FAO.
Accessible version
| Year | Labour Force Participation Gap (Per Cent) | |||
|---|---|---|---|---|
| Without children less than 18 years | With youngest child less than 18 years | |||
| Women | Men | Women | Men | |
| 1976 | 70.7 | 94.6 | 50.5 | 97.7 |
| 1977 | 70.9 | 93.8 | 52 | 97.6 |
| 1978 | 72.7 | 94.3 | 55.3 | 97.9 |
| 1979 | 74 | 94.9 | 57.1 | 97.7 |
| 1980 | 75.9 | 94.7 | 59.5 | 97.4 |
| 1981 | 75.7 | 95.1 | 62.4 | 97.9 |
| 1982 | 77.8 | 94.1 | 63.3 | 97.4 |
| 1983 | 78.6 | 94.4 | 64.8 | 97.4 |
| 1984 | 78.4 | 93.5 | 66.3 | 97.4 |
| 1985 | 80 | 94.4 | 67.3 | 97.3 |
| 1986 | 79.9 | 94.8 | 69.6 | 97.6 |
| 1987 | 81.7 | 93.7 | 70.3 | 97.5 |
| 1988 | 82.7 | 93.8 | 72.7 | 97.2 |
| 1989 | 83 | 94.1 | 74.2 | 96.9 |
| 1990 | 83.6 | 93.5 | 74.3 | 96.7 |
| 1991 | 83.5 | 93.1 | 74.4 | 96.1 |
| 1992 | 82.3 | 91.2 | 73.2 | 95.5 |
| 1993 | 82.1 | 90.8 | 73.5 | 95.6 |
| 1994 | 81.9 | 90.5 | 72.8 | 94.6 |
| 1995 | 80.3 | 90 | 73.5 | 94.6 |
| 1996 | 81 | 89.7 | 74.5 | 94.6 |
| 1997 | 81.5 | 90 | 75.1 | 94.8 |
| 1998 | 82.1 | 90.2 | 75.9 | 95.3 |
| 1999 | 83.1 | 90 | 76.3 | 95.5 |
| 2000 | 82.4 | 90.6 | 76.8 | 95.6 |
| 2001 | 82.7 | 90.4 | 77.9 | 95.5 |
| 2002 | 83.3 | 90.3 | 79.3 | 95.4 |
| 2003 | 85.3 | 91.2 | 79 | 95.3 |
| 2004 | 85.4 | 90.4 | 79.1 | 95.5 |
| 2005 | 84.6 | 90.2 | 79.7 | 95.6 |
| 2006 | 84.7 | 90.3 | 78.7 | 95.8 |
| 2007 | 85.1 | 89.2 | 80.1 | 94.7 |
| 2008 | 85.1 | 90 | 79.1 | 95.2 |
| 2009 | 85.5 | 89.6 | 79.2 | 94.4 |
| 2010 | 85.4 | 88.6 | 79.6 | 94.9 |
| 2011 | 85.2 | 89.5 | 79.6 | 94.7 |
| 2012 | 84.8 | 89.5 | 79.8 | 94.9 |
| 2013 | 85.5 | 89.9 | 80.1 | 95.1 |
| 2014 | 85.1 | 89.5 | 78.5 | 94.5 |
| 2015 | 84.3 | 89 | 78.8 | 95.1 |
| 2016 | 83.7 | 89.5 | 78.8 | 94.8 |
| 2017 | 85.5 | 90.2 | 78.7 | 94.5 |
| 2018 | 86 | 89.5 | 78.4 | 94.4 |
| 2019 | 86.6 | 90.1 | 79.4 | 94.7 |
| 2020 | 84.8 | 89.3 | 78.4 | 94.1 |
| 2021 | 87.7 | 91.8 | 80.9 | 95.3 |
| 2022 | 88.8 | 92.2 | 81.7 | 95.8 |
Labour market outcomes of women
Figure 2.2 The overall gender wage ratio has not improved in the past decade
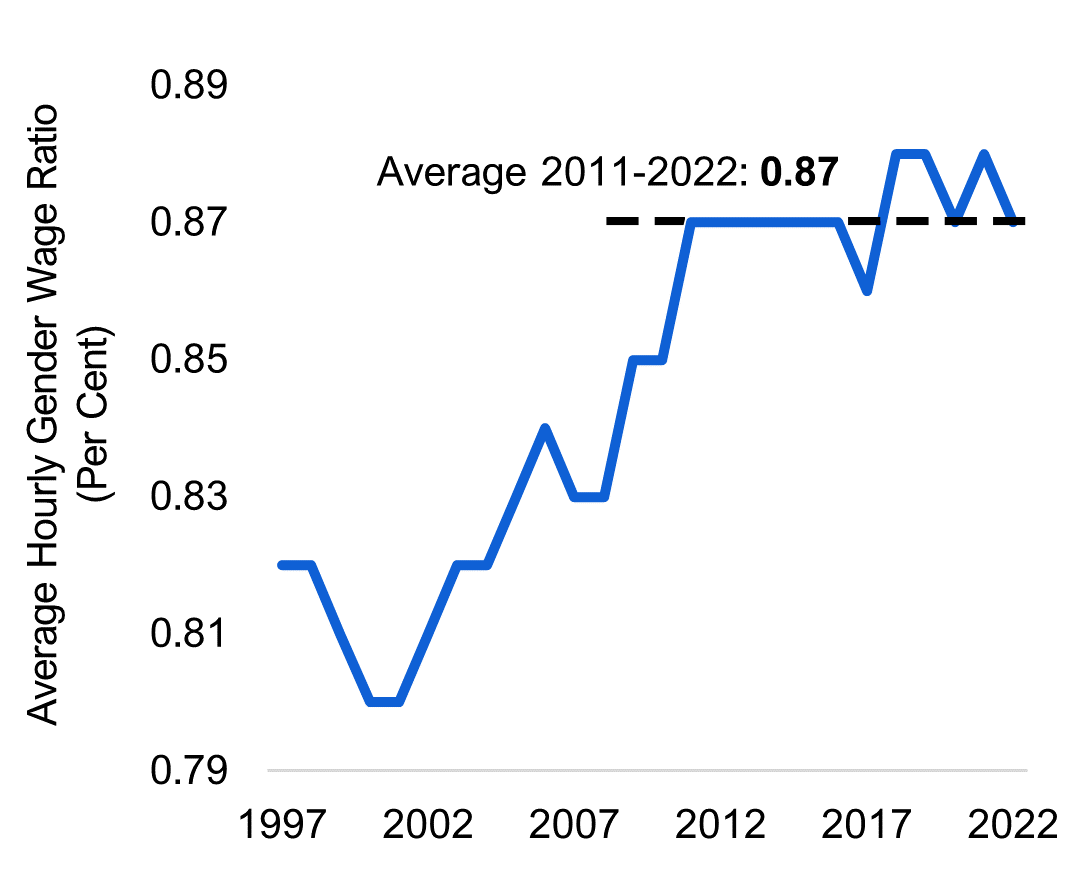
Source: Statistics Canada and FAO.
Accessible version
| Year | Average Hourly Gender Wage Ratio (Per Cent) |
|---|---|
| 1997 | 0.82 |
| 1998 | 0.82 |
| 1999 | 0.81 |
| 2000 | 0.8 |
| 2001 | 0.8 |
| 2002 | 0.81 |
| 2003 | 0.82 |
| 2004 | 0.82 |
| 2005 | 0.83 |
| 2006 | 0.84 |
| 2007 | 0.83 |
| 2008 | 0.83 |
| 2009 | 0.85 |
| 2010 | 0.85 |
| 2011 | 0.87 |
| 2012 | 0.87 |
| 2013 | 0.87 |
| 2014 | 0.87 |
| 2015 | 0.87 |
| 2016 | 0.87 |
| 2017 | 0.86 |
| 2018 | 0.88 |
| 2019 | 0.88 |
| 2020 | 0.87 |
| 2021 | 0.88 |
| 2022 | 0.87 |
Ontario women continue to experience disparities in their wages. The gender wage ratio, a measure of how much females earn per hour relative to their male counterparts has not improved in Ontario over the past decade, hovering around $0.87. This means that women workers earn 87 cents for every dollar earned by men. The gender wage gap persists across all age groups and across all broad occupational categories.
While the occupational composition of employed women explains some of the overall gender wage gap, the FAO estimates this only accounts for 2 cents of the 13-cent gender wage gap. The remaining 11 cents of the gender wage gap is due to wage inequality within occupations, which is difficult to quantify but could be due to gender-based wage discrimination, or women’s selection of less demanding or more flexible work to accommodate family or caregiving responsibilities, among other factors.
In addition to this wage disparity, women are disproportionately represented in part-time jobs, and are underrepresented in management positions despite having surpassed men in educational attainment. Some women also face a short-term “motherhood earnings penalty.” Using new data for Ontario mothers across two cohorts (2003 and 2014), the FAO finds that after having a child, it takes Ontario mothers up to four years to return to their pre-childbirth earnings level.
Figure 2.3 Ontario mothers face earnings loss up to four years following childbirth
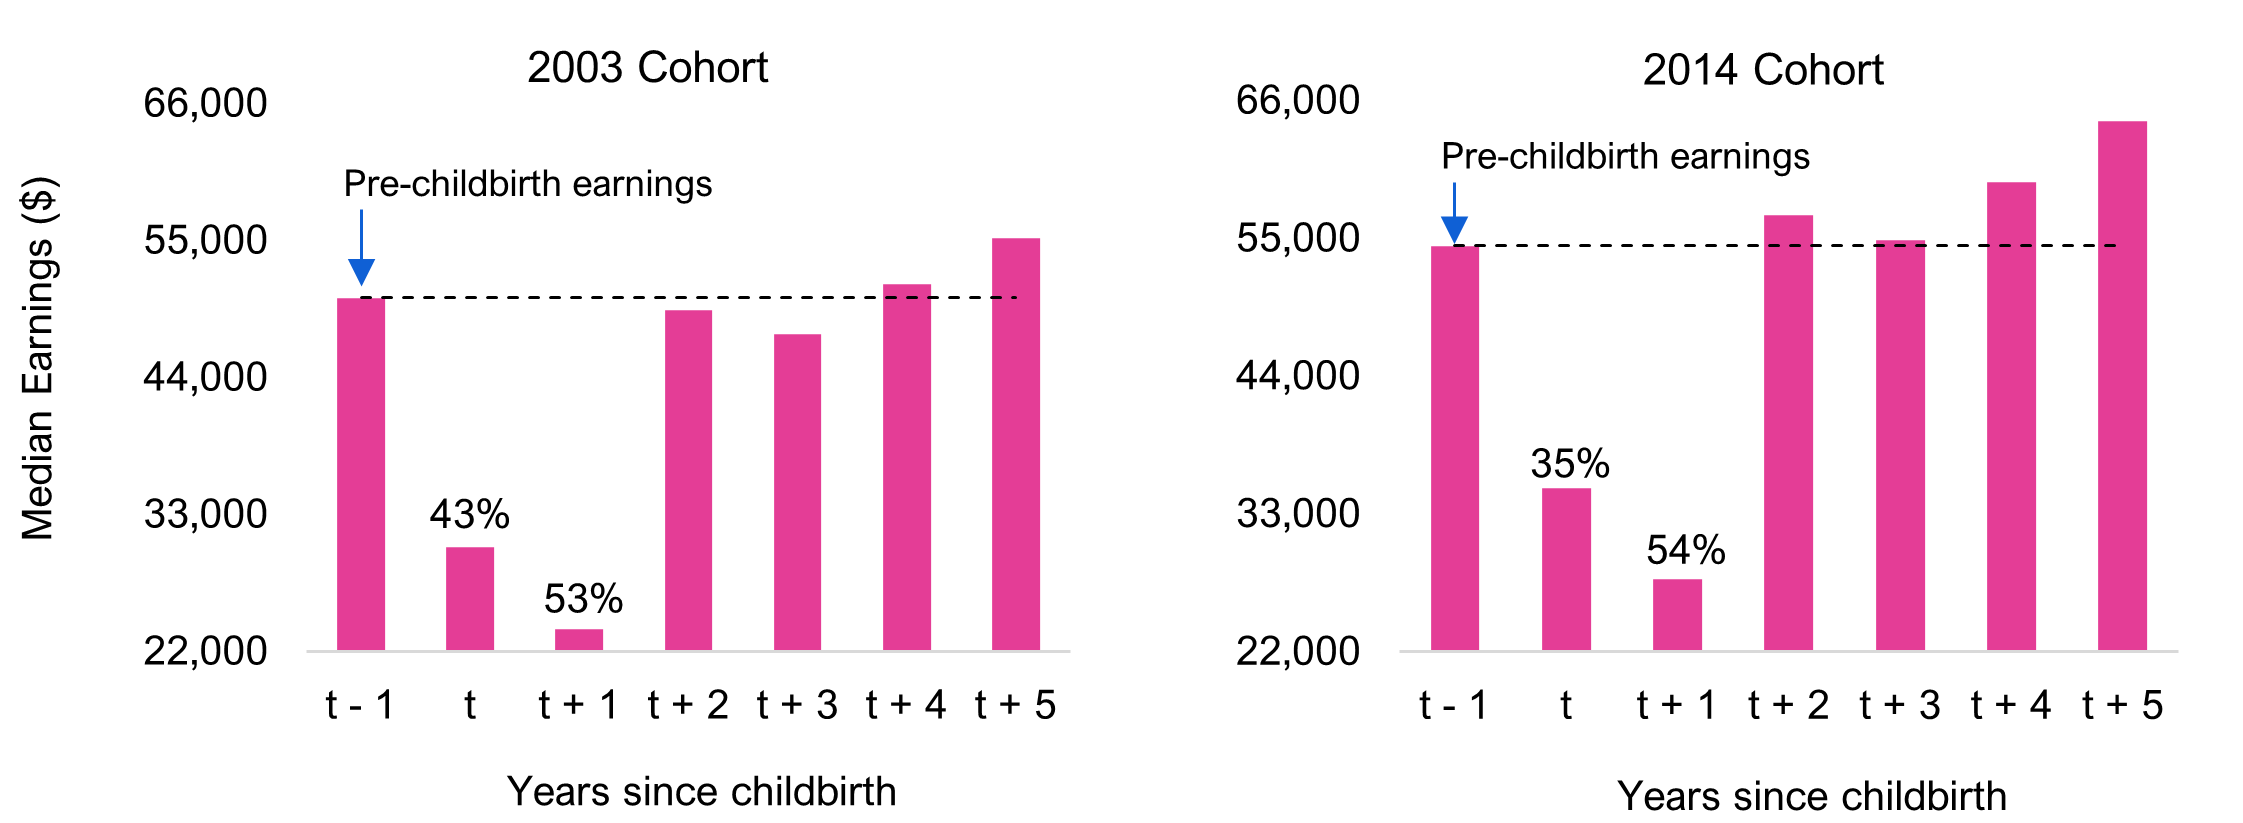
Note: “t” represents the year of childbirth.
Source: Statistics Canada and FAO
Accessible version
| Years since childbirth | Median Earnings ($) | |
|---|---|---|
| 2003 Cohort | 2014 Cohort | |
| t – 1 | 50,400 | 54,400 |
| t | 30,400 | 35,100 |
| t + 1 | 23,800 | 27,800 |
| t + 2 | 49,400 | 56,900 |
| t + 3 | 47,500 | 54,900 |
| t + 4 | 51,500 | 59,500 |
| t + 5 | 55,200 | 64,400 |
Potential impacts of $10 a day child care in Ontario
In 2021, Ontario and the federal government signed the Canada-Ontario Early Years and Child Care Agreement, in which participating child care operators were to reduce child care fees for children under six years of age by 50 per cent from 2019 levels by the end of December 2022, and offer an average $10 a day child care by September 2025.
Figure 2.4 $10 a day childcare will raise the labour market participation on Ontario women
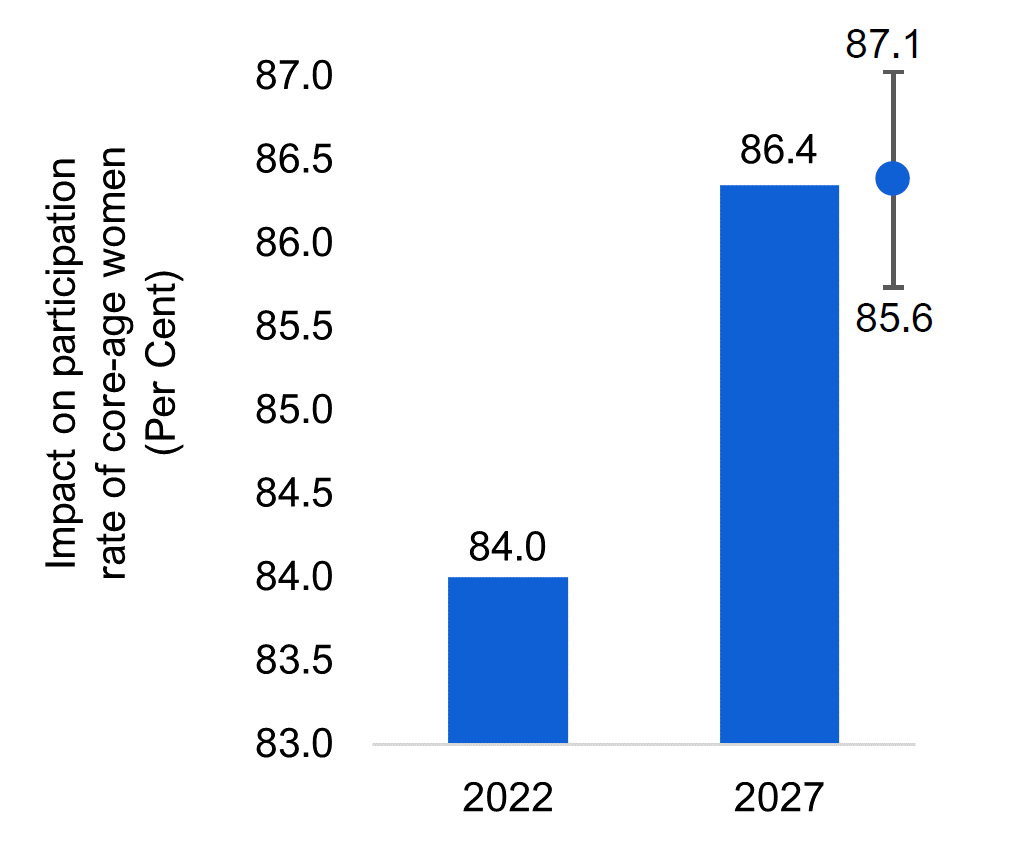
Source: Statistics Canada and FAO.
Accessible version
| Year | Impact on Participation Rate of Core Age Women (Per Cent) |
|---|---|
| 2022 | 84 |
| 2027 | 86.4 |
While it is less clear if subsidized child care will improve the short-term earnings profile of mothers following childbirth, it is likely to improve female labour participation based on experiences observed elsewhere. Assuming the objectives set out in this bilateral agreement between Ontario and the federal government are met, the FAO estimates that subsidized child care fees in Ontario could increase the core-age female labour force participation rate from 84 per cent in 2022 to between 85.6 and 87.1 per cent by 2027. This would add 50,900 to 98,600 more women to Ontario’s labour force.
However, several key challenges to the $10 a day child care program in Ontario could limit the positive potential impacts on women’s labour market participation, including inadequate funding, a lack of child care spaces, a shortage of qualified early childhood educators and any future changes to parental leave benefits.
3. Participation of Women in Ontario’s Labour Market
This chapter presents how the labour market participation of women in Ontario has evolved over time. The chapter shows how women continue to have lower labour market participation than men, and this difference widens with age. However, among more highly educated women, the labour market participation gap is smaller. Mothers in particular persistently have much lower labour market attachment compared to fathers and women without young children, reflecting the time taken away to care for young children.
Women have increasingly joined the labour market, but persistently lag behind Men
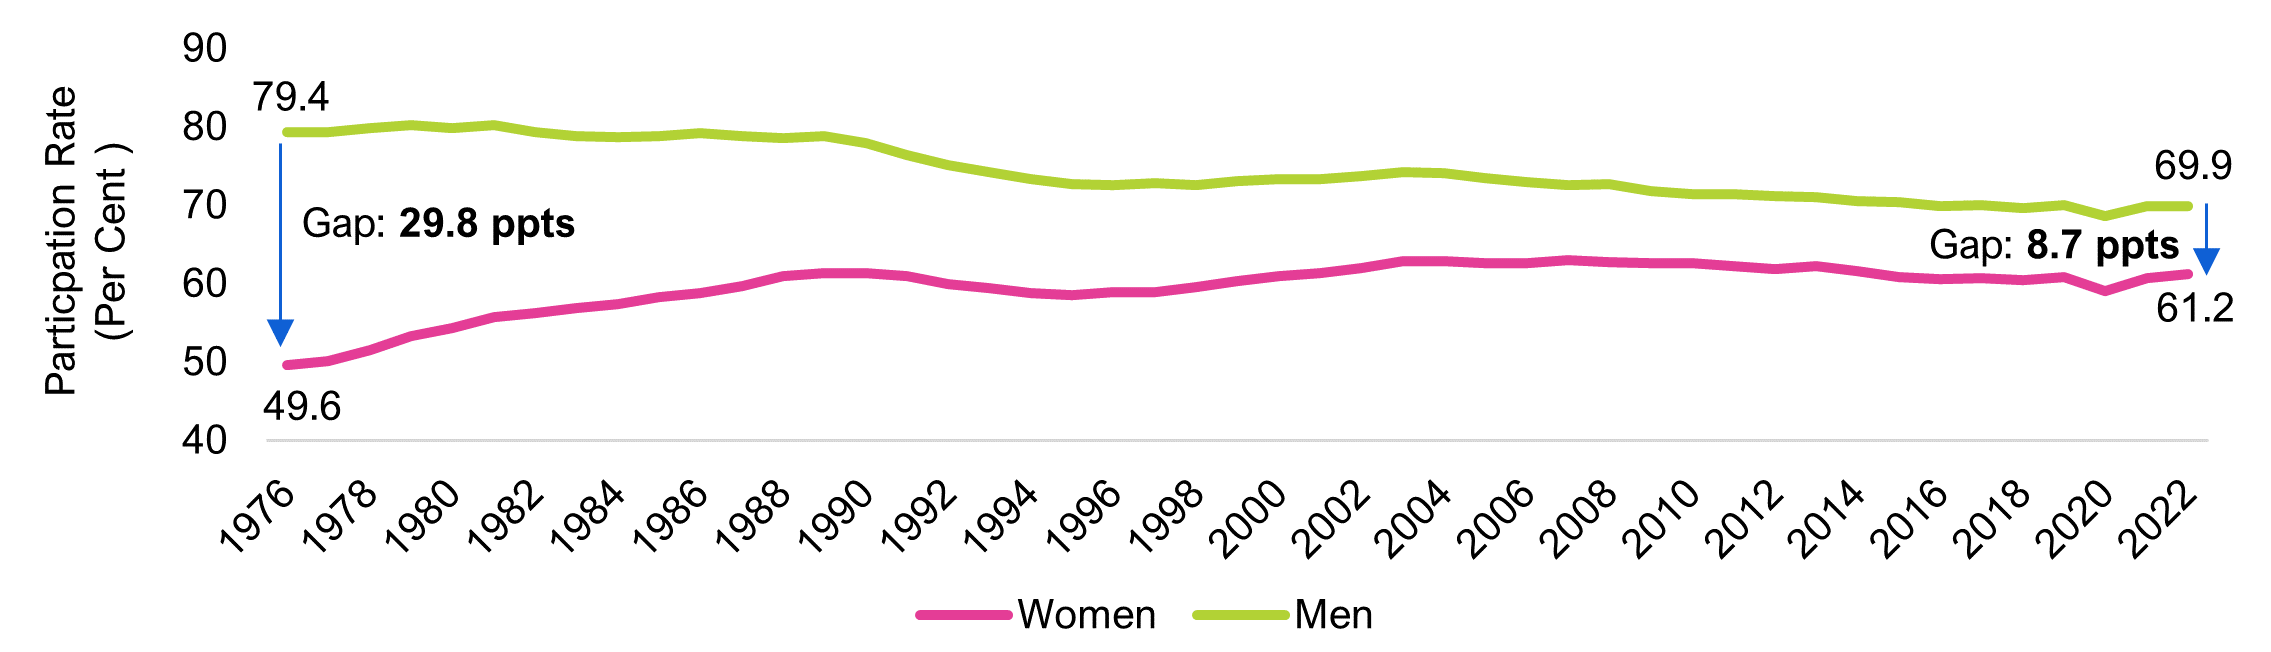
Over the last 45 years, an ever-growing proportion of women, notably in the core working age group (25-54 years) has joined the labour market in Ontario. This has resulted in the labour participation rate of women increasing from 49.6 per cent in 1976 to 61.2 per cent in 2022.This increase was larger than the decline in the labour participation rate (9.5 percentage points)[2] of men over the same period. As a result, the gap in labour participation between men and women in Ontario has narrowed significantly from 29.8 percentage points in 1976 to 8.7 percentage points in 2022, similar to trends observed in all the other provinces in Canada. However, this narrowing has occurred unevenly over time, with very little progress over the past 20 years.
Figure 3.1 Narrowing gap in labour participation rates of men and women
Source: Statistics Canada and FAO.
Many factors have contributed to rising participation of women in Ontario’s workforce, including the evolution of cultural attitudes and perceptions towards women and work, women’s increased educational attainment, changes in labour market conditions such as the rise of employment opportunities in the service sector, flexible work arrangements and increased government supports through family-friendly policies.[3]
Gender gap in participation rate varies by age and educational attainment
While the overall gap in labour market participation between men and women has narrowed over the years, certain groups of women continued to see larger differences compared to men in similar situations.
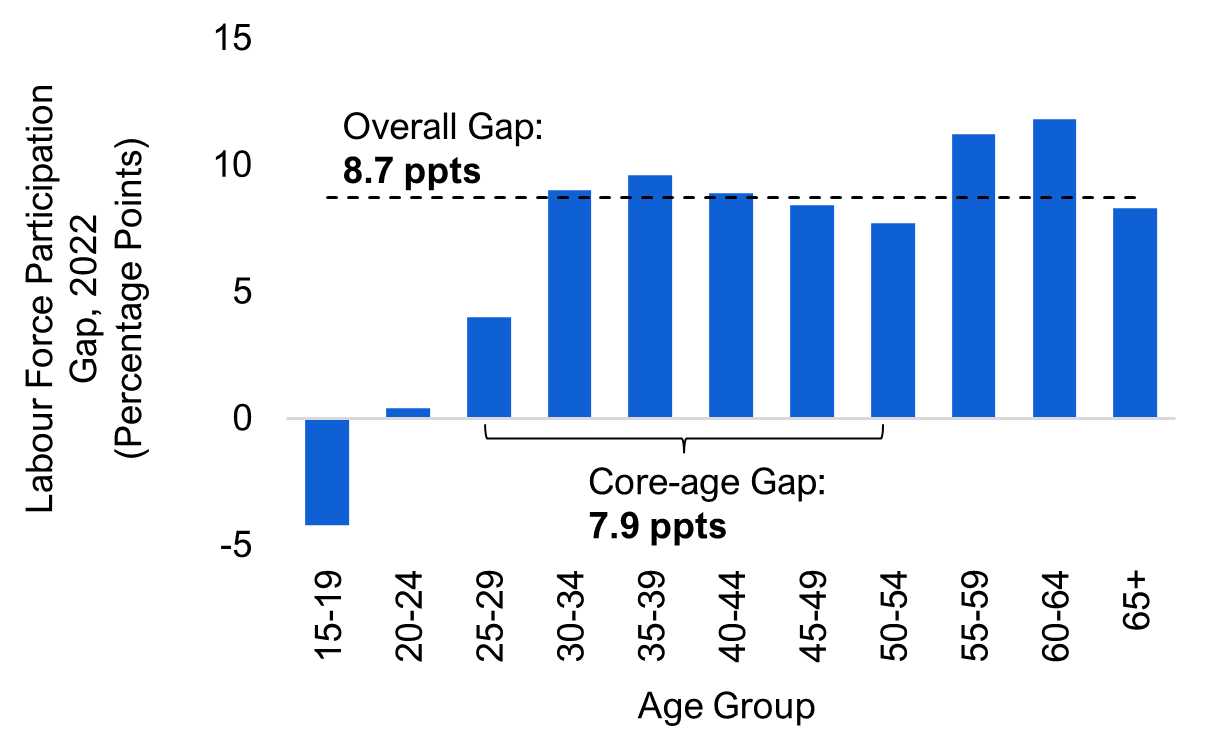
Figure 3.2 Older women participate less in the labour market
Source: Statistics Canada and FAO.
Of all the age groups, the labour force participation rate gap was the smallest for younger women. For example, in 2022 teen age women (15-19 years) participated in the labour market at higher rates compared to teen age men, while the rates for young workers (20-24 years) were essentially the same. Conversely, the participation gap of older women is much wider, especially for those aged 55-64 years.
Overall, the core-age (25-54 years) participation rate gap stood at 7.9 percentage points in 2022. Among the core working age group, the gap was the largest for women aged 35-39, when many are raising young children, at 9.6 percentage points lower than men of the same age. The gap in participation rates declines to 7.7 percentage points for women between the ages of 50 and 54.
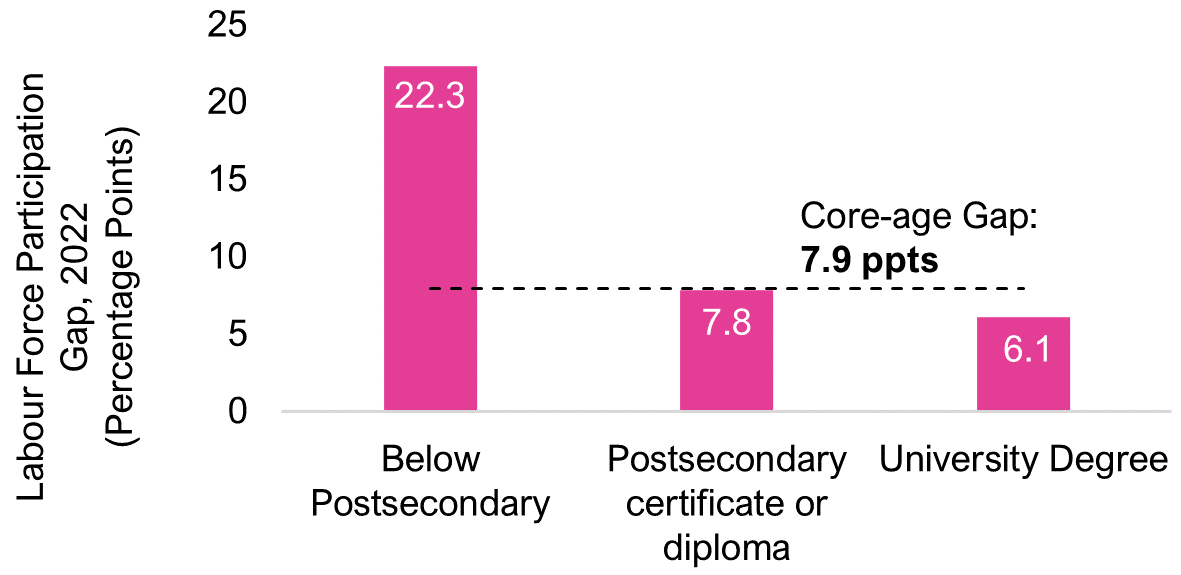
Figure 3.3 Women without post-secondary degrees participate in the labour force significantly less than men
Note: Labour force participation gap is shown for core age group (25-54 years).
Source: Statistics Canada and FAO.
The difference in core-age labour participation is also more pronounced among women with lower educational attainment. Women with below postsecondary education had a labour market participation rate of 56.7 per cent in 2022, significantly lower than the 79.1 per cent rate of men with the same education. This 22.3 percentage points difference was more than three times the gap for women with university degrees. This trend is not specific to Ontario and is observed in many OECD countries.[4] Since higher levels of education are positively correlated with wages, women with less education also have an earnings disadvantage when compared to highly educated men and women.
The gender participation gap almost closed workers without young children, but remains wider for parents
Individual decisions to not look for work and stay out of the labour market can be based on voluntary or involuntary considerations. The reasons for involuntarily not participating in the labour market vary by gender. Historically, a significantly larger percentage of women who left the workforce against their will did so because of personal and family responsibilities, such as giving birth, compared to men in similar situations. In 2022, nearly 39 per cent of core-age women (representing about 17,600) who reported wanting work but did not seek a job cited personal and family responsibilities as the reason – more than twice the proportion of men (18 per cent).[5]
The impact of childbirth on labour participation is more pronounced for women than men. Over time, the gap in labour participation between core working age men and women without children under 18 years old has decreased significantly from 23.9 percentage points in 1976 to just 3.4 percentage points in 2022. However, the gap between mothers and fathers with children under 18 remains much wider and has not improved for nearly two decades. In 2022, the difference in labour participation rates between core-age mothers and fathers was 14.1 percentage points, which is more than four times the gender gap for workers without children under 18.
Figure 3.4 Gender participation rate gap for men and women without young children almost closed, still wide for parents
Note: Labour force participation rate gap is shown for core age group (25-54 years).
Source: Statistics Canada and FAO.
The labour market participation of mothers has persistently remained well below that of women without young children. After rapidly increasing since the late 1970s, the labour participation of mothers has not risen much since the early 2000s, reaching 81.7 per cent in 2022. In contrast, women without children under 18 have made continual gains in labour participation over the past four decades to a peak of 88.8 per cent in 2022.
Conversely, Ontario fathers with children under 18 have had consistently higher labour market participation rates compared to men without children. This suggests that unlike motherhood, fatherhood contributes to labour market attachment, reflecting in part the financial responsibility of providing for a family.
Personal and family responsibilities, particularly motherhood, explain a large share of the labour participation gap in 2022
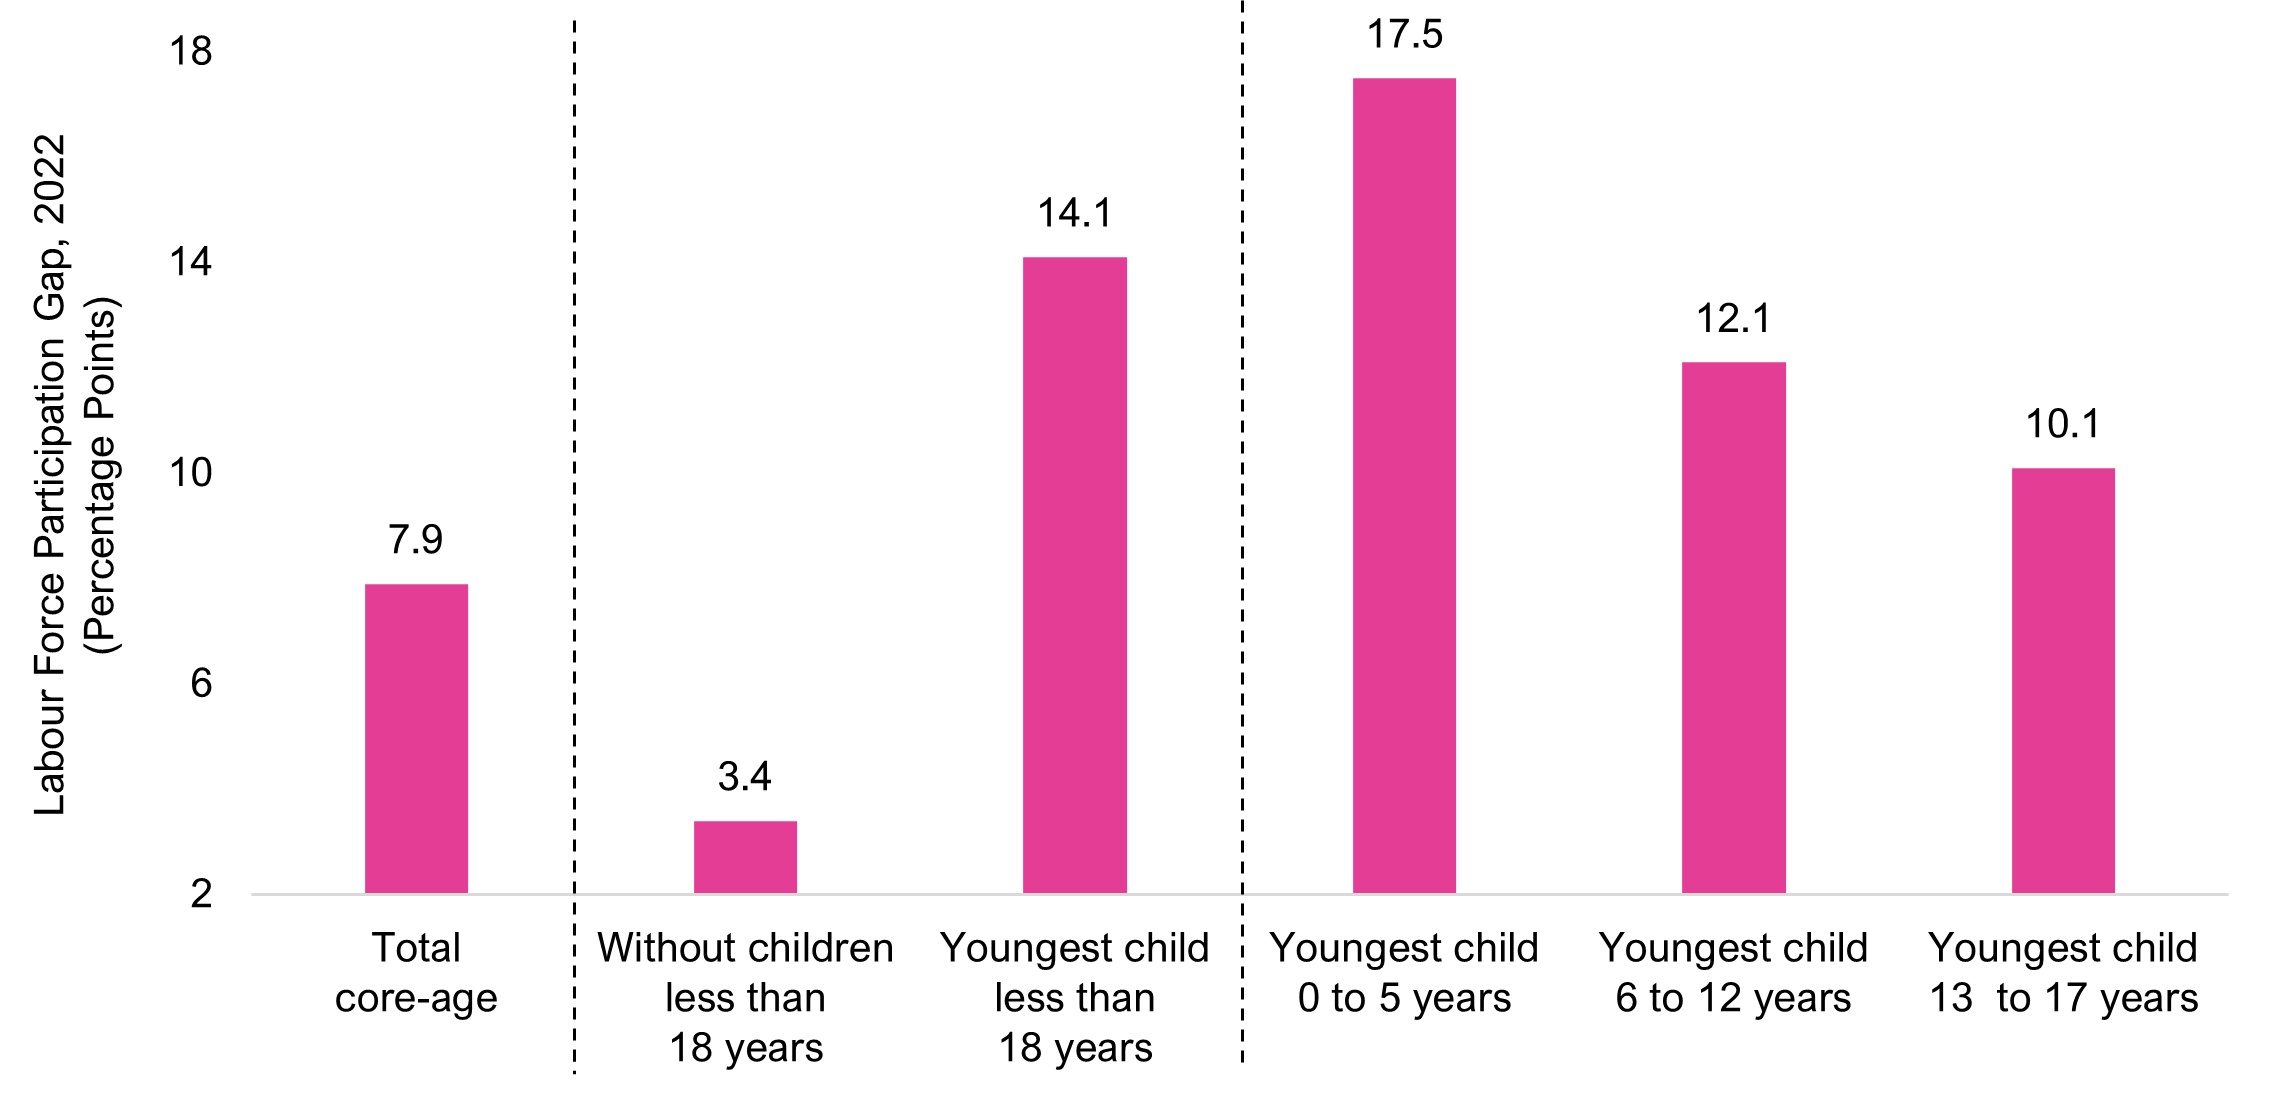
The significantly lower labour market participation of mothers reflects child care responsibilities which tend to be greater at the earlier stages of the child’s life, and ease as the child ages. For example, in 2022 the labour participation of mothers with young children aged 0-5 years old was 17.5 percentage points lower than fathers. By the time the children are 13-17 years old, mothers’ labour participation was 10.1 percentage points lower than fathers.
These lower rates of labour participation can impact the earnings trajectory of mothers compared to women without young children. As well, the high cost of child care and the shortage of available child care spaces in Ontario can significantly impede mothers’ ability to participate in the labour force, as discussed in the rest of this report.
Figure 3.5 Family responsibilities and motherhood explains a large share of the 2022 participation gap
Note: Labour force participation rate gap is shown for core age group (25-54 years).
Source: Statistics Canada and FAO
4. Labour Market Outcomes of Women
This chapter examines how the wage gap between men and women has evolved over time in Ontario. While the gender wage gap saw broad improvement from 2000 to 2010, progress has stalled in the recent decade. The gender wage gap persists across all age groups, industries, and occupations, and reflects in part differences in the type of work and occupation selected by women compared to men. As well, motherhood has a unique role in driving the gender wage gap through the significant earnings losses experienced by mothers following childbirth.
The gender wage gap: women earn 87 cents for every dollar men earn
Figure 4.1 The gender wage ratio has not improved in the past decade
Note: The gender wage ratio is calculated as female average earnings as a proportion of male average earnings for full-time and part-time employees that are 15 years and older.
Source: Statistics Canada and FAO.
In Ontario, women earned an average hourly wage[6] of $30.57 in 2022, while men earned $35.26, resulting in a gender wage gap of $4.69 (or 13.3 per cent lower). This means that women earned $0.87 for every dollar earned by men. This gender wage ratio[7] has improved over time, as women’s earnings increased from $0.82 for every dollar earned by men in 1997 to $0.87 in 2022. Several factors have driven the improvement in the gender wage gap, including changes in the distribution of men and women across occupations, women’s increased educational attainment and the decline in the share of men in unionized employment which tend to have higher pay.[8]
However, after steadily rising over the 1997 to 2010 period, the gender wage ratio has stalled in the past decade. The existing gap in wages could be partially explained by differences in the occupational distribution of men and women, and higher rates of part-time work for women. However, a major portion of the gender wage gap is still largely unexplained and could be due to differences in work experience, field of study, or gender bias in the workplace.[9]
Women across all age groups earn less than men
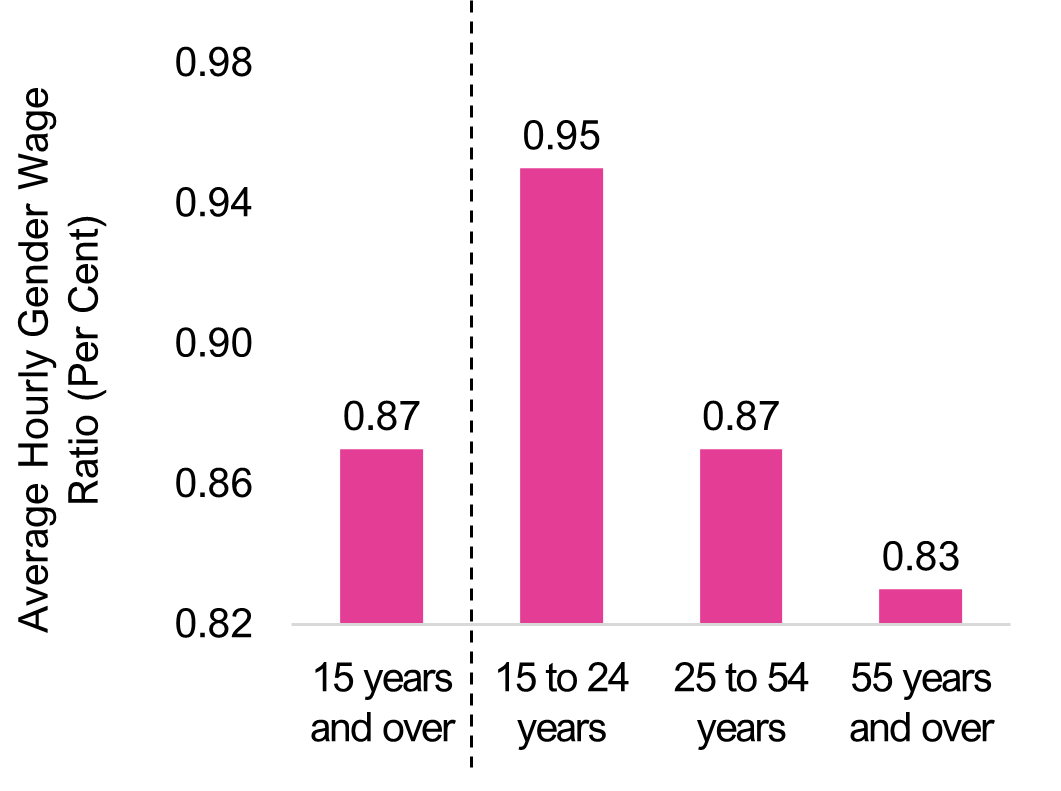
Figure 4.2 Gender wage gap persists across age groups
Source: Statistics Canada and FAO.
In Ontario, gender wage differences tend to become larger with age. Among the major age groups, young women have the smallest gap in wages compared to young men. In 2022, young women aged 15-24 years earned $0.95 for every dollar earned by men in the same age group. In contrast, core-age women (25-54 years) earned $0.87 compared to core-age men, and older women (55 years and over) earned less at $0.83.
The larger wage gap at older ages reflects in part the impact of caretaking responsibilities which tend to increase with age and fall predominantly on women. Core-age women are more likely to take time away from the labour market to raise children or attend to family responsibilities, leading to employment disruptions at a time in their career when their labour market attachment would otherwise be the strongest. These caregiving responsibilities can impede women’s ability to put in long hours that are needed to secure promotions in certain industries, develop networks to facilitate movement to higher paying jobs, as well as create incentives for selecting lower-paying jobs with limited hour requirements.[10]
Despite improvements, women earn less than men across all broad occupational categories
Since 1997, the gender wage gap has narrowed within most broad occupational categories. The most significant improvements have occurred in natural resources, management, manufacturing, and health occupations. However, some of these occupations employ very few women. For example, natural resources occupations saw the greatest improvement ($0.16) in the gender wage gap over the past 25 years, but only comprised 0.6 per cent of Ontario’s total female employment in 2022.
| Occupation | Gender Wage Gap | Change: | Share of Women in Employment (Per Cent) | |
|---|---|---|---|---|
| 1997 | 2022 | 1997-2022 | 2022 | |
| All Occupations | 0.82 | 0.87 | 0.05 | 100.0 |
| Health | 0.93 | 0.99 | 0.06 | 12.6 |
| Management | 0.79 | 0.91 | 0.12 | 7.5 |
| Natural and applied sciences and related occupations | 0.86 | 0.89 | 0.03 | 5.3 |
| Art, culture, recreation and sport | 0.83 | 0.88 | 0.05 | 3.0 |
| Sales and service | 0.83 | 0.85 | 0.02 | 25.2 |
| Business, finance and administration | 0.82 | 0.84 | 0.02 | 23.7 |
| Natural resources, agriculture and related production | 0.67 | 0.84 | 0.16 | 0.6 |
| Manufacturing and utilities | 0.73 | 0.80 | 0.07 | 3.0 |
| Education, law and social, community and government services | 0.80 | 0.79 | -0.01 | 16.4 |
| Trades, transport and equipment operators and related occupations | 0.77 | 0.78 | 0.01 | 2.7 |
Conversely, occupations with a high concentration of women tended to experience much smaller improvements in the gender wage gap. These include occupations in: sales and service, non-management roles in business, finance and administration, and occupations in education, law and government services.
The gender wage gap persists across all broad occupational categories with considerable variation. In 2022, the gap in average hourly wages ranged from 0.99 in health occupations and 0.91 in management roles (meaning women earn 99 cents and 91 cents respectively for each dollar men earn) to a low of 0.78 for occupations in trades, transport and equipment operators.
Not only are women being paid less than men among the same broad occupational groups, but they are also over-represented in lower-paying occupations and under-represented in higher-paying occupations. In 2022, almost 60 per cent of women employees worked in occupations earning less than the $32.94 average hourly wage for both sexes. By comparison, 53 per cent of men earned less than the average hourly wage rate.
However, while some of the overall gender wage gap is explained by the occupational composition of employed women, the FAO estimates this only accounts for 2 cents of the 13-cent gender wage gap, while the remaining 11 cents of the gender wage gap is due to wage inequality within occupations.
The remaining gender wage gap could be the result of several issues, including gender-based wage discrimination, women’s selection of less demanding or more flexible work to accommodate family or caregiving responsibilities, or less favourable wage negotiations.[11] The following section outlines other factors that affect gender wage differences, including barriers to promotions, the higher prevalence of part-time work, and the impact of childbirth on mother's earnings.
More educated women entering the workforce but barriers to opportunities and earnings persist
Women have become better educated, but still lag Men in higher-paying STEM fields
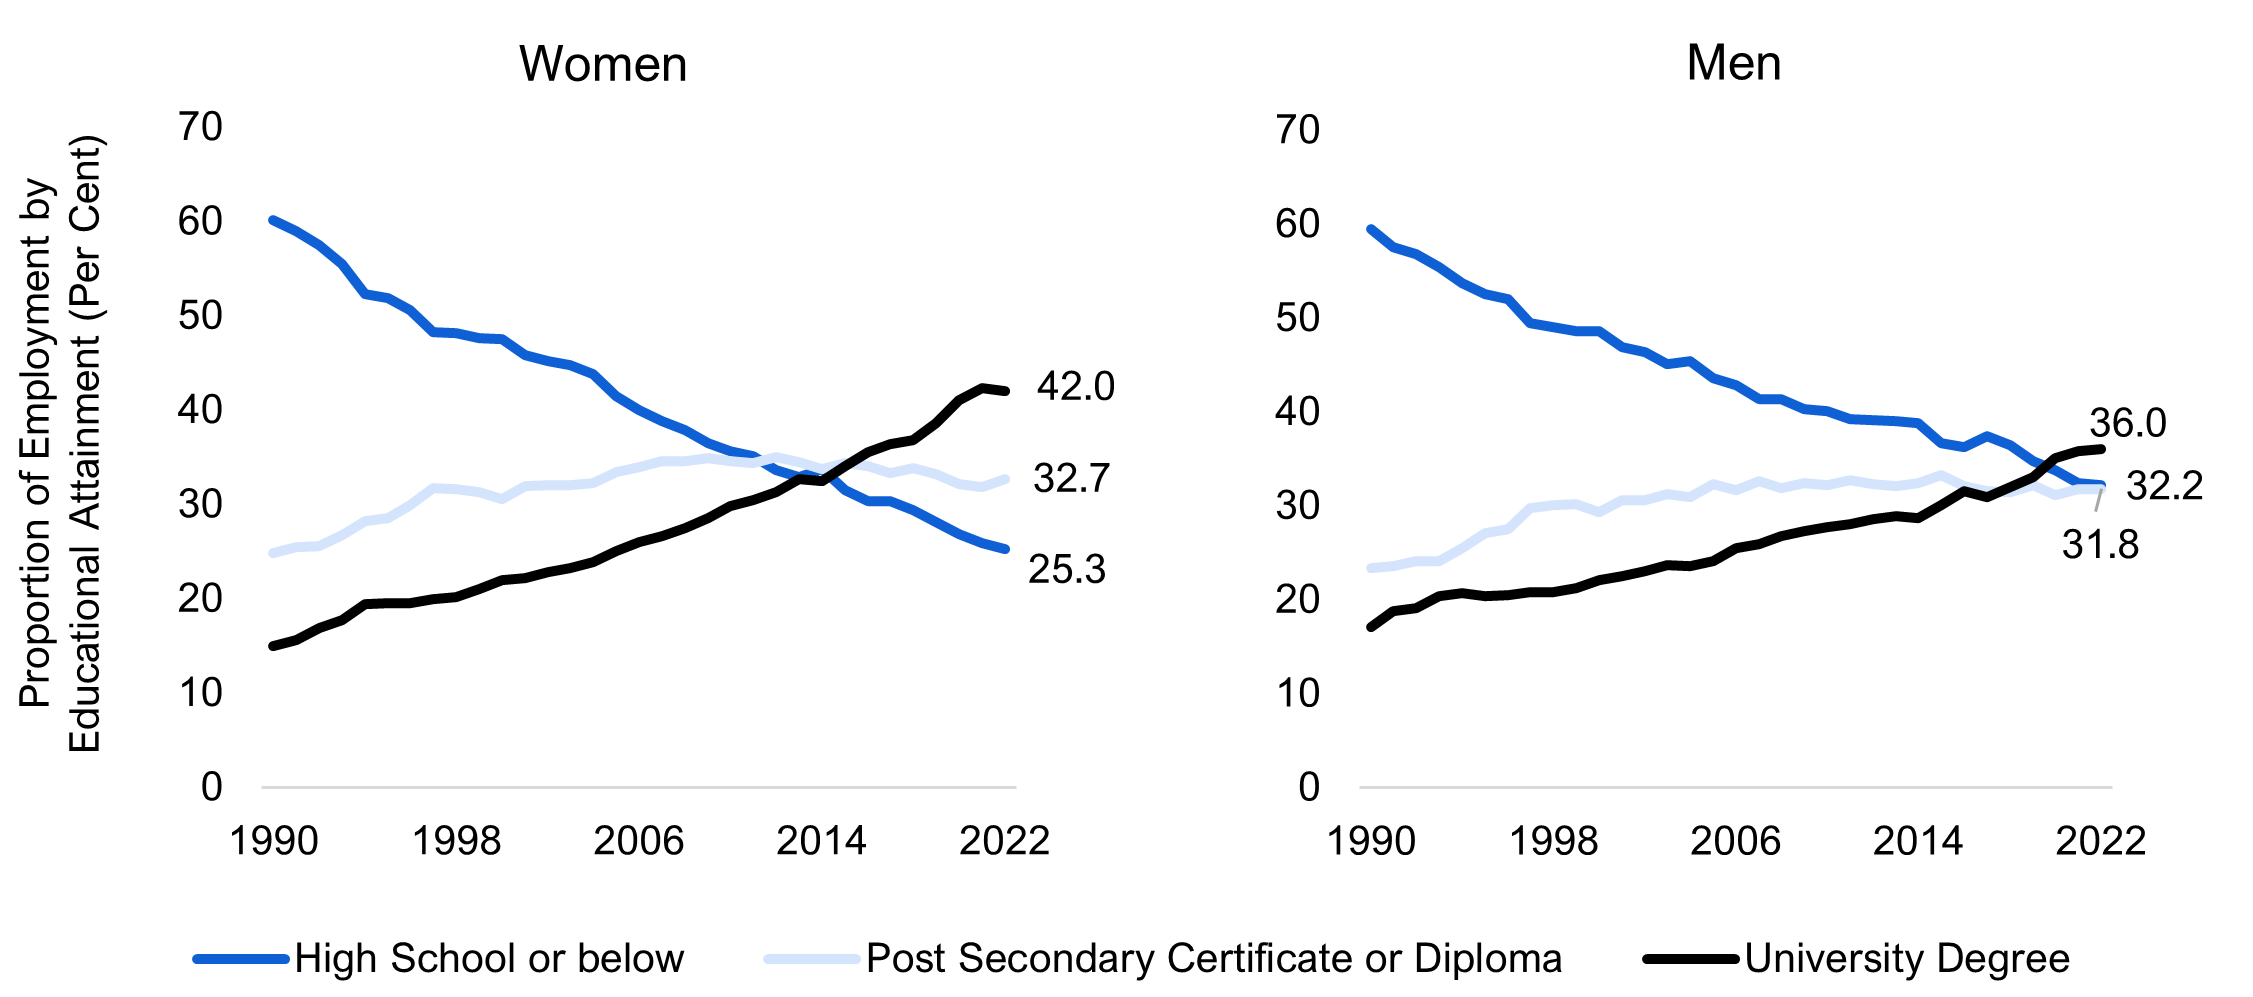
Ontario’s employed workforce has become increasingly more educated since 1990, and women have outpaced men in terms of educational attainment. For example, between 1990 and 2022, the number of employed women with university degrees more than quadrupled, while for men it tripled. As a result, by 2022 the pool of employed women was more educated, with 42.0 per cent holding a university degree, compared to 36.0 per cent for men. Conversely, 31.8 per cent of employed men had a high school education, compared to 25.3 per cent of women in 2022.
Figure 4.3 Women in Ontario are more educated than Men
Source: Statistics Canada and FAO.
While educational attainment has increased significantly for women, certain key differences in the field of study chosen by men and women may impact lifelong earnings potential. In 2020, women significantly outnumbered men in health, education, social and behavioral sciences and law fields, while men outnumbered women in science, technology, engineering, and mathematics (STEM) fields that have significantly higher income potential.[12]
Figure 4.4 Women less likely to study STEM subjects compared to Men
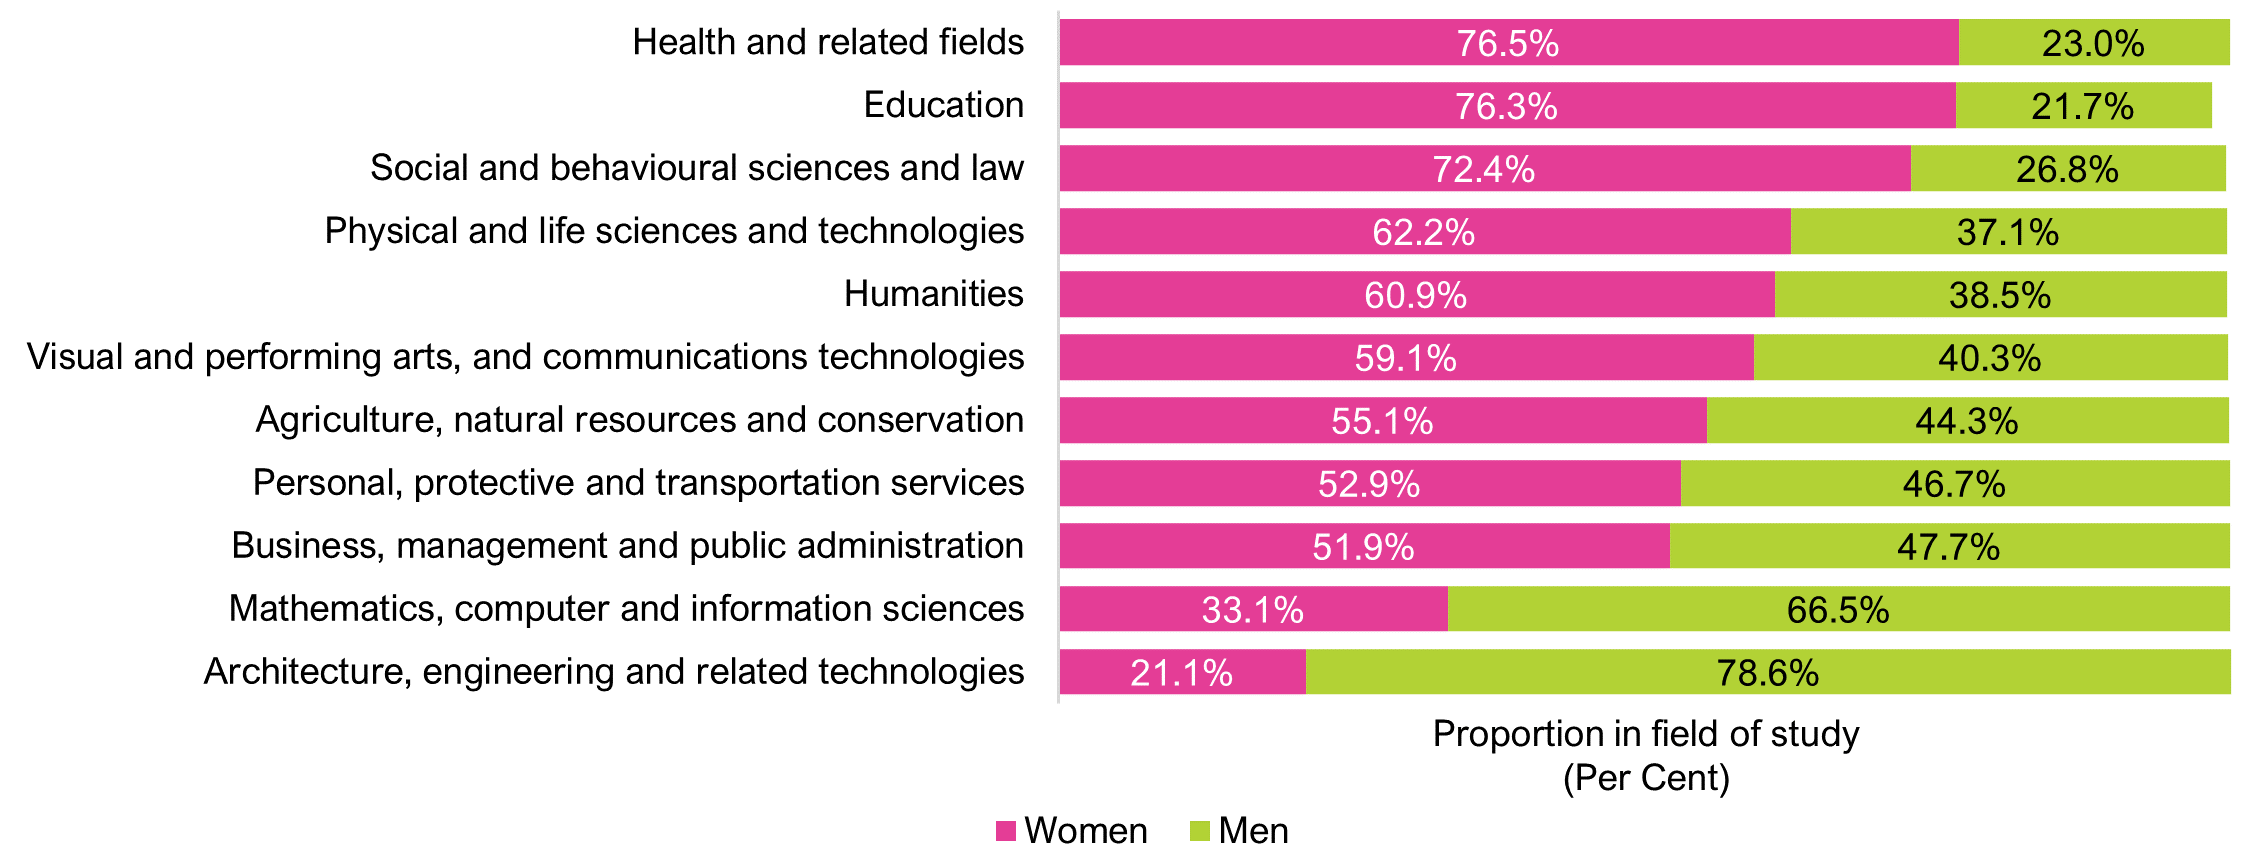
Note: Numbers may not add to 100 – excludes “Gender Unknown”. The proportion of employment for a particular group is the number of persons employed in that group expressed as a proportion of total employment. Estimates are percentages.
Source: Statistics Canada and FAO.
Women continue to be underrepresented in higher-paying management roles
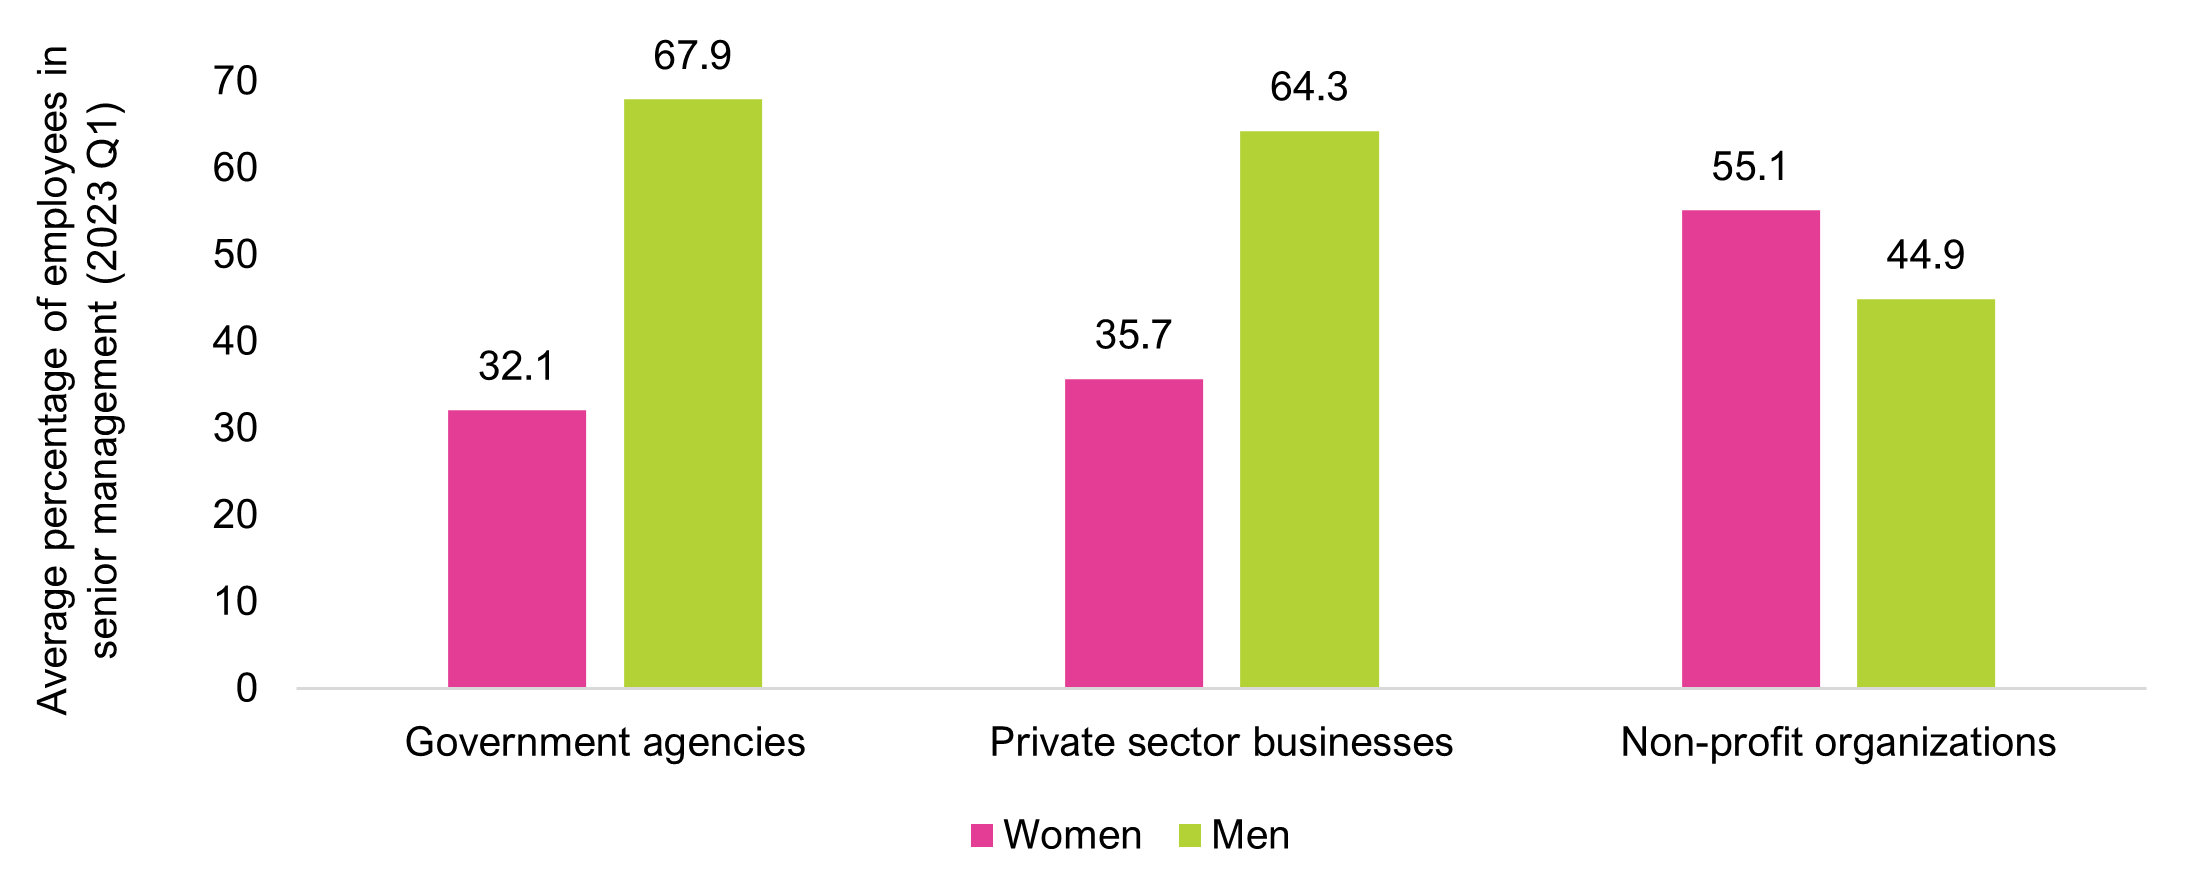
Management positions tend to have more decision-making responsibilities and higher pay. Since 1987, most of these roles in Ontario have been occupied by men. In 2022, men accounted for 62.7 per cent of senior management roles and 64.2 per cent of middle management roles. In comparison, women only accounted for 37.3 per cent of senior management roles and 35.8 per cent of middle management roles.
Figure 4.5 Women continue to be underrepresented in management occupations
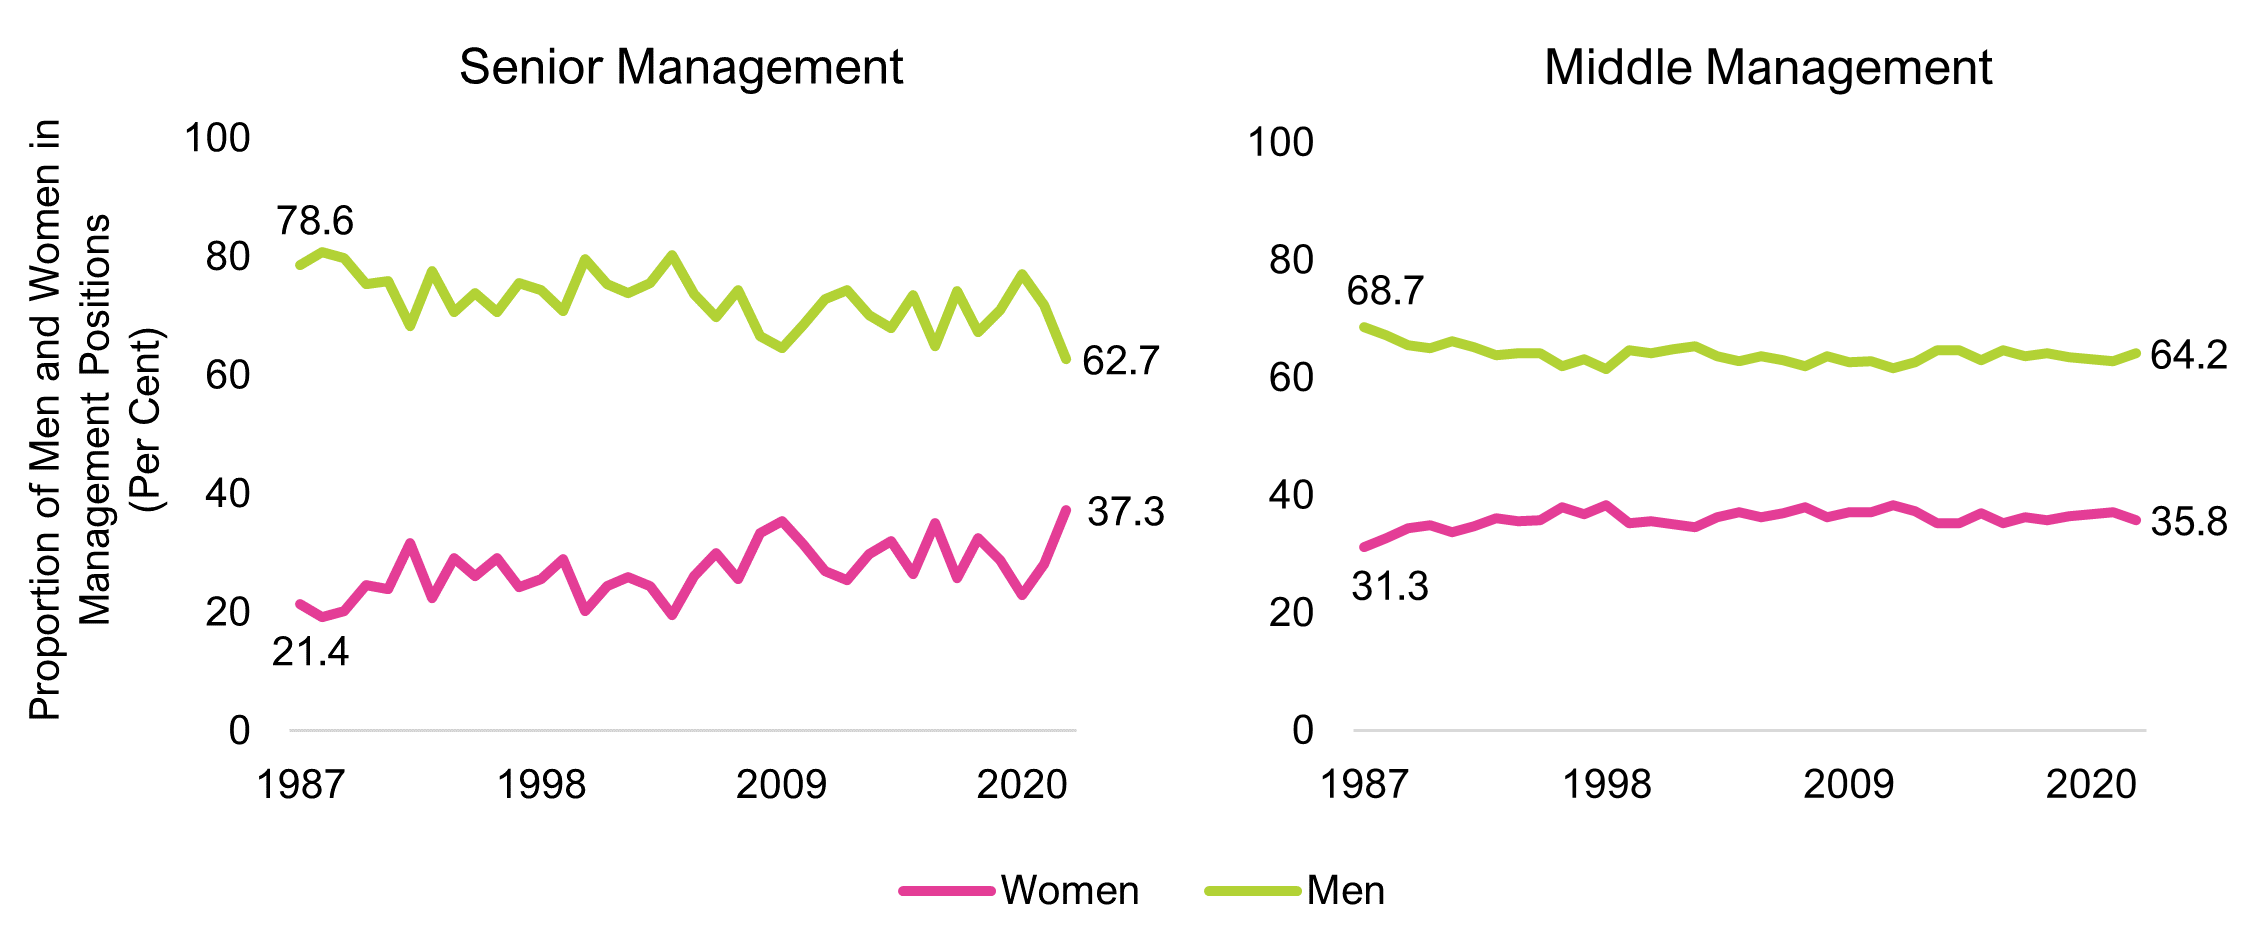
Note: The proportion of employment for a particular group is the number of persons employed in that group expressed as a proportion of total employment. Estimates are percentages.
Source: Statistics Canada and FAO.
In 2023, only non-profit organizations in Ontario reported having more women (55.1 percent) in senior management roles than men (44.9 per cent). Among government agencies, 32.1 per cent of women occupied the ranks of senior management compared to 67.9 per cent of men. Private sector businesses have modestly more female representation, with 35.7 per cent of women in senior management positions compared to 64.3 per cent of men.
Figure 4.6 Only non-profit organizations have higher representation of women in senior management positions
Source: Statistics Canada and FAO
The representation of women in top officer positions, such as chairperson, president, executive vice president or vice president across all Ontario corporations[13] is even lower. In 2019, men held 75.6 per cent of these positions, while women held only 24.4 per cent.
Among academic institutions in Ontario, men dominate the full professor rank holding 39 per cent of the highest positions compared to 31 per cent for women. However, a more equal representation of men and women exists among the lower ranks of assistant professor and associate professor.[14]
Women face early career challenges that can act as a barrier to progressing to leadership roles, including being passed up for a promotion compared to male colleagues, which may reflect gender-based workplace discrimination. More men than women are considered for first level management promotions, creating a gap that women are unable to close throughout their careers.[15] Recent findings also suggest that there are challenges associated with the pipeline to senior management roles. In 2023, there was an 11.9 percentage point decline of women in the pipeline to senior management roles from 2022.[16] These barriers to career progression play an important role in reinforcing the gender wage gap between men and women.
A greater proportion of women work part-time jobs
Figure 4.7 Greater proportion of women work part-time across all age groups
Note: The proportion of employment for a particular group is the number of persons employed in that group expressed as a proportion of total employment. Estimates are percentages.
Source: Statistics Canada and FAO.
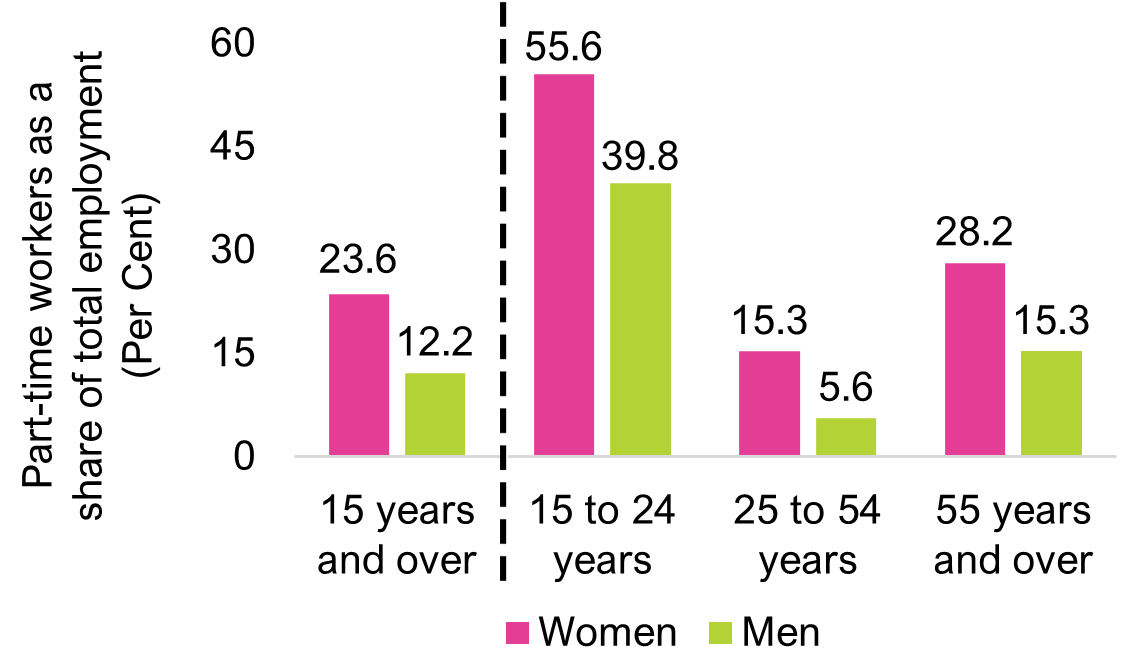
Historically, a greater proportion of women have been employed in part-time jobs compared to men. In 2022, 23.6 per cent of employed women worked in part-time jobs, nearly double the proportion of men (12.2 per cent). A larger share of employed women compared to men work part-time across all age groups. For young workers, more than half of women work in part-time jobs (55.6 per cent), well above the proportion of men (39.8 per cent). In the core working age group, 15.3 per cent of all women employees were in part-time employment in 2022, nearly three times the share for men (5.6 per cent). A large gap is also observed among workers ages 55 years and over, with 28.2 per cent of women employed in part-time positions, compared to 15.3 per cent for men.
Among these age groups, women’s decision to work part-time tends to be heavily influenced by family reasons compared to men. For example, in 2022, 37.5 per cent of core-age women (25 – 54 years) employed part-time chose to do so to be able to care for children or for other personal and family responsibilities. In contrast, just 12.6 per cent of core-aged men employed part-time had similar reasons for choosing part-time employment, three times fewer than women. Even in older age groups when child care responsibilities diminish, women were more than twice as likely to work part-time due to personal and family responsibilities, such as providing care to a spouse or elderly parents, compared to men. Promotions into management positions that offer a higher salary are more difficult to achieve in part-time work compared to full-time work, which can widen the difference in earnings between men and women.
Ontario mothers experience up to a four year earnings penalty after childbirth
Having children often results in a negative and persistent earnings impact over a woman’s career, a finding that occurs in many countries. For example, in Denmark, women’s earnings fell behind men’s earnings due to childbirth by 20 per cent over the 1980 to 2013 period. Childbirth was also found to explain approximately 80 per cent of the gender gap in earnings between Danish men and women.[17]
Canadian research[18] also shows that a significant "motherhood penalty" exists for women who have children in comparison to women who do not. This section analyses the median earnings of mothers and non-mothers[19] aged 30-39 for two separate cohorts of Ontario women who gave birth in 2003 and 2014,[20] presenting evidence of the motherhood penalty in the province.
A reduction in earnings for mothers is expected as women typically leave the labour market for childbirth and can remain on parental leave between 12 months (standard parental leave) and 18 months (extended parental leave).[21] Based on the analysis of the earnings of two cohorts of Ontario women who gave birth in 2003 and 2014, mothers experienced a significant drop in earnings in the year of childbirth and the following year. Women who gave birth in 2003, on average experienced earnings decline of 43 per cent in the year of childbirth and 53 per cent in the following year. For women in 2014 cohort, the earnings drop was similar at 35 per cent in the year of childbirth and 54 per cent in the following year.
Figure 4.8 Ontario mothers face earnings loss up to four years following childbirth
Note: “t” represents the year of childbirth.
Source: Statistics Canada and FAO
Importantly, when mothers return to the labour market after childbirth it can take several years to return to their pre-childbirth level of earnings. For the women who gave birth in 2003, their median earnings did not recover fully back to the pre-childbirth earnings until four years after childbirth. In comparison, the 2014 cohort experienced a shorter period of earnings loss at two years after the birth of a child. These findings are generally consistent with other estimates on earnings loss for Canadian mothers at approximately five years post child-birth.[22]
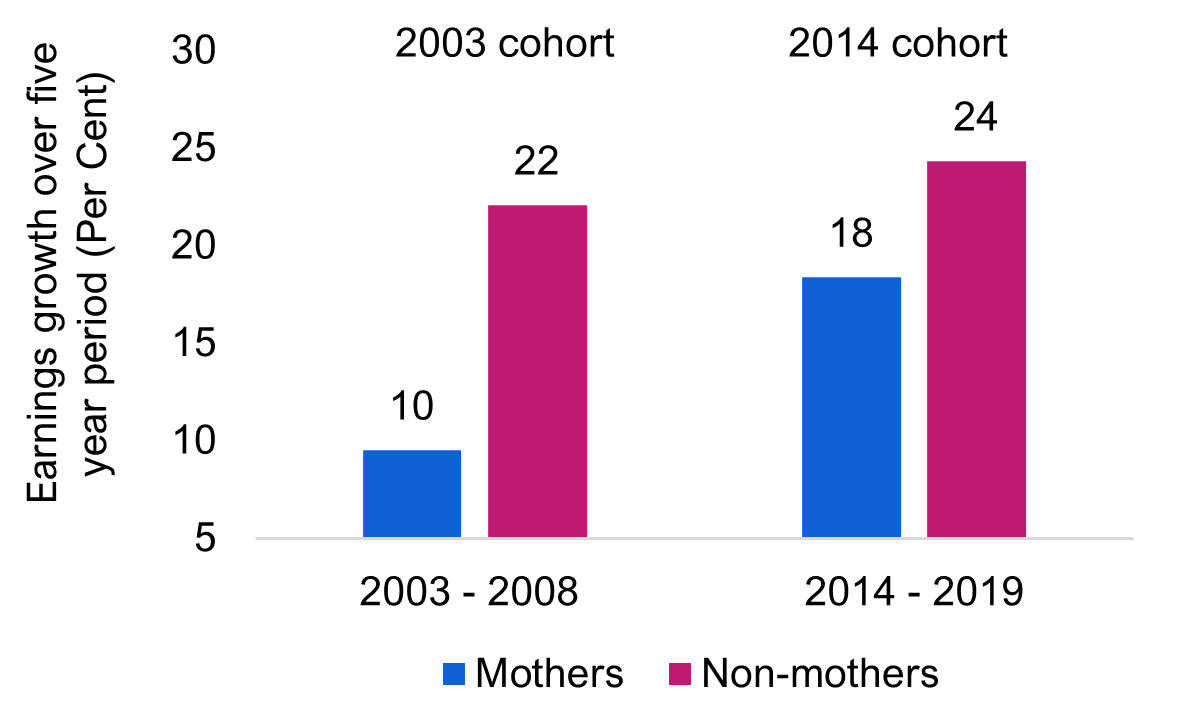
The 2014 cohort of Ontario mothers saw a stronger earnings recovery in the post-childbirth years compared to the 2003 cohort of mothers. By the fifth year after childbirth, the earnings of the 2014 cohort of mothers were 18 per cent above their pre-childbirth earnings. In contrast, the earnings of the 2003 cohort of mothers were only 10 per cent above their pre-childbirth earnings five years after childbirth. These differences in five-year earnings growth may have been influenced by the business cycle. The 2008 global financial crisis would have impacted the 2003 cohort, while the 2014 cohort experienced a period of steady economic growth. In addition, full day kindergarten was fully available in Ontario by 2014, which may have strengthened labour participation and earnings of mothers.
Figure 4.9 Earnings growth for Ontario mothers lag behind women without children
Source: Statistics Canada and FAO.
This contrasts with the earnings growth of Ontario’s non-mothers in both cohorts. For the 2003 cohort, women who did not give birth had earnings growth of 22 per cent by 2008, more than twice the 10 per cent increase in earnings experienced by mothers. Similarly, the earnings of women who did not give birth in 2014, rose 24 per cent by 2019, ahead of the 18 per cent growth experienced by mothers who gave birth in 2014.
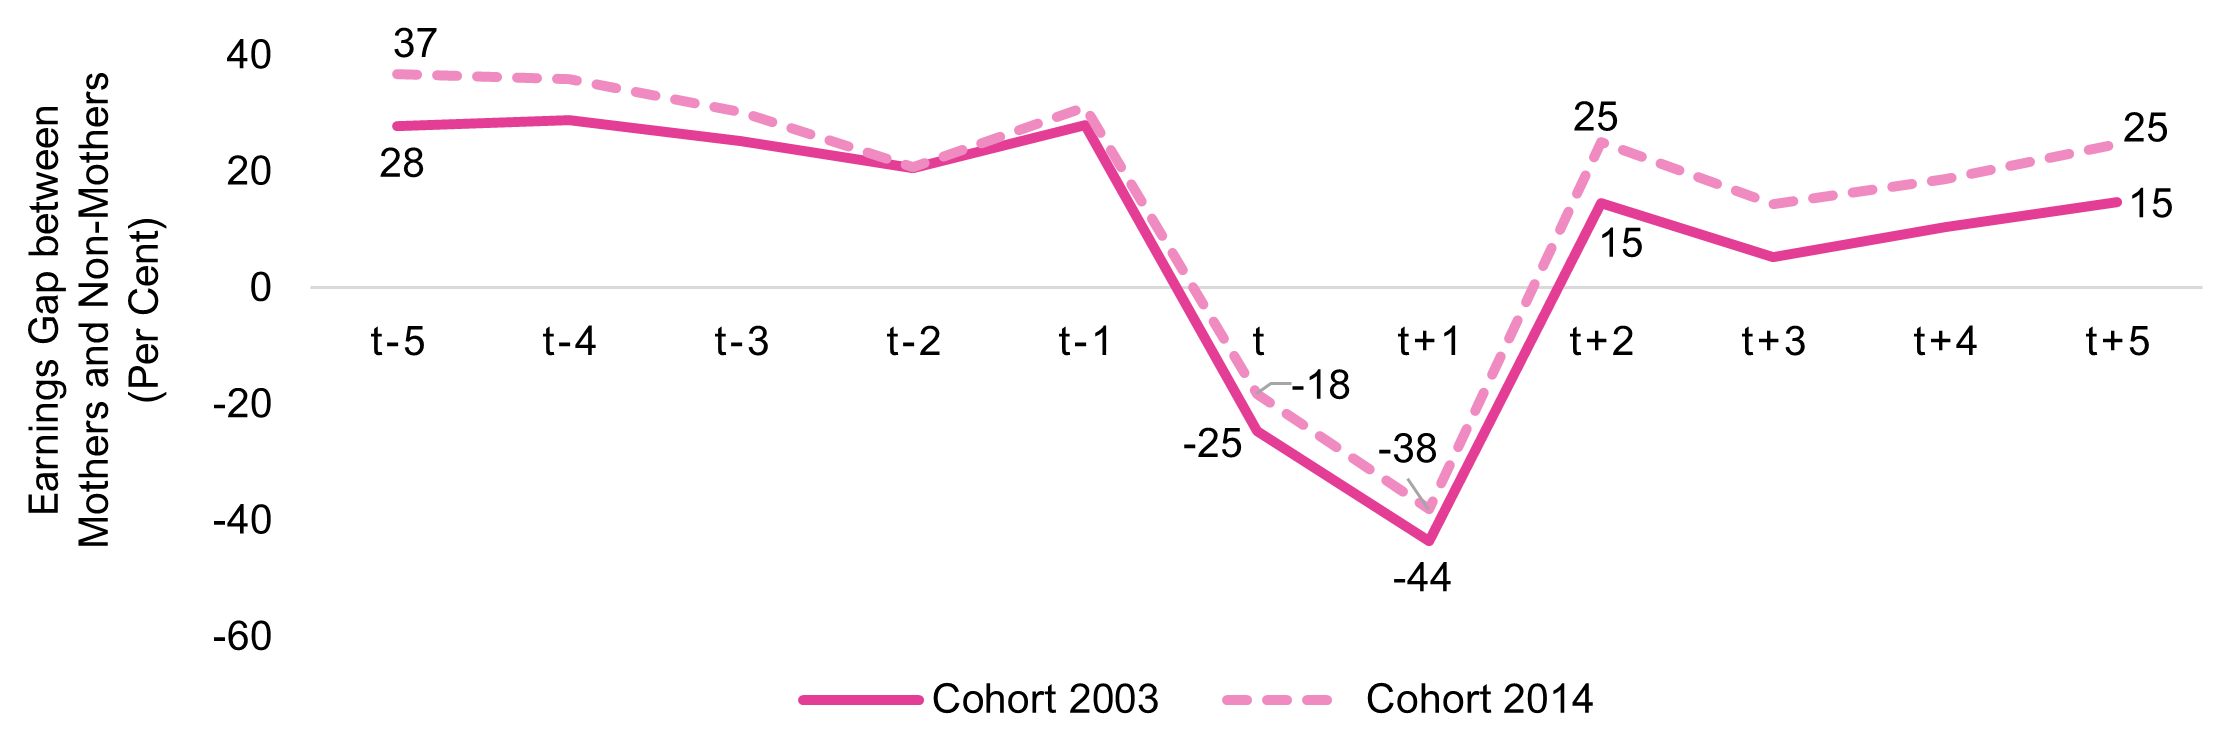
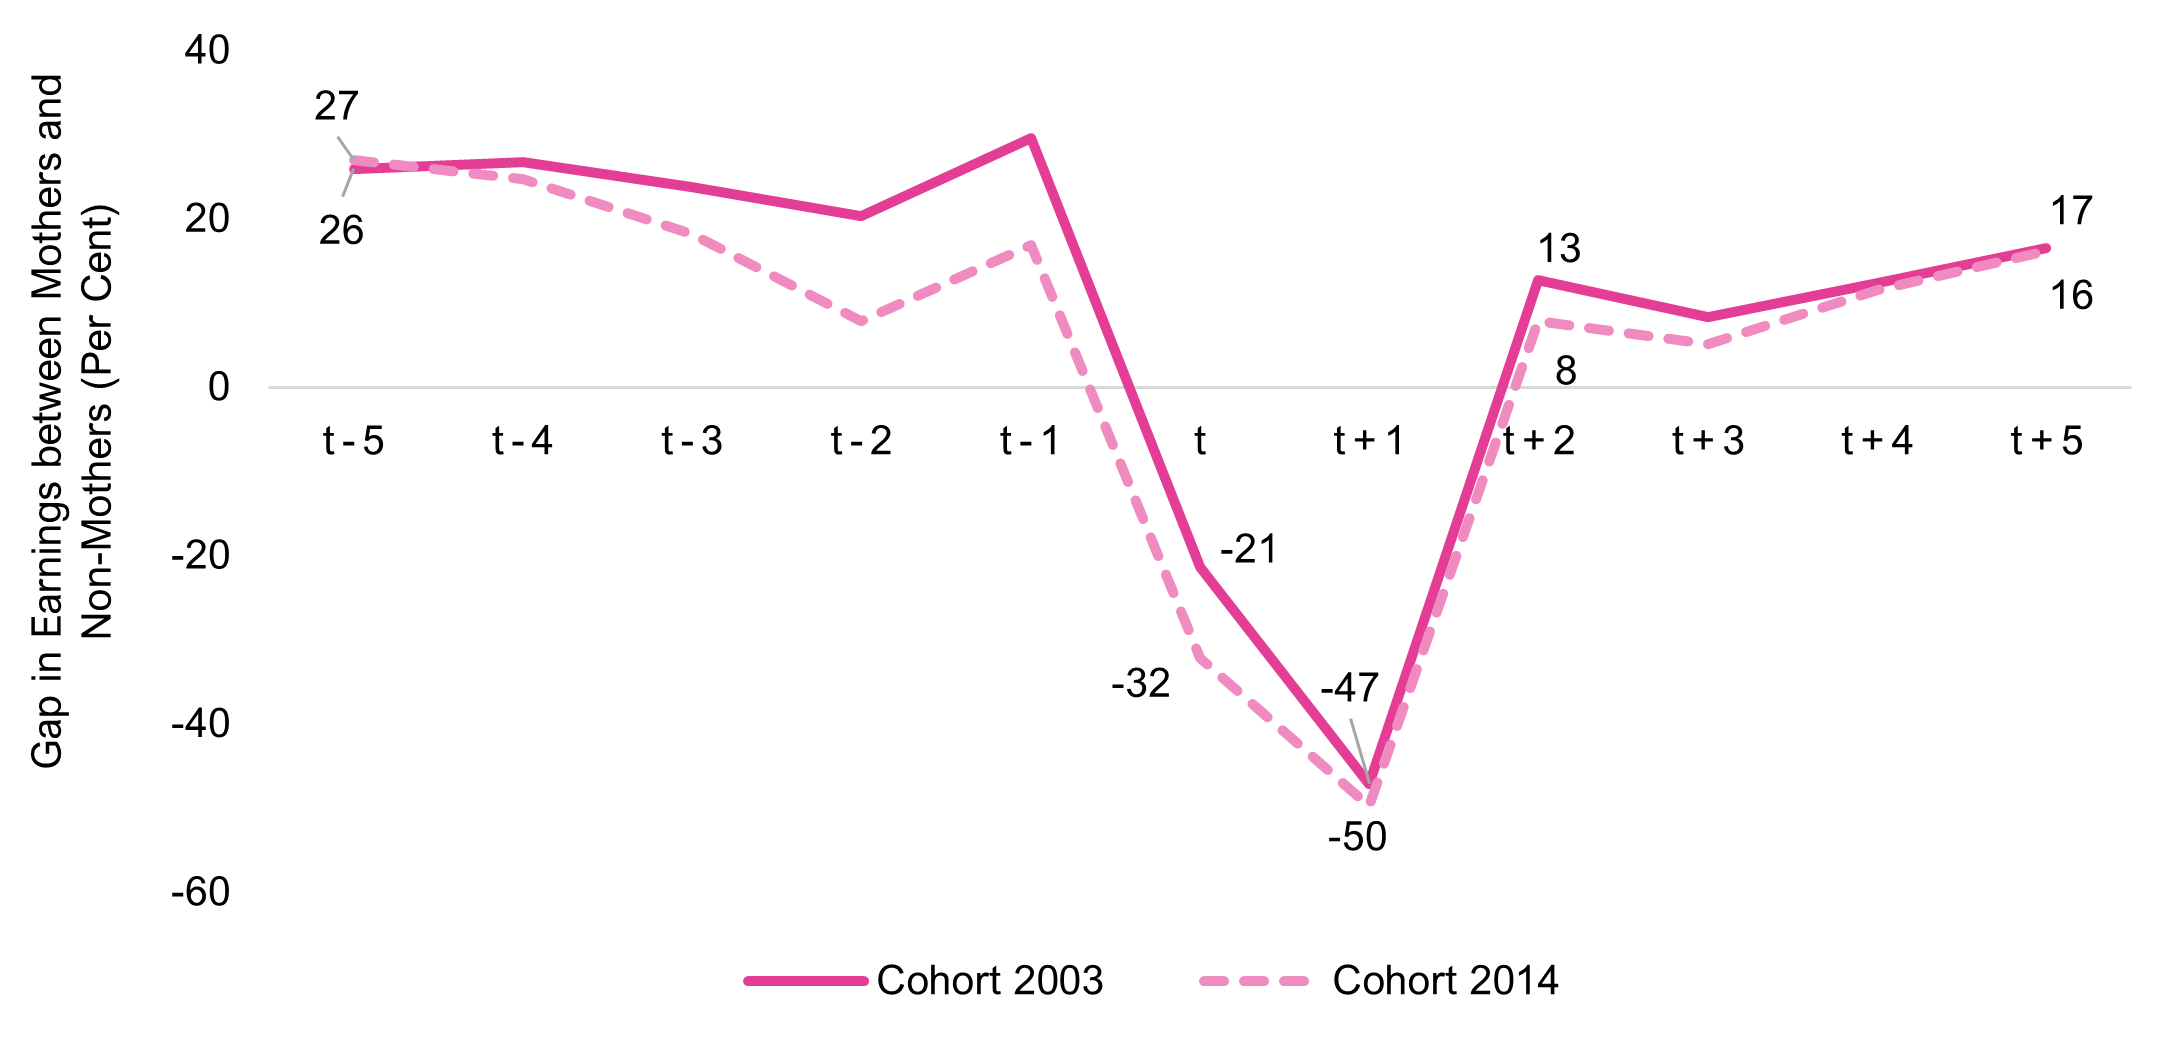
Figure 4-10 highlights the evolution in the earnings differences between mothers and non-mothers for both cohorts over a 10-year period. In the five years before childbirth, mothers' earnings were higher than non-mothers, by 28 per cent for the 2003 cohort and 37 per cent for the 2014 cohort.
During the year of childbirth and the following year, the earnings for mothers dropped significantly below non-mothers. In the year of birth, the median earnings for mothers dropped between 18 and 25 per cent compared to women who did not give birth.[23] In the following year, mothers continued to experience earnings drop ranging from 38 to 44 per cent compared to non-mothers. As mothers re-entered the labour market their earnings again surpassed the earnings of non-mothers, but by the fifth year this advantage was not as large as the pre-childbirth difference.[24]
Figure 4.10 Ontario mothers experience earnings penalty for two years after child birth
Note: “t” represents the year of childbirth.
Source: Statistics Canada and FAO
The extent of the earnings loss for women who give birth is affected by the age at which they give birth, with older mothers experiencing smaller losses than younger mothers.[25] Younger Canadian mothers (below the age of 30 years) continue to experience a motherhood penalty for up to nine years after childbirth.[26] In contrast, older mothers, between the ages of 30-34 years, face a shorter earnings penalty period spanning five years after childbirth.
Ontario women are increasingly giving birth at older ages. The average age of Ontario women at the time of childbirth has increased from 28.4 years in 1991 to 32.1 years in 2021, modestly above the rest of Canada. This delay in the age of childbirth may reflect mothers’ higher educational attainment, as well as considerations about the motherhood earnings penalty. Delayed childbirth would also mean these women had become more established in their careers with longer job tenure and higher earnings.
5. Potential Impacts of $10 a Day Child Care in Ontario
This chapter explores how the Canada-wide Early Learning and Child Care Agreement (the ‘Child Care Agreement’) could impact the labour market participation of Ontario mothers. It also compares these impacts to those experienced by Quebec mothers following the introduction of subsidized child care in 1997.
If the Child Care Agreement’s objectives are met, Ontario’s core-age female labour force participation rate could increase from 84 per cent in 2022 to between 85.6 and 87.1 per cent by 2027 all else equal. However, there are several constraints to achieving this, including ensuring an adequate supply of child care spaces and program funding, as well as child care staffing shortages.
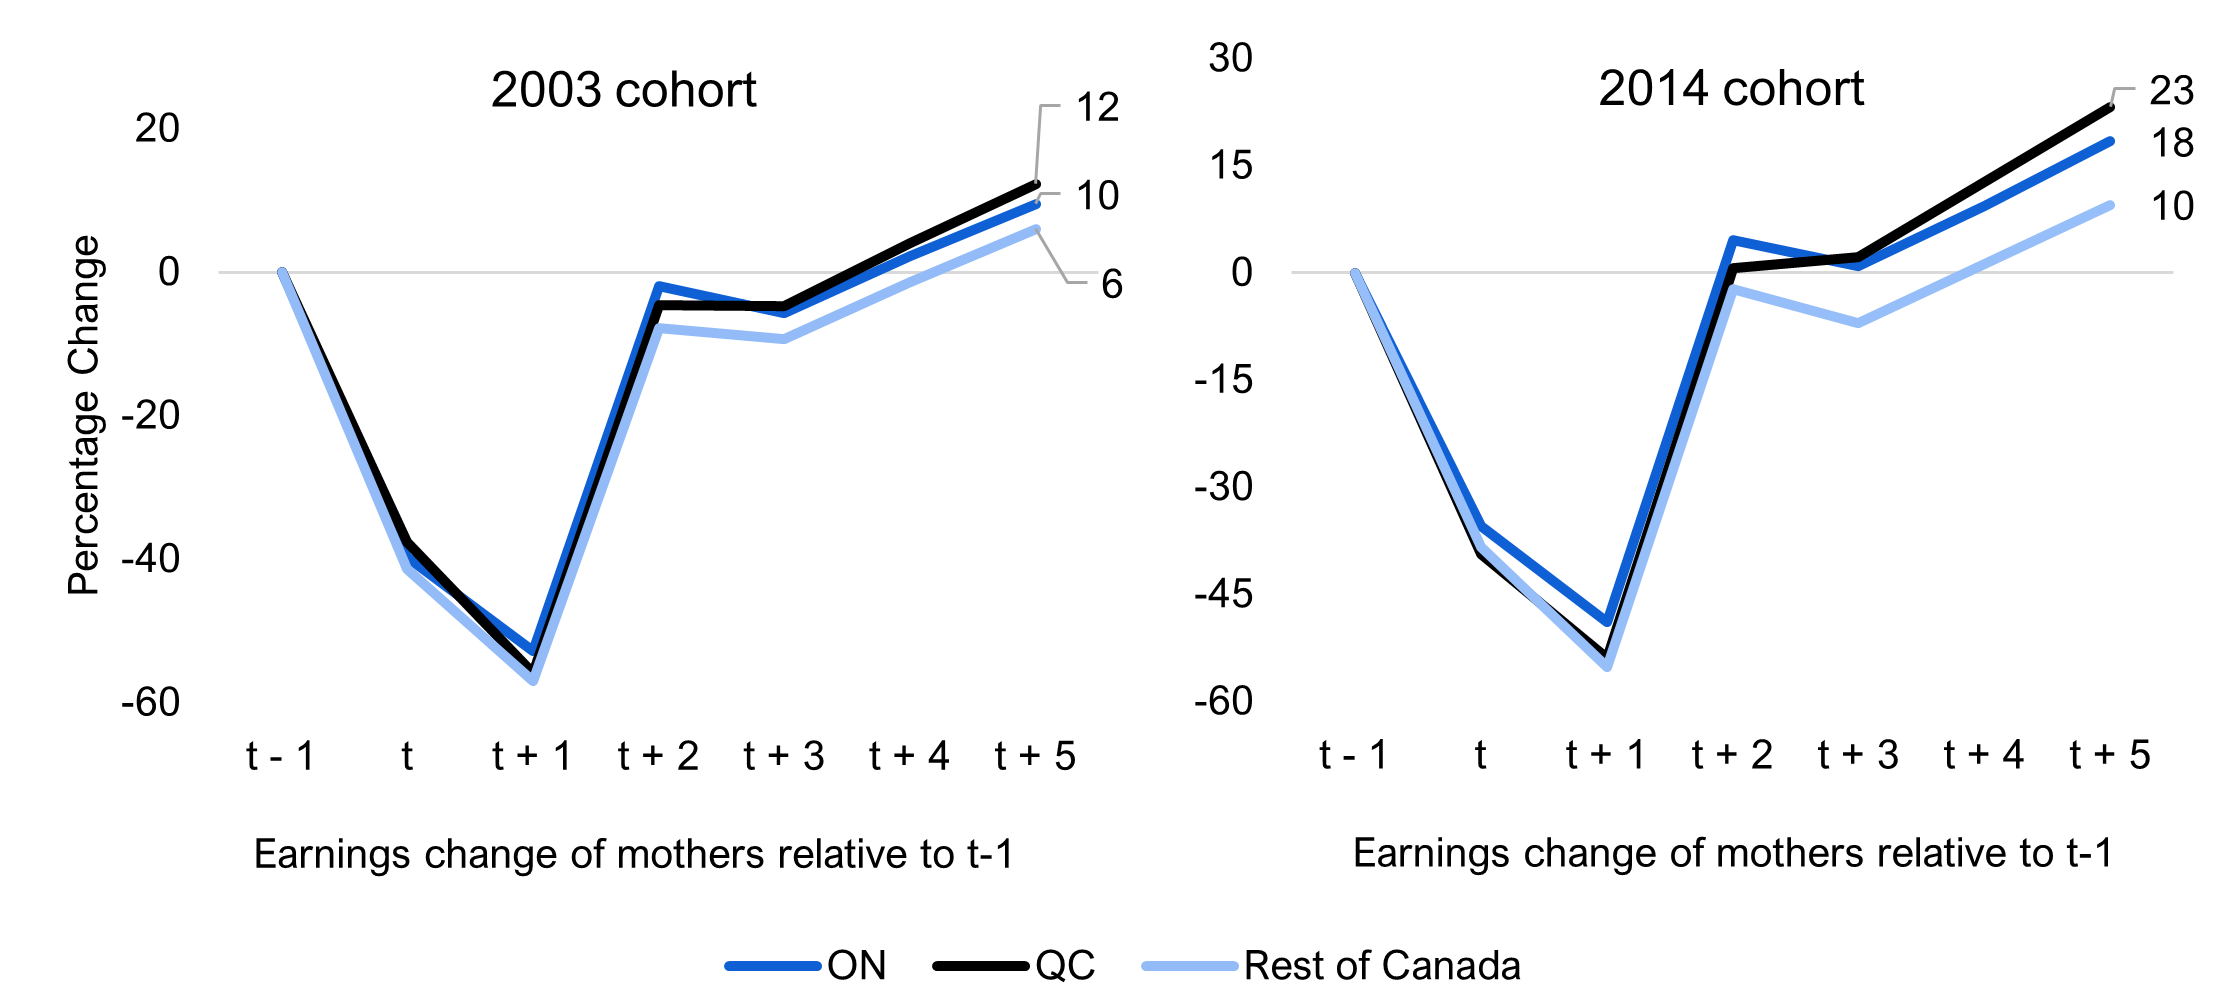
This chapter also discusses how the Child Care Agreement could impact the short-term earnings trajectory of mothers in Ontario by examining the experience of Quebec mothers. Subsidized child care in Quebec appears to have only modestly improved mothers earnings outcomes compared to Ontario. Mothers in both provinces faced motherhood penalties for two years before returning to pre-childbirth earnings. However, five years after childbirth Quebec mothers earned 23 per cent more than they did pre-childbirth, larger than the 18 per cent increase for Ontario mothers.
Child Care in Ontario and the Canada-wide Early Learning and Child Care Agreement
In the 2021 federal budget, the government of Canada outlined a national child care spending plan with the aim to reduce child care fees by 50 per cent from 2019 levels by the end of 2022, and to further reduce fees for all regulated child care spaces for children under the age of six years to $10 a day by 2026. In 2021 and 2022, the federal government signed bilateral Early Learning and Child Care Agreements with all provinces and territories. These agreements outline regional funding allocations, as well as the planned number of child care spaces and early child care educator jobs to be created.
The 2022 federal budget allocated $30 billion over five years to fund the agreements, and also earmarked an additional $625 million over four years beginning in 2023-24 for an Early Learning and Child Care Infrastructure Fund to help with implementation of the agreements. Successful implementation of the agreements will depend on the extent to which provinces and territories are able to meet the federal targets they contain.[27]
According to the Canada-Ontario agreement,[28] Ontario is expected to receive $10.2 billion in federal funding over five years. The province plans to add an additional $267 million in funding to bring the combined funding to a total of $10.5 billion over five years. Child care funding in Ontario is projected to increase from $2.2 billion in 2021-22 to $6.5 billion in 2027-28 as the province implements the new $10 a day child care program.[29] The agreement has two main objectives in the provision of licensed child care for children under the age of six years. The first is to reduce the cost of child care to an average $10 a day by 2025, and the second is to create 71,000 new licensed child care spaces.[30]
Implementation of the Child Care Agreement in Ontario
The Ontario government funds municipal service system managers designated under the Child Care and Early Years Act to manage child care services across the province. Licensed child care providers offer spaces at market prices less any support through transfer payments from the Province.
Under the agreement, licensed child care operators in Ontario can receive funding to offer reduced fees to families with children under the age of six years old that pay more than $12 a day in child care fees. Once eligible providers are enrolled in the program, funding is provided directly to municipal service system managers, and subsequently to the providers, who can then lower child care fees. For child care operators that chose not to participate, government funding directed at reducing fees is not provided and parents continue to pay status quo market-based child care fees.
As of November 1, 2022, 92 per cent of licensed operators had enrolled into the program.[31] The Province outlined a phased approach for participating operators, reducing child care fees for children under six years of age by an average of 25 per cent retroactive to April 1, 2022. By the end of December 2022, child care operators were to reduce fees by 50 per cent on average, and ultimately offer an average $10 a day child care by September 2025.
| Timeline | Policy target | Estimated average licensed child care fee/day |
|---|---|---|
| March 2022 | 25 per cent reduction in fees | $36 |
| December 2022 | 37 per cent additional reduction in fees (50 per cent of 2020 fee) | $23 |
| September 2024 | Unknown reduction in fees | TBD |
| September 2025 | $10 a day target | $10 |
The 2022 federal budget estimates that a 50 per cent reduction in child care fees would save an annual average of $6,000 per child relative to gross fees paid in 2019, and fees at $10 a day is expected to save over $9,000 per child.[32]
At the end of 2021, there were 304,246 licensed child care spaces in Ontario for children under age six. The Agreement also includes a target of 71,000 new licensed child care spaces for children under the age of six years by 2026, which, if achieved, would bring the total number to 375,111 in that year.[33]
The Potential Impact of $10 Child Care on Women’s Labour Participation
The high cost of child care in Ontario contributes to lower rates of child care usage[34] and lower female labour market participation.[35] In 2022, child care usage among children below the age of six was 39.3 per cent in Ontario, the lowest rate among Canadian provinces.[36] In contrast, Quebec’s subsidized child care program contributed to the highest share of children in child care at 71.3 per cent.[37] Low child care usage contributes to lower female labour participation as mothers with young children often take time off from work or leave their jobs.
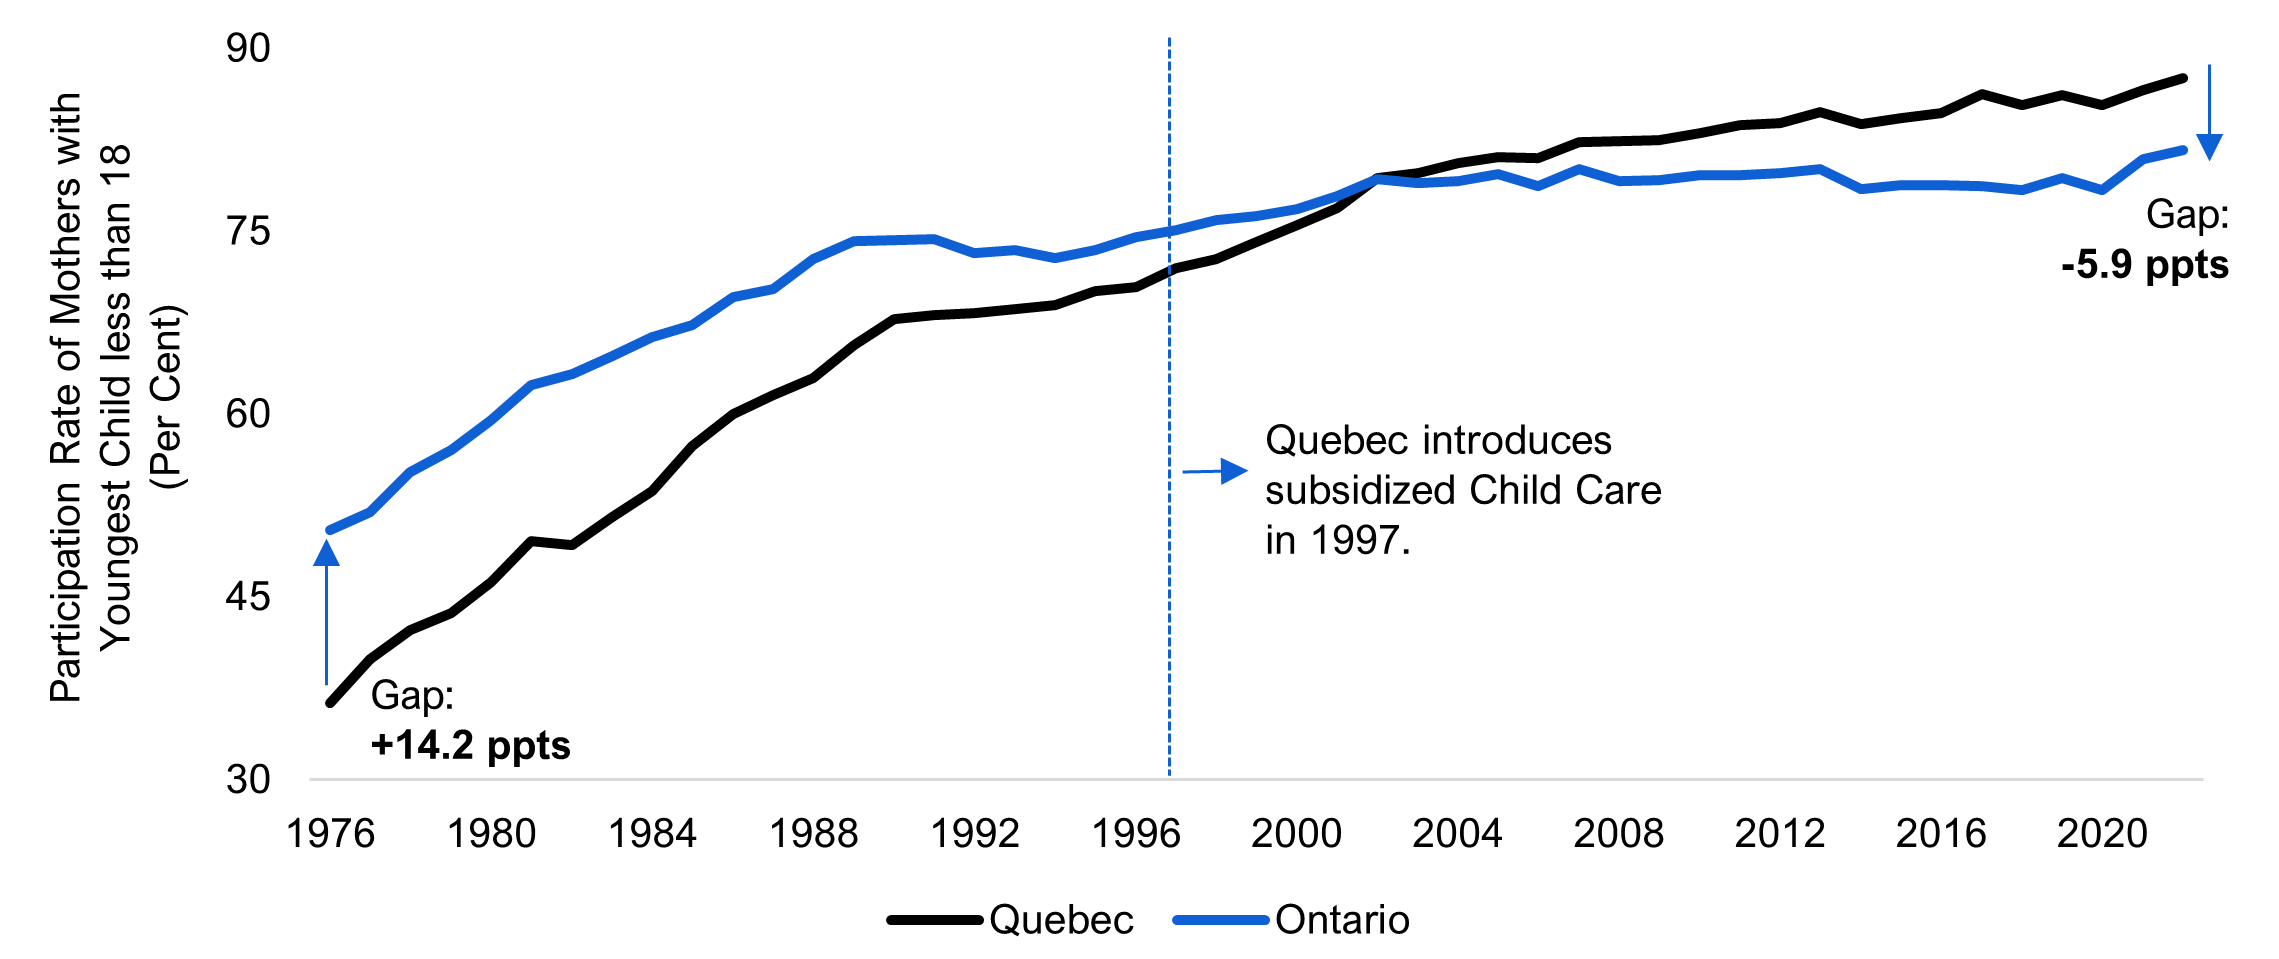
One of the aims of the Canada-wide Early Learning and Child Care Agreement is to increase the labour participation of women with children.[38] In Quebec, following the implementation of subsidized child care in 1997, the job market engagement of mothers improved dramatically. The labour force participation rate of Quebec’s mothers with children 0-5 years rose from 67 per cent in 1997 to 83 per cent in 2022.
The following sections assess the potential impact of the Child Care Agreement in Ontario in three ways:
- by examining the experience of Quebec mothers following the introduction of subsidized child care policies in 1997;
- by exploring the changes in labour market participation for Ontario mothers in 2022 (the first year of the agreement) and;
- by estimating the potential impacts on labour market participation based on the experience of numerous other jurisdictions that have introduced subsidized child care.
Quebec’s subsidized child care policies improved the labour market participation of mothers
Historically, the labour participation rate of Ontario mothers was well above that of Quebec mothers. In 1977, the labour force participation rate of Ontario mothers was 14.2 percentage points higher than Quebec mothers. However, following the introduction of subsidized child care in 1997, Quebec mothers increasingly entered the labour market, and by 2022 Ontario’s labour force participation rate of mothers was 6 percentage points lower.
Figure 5.1 Quebec mothers’ participation rates surpassed Ontario mothers after the introduction of subsidized child care
Note: Only includes core-age group (25-54 years).
Source: Statistics Canada and FAO
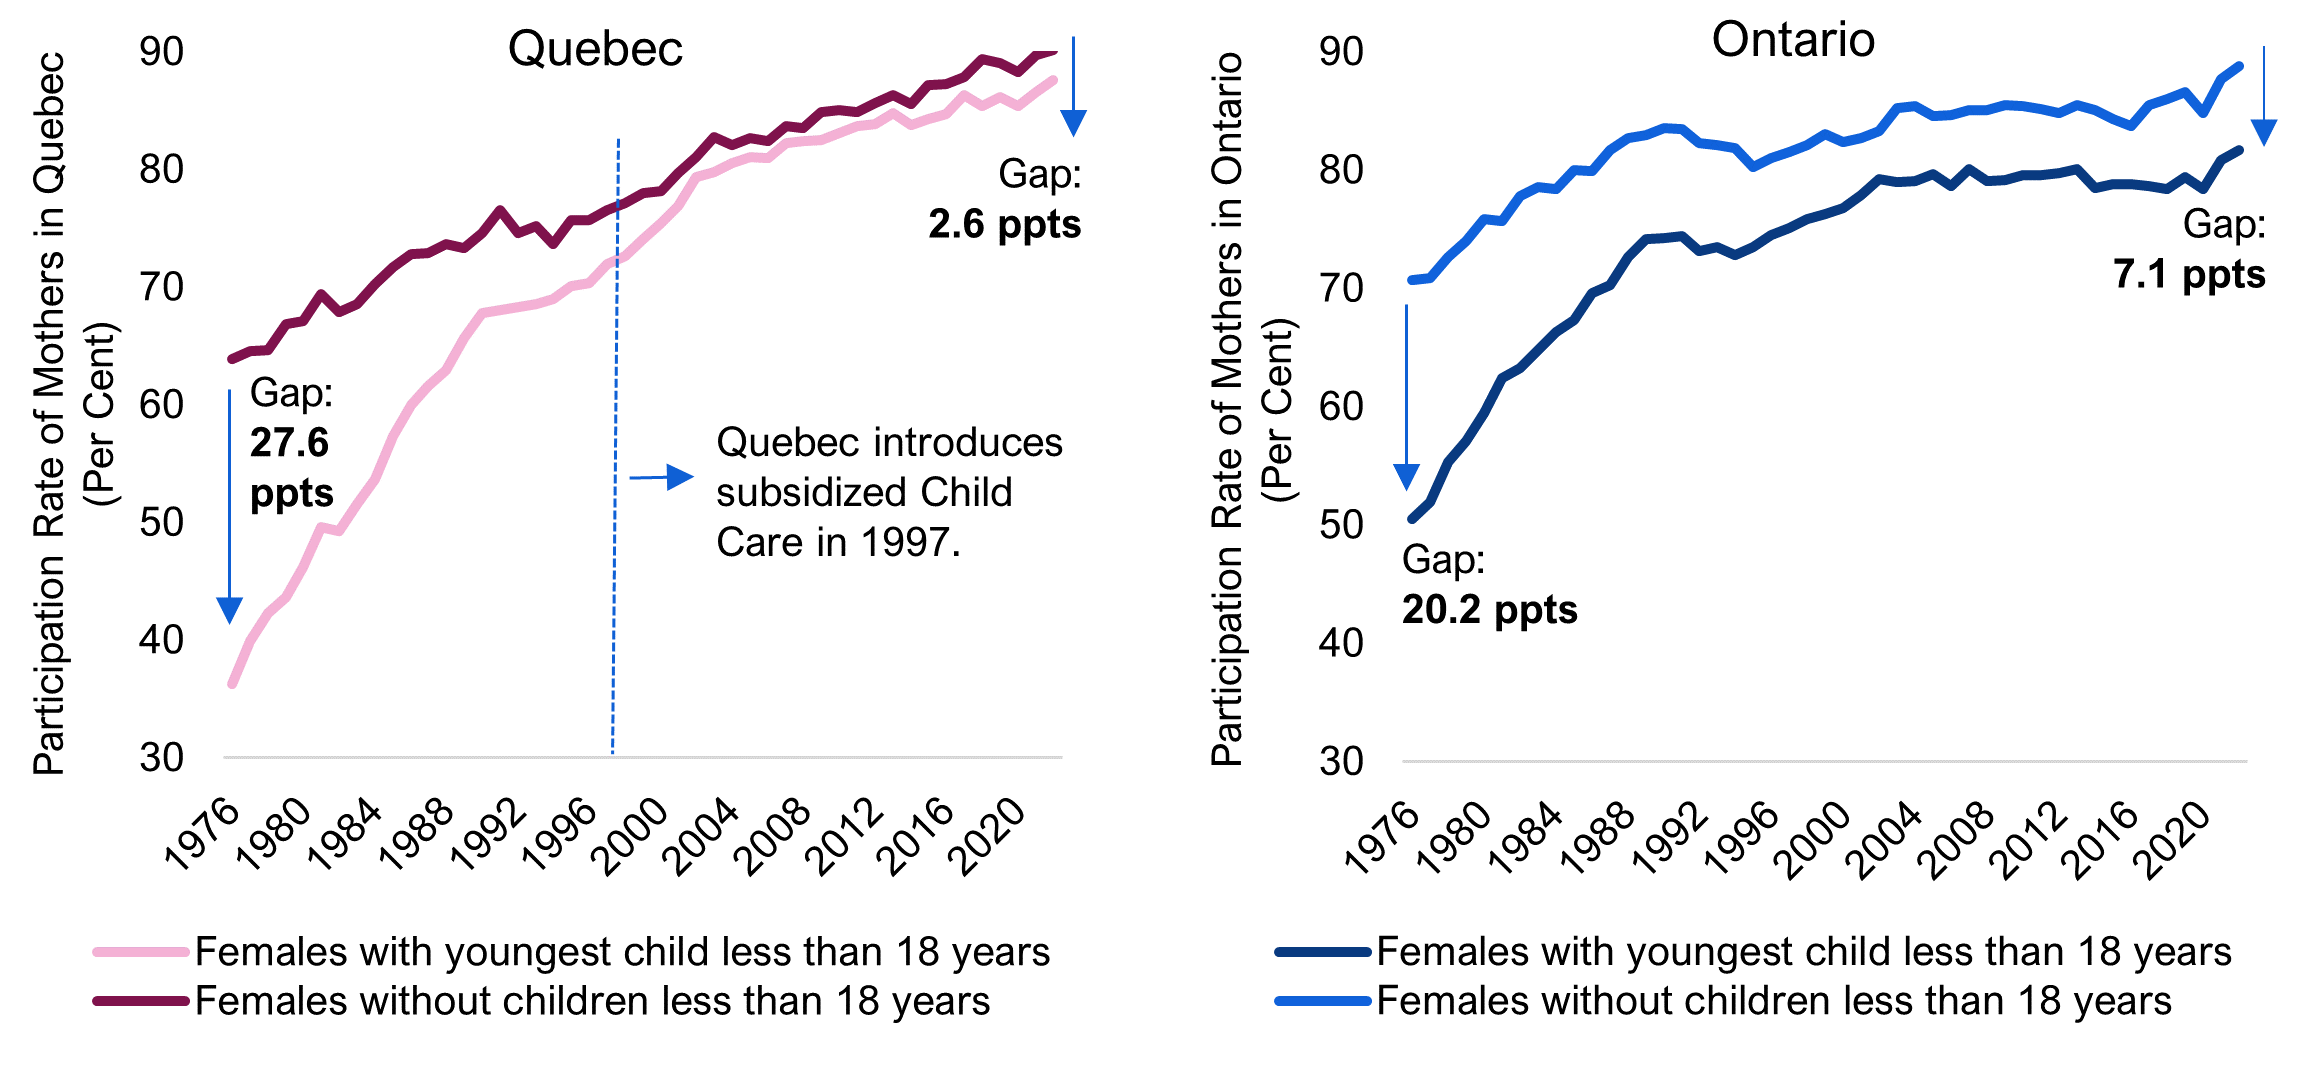
While the labour force participation rate of Ontario mothers was largely unchanged over the past two decades, the rate for Quebec’s mothers has risen significantly. As a result, the gap in labour participation rates between Quebec mothers and non-mothers has declined dramatically from 27.6 percentage points in 1976 to just 2.6 percentage points in 2022. By comparison, Ontario mother’s labour participation rate was 7.1 percentage points lower than non-mothers in 2022.
Figure 5.2 Quebec mothers’ labour participation gap has narrowed significantly
Note: Only includes core-age group (25-54 years).
Source: Statistics Canada and FAO
The labour market trends in Quebec offer insight into the effectiveness of family policies that encourage mothers' participation in the labour force.[39]
A greater proportion of Quebec mothers return to the labour market following childbirth compared to Ontario mothers
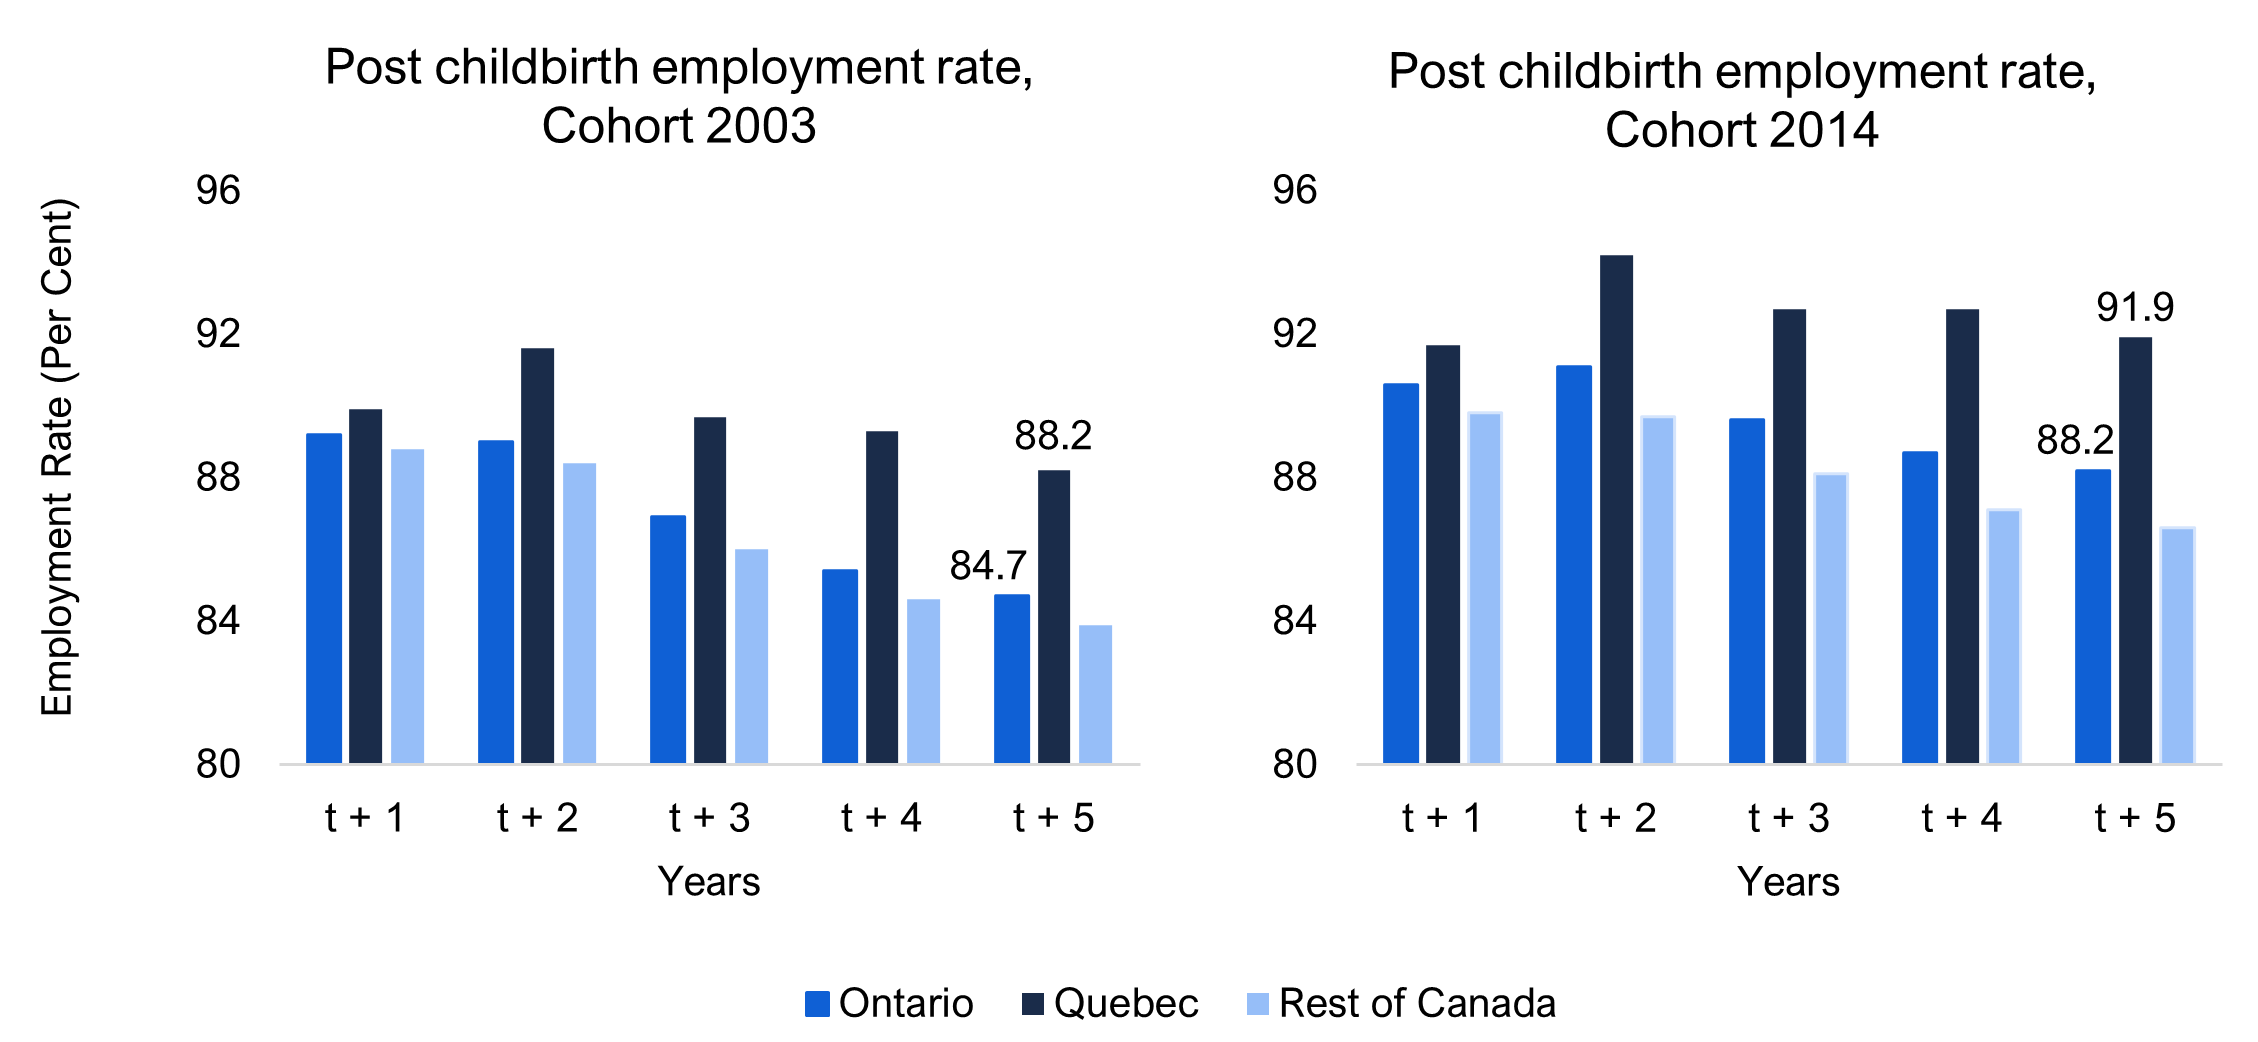
Childbirth impacts the employment of mothers as they decide whether to stay at home or return to work, as well as decisions about the duration of their maternity leave. The proportion and outcomes of mothers returning to the labour market following childbirth show considerable differences between Ontario and Quebec. Notably, the employment rate[40] of Quebec mothers is higher for every year following childbirth compared to Ontario mothers and mothers in the rest of Canada.
Using the custom data sets provided by Statistics Canada (the 2003 and 2014 cohorts aged 30 to 39 years of mothers who gave birth and non-mothers), figure 5-3 compares the post-birth employment rates of Ontario mothers to those of Quebec and the rest of Canada for both cohorts.
Figure 5.3 Post childbirth employment rates of Quebec mothers exceed Ontario and Rest of Canada mothers
Source: Statistics Canada and FAO
For the 2003 cohort, 88.2 per cent of Quebec mothers were employed five years after childbirth compared to 84.7 per cent of Ontario mothers. For the 2014 cohort, 91.9 per cent of Quebec mothers were employed five years after childbirth, compared to 88.2 per cent of Ontario mothers. Other research shows a higher rate of Quebec mothers returning to work compared to Ontario and other provinces.[41] This suggests that policies which subsidize the costs of child care tend to increase the labour market participation of mothers.
An early look at the potential impact of $10 a day child care on Ontario mothers in 2022
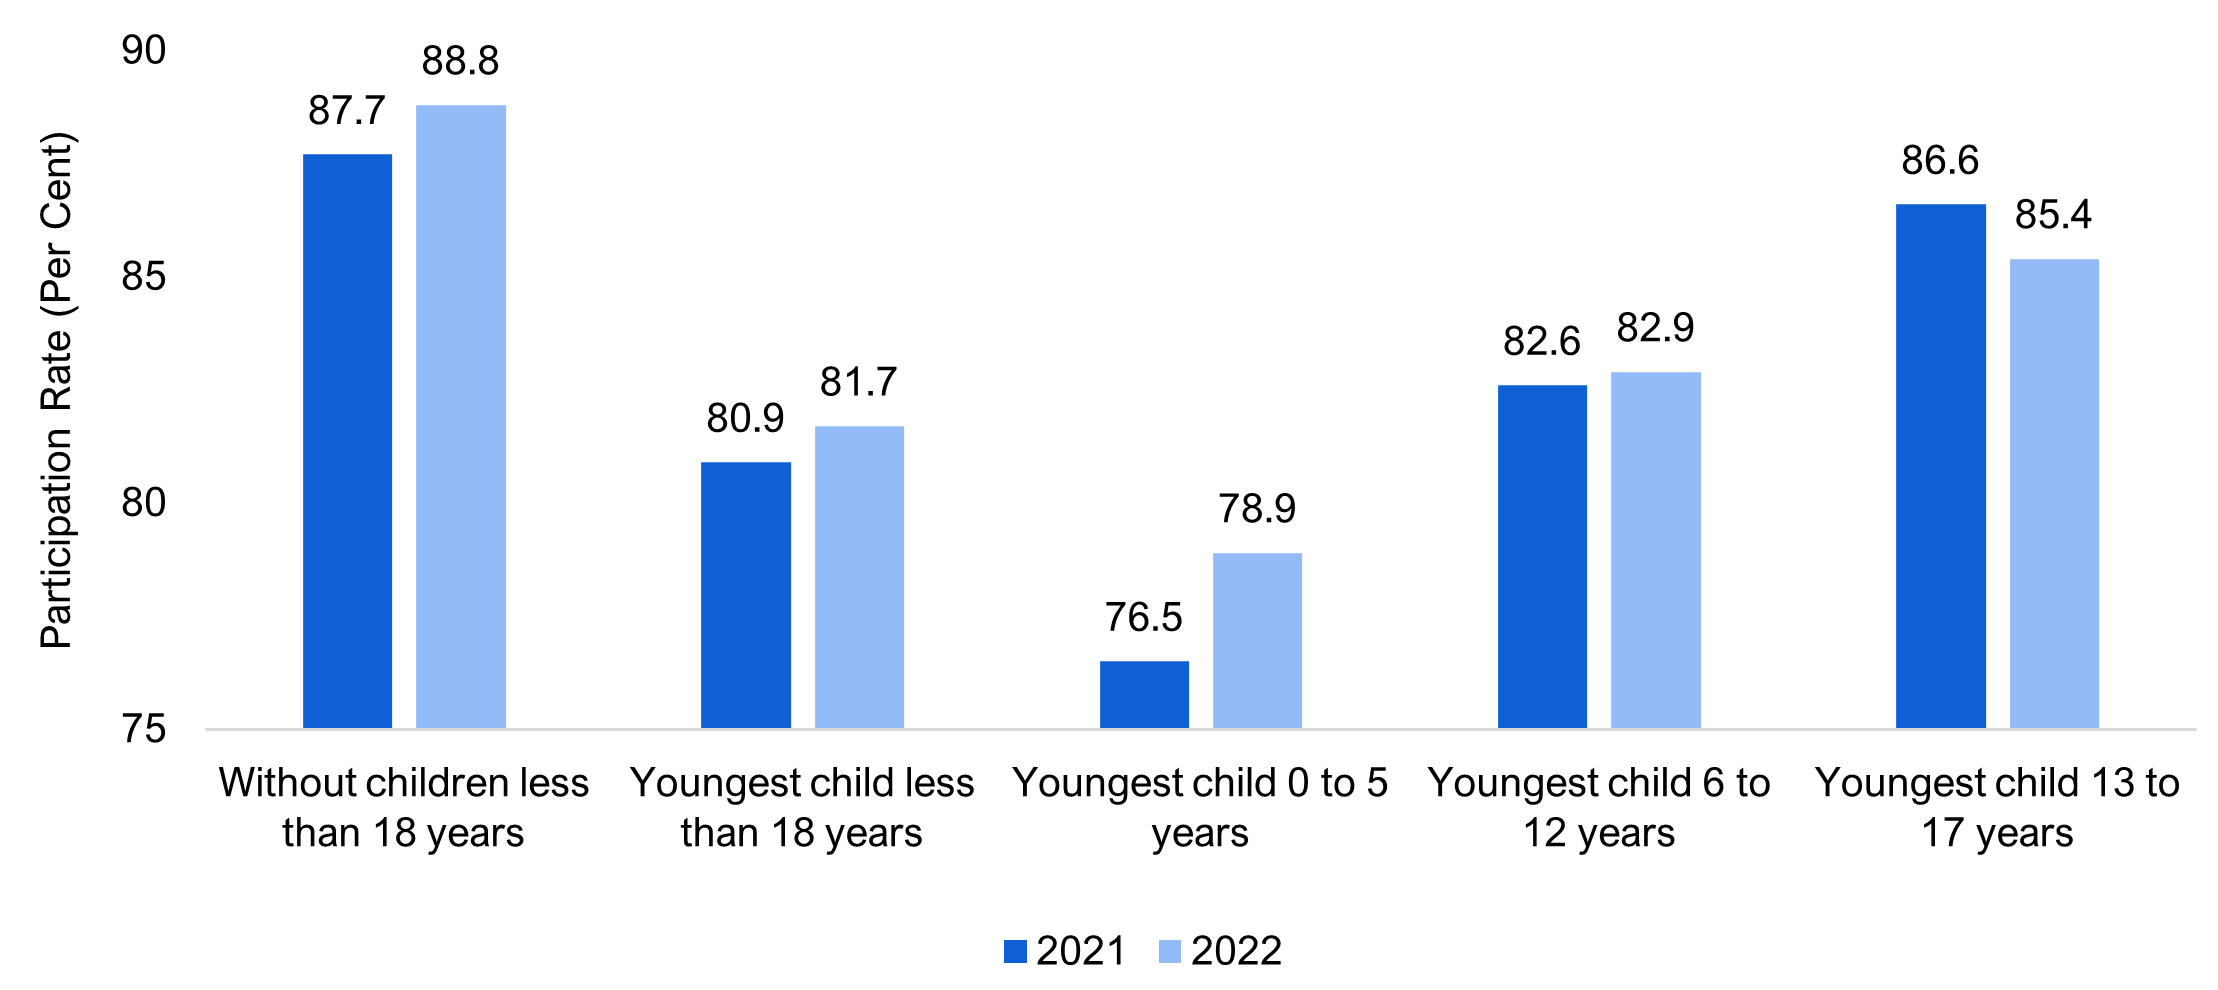
In 2022, labour participation rates for Ontario core-age mothers reached 81.7 per cent – the highest on record since 1976 and 1.1 percentage points higher than in 2021. Notably, the labour participation rate of mothers with children between the ages of 0-5 years increased from 76.5 per cent in 2021 to 78.9 per cent in 2022, an increase of 2.4 percentage points. Mothers with older children (13-17 years) who are not impacted by the Child Care Agreement experienced modest declines in labour participation.
Figure 5.4 Record participation rate gains for Ontario mothers
Source: Statistics Canada and FAO
Participating child care operators in Ontario began reducing fees by 25 per cent on April 1, 2022. Although the lower fees are likely already encouraging increased labour market attachment of mothers with young children, more time is needed to assess the full impact. In addition, numerous other factors are impacting labour market participation rates, including the historically tight labour market with a high prevalence of available jobs, the easing of the COVID-19 pandemic, the rise of work-from-home arrangements, and greater pressure on household financial budgets due to elevated inflation and higher interest rates.
Projecting the potential impact of $10 a day child care on Ontario mothers
Figure 5.5 The impact on Ontario’s female participation rate by 2027
Source: Statistics Canada and FAO.
To estimate the potential impact of the $10 a day child care policy on mother's labour market participation, the FAO used existing research that analyzed the relationship between child care fees and job market attachment.[42] The estimated response of female labour supply to lower child care costs range from a two to four per cent increase for every 10 per cent decrease in the cost of child care.[43]
This suggests that in response to a 78.3 per cent decline in child care costs (corresponding to a decline in average child care costs from $46 in 2022 to $10 by 2025), the labour market participation rate of Ontario core-age women could potentially increase from 84.0 per cent in 2022 to between 85.6 and 87.1 per cent by 2027 all else equal. This would add 50,900 to 98,600 more women to Ontario’s labour force.
While the FAO did not conduct a full macroeconomic analysis, the current high level of job vacancies suggests that Ontario’s labour market has the capacity to absorb the increase in labour market entrants prompted by the subsidized child care fees, and any impacts on Ontario’s unemployment rate would be minimal in the short term. Over the long term, Ontario’s potential economic growth depends fundamentally on the supply of workers and their productivity (i.e. the average amount of income each worker can produce). As such, subsidizing child care fees has the potential to increase the labour supply and support long-term economic growth.
However, several potential constraints could limit the increase in the labour participation of Ontario mothers, including: ensuring an adequate supply of child care spaces and program funding, as well as child care staffing shortages. The actual path of women’s labour market participation over the next several years will depend on the impact of these constraints and the overall health of Ontario's economy and the pace of job creation.
The Potential Impact of $10 Child Care on Women’s Labour Market Outcomes
Using the custom data sets provided by Statistics Canada, the FAO compared the earnings penalty of Ontario and Quebec mothers across two cohorts (2003 and 2014) after childbirth. While evidence supporting the improvements in labour participation and employment of mothers from lower child care costs is well documented, it is less clear whether lower child care costs would improve the short-term earnings profile of mothers after childbirth. While a large portion of the earnings gap between mothers and women without children can be explained by observable factors such as age and education, an important influence is the number and duration of career interruptions. Importantly, after accounting for all observable factors, approximately 30 per cent of the motherhood earnings gap remains unexplained. It is difficult to assess to what extent this remaining earnings gap is due to the changing preferences of women post-childbirth, employer’s discrimination towards mothers, or other factors.[44]
Earnings growth in post-childbirth years for Quebec mothers only modestly above mothers in Ontario
While subsidized child care fees in Quebec raised mothers’ labour participation and employment, it is less clear whether there are similar gains to their short-term income trajectories. Five years after childbirth, Quebec mothers in the 2003 cohort reported earnings growth of 12 per cent, only modestly above the 10 percent gain for Ontario mothers without subsidized child care fees. The 2014 cohort showed more of a difference, with the earnings of Quebec mothers increasing 23 per cent above their pre-childbirth earnings five years after childbirth, five percentage points higher than the 18 per cent increase for Ontario mothers.
Figure 5.6 Mothers in Ontario and Quebec experience similar short-term earnings losses
Note: year “t-1” is the year prior to childbirth, and year t is the year of childbirth.
Source: Statistics Canada and FAO
Across both cohorts, mothers in the rest of Canada had the weakest earnings growth compared to Ontario and Quebec. In the 2003 cohort, mothers in the rest of Canada only saw a 6 per cent increase in earnings five years after childbirth, half the growth of mothers in Quebec. For the 2014 cohort, a similar pattern emerged, with mothers in the rest of Canada recording earnings growth of 10 per cent, significantly below the 23 per cent growth for Quebec mothers. This gap may reflect differences in the labour market conditions among the provinces.
Comparing earnings between Quebec mothers and non-mothers reveals a similar outcome, where the availability of lower child care fees did not noticeably lessen the duration or the magnitude of the motherhood penalty. Across the Quebec cohort of mothers, earnings fell between 21 and 32 per cent in the year of childbirth and declined further in the following year between 47 to 50 per cent, larger losses than experienced by Ontario mothers (38 to 44 per cent). Five years after childbirth, while both Quebec and Ontario mothers fare better than non-mothers, they did not return to rate of their pre-birth earnings advantage.
Figure 5.7 Quebec mothers face motherhood earnings penalty of two years
Note: “t” represents the year of childbirth.
Source: Statistics Canada and FAO
The extent to which the $10 a day child care policy will impact women’s earnings and the gender wage gap in Ontario depends on whether increased labour market engagement is correlated with higher wages. For example, in Quebec’s case the gender wage gap improved from $0.84 in 1997 to $0.91 in 2022, an improvement of 7 cents for every dollar men earn. Over the same period, Ontario’s gender wage gap improved by 5 cents in the absence of subsidized child care fees. This suggests only a weak correlation between subsidized child care fees and higher average hourly wages for women in the short-term, and that other factors may impact women’s earnings to a greater extent.
The impact of subsidized child care fees on the motherhood earnings penalty is unclear and requires further research. These impacts will depend in part on whether lower child care costs affect decisions about how quickly mothers re-enter the labour market. It is possible that the new child care agreement will prompt Ontario mothers to take shorter maternity leaves, based on the experience of Quebec.[45] Shorter maternity leaves could also be expected to lessen the life-time motherhood earnings penalty, but this was beyond the scope of the FAO’s research.
Potential challenges could limit the labour market impact of $10 a day child care in Ontario
There are various risks associated with the Child Care Agreement that could limit the potential positive impacts to Ontario’s labour market and the broader economy. The main risks include:
- Adequate supply of child care spaces: The agreement indicates that 71,000 new child care spaces be created by 2026. However, the lower child care fee could lead to excess demand for child care providers, resulting in a shortage of child care spaces. The FAO estimates that by 2026, 227,146 additional spaces would be required to fulfil the demand for $10 a day child care. If the government does not expand supply of child care spaces beyond the 71,000 in the agreement, lengthy waitlists will result, offsetting some of the positive impacts on mother's labour market participation.
- Child care staffing shortages. Increasing and retainingearly childhood educators in the child care sector will be crucial for the expansion of child care spaces, as new spots cannot open with insufficient staffing levels. The province has set a wage floor for early child care program staff at $19 per hour in 2023, increasing by $1 every year to reach a maximum cap of $25 per hour.[46] The FAO estimates that 16,000 more child care workers will need to be hired by 2026-27.[47] Reports of many workers leaving the child care sector suggest it could be challenging to find adequate staffing levels for the expected increase in demand for spaces.[48] In 2022, staffing shortages caused 25 per cent of Toronto child care agencies to temporarily reduce their operating capacity.[49]
- Insufficient program funding: The implementation of the $10 a day child care program depends on significant federal government contributions. The FAO has estimated that there is a risk of a $1.2 billion funding shortfall in 2026-27 based on the preliminary commitment and an estimated $4.1 billion shortfall in the absence of a provincial and federal commitment by 2027-28.
- Expansion of parental leave and benefits: The decision to return to work and how soon to do so depends on the availability of paid parental leave and benefits. The current parental benefits system allows for a standard paid leave for 12 months (55 per cent of average weekly earnings for up to 35 weeks) with the option to extend the leave to 18 months (33 per cent of average weekly earnings for up to 61 weeks). An expansion of the benefit system generally delays a mother’s re-entry into the labour market.[50] Any further policy changes that enhance parental leave benefits could limit the expected increase in labour participation of mothers in response to the new low-fee child care program.[51]
6. Appendix
Appendix A: Statistics Canada custom data and sample
Chapter 4 and 5 use data from Statistics Canada’s Longitude Worker File (LWF) 1998-2019. The LWF is a 10 per cent random sample of all Canadian workers, constructed by integrating data from four sources: the Record of Employment (ROE) files of Human Resources Development Canada (on worker separations), the T1 and T4 tax files of Canada Customs and Revenue Agency, and the Longitudinal Employment Analysis Program (LEAP) of the Business and Labour Market Analysis (BLMA) Division of Statistics Canada.
The ROE indicates the reason for a job interruption, and maternity leave is one of the reasons. The maternity leave indicator is used in this report to define mothers compared to women who did not give birth (non-mothers). T4 records are used to measure the employment rate (zero or positive earnings) and median earnings of mother and non-mothers. Note that income measures earnings from paid employment, taken from Total T4 earnings, were adjusted to 2021 constant dollars using the Consumer Price Index, and were rounded to the nearest $100.
The mothers in this study sample were aged 30-39 years in the year they gave birth; they had positive earnings reported in a T4 slips before taking maternity leave and filed the T1 tax return in the same year, and in the previous year; and they did not experience a job separation related to maternity. Note that results were regionally broken down for Ontario, Quebec, and rest of Canada. These restrictions allow for the construction of two separate cohorts defined in 2003 and 2014, and the period spans from 1998 to 2008 and from 2009 to 2019, respectively.
For each cohort of mothers, median earnings for unconditional (including zero earnings) and conditional (excluding zero earnings) samples were calculated, and an employment rate tabulation was established. This cohort of non-mothers satisfied the same restrictions, except for giving birth. The comparison group provides insights about the extent of changes in employment or earnings due to childbirth as experienced by mothers only.
| Sample restrictions | 1. Two separate cohorts defined in 2003 and 2014 to identify mothers vs. women who did not give birth. To produce statistics prior to and after childbirth, the periods span from 1998 to 2008, and 2009 to 2019, respectively. |
|---|---|
| 2. Excludes women who had a job separation related to maternity in t-1 when defining the sample in year t. | |
| 3. Age: 30-39 years in cohort years (2003 and 2014). Note that this age range covers more mothers in cohort 2014 than cohort 2003. | |
| 4. Filed T1 tax return in year t (to have gender, age, and province information) and filed the T1 tax return in Canada (provinces and territories). | |
| 5. Had positive earnings reported in a T4 in year t. This restriction was applied because the definition of mothers is based on ROE which an employer issues to its employees, both mothers and non-mothers were restricted to those who had at least one paid job in year t with positive earnings on their T4. |
Definitions:
- Mother/ Non-mother – Mothers were defined as women who had at least one paid job in year t and received a ROE for maternity (pregnancy) and parental leave reasons. The pregnancy may or may not be their first. Non-mothers were defined as women who had at least one paid job in year t and did not receive an ROE for maternity (pregnancy) or parental leave reasons. Note that some new mothers who did not receive an ROE may be included to as non-mothers.
- Employment rate – Employment = 1 if a person had positive earnings. Employment = 0 if a person had zero earnings in the T4 record or the person had no T4 records in the year (a person having no T4 records may not work at all or may have some self-employment income).
- Median earnings – Income measures earnings from paid jobs, taken from Total T4 earnings. Income was adjusted to 2021 constant dollars using the Consumer Price Index and was rounded to the nearest $100.
- Region – Region of residence: Ontario, Quebec, and rest of Canada (including the Territories).
- Gender Wage ratio: The gender wage ratio is calculated as female average earnings as a proportion of male average earnings for full-time and part-time employees 15 years and older.
- Parental Leave: Standard parental leave offers a benefit of 55 per cent of earnings for 12 months while extended parental leave offers a benefit rate of 33 per cent for 18 months.
- Participation Rate: The percentage of the population that is either working or actively looking for work.
- Motherhood Penalty: The income losses incurred by a woman in the year of, and subsequent years after childbirth.
- Core-Age: Age group that includes 25-54 year olds.
- Top Officer: An individual who occupies one of the following positions: chairperson, president, vice-president, or executive vice president.
Appendix B: Statistics Canada table references for figures
| Figure | Table |
|---|---|
| Fig 3.1 | Table: 14-10-0327-01 |
| Fig 3.2 | Table: 14-10-0020-01 (formerly CANSIM 282-0004) |
| Fig 3.3 | Table: 14-10-0020-01 (formerly CANSIM 282-0004) |
| Fig 3.4 | Table: 14-10-0396-01 |
| Fig 3.5 | Table: 14-10-0396-01 |
| Fig 4.1 | Table: 14-10-0064-01 (formerly CANSIM 282-0072) |
| Fig 4.2 | Table: 14-10-0064-01 (formerly CANSIM 282-0072) |
| Fig 4.3 | Table: 14-10-0118-01 (formerly CANSIM 282-0209) |
| Fig 4.4 | Table: 37-10-0135-01 |
| Fig 4.5 | Table: 14-10-0416-01 |
| Fig 4.6 | Table: 33-10-0660-01 |
| Fig 4.7 | Table: 14-10-0327-01 |
| Fig 4.8 | Custom tabulation from Longitudinal Workers File |
| Fig 4.9 | Custom tabulation from Longitudinal Workers File |
| Fig 4.10 | Custom tabulation from Longitudinal Workers File |
| Fig 5.1 | Table: 14-10-0396-01 |
| Fig 5.2 | Table: 14-10-0396-01 |
| Fig 5.3 | Custom tabulation from Longitudinal Workers File |
| Fig 5.4 | Table: 14-10-0396-01 |
| Fig 5.5 | Table: 14-10-0396-01 |
| Fig 5.6 | Custom tabulation from Longitudinal Workers File |
| Fig 5.7 | Custom tabulation from Longitudinal Workers File |
Appendix C: Glossary of Terms
| Term | Definition |
|---|---|
| STEM | Science, Technology, Engineering, and Mathematics |
| CWELCC | Canada-Wide Early Learning and Child Care |
| EI | Employment Insurance |
| LWF | Longitude Worker File |
| ROE | Record of Employment |
| LEAP | Longitudinal Employment Analysis Program |
| BLMA | Business and Labour Market Analysis |
Graphical Descriptions
| Year | Participation Rate (Per Cent) | |
|---|---|---|
| Women | Men | |
| 1976 | 49.6 | 79.4 |
| 1977 | 50.2 | 79.3 |
| 1978 | 51.5 | 79.8 |
| 1979 | 53.3 | 80.3 |
| 1980 | 54.4 | 79.8 |
| 1981 | 55.7 | 80.3 |
| 1982 | 56.2 | 79.3 |
| 1983 | 56.9 | 78.8 |
| 1984 | 57.4 | 78.7 |
| 1985 | 58.3 | 78.9 |
| 1986 | 58.8 | 79.2 |
| 1987 | 59.7 | 78.9 |
| 1988 | 61 | 78.6 |
| 1989 | 61.4 | 78.8 |
| 1990 | 61.4 | 78 |
| 1991 | 61 | 76.4 |
| 1992 | 59.9 | 75.1 |
| 1993 | 59.4 | 74.3 |
| 1994 | 58.8 | 73.4 |
| 1995 | 58.6 | 72.7 |
| 1996 | 58.9 | 72.6 |
| 1997 | 59 | 72.8 |
| 1998 | 59.6 | 72.6 |
| 1999 | 60.3 | 73.1 |
| 2000 | 61 | 73.3 |
| 2001 | 61.4 | 73.4 |
| 2002 | 62 | 73.7 |
| 2003 | 62.9 | 74.3 |
| 2004 | 62.9 | 74.1 |
| 2005 | 62.6 | 73.5 |
| 2006 | 62.6 | 73 |
| 2007 | 63 | 72.6 |
| 2008 | 62.8 | 72.7 |
| 2009 | 62.6 | 71.8 |
| 2010 | 62.7 | 71.5 |
| 2011 | 62.3 | 71.5 |
| 2012 | 61.9 | 71.2 |
| 2013 | 62.2 | 71 |
| 2014 | 61.6 | 70.6 |
| 2015 | 60.8 | 70.4 |
| 2016 | 60.6 | 69.9 |
| 2017 | 60.7 | 70 |
| 2018 | 60.5 | 69.6 |
| 2019 | 60.8 | 70 |
| 2020 | 59.1 | 68.6 |
| 2021 | 60.7 | 69.9 |
| 2022 | 61.2 | 69.9 |
| Age Group | Labour Force Participation Gap (Percentage Points) | Overall Gap |
|---|---|---|
| 15-19 | -4.2 | 8.7 |
| 20-24 | 0.4 | 8.7 |
| 25-29 | 4.0 | 8.7 |
| 30-34 | 9.0 | 8.7 |
| 35-39 | 9.6 | 8.7 |
| 40-44 | 8.9 | 8.7 |
| 45-49 | 8.4 | 8.7 |
| 50-54 | 7.7 | 8.7 |
| 55-59 | 11.2 | 8.7 |
| 60-64 | 11.8 | 8.7 |
| 65+ | 8.3 | 8.7 |
| Educational Attainment | Labour Force Participation Gap (Percentage Points) | Overall Gap |
|---|---|---|
| Below Postsecondary | 22.3 | 7.9 |
| Postsecondary certificate or diploma | 7.8 | 7.9 |
| University Degree | 6.1 | 7.9 |
| Year | Labour Force Participation Gap (Per Cent) | |||
|---|---|---|---|---|
| Without children less than 18 years | With youngest child less than 18 years | |||
| Women | Men | Women | Men | |
| 1976 | 70.7 | 94.6 | 50.5 | 97.7 |
| 1977 | 70.9 | 93.8 | 52 | 97.6 |
| 1978 | 72.7 | 94.3 | 55.3 | 97.9 |
| 1979 | 74 | 94.9 | 57.1 | 97.7 |
| 1980 | 75.9 | 94.7 | 59.5 | 97.4 |
| 1981 | 75.7 | 95.1 | 62.4 | 97.9 |
| 1982 | 77.8 | 94.1 | 63.3 | 97.4 |
| 1983 | 78.6 | 94.4 | 64.8 | 97.4 |
| 1984 | 78.4 | 93.5 | 66.3 | 97.4 |
| 1985 | 80 | 94.4 | 67.3 | 97.3 |
| 1986 | 79.9 | 94.8 | 69.6 | 97.6 |
| 1987 | 81.7 | 93.7 | 70.3 | 97.5 |
| 1988 | 82.7 | 93.8 | 72.7 | 97.2 |
| 1989 | 83 | 94.1 | 74.2 | 96.9 |
| 1990 | 83.6 | 93.5 | 74.3 | 96.7 |
| 1991 | 83.5 | 93.1 | 74.4 | 96.1 |
| 1992 | 82.3 | 91.2 | 73.2 | 95.5 |
| 1993 | 82.1 | 90.8 | 73.5 | 95.6 |
| 1994 | 81.9 | 90.5 | 72.8 | 94.6 |
| 1995 | 80.3 | 90 | 73.5 | 94.6 |
| 1996 | 81 | 89.7 | 74.5 | 94.6 |
| 1997 | 81.5 | 90 | 75.1 | 94.8 |
| 1998 | 82.1 | 90.2 | 75.9 | 95.3 |
| 1999 | 83.1 | 90 | 76.3 | 95.5 |
| 2000 | 82.4 | 90.6 | 76.8 | 95.6 |
| 2001 | 82.7 | 90.4 | 77.9 | 95.5 |
| 2002 | 83.3 | 90.3 | 79.3 | 95.4 |
| 2003 | 85.3 | 91.2 | 79 | 95.3 |
| 2004 | 85.4 | 90.4 | 79.1 | 95.5 |
| 2005 | 84.6 | 90.2 | 79.7 | 95.6 |
| 2006 | 84.7 | 90.3 | 78.7 | 95.8 |
| 2007 | 85.1 | 89.2 | 80.1 | 94.7 |
| 2008 | 85.1 | 90 | 79.1 | 95.2 |
| 2009 | 85.5 | 89.6 | 79.2 | 94.4 |
| 2010 | 85.4 | 88.6 | 79.6 | 94.9 |
| 2011 | 85.2 | 89.5 | 79.6 | 94.7 |
| 2012 | 84.8 | 89.5 | 79.8 | 94.9 |
| 2013 | 85.5 | 89.9 | 80.1 | 95.1 |
| 2014 | 85.1 | 89.5 | 78.5 | 94.5 |
| 2015 | 84.3 | 89 | 78.8 | 95.1 |
| 2016 | 83.7 | 89.5 | 78.8 | 94.8 |
| 2017 | 85.5 | 90.2 | 78.7 | 94.5 |
| 2018 | 86 | 89.5 | 78.4 | 94.4 |
| 2019 | 86.6 | 90.1 | 79.4 | 94.7 |
| 2020 | 84.8 | 89.3 | 78.4 | 94.1 |
| 2021 | 87.7 | 91.8 | 80.9 | 95.3 |
| 2022 | 88.8 | 92.2 | 81.7 | 95.8 |
| Family Age Composition | Labour Force Participation Gap (Percentage Points) |
|---|---|
| Total Core-age | 7.9 |
| Without children less than 18 years | 3.4 |
| Youngest child less than 18 years | 14.1 |
| Youngest child 0 to 5 years | 17.5 |
| Youngest child 6 to 12 years | 12.1 |
| Youngest child 13 to 17 years | 10.1 |
| Year | Average Hourly Gender Wage Ratio (Per Cent) |
|---|---|
| 1997 | 0.82 |
| 1998 | 0.82 |
| 1999 | 0.81 |
| 2000 | 0.8 |
| 2001 | 0.8 |
| 2002 | 0.81 |
| 2003 | 0.82 |
| 2004 | 0.82 |
| 2005 | 0.83 |
| 2006 | 0.84 |
| 2007 | 0.83 |
| 2008 | 0.83 |
| 2009 | 0.85 |
| 2010 | 0.85 |
| 2011 | 0.87 |
| 2012 | 0.87 |
| 2013 | 0.87 |
| 2014 | 0.87 |
| 2015 | 0.87 |
| 2016 | 0.87 |
| 2017 | 0.86 |
| 2018 | 0.88 |
| 2019 | 0.88 |
| 2020 | 0.87 |
| 2021 | 0.88 |
| 2022 | 0.87 |
| Age Group | 2022 Average Hourly Gender Wage Ratio (Per Cent) |
|---|---|
| 15 years and over | 0.87 |
| 15 to 24 years | 0.95 |
| 25 to 54 years | 0.87 |
| 55 years and over | 0.83 |
| Year | Proportion of Employment by Educational Attainment (Per Cent) | |||||
|---|---|---|---|---|---|---|
| Men | Women | |||||
| High School or below | Post Secondary Certificate or Diploma | University Degree | High School or below | Post Secondary Certificate or Diploma | University Degree | |
| 1990 | 59.5 | 23.3 | 17.1 | 60.1 | 24.8 | 15.0 |
| 1991 | 57.5 | 23.5 | 18.8 | 58.9 | 25.4 | 15.5 |
| 1992 | 56.8 | 24.1 | 19.0 | 57.4 | 25.5 | 16.9 |
| 1993 | 55.4 | 24.1 | 20.4 | 55.4 | 26.7 | 17.7 |
| 1994 | 53.7 | 25.5 | 20.7 | 52.3 | 28.2 | 19.4 |
| 1995 | 52.5 | 27.0 | 20.4 | 51.8 | 28.5 | 19.5 |
| 1996 | 51.9 | 27.5 | 20.5 | 50.6 | 29.8 | 19.4 |
| 1997 | 49.4 | 29.7 | 20.8 | 48.3 | 31.7 | 19.9 |
| 1998 | 49.0 | 30.1 | 20.8 | 48.1 | 31.6 | 20.1 |
| 1999 | 48.6 | 30.1 | 21.2 | 47.6 | 31.3 | 21.0 |
| 2000 | 48.5 | 29.3 | 22.0 | 47.5 | 30.5 | 21.9 |
| 2001 | 46.8 | 30.6 | 22.4 | 45.8 | 31.9 | 22.1 |
| 2002 | 46.3 | 30.6 | 23.0 | 45.2 | 32.0 | 22.7 |
| 2003 | 45.0 | 31.2 | 23.6 | 44.7 | 32.0 | 23.2 |
| 2004 | 45.4 | 30.9 | 23.5 | 43.8 | 32.2 | 23.9 |
| 2005 | 43.5 | 32.2 | 24.1 | 41.4 | 33.4 | 25.0 |
| 2006 | 42.8 | 31.6 | 25.5 | 39.9 | 33.9 | 26.0 |
| 2007 | 41.3 | 32.6 | 25.9 | 38.7 | 34.5 | 26.6 |
| 2008 | 41.4 | 31.8 | 26.7 | 37.8 | 34.6 | 27.5 |
| 2009 | 40.2 | 32.3 | 27.3 | 36.5 | 34.8 | 28.5 |
| 2010 | 40.0 | 32.2 | 27.7 | 35.6 | 34.5 | 29.7 |
| 2011 | 39.2 | 32.7 | 28.0 | 35.1 | 34.3 | 30.5 |
| 2012 | 39.1 | 32.2 | 28.5 | 33.6 | 35.0 | 31.2 |
| 2013 | 39.0 | 32.0 | 28.8 | 32.9 | 34.4 | 32.6 |
| 2014 | 38.8 | 32.4 | 28.6 | 33.7 | 33.7 | 32.4 |
| 2015 | 36.7 | 33.2 | 30.0 | 31.5 | 34.3 | 34.1 |
| 2016 | 36.2 | 32.0 | 31.6 | 30.3 | 34.0 | 35.5 |
| 2017 | 37.4 | 31.5 | 30.9 | 30.3 | 33.2 | 36.3 |
| 2018 | 36.4 | 31.5 | 32.0 | 29.3 | 33.8 | 36.7 |
| 2019 | 34.7 | 32.2 | 33.0 | 28.1 | 33.1 | 38.6 |
| 2020 | 33.7 | 31.1 | 35.0 | 26.8 | 32.1 | 41.0 |
| 2021 | 32.4 | 31.7 | 35.8 | 25.8 | 31.7 | 42.3 |
| 2022 | 32.2 | 31.7 | 35.9 | 25.2 | 32.7 | 42.0 |
| Field of Study | Proportion in Field of Study (Per Cent) | |
|---|---|---|
| Men | Women | |
| Architecture, engineering and related technologies | 78.6 | 21.0 |
| Mathematics, computer and information sciences | 66.4 | 33.1 |
| Business, management and public administration | 47.6 | 51.9 |
| Other | 47.4 | 52.2 |
| Personal, protective and transportation services | 46.6 | 52.9 |
| Total, field of study | 44.4 | 55.0 |
| Agriculture, natural resources and conservation | 44.3 | 55.1 |
| Visual and performing arts, and communications technologies | 40.2 | 59.1 |
| Humanities | 38.4 | 60.8 |
| Physical and life sciences and technologies | 37.0 | 62.2 |
| Social and behavioural sciences and law | 26.8 | 72.4 |
| Education | 21.7 | 76.2 |
| Health and related fields | 23.0 | 76.5 |
| Year | Proportion of Men and Women in Management Positions (Per Cent) | |||
|---|---|---|---|---|
| Senior Management | Middle Management | |||
| Women | Men | Women | Men | |
| 1987 | 21.3 | 78.6 | 31.3 | 68.6 |
| 1988 | 19.1 | 80.8 | 32.7 | 67.2 |
| 1989 | 20.1 | 79.8 | 34.4 | 65.5 |
| 1990 | 24.6 | 75.3 | 34.9 | 65.0 |
| 1991 | 24 | 76 | 33.7 | 66.2 |
| 1992 | 31.6 | 68.3 | 34.7 | 65.2 |
| 1993 | 22.3 | 77.6 | 36.0 | 63.9 |
| 1994 | 29.2 | 70.7 | 35.7 | 64.2 |
| 1995 | 26.0 | 73.9 | 35.7 | 64.2 |
| 1996 | 29.2 | 70.7 | 38.0 | 61.9 |
| 1997 | 24.3 | 75.6 | 36.7 | 63.2 |
| 1998 | 25.6 | 74.3 | 38.4 | 61.5 |
| 1999 | 29.0 | 70.9 | 35.3 | 64.6 |
| 2000 | 20.3 | 79.6 | 35.7 | 64.2 |
| 2001 | 24.5 | 75.4 | 35.1 | 64.8 |
| 2002 | 26.0 | 73.9 | 34.5 | 65.4 |
| 2003 | 24.4 | 75.5 | 36.3 | 63.6 |
| 2004 | 19.6 | 80.3 | 37.2 | 62.7 |
| 2005 | 26.1 | 73.8 | 36.3 | 63.6 |
| 2006 | 30.1 | 69.8 | 37.0 | 62.9 |
| 2007 | 25.6 | 74.4 | 38.0 | 61.9 |
| 2008 | 33.3 | 66.6 | 36.2 | 63.7 |
| 2009 | 35.3 | 64.6 | 37.2 | 62.7 |
| 2010 | 31.4 | 68.5 | 37.1 | 62.8 |
| 2011 | 27.0 | 72.9 | 38.3 | 61.6 |
| 2012 | 25.5 | 74.4 | 37.2 | 62.7 |
| 2013 | 29.8 | 70.1 | 35.3 | 64.6 |
| 2014 | 32.0 | 67.9 | 35.2 | 64.7 |
| 2015 | 26.4 | 73.5 | 36.9 | 63.0 |
| 2016 | 35.0 | 64.9 | 35.3 | 64.6 |
| 2017 | 25.8 | 74.1 | 36.2 | 63.7 |
| 2018 | 32.6 | 67.3 | 35.7 | 64.2 |
| 2019 | 28.9 | 71.0 | 36.4 | 63.5 |
| 2020 | 22.9 | 77.0 | 36.8 | 63.1 |
| 2021 | 28.1 | 71.8 | 37.2 | 62.7 |
| 2022 | 37.2 | 62.7 | 35.8 | 64.1 |
| Average Percentage of Employees in Senior Management (2023 Q1) | ||
|---|---|---|
| Women | Men | |
| Government agencies | 32.1 | 67.9 |
| Private sector businesses | 35.7 | 64.3 |
| Non-profit organizations | 55.1 | 44.9 |
| Age group | Part-time Workers as a Share of Total Employment (Per Cent) | |
|---|---|---|
| Men | Women | |
| 15 years and over | 12.1 | 23.5 |
| 15 to 24 years | 39.7 | 55.5 |
| 25 to 54 years | 5.5 | 15.2 |
| 55 years and over | 15.2 | 28.1 |
| Years since childbirth | Median Earnings ($) | |
|---|---|---|
| 2003 Cohort | 2014 Cohort | |
| t – 1 | 50,400 | 54,400 |
| t | 30,400 | 35,100 |
| t + 1 | 23,800 | 27,800 |
| t + 2 | 49,400 | 56,900 |
| t + 3 | 47,500 | 54,900 |
| t + 4 | 51,500 | 59,500 |
| t + 5 | 55,200 | 64,400 |
| Earnings Growth Over Five Year Period (Per Cent) | ||
|---|---|---|
| 2003 cohort | 2014 cohort | |
| Mothers | 10 | 18 |
| Non-mothers | 22 | 24 |
| Years since childbirth | Earnings Gap between Mothers and Non-Mothers (Per Cent) | |
|---|---|---|
| Cohort 2003 | Cohort 2014 | |
| t – 5 | 28 | 37 |
| t – 4 | 29 | 36 |
| t – 3 | 25 | 30 |
| t – 2 | 21 | 21 |
| t – 1 | 28 | 31 |
| t | -25 | -18 |
| t + 1 | -44 | -38 |
| t + 2 | 15 | 25 |
| t + 3 | 5 | 14 |
| t + 4 | 11 | 19 |
| t + 5 | 15 | 25 |
| Year | Participation Rate of Mothers with Youngest Child less than 18 (Per Cent) | |
|---|---|---|
| Quebec | Ontario | |
| 1976 | 36.3 | 50.5 |
| 1977 | 39.9 | 52 |
| 1978 | 42.3 | 55.3 |
| 1979 | 43.7 | 57.1 |
| 1980 | 46.2 | 59.5 |
| 1981 | 49.6 | 62.4 |
| 1982 | 49.3 | 63.3 |
| 1983 | 51.6 | 64.8 |
| 1984 | 53.7 | 66.3 |
| 1985 | 57.4 | 67.3 |
| 1986 | 60 | 69.6 |
| 1987 | 61.6 | 70.3 |
| 1988 | 63 | 72.7 |
| 1989 | 65.7 | 74.2 |
| 1990 | 67.8 | 74.3 |
| 1991 | 68.1 | 74.4 |
| 1992 | 68.3 | 73.2 |
| 1993 | 68.6 | 73.5 |
| 1994 | 69 | 72.8 |
| 1995 | 70.1 | 73.5 |
| 1996 | 70.4 | 74.5 |
| 1997 | 72 | 75.1 |
| 1998 | 72.7 | 75.9 |
| 1999 | 74.1 | 76.3 |
| 2000 | 75.5 | 76.8 |
| 2001 | 76.9 | 77.9 |
| 2002 | 79.4 | 79.3 |
| 2003 | 79.8 | 79 |
| 2004 | 80.6 | 79.1 |
| 2005 | 81.1 | 79.7 |
| 2006 | 81 | 78.7 |
| 2007 | 82.3 | 80.1 |
| 2008 | 82.4 | 79.1 |
| 2009 | 82.5 | 79.2 |
| 2010 | 83.1 | 79.6 |
| 2011 | 83.7 | 79.6 |
| 2012 | 83.9 | 79.8 |
| 2013 | 84.8 | 80.1 |
| 2014 | 83.8 | 78.5 |
| 2015 | 84.3 | 78.8 |
| 2016 | 84.7 | 78.8 |
| 2017 | 86.3 | 78.7 |
| 2018 | 85.4 | 78.4 |
| 2019 | 86.2 | 79.4 |
| 2020 | 85.4 | 78.4 |
| 2021 | 86.6 | 80.9 |
| 2022 | 87.6 | 81.7 |
| Year | Participation Rate of Mothers in Quebec (Per Cent) | Participation Rate of Mothers in Ontario (Per Cent) | ||
|---|---|---|---|---|
| With youngest child less than 18 years | Without children less than 18 years | With youngest child less than 18 years | Without children less than 18 years | |
| 1976 | 36.3 | 63.9 | 50.5 | 70.7 |
| 1977 | 39.9 | 64.6 | 52 | 70.9 |
| 1978 | 42.3 | 64.7 | 55.3 | 72.7 |
| 1979 | 43.7 | 66.9 | 57.1 | 74 |
| 1980 | 46.2 | 67.1 | 59.5 | 75.9 |
| 1981 | 49.6 | 69.4 | 62.4 | 75.7 |
| 1982 | 49.3 | 67.9 | 63.3 | 77.8 |
| 1983 | 51.6 | 68.6 | 64.8 | 78.6 |
| 1984 | 53.7 | 70.3 | 66.3 | 78.4 |
| 1985 | 57.4 | 71.7 | 67.3 | 80 |
| 1986 | 60 | 72.8 | 69.6 | 79.9 |
| 1987 | 61.6 | 72.9 | 70.3 | 81.7 |
| 1988 | 63 | 73.7 | 72.7 | 82.7 |
| 1989 | 65.7 | 73.3 | 74.2 | 83 |
| 1990 | 67.8 | 74.6 | 74.3 | 83.6 |
| 1991 | 68.1 | 76.6 | 74.4 | 83.5 |
| 1992 | 68.3 | 74.6 | 73.2 | 82.3 |
| 1993 | 68.6 | 75.2 | 73.5 | 82.1 |
| 1994 | 69 | 73.7 | 72.8 | 81.9 |
| 1995 | 70.1 | 75.7 | 73.5 | 80.3 |
| 1996 | 70.4 | 75.7 | 74.5 | 81 |
| 1997 | 72 | 76.6 | 75.1 | 81.5 |
| 1998 | 72.7 | 77.2 | 75.9 | 82.1 |
| 1999 | 74.1 | 78 | 76.3 | 83.1 |
| 2000 | 75.5 | 78.2 | 76.8 | 82.4 |
| 2001 | 76.9 | 79.7 | 77.9 | 82.7 |
| 2002 | 79.4 | 81.1 | 79.3 | 83.3 |
| 2003 | 79.8 | 82.8 | 79 | 85.3 |
| 2004 | 80.6 | 82.1 | 79.1 | 85.4 |
| 2005 | 81.1 | 82.7 | 79.7 | 84.6 |
| 2006 | 81 | 82.4 | 78.7 | 84.7 |
| 2007 | 82.3 | 83.7 | 80.1 | 85.1 |
| 2008 | 82.4 | 83.5 | 79.1 | 85.1 |
| 2009 | 82.5 | 84.9 | 79.2 | 85.5 |
| 2010 | 83.1 | 85.1 | 79.6 | 85.4 |
| 2011 | 83.7 | 84.9 | 79.6 | 85.2 |
| 2012 | 83.9 | 85.7 | 79.8 | 84.8 |
| 2013 | 84.8 | 86.3 | 80.1 | 85.5 |
| 2014 | 83.8 | 85.6 | 78.5 | 85.1 |
| 2015 | 84.3 | 87.2 | 78.8 | 84.3 |
| 2016 | 84.7 | 87.3 | 78.8 | 83.7 |
| 2017 | 86.3 | 87.9 | 78.7 | 85.5 |
| 2018 | 85.4 | 89.4 | 78.4 | 86 |
| 2019 | 86.2 | 89.1 | 79.4 | 86.6 |
| 2020 | 85.4 | 88.3 | 78.4 | 84.8 |
| 2021 | 86.6 | 89.7 | 80.9 | 87.7 |
| 2022 | 87.6 | 90.2 | 81.7 | 88.8 |
| Years since childbirth | Employment Rate (Per Cent) | |||||
|---|---|---|---|---|---|---|
| Cohort 2003 | Cohort 2014 | |||||
| Ontario | Quebec | Rest of Canada | Ontario | Quebec | Rest of Canada | |
| t + 1 | 89.2 | 89.9 | 88.8 | 90.6 | 91.7 | 89.8 |
| t + 2 | 89 | 91.6 | 88.4 | 91.1 | 94.2 | 89.7 |
| t + 3 | 86.9 | 89.7 | 86 | 89.6 | 92.7 | 88.1 |
| t + 4 | 85.4 | 89.3 | 84.6 | 88.7 | 92.7 | 87.1 |
| t + 5 | 84.7 | 88.2 | 83.9 | 88.2 | 91.9 | 86.6 |
| Family age composition | Participation Rate (Per Cent) | |
|---|---|---|
| 2021 | 2022 | |
| Without children less than 18 years | 87.7 | 88.8 |
| Youngest child less than 18 years | 80.9 | 81.7 |
| Youngest child 0 to 5 years | 76.5 | 78.9 |
| Youngest child 6 to 12 years | 82.6 | 82.9 |
| Youngest child 13 to 17 years | 86.6 | 85.4 |
| Year | Impact on Participation Rate of Core Age Women (Per Cent) |
|---|---|
| 2022 | 84 |
| 2027 | 86.4 |
| Years Since Childbirth | Earnings Change of Mothers Relative to t-1 (Percentage Change) | |||||
|---|---|---|---|---|---|---|
| 2003 cohort | 2014 cohort | |||||
| Ontario | Quebec | Rest of Canada | Ontario | Quebec | Rest of Canada | |
| t | -40 | -38 | -41 | -35 | -39 | -38 |
| t + 1 | -53 | -56 | -57 | -49 | -54 | -55 |
| t + 2 | -2 | -5 | -8 | 5 | 1 | -2 |
| t + 3 | -6 | -5 | -9 | 1 | 2 | -7 |
| t + 4 | 2 | 4 | -1 | 9 | 13 | 1 |
| t + 5 | 10 | 12 | 6 | 18 | 23 | 10 |
| Years Since Childbirth | Gap in Earnings Between Mothers and Non-Mothers (Per Cent) | |
|---|---|---|
| Cohort 2003 | Cohort 2014 | |
| t – 5 | 26 | 27 |
| t – 4 | 27 | 25 |
| t – 3 | 24 | 18 |
| t – 2 | 20 | 8 |
| t – 1 | 30 | 17 |
| t | -21 | -32 |
| t + 1 | -47 | -50 |
| t + 2 | 13 | 8 |
| t + 3 | 8 | 5 |
| t + 4 | 12 | 11 |
| t + 5 | 17 | 16 |
Footnotes
[1] Statistics Canada did update the 2021 census to include a self-reported question on gender, the first country to do so. See: https://www150.statcan.gc.ca/n1/daily-quotidien/220427/dq220427b-eng.htm
[2] In this report, non-mother refers to a woman who does not have children under 18 years old in the household.
[3] Several factors could explain this decline, including the shift in the labour market away from the manufacturing sector and towards services, declining male educational attainment, delayed family formation and population aging.
[4] See The Rise of the Dual Earner Family with Children Report, 2016, Statistics Canada for more details.
[5] See OECD report: Women with low levels of education face a double disadvantage in the labour market.
[6] Statistics Canada. Table 14-10-0128-01 Reason for not looking for work.
[7] The average hourly wage is commonly used to calculate the gender wage gap, measuring only compensation related to paid employment. This measure excludes self employment income related to the underground economy and other sources of compensation such as overtime pay, bonuses, pension plans, stock options and medical and dental benefits. See Statistics Canada, Measuring and Analyzing the Gender Pay Gap: A Conceptual and Methodological Overview.
[8] The gender wage ratio is calculated as female average earnings as a proportion of male average earnings for full-time and part-time employees 15 years and older.
[9] See Statistics Canada, The gender wage gap in Canada: 1998 to 2018 Report, 2019.
[11] See National Bureau of Economic Research, The Dynamics of Gender Earnings Differentials: Evidence from Establishment Data.
[12] See: Moyser, Melissa (2017), “Women and Paid Work”. Statistics Canada.
[13] For details see Statistics Canada, Which Bachelor's Degree Programs Were Associated with the Highest Pay Prior to the COVID-19 Pandemic? A Focus on Very Detailed Fields of Study for details.
[14] This includes government business entities, publicly traded corporations and private enterprises.
[15] At the assistant professor rank in 2021-22, men and women accounted for roughly half of the full-time positions. At the associate professor rank, women held 44 per cent of full-time positions while men held 56 per cent. See Statistics Canada Table: 37-10-0144-01.
[16] See McKinsey & Company Women in the Workplace 2022.
[17] See The Prosperity Project 2023 Annual Report Card on Gender Diversity and Leadership.
[18] See Klevnin et al (2019). Zhang (2009), Zhang (2010).
[19] RBC, Family Matters: the cost of having children on women's careers,
[20] These are custom data sets from Statistics Canada and the approach follows Zhang (2010). See Appendix for more details.
[21] Standard parental leave offers a benefit of 55 per cent of earnings while extended parental benefits offer a benefit rate of 33 per cent. See Government of Canada Employment Insurance Benefits.
[22] See RBC, Family Matters: the cost of having children on women's careers.
[23] Waldfogel (1998) found the earnings gap to be as large as 20 per cent for British and American mothers and non-mothers, Ejrnaes and Kunze (2004) found a 10 to 20 per cent wage drop for German mothers. Zhang (2009) finds Canadian evidence of a 12 per cent average earnings gap between mothers and non-mothers, increasing with the number of children. Additionally, Zhang (2010) shows an earnings gap of 5 to 10 per cent from the second to the ninth year following childbirth.
[24] The median earnings of mothers ages 30-39 are higher than those of non-mothers prior to the birth year. This is similar to the results in Zhang (2010), who showed that the average earnings of mothers was higher than those of non-mothers for the 1991 cohort (see figure 1). While there are differences in the cohorts examined and the specific measures of earnings (median versus average) between the studies, the FAO’s sample focuses on older mothers, who may be more established in their careers than younger mothers and have accumulate relatively greater amounts of human capital.
[25] See RBC, Family Matters: the cost of having children on women's careers and Zhang (2010).
[26]Ibid.
[27] See FAO's Ministry of Education report.
[28] See Canada-Ontario early years and child care agreement.
[29] See FAO's Ministry of Education report.
[30] These targets are expressed relative to the end of 2021. However, when expressed relative to the start of 2019 these targets become 42,000 increase in spaces by the end of 2023 and 86,000 increase in spaces by the end of 2026.
[31] See Ontario's Early Years and Child Care Annual Report, 2022.
[32] See Federal Budget 2022.
[33] See FAO's Ministry of Education report.
[34] According to Statistics Canada’s Survey on Early Learning and Child Care Arrangements, 48 per cent of Ontario families with young children listed affordability as a difficulty in their search for child care, while 17 per cent do not use child care due to high costs. See Survey on Early Learning and Child Care Arrangements,2022.
[35] See FAO's Child Care in Ontario report.
[36] See Statistics Canada’s Survey on Early Learning and Child Care Arrangements,2022.
[37] Ibid.
[38] See Budget 2021 for more details.
[39] For details see Statistics Canada, Fertility rates and labour force participation among women in Quebec and Ontario for details.
[40] The post-childbirth employment rate is calculated by aggregating the total number of mothers reporting positive income in a given post-childbirth year on their T4 tax returns and expressing it as proportion of mothers that gave birth in that year.
[41] See Choi (2023) for more details.
[42] See Baker, Gruber and Milligan (2015), Universal Child Care, Maternal Labour Supply and Family well-being and Fortin et al. (2012), Impact of Quebec’s universal low-fee child care program on female labour force participation, domestic income and government budgets.
[43] Ibid.
[44] See Zhang (2009) and Correll et al (2007).
[45] See Choi (2023) for discussion of this potential impact.
[46] See Ministry of Education Report: Canada-Wide Early Learning and Child Care Guidelines.
[47] See FAO's Ontario Public Sector Employment and Compensation Report
[48] See Roadmap to Universal Child care in Ontario.
[49] See Early Years and Child Care Workforce Project.
[50] Baker and Milligan (2008) find evidence that the extension of parental leave in Canada from six months to one year in 2001 increased mother’s time away from the workforce. Choi (2023) in a Statistics Canada report shows that following the implementation of the extension in parental benefits system in 2017, the percentage of mothers that stayed away from the labour market for more than 12 months increased from 17.5 per cent to 28.8 per cent between 2009 and 2019.