


Summary
This Budget Outlook Update provides the FAO’s projection of the Ontario government’s fiscal position over the 2021-22 to 2023-24 period. The report compares the FAO’s outlook to the government’s plan presented in the 2021 Economic Outlook and Fiscal Review (or Fall Economic Statement) for the budget balance, key debt measures, revenues and program spending. The FAO’s revenue and program spending projections are based on current and announced government policies. The Appendix presents a comparison of the FAO’s economic outlook with the Fall Economic Statement (FES).
The FAO will provide a detailed assessment of Ontario’s economic and fiscal prospects when it releases the Long-Term Budget Outlook in early March 2022.
Budget deficit expected to be smaller compared to the government plan
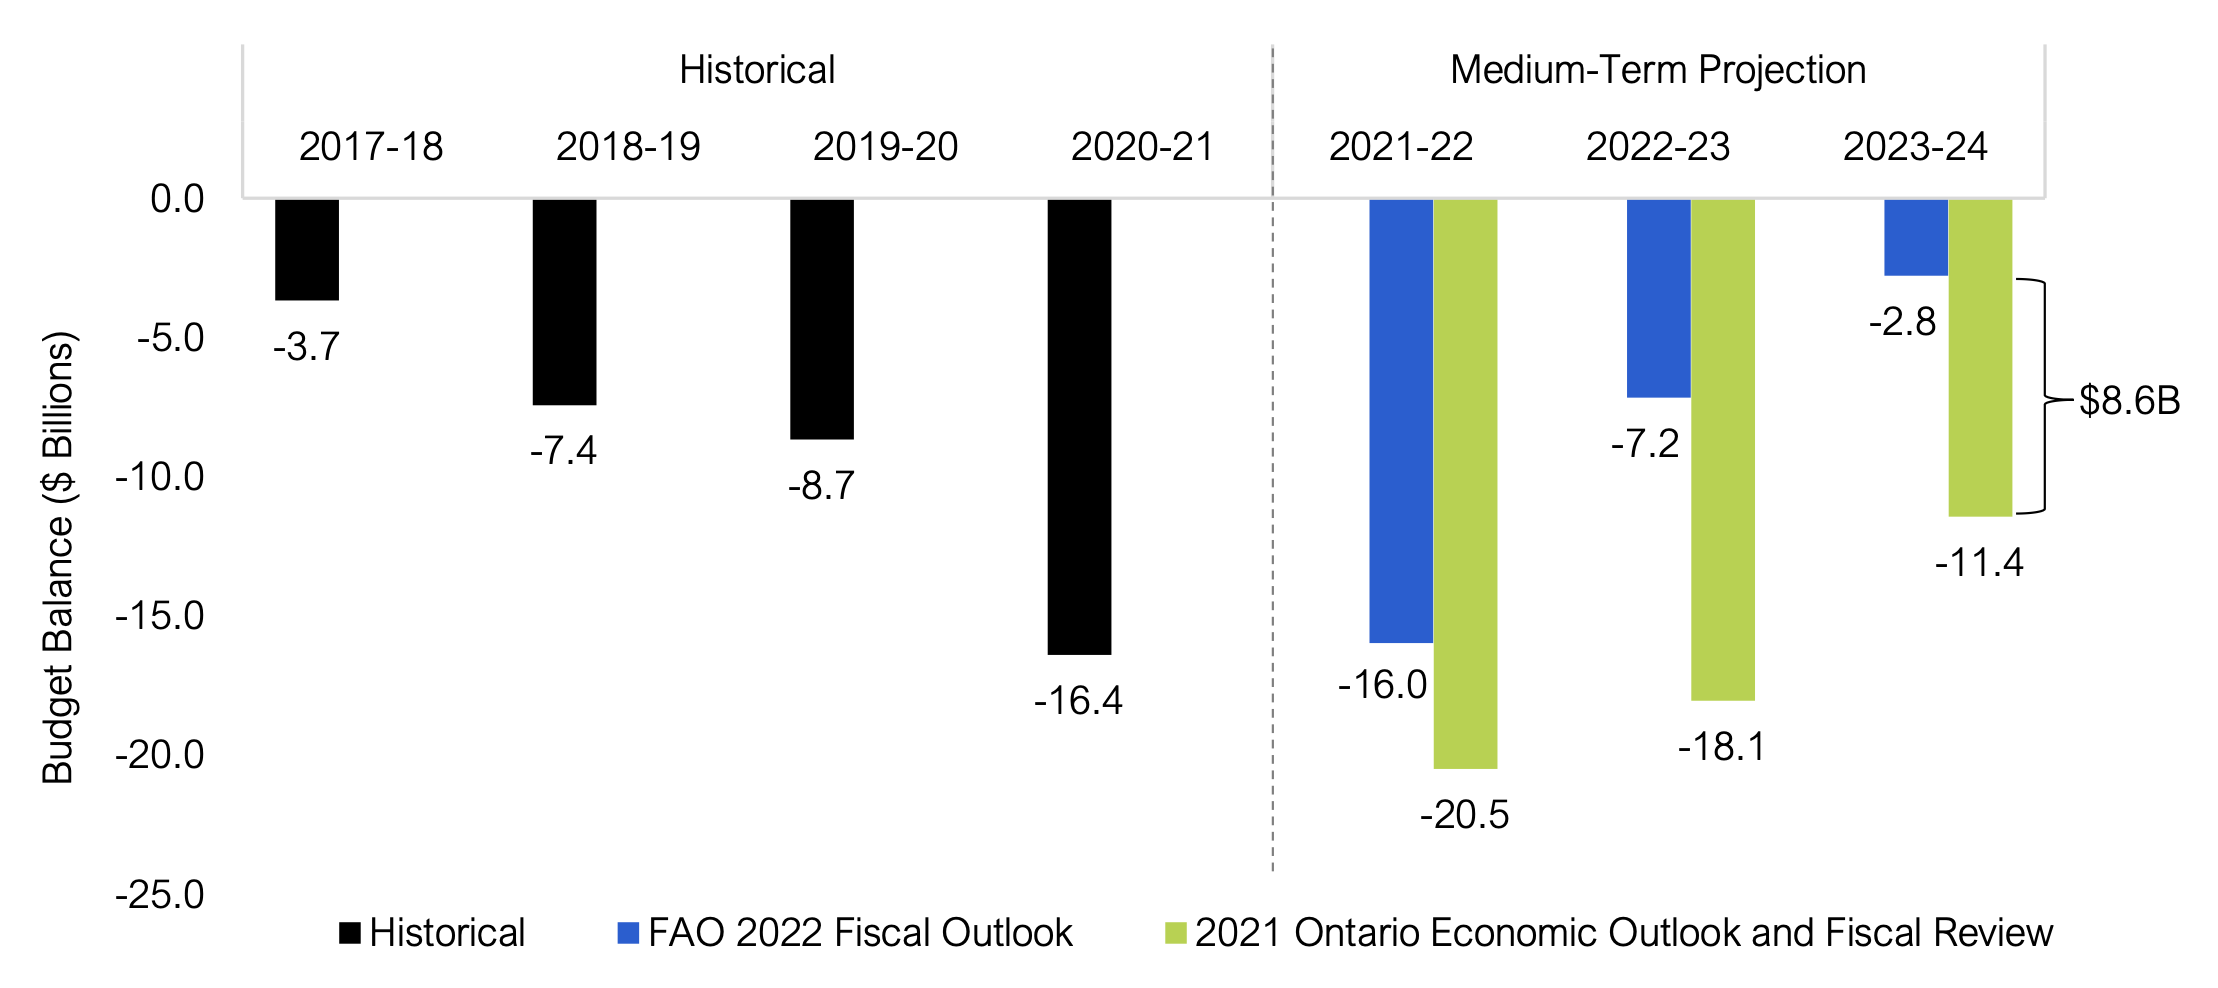
The FAO projects smaller deficits than the FES outlook largely due to stronger revenue growth. For 2021-22, the FAO expects a $16.0 billion budget deficit, lower than the government outlook for a $20.5 billion deficit.[1] By 2023-24, the FAO projects the deficit will decline to $2.8 billion, compared to the FES outlook of $11.4 billion.
However, if the government makes future announcements such as new tax cuts, spending initiatives or a combination of both, the FAO’s deficit projection would deteriorate.
Lower net debt-to-GDP ratio
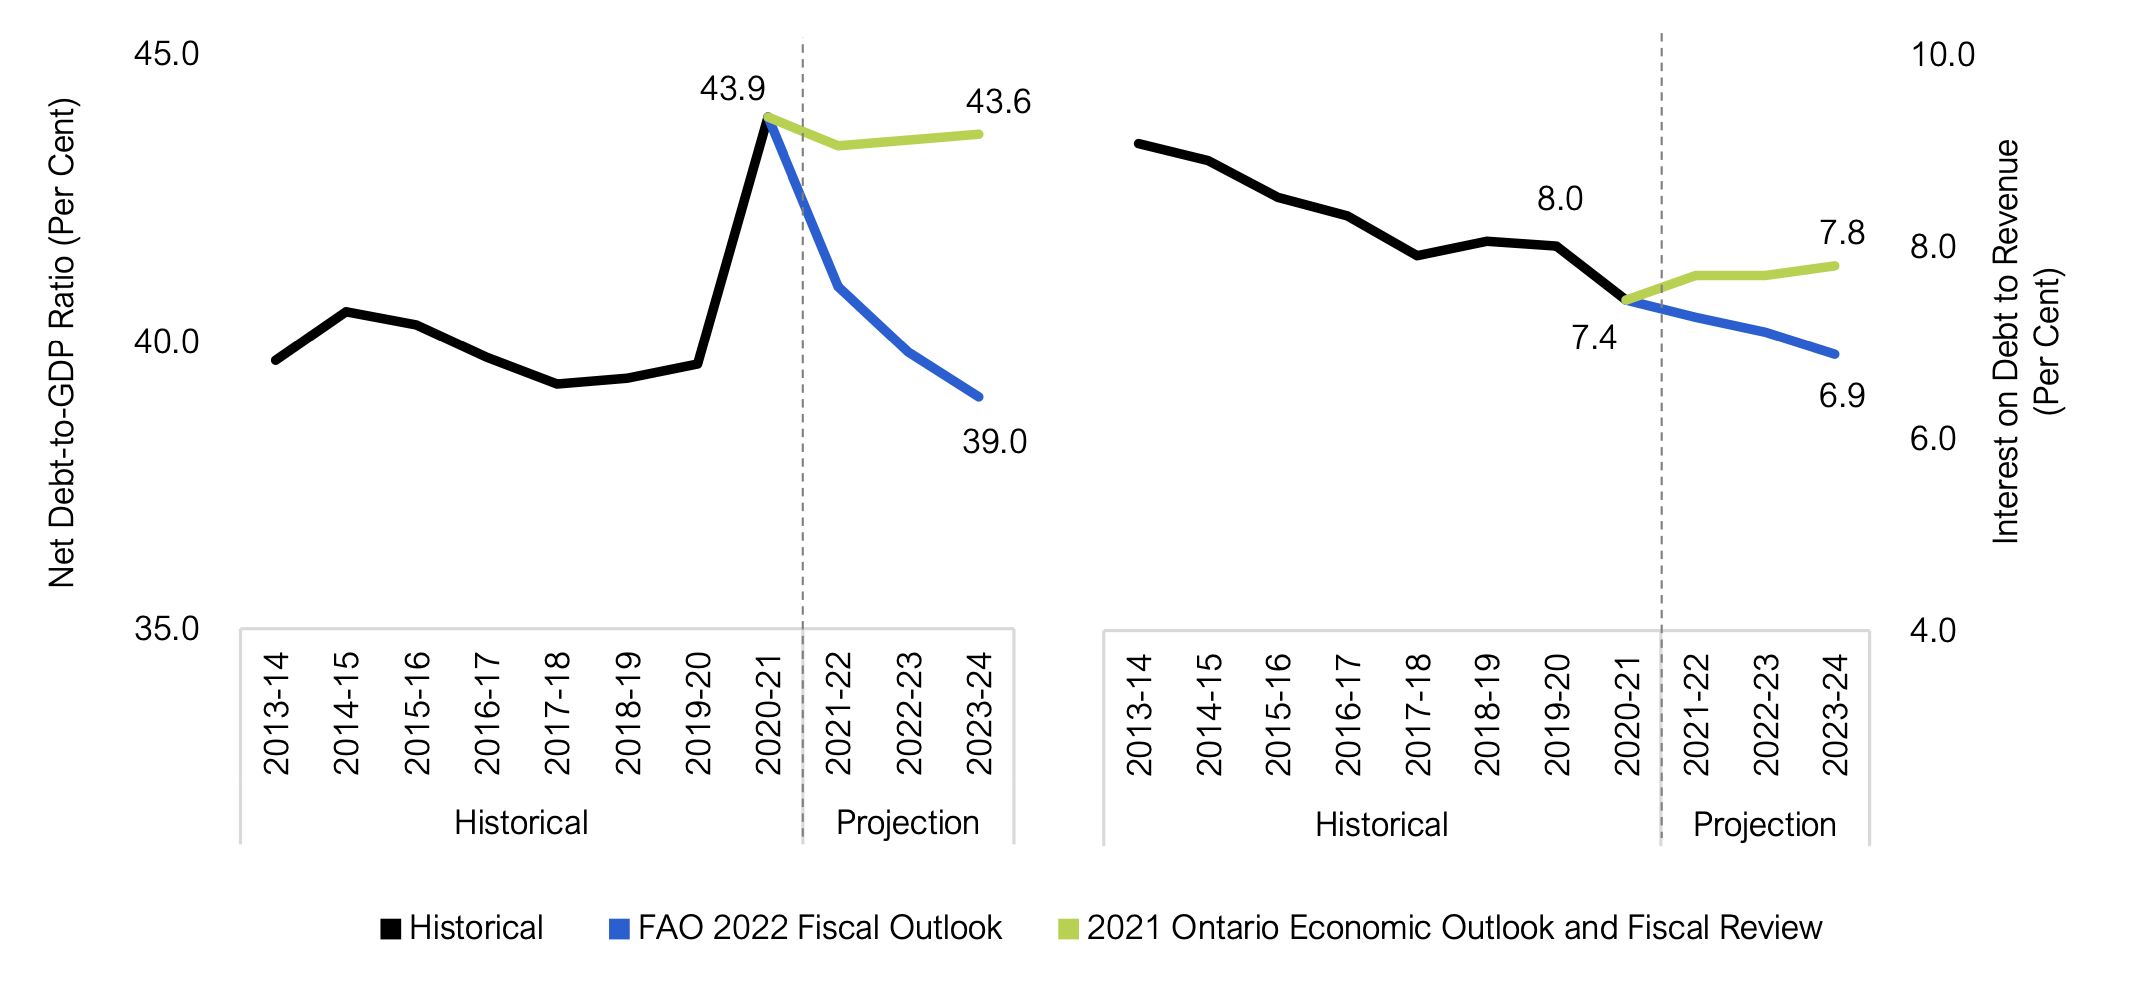
Smaller deficits combined with robust economic growth over the projection lower the net debt-to-GDP ratio modestly below pre-pandemic levels. By 2023-24, the FAO projects Ontario’s net debt-to-GDP ratio will reach 39.0 per cent, lower than the government’s outlook of 43.6 per cent. Interest on debt as a share of revenue is projected to decline to 6.9 per cent, below its pre-pandemic level of 8.0 per cent.
Revenues projected to be higher than the government outlook
The FES projects slower revenue growth over the 2021-22 to 2023-24 period compared to the FAO, reflecting weaker expected economic growth, extra prudence, and potential unannounced tax cuts which are not included in the FAO’s projection. By 2023-24, the FAO expects total revenues to be $7.6 billion higher than the government’s projection.
Government spending plan includes significant unallocated funds, while most sectors face funding shortfalls
Based on a review of the government’s existing programs and announced new program commitments to date, the FAO projects a $6.3 billion combined funding shortfall by 2023-24. By sector, shortfalls are expected in health ($4.5 billion), education ($0.4 billion), postsecondary education ($0.2 billion), children’s and social services ($0.8 billion) and justice ($0.4 billion). At the same time, the government’s spending plan includes significant unallocated funds that the Province will need to decide how to use. For example, the unallocated funds could be used to address the funding shortfall, create new programs, enhance existing programs, and / or lower the budget deficit.[2]
Budget and Debt Outlook
The FAO expects lower budget deficits compared to the government’s projection
- Ontario recorded a budget deficit of $16.4 billion in 2020-21, significantly less than the $38.5 billion shortfall expected in the 2021 Budget.[3] This dramatic improvement reflected the unprecedented support from the federal government through direct COVID-19 transfer payments to the province, as well as income initiatives for workers and businesses that propped up provincial revenue.[4]
- The FAO expects that Ontario’s deficits will improve over the medium term as the province recovers from the COVID-19 pandemic and the economy rebounds strongly. The FAO projects that under current policies, Ontario’s deficit would decline from $16.0 billion in 2021-22 to $2.8 billion by 2023-24.
- In contrast, the government’s deficit forecast improves much slower than the FAO’s outlook. By 2023-24, the FAO expects the deficit to be $8.6 billon smaller than the government’s deficit projection of $11.4 billion. This difference results from the FAO’s significantly higher revenue outlook combined with a lower projection for interest on debt expense.
Figure 1 FAO’s deficit projection $8.6 billion lower than government’s by 2023-24
The Budget Balance is presented without the reserve.
Source: 2021 Ontario Economic Outlook and Fiscal Review and FAO.
Accessible version
| Budget Balance ($ Billions) | |||
| Year | Historical | FAO 2022 Fiscal Outlook | 2021 Ontario Economic Outlook and Fiscal Review |
| 2017-18 | -3.7 | ||
| 2018-19 | -7.4 | ||
| 2019-20 | -8.7 | ||
| 2020-21 | -16.4 | ||
| 2021-22 | -16.0 | -20.5 | |
| 2022-23 | -7.2 | -18.1 | |
| 2023-24 | -2.8 | -11.4 | |
- The FAO’s deficit projection is based on current government revenue and program spending policies, the estimated impact of the Omicron wave of the COVID-19 pandemic, and new program announcements made since the release of the FES up to January 20, 2022. If the government announces new tax cuts or spending initiatives in the future, the FAO’s deficit projections would deteriorate.
Lower deficits will improve Ontario’s fiscal sustainability indicators
- Given the FAO’s outlook for declining budget deficits, Ontario’s fiscal indicators are expected to improve over the projection after sharp deteriorations in 2020-21 caused by the pandemic. The province’s net debt-to-GDP ratio is expected to decline to 39.0 per cent by 2023-24, below the 43.9 per cent recorded in 2020-21 and modestly lower than pre-pandemic rates.
- Similarly, debt interest payments as a share of revenue are projected to decline from 7.4 per cent in 2020-21 to 6.9 per cent by 2023-24, well below the pre-pandemic (2019-20) share of 8.0 percent.
Figure 2 FAO projects an improvement in Ontario’s fiscal sustainability indicators
Source: 2021 Ontario Economic Outlook and Fiscal Review and FAO.
Accessible version
| Net Debt-to-GDP Ratio (Per Cent) | Interest on Debt to Revenue (Per Cent) | |||||
| Year | Historical | FAO 2022 Fiscal Outlook | 2021 Ontario Economic Outlook and Fiscal Review | Historical | FAO 2022 Fiscal Outlook | 2021 Ontario Economic Outlook and Fiscal Review |
| 2013-14 | 39.7 | 9.1 | ||||
| 2014-15 | 40.5 | 8.9 | ||||
| 2015-16 | 40.3 | 8.5 | ||||
| 2016-17 | 39.7 | 8.3 | ||||
| 2017-18 | 39.3 | 7.9 | ||||
| 2018-19 | 39.4 | 8.1 | ||||
| 2019-20 | 39.6 | 8.0 | ||||
| 2020-21 | 43.9 | 7.4 | ||||
| 2021-22 | 41.0 | 43.4 | 7.3 | 7.7 | ||
| 2022-23 | 39.8 | 43.5 | 7.1 | 7.7 | ||
| 2023-24 | 39.0 | 43.6 | 6.9 | 7.8 | ||
Revenue Outlook
The FAO projects higher revenues compared to the government’s Fall Economic Statement
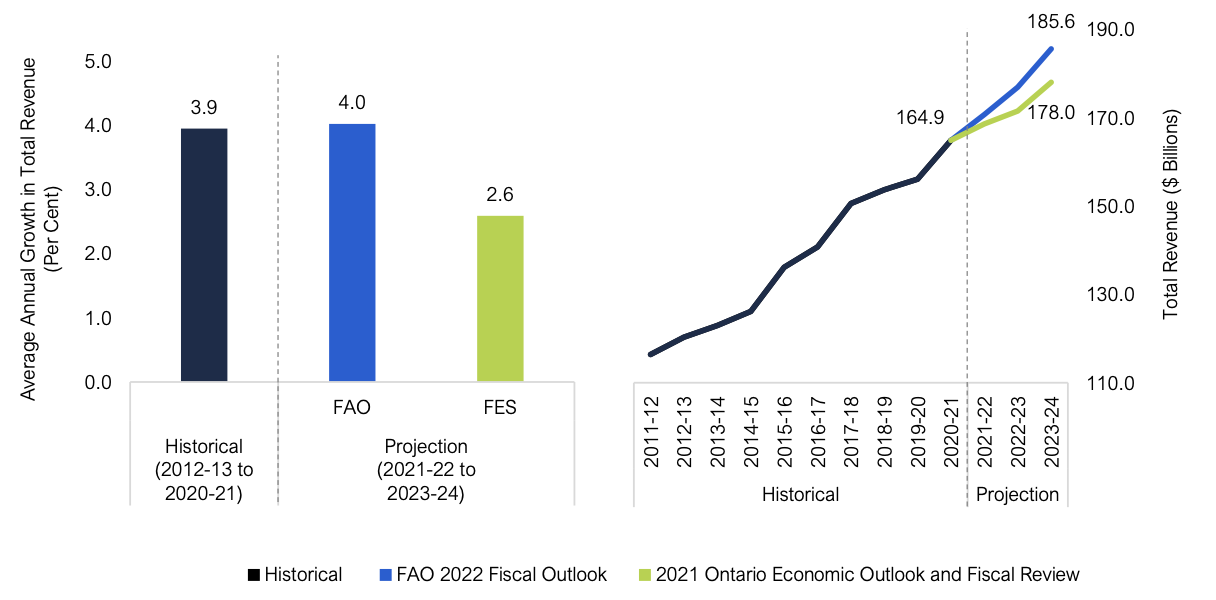
- The FAO projects average annual revenue growth of 4.0 per cent over the 2021-22 to 2023-24 period, consistent with its economic outlook and similar to historical experience since 2012-13. In contrast, the FES expects annual revenue growth of 2.6 per cent over the same period, 1.4 percentage points lower than the FAO’s outlook.
- By 2023-24, the FAO projects $185.6 billion in total revenue, $7.6 billion higher than the government’s projection of $178.0 billion in the FES.
Figure 3 The FAO’s revenue projection is $7.6 billion higher than the government’s by 2023-24
Source: 2021 Ontario Economic Outlook and Fiscal Review and FAO.
Accessible version
| Average Annual Growth in Total Revenue (Per Cent) | |||
| Period | Historical | FAO 2022 Fiscal Outlook | 2021 Ontario Economic Outlook and Fiscal Review |
| Historical (2012-23 to 2020-21) | 3.9 | ||
| Projection (2021-22 to 2023-24) | 4.0 | 2.6 | |
Fall Economic Statement’s lower revenue outlook could reflect unannounced tax cuts
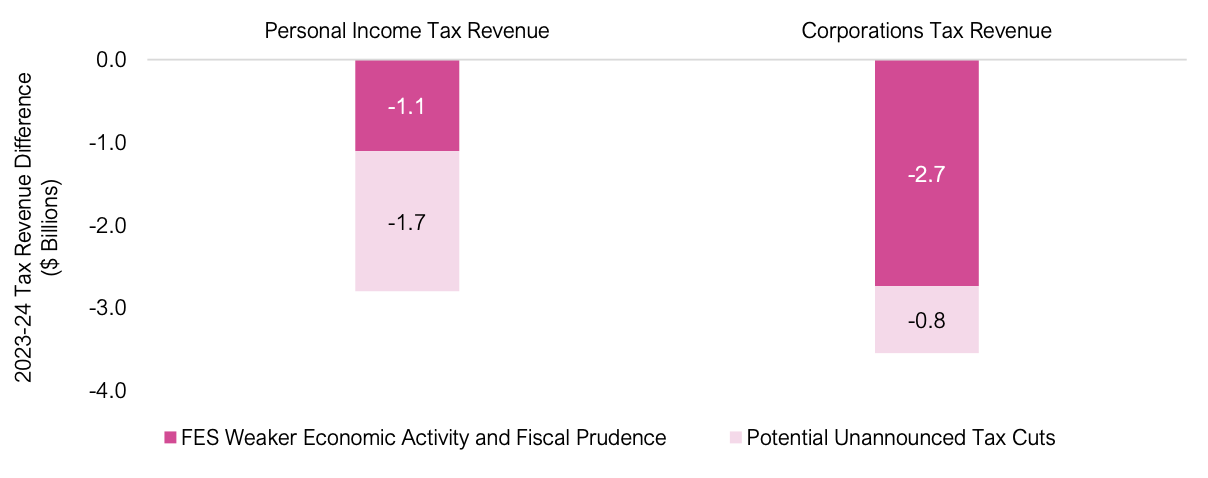
- The FAO’s tax revenue projection is higher than the FES over the entire outlook, with the difference growing to $7.7 billion by 2023-24. Gaps in personal income tax and corporations tax revenues make up $6.4 billion of this difference in 2023-24.[5]
- Personal income tax revenues in the FES are expected to be $2.8 billion lower than the FAO’s projection in 2023-24. About $1.1 billion of the difference can be explained by the government’s weaker labour income projection. The remaining $1.7 billion difference remains unexplained but could be potential unannounced personal income tax cuts incorporated in the government’s fiscal plan.
- Corporations tax revenues in the FES are expected to be $3.6 billion lower compared to the FAO’s projection in 2023-24. The FAO estimates that $2.7 billion of this difference might be attributed to the use of significant fiscal prudence and the government’s weaker corporate income projection in 2023 and 2024. The remaining difference of $0.8 billion may indicate that unannounced corporations tax cuts are included in the government’s fiscal plan.
Figure 4 Unannounced tax cuts could explain the difference between the FAO and the Fall Economic Statement’s tax revenue projections
Source: 2021 Ontario Economic Outlook and Fiscal Review and FAO.
Accessible version
| 2023-24 Tax Revenue Difference ($ Billions) | ||
| Personal Income Tax Revenue | Corporations Tax Revenue | |
| FES Weaker Economic Activity and Fiscal Prudence | -1.1 | -2.7 |
| Potential Unannounced Tax Cuts | -1.7 | -0.8 |
Program Spending Outlook
- Over the three-year outlook, the FAO projects[6] that program spending will increase by an average annual rate of 1.3 per cent. The relatively slow growth rate in program spending is due to the expectation that time-limited COVID-19-related spending will be largely completed by the end of 2022-23.[7]
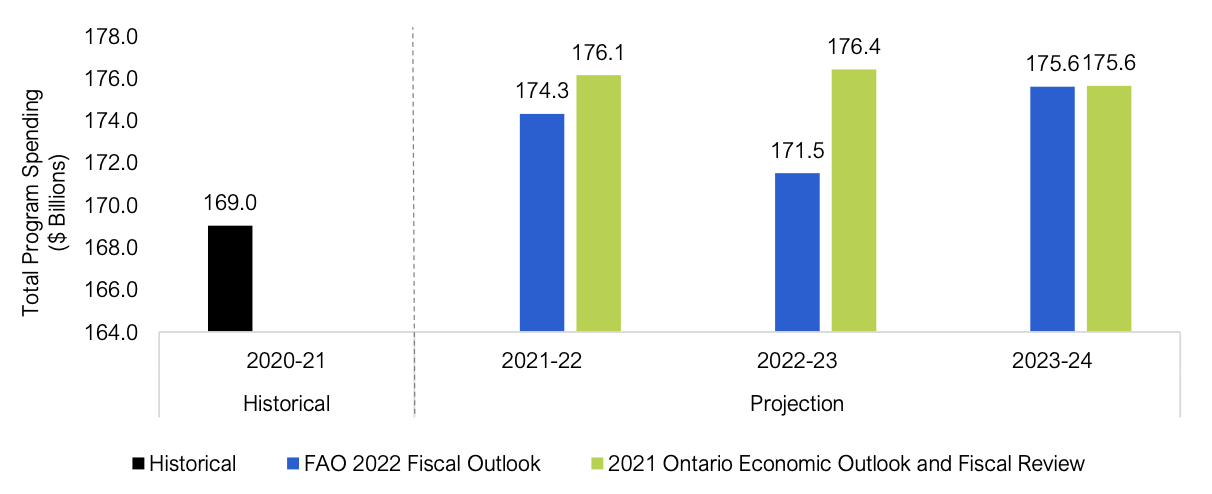
- The FAO projects total program spending of $174.3 billion this year, dropping to $171.5 billion in 2022-23, and then rising to $175.6 billion in 2023-24. The decline in program spending from 2021-22 to 2022-23 reflects the projected year-over-year decline in COVID-19-related spending.[8]
FAO’s program spending projection lower than the government’s in 2021-22 and 2022-23
- The FAO’s program spending projection is lower than the government’s spending plan in the 2021 Fall Economic Statement, with a gap of $1.8 billion in 2021-22 and $4.9 billion in 2022-23, narrowing to a difference of only $39 million in 2023-24.
Figure 5 FAO’s program spending projection is lower than the government’s in 2021-22 and 2022-23
Source: FAO analysis of the 2021 Ontario Economic Outlook and Fiscal Review and information provided by the Ministry of Finance.
Accessible version
| Total Program Spending ($ Billions) | |||
| Year | Historical | FAO 2022 Fiscal Outlook | 2021 Ontario Economic Outlook and Fiscal Review |
| 2020-21 | 169.0 | ||
| 2021-22 | 174.3 | 176.1 | |
| 2022-23 | 171.5 | 176.4 | |
| 2023-24 | 175.6 | 175.6 | |
Government spending plan includes significant unallocated funds, while most sectors face funding shortfalls
- Although by 2023-24 the difference between the FAO’s and the Province’s projections for total program spending is only $39 million, there are significant differences among program sectors for all three years of the spending outlook.
| Sector | Spending Gap, Province vs. FAO | ||
|---|---|---|---|
| 2021-22 ($ millions) | 2022-23 ($ millions) | 2023-24 ($ millions) | |
| Health | -1,448 | -3,098 | -4,491 |
| Education | -243 | 112 | -429 |
| Postsecondary Education | -12 | -112 | -221 |
| Children’s and Social Services | 378 | -279 | -816 |
| Justice | -46 | -171 | -379 |
| Sum of shortfalls in 5 sectors | -1,372 | -3,547 | -6,336 |
| Other Programs | 3,205 | 8,450 | 6,375 |
| Total | 1,833 | 4,903 | 39 |
- The FAO projects a $6.3 billion funding shortfall in the five sectors by 2023-24. Overall, the largest funding shortfall occurs in the health sector, with the Province’s plan in the FES lower than the FAO’s projection by $1.4 billion in 2021-22, $3.1 billion in 2022-23 and $4.5 billion in 2023-24.
- In 2021-22, the health sector shortfall represents the impact of the Omicron wave of the COVID-19 pandemic,[9] which began after the November 4, 2021 release of the FES. To address the shortfall, the Province will need to transfer unallocated funds from the Time-Limited COVID-19 Fund or the Contingency Fund to the health sector.
- For 2022-23 and 2023-24, the shortfall largely represents the difference between the FAO’s projected cost of current government health sector programs and policies, compared to the amount allocated by the Province in its FES spending plan. To address the shortfall, the Province will need to: transfer unallocated funds to the health sector, increase the overall health sector spending plan in the upcoming 2022 Ontario Budget, and/or implement health sector program cuts or other savings measures.
- In contrast, in the ‘other programs’ sector,[10] the Province’s spending plan is significantly higher than the FAO’s projection in every year, by $3.2 billion in 2021-22, $8.5 billion in 2022-23 and $6.4 billion in 2023-24.
- The difference between the FAO’s ‘other programs’ projection and the Province’s spending plan in the FES is largely due to unallocated funds included in each year of the Province’s spending plan.
- As the Province cannot directly spend unallocated funds but instead must allocate them to programs, the FAO excludes unallocated funds from its program spending projection until the government decides how to use the funds. For example, the unallocated funds could be used to fund new programs, enhance existing programs, support sectors with projected funding shortfalls under current program policies, or lower the budget deficit.
Appendix
| (Per Cent Growth) | 2019a | 2020a | 2021f | 2022f | 2023f | 2024f |
|---|---|---|---|---|---|---|
| Nominal GDP | ||||||
| FAO – Fiscal Outlook Update | 3.7 | -2.8 | 11.8 | 6.9 | 4.5 | 3.7 |
| 2021 Ontario FES* | 3.7 | -2.8 | 9.0 | 6.6 | 4.6 | 4.1 |
| Labour Income | ||||||
| FAO – Fiscal Outlook Update | 4.4 | -0.3 | 9.6 | 5.0 | 4.1 | 3.7 |
| 2021 Ontario FES | 4.4 | -0.3 | 6.3 | 4.7 | 4.7 | 4.1 |
| Corporate Profits | ||||||
| FAO – Fiscal Outlook Update | -1.3 | 10.2 | 23.8 | 8.5 | 5.0 | 3.7 |
| 2021 Ontario FES | -1.3 | 10.2 | 30.6 | 9.1 | 1.5 | 3.3 |
| Household Consumption | ||||||
| FAO – Fiscal Outlook Update | 3.5 | -7.4 | 7.3 | 8.5 | 4.7 | 3.7 |
| 2021 Ontario FES | 3.5 | -7.4 | 6.2 | 7.6 | 4.8 | 4.3 |
| (Per Cent Growth) | 2019a | 2020a | 2021a | 2022f | 2023f | 2024f |
|---|---|---|---|---|---|---|
| Real GDP* | ||||||
| FAO – Fiscal Outlook Update | 2.0 | -5.1 | 4.5 | 4.2 | 2.5 | 1.9 |
| 2021 Ontario FES** | 2.0 | -5.1 | 4.3 | 4.5 | 2.6 | 2.0 |
| Employment | ||||||
| FAO – Fiscal Outlook Update | 2.8 | -4.8 | 4.9 | 4.3 | 1.1 | 0.9 |
| 2021 Ontario FES | 2.8 | -4.8 | 4.3 | 3.3 | 2.0 | 1.5 |
| Unemployment Rate (Per Cent) | ||||||
| FAO – Fiscal Outlook Update | 5.6 | 9.6 | 8.0 | 6.1 | 6.0 | 6.0 |
| 2021 Ontario FES | 5.6 | 9.6 | 8.2 | 6.6 | 6.2 | 6.1 |
| CPI Inflation (Per Cent) | ||||||
| FAO – Fiscal Outlook Update | 1.9 | 0.7 | 3.5 | 3.8 | 2.2 | 1.9 |
| 2021 Ontario FES | 1.9 | 0.7 | 3.1 | 2.6 | 2.1 | 1.9 |
| Three-month Treasury Bill Rate (Per Cent) | ||||||
| FAO – Fiscal Outlook Update | 1.7 | 0.4 | 0.1 | 1.0 | 1.7 | 2.1 |
| 2021 Ontario FES | 1.7 | 0.4 | 0.1 | 0.3 | 0.9 | 1.3 |
| 10-year Government Bond Rate (Per Cent) | ||||||
| FAO – Fiscal Outlook Update | 1.6 | 0.7 | 1.4 | 1.9 | 2.3 | 2.9 |
| 2021 Ontario FES | 1.6 | 0.7 | 1.3 | 1.8 | 2.2 | 2.5 |
| ($ Billions) | 2019-20a | 2020-21a | 2021-22f | 2022-23f | 2023-24f |
|---|---|---|---|---|---|
| Revenue | |||||
| Personal Income Tax | 37.7 | 40.3 | 42.4 | 44.6 | 46.8 |
| Sales Tax | 28.6 | 26.6 | 31.0 | 33.5 | 35.1 |
| Corporations Tax | 15.4 | 17.8 | 19.0 | 20.2 | 21.0 |
| All Other Taxes | 26.5 | 26.2 | 28.4 | 28.5 | 29.2 |
| Total Taxation Revenue | 108.3 | 110.9 | 120.8 | 126.8 | 132.1 |
| Transfers from Government of Canada | 25.4 | 33.9 | 28.7 | 27.1 | 28.7 |
| Income from Government Business Enterprise | 5.9 | 5.0 | 4.7 | 5.5 | 6.6 |
| Other Non-Tax Revenue | 16.5 | 15.1 | 16.5 | 17.5 | 18.2 |
| Total Revenue | 156.1 | 164.9 | 170.7 | 176.9 | 185.6 |
| Expense | |||||
| Health Sector | 63.7 | 69.5 | 76.5 | 74.9 | 77.7 |
| Health (Base) | 63.7 | 62.1 | 69.3 | 73.8 | 77.3 |
| Temporary COVID-19 Funds | 0.0 | 7.4 | 7.2 | 1.2 | 0.4 |
| Education Sector | 31.7 | 32.9 | 33.4 | 33.2 | 33.7 |
| Education* (Base) | 31.4 | 29.4 | 32.1 | 32.9 | 33.7 |
| Temporary COVID-19 Funds | 0.4 | 3.5 | 1.3 | 0.3 | 0.0 |
| Children’s and Social Services Sector | 17.1 | 17.4 | 17.5 | 18.2 | 18.9 |
| Children’s and Social Services (Base) | 17.1 | 16.9 | 17.1 | 18.2 | 18.9 |
| Temporary COVID-19 Funds | 0.0 | 0.5 | 0.4 | 0.0 | 0.0 |
| Postsecondary Education Sector | 10.5 | 9.8 | 10.7 | 11.1 | 11.4 |
| Postsecondary Education (Base) | 10.5 | 9.6 | 10.7 | 11.1 | 11.4 |
| Temporary COVID-19 Funds | 0.0 | 0.2 | 0.0 | 0.0 | 0.0 |
| Justice Sector | 4.7 | 4.8 | 4.9 | 5.0 | 5.2 |
| Justice (Base) | 4.7 | 4.8 | 4.9 | 5.0 | 5.2 |
| Temporary COVID-19 Funds | 0.0 | 0.1 | 0.0 | 0.0 | 0.0 |
| Other Programs | 24.5 | 34.6 | 31.3 | 29.0 | 28.8 |
| Other (Base) | 24.5 | 23.8 | 27.4 | 28.4 | 28.8 |
| Temporary COVID-19 Funds | 0.0 | 10.8 | 3.8 | 0.6 | 0.0 |
| Total Program Expense | 152.3 | 169.0 | 174.3 | 171.5 | 175.6 |
| Total Program Expense (Base) | 151.9 | 146.7 | 161.6 | 169.4 | 175.2 |
| Total Temporary COVID-19 Funds | 0.4 | 22.3 | 12.7 | 2.1 | 0.4 |
| Interest on Debt | 12.5 | 12.3 | 12.4 | 12.6 | 12.8 |
| Total Expense | 164.8 | 181.3 | 186.7 | 184.1 | 188.4 |
| Budget Balance** | -8.7 | -16.4 | -16.0 | -7.2 | -2.8 |
| ($ Billions) | 2019–20a | 2020–21a | 2021–22f | 2022–23f | 2023–24f |
|---|---|---|---|---|---|
| Budget Balance* | -8.7 | -16.4 | -16.0 | -7.2 | -2.8 |
| Accumulated Deficit | 225.8 | 239.3 | 255.3 | 262.4 | 265.2 |
| Net Debt | 353.3 | 373.6 | 396.9 | 412.6 | 422.9 |
| Net Debt-to-GDP (Per Cent) | 39.6 | 43.9 | 41.0 | 39.8 | 39.0 |
Footnotes
[1] The government’s budget balance in this report is shown before the reserve.
[2] The FAO excludes unallocated funds from its program spending projection until the government decides how to use these funds.
[3] See page 7 of the 2021 Ontario Budget.
[4] See the FAO’s Federal and Provincial COVID-19 Response Measures: 2021 Update.
[5] The remaining $1.3 billion is attributed to differences in sales tax and other tax revenue projections, largely explained by the FAO’s stronger economic projection.
[6] The FAO’s program spending forecast is based on the FAO’s projected cost of current government programs and policies, the impact on the health sector of the Omicron wave of the COVID-19 pandemic, and new program announcements made since the release of the FES up to January 20, 2022. Importantly, the FAO’s program spending forecast excludes unallocated funds included in the government’s program spending outlook in the FES, as unallocated funds represent unannounced or upcoming program decisions.
[7] In contrast, the FAO projects an average annual program spending growth rate of 3.6 per cent from 2019-20 to 2023-24 (which excludes the temporary impact of COVID-19-related spending). The FAO’s program spending forecast includes an estimated $0.4 billion of COVID-19-related spending in both 2019-20 and 2023-24.
[8] The FAO’s three-year spending projection includes an estimated $12.7 billion in COVID-19-related spending in 2021-22, $2.1 billion in 2022-23 and $0.4 billion in 2023-24. The government’s spending plan in the FES includes COVID-19-related spending of $10.7 billion in 2021-22, $3.4 billion in 2022-23 and none in 2023-24. The FAO’s COVID-19-related spending outlook reflects the estimated impact of the Omicron wave of the COVID-19 pandemic, and new COVID-19-related program announcements made since the release of the FES up to January 20, 2022. For information on COVID-19-related spending prior to the Omicron wave, see the FAO’s Federal and Provincial COVID-19 Response Measures: 2021 Update.
[9] For example, after accounting for the projected impact of the Omicron wave on hospitalizations, the FAO estimates that patients with COVID-19 will occupy a total of 431,000 hospital days in 2021-22, a 98.6 per cent increase compared to the 217,000 hospitals days occupied by COVID-19 patients in 2020-21.
[10] The ‘other programs’ sector includes the following ministries: Agriculture, Food and Rural Affairs; Economic Development, Job Creation and Trade; Energy, Northern Development and Mines; Environment, Conservation and Parks; Finance; Francophone Affairs; Government and Consumer Services; Heritage, Sport, Tourism and Culture Industries; Indigenous Affairs; Infrastructure; Labour, Training and Skills Development; Municipal Affairs and Housing; Natural Resources and Forestry; Seniors and Accessibility; Transportation; and Treasury Board Secretariat. The ‘other programs’ sector also includes the Executive Offices (Cabinet Office, Office of the Lieutenant Governor, and Office of the Premier) and the Legislative Offices. The FAO includes Ontario Teachers’ Pension Plan expense in the education sector.