


An Updated Assessment of the Impact of the COVID-19 Pandemic
1 | Summary
Largest decline in economic output on record
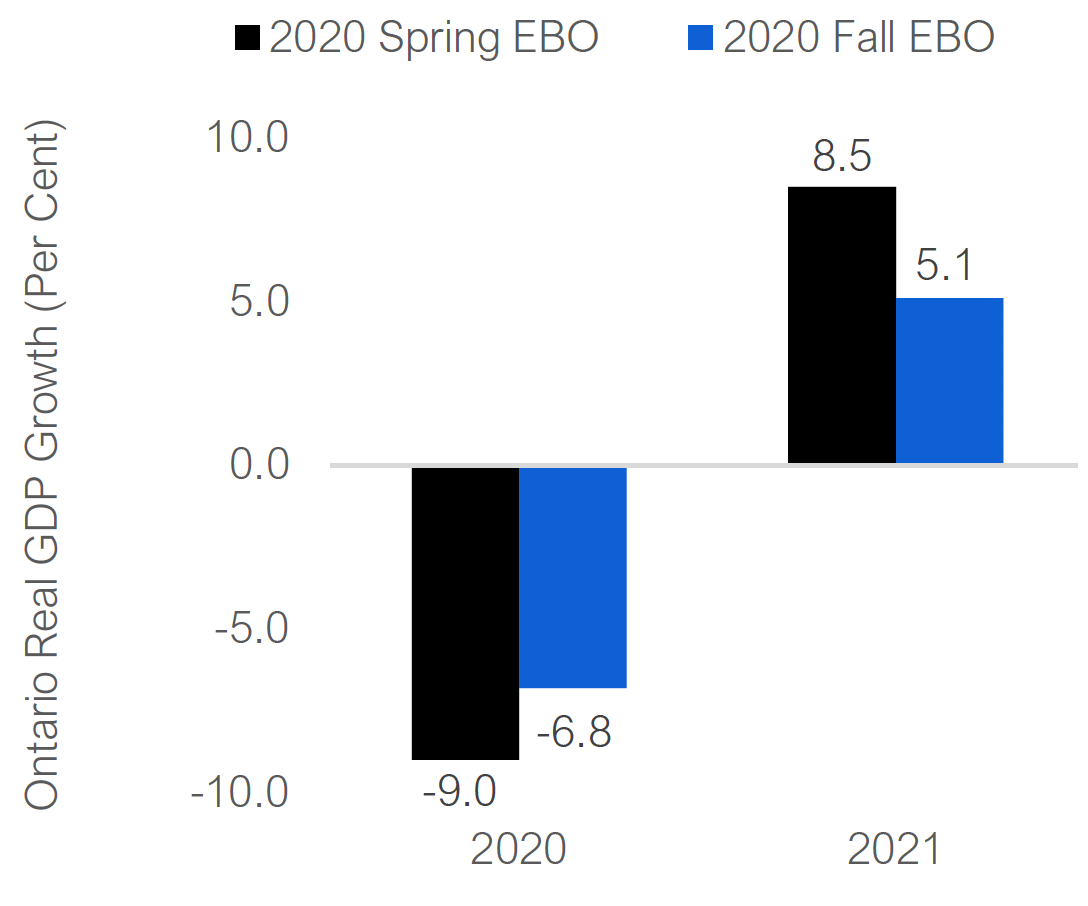
Figure 1-1 Less severe decline in Ontario real GDP projected for 2020
Source: FAO.
Accessible version
| Ontario Real GDP Growth (Per Cent) | 2020 | 2021 |
|---|---|---|
| 2020 Spring EBO | -9.0 | 8.5 |
| 2020 Fall EBO | -6.8 | 5.1 |
The COVID-19 pandemic and shutdowns have resulted in a historic negative shock to Ontario’s economy. However, initial measures to contain the pandemic in Ontario were relatively successful in limiting the spread of the virus through the summer, allowing for an earlier and broader reopening of the economy than the FAO initially anticipated.
The FAO’s updated outlook projects Ontario real GDP will decline by 6.8 per cent in 2020, an improvement from a 9.0 per cent decrease initially projected in the FAO’s spring outlook. Even so, this year’s downturn is expected to be the largest annual decline in economic output on record.[1] Assuming the pandemic remains relatively contained, Ontario’s economic growth is expected to rebound strongly in 2021, with real GDP rising by 5.1 per cent. However, if the recent rise in daily COVID-19 cases is sustained and prompts the reintroduction of significant pandemic containment measures in select regions or sectors, economic growth would be slower than projected in 2021.
Budget deficit of $37.2 billion projected in 2020-21
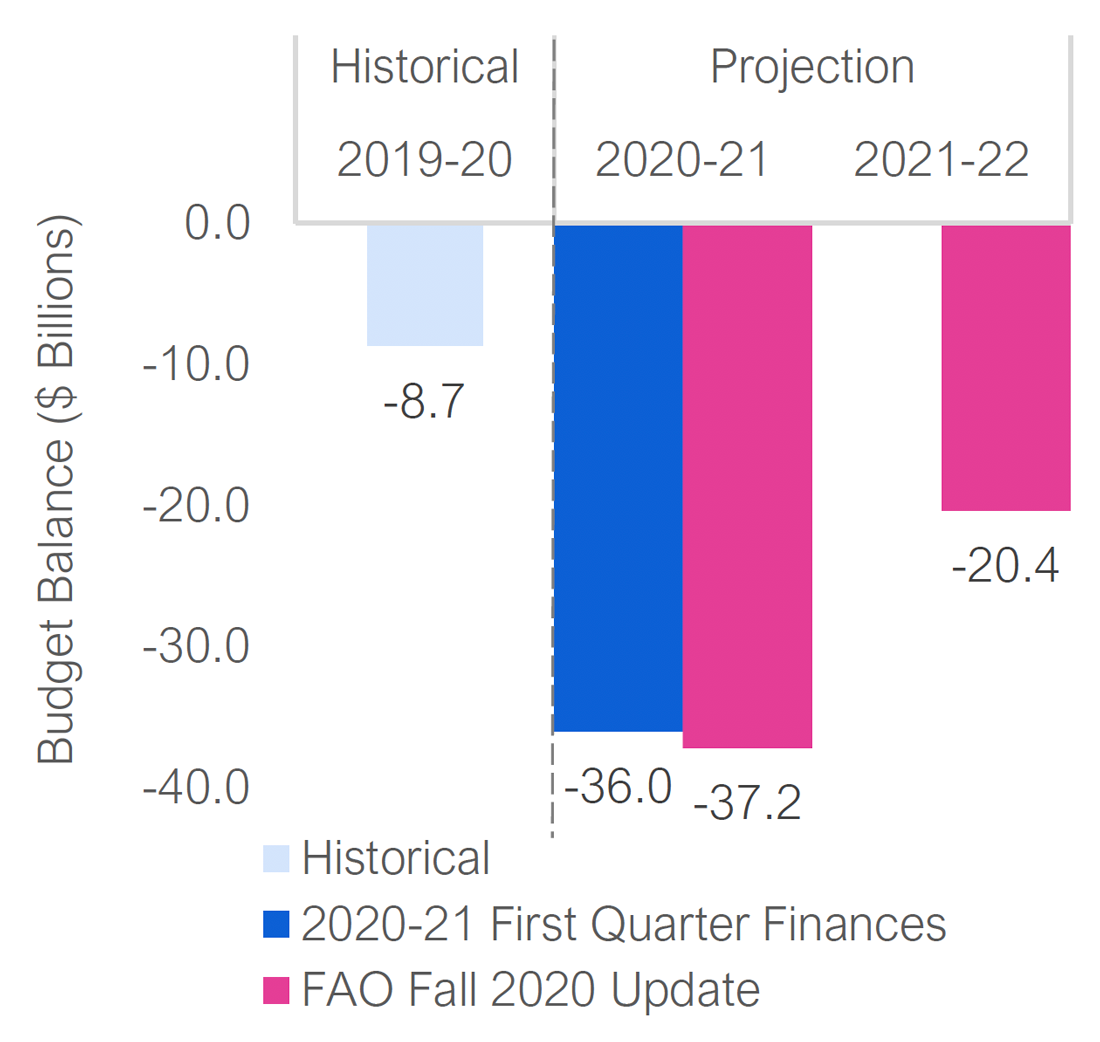
Figure 1-2 $37.2 billion deficit in 2020-21
Note: The budget balance is presented before reserve.
Source: Ontario Public Accounts, 2020-21 First Quarter Finances and FAO.
Accessible version
| Historical | Projection | ||
|---|---|---|---|
| Budget Balance ($ Billions) | 2019-20 | 2020-21 | 2021-22 |
| Historical | -8.7 | ||
| 2020 First Quarter Finances | -36.0 | ||
| 2020 Fall EBO | -37.2 | -20.4 | |
The FAO projects Ontario’s budget deficit will increase from $8.7 billion in 2019-20 to a record $37.2 billion in 2020-21 due to a sharp drop in revenue coupled with a strong increase in program spending. This is broadly consistent with the government’s updated deficit projection of $36.0 billion in the First Quarter Finances.[2]
Notably, a significant amount of the government’s 2020-21 program spending is currently unallocated to specific programs. While the fiscal year is not over and the path of the pandemic remains uncertain, any unused contingency funds would substantially reduce the reported 2020-21 budget deficit. As the province recovers from the COVID-19 pandemic and the economy rebounds, the FAO projects that the budget deficit will improve to $20.4 billion in 2021-22.
Ongoing deficits projected over medium term
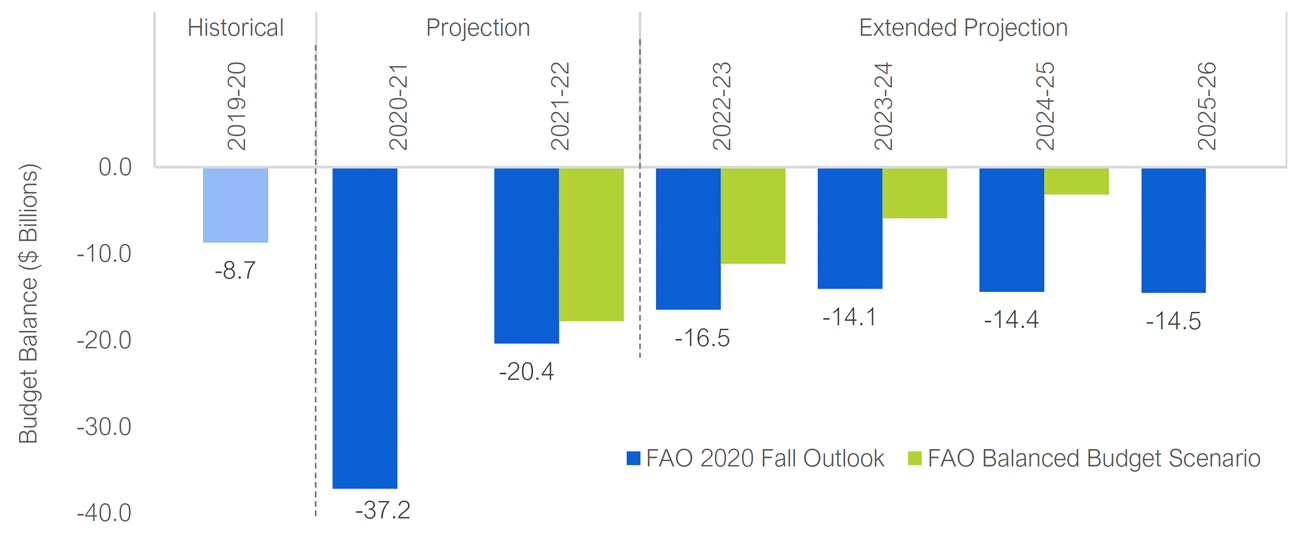
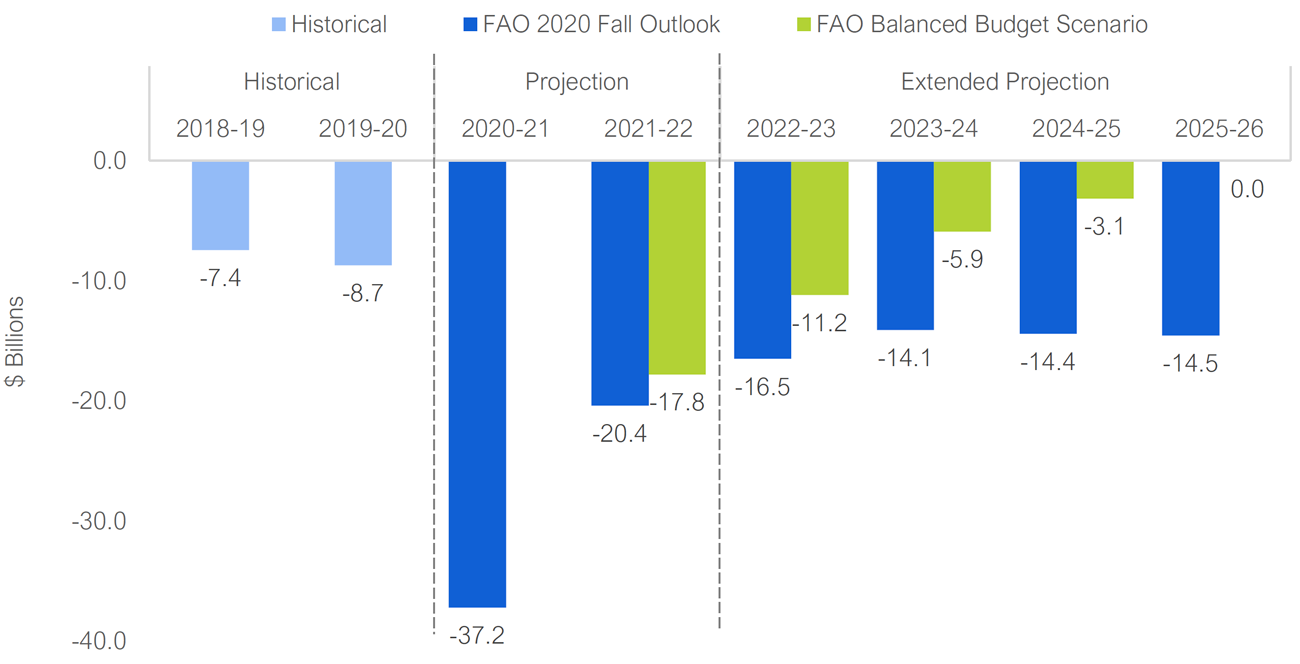
Figure 1-3 Roughly $14 billion is required to balance Ontario’s budget by 2025-26
Note: The FAO’s budget balance is presented before reserve.
Source: Ontario Public Accounts and FAO.
Accessible version
| Budget Balance | Historical | Projection | Extended Projection | ||||
|---|---|---|---|---|---|---|---|
| ($ Billions) | 2019-20 | 2020-21 | 2021-22 | 2022-23 | 2023-24 | 2024-25 | 2025-26 |
| Historical | -8.7 | ||||||
| FAO 2020 Fall Outlook | -37.2 | -20.4 | -16.5 | -14.1 | -14.4 | -14.5 | |
| FAO Balanced Budget Scenario | -17.8 | -11.2 | -5.9 | -3.1 | 0.0 | ||
Assuming the economic recovery continues to support strong revenue growth and that temporary COVID-19 spending measures are phased out, the FAO projects the deficit would continue to improve to $14 billion by 2023-24, but would not improve further in the absence of policy changes.
In Ontario, the Fiscal Sustainability, Transparency and Accountability Act, 2019 (FSTAA) requires that when the budget is in deficit, the Province must develop a fiscal recovery plan that specifies when and how the budget will be balanced.
Previously, the government committed to balance the budget by 2023-24 and to reduce the net debt-to-GDP ratio to under 40.8 per cent by 2022-23. However, with the onset of the COVID-19 pandemic and resulting economic downturn, the government will need to revise its fiscal targets.
FSTAA’s balanced budget requirement is a relatively rigid fiscal rule. If the government chose to balance the budget over the next five years, as in its previous recovery plan from the 2019 budget,[3] the FAO estimates that it would require roughly $14 billion in permanent revenue increases or spending cuts, or some combination of both.
Balancing the budget in five years would also have significant impacts on other key metrics that are important to prudent fiscal management. The province’s net debt-to-GDP ratio would fall from over 48 per cent in 2020-21 to about 44 per cent by 2025-26 – a 4 percentage point improvement over five years. The share of revenues required to service the Province’s debt, which is projected to decline in the absence of policy changes, would decline further if the budget was balanced in five years. Debt interest as a share of revenue would fall from 8.3 cents per dollar of revenue in 2020-21 to 6.5 cents by 2025-26 – the lowest share in over 50 years.
The FAO will release its next economic and budget outlook following the government’s November budget and will include an updated medium-term economic forecast as well as an assessment of the government’s fiscal recovery plan.
2 | Economic Outlook
Largest decline in economic output on record
The COVID-19 pandemic and shutdowns have resulted in a historic negative shock to Ontario’s economy. However, initial measures to contain the pandemic in Ontario were relatively successful in limiting the spread of the virus through the summer, allowing for an earlier and broader reopening of the economy than first anticipated. Faced with a potentially unprecedented economic crisis, the federal and provincial governments quickly introduced, and subsequently enhanced, a variety of programs designed to support household and business incomes during the crisis. As a result, economic activity began to rebound in May, with stronger than expected gains in employment, household spending and housing investment.
Compared to the FAO’s spring outlook,[4] the decline in economic activity in 2020 is now expected to be less severe. However, the pace of the recovery is expected to moderate through the fall and into next year as government supports begin to taper, some sectors continue to struggle because of restrictions, and significant uncertainty about the future path of the pandemic weighs on the broader economy.[5]
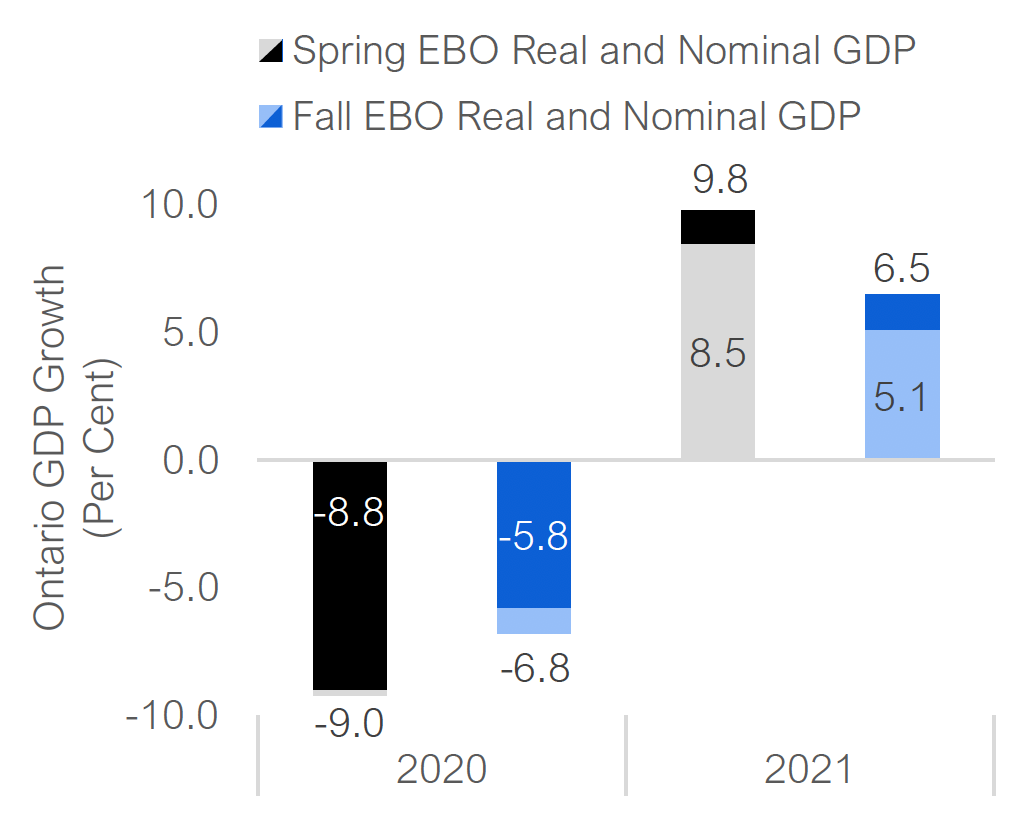
Figure 2-1 Decline in Ontario GDP in 2020 projected to be less severe than in spring outlook
Source: FAO.
Accessible version
| Ontario GDP Growth (Per Cent) | 2020 | 2021 | |
|---|---|---|---|
| FAO Spring EBO | Real GDP | -9.0 | 8.5 |
| Nominal GDP | -8.8 | 9.8 | |
| FAO Fall EBO | Real GDP | -6.8 | 5.1 |
| Nominal GDP | -5.8 | 6.5 |
The FAO’s updated outlook projects Ontario real GDP will decline by 6.8 per cent in 2020, an improvement from a 9.0 per cent decrease initially projected in the FAO’s spring outlook. Even so, this year’s downturn is expected to be the largest annual decline in economic output on record.[6]
Assuming the pandemic remains relatively contained, Ontario’s economic growth is expected to rebound strongly in 2021, with real GDP rising by 5.1 per cent, although slower than anticipated in the FAO’s spring projection. However, if the recent rise in daily COVID-19 cases is sustained and prompts the reintroduction of significant pandemic containment measures in select regions or sectors, economic growth would be slower than projected in 2021.
Ontario nominal GDP, which provides a broad measure of the tax base, is projected to decline by 5.8 per cent in 2020, reflecting lower labour income and a steep slump in corporate profits. Nominal GDP is expected to rebound in 2021, growing by 6.5 per cent.
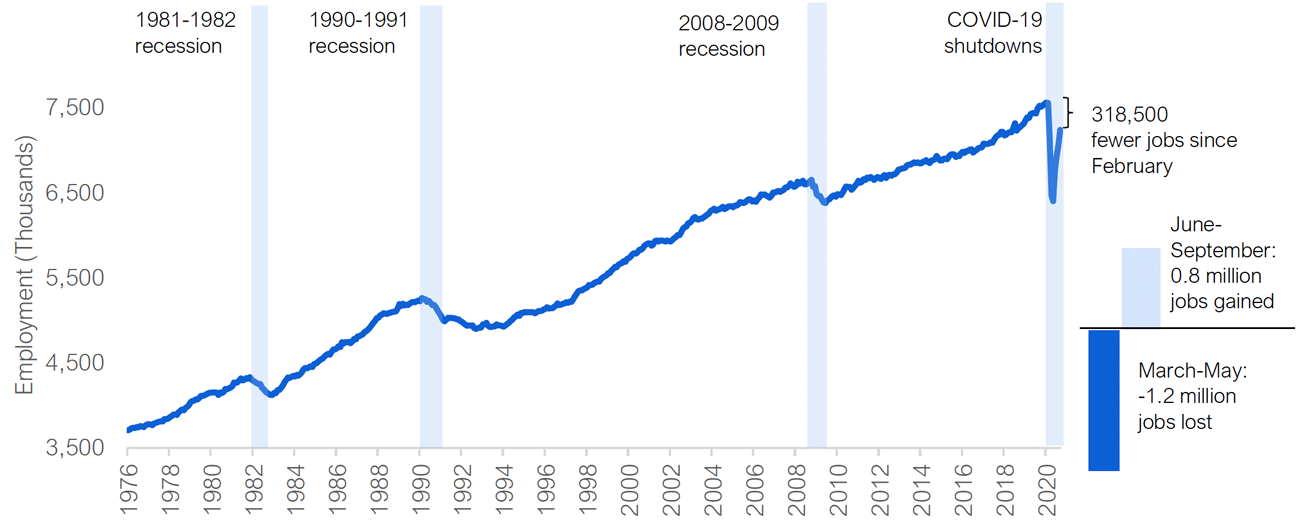
Job market recovery will slow
The impact of the pandemic shutdowns on Ontario’s labour market has been dramatic, with a record 1.2 million jobs lost from February to May, while the unemployment rate more than doubled to 13.6 per cent. Job losses were experienced across all age groups, sectors and regions.[7] As the economy reopened through the summer, employment has rebounded strongly, rising by 838,000 over the June to September period, recovering nearly three-quarters of the jobs lost during the height of the pandemic. Despite these recent gains, Ontario employment remains down by 318,500 jobs (or 4.2 per cent) in September compared to the pre-pandemic peak in February. The strong pace of monthly job gains during the early reopening phase is also expected to moderate, delaying a full employment recovery into 2021.
Figure 2‑2 Ontario’s employment still 318,500 jobs below pre-pandemic peak
Source: Statistics Canada and FAO.
Accessible version
| Thousands | |
|---|---|
| Pre-pandemic peak employment | 7,555.1 |
| February to May change in employment | -1,156.5 |
| May to September change in employment | 838.0 |
| Total change in employment since February | -318.5 |
The recovery in jobs in Ontario since May has been broadly spread across many groups and industries. However, those most affected by job loss during the pandemic continue to struggle. Employment of young workers (aged 15 to 24) remains 12.1 per cent below its February level, while the youth unemployment rate was 23.0 per cent in September. In the accommodation and food services industries, which are still subject to many pandemic-related restrictions, employment levels in September were 13.8 per cent lower than in February.[8]
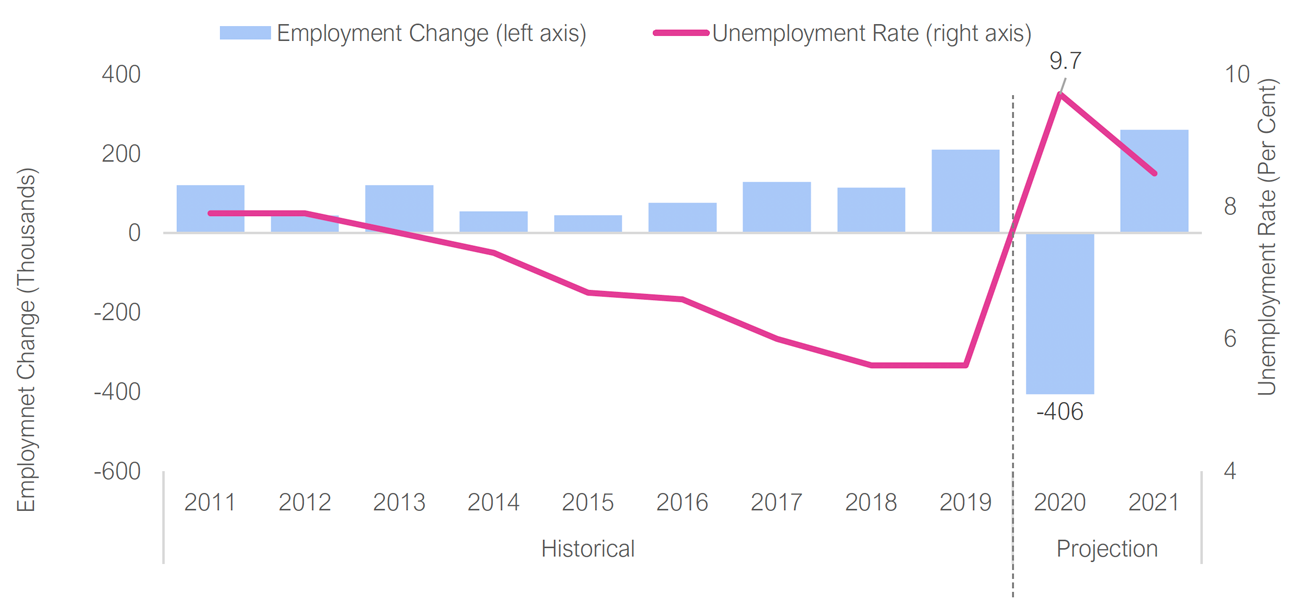
As employment continues to recover through the remaining months of 2020 and into next year, Ontario’s unemployment rate is expected to trend lower. Nonetheless, Ontario’s annual average unemployment rate is projected to reach a 26-year high of 9.7 per cent in 2020, before declining modestly to 8.5 per cent in 2021.
Figure 2‑3 Unemployment rate projected to rise to 9.7 per cent in 2020
Source: Statistics Canada and FAO.
Accessible version
| Employment Change (Thousands) | Unemployment Rate (Per Cent) | ||
|---|---|---|---|
| Historical | 2011 | 121 | 7.9 |
| 2012 | 44 | 7.9 | |
| 2013 | 121 | 7.6 | |
| 2014 | 55 | 7.3 | |
| 2015 | 45 | 6.8 | |
| 2016 | 76 | 6.5 | |
| 2017 | 128 | 6.0 | |
| 2018 | 114 | 5.6 | |
| 2019 | 210 | 5.6 | |
| Projection | 2020 | -367 | 9.7 |
| 2021 | 339 | 8.5 |
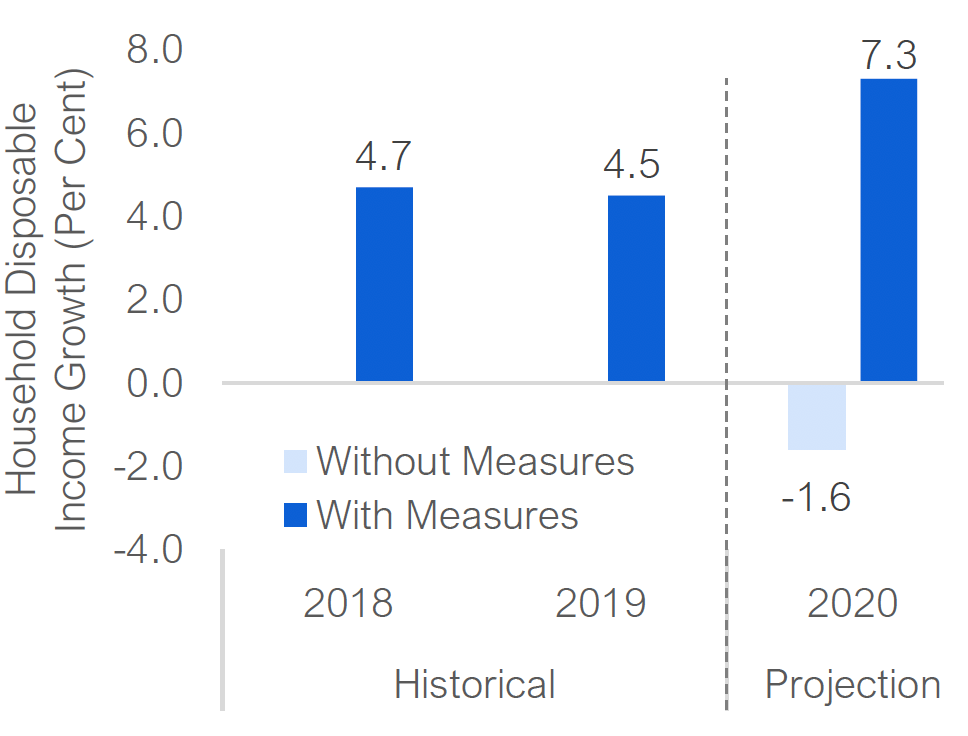
Significant government support underpinning household incomes and spending
Figure 2-4 Emergency government support measures lead to strong increase in income in 2020
Source: Statistics Canada, Ontario Economic Accounts and FAO.
Accessible version
| Household Disposable Income Growth (Per Cent) | 2018 | 2019 | 2020 |
|---|---|---|---|
| With Measures | 4.7 | 4.5 | 7.3 |
| Without Measures | -1.6 |
The sharp job losses during the pandemic have weakened labour income significantly. However, massive support from the federal government, notably the Canadian Emergency Relief Benefit, has more than offset these losses. In the absence of the support measures, the FAO estimates that disposable income of Ontario households would have declined by 1.6 per cent in 2020. However, when the government income support measures are included, household disposable income is projected to rise by 7.3 per cent this year, the strongest annual increase since 1989.[9]
This income support has helped household spending recover quickly as the economy reopened, while record low mortgage rates have fuelled housing market activity. These income support programs combined with pent-up demand led to a 56 per cent surge in retail sales from May to July, while home sales in August reached the highest monthly level on record.
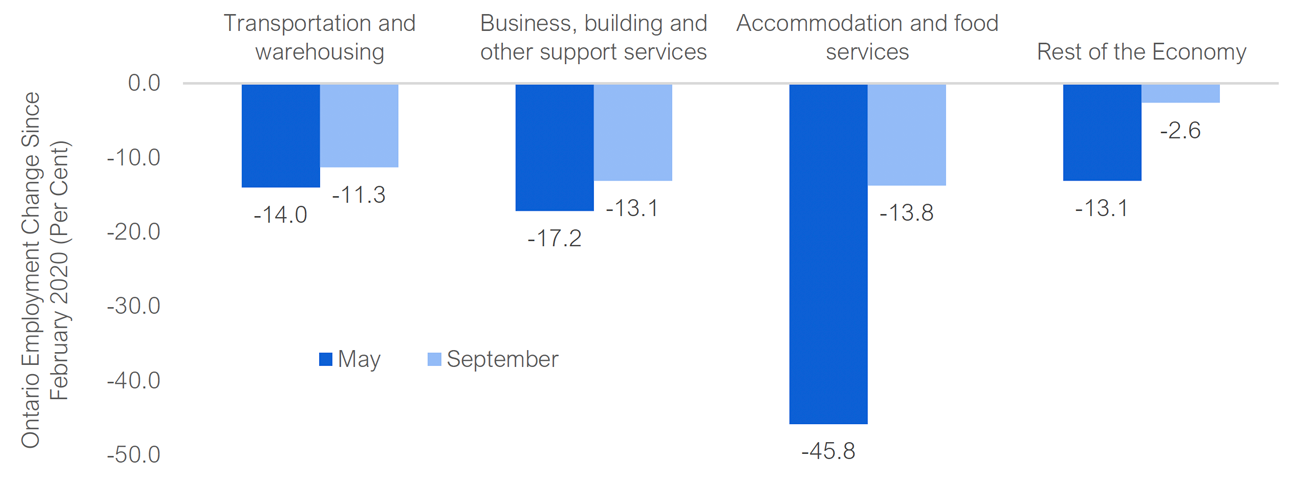
Despite these gains, overall economic activity remains below pre-pandemic levels and the path to a full recovery is likely to be slow with uneven growth among sectors. Sectors most affected by the pandemic shutdowns, such as accommodation and food services, culture and recreation, and transportation, have suffered some of the steepest declines in employment. Faced with continued restrictions and reduced demand as the economy reopens, employment in these sectors is expected to lag behind the rest of the economy.
Figure 2‑5 Sectors affected the most by pandemic shutdowns face slower recovery in employment
Source: Statistics Canada and FAO.
Accessible version
| Ontario Employment Change Since February 2020 (Per Cent) | May | September |
|---|---|---|
| Transportation and warehousing | -14.0 | -11.3 |
| Business, building and other support services | -17.2 | -13.1 |
| Accommodation and food services | -45.8 | -13.8 |
| Rest of the Economy | -12.6 | -2.6 |
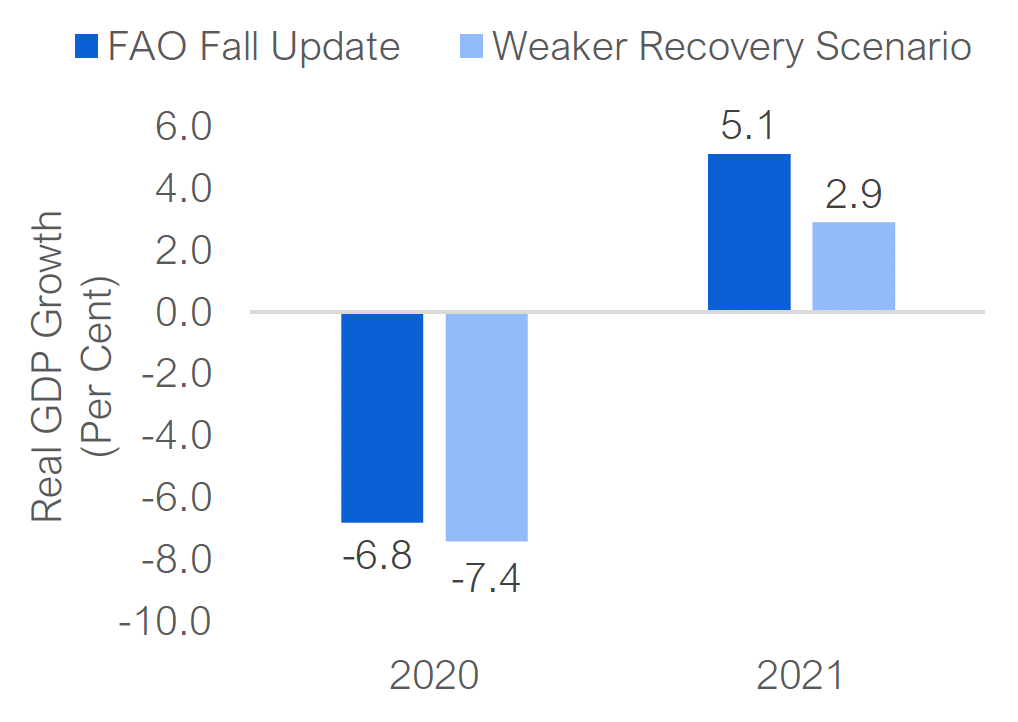
Economic recovery would be weaker if significant shutdown measures are reintroduced
Figure 2-6 Economic growth would be weaker if pandemic containment measures are reintroduced
Source: FAO.
Accessible version
| Real GDP Growth (Per Cent) | 2020 | 2021 |
|---|---|---|
| FAO Fall EBO | -6.8 | 5.1 |
| Delayed Recovery | -7.4 | 2.9 |
Ontario’s economy faces several significant risks that could lead to slower economic growth than projected. In particular, the recent rise in daily COVID-19 infections poses a serious risk to the pace of Ontario’s economic recovery. If rising cases prompt the government to reintroduce significant pandemic containment measures in select regions or sectors, economic output could stall or decline in the fourth quarter of 2020 and into early next year.
The FAO developed a scenario to assess the impact of a partial shutdown, beginning this fall. Under this scenario, the FAO estimates that Ontario real GDP would decline by a more severe 7.4 per cent in 2020 and rebound just 2.9 per cent in 2021, much slower than the 5.1 per cent expected in the baseline outlook.
Other risks to a sustained economic recovery include the eventual withdrawal of government income supports. As government emergency programs are gradually reduced, highly indebted households and businesses may struggle, leading to a sharp rise in insolvencies. Additionally, health-related childcare concerns could also delay or prevent the return to work for many parents, dampening household incomes and spending. Over the medium term, the pandemic could force a relatively abrupt restructuring of many Ontario industries, with lasting consequences. For industries hardest hit by the pandemic, including tourism, entertainment and transportation, a slow and prolonged recovery could lead to the permanent loss of jobs and downscaling of businesses.
3 | Budget Outlook
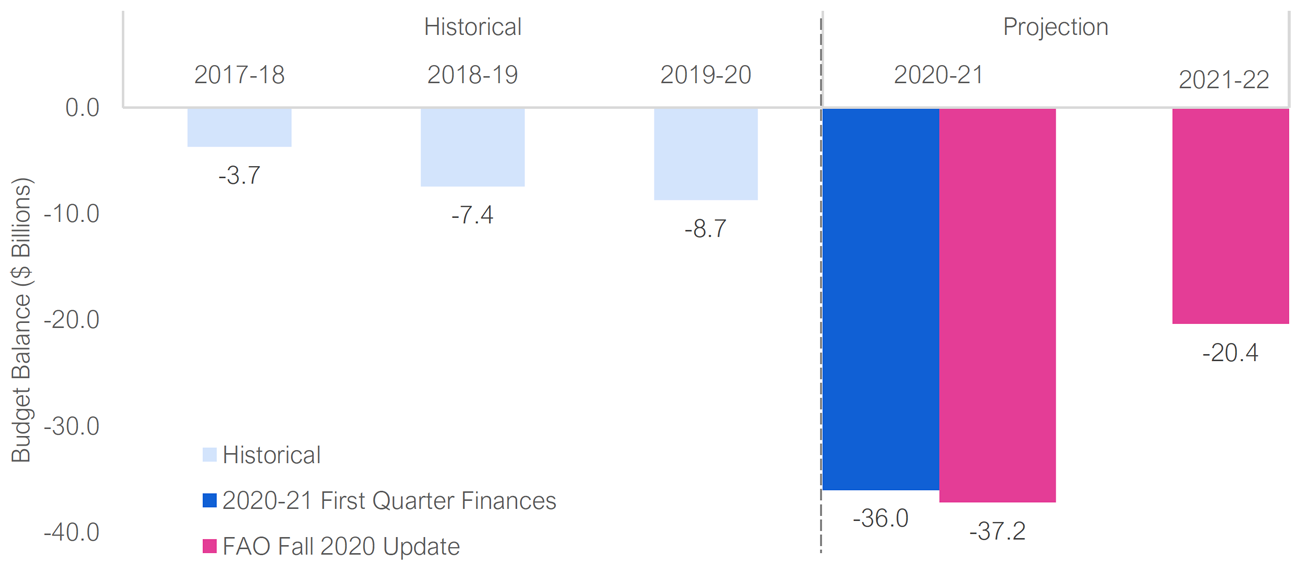
Budget deficit of $37.2 billion projected in 2020-21
The FAO projects Ontario’s budget deficit will increase from $8.7 billion in 2019-20 to $37.2 billion in 2020-21. As the province recovers from the COVID-19 pandemic and the economy rebounds, the budget deficit is expected to improve to $20.4 billion in 2021-22.
The FAO’s deficit forecast for 2020-21 is broadly consistent with the government’s updated deficit projection of $36.0 billion in the First Quarter Finances (excluding the $2.5 billion reserve).[10] The FAO’s slightly higher deficit projection reflects a weaker outlook for nominal GDP growth – a broad measure of the tax base – compared to the government’s projection.
Figure 3‑1 FAO’s budget deficit forecast is broadly consistent with the Province’s in the 2020-21 First Quarter Finances
Note: The budget balance is presented before the reserve.
Source: Ontario Public Accounts, 2020-21 First Quarter Finances, and FAO.
Accessible version
| Historical | Projection | ||||
|---|---|---|---|---|---|
| Budget Balance ($ Billions) | 2017-18 | 2018-19 | 2019-20 | 2020-21 | 2021-22 |
| Historical | -3.7 | -7.4 | -8.7 | ||
| 2020 First Quarter Finances | -36.0 | ||||
| FAO Fall 2020 Update | -37.2 | -20.4 | |||
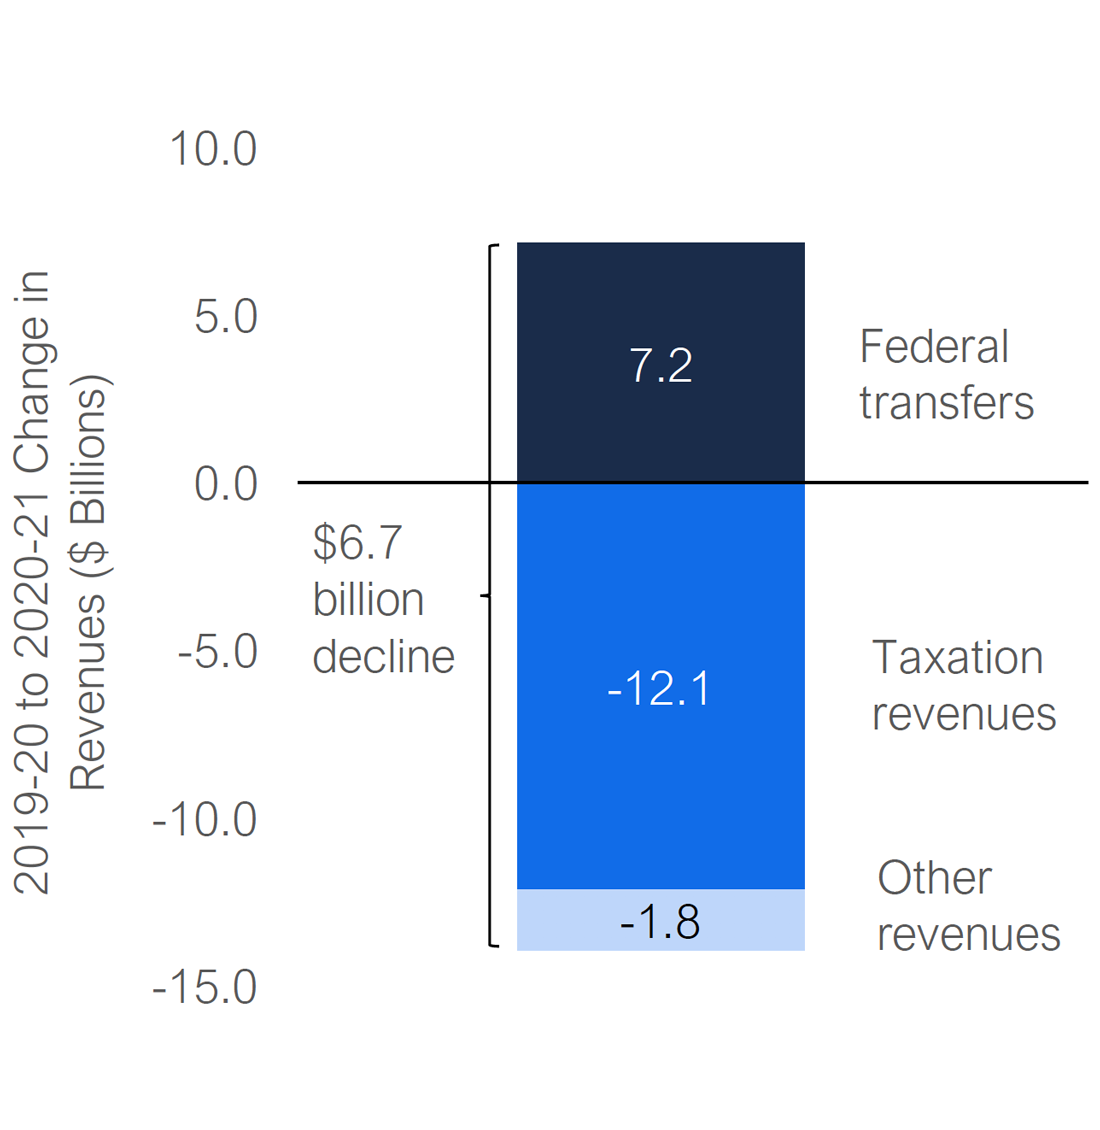
Sharp revenue decline projected for this year
Figure 3-2 The decline in 2020-21 tax revenues is partially offset by higher federal transfers
Source: Ontario Public Accounts and FAO.
Accessible version
| Change in Revenues ($ Billions) | |
|---|---|
| Federal transfers | 7.2 |
| Taxation revenues | -12.1 |
| Other revenues | -1.8 |
Tax revenues are projected to drop $12.1 billion (11.2 per cent) in 2020-21. The three largest sources of tax revenue – Corporations Tax (-$6.6 billion), Sales Tax (-$2.1 billion) and Personal Income Tax (-$2.1 billion) – make up the majority of the overall decline. The decline in tax revenues is partly offset by a significant $7.2 billion (28.2 per cent) increase in transfers from the federal government. Combined, the FAO projects total revenue will decline by $6.7 billion (4.3 per cent) in 2020-21.
Figure 3-3 Decline in revenues in 2020-21 projected to be less severe than in spring
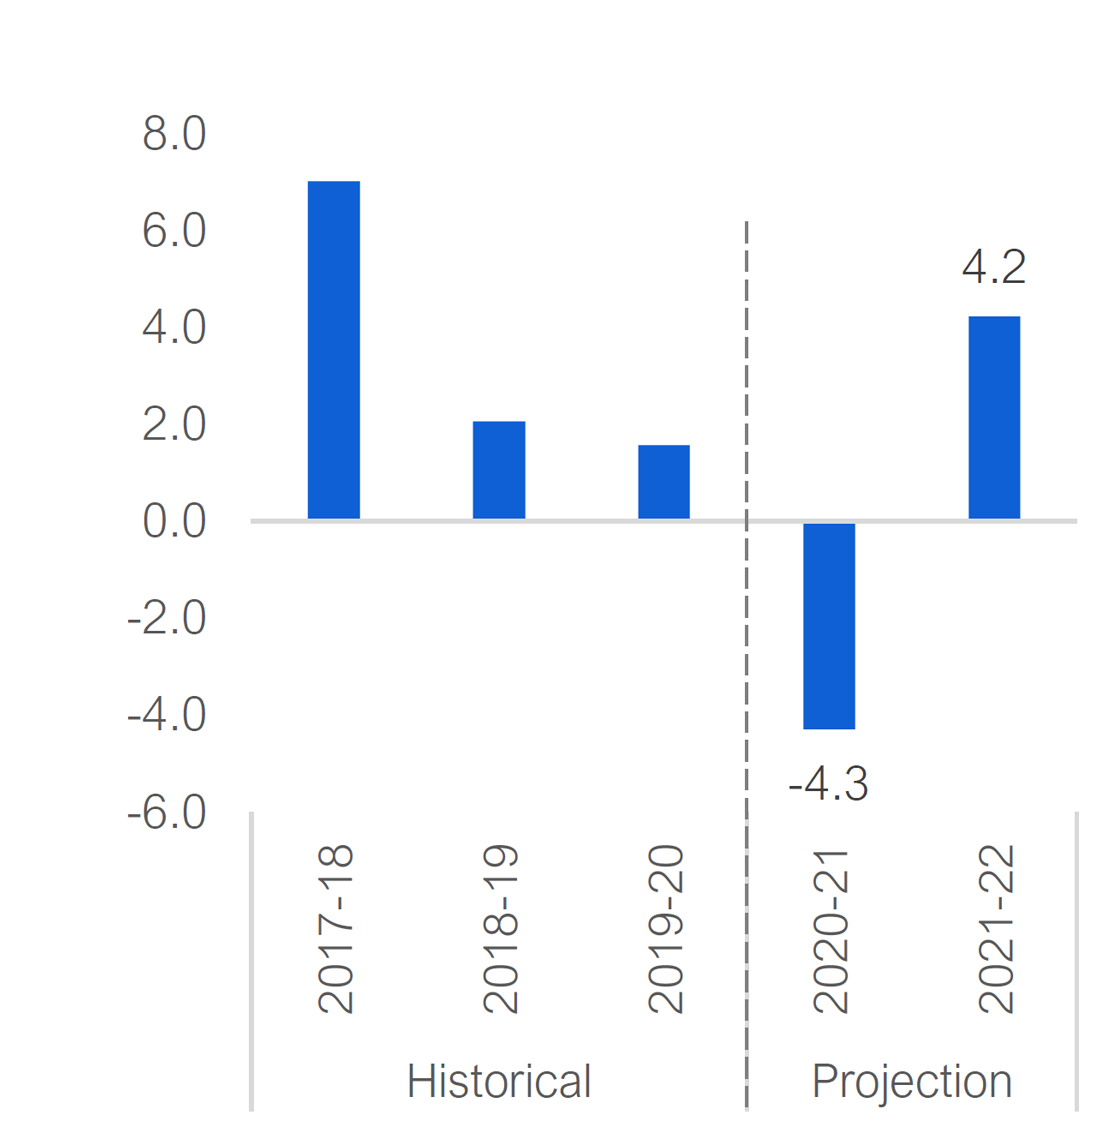
Source: Ontario Public Accounts and FAO.
Accessible version
| Historical | Projection | ||||
|---|---|---|---|---|---|
| 2017-18 | 2018-19 | 2019-20 | 2020-21 | 2021-22 | |
| Annual Growth in Revenue (Per Cent) | 7.0 | 2.1 | 1.6 | -4.3 | 4.2 |
Supported by a rebound in economic activity, tax revenues are expected to partially bounce back in 2021-22, rising by $7.3 billion (7.6 per cent). As the economy continues to recover and government emergency spending is reduced, federal transfers are assumed to return to approximately pre-pandemic levels based on current policies. In 2021-22, as the economy recovers, total revenue is expected to rebound, increasing by $6.3 billion (4.2 per cent).
The historic pandemic-related shock to Ontario’s economy and government-mandated shutdowns will substantially impact the province’s revenues. However, the decline in the key economic drivers of tax revenues in 2020 is now projected to be somewhat less severe than in the FAO’s spring projection. In addition, income support programs from both the federal and provincial governments have been significantly enhanced since the spring. As a result, tax revenues are expected to decline less in 2020-21 than the FAO had initially projected in its spring outlook.
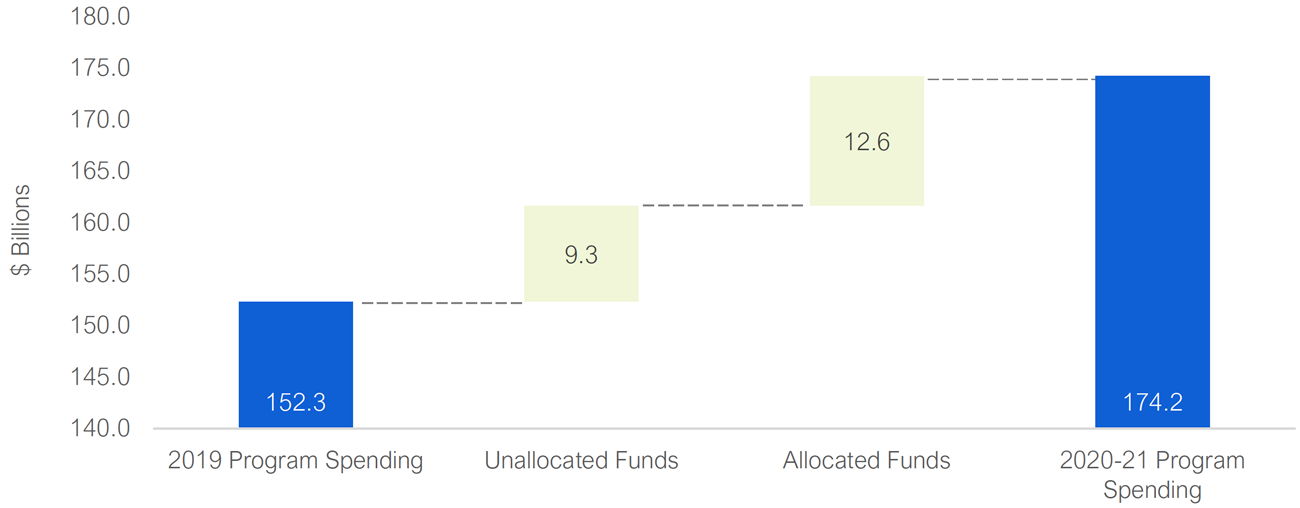
Strong increase in 2020-21 program spending
In the 2020-21 First Quarter Finances, the government provided an update to the current year’s spending plan reported in the March 2020 Economic and Fiscal Update (March Update). Based on the updated plan, Ontario’s program spending in 2020-21 is projected to be $13.1 billion (or 13.8 per cent) higher than the initial projection at the time of the March Update.
Planned program spending in 2020-21 of $174.2 billion is now expected to be $21.9 billion higher than 2019-20. However, at the time of the writing of this report, the $21.9 billion increase includes approximately $9.3 billion in program spending for 2020-21 that has yet to be allocated to specific programs, consisting of:
- $6.7 billion[11] from the COVID-19 Health Sector Response Fund and the Support for People and Jobs Fund; and a
- $2.6 billion increase in the standard Contingency Fund.
Figure 3‑4 Over $9 billion of the increase in program spending in 2020-21 remains unallocated
Source: Ontario Public Accounts, 2020-21 First Quarter Finances, and FAO.
Accessible version
| ($ Billions) | |
|---|---|
| 2019 Program Spending | 152.3 |
| Unallocated Funds | 9.3 |
| Allocated Funds | 12.6 |
| 2020-21 Program Spending | 174.2 |
The government has yet to provide an updated spending outlook beyond 2020-21.[12] As a result, the FAO prepared a sector-specific analysis of spending cost drivers (including population growth, aging and price inflation) to develop estimates of program spending by sector for 2021-22. After adjusting for the significant temporary spending in 2020-21 related to many of the COVID-19 measures, the FAO projects that program spending would be expected to decrease by 6.1 per cent to $163.6 billion in 2021-22.
Budget deficit and debt outlook
The FAO projects a record high Ontario budget deficit of $37.2 billion (or 4.4 per cent of GDP) in 2020-21, reflecting a sharp decline in revenues combined with a significant increase in program spending.
This updated deficit projection is moderately lower than the FAO’s spring outlook,[13] but broadly consistent with the government’s latest projection from the 2020-21 First Quarter Finances. The FAO’s revised deficit outlook reflects a smaller decline in revenues, the result of a less severe economic downturn and increased federal transfers that more than offset a significant increase in planned program spending.
Notably, the government could report a substantially smaller budget deficit for 2020-21 than the FAO’s projection of $37.2 billion, if it does not allocate all of the $9.3 billion of unused contingency funds to specific programs. Unallocated contingency funds that are not used in the current fiscal year would reduce both the budget deficit and Ontario’s net debt, contributing to lower interest on debt expense.[14]
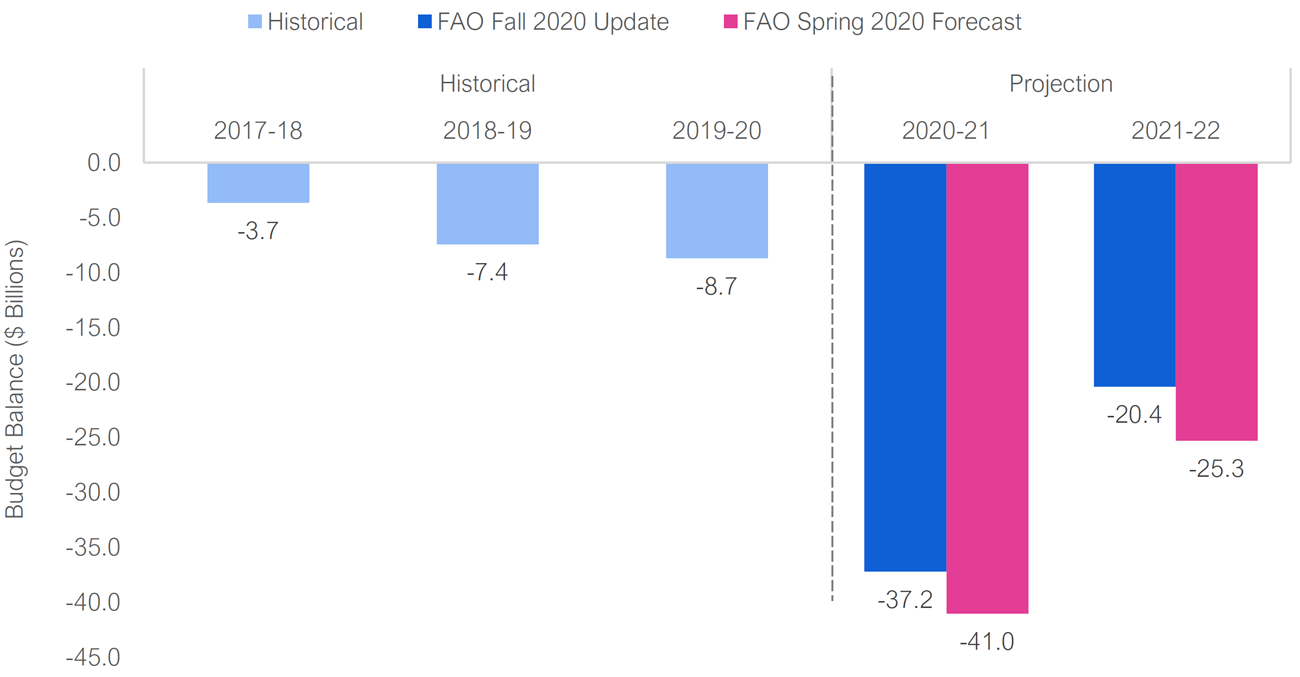
Figure 3‑5 Ontario’s budget deficit projected to be smaller than the FAO’s spring projection
Source: Ontario Public Accounts, and FAO.
Accessible version
| Historical | Projection | ||||
|---|---|---|---|---|---|
| Budget Balance ($ Billions) | 2017-18 | 2018-19 | 2019-20 | 2020-21 | 2021-22 |
| Historical | -3.7 | -7.4 | -8.7 | ||
| FAO Fall 2020 Update | -37.2 | -20.4 | |||
| FAO Spring 2020 Forecast | -41.0 | -25.3 | |||
As the province recovers from the pandemic and the economy begins to recover, the budget deficit is expected to improve to $20.4 billion in 2021-22, somewhat smaller than projected in the FAO’s spring outlook. The improvement to the budget deficit next year is the result of a partial rebound in revenues and lower program expenses as much of the pandemic-related spending in 2020-21 is assumed to be temporary.
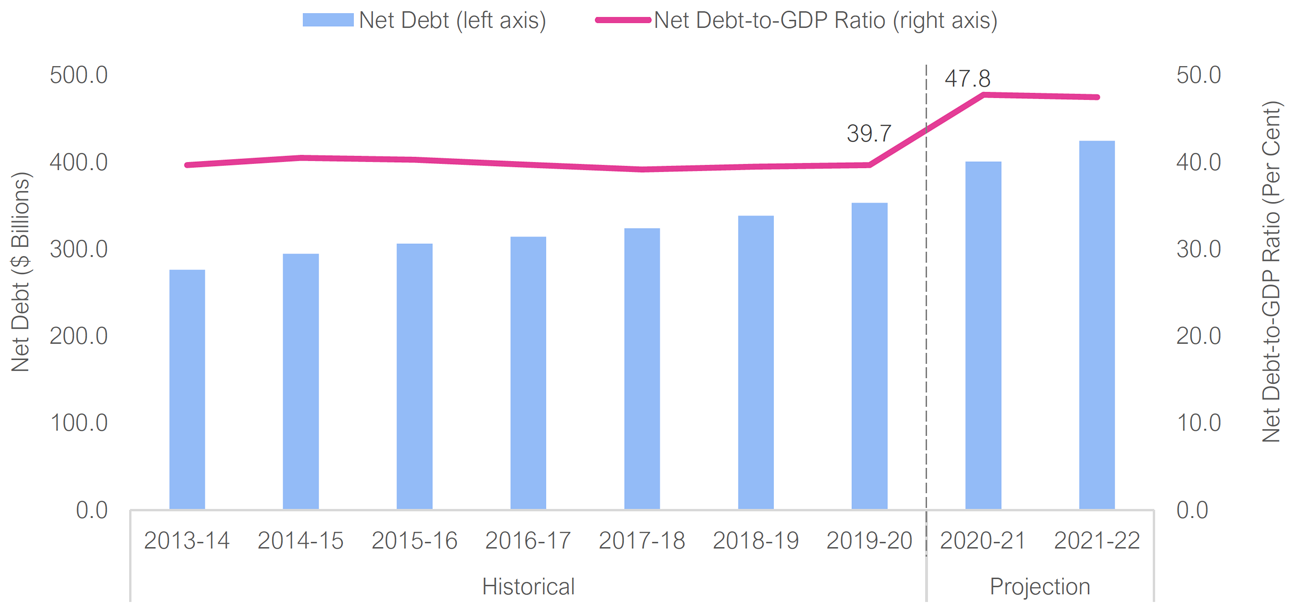
Given the revised deficit outlook, net debt is projected to increase by $47.4 billion in 2020-21 and by a further $23.8 billion in 2021-22. Higher debt will result in a sharp increase Ontario’s net debt-to-GDP ratio from 39.7 per cent in 2019-20 to almost 48 per cent in 2020-21. The debt-to-GDP ratio is projected to remain at this higher level in 2021-22.
Figure 3‑6 Ontario’s net debt-to-GDP ratio to reach a record 47.8 per cent in 2020-21
Source: Statistics Canada, Ontario Economic Accounts, Ontario Public Accounts, and FAO.
Accessible version
| Net Debt ($ Billions) | Net debt-to-GDP (Per Cent) | ||
|---|---|---|---|
| Historical | 2013-14 | 276.2 | 39.7 |
| 2014-15 | 294.6 | 40.5 | |
| 2015-16 | 306.4 | 40.3 | |
| 2016-17 | 314.1 | 39.7 | |
| 2017-18 | 323.8 | 39.2 | |
| 2018-19 | 338.5 | 39.5 | |
| 2019-20 | 353.3 | 39.7 | |
| Projection | 2020-21 | 400.7 | 47.8 |
| 2021-22 | 424.5 | 47.5 |
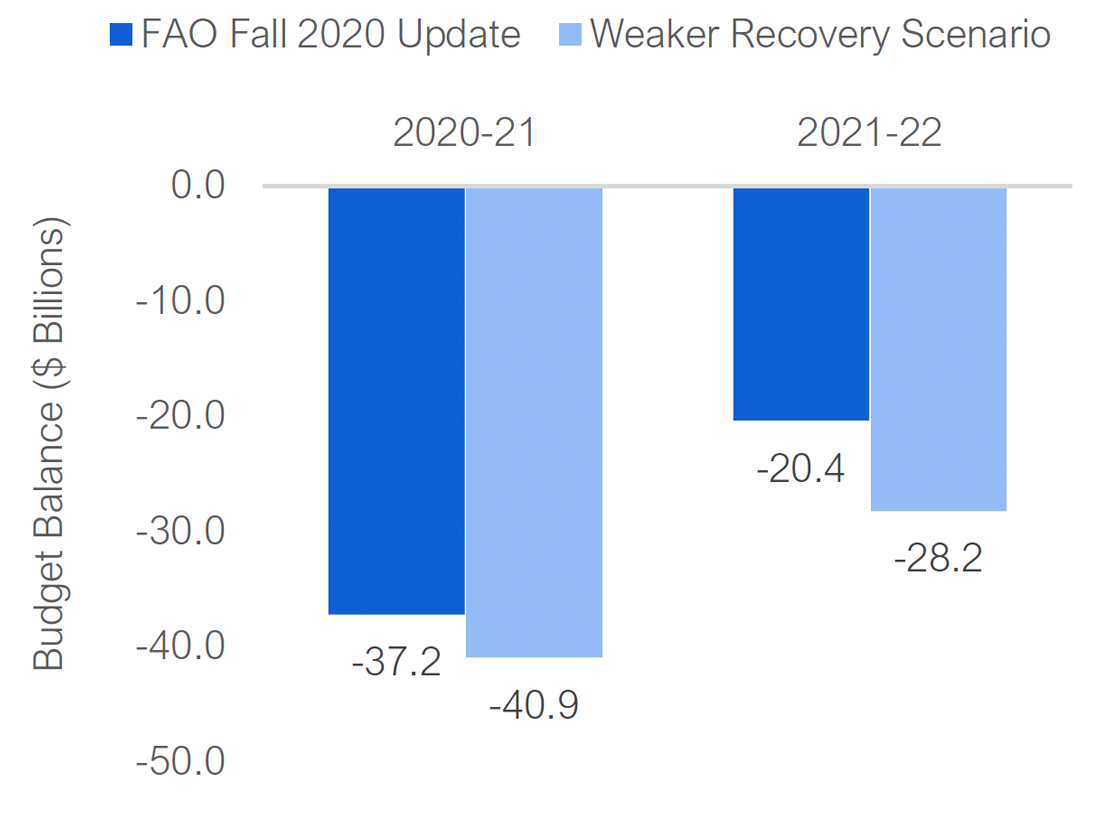
Pandemic resurgence and weaker economic recovery would lead to higher budget deficits
In the FAO’s scenario where rising COVID-19 infections prompt the reintroduction of significant shutdowns that result in slower economic growth, provincial revenue would experience a sharper drop in 2020-21 and recover more slowly in 2021-22, while program spending would be somewhat higher. Under these circumstances, the budget deficit would reach almost $41 billion in 2020-21 and improve only moderately to $28.2 billion in 2021-22.
A sustained increase in budget deficits would lead to much higher levels of borrowing and debt accumulation. Under this scenario, Ontario’s net debt-to-GDP ratio would increase substantially from 39.7 per cent in 2019-20 to over 50 per cent by 2021-22.
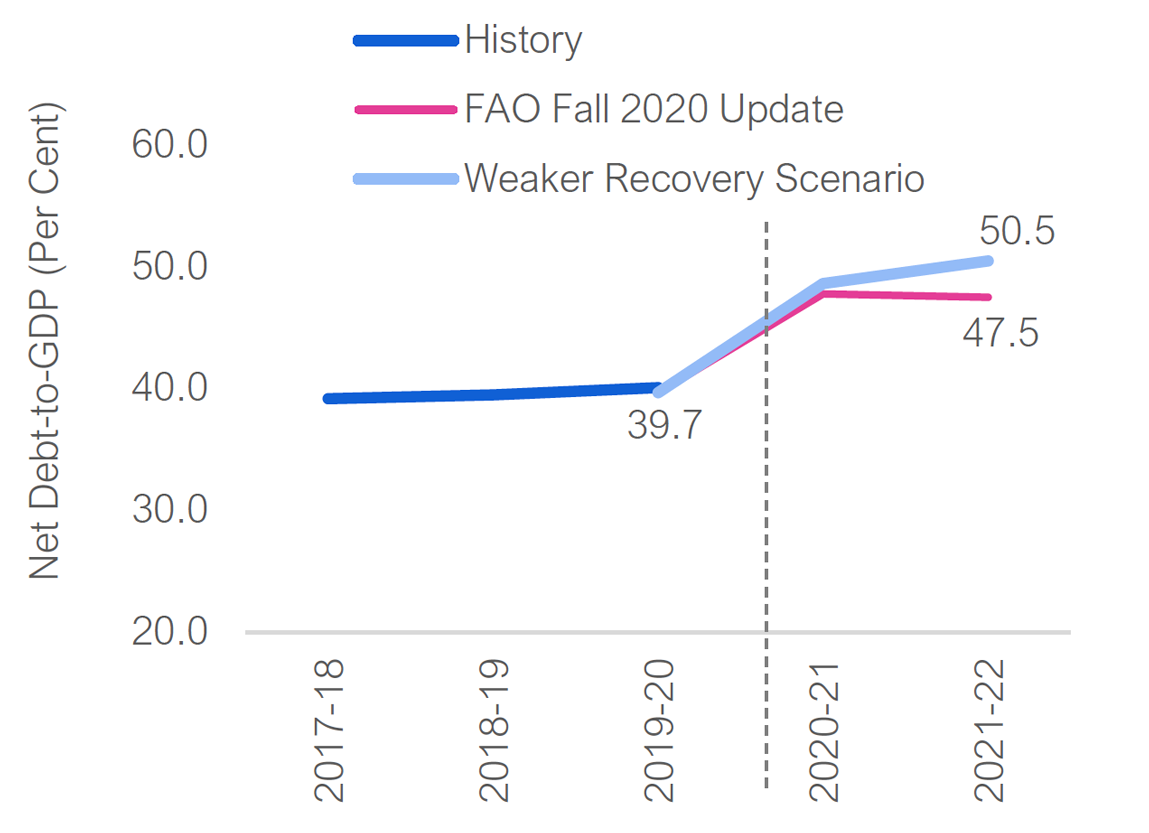
Figure 3-7 A weaker recovery in Ontario would result in a significantly higher deficit in 2021-22
Source: FAO.
Accessible version
| Historical | Projection | ||||
|---|---|---|---|---|---|
| Net Debt-to-GDP (Per Cent) | 2017-18 | 2018-19 | 2019-20 | 2020-21 | 2021-22 |
| Historical | 39.2 | 39.5 | 39.7 | ||
| FAO Fall 2020 Update | 47.8 | 47.5 | |||
| Weaker Recovery Scenario | 48.6 | 50.5 | |||
Figure 3-8 A weaker economic recovery would raise the net debt-to-GDP ratio above 50 per cent
Source: Statistics Canada, Ontario Economic Accounts, Ontario Public Accounts and FAO.
Accessible version
| Budget Balance ($ Billions) | 2020-21 | 2021-22 |
|---|---|---|
| FAO Fall 2020 Update | -37.2 | -20.4 |
| Weaker Recovery Scenario | -40.9 | -28.2 |
Ontario’s fiscal recovery plan
In Ontario, the Fiscal Sustainability, Transparency and Accountability Act, 2019 (FSTAA) requires that when the budget is in deficit, the Province must develop a fiscal recovery plan that specifies how the budget will be balanced and the time period over which this will be achieved. This budgetary requirement was introduced in the 2019 Ontario budget.[15] In its March Update, the government committed to presenting a revised multi-year budget plan to the Legislature no later than November 15, 2020.[16]
To provide an analysis of a path to a balanced budget given the current fiscal environment, the FAO extended its base case fiscal projection to 2025-26. Figure 3-9 shows the FAO’s extended base case deficit projection for Ontario, which assumes a continued economic recovery and higher revenues, combined with the phasing-out of temporary COVID-19 spending measures.[17] Based on this extended projection, the FAO would expect the Ontario budget deficit to continue improving from $20.4 billion in 2021-22 to approximately $14 billion by 2023-24.
However, beyond 2023-24, and in the absence of policy changes, the FAO projects ongoing budget deficits in the range of $14 billion. These sustained budget deficits reflect Ontario’s existing deficit of $8.7 billion in 2019-20, the lasting fiscal impact of the pandemic, as well as Ontario’s aging population, which slows economic growth while putting upward pressure on government spending.[18]
Figure 3‑9 Roughly $14 billion is required to balance Ontario’s budget by 2025-26
Note: Budget balance is presented before the reserve.
Source: Ontario Public Accounts, and FAO.
Accessible version
| Budget Balance | Historical | Projection | Extended Projection | |||||
|---|---|---|---|---|---|---|---|---|
| ($ Billions) | 2018-19 | 2019-20 | 2020-21 | 2021-22 | 2022-23 | 2023-24 | 2024-25 | 2025-26 |
| Historical | -7.4 | -8.7 | ||||||
| FAO 2020 Fall Outlook | -37.2 | -20.4 | -16.5 | -14.1 | -14.4 | -14.5 | ||
| FAO Balanced Budget Scenario | -17.8 | -11.2 | -5.9 | -3.1 | 0.0 | |||
To provide an estimate of the extent of ongoing revenue increases or spending cuts required to balance the budget, the FAO constructed a hypothetical balanced budget scenario. If the government chose to balance the budget over the next five years, as in its previous recovery plan from the 2019 budget,[19] the FAO estimates that it would require roughly $14 billion in permanent revenue increases or spending cuts, or some combination of both. In Figure 3-9, the FAO’s “balanced budget scenario” phases in $14 billion of revenue increases and spending cuts in equal measure over five years to reach a budget balance in 2025-26.
To illustrate the policy tools available to the government to achieve these fiscal adjustments, the FAO estimated the sensitivity of the budget balance to changes in three key policy areas: tax revenues, federal transfers and program expenditures. Table 3-1 provides an estimate of both the immediate 2021-22 impact as well as the longer-term budget impact in 2025-26 of various policy changes.
| Change in budget balance in: | ||
|---|---|---|
| Change Beginning in 2021-22 | 2021-22 | 2025-26 |
| Tax Policy | ||
| A sustained 10 per cent increase in Personal Income Tax revenues ($500 per tax filer in 2021-22) over the projection | +$3.7 billion | +$4.8 billion |
| A sustained 1 percentage point increase in the general Corporations Tax rate over the projection | +$0.9 billion | +$1.2 billion |
| A sustained 1 percentage point increase in the HST rate over the projection | +$3.6 billion | +$4.6 billion |
| Federal Transfers | ||
| A sustained 1 percentage point increase in the annual growth of the Canada Health Transfer over the projection | +$0.2 billion | +$1.0 billion |
| A sustained 1 percentage point increase in the annual growth of the Canada Social Transfer over the projection | +$0.1 billion | +$0.5 billion |
| Expenditure Policy | ||
| A sustained 0.5 percentage point decrease in the growth rate of total program spending over the projection | +$0.9 billion | +$4.7 billion |
| A sustained 1 percentage point decrease in the growth rate of health spending over the projection | +$0.7 billion | +$4.1 billion |
If the government were to permanently increase personal income tax revenue by 10 per cent or around $500 per tax filer, starting in 2021-22, the budget deficit would improve by $3.7 billion in the first year and by $4.8 billion by 2025-26.
For federal transfers, if the annual growth rate of the Canada Health Transfer or the Canada Social Transfer were to increase by 1 percentage point over the projection, the budget deficit would decrease by $1 billion or $0.5 billion respectively by 2025-26.
For expenditure policy, if the government were to decrease the growth rate of program spending by 0.5 percentage points in each year beginning in 2021-22, the budget deficit would decrease by $4.7 billion by 2025-26.
Given the FSTAA requirements for a balanced budget, these estimated budget sensitivities are intended to inform the debate around the government’s policy choices.
Ontario’s fiscal targets
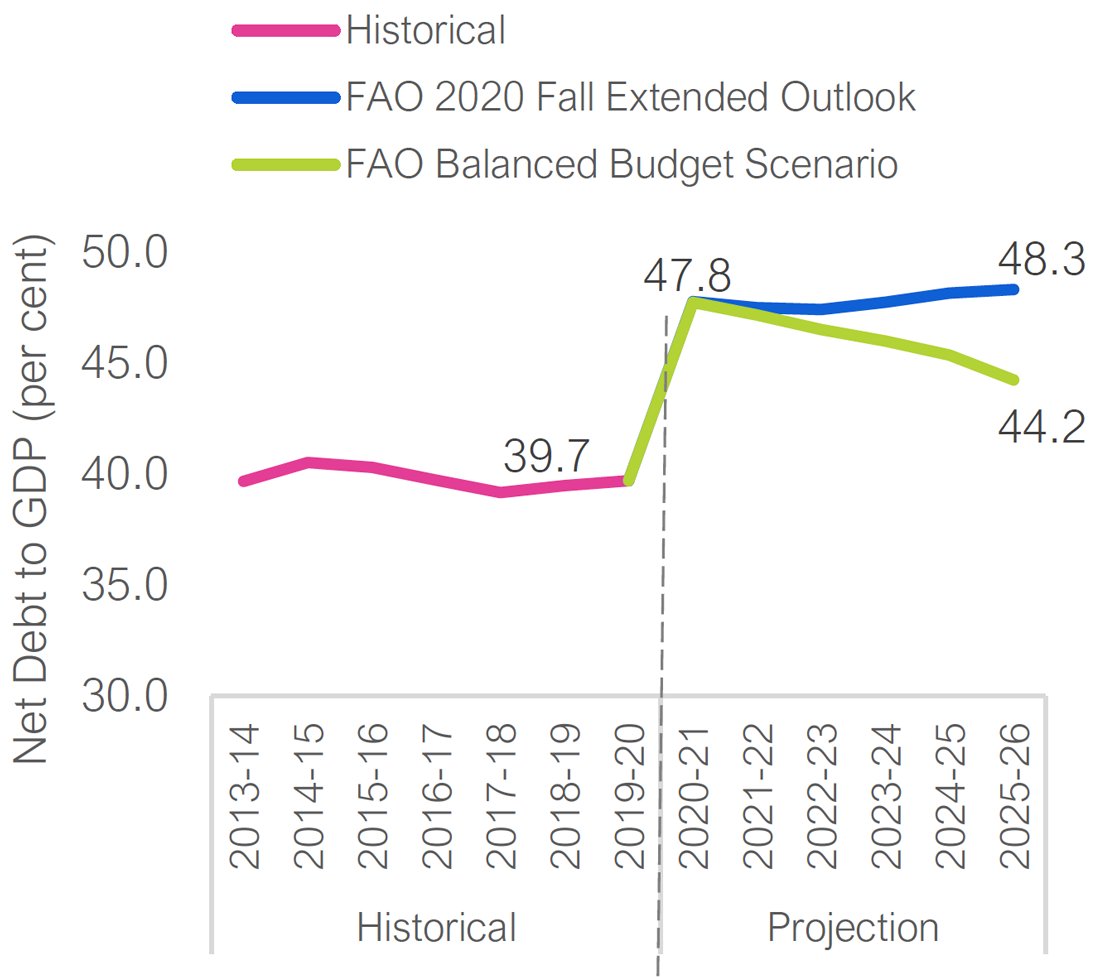
Figure 3-10 Net debt-to-GDP ratio improves to 44.2 per cent under balanced budget scenario
Source: Ontario Public Accounts and FAO.
Accessible version
| Net Debt to GDP (Per Cent) | Historical | FAO 2020 Fall Extended Outlook | FAO Balanced Budget Scenario | |
|---|---|---|---|---|
| Historical | 2013-14 | 39.7 | ||
| 2014-15 | 40.5 | |||
| 2015-16 | 40.3 | |||
| 2016-17 | 39.7 | |||
| 2017-18 | 39.2 | |||
| 2018-19 | 39.5 | |||
| 2019-20 | 39.7 | |||
| Projection | 2020-21 | 47.8 | 47.7 | |
| 2021-22 | 47.5 | 47.2 | ||
| 2022-23 | 47.4 | 46.5 | ||
| 2023-24 | 47.7 | 46.0 | ||
| 2024-25 | 48.2 | 45.4 | ||
| 2025-26 | 48.3 | 44.2 |
In the 2019 Ontario Budget, the government committed to balance the budget by 2023-24 and to reduce the net debt-to-GDP ratio to under 40.8 per cent by 2022-23. However, with the onset of the COVID-19 pandemic and the resulting economic downturn, the government will need to revise its fiscal targets. FSTAA’s current requirement to balance the overall budget is a relatively rigid fiscal rule,[20] which will affect other key fiscal measures, including the province’s debt burden and its interest on debt payments relative to revenues.
In the FAO’s extended base case outlook, the net debt-to-GDP ratio increases only modestly from 47.8 per cent in 2020-21 to 48.3 per cent in 2025-26, despite ongoing deficits of roughly $14 billion.
Under the FAO’s balanced budget scenario, the Province is assumed to implement $14 billion of fiscal adjustments over the next five years, which would lower the net debt-to-GDP ratio from 47.8 per cent in 2020-21 to 44.2 per cent by 2025-26.
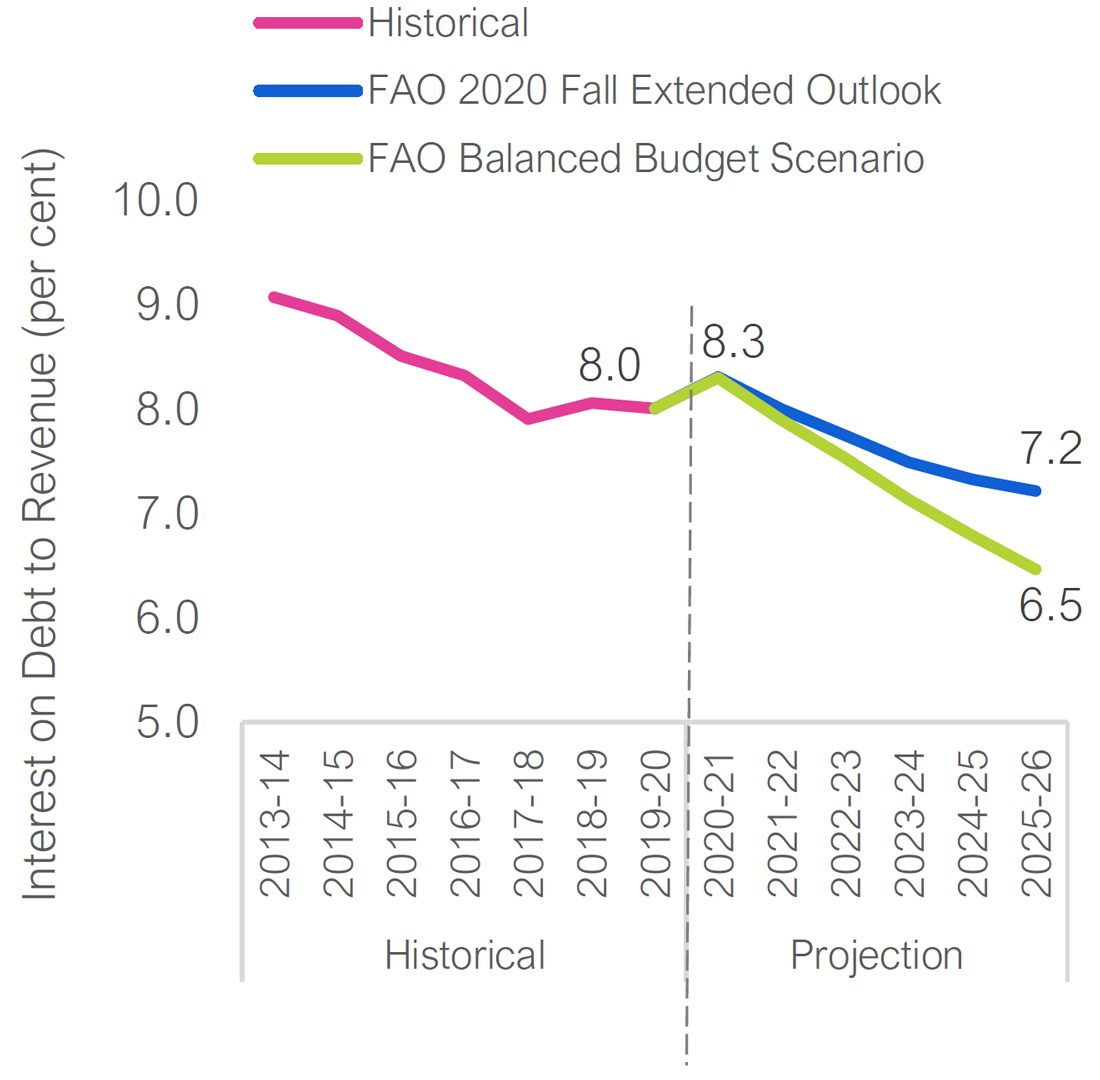
Figure 3-11 Despite ongoing $14 billion deficits, the share of revenues funding debt interest declines
Source: Ontario Public Accounts and FAO.
Accessible version
| Interest of Debt to Revenue (Per Cent) | Historical | FAO 2020 Fall Extended Outlook | FAO Balanced Budget Scenario | |
|---|---|---|---|---|
| Historical | 2013-14 | 9.1 | ||
| 2014-15 | 8.9 | |||
| 2015-16 | 8.5 | |||
| 2016-17 | 8.3 | |||
| 2017-18 | 7.9 | |||
| 2018-19 | 8.1 | |||
| 2019-20 | 8.0 | |||
| Projection | 2020-21 | 8.3 | 8.3 | |
| 2021-22 | 8.0 | 7.9 | ||
| 2022-23 | 7.7 | 7.5 | ||
| 2023-24 | 7.5 | 7.1 | ||
| 2024-25 | 7.3 | 6.8 | ||
| 2025-26 | 7.2 | 6.5 |
The ratio of interest on debt to revenue shows the share of annual revenues required to service the Province’s debt. Higher ratios leave less revenue available for program spending such as health care or education, reducing the budgetary flexibility of the government.
Despite ongoing deficits of roughly $14 billion under the FAO’s extended base case outlook, debt interest as a share of revenue is projected to decline from 8.3 per cent in 2020-21 to 7.2 per cent by 2025-26, due to steady revenue growth coupled with very low interest rates. In addition, the government’s ability to refinance maturing debt at lower interest rates also offsets the impact of the rising debt burden.
Under the FAO’s balanced budget scenario, the Province implements $14 billion of fiscal adjustments over the next five years, which would accelerate the decline in debt interest as a share of revenue from 8.3 per cent in 2020-21 to a historic low of 6.5 per cent by 2025-26, the lowest share in over 50 years.
4 | Appendix
Appendix A: Economic Tables
| (Per Cent Growth) | 2018a | 2019a | 2020f | 2021f |
|---|---|---|---|---|
| Nominal GDP | ||||
| FAO – Fall 2020 | 3.7 | 3.9 | -5.8 | 6.5 |
| Ontario 2020-21 First Quarter Finances* | 3.7 | 3.9 | -5.3 | 7.1 |
| Consensus** | 3.7 | 3.9 | -4.7 | 6.6 |
| Labour Income | ||||
| FAO – Fall 2020 | 5.5 | 4.2 | -3.5 | 4.2 |
| Ontario 2020-21 First Quarter Finances | 5.5 | 4.2 | -2.5 | 5.5 |
| Corporate Profits | ||||
| FAO – Fall 2020 | -0.9 | 2.6 | -15.9 | 11.7 |
| Ontario 2020-21 First Quarter Finances | -0.9 | 2.6 | -14.1 | 9.3 |
| Household Consumption | ||||
| FAO – Fall 2020 | 4.4 | 3.6 | -5.9 | 6.2 |
| Ontario 2020-21 First Quarter Finances | 4.4 | 3.6 | -6.0 | 8.3 |
| (Per Cent Growth) | 2018a | 2019a | 2020f | 2021f |
|---|---|---|---|---|
| Real GDP | ||||
| FAO – Fall 2020 | 2.2 | 1.7 | -6.8 | 5.1 |
| Ontario 2020-21 First Quarter Finances* | 2.2 | 1.7 | -6.7 | 5.5 |
| Consensus** | 2.2 | 1.7 | -6.1 | 5.0 |
| Real GDP Components | ||||
| Household Consumption | 2.5 | 2.2 | -6.5 | 4.4 |
| Residential Investment | -3.3 | -0.3 | -1.7 | 5.9 |
| Business Investment | 6.3 | -2.1 | -13.5 | 11.7 |
| Government (Consumption and Investment) | 4.0 | 2.7 | -1.0 | 3.8 |
| Exports | 0.9 | 2.0 | -13.7 | 6.1 |
| Imports | 1.6 | 1.4 | -11.0 | 6.0 |
| 2018a | 2019a | 2020f | 2021f | |
|---|---|---|---|---|
| Employment (Per Cent Growth) | 1.6 | 2.9 | -5.4 | 3.7 |
| Unemployment Rate (Per Cent) | 5.6 | 5.6 | 9.7 | 8.5 |
| Labour Force (Per Cent Growth) | 1.2 | 2.8 | -1.2 | 2.4 |
| CPI Inflation (Per Cent) | 2.4 | 1.9 | 0.5 | 1.7 |
| Canada Real GDP (Per Cent Growth) | 2.0 | 1.7 | -6.1 | 5.0 |
| U.S. Real GDP (Per Cent Growth) | 3.0 | 2.2 | -5.5 | 3.8 |
| Canadian Dollar (Cents US) | 77.2 | 75.4 | 73.7 | 76.5 |
| Three-month Treasury Bill Rate (Per Cent) | 1.4 | 1.7 | 0.5 | 0.2 |
| 10-year Government Bond Rate (Per Cent) | 2.3 | 1.6 | 0.7 | 0.9 |
Appendix B: Fiscal Tables
| ($ Billions) | 2017-18a | 2018-19a | 2019-20a | 2020-21f | 2021-22f |
|---|---|---|---|---|---|
| Revenue | |||||
| Personal Income Tax | 32.9 | 35.4 | 37.7 | 35.6 | 36.4 |
| Sales Tax | 25.9 | 27.8 | 28.6 | 26.5 | 28.3 |
| Corporations Tax | 15.6 | 16.6 | 15.4 | 8.8 | 12.1 |
| All Other Taxes | 25.3 | 25.7 | 26.5 | 25.3 | 26.8 |
| Total Taxation Revenue | 99.7 | 105.5 | 108.3 | 96.2 | 103.5 |
| Transfers from Government of Canada | 24.9 | 25.1 | 25.4 | 32.6 | 28.7 |
| Income from Government Business Enterprise | 6.2 | 5.5 | 5.9 | 3.9 | 6.0 |
| Other Non-Tax Revenue | 19.9 | 17.6 | 16.5 | 16.7 | 17.5 |
| Total Revenue | 150.6 | 153.7 | 156.1 | 149.4 | 155.7 |
| Expense | |||||
| Health Sector | 59.1 | 61.9 | 63.7 | 72.7 | 69.3 |
| Education Sector | 27.3 | 28.7 | 31.8 | 30.3 | 30.8 |
| Children’s and Social Services Sector | 16.3 | 16.8 | 17.1 | 17.8 | 18.2 |
| Other* | 39.7 | 41.3 | 39.7 | 53.4 | 45.3 |
| Total Program Expense | 142.4 | 148.8 | 152.3 | 174.2 | 163.6 |
| Interest on Debt | 11.9 | 12.4 | 12.5 | 12.4 | 12.5 |
| Total Expense | 154.3 | 161.1 | 164.8 | 186.6 | 176.1 |
| Budget Balance** | -3.7 | -7.4 | -8.7 | -37.2 | -20.4 |
| ($ Billions) | 2017-18a | 2018-19a | 2019-20f | 2020-21f | 2021-22f |
|---|---|---|---|---|---|
| Budget Balance* | -3.7 | -7.4 | -8.7 | -37.2 | -20.4 |
| Accumulated Deficit | 209.0 | 216.6 | 225.8 | 264.2 | 284.6 |
| Net Debt | 323.8 | 338.5 | 353.3 | 400.7 | 424.5 |
| Net Debt to GDP (Per Cent) | 39.2 | 39.5 | 39.7 | 47.8 | 47.5 |
| Ministry | 2019-20 ($ Millions) |
Plan 2020-21 ($ Millions) |
Y/Y Change ($ Millions) |
Y/Y Growth (Per Cent) |
|---|---|---|---|---|
| Health and Long-Term Care | 63,716 | 68,228 | 4,512 | 7.1 |
| COVID-19 Health Contingency Fund | 0 | 4,500 | 4,500 | |
| Finance | 1,519 | 1,935 | 416 | 27.4 |
| COVID‑19 Response: Support for People and Jobs Fund | 0 | 3,084 | 3,084 | |
| Treasury Board Secretariat (Base) | 190 | 299 | 109 | 57.3 |
| Temporary Pandemic Pay | 0 | 672 | 672 | |
| Employee and Pensioner Benefits | 1,666 | 1,389 | -277 | -16.6 |
| Contingency Funds | 0 | 2,721 | 2,721 | |
| Transportation | 5,011 | 7,610 | 2,599 | 51.9 |
| Municipal Affairs and Housing | 1,199 | 2,923 | 1,724 | 143.8 |
| Children, Community and Social Services | 17,103 | 17,762 | 659 | 3.9 |
| Infrastructure | 358 | 863 | 505 | 140.9 |
| Energy, Northern Development and Mines | 6,712 | 7,185 | 473 | 7.0 |
| Training, Colleges and Universities | 11,273 | 11,716 | 443 | 3.9 |
| Education | 31,752 | 31,893 | 141 | 0.4 |
| Government and Consumer Services | 1,550 | 1,666 | 116 | 7.5 |
| Solicitor General | 2,774 | 2,850 | 76 | 2.7 |
| Environment, Conservation and Parks | 612 | 661 | 49 | 8.1 |
| Seniors and Accessibility | 54 | 87 | 33 | 60.4 |
| Board of Internal Economy | 257 | 281 | 24 | 9.3 |
| Indigenous Affairs | 87 | 96 | 9 | 10.6 |
| Heritage, Sport, Tourism and Culture Industries | 1,644 | 1,651 | 7 | 0.4 |
| Executive Offices | 32 | 38 | 6 | 17.2 |
| Francophone Affairs | 5 | 6 | 1 | 22.0 |
| Natural Resources and Forestry | 677 | 651 | -26 | -3.8 |
| Labour | 281 | 244 | -37 | -13.1 |
| Economic Development, Job Creation and Trade | 727 | 636 | -92 | -12.6 |
| Attorney General | 1,942 | 1,682 | -260 | -13.4 |
| Agriculture, Food and Rural Affairs | 1,132 | 864 | -268 | -23.7 |
| Interest on Debt | 12,495 | 12,458 | -37 | -0.3 |
| Total Expense | 164,768 | 186,651 | 21,883 | 13.3 |
Appendix C: Extended Outlook
| Historical | FAO Projection | FAO Extended Projection | ||||||
|---|---|---|---|---|---|---|---|---|
| (Per Cent Growth) | 2018a | 2019a | 2020f | 2021f | 2022f | 2023f | 2024f | 2025f |
| Real GDP | 2.2 | 1.7 | -6.8 | 5.1 | 3.4 | 1.7 | 1.7 | 1.9 |
| Nominal GDP | 3.7 | 3.9 | -5.8 | 6.5 | 5.1 | 3.6 | 3.6 | 3.8 |
| Historical | FAO Projection | FAO Extended Projection | ||||||
|---|---|---|---|---|---|---|---|---|
| ($ Billions) | 2018-19a | 2019-20a | 2020-21f | 2021-22f | 2022-23f | 2023-24f | 2024-25f | 2025-26f |
| Revenue | 153.7 | 156.1 | 149.4 | 155.7 | 161.0 | 166.9 | 172.9 | 179.2 |
| Total Expense | 161.1 | 164.8 | 186.6 | 176.1 | 177.4 | 181.0 | 187.3 | 193.8 |
| Total Program Expense | 148.8 | 152.3 | 174.2 | 163.6 | 165.0 | 168.5 | 174.6 | 180.8 |
| Interest on Debt | 12.4 | 12.5 | 12.4 | 12.5 | 12.5 | 12.5 | 12.7 | 12.9 |
| Interest on Debt as a Share of Revenue (Per Cent) | 8.1 | 8.0 | 8.3 | 8.0 | 7.7 | 7.5 | 7.3 | 7.2 |
| Budget Balance | -7.4 | -8.7 | -37.2 | -20.4 | -16.5 | -14.1 | -14.4 | -14.5 |
| Net Debt | 338.5 | 353.3 | 400.7 | 424.5 | 445.2 | 464.3 | 485.4 | 505.6 |
| Net Debt to GDP (Per Cent) | 39.5 | 39.7 | 47.8 | 47.5 | 47.4 | 47.7 | 48.2 | 48.3 |
Footnotes
[1] Based on Statistics Canada’s Provincial Economic Accounts which cover the period 1981 to 2018.
[2] Excluding the $2.5 billion reserve. For details, see page 13 of the 2020-21 First Quarter Finances.
[3] See page 5 of the 2019 Ontario Budget.
[4] Economic and Budget Outlook Spring 2020, FAO, May 2020.
[5] The recent rise in daily COVID-19 infections poses a serious risk to the pace of Ontario’s economic recovery. If rising cases prompt the government to reintroduce selective pandemic containment measures, the economic recovery would be weaker and possibly delayed. The timing of a safe, effective and widely available vaccine is expected to be a key factor in shaping the timing and pace of the economic recovery.
[6] Based on Statistics Canada’s Provincial Economic Accounts which cover the period 1981 to 2018.
[7] See Ontario’s Regional Labour Markets During the COVID-19 Pandemic, FAO, June 2020 and Ontario’s Job Market during the COVID-19 Pandemic, FAO, May 2020.
[8] The FAO will release a detailed summary of the 2020 labour market, including an assessment of the impact of the COVID-19 pandemic, in early 2021.
[9] Federal and provincial government measures incorporated into the projection include the Canada Emergency Relief Benefit (CERB), the Enhanced Goods and Services Tax Credit, the Enhanced Canada Child Benefit, Canada Emergency Student Benefit (CESB),Ontario’s $200 COVID-19 Childcare Support benefit and increases to the Guaranteed Annual Income System (GAINS) payment for low-income seniors. In total, these government measures added $45 billion to household incomes in Ontario this year. This $45 billion amount does not include the Canada Emergency Wage Subsidy, which was recorded by Statistics Canada as a subsidy to corporations and unincorporated businesses and is reflected in disposable income directly through labour income. For an analysis of government measures responding to the COVID-19 pandemic, see Federal and Provincial COVID-19 Response Measures, FAO, September 2020.
[10] For details, see page 13 of the 2020-21 First Quarter Finances.
[11] According to the 2020-21 First Quarter Finances, the net position of the Health Contingency Fund and the Support for People and Jobs Contingency Fund was $7.5 billion as of June 30, 2020. As of August 26, the government announced several new policy measures that would reduce the size of the unallocated amount of program spending to $6.7 billion. For details, see the FAO’s Federal and Provincial COVID-19 Response Measures. Over the remaining months of the current fiscal year, the government is expected to announce new programs or increased spending for existing programs that would lower the size of the unallocated funds further.
[12] The government has committed to presenting a multi-year budget to the Legislature no later than November 15. See page 5 of the 2020-21 First Quarter Finances.
[13] See Page 17 of the FAO’s Spring 2020 Economic and Budget Outlook for details.
[14] The government committed to using any unallocated contingency funds at year end to reduce Ontario’s net debt position. See page 13 of the 2020-21 First Quarter Finances.
[15] See page 19 of the 2019 Ontario Budget.
[16] See page vii of March 2020 Economic and Fiscal Update.
[17] These extended revenue and spending projections represent average historical rates of revenue and spending growth, and are adapted from the FAO’s recent Long-Term Budget Outlook, adjusted to the current short-term outlook.
[18] See the FAO’s Long-Term Budget Outlook for more details.
[19] See page 5 of the 2019 Ontario Budget.
[20] See page 32 of the OECD’s “Prudent Debt Targets and Fiscal Frameworks.”