


1. Summary
This Economic and Budget Outlook report provides the FAO’s projection for Ontario’s economy and the Government of Ontario’s (the Province’s) finances over the 2023-24 to 2028-29 period. The report also compares the FAO’s budget outlook to the government’s plan presented in the 2024 Ontario Budget from 2023-24 to 2026-27. The FAO’s revenue and spending projections are based on current and announced government policies.
Ontario’s economic growth expected to remain slow in 2024
Ontario’s real GDP growth slowed sharply to 1.2 per cent in 2023 and is projected to remain slow at 1.1 per cent in 2024, reflecting the ongoing impact of higher interest rates on household spending and business investment. As inflation cools and interest rates decline over the outlook, Ontario’s real GDP growth is projected to improve to 2.0 per cent in 2025 and average 2.1 per cent over the 2026 to 2028 period.
FAO projects several years of budget deficits before balance reached in 2028-29
Following a budget deficit of $5.9 billion in 2022-23, the FAO projects that Ontario’s budget deficit will temporarily improve to $0.9 billion in 2023-24, smaller than the government’s projection of a $3.0 billion deficit in the 2024 Ontario Budget. The FAO expects the budget deficit will widen to $6.4 billion in 2024-25 and improve gradually over the outlook, reaching a surplus of $1.8 billion in 2028-29, two years later than the government’s plan for a budget surplus.
Revenue growth expected to moderate after strong gains during the pandemic
The FAO projects revenue growth will average 3.8 per cent per year from 2022-23 to 2028-29, slower than the 7.3 per cent average annual growth recorded during the COVID-19 pandemic. The FAO projects $1.0 billion less revenue in 2023-24 compared to the government’s revenue projection and $3.9 billion lower by 2026-27, mainly reflecting the FAO’s less optimistic outlook for corporate tax revenue.
FAO expects a slower pace of spending growth over the outlook
The FAO projects that spending will grow at an average annual rate of 3.1 per cent from 2022-23 to 2028-29, slower than the 5.6 per cent average annual growth rate recorded over the previous six years from 2016-17 to 2022-23. The government’s total spending plan in the 2024 Ontario Budget is similar to the FAO’s projection, with the largest difference in 2023-24, where the government’s spending forecast is $3.0 billion higher than the FAO’s projection.
Fiscal sustainability indicators projected to remain below the government’s targets
The FAO projects that the Province’s debt burden, measured by the net debt-to-GDP ratio, will remain stable around 38 per cent, before declining to 36.6 per cent by 2028-29 as GDP grows faster than the increase in net debt. The ratio of interest on debt-to-revenue, an indicator of budgetary flexibility, is projected to increase from 6.4 per cent in 2022-23 to 7.0 per cent in 2026-27, before declining slightly to 6.7 per cent by 2028-29. Both fiscal sustainability indicators are expected to remain below the government’s 2024 Ontario Budget targets of 40.0 per cent for the net debt-to-GDP ratio and 7.5 per cent for the interest on debt-to-revenue ratio.
Risks to the economic and budget outlook
Ontario’s economic and revenue growth could be negatively affected by ongoing geopolitical risks or if inflation and interest rates remain higher for longer than anticipated. While the FAO has incorporated lower expected population growth in its projections based on the federal government’s announced limits on temporary residents over the next three years, the eventual impact on Ontario’s economy depends on the federal government’s final targets and implementation.
The FAO’s spending outlook does not include the estimated cost of some recently announced spending measures, including the Building Ontario Fund; the upload to the Province of the Gardiner Expressway, Don Valley Parkway and Ottawa Road 174; provincial support to Honda to build new electric vehicle and battery plants; and the refurbishment of the Ontario Legislative building. In addition, the FAO may revise its estimates for the financial impact of several recent federal government policy announcements (e.g., the taxation of capital gains, Canada Student Grants and the Canada Disability Benefit) to the Province’s spending and revenue outlooks as more information becomes available.
2. Economic Outlook
Global economic growth continues to moderate
After the pace of global economic growth moderated from 3.5 per cent in 2022 to 3.2 per cent in 2023, the International Monetary Fund (IMF) projects that growth will hold steady at 3.2 per cent in 2024 and 2025 as inflation continues to slow without a downturn in economic activity.[1] Growth in emerging market and developing economies is projected to stabilize at 4.2 per cent in 2024 and 2025, marginally slower than the 4.3 per cent growth observed in 2023, with output in the largest economies in Asia and Latin America expected to moderate. Growth in advanced economies is projected to improve slightly from 1.6 per cent in 2023 to 1.7 per cent in 2024, led by the strength of the United States economy.
Figure 2.1 Global economic growth projected to moderate versus pre-pandemic period
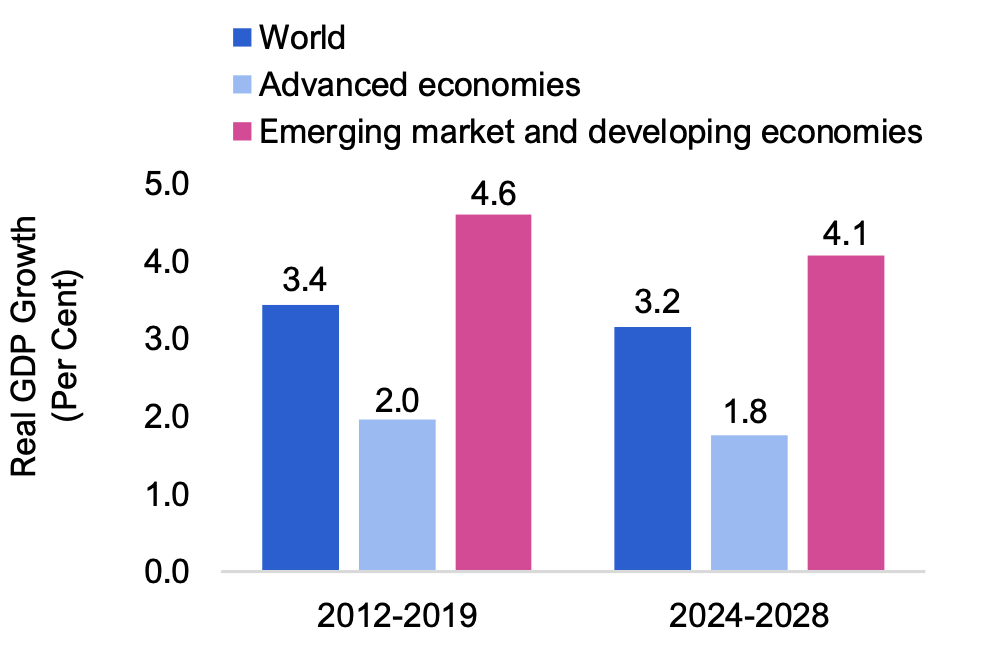
Source: International Monetary Fund.
Risks to the short-term global economic outlook are largely unchanged from the IMF’s January 2024 outlook. Volatility in commodity prices could reverse current progress in slowing inflation and delay central banks’ plans to lower policy interest rates. Growth in global trade remains subdued, complicated by geopolitical tensions, periodic shipping disruptions and extreme weather events.
Over the medium term, global economic growth is expected to average 3.2 per cent, slower than the pre-pandemic experience. Moderating growth is expected to be broad-based across most advanced and emerging market and developing economies, reflecting weak productivity growth and intensifying geopolitical fragmentation.
The United States, Ontario’s largest trading partner, is expected to record economic growth of 2.7 per cent in 2024 after a gain of 2.5 per cent in 2023, a significant upward revision[2] that reflects higher than expected immigration, ongoing job gains, strong government spending and robust wage growth. However, US inflation has also been higher than expected in early 2024, raising the possibility that the Federal Reserve will maintain higher interest rates for longer than previously anticipated. Economic growth in the United States is expected to slow to 1.9 per cent in 2025 as labour income growth and government spending moderate.
Ontario outlook: inflation and economic growth to slow
Figure 2.2 Ontario’s inflation rate projected to moderate over the next two years
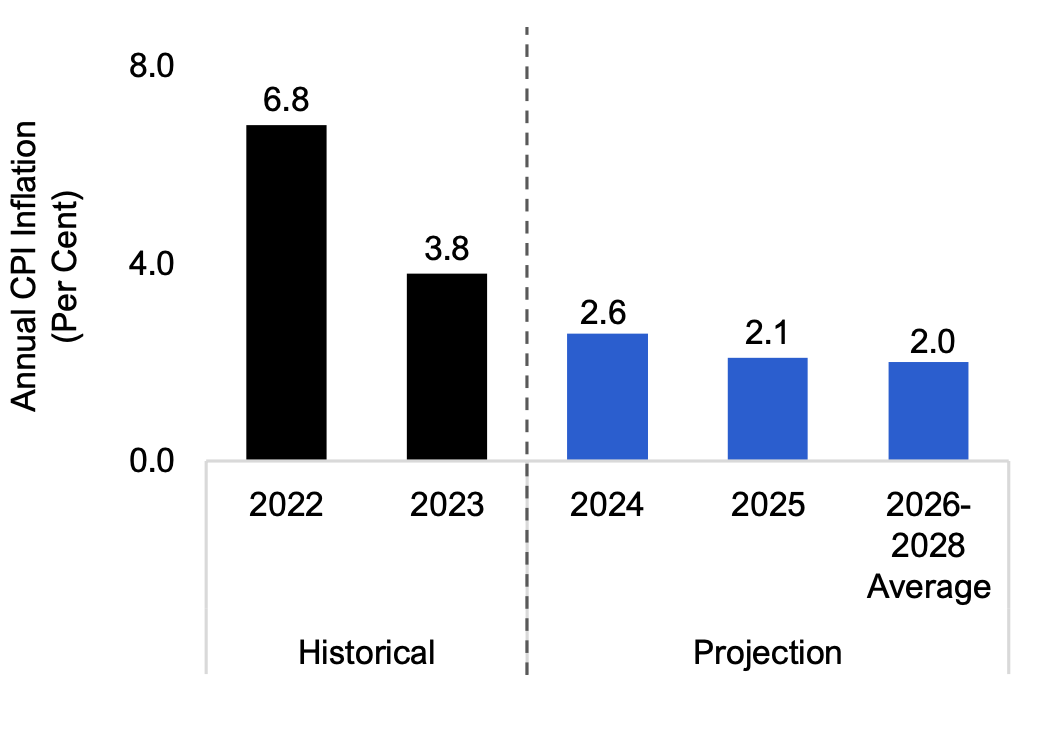
Source: Statistics Canada and FAO.
Ontario’s inflation rate[3] continued to trend down in early 2024, declining from 3.4 per cent in December 2023 to 2.6 per cent in March 2024. Food price inflation, which was the fastest growing component of Ontario’s consumer price index (CPI) in 2023,[4] cooled from 4.1 per cent in December 2023 to 2.3 per cent in March 2024, falling below the headline inflation rate for the first time since November 2021. However, shelter price inflation remained elevated at 5.5 per cent in March 2024, driven by high mortgage interest costs and rental prices.
Ontario’s average annual inflation rate is expected to remain above historical averages[5] in 2024 at 2.6 per cent, before moderating to an average of two per cent over the rest of the outlook as lower interest rates help relieve mortgage interest costs and price inflation eases for most CPI components.
Figure 2.3 Short-term interest rates to remain high in 2024
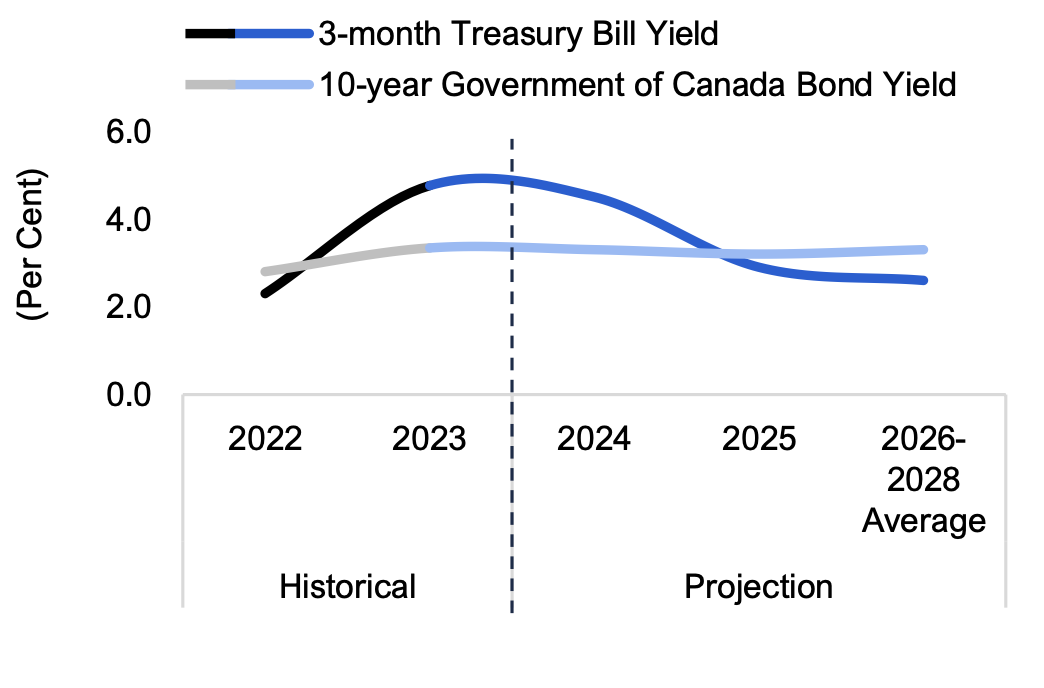
Source: Statistics Canada and FAO.
Since its last increase in July 2023, the Bank of Canada has maintained its policy interest rate at 5.00 per cent. Inflation expectations of consumers and businesses are moderating,[6] but the Bank projects Canada’s CPI inflation to remain close to three per cent in the near term as oil prices rise and shelter price inflation remains elevated.[7] Most financial market participants anticipate that the Bank will begin lowering its policy interest rate in mid-2024.[8]
In line with most private sector economists, the FAO projects that short-term interest rates will trend down in 2024 but remain higher than long-term rates. As inflation eases closer to the Bank’s two per cent target in 2025, short-term interest rates are projected to fall below long-term rates.
Ontario’s real GDP projected to extend slower pace of growth in 2024
Figure 2.4 Ontario’s real GDP growth projected to remain slow in 2024
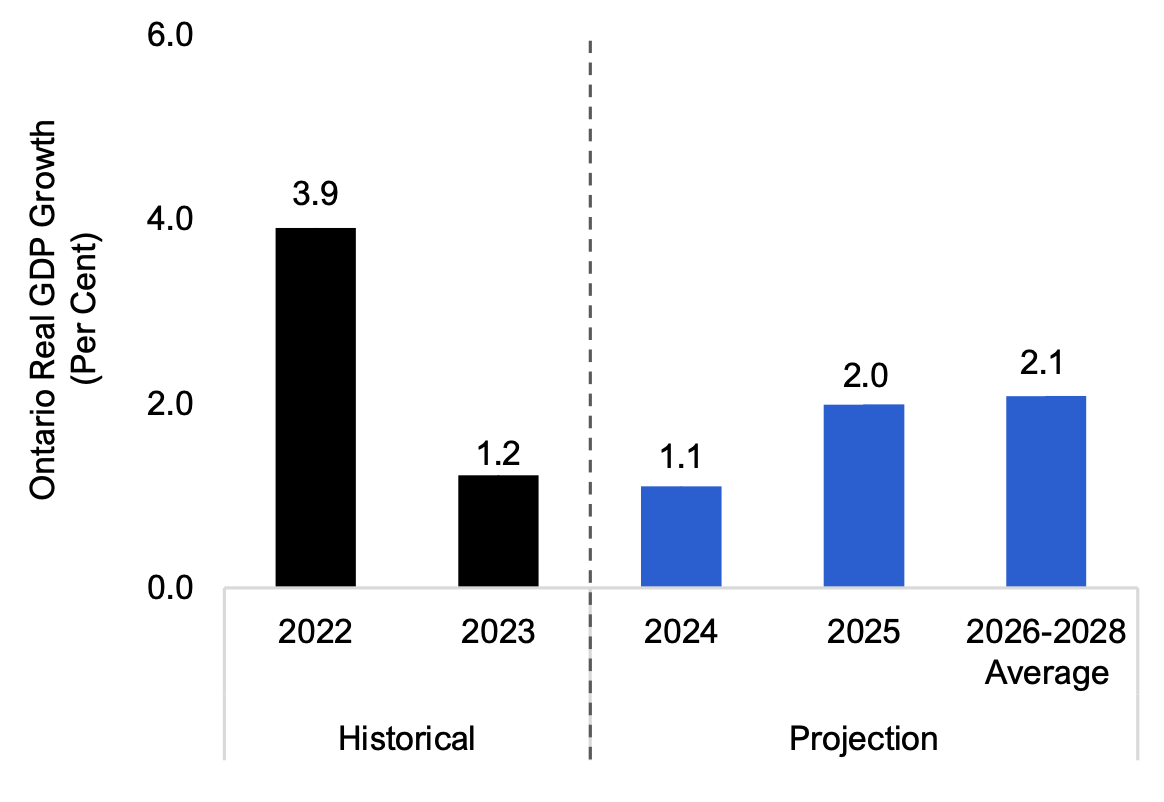
Source: Ontario Economic Accounts and FAO.
Ontario’s real GDP expanded by 1.2 per cent in 2023, sharply slower than the 3.9 per cent increase recorded in 2022. This slowdown was largely driven by a moderation in household spending from record growth of 7.1 per cent in 2022 to 1.8 per cent in 2023, reflecting the impact of higher interest rates. High borrowing costs also discouraged housing starts and home resales, and prompted businesses to scale back investment plans. As a result, residential investment (-7.9 per cent) and business investment in machinery and equipment (-13.3 per cent) both declined in 2023.
Ontario’s economic growth is projected to slow modestly to 1.1 per cent in 2024, reflecting the ongoing impact of higher interest rates on household spending and business investment. Ontario’s trade activity is also expected to slow in 2024, after real international exports surged by 9.1 per cent in 2023, the fastest gain since 2010.
As inflation cools and interest rates fall over the outlook, Ontario’s real GDP growth is projected to improve to 2.0 per cent in 2025 and average 2.1 per cent over the 2026 to 2028 period. Residential investment is expected to rebound over the next two years as lower interest rates and government plans[9] encourage housing sales and construction activity, while ongoing population growth and resilient consumer spending in the United States are expected to support Ontario’s exports. However, several downside risks to the outlook could result in a slower pace of economic growth – see discussion in Chapter 6.
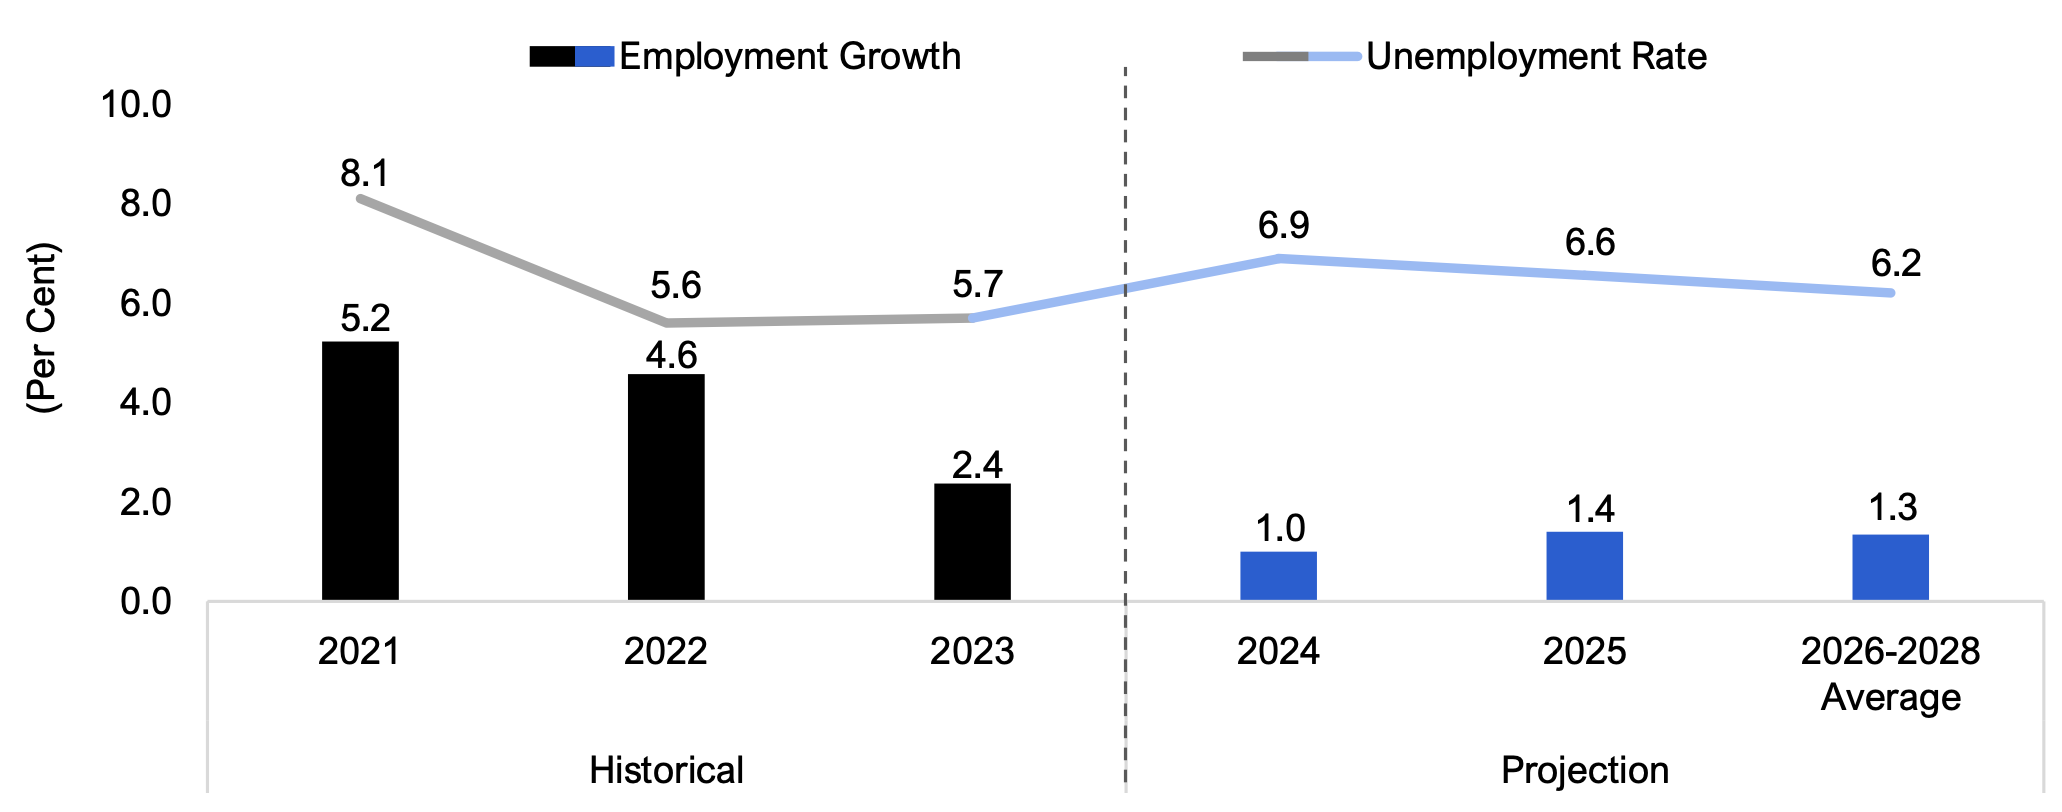
Ontario’s job growth expected to slow further in 2024
After employment increased by 2.4 per cent in 2023, Ontario is expected to record slower job creation of 1.0 per cent in 2024 as the province’s economy grows at a weak pace. The annual unemployment rate is projected to increase from 5.7 per cent in 2023 to 6.9 per cent in 2024 as the number of people entering the labour market grows faster than employment. The unemployment rate is projected to fall gradually over the remainder of the outlook and average 6.2 per cent during 2026 to 2028 as economic growth recovers.
Figure 2.5 Unemployment rate expected to rise in 2024
Source: Statistics Canada and FAO
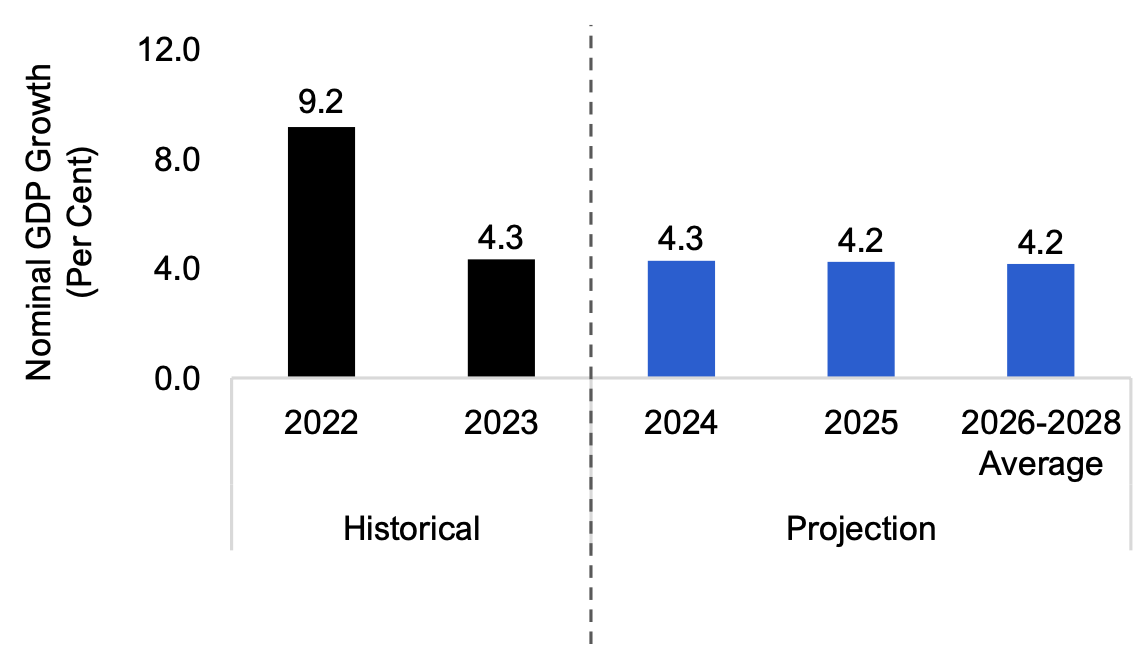
Ontario’s nominal GDP growth projected to remain stable
Figure 2.6 Ontario’s nominal GDP growth to maintain current pace over the outlook
Source: Ontario Economic Accounts and FAO.
Ontario’s nominal GDP, which provides a broad measure of the tax base, expanded by 4.3 per cent in 2023, less than half the 9.2 per cent growth recorded in 2022. Labour income growth in 2023 was 6.5 per cent as average hourly wages grew above inflation,[10] while corporate profits declined by 13.7 per cent, the largest annual decline since 2009.
Nominal GDP is projected to grow at 4.3 per cent in 2024 as a softening labour market eases wage pressures and corporate profits rebound. Over the 2026 to 2028 period, nominal GDP growth is expected to average 4.2 per cent annually, supported by moderate job gains and lower interest rates.
3. Budget and Debt Outlook
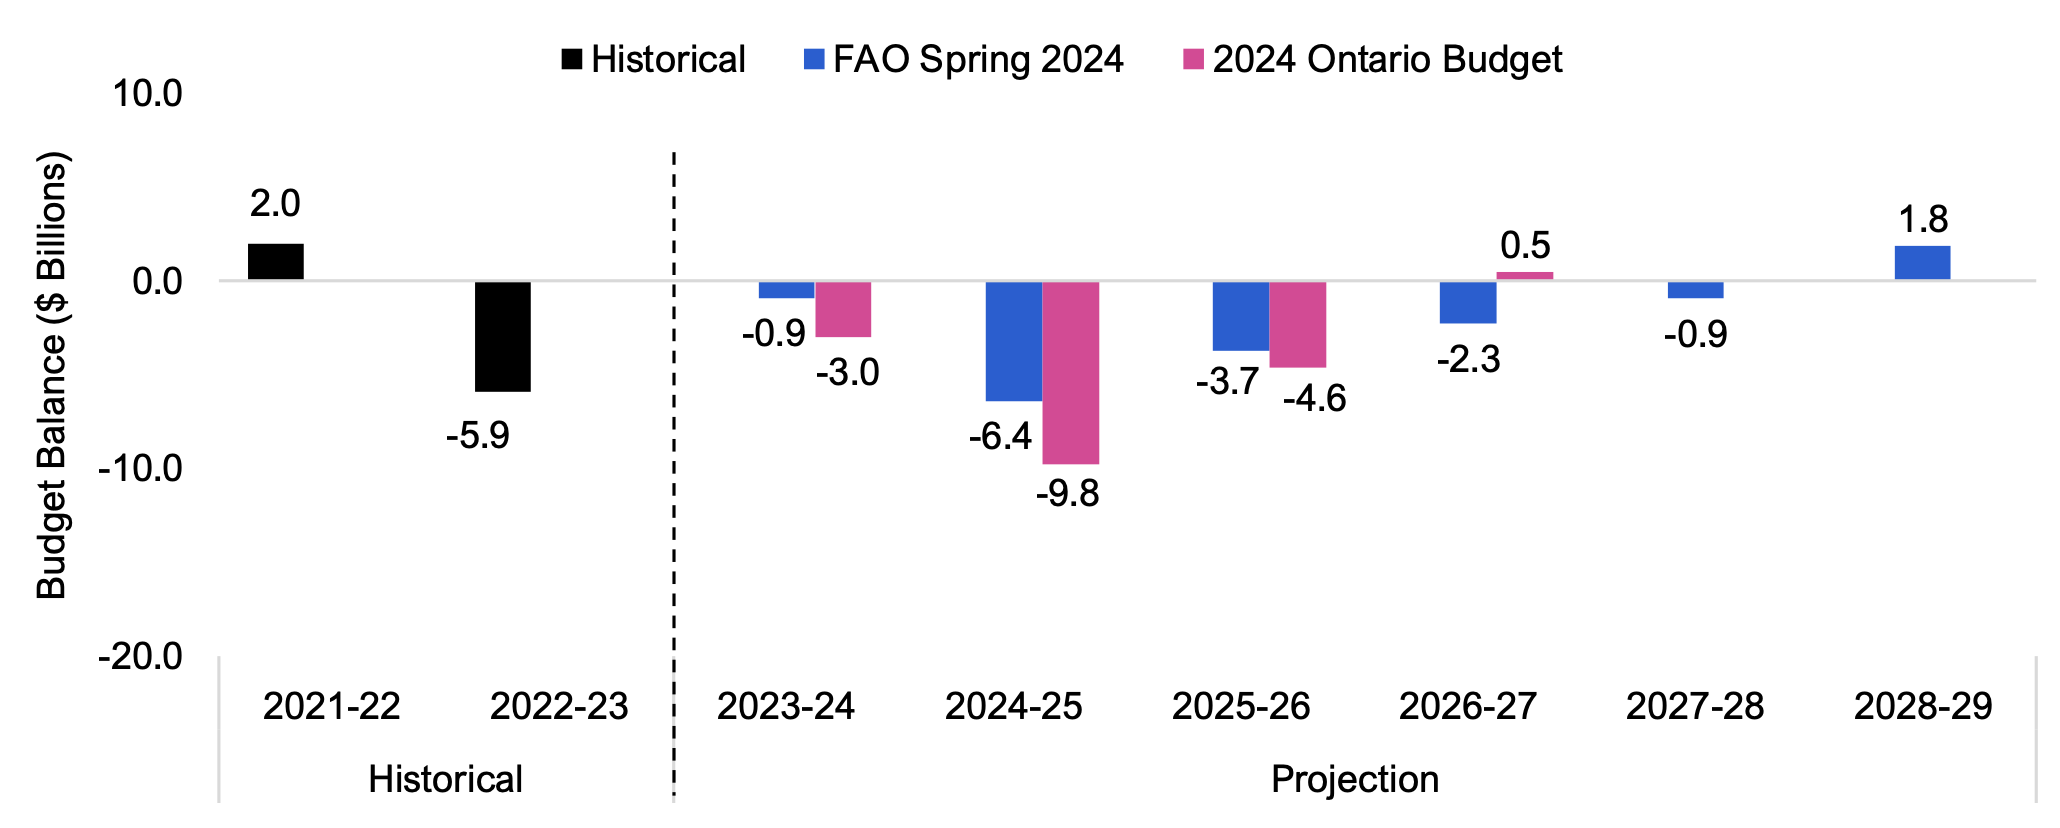
FAO’s budget projection
Following a budget deficit of $5.9 billion in 2022-23, the FAO projects that Ontario’s budget deficit will temporarily improve to $0.9 billion in 2023-24 before widening to $6.4 billion in 2024-25. Beyond 2024-25, the budget outlook is expected to improve as revenue gains outpace the growth in spending under current government policies and announced commitments. The FAO projects that the Province will record a budget surplus of $1.8 billion in 2028-29, two years later than the government’s plan for a budget surplus in the 2024 Ontario Budget.
Figure 3.1 FAO projects budget deficits until 2028-29
Source: Ontario Public Accounts, 2024 Ontario Budget and FAO
The FAO’s 2023-24 budget deficit projection of $0.9 billion is smaller than the government’s $3.0 billion projected deficit in the 2024 Ontario Budget. The FAO’s $2.1 billion smaller projected budget deficit for 2023-24 is comprised of:
- $1.0 billion in lower projected revenue; and
- $3.0 billion in lower projected spending.
By 2026-27, the last year of the Province’s outlook in the 2024 budget, the government projects a $0.5 billion budget surplus. In contrast, the FAO expects Ontario to record a deficit of $2.3 billion. The FAO’s $2.8 billion larger projected budget deficit for 2026-27 is comprised of:
- $3.9 billion in lower projected revenue;
- $0.8 billion in higher projected spending; and
- the exclusion of the government’s $2.0 billion budget reserve.
The FAO’s budget outlook is based on current government policies and announced commitments. If the government makes future policy announcements, the FAO’s budget projection would change. In addition, there are positive and negative risks that could materially impact the FAO’s economic and budget projections – see Chapter 6 for a discussion.
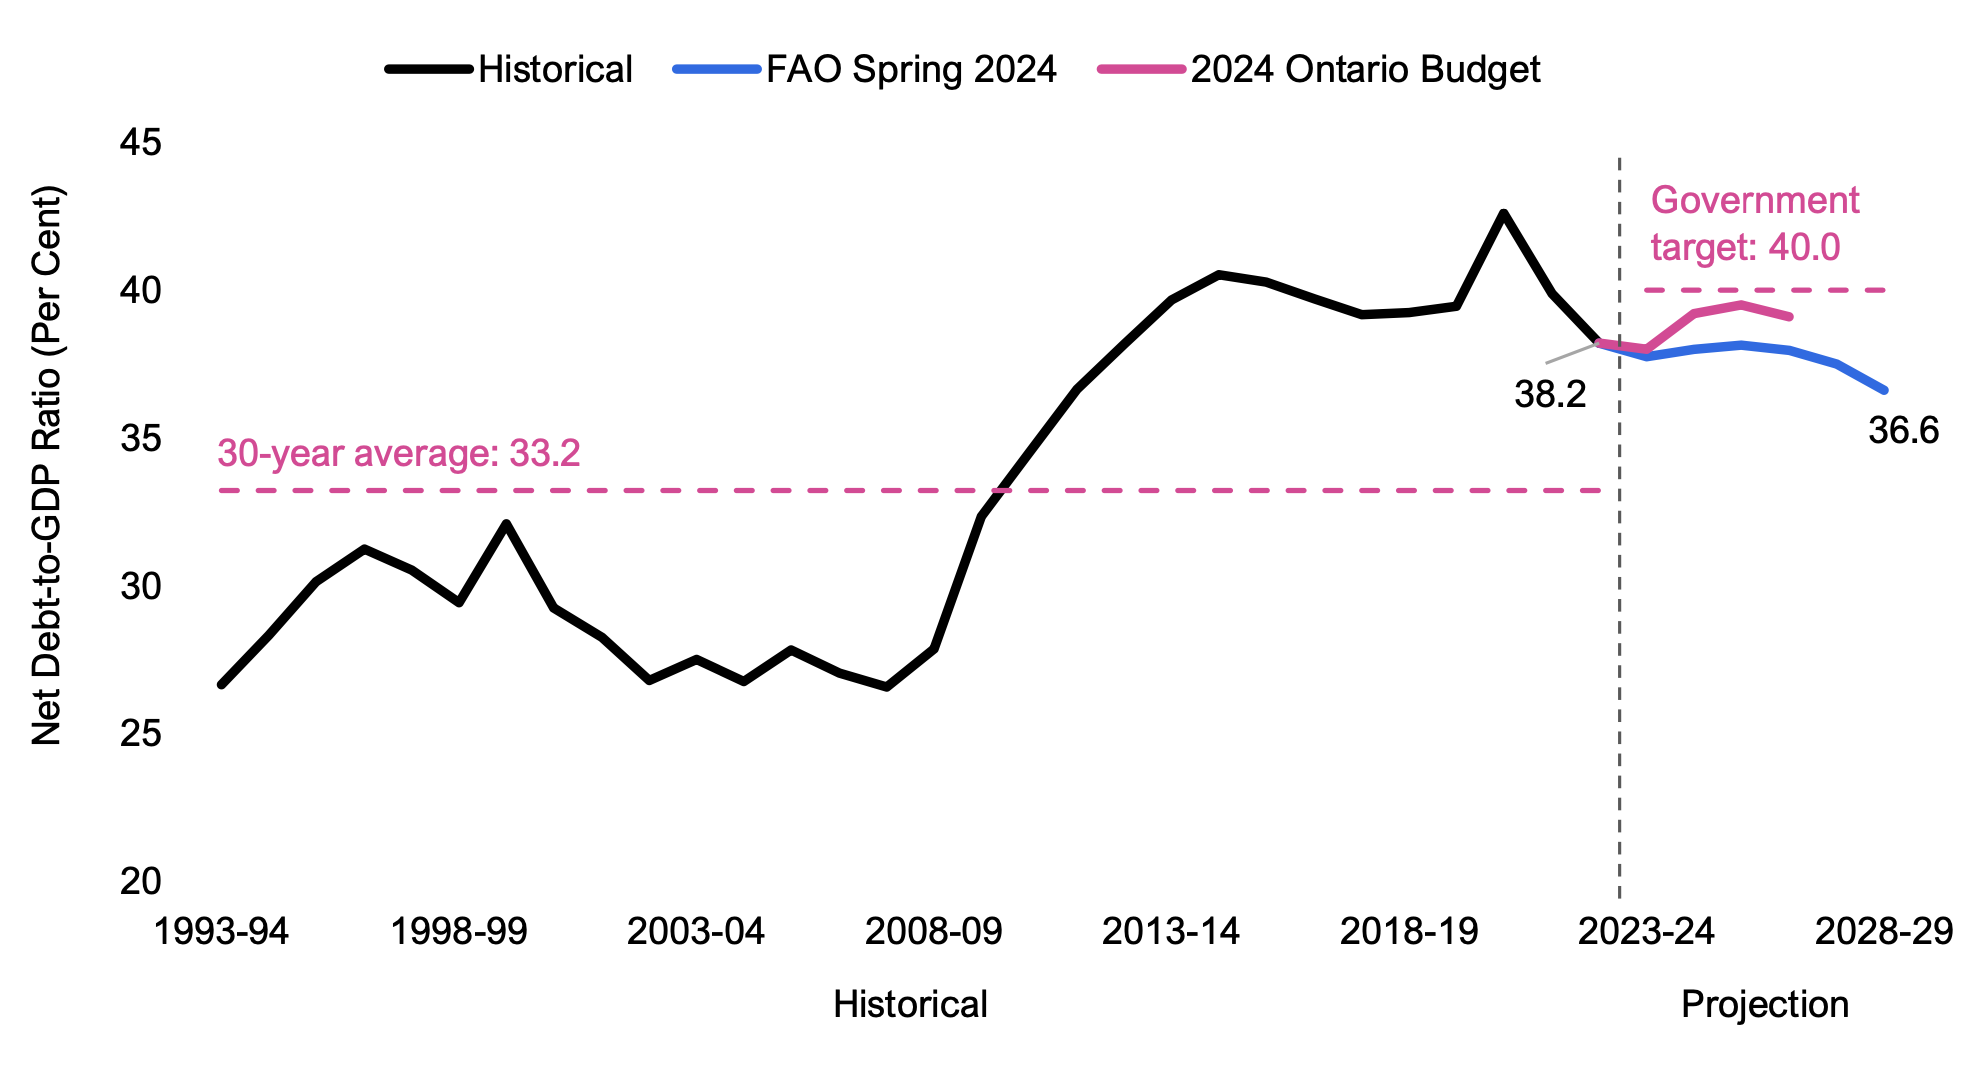
Ontario’s fiscal sustainability indicators
To assess Ontario’s fiscal sustainability, the FAO evaluates the projected trends in the net debt-to-GDP ratio and interest on debt as a share of revenue.[11] Significant and prolonged deterioration in these indicators over time could raise concerns about the government’s ability to deliver on its budgetary commitments.
Net debt as a share of GDP provides information on the government’s ability to raise funds to service its debt obligations. The FAO projects that the Province’s net debt-to-GDP ratio will remain stable around 38 per cent, before declining to 36.6 per cent by 2028-29 as GDP grows faster than the increase in net debt. Over the projection, the Province’s net debt-to-GDP ratio is expected to remain below the government’s target in the 2024 Ontario Budget of 40.0 per cent but above the 30-year historical average of 33.2 per cent.
Figure 3.2 Ontario’s net debt-to-GDP ratio is projected to improve
Source: Ontario Public Accounts, Ontario Economic Accounts, 2024 Ontario Budget and FAO
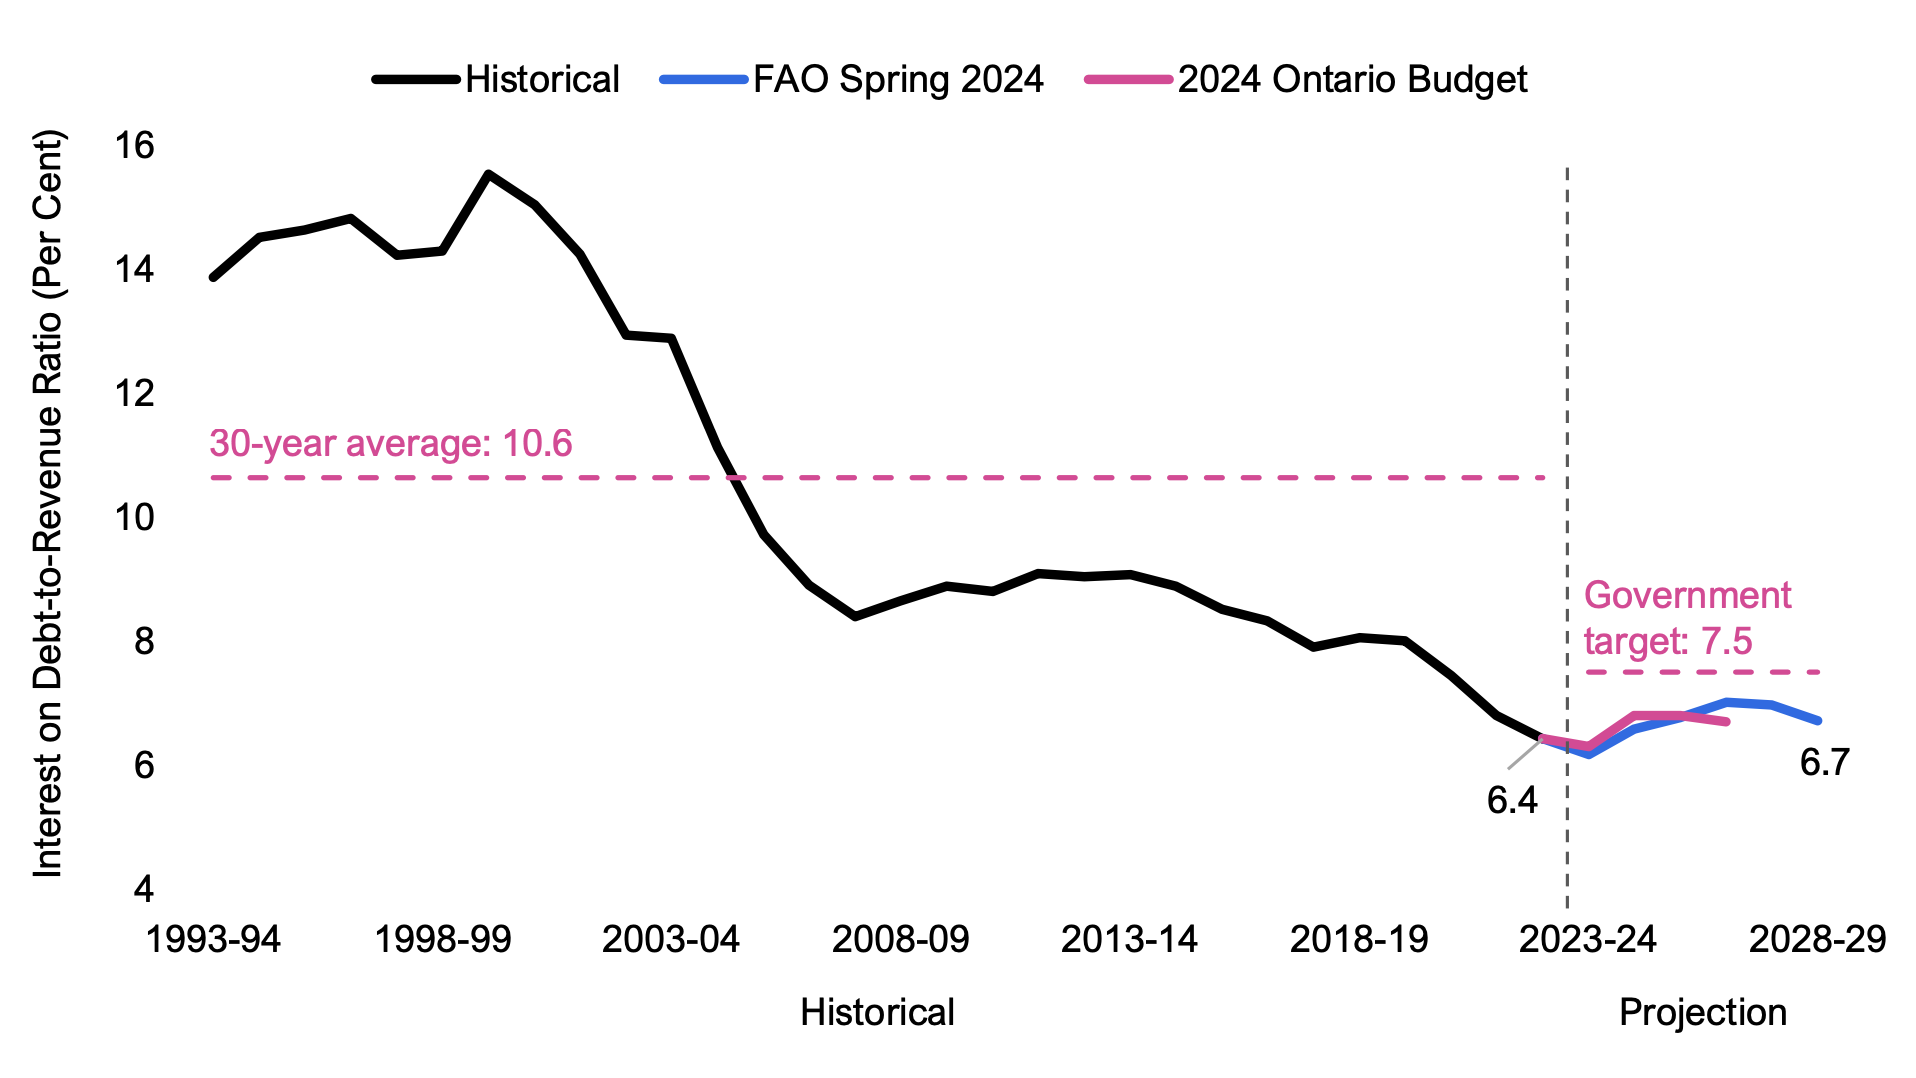
The ratio of interest on debt-to-revenue is an indicator of budgetary flexibility – a higher ratio indicates that the government has a smaller share of revenue available to spend on programs. Ontario’s debt interest payments as a share of revenue are projected to increase from 6.4 per cent in 2022-23 to 7.0 per cent by 2026-27, before declining slightly to 6.7 per cent by 2028-29, as Ontario is projected to return to a budget surplus by 2028-29. Over the projection, the Province’s interest on debt-to-revenue ratio is expected to remain below the government’s target in the 2024 Ontario Budget of 7.5 per cent and below the 30-year historical average of 10.6 per cent.
Figure 3.3 Ontario’s interest on debt-to-revenue ratio is projected to deteriorate slightly
Source: Ontario Public Accounts, 2024 Ontario Budget and FAO
4. Revenue Outlook
Overview
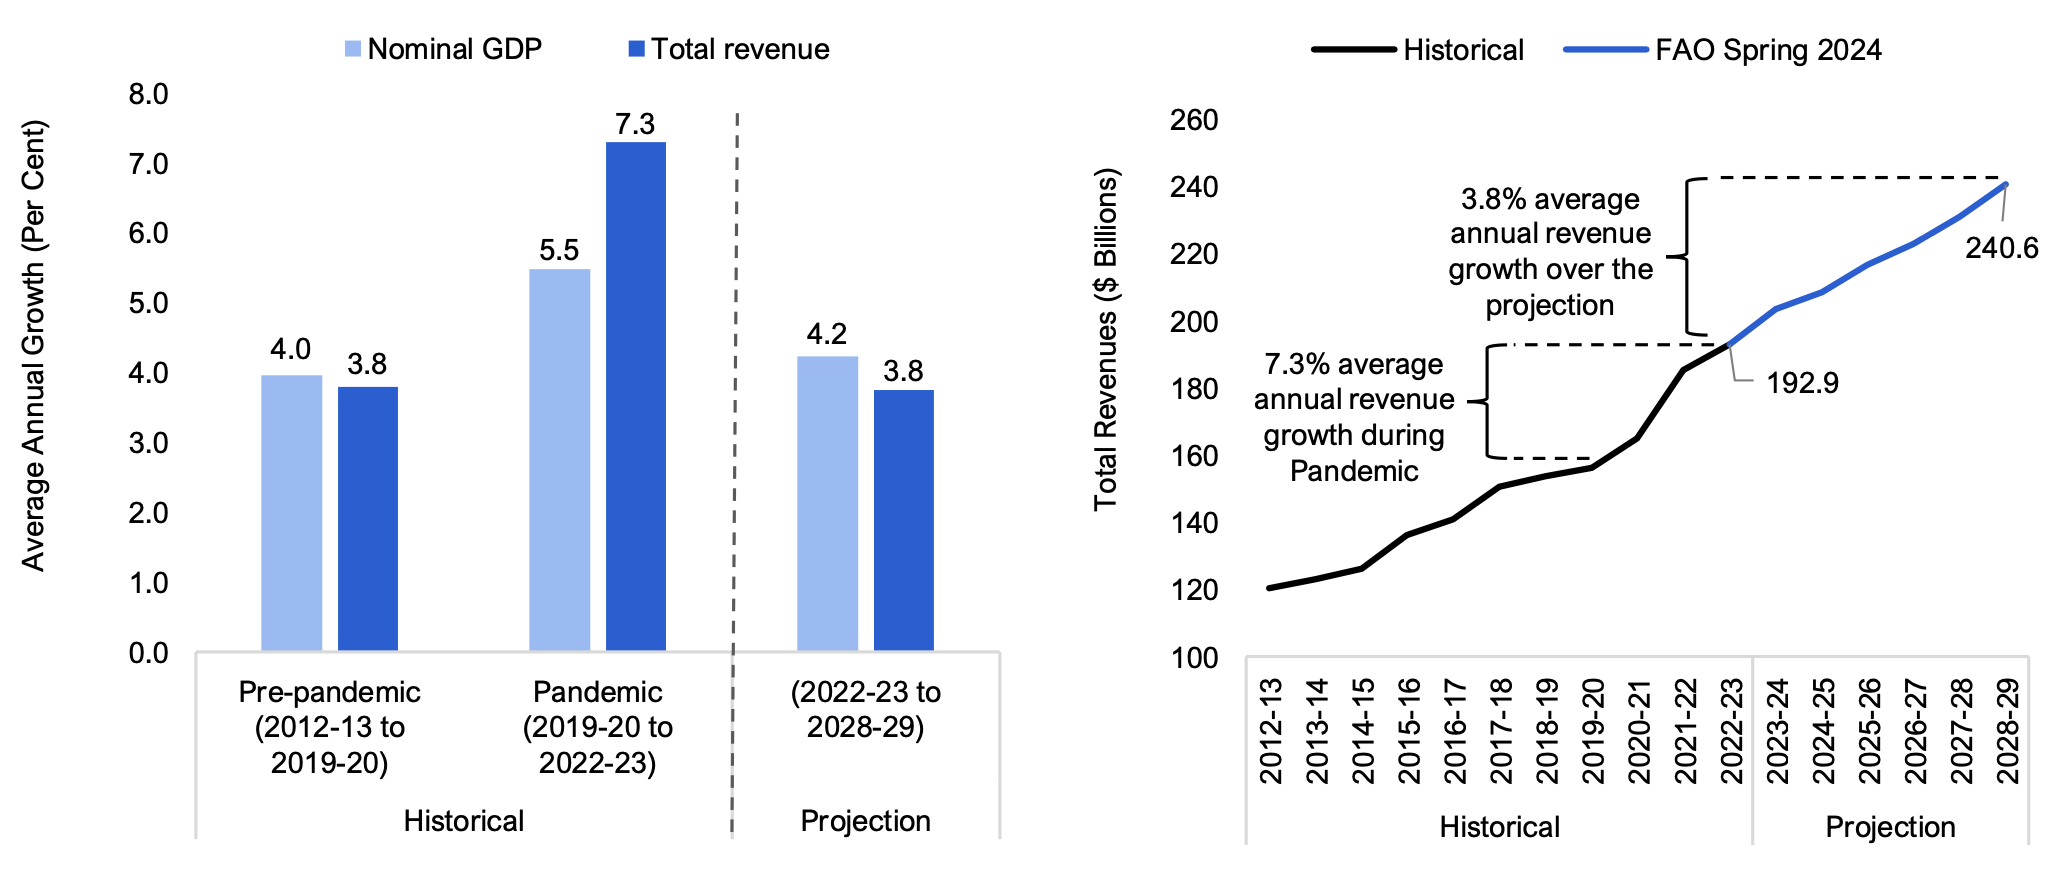
The FAO projects revenue growth will average 3.8 per cent per year over the projection as revenues grow from $192.9 billion in 2022-23 to $240.6 billion in 2028-29. Growth in revenues is expected to be slower than the 7.3 per cent average annual growth recorded during the COVID-19 pandemic. The moderation in revenue growth reflects the FAO's expectation that revenue gains will more closely align with underlying economic activity, similar to the experience prior to the pandemic.
Figure 4.1 Ontario’s revenue growth to moderate in line with economic activity
Source: Statistics Canada, Ontario Public Accounts and FAO
The 3.8 per cent average annual growth in total revenues from 2022-23 to 2028-29 is comprised of the following:
- Tax revenue growth of 3.7 per cent per year, including personal income tax revenue growth of 6.3 per cent, based on the FAO’s outlook for labour income; sales tax revenue growth of 4.1 per cent, driven by the projected increase in consumer spending; and an average annual decline in corporations tax revenue of -1.4 per cent, reflecting declines in corporate profits in 2022 and 2023, which is expected to limit corporate taxable income growth.
- Federal government transfer revenue growth of 4.6 per cent annually, based on existing agreements with the federal government, including Canada Health Transfer growth of 5.9 per cent and Canada Social Transfer growth of 3.1 per cent.
- Income from government business enterprises averaging 5.4 per cent per year and other non-tax revenue growth of 1.7 per cent per year.
Comparison to FAO’s Winter 2024 revenue forecast
Compared to the Winter 2024 EBO, the FAO’s revenue projection has increased by a cumulative $6.7 billion over the 2023-24 to 2027-28 period. Despite the cumulative increase of $6.7 billion, in 2026-27 and 2027-28, the FAO’s forecast is $2.4 and $2.9 billion below the Winter projection, respectively.
The cumulative difference in the forecast over the 2023-24 to 2027-28 period is comprised of:
- $8.5 billion in higher projected personal income tax and $10.1 billion in higher projected sales tax revenue. These higher forecasts reflect new information from 2022 tax results.
- $5.8 billion in lower projected corporations tax revenue based on new information from 2022 tax returns and an expectation of weaker revenues reflecting sharp declines in corporate profits in 2022 and 2023, which is expected to limit corporate taxable income.
- $0.4 billion in lower projected transfers from the Government of Canada, largely reflecting revised projections for Canada-wide Early Learning and Child Care funding.
- $1.5 billion in lower projected income from government business enterprises due to lower expected revenues from the Liquor Control Board of Ontario (LCBO), Ontario Power Generation, and Ontario Lottery and Gaming Corporation.
- $1.8 billion in lower other non-tax revenue, largely resulting from a reduction in projected college tuition fees from the federal cap on international student permits.
| Difference ($ billions) | 2023-24 | 2024-25 | 2025-26 | 2026-27 | 2027-28 | Total | ||
|---|---|---|---|---|---|---|---|---|
| Personal Income Tax | 2.3 | 2.0 | 1.4 | 1.2 | 1.6 | 8.5 | ||
| Sales Tax | 3.8 | 1.5 | 1.5 | 1.6 | 1.7 | 10.1 | ||
| Corporations Tax | -1.3 | 0.5 | -0.8 | -2.0 | -2.2 | -5.8 | ||
| All Other Taxes | 0.0 | -0.6 | -0.3 | -0.7 | -0.7 | -2.3 | ||
| Total Taxation Revenue | 4.8 | 3.3 | 1.8 | 0.1 | 0.4 | 10.5 | ||
| Transfers from Government of Canada | 0.0 | 0.4 | 0.6 | -0.3 | -1.2 | -0.4 | ||
| Income from Government Business Enterprises | 0.5 | 0.3 | -0.4 | -1.0 | -1.0 | -1.5 | ||
| Other Non-Tax Revenue | 1.1 | 0.2 | -0.8 | -1.3 | -1.1 | -1.8 | ||
| Total Revenue | 6.5 | 4.2 | 1.3 | -2.4 | -2.9 | 6.7 | ||
Comparison to government revenue projection
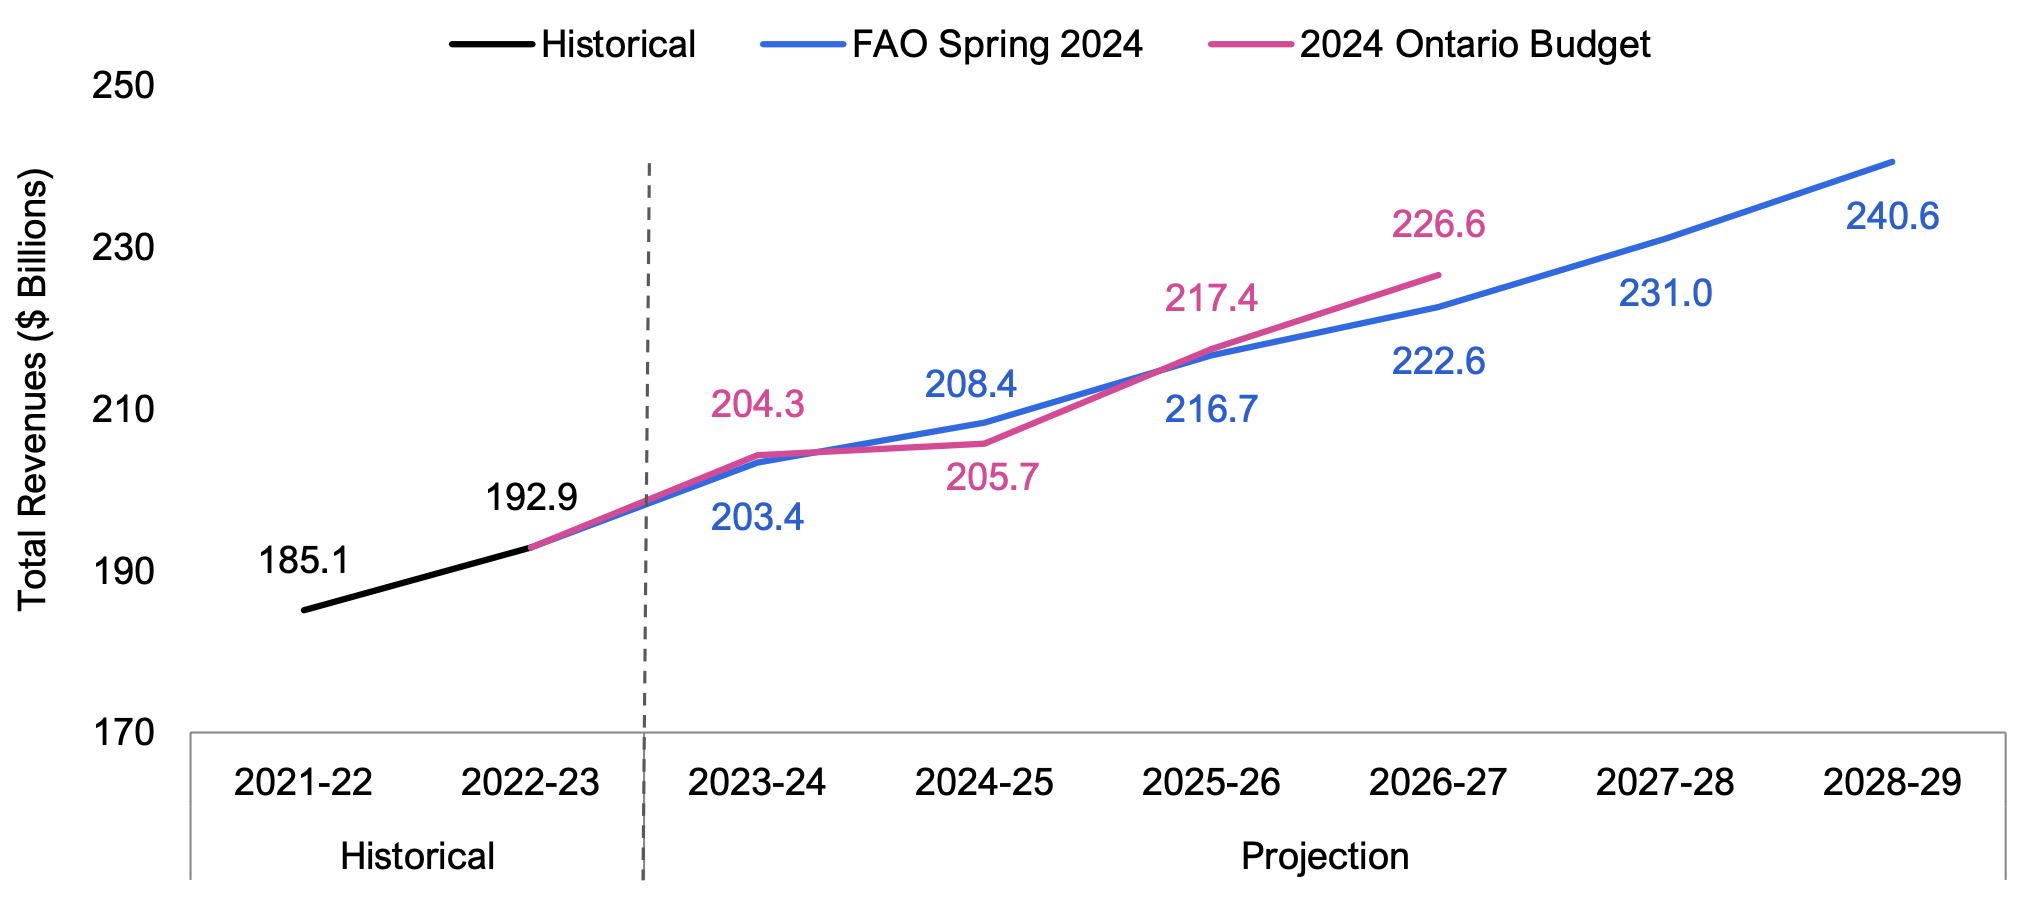
The FAO projects $1.0 billion less revenue in 2023-24 when compared to the government’s revenue projection in the 2024 Ontario Budget. By 2026-27, the last year presented in the 2024 budget, the FAO projects $3.9 billion less revenue. The differences result from the FAO’s lower tax revenue forecast, which is partially offset by the FAO’s higher other non-tax revenue forecast.
Figure 4.2 Comparison to 2024 Ontario Budget revenue projection ($ billions)
Source: Ontario Public Accounts, 2024 Ontario Budget and FAO
The FAO’s lower tax revenue forecast compared to the government’s outlook results from differences in the FAO’s economic outlook as well the FAO’s expectation that sharp declines in corporate profits in 2022 and 2023 will limit corporate taxable income over the outlook. The FAO’s higher other non-tax revenue forecast results from the FAO’s assumption that the federal cap on international student permits will have a more gradual impact on projected college tuition fees.
| Difference ($ billions) | 2023-24 | 2024-25 | 2025-26 | 2026-27 | Total | ||
|---|---|---|---|---|---|---|---|
| Personal Income Tax | 1.3 | 1.7 | 0.6 | -0.4 | 3.3 | ||
| Sales Tax | 0.0 | 0.0 | -0.1 | -0.3 | -0.4 | ||
| Corporations Tax | -2.2 | -0.6 | -2.2 | -4.2 | -9.3 | ||
| All Other Taxes | 0.2 | 0.3 | 0.4 | 0.5 | 1.3 | ||
| Total Taxation Revenue | -0.7 | 1.4 | -1.3 | -4.4 | -5.1 | ||
| Transfers from Government of Canada | -0.2 | 0.0 | 0.1 | 0.1 | 0.0 | ||
| Income from Government Business Enterprises | 0.0 | 0.0 | 0.0 | 0.0 | 0.0 | ||
| Other Non-Tax Revenue | 0.0 | 1.3 | 0.5 | 0.4 | 2.2 | ||
| Total Revenue | -1.0 | 2.7 | -0.8 | -3.9 | -3.0 | ||
5. Spending Outlook
Overview
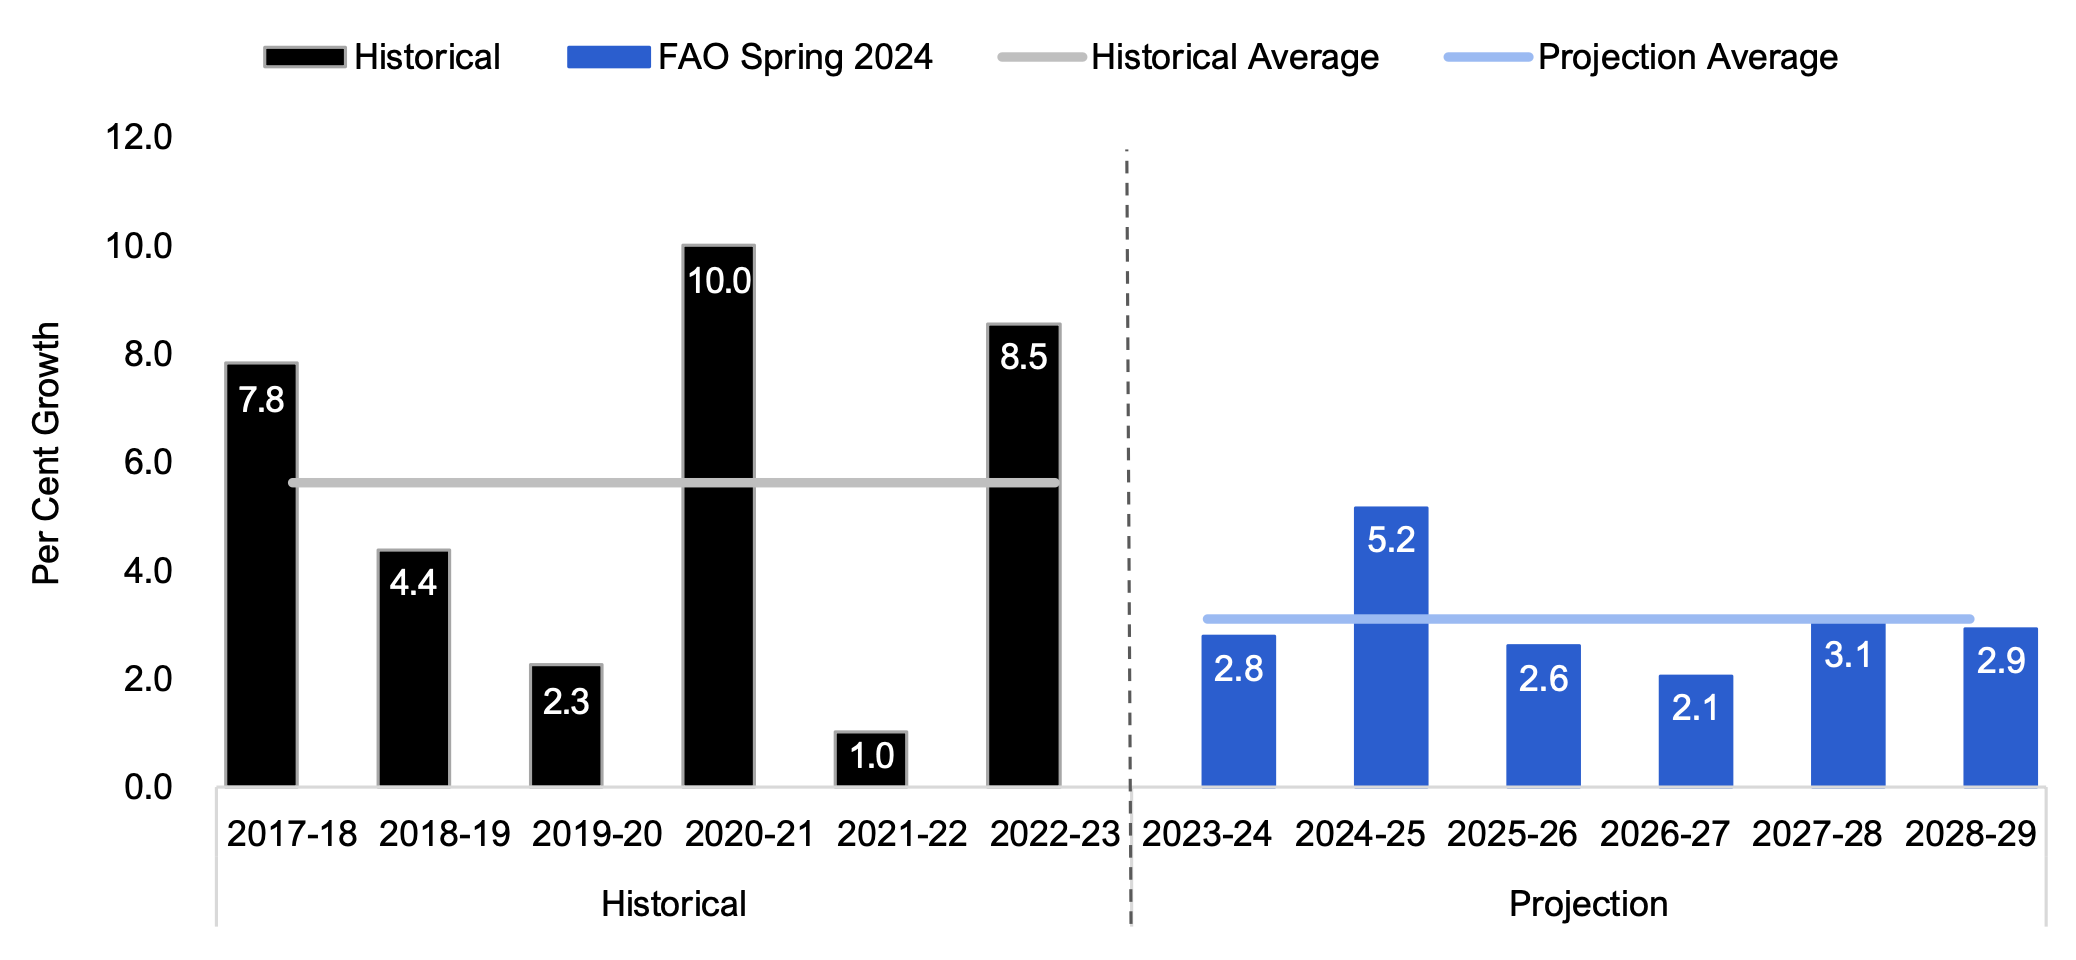
The FAO projects that spending will grow from $198.7 billion in 2022-23 to $238.7 billion 2028-29, representing an average annual growth rate of 3.1 per cent.[12] The FAO’s projected average annual growth rate for provincial spending is lower than the 5.6 per cent average annual growth rate recorded from 2016-17 to 2022-23, a period that included the introduction of significant new government programs, the material expansion of existing programs, higher spending in response to the COVID-19 pandemic, and one-time spending in 2022-23.[13] Going forward, based on the FAO’s analysis of current government policies and announced commitments, the spending growth rate is expected to moderate.
Figure 5.1 Provincial spending annual growth rate, actual and FAO projection, 2017-18 to 2028-29 (per cent)
Source: FAO analysis of the 2024 Ontario Budget and information provided by the Ministry of Finance.
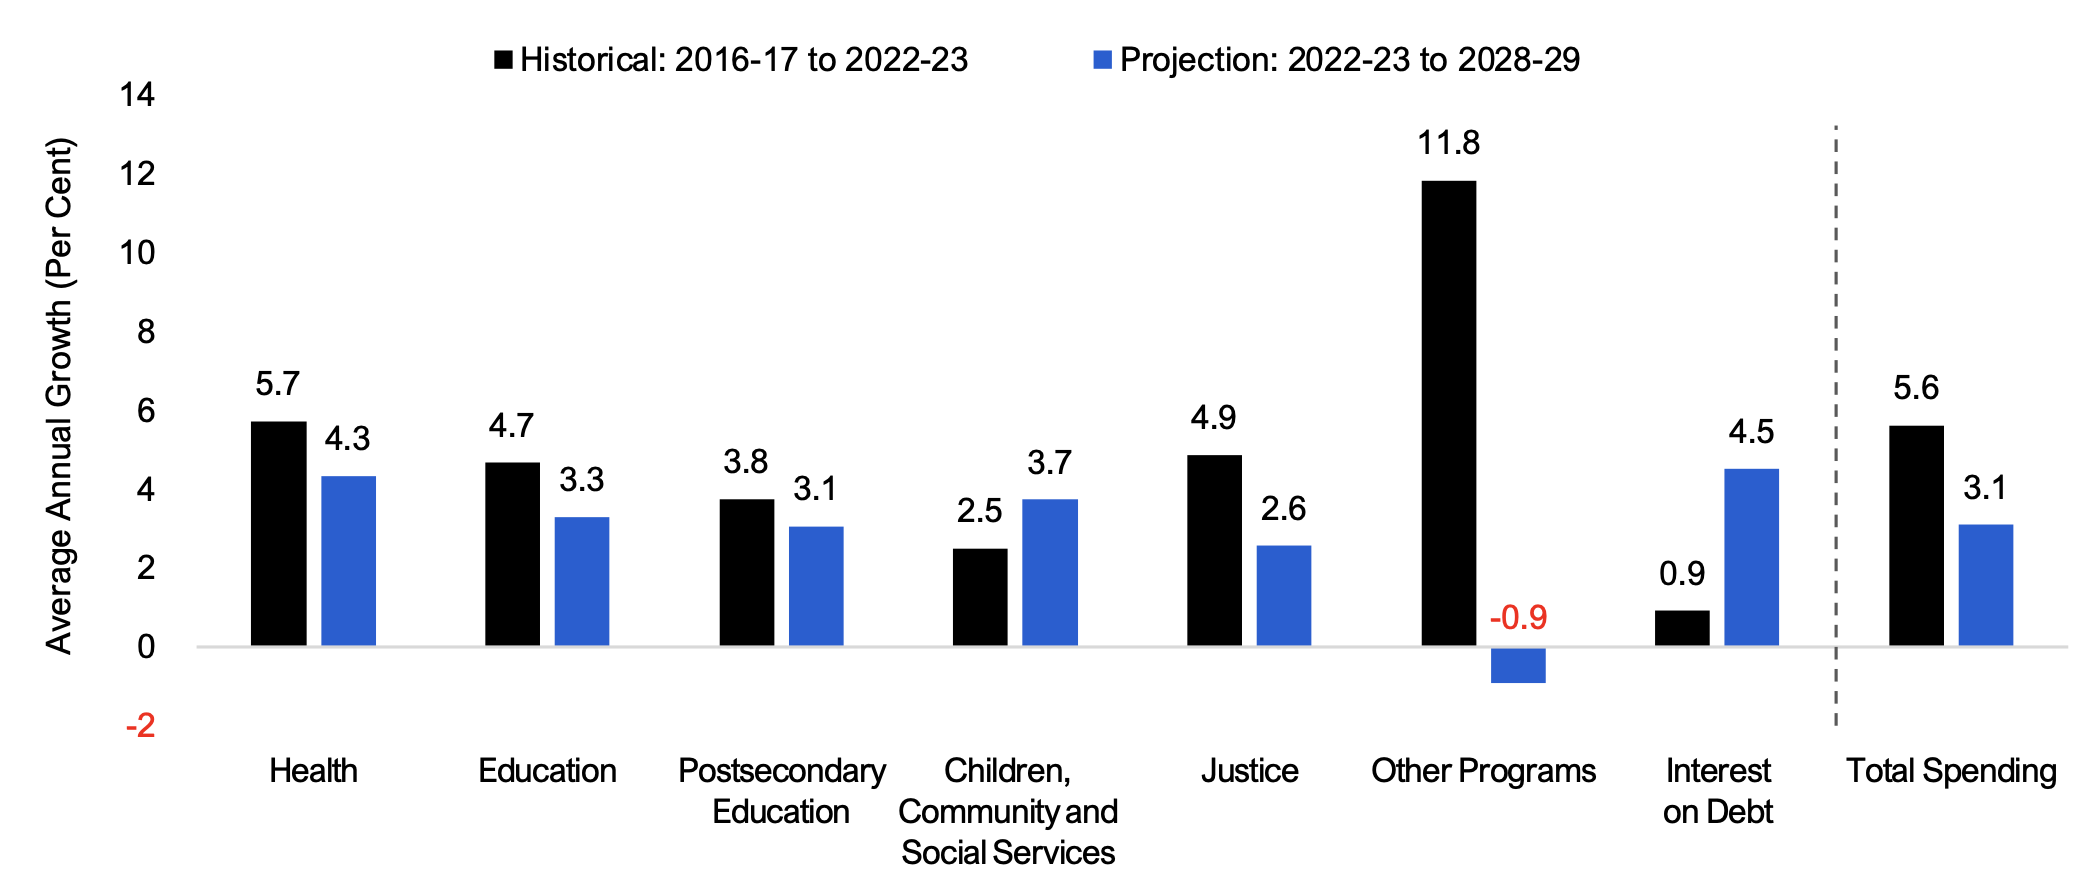
By sector, ‘other programs’ is expected to experience the most significant decrease in spending growth, from 11.8 per cent average annual growth (2016-17 to 2022-23) to a projected negative 0.9 per cent average annual growth (2022-23 to 2028-29). This is followed by the justice sector, from 4.9 per cent average annual growth (2016-17 to 2022-23) to a projected average annual growth rate of 2.6 per cent (2022-23 to 2028-29), the health sector (5.7 per cent to a projected 4.3 per cent) and the education sector (4.7 per cent to a projected 3.3 per cent).
In contrast, two sectors are expected to experience higher growth from 2022-23 to 2028-29 compared to the previous six-year period. Spending on interest on debt is expected to grow by an average of 4.5 per cent per year from 2022-23 to 2028-29 compared to an average of 0.9 per cent per year from 2016-17 to 2022-23, and spending on children, community and social services is expected to grow by an average of 3.7 per cent per year over the forecast compared to 2.5 per cent per year from 2016-17 to 2022-23.
Figure 5.2 FAO’s spending projection by sector, average annual growth (per cent)
Source: FAO analysis of the 2024 Ontario Budget and information provided by the Ministry of Finance.
Comparison to Winter 2024 EBO spending forecast
Compared to the Winter 2024 EBO, the FAO’s spending projection has increased by an average of $2.1 billion per year, for a cumulative total of $10.6 billion from 2023-24 to 2027-28, of which:
- $9.7 billion is due to new government policy measures, including:
- a projected $4.8 billion increase in health spending, due to increases to physician fees, Digital Health investments, new health care workforce investments, increases to the Long-Term Care construction funding subsidy and higher health capital spending;
- a projected $3.2 billion increase in ‘other programs’ spending, which includes $0.9 billion for the Building Faster Fund,[14] $1.0 billion for the Municipal Housing Infrastructure Program and $0.8 billion for the Housing-Enabling Water Systems Fund; and
- a projected $0.9 billion increase in postsecondary education spending, largely due to the Postsecondary Education Sustainability Fund; and
- $0.9 billion is due to updated cost estimates for existing programs and announced commitments. This includes updates from recent collective bargaining agreements, updated spending information for 2023-24,[15] and a decrease in Ontario’s projected population due to the federal government’s plans to reduce the number of temporary residents.
Comparison to government spending plan
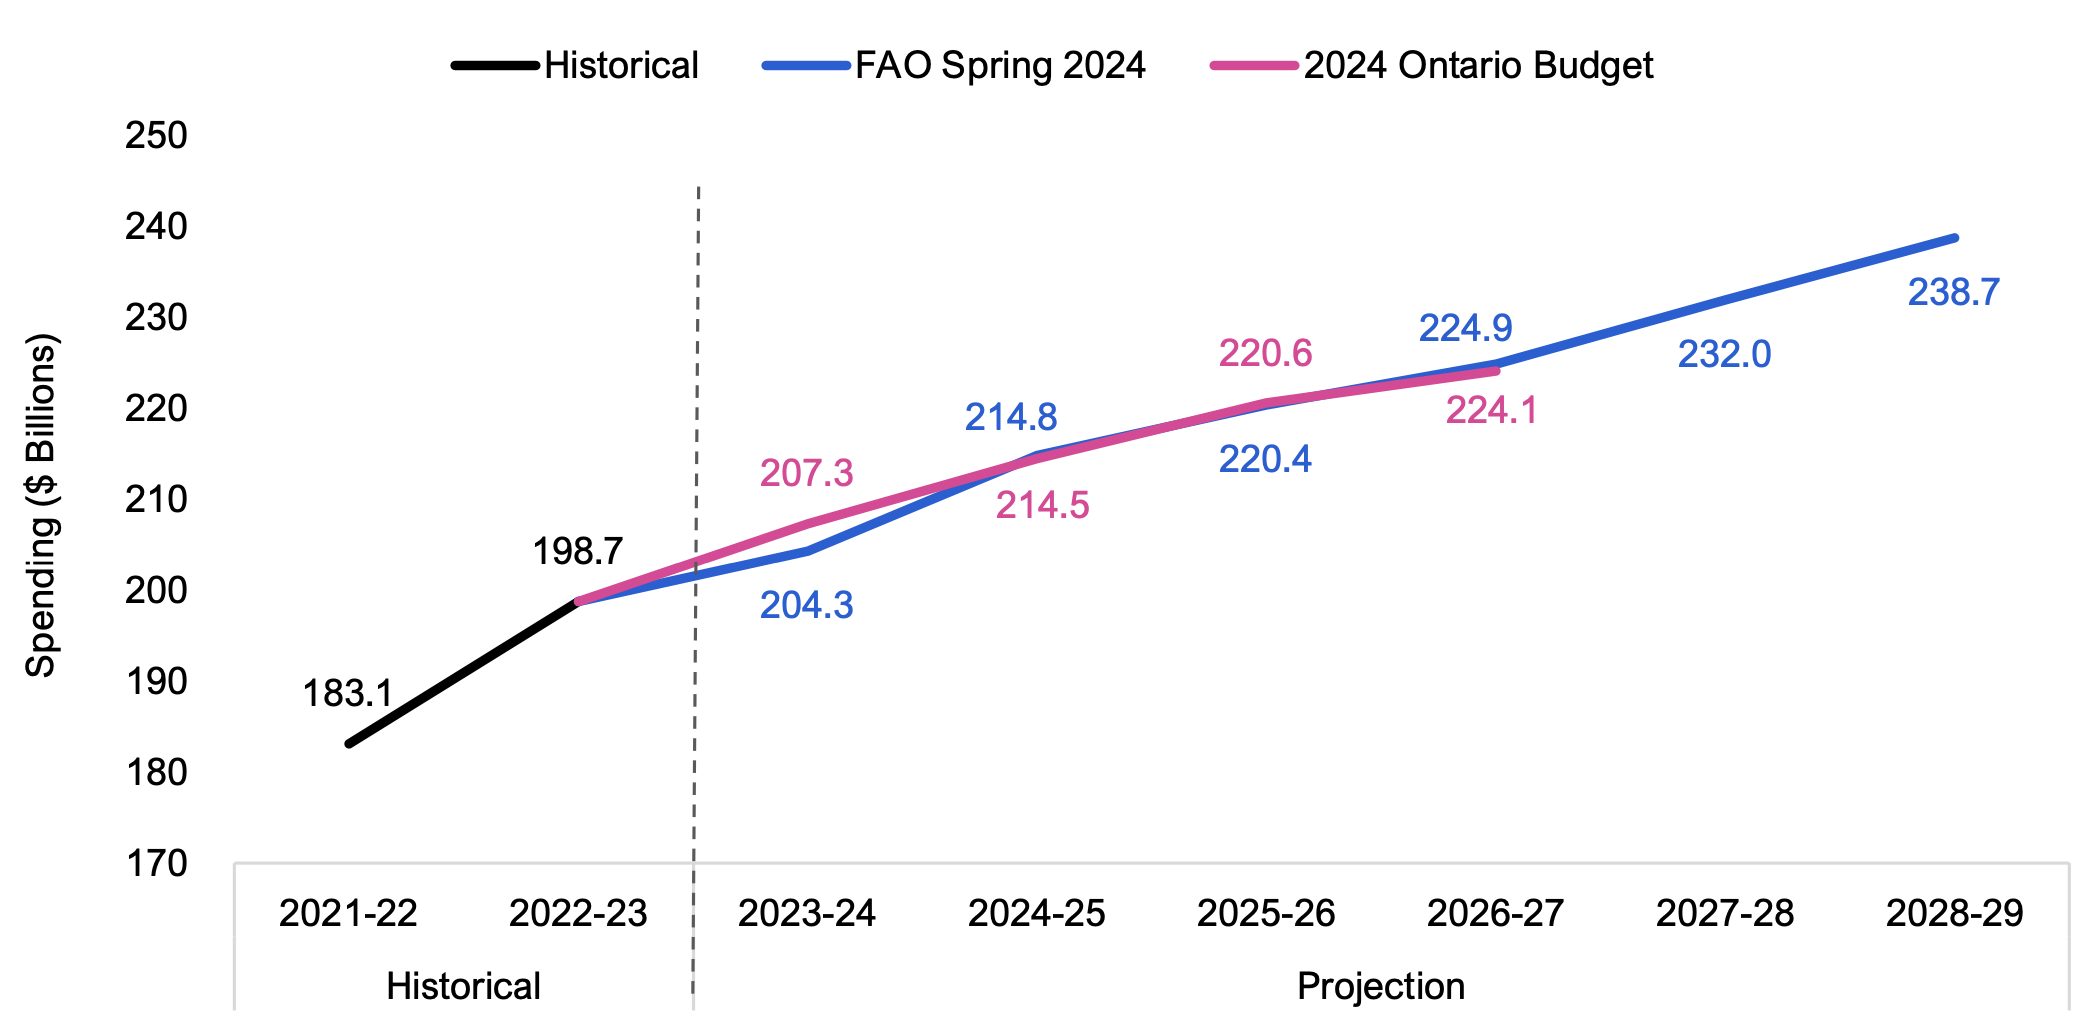
From 2023-24 to 2026-27, the government’s spending plan in the 2024 Ontario Budget is similar to the FAO’s projection, with the largest difference in 2023-24, where the government’s spending forecast is $3.0 billion above the FAO’s projection.
Figure 5.3 Spending projections, FAO compared to the government, $ billions
Source: FAO analysis of the 2024 Ontario Budget and information provided by the Ministry of Finance.
In 2023-24, the FAO projects that all sectors will spend less than estimated by the Province in the 2024 budget, led by health (-$1.6 billion), other programs (-$0.8 billion) and interest on debt (-$0.3 billion).
Over the three-year period from 2024-25 to 2026-27, the FAO’s total spending projection is similar to the government’s spending plan in the 2024 Ontario Budget. However, there are differences at the sector level. The FAO estimates that the government’s spending plan for all sectors excluding ‘other programs’ contains a combined funding shortfall of $13.1 billion over three years. Conversely, $12.1 billion in excess funds remains in ‘other programs’, largely due to the government’s contingency fund, which could be used to address the funding shortfalls in the other sectors. Alternatively, the government could use the excess funds to introduce new programs, enhance existing programs or address new spending pressures that could materialize (see next chapter for more details). The FAO does not include the contingency fund in its spending forecast as the purpose of the funds has not yet been announced.
| Difference ($ billions) | 2023-24 | 2024-25 | 2025-26 | 2026-27 | Total | ||
|---|---|---|---|---|---|---|---|
| Health | 1.6 | -1.0 | -1.7 | -3.4 | -4.5 | ||
| Education | 0.1 | -0.4 | -0.4 | -0.7 | -1.4 | ||
| Postsecondary Education | 0.1 | -0.7 | -0.7 | -0.7 | -2.0 | ||
| Children, Community and Social Services | 0.1 | -0.4 | -0.7 | -1.3 | -2.2 | ||
| Justice | 0.2 | -0.2 | -0.4 | -0.5 | -0.8 | ||
| Other Programs* | 0.8 | 2.2 | 3.9 | 6.1 | 12.9 | ||
| Interest on Debt | 0.3 | 0.2 | 0.1 | -0.4 | 0.2 | ||
| Total Spending Difference | 3.0 | -0.3 | 0.2 | -0.8 | 2.1 | ||
6. Risks to the Economic and Budget Outlook
Risks
There are a number of risks that could impact the FAO’s economic and budget outlook over the projection. These factors pose both downside and upside risks to the FAO’s outlook.
Global economic uncertainty
Multiple ongoing geopolitical conflicts and periodic shipping disruptions are downside risks to recovery in global trade and international investment. Key elections in over 50 countries in 2024[16] also adds uncertainty to future international relations and trade policies. A slower recovery in global trade and weaker economic activity in Ontario’s trade partners would potentially weigh on Ontario’s economic growth and dampen provincial revenues.
Persistent elevated inflation
Rising energy and commodity prices in recent months have renewed concerns that higher production and import costs could reignite inflation. If inflation proves more persistent than expected, the Bank of Canada may maintain its policy interest rate at a higher level for longer than anticipated, adding further financial stress to households and businesses. Slower than expected economic growth would negatively affect provincial revenues, while elevated inflation would apply upward pressure on program spending, including spending on public sector wages.
Slower population growth
In early 2024, the Government of Canada announced plans to limit the number of international student permits granted over the next two years[17] and to decrease the share of temporary residents relative to the total population over the next three years.[18] Based on these announcements, the FAO’s economic outlook incorporates lower population growth over the next several years, but the eventual impact on Ontario’s economy depends on the federal government’s final targets and implementation. A sharper than expected reduction in temporary residents could further weigh on economic activity. Weaker economic growth would adversely impact provincial revenues, while slower inflation and population growth could alleviate pressures on program spending.
Costing of new spending measures
The FAO’s spending outlook does not include the estimated cost of some recently announced spending measures, as details on funding and design are not yet known. This includes the Building Ontario Fund[19]; the upload to the Province of the Gardiner Expressway, Don Valley Parkway and Ottawa Road 174; provincial support to Honda to build new electric vehicle and battery plants[20]; and the refurbishment of the Ontario Legislative building. The FAO will update its spending projection to account for these measures as details are provided to the FAO.
Impact of federal government policies
The FAO’s outlook incorporates assumptions for federal government policies that impact the Province’s budget. The FAO has included the estimated impact to provincial revenue of the increase in the capital gains inclusion rate from one-half to two-thirds for corporations and for individuals and trusts on gains of over $250,000 that was announced in the 2024 federal budget.[21]
The FAO assumes that the recently extended Canada Student Grants, which reduces provincial spending on Student Financial Assistance Programs (OSAP), will continue for one year as currently planned. In addition, the FAO incorporated the recently announced cap on international student permits for 2024 and 2025, which affects revenue and spending in the postsecondary education sector.
The FAO’s projection also assumes that agreements supporting $10-a-day child care and affordable housing programs are extended after their expiry in 2025-26 and 2027-28, respectively. Finally, the 2024 federal budget announced funding for a new Canada Disability Benefit. Canada Disability Benefit payments provided to Ontarians could reduce provincial spending on the Ontario Disability Support Program if the Province does not treat the payments as exempt unearned income.
Budget balance and net debt sensitivities
To illustrate the impact of potential policy changes on Ontario’s budget position, the FAO estimated the sensitivity of key budget indicators to changes in three main areas: taxation, federal transfers and spending. For each policy item, Table 6.1 provides an estimate of the 2024-25 and 2028-29 change in the budget balance, the total change in net debt by 2028-29, and the change in the net debt-to-GDP ratio in 2028-29.
| Change in Budget Balance in: | Change in Net Debt by 2028-29 |
Change in Net Debt-to-GDP Ratio by 2028-29 |
|||
|---|---|---|---|---|---|
| 2024–25 | 2028–29 | ||||
| Taxation | |||||
| Increasing/decreasing annual personal income taxes payable by $500 for the average taxpayer | +/-$5.1 billion | +/-$7.0 billion | +/-$29.8 billion | +/-2.2 ppt | |
| A one percentage point increase/decrease to the 11.5 per cent provincial general corporate tax rate | +/-$1.9 billion | +/-$2.3 billion | +/-$10.4 billion | +/-0.8 ppt | |
| A one percentage point increase/decrease to the 8 per cent provincial HST rate | +/-$5.1 billion | +/-$6.9 billion | +/-$29.9 billion | +/-2.2 ppt | |
| Federal Transfers | |||||
| A sustained one percentage point increase/decrease in the growth rate of the Canada Health Transfer | +/-$0.2 billion | +/-$1.4 billion | +/-$ 3.7 billion | +/-0.3 ppt | |
| A sustained one percentage point increase/decrease in the growth rate of the Canada Social Transfer | +/-$0.1 billion | +/-$0.4 billion | +/-$1.2 billion | +/-0.1 ppt | |
| Spending | |||||
| A sustained one percentage point increase/decrease in the growth rate of health sector spending | -/+$0.9 billion | -/+$5.6 billion | -/+$15.4 billion | -/+1.2 ppt | |
| A sustained one percentage point increase/decrease in the growth rate of education sector spending | -/+$0.4 billion | -/+$2.5 billion | -/+$6.9 billion | -/+0.5 ppt | |
| A sustained one percentage point increase/decrease in Ontario public sector salaries and wages | -/+$0.6 billion | -/+$3.6 billion | -/+$10.0 billion | -/+0.7 ppt | |
| A one percentage point increase/decrease in the cost of Provincial borrowing | -/+$0.6 billion | -/+$2.3 billion | -/+$7.4 billion | -/+0.6 ppt | |
7. Appendix
| (Per Cent Growth) | 2022a | 2023a | 2024f | 2025f | 2026f-2028f Average* | ||
|---|---|---|---|---|---|---|---|
| Nominal GDP | |||||||
| FAO | 9.2 | 4.3 | 4.3 | 4.2 | 4.2 | ||
| 2024 Ontario Budget** | 9.2 | 4.1 | 2.7 | 3.9 | 4.2 | ||
| Labour Income | |||||||
| FAO | 8.8 | 6.5 | 4.5 | 4.2 | 4.2 | ||
| 2024 Ontario Budget** | 8.9 | 6.7 | 4.3 | 4.4 | 4.1 | ||
| Corporate Profits | |||||||
| FAO | -5.9 | -13.7 | 5.0 | 4.5 | 4.3 | ||
| 2024 Ontario Budget** | -5.9 | -12.6 | -4.7 | 3.5 | 7.0 | ||
| Household Consumption | |||||||
| FAO | 13.2 | 5.4 | 3.5 | 4.1 | 4.2 | ||
| 2024 Ontario Budget** | 13.2 | 6.0 | 3.5 | 4.1 | 4.3 | ||
| 2022a | 2023a | 2024f | 2025f | 2026f-2028f Average* | |||
|---|---|---|---|---|---|---|---|
| Real GDP (Per Cent Growth) | |||||||
| FAO | 3.9 | 1.2 | 1.1 | 2.0 | 2.1 | ||
| 2024 Ontario Budget | 3.9 | 1.2 | 0.3 | 1.9 | 2.2 | ||
| Employment (Per Cent Growth) | |||||||
| FAO | 4.6 | 2.4 | 1.0 | 1.4 | 1.3 | ||
| 2024 Ontario Budget | 4.6 | 2.4 | 0.8 | 1.7 | 1.4 | ||
| Unemployment Rate (Per Cent) | |||||||
| FAO | 5.6 | 5.7 | 6.9 | 6.6 | 6.2 | ||
| 2024 Ontario Budget | 5.6 | 5.7 | 6.7 | 6.6 | 6.3 | ||
| CPI Inflation (Per Cent) | |||||||
| FAO | 6.8 | 3.8 | 2.6 | 2.1 | 2.0 | ||
| 2024 Ontario Budget | 6.8 | 3.8 | 2.6 | 2.0 | 2.0 | ||
| 3-month Treasury Bill Rate (Per Cent) | |||||||
| FAO | 2.3 | 4.8 | 4.5 | 2.9 | 2.6 | ||
| 2024 Ontario Budget | 2.3 | 4.8 | 4.4 | 3.0 | 2.6 | ||
| 10-year Government Bond Rate (Per Cent) | |||||||
| FAO | 2.8 | 3.3 | 3.3 | 3.2 | 3.3 | ||
| 2024 Ontario Budget | 2.8 | 3.3 | 3.2 | 3.1 | 3.4 | ||
| ($ Billions) | 2021-22a | 2022-23a | 2023-24f | 2024-25f | 2025-26f | 2026-27f | 2027-28f | 2028-29f | ||
|---|---|---|---|---|---|---|---|---|---|---|
| Revenue | ||||||||||
| Personal Income Tax | 46.8 | 44.2 | 51.9 | 53.7 | 55.6 | 58.0 | 60.8 | 63.6 | ||
| Annual Growth (Per Cent) | 15.9 | -5.4 | 17.4 | 3.4 | 3.6 | 4.2 | 4.9 | 4.7 | ||
| Sales Tax | 30.4 | 36.1 | 39.8 | 38.8 | 40.5 | 42.3 | 44.1 | 45.8 | ||
| Annual Growth (Per Cent) | 14.2 | 18.9 | 10.2 | -2.3 | 4.4 | 4.4 | 4.1 | 4.0 | ||
| Corporations Tax | 25.2 | 27.8 | 22.0 | 24.3 | 24.1 | 23.8 | 24.6 | 25.6 | ||
| Annual Growth (Per Cent) | 41.9 | 10.2 | -21.0 | 10.6 | -0.9 | -1.1 | 3.3 | 4.2 | ||
| All Other Taxes | 29.3 | 28.4 | 28.1 | 29.3 | 31.9 | 32.8 | 33.9 | 35.1 | ||
| Annual Growth (Per Cent) | 12.0 | -3.1 | -1.2 | 4.3 | 8.9 | 2.8 | 3.4 | 3.4 | ||
| Total Taxation Revenue | 131.7 | 136.5 | 141.7 | 146.1 | 152.1 | 156.9 | 163.4 | 170.2 | ||
| Annual Growth (Per Cent) | 18.8 | 3.7 | 3.8 | 3.1 | 4.1 | 3.1 | 4.1 | 4.2 | ||
| Transfers from Government of Canada | 30.6 | 31.3 | 34.5 | 36.3 | 37.6 | 38.7 | 39.4 | 41.0 | ||
| Annual Growth (Per Cent) | -9.8 | 2.1 | 10.4 | 5.1 | 3.6 | 3.1 | 1.6 | 4.1 | ||
| Income from Government Business Enterprises | 6.4 | 6.1 | 7.3 | 6.8 | 8.0 | 7.8 | 8.1 | 8.4 | ||
| Annual Growth (Per Cent) | 28.6 | -4.8 | 18.6 | -6.7 | 18.1 | -3.2 | 4.1 | 4.1 | ||
| Other Non-Tax Revenue | 16.4 | 19.0 | 19.8 | 19.2 | 18.9 | 19.3 | 20.2 | 21.0 | ||
| Annual Growth (Per Cent) | 8.8 | 15.6 | 4.6 | -3.1 | -1.4 | 1.6 | 5.0 | 4.0 | ||
| Total Revenue | 185.1 | 192.9 | 203.4 | 208.4 | 216.7 | 222.6 | 231.0 | 240.6 | ||
| Annual Growth (Per Cent) | 12.2 | 4.2 | 5.4 | 2.5 | 4.0 | 2.8 | 3.8 | 4.1 | ||
| Spending | ||||||||||
| Health Sector | 75.8 | 78.5 | 82.9 | 86.0 | 89.7 | 93.3 | 97.5 | 101.2 | ||
| Annual Growth (Per Cent) | 9.0 | 3.6 | 5.6 | 3.7 | 4.4 | 4.0 | 4.4 | 3.9 | ||
| Education Sector* | 31.6 | 36.2 | 38.2 | 39.7 | 41.0 | 41.9 | 42.9 | 44.0 | ||
| Annual Growth (Per Cent) | -4.0 | 14.7 | 5.5 | 3.9 | 3.3 | 2.4 | 2.3 | 2.5 | ||
| Children, Community and Social Services Sector | 17.0 | 18.0 | 19.4 | 20.3 | 20.7 | 21.3 | 21.9 | 22.5 | ||
| Annual Growth (Per Cent) | -2.1 | 6.0 | 7.3 | 4.9 | 2.1 | 2.9 | 2.4 | 2.9 | ||
| Postsecondary Education Sector | 10.6 | 11.8 | 12.5 | 12.9 | 13.1 | 13.7 | 13.7 | 14.1 | ||
| Annual Growth (Per Cent) | 8.0 | 10.8 | 6.3 | 3.4 | 1.6 | 4.0 | 0.1 | 3.1 | ||
| Justice Sector | 4.9 | 5.4 | 5.9 | 6.1 | 5.9 | 6.1 | 6.1 | 6.3 | ||
| Annual Growth (Per Cent) | 4.1 | 9.1 | 9.0 | 3.0 | -2.1 | 2.0 | 1.4 | 2.4 | ||
| Other Programs* | 30.6 | 36.5 | 32.9 | 36.2 | 35.3 | 33.0 | 33.8 | 34.5 | ||
| Annual Growth (Per Cent) | -11.6 | 19.1 | -9.8 | 9.9 | -2.5 | -6.4 | 2.5 | 2.1 | ||
| Total Program Spending | 170.5 | 186.4 | 191.7 | 201.1 | 205.8 | 209.3 | 215.8 | 222.6 | ||
| Annual Growth (Per Cent) | 0.9 | 9.3 | 2.9 | 4.9 | 2.3 | 1.7 | 3.1 | 3.1 | ||
| Interest on Debt | 12.6 | 12.4 | 12.5 | 13.7 | 14.6 | 15.6 | 16.1 | 16.2 | ||
| Annual Growth (Per Cent) | 2.3 | -1.5 | 1.3 | 9.3 | 6.8 | 6.6 | 3.2 | 0.2 | ||
| Total Spending | 183.1 | 198.7 | 204.3 | 214.8 | 220.4 | 224.9 | 232.0 | 238.7 | ||
| Annual Growth (Per Cent) | 1.0 | 8.5 | 2.8 | 5.2 | 2.6 | 2.1 | 3.1 | 2.9 | ||
| Budget Balance | 2.0 | -5.9 | -0.9 | -6.4 | -3.7 | -2.3 | -0.9 | 1.8 | ||
| Accumulated Deficit | 238.2 | 246.8 | 247.7 | 254.1 | 257.9 | 260.1 | 261.1 | 259.2 | ||
| Net Debt | 382.8 | 400.5 | 412.8 | 433.6 | 453.4 | 470.9 | 484.2 | 491.9 | ||
| Net Debt-to-GDP (Per Cent) | 39.9 | 38.2 | 37.7 | 38.0 | 38.1 | 38.0 | 37.5 | 36.6 | ||
| Interest on Debt-to-Revenue (Per Cent) | 6.8 | 6.4 | 6.2 | 6.6 | 6.8 | 7.0 | 7.0 | 6.7 | ||
| FAO Revenue Projection Changes, $ Billions | ||||||||
|---|---|---|---|---|---|---|---|---|
| 2023-24 | 2024-25 | 2025-26 | 2026-27 | 2027-28 | Total | |||
| Winter 2024 EBO | 196.9 | 204.1 | 215.4 | 225.0 | 234.0 | - | ||
| New Government Measures | 0.0 | -0.0 | -0.6 | -0.0 | -0.0 | -0.7 | ||
| Forecast Updates | 6.5 | 4.2 | 1.9 | -2.3 | -2.9 | 7.4 | ||
| Total Changes | 6.5 | 4.2 | 1.3 | -2.4 | -2.9 | 6.7 | ||
| Spring 2024 EBO | 203.4 | 208.4 | 216.7 | 222.6 | 231.0 | - | ||
| FAO Program Spending Projection Changes, $ Billions | ||||||||
|---|---|---|---|---|---|---|---|---|
| 2023-24 | 2024-25 | 2025-26 | 2026-27 | 2027-28 | Total | |||
| Winter 2024 EBO | 201.6 | 210.4 | 217.8 | 224.3 | 231.7 | - | ||
| New Government Measures | 0.8 | 2.9 | 3.0 | 2.2 | 0.8 | 9.7 | ||
| Forecast Updates | 1.8 | 1.6 | -0.4 | -1.5 | -0.5 | 0.9 | ||
| Total Changes | 2.7 | 4.4 | 2.6 | 0.6 | 0.3 | 10.6 | ||
| Spring 2024 EBO | 204.3 | 214.8 | 220.4 | 224.9 | 232.0 | - | ||
| 2023-24 | 2024-25 | 2025-26 | 2026-27 | |||
|---|---|---|---|---|---|---|
| Budget Balance - 2024 Ontario Budget | -3.0 | -9.8 | -4.6 | 0.5 | ||
| Difference in FAO Projection (see Table Notes) | ||||||
| Revenue | -1.0 | 2.7 | -0.8 | -3.9 | ||
| Spending | 3.0 | -0.3 | 0.2 | -0.8 | ||
| Reserve | 0.0 | 1.0 | 1.5 | 2.0 | ||
| Total Difference | 2.1 | 3.4 | 0.9 | -2.8 | ||
| Budget Balance - FAO Spring 2024 EBO | -0.9 | -6.4 | -3.7 | -2.3 | ||
Graphical Descriptions
| Real GDP Growth (Per Cent) | ||
|---|---|---|
| 2012-2019 | 2024-2028 | |
| World | 3.4 | 3.2 |
| Advanced economies | 2.0 | 1.8 |
| Emerging market and developing economies | 4.6 | 4.1 |
| Historical | Projection | ||||
|---|---|---|---|---|---|
| 2022 | 2023 | 2024 | 2025 | 2026-28 Average | |
| Annual CPI Inflation (Per Cent) | 6.8 | 3.8 | 2.6 | 2.1 | 2.0 |
| (Per Cent) | Historical | Projection | |||
|---|---|---|---|---|---|
| 2022 | 2023 | 2024 | 2025 | 2026-28 Average | |
| 3-month Treasury Bill Yield | 2.3 | 4.8 | 4.5 | 2.9 | 2.6 |
| 10-year Government of Canada Bond Yield | 2.8 | 3.3 | 3.3 | 3.2 | 3.3 |
| Historical | Projection | ||||
|---|---|---|---|---|---|
| 2022 | 2023 | 2024 | 2025 | 2026-28 Average | |
| Ontario Real GDP Growth (Per Cent) | 3.9 | 1.2 | 1.1 | 2.0 | 2.1 |
| Per Cent | Historical | Projection | ||||
|---|---|---|---|---|---|---|
| 2021 | 2022 | 2023 | 2024 | 2025 | 2026-28 Average | |
| Employment Growth | 5.2 | 4.6 | 2.4 | 1.0 | 1.4 | 1.3 |
| Unemployment Rate | 8.1 | 5.6 | 5.7 | 6.9 | 6.6 | 6.2 |
| Historical | Projection | ||||
|---|---|---|---|---|---|
| 2022 | 2023 | 2024 | 2025 | 2026-28 Average | |
| Nominal GDP Growth (Per Cent) | 9.2 | 4.3 | 4.3 | 4.2 | 4.2 |
| Budget Balance ($ Billions) | |||
|---|---|---|---|
| Historical | FAO Spring 2024 | 2024 Ontario Budget | |
| 2021-22 | 2.0 | ||
| 2022-23 | -5.9 | ||
| 2023-24 | -0.9 | -3.0 | |
| 2024-25 | -6.4 | -9.8 | |
| 2025-26 | -3.7 | -4.6 | |
| 2026-27 | -2.3 | 0.5 | |
| 2027-28 | -0.9 | ||
| 2028-29 | 1.8 | ||
| Net Debt-to-GDP Ratio (Per Cent) | Historical | FAO Spring 2024 | 2024 Ontario Budget | 30-year average | Government target | |
|---|---|---|---|---|---|---|
| Historical | 1993-94 | 26.6 | 33.2 | |||
| 1994-95 | 28.3 | |||||
| 1995-96 | 30.1 | |||||
| 1996-97 | 31.2 | |||||
| 1997-98 | 30.5 | |||||
| 1998-99 | 29.4 | |||||
| 1999-00 | 32.1 | |||||
| 2000-01 | 29.3 | |||||
| 2001-02 | 28.2 | |||||
| 2002-03 | 26.8 | |||||
| 2003-04 | 27.5 | |||||
| 2004-05 | 26.8 | |||||
| 2005-06 | 27.8 | |||||
| 2006-07 | 27.1 | |||||
| 2007-08 | 26.6 | |||||
| 2008-09 | 27.8 | |||||
| 2009-10 | 32.3 | |||||
| 2010-11 | 34.5 | |||||
| 2011-12 | 36.6 | |||||
| 2012-13 | 38.2 | |||||
| 2013-14 | 39.7 | |||||
| 2014-15 | 40.5 | |||||
| 2015-16 | 40.3 | |||||
| 2016-17 | 39.7 | |||||
| 2017-18 | 39.2 | |||||
| 2018-19 | 39.3 | |||||
| 2019-20 | 39.5 | |||||
| 2020-21 | 42.6 | |||||
| 2021-22 | 39.9 | |||||
| 2022-23 | 38.2 | |||||
| Projection | 2023-24 | 37.7 | 38.0 | 40.0 | ||
| 2024-25 | 38.0 | 39.2 | ||||
| 2025-26 | 38.1 | 39.5 | ||||
| 2026-27 | 38.0 | 39.1 | ||||
| 2027-28 | 37.5 | |||||
| 2028-29 | 36.6 | |||||
| Interest on Debt-to-Revenue Ratio (Per Cent) | Historical | FAO Spring 2024 | 2024 Ontario Budget | 30-year average | Government target | |
|---|---|---|---|---|---|---|
| Historical | 1993-94 | 13.9 | 10.6 | |||
| 1994-95 | 14.5 | |||||
| 1995-96 | 14.6 | |||||
| 1996-97 | 14.8 | |||||
| 1997-98 | 14.2 | |||||
| 1998-99 | 14.3 | |||||
| 1999-00 | 15.5 | |||||
| 2000-01 | 15.0 | |||||
| 2001-02 | 14.2 | |||||
| 2002-03 | 12.9 | |||||
| 2003-04 | 12.9 | |||||
| 2004-05 | 11.1 | |||||
| 2005-06 | 9.7 | |||||
| 2006-07 | 8.9 | |||||
| 2007-08 | 8.4 | |||||
| 2008-09 | 8.7 | |||||
| 2009-10 | 8.9 | |||||
| 2010-11 | 8.8 | |||||
| 2011-12 | 9.1 | |||||
| 2012-13 | 9.0 | |||||
| 2013-14 | 9.1 | |||||
| 2014-15 | 8.9 | |||||
| 2015-16 | 8.5 | |||||
| 2016-17 | 8.3 | |||||
| 2017-18 | 7.9 | |||||
| 2018-19 | 8.1 | |||||
| 2019-20 | 8.0 | |||||
| 2020-21 | 7.5 | |||||
| 2021-22 | 6.8 | |||||
| 2022-23 | 6.4 | |||||
| Projection | 2023-24 | 6.2 | 6.3 | 7.5 | ||
| 2024-25 | 6.6 | 6.8 | ||||
| 2025-26 | 6.8 | 6.8 | ||||
| 2026-27 | 7.0 | 6.7 | ||||
| 2027-28 | 7.0 | |||||
| 2028-29 | 6.7 | |||||
| Average Annual Growth (Per Cent) | |||
|---|---|---|---|
| Historical | Projection | ||
| Pre-pandemic (2012-13 to 2019-20) | Pandemic (2019-20 to 2022-23) | (2022-23 to 2028-29) | |
| Nominal GDP | 4.0 | 5.5 | 4.2 |
| Total Revenue | 3.8 | 7.3 | 3.8 |
| Total Revenues ($ Billions) | ||||
|---|---|---|---|---|
| Historical | FAO Winter 2024 | Growth | ||
| Historical | 2012-13 | 120.3 | ||
| 2013-14 | 123.0 | |||
| 2014-15 | 126.2 | |||
| 2015-16 | 136.1 | |||
| 2016-17 | 140.7 | |||
| 2017-18 | 150.6 | |||
| 2018-19 | 153.8 | |||
| 2019-20 | 156.2 | 7.3% average annual revenue growth during Pandemic | ||
| 2020-21 | 165.0 | |||
| 2021-22 | 185.1 | |||
| 2022-23 | 192.9 | |||
| Projection | 2023-24 | 203.4 | 3.8% average annual revenue growth over the projection | |
| 2024-25 | 208.4 | |||
| 2025-26 | 216.7 | |||
| 2026-27 | 222.6 | |||
| 2027-28 | 231.0 | |||
| 2028-29 | 240.6 | |||
| Total Revenues ($ Billions) | ||||
|---|---|---|---|---|
| Historical | FAO Winter 2024 | 2024 Ontario Budget | ||
| Historical | 2021-22 | 185.1 | ||
| 2022-23 | 192.9 | |||
| Projection | 2023-24 | 203.4 | 204.3 | |
| 2024-25 | 208.4 | 205.7 | ||
| 2025-26 | 216.7 | 217.4 | ||
| 2026-27 | 222.6 | 226.6 | ||
| 2027-28 | 231.0 | |||
| 2028-29 | 240.6 | |||
| Per Cent Growth | |||||
|---|---|---|---|---|---|
| FAO Spring 2024 | Historical Average | Projection Average | |||
| Historical | 2017-18 | 7.8 | 5.6 | ||
| 2018-19 | 4.4 | ||||
| 2019-20 | 2.3 | ||||
| 2020-21 | 10.0 | ||||
| 2021-22 | 1.0 | ||||
| 2022-23 | 8.5 | ||||
| Projection | 2023-24 | 2.8 | 3.1 | ||
| 2024-25 | 5.2 | ||||
| 2025-26 | 2.6 | ||||
| 2026-27 | 2.1 | ||||
| 2027-28 | 3.1 | ||||
| 2028-29 | 2.9 | ||||
| Average Annual Growth (Per Cent) | ||
|---|---|---|
| Sector | Historical 2016-17 to 2022-23 | Projection 2022-23 to 2028-29 |
| Health | 5.7 | 4.3 |
| Education | 4.7 | 3.3 |
| Postsecondary Education | 3.8 | 3.1 |
| Children, Community and Social Services | 2.5 | 3.7 |
| Justice | 4.9 | 2.6 |
| Other Programs | 11.8 | -0.9 |
| Interest on Debt | 0.9 | 4.5 |
| Total Spending | 5.6 | 3.1 |
| Spending ($ Billions) | ||||
|---|---|---|---|---|
| Historical | FAO Spring 2024 | 2024 Ontario Budget | ||
| Historical | 2021-22 | 183.1 | ||
| 2022-23 | 198.7 | |||
| Projection | 2023-24 | 204.3 | 207.3 | |
| 2024-25 | 214.8 | 214.5 | ||
| 2025-26 | 220.4 | 220.6 | ||
| 2026-27 | 224.9 | 224.1 | ||
| 2027-28 | 232.0 | |||
| 2028-29 | 238.7 | |||
Footnotes
[1] World Economic Outlook, International Monetary Fund, April 2024.
[2] In the January 2024 World Economic Outlook, the International Monetary Fund projected US real GDP growth of 2.1 per cent in 2024. The Bank of Canada similarly revised up its outlook for US real GDP growth in 2024 from 1.7 per cent in its January 2024 Monetary Policy Report to 2.7 per cent in its April 2024 Monetary Policy Report.
[3] The inflation rate is measured by the year-over-year per cent change in Ontario’s consumer price index.
[4] Average annual food price inflation in Ontario was 7.1 per cent in 2023, the highest among all major CPI components.
[5] Since the Bank of Canada began targeting inflation in 1991, Ontario’s annual CPI inflation rate has averaged 2.1 per cent.
[6] Canadian Survey of Consumer Expectations: First Quarter of 2024, Bank of Canada, April 2024; Business Outlook Survey: First Quarter of 2024, Bank of Canada, April 2024.
[7] Monetary Policy Report, Bank of Canada, April 2024.
[8] Market Participants Survey: First Quarter of 2024, Bank of Canada, April 2024.
[9] Examples of recently announced government plans outlined in the federal government’s 2024 budget include 30-year mortgage amortizations for first-time home buyers purchasing newly built homes, higher withdrawal limits from Registered Retirement Savings Plans under the Home Buyers’ Plan and increased funding for the Apartment Construction Loan Program, the Canada Housing Infrastructure Fund and the Housing Accelerator Fund.
[10] Following two years of wage growth lagging inflation, the average hourly wage of Ontarians increased 5.1 per cent in 2023, above the 3.8 per cent average annual CPI inflation rate. Average hourly wage growth exceeded inflation for most major groups of workers and in most industries and occupation groups. For details, see the FAO’s report on Ontario’s Labour Market in 2023.
[11] For more information on fiscal sustainability indicators, see Chapter 2 of the FAO’s Long-Term Budget Outlook: Assessing Ontario’s Fiscal Sustainability: 2021-2050 report.
[12] For context, Ontario’s population and inflation is projected to grow by a combined 3.8 per cent per year from 2022-23 to 2028-29.
[13] Examples of new programs during this period include the Fair Hydro Plan (2017-18, currently referred to as the Ontario Electricity Rebate), the Renewable Cost Shift (2020-21, currently referred to as the Comprehensive Electricity Plan) and the start of the $10-a-day child care program in 2022-23. Examples of expanded programs include the expansion of hospital beds and the increase in hours of direct care provided to long-term care home residents. In 2022-23, temporary COVID-19-related spending was approximately $6.3 billion. In addition, 2022-23 included $6.3 billion in one-time payments for land and land-related claims with Indigenous communities. Finally, the government included a $2.5 billion contingent liability in 2022-23 to recognize the potential impact of retroactive payments related to Bill 124, the Protecting a Sustainable Public Sector for Future Generations Act, 2019.
[14] The Building Faster Fund is expected to total $1.2 billion over three years, of which $0.3 billion was included in the FAO’s Winter 2024 EBO spending projection as part of the Ontario-Toronto New Deal.
[15] See FAO Expenditure Monitor 2023-24: Q3.
[16] SIS Global Election Tracker, American University, 2024.
[17] Minister Miller issues statement on international student allocations for provinces and territories, Immigration, Refugees and Citizenship Canada, April 2024.
[18] Announcement related to Temporary Residents, Immigration, Refugees and Citizenship Canada, March 2024.
[19] Previously known as the Ontario Infrastructure Bank.
[20] The Province announced that it would provide up to $2.5 billion in support through direct and indirect incentives. See Honda to Build Canada’s First Comprehensive Electric Vehicle Supply Chain, Creating Thousands of New Jobs in Ontario.
[21] The FAO’s preliminary estimate for the impact of the change in the capital gains inclusion rate is $3.1 billion in additional revenue over the 2024-25 to 2028-29 projection. This estimate will be revised when more information becomes available.