


1. Summary
This Economic and Budget Outlook report provides the FAO’s projection for the provincial economy and the Province’s finances over the 2023-24 to 2027-28 period. The report also compares the FAO’s budget outlook to the government’s plan presented in the 2023 Ontario Economic Outlook and Fiscal Review (Fall Economic Statement or FES) from 2023-24 to 2025-26. The FAO’s revenue and spending projections are based on current and announced government policies.
Ontario’s economic growth to slow further in 2024
Ontario’s economic growth (as measured by growth in real GDP) slowed sharply to 1.2 per cent in 2023 and is projected to slow further to 0.7 per cent in 2024, reflecting the ongoing impact of higher interest rates on household spending and the housing market, and a weaker global environment. Ontario’s economic growth is projected to improve over the 2025 to 2028 period as lower interest rates bolster household spending and residential investment.
FAO projects balanced budget by 2026-27
The FAO projects a $4.7 billion budget deficit in 2023-24, slightly smaller than the government’s $5.6 billion deficit projected in the 2023 FES. Ontario’s budget deficit is expected to widen to $6.2 billion in 2024-25 and gradually improve over the outlook, reaching a balanced position by 2026-27, one year later than expected by the government.
The FAO’s current budget outlook is a significant deterioration from the FAO’s Spring 2023 outlook, which expected growing budget surpluses over the forecast to 2027-28. This significant downward revision is the result of both lower than projected revenues and higher than projected spending. The FAO now expects the Province to record $74.1 billion more in net debt by 2027-28 when compared to the FAO’s spring projection. Despite this increase, Ontario’s net debt-to-GDP ratio is expected to remain below the government’s 2023 Ontario Budget target.
Ontario’s revenue growth to moderate after pandemic-related surge
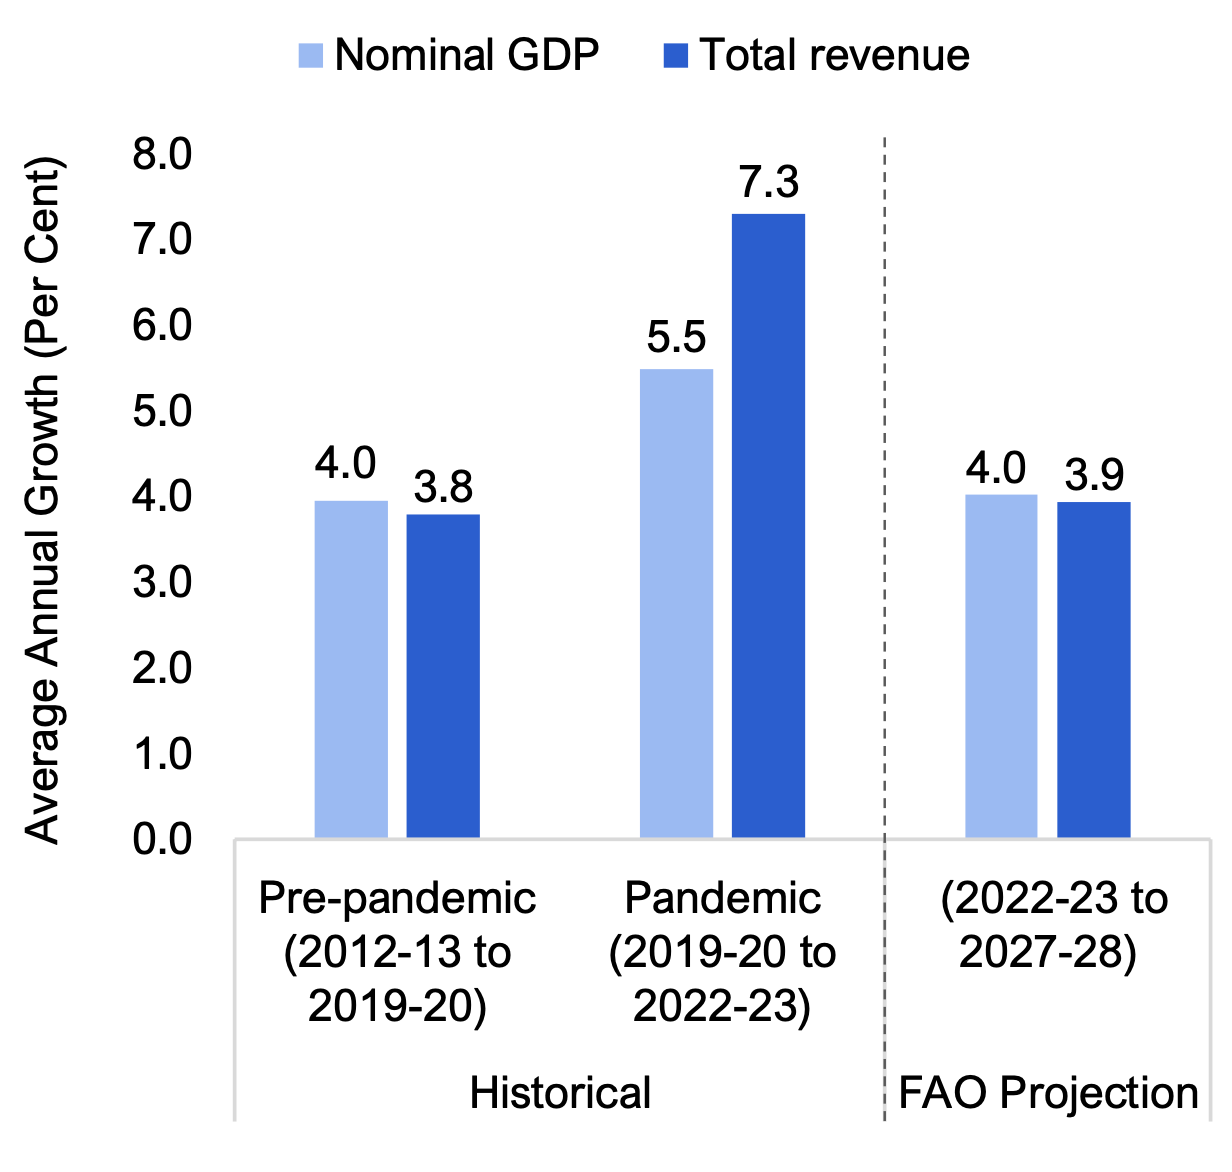
The FAO projects revenue growth will average 3.9 per cent per year from 2022-23 to 2027-28, slower than the 7.3 per cent average annual growth recorded during the pandemic. The FAO’s revenue projection is lower by an average of $5.8 billion per year compared to the FAO’s Spring 2023 projection, for a cumulative decrease of $29.0 billion over five years. This decrease is mainly due to lower projected personal income tax based on new information from 2022 tax returns. The FAO’s revenue forecast is also $4.9 billion lower than the government’s outlook in 2023-24, and $4.6 billion lower by 2025-26 due to the FAO’s less optimistic projection for corporate and sales tax revenue.
FAO’s spending projection higher compared to the Spring 2023 EBO outlook
The FAO projects spending growth will average 3.1 per cent per year from 2022-23 to 2027-28, slower than the 5.2 per cent average annual growth over the previous five years. The FAO’s spending projection has increased by an average of $6.7 billion per year compared to the FAO’s Spring 2023 outlook, for a cumulative increase of $33.4 billion over five years. This increase is due in part to higher projected spending on Ontario public sector salaries and wages, new government policy measures, and higher projected interest on debt spending to support the estimated increase in net debt. Overall, the FAO’s spending projection is similar to the government’s spending plan in the 2023 FES with the exception of 2023-24, where the government’s spending plan is $4.8 billion above the FAO’s projection.
Ontario’s fiscal sustainability indicators to remain below the government’s targets
Ontario’s debt burden (as measured by the net debt-to-GDP ratio) is expected to increase from 38.3 per cent in 2022-23 to 38.7 per cent in 2024-25, before declining to 37.0 per cent by 2027-28. The interest on debt-to-revenue ratio, a measure of budget flexibility, is projected to increase from 6.4 per cent in 2022-23 to 7.0 per cent in 2025-26, before declining to 6.8 per cent by 2027-28. Both fiscal sustainability indicators are expected to remain below the government’s 2023 Ontario Budget targets of 40.0 per cent for the net debt-to-GDP ratio and 7.5 per cent for the interest on debt-to-revenue ratio.
Risks to the economic and budget outlook
Ontario’s economic growth could be negatively affected by numerous geopolitical risks, or if inflation and interest rates remain higher for longer than anticipated. If the US economy continues to grow above expectations, that could positively affect Ontario’s economic growth and revenues. While the FAO has adjusted its assumptions for public sector wage growth to reflect the estimated impact of Bill 124 retroactive compensation and higher wage settlements, the outcomes of upcoming negotiations or arbitration awards could affect the FAO’s spending projection. Also, the FAO’s spending projection does not yet include the estimated costs of the newly announced Ontario Infrastructure Bank or the upload of the Gardiner Expressway and Don Valley Parkway due to uncertainty around details and the timing of implementation. When details of these initiatives are finalized, the FAO will update its spending projection to account for these costs.
2. Economic Outlook
Global economic growth expected to moderate
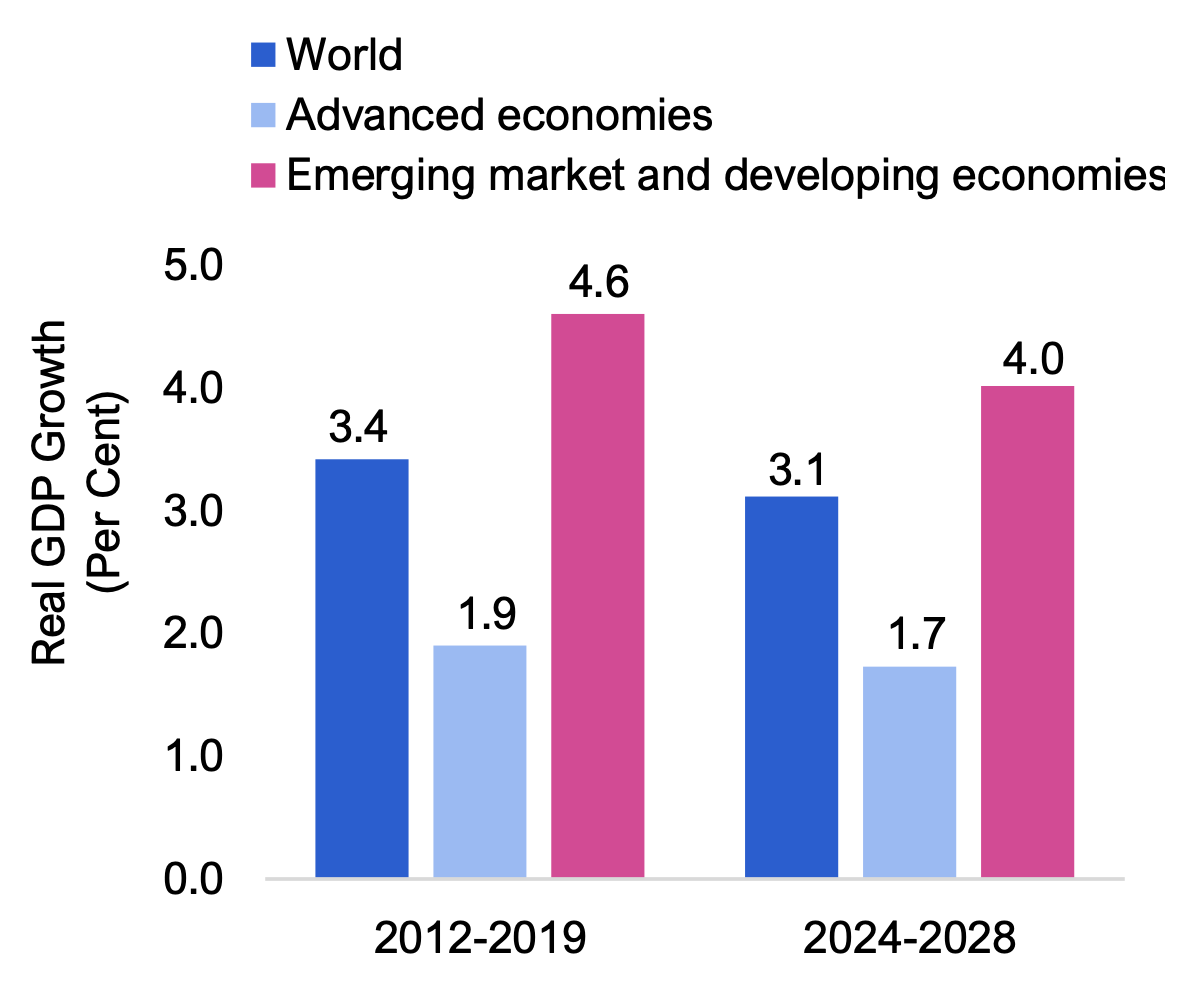
The global economy grew by an estimated 3.0 per cent in 2023, moderating from 3.5 per cent in 2022 as higher interest rates and geopolitical conflicts weighed on the recovery of economic activity from the COVID-19 pandemic.[1] Emerging market and developing economies maintained a similar pace of growth of around 4.0 per cent in 2022 and 2023, while growth in advanced economies slowed from 2.6 per cent in 2022 to 1.5 per cent in 2023 largely due to the further tightening of monetary policy.
Figure 2.1 Global economic growth projected to moderate
Source: International Monetary Fund.
Risks to the short-term global economic outlook remain skewed to the downside. Recession concerns have somewhat abated as inflation slowed without a major downturn in economic activity in advanced economies. However, China’s labour market challenges and real estate crisis have shed confidence in its post-pandemic recovery, while commodity prices could become more volatile due to ongoing geopolitical tensions and extreme weather events.
Global economic growth is expected to pick up in 2025 as inflation gradually returns to central bank targets and policy interest rates are lowered. The global economy is projected to grow by an average annual rate of 3.1 per cent over the 2024 to 2028 period, slightly slower than the 3.4 per cent average growth observed after the 2007-08 global financial crisis and before the 2020 pandemic.
The United States, Ontario’s largest trading partner, is expected to record economic growth of 1.5 per cent in 2024, after a gain of 2.5 per cent in 2023. Household consumption, investment and employment growth are projected to moderate in 2024, followed by a small rebound in 2025 as the Federal Reserve gradually lowers the Federal Funds Rate.
Ontario outlook: inflation and economic growth to slow
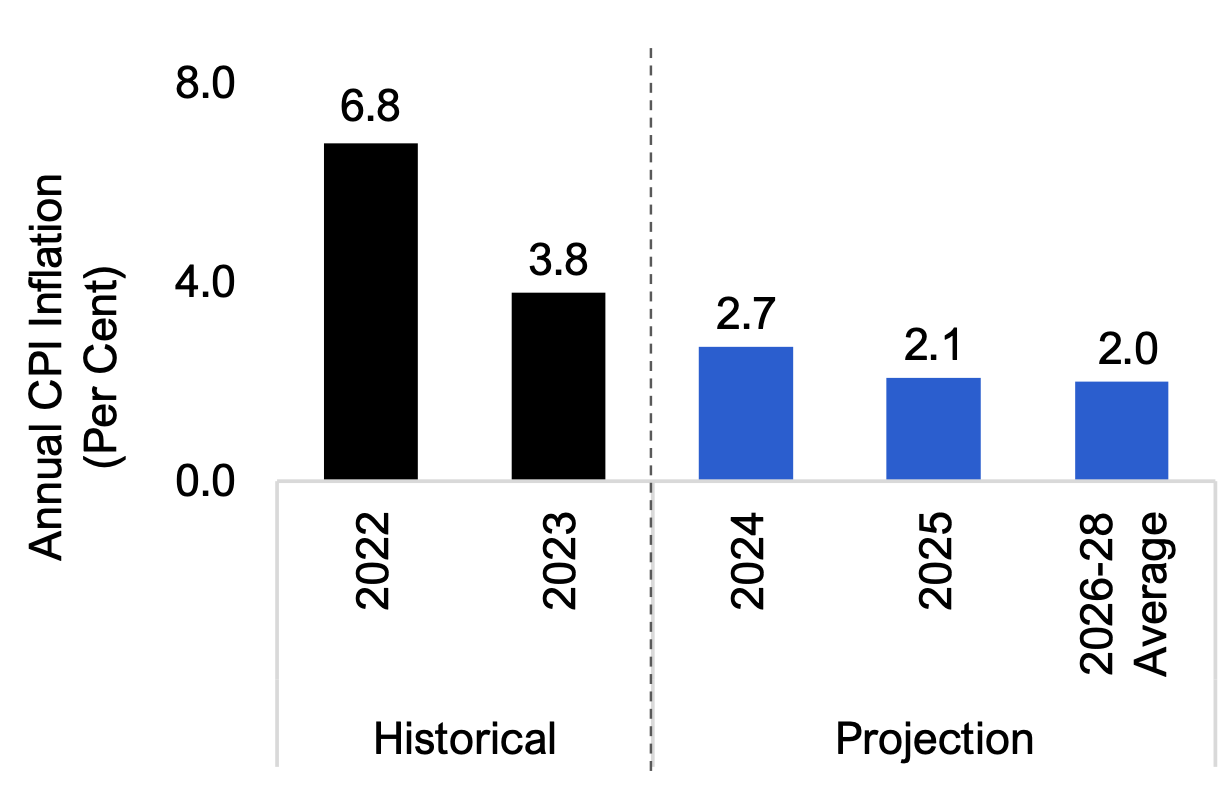
Figure 2.2 Ontario’s inflation rate projected to moderate gradually over the next two years
Source: Statistics Canada and FAO.
Since peaking at a 41-year high of 6.8 per cent in 2022, Ontario’s average annual inflation rate fell to 3.8 per cent in 2023 as higher interest rates slowed demand and global supply chains improved. The lower inflation rate was mainly driven by a 4.3 per cent drop in energy prices in 2023. Inflation rates in most categories eased in 2023 except for health and personal care, and alcohol and tobacco. The pace of food inflation moderated from an increase of 9.1 per cent in 2022 to 7.1 per cent in 2023.
Annual CPI inflation is still expected to remain above historical averages in 2024 at 2.7 per cent and moderate to an average of close to two per cent over the rest of the outlook as the economy fully adjusts to higher interest rates.
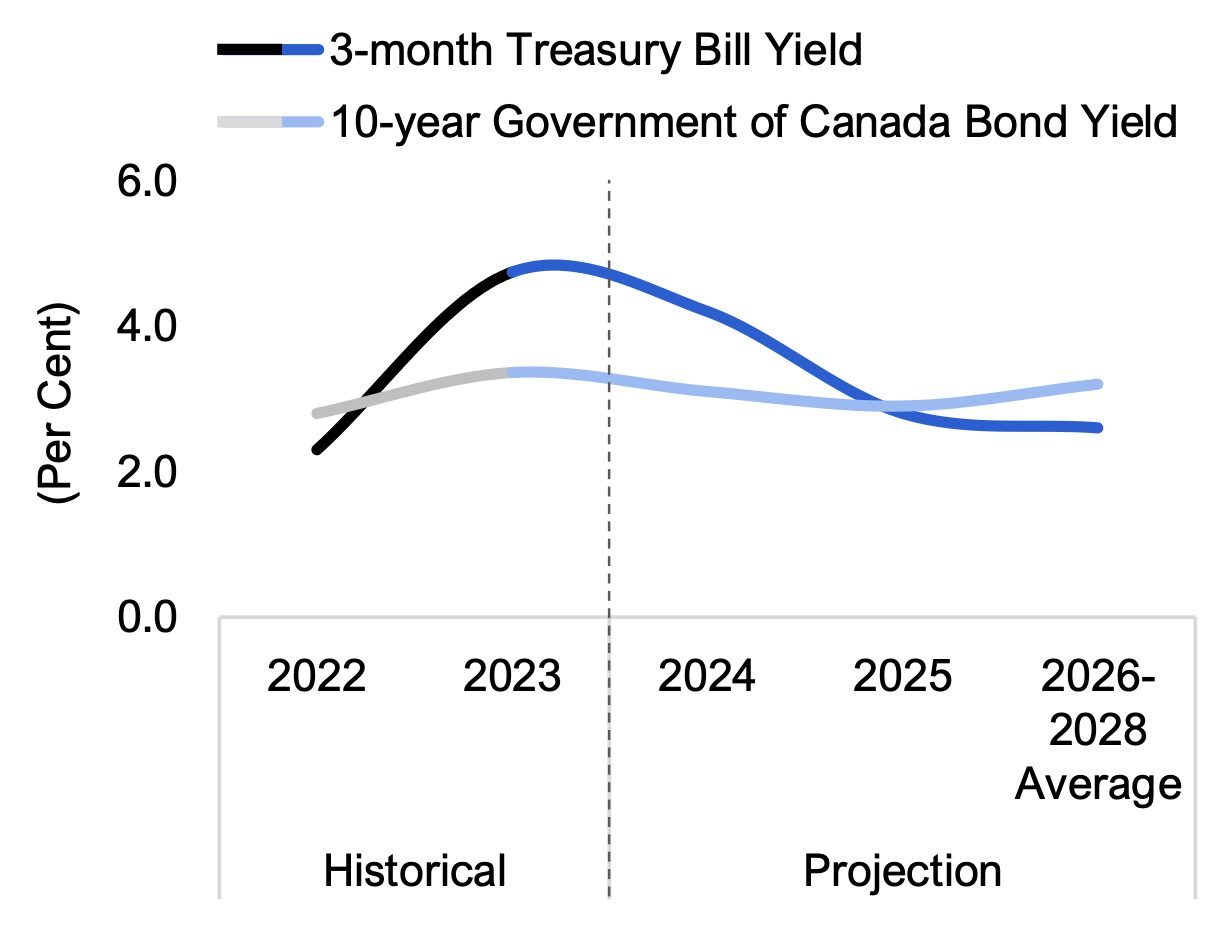
Figure 2.3 Short-term interest rates to remain high in 2024
Source: Statistics Canada and FAO.
Since its last increase in July 2023, the Bank of Canada has maintained its policy interest rate at 5.00 per cent. With economic growth and inflation slowing, financial market participants anticipate the Bank of Canada will lower its policy interest rate by 150 basis points by early 2025.[2]
In line with most private sector economists, the FAO projects that short-term interest rates will stay above long-term rates in 2024, which has historically indicated the possibility of weak economic growth. As inflation continues to ease closer to the Bank’s two per cent target, short-term interest rates are projected to fall below long-term rates by 2025.
Ontario’s real GDP growth has slowed sharply
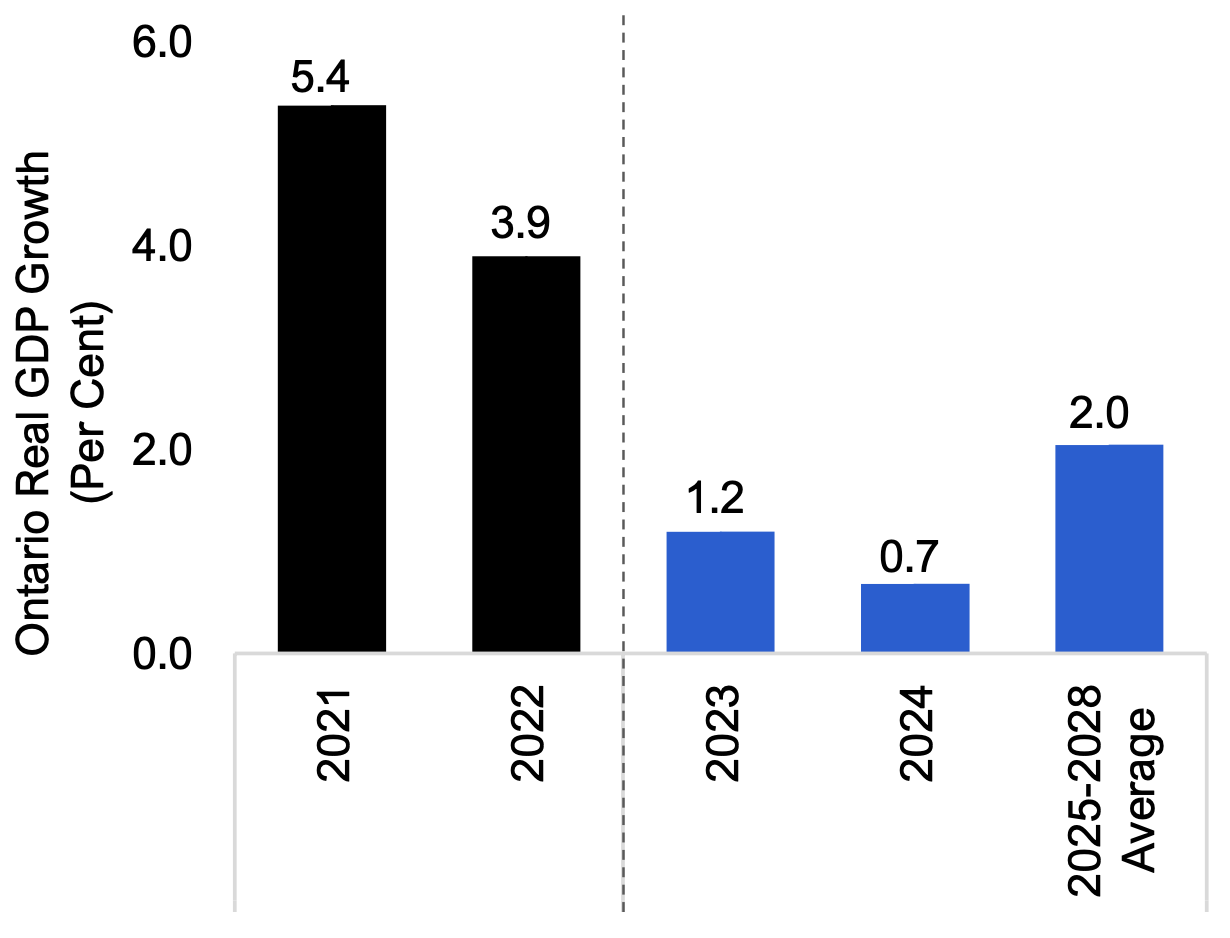
Figure 2.4 Ontario’s economic growth projected to slow further in 2024
Source: Ontario Economic Accounts and FAO.
Ontario’s real GDP expanded by an estimated 1.2 per cent in 2023, down sharply from 3.9 per cent growth in 2022 and 5.4 per cent in 2021. Elevated inflation, rising interest rates and the weaker global environment continued to weigh on household and business sector activity in 2023. Residential and business investment are projected to decline for the second consecutive year in 2023 as high borrowing costs discouraged new home construction, housing sales activity and investment in machinery and equipment.
The pace of Ontario’s economic growth is projected to slow further to 0.7 per cent in 2024, reflecting the ongoing impact of higher interest rates on highly indebted households’ spending. Residential investment is projected to remain weak in 2024 as high mortgage rates and affordability challenges continue to dampen housing activity. While US consumer spending outperformed expectations in 2023, it is expected to slow in 2024 as excess savings from the COVID-19 pandemic are depleted, impacting Ontario’s exports.
Economic growth is projected to improve to an average of 2.0 per cent over the 2025 to 2028 period as interest rates fall, helping to bolster household spending. Residential investment is expected to rebound in 2025 due to strong population growth[3] and government plans[4] to spur housing construction activity. Recovery in consumer demand in the United States is expected to support a moderate rebound in Ontario’s exports. However, a number of downside risks to the outlook could result in a slower pace of economic growth – see discussion in Chapter 6.
Ontario’s job market expected to slow further in 2024
Figure 2.5 Unemployment rate expected to rise in 2024
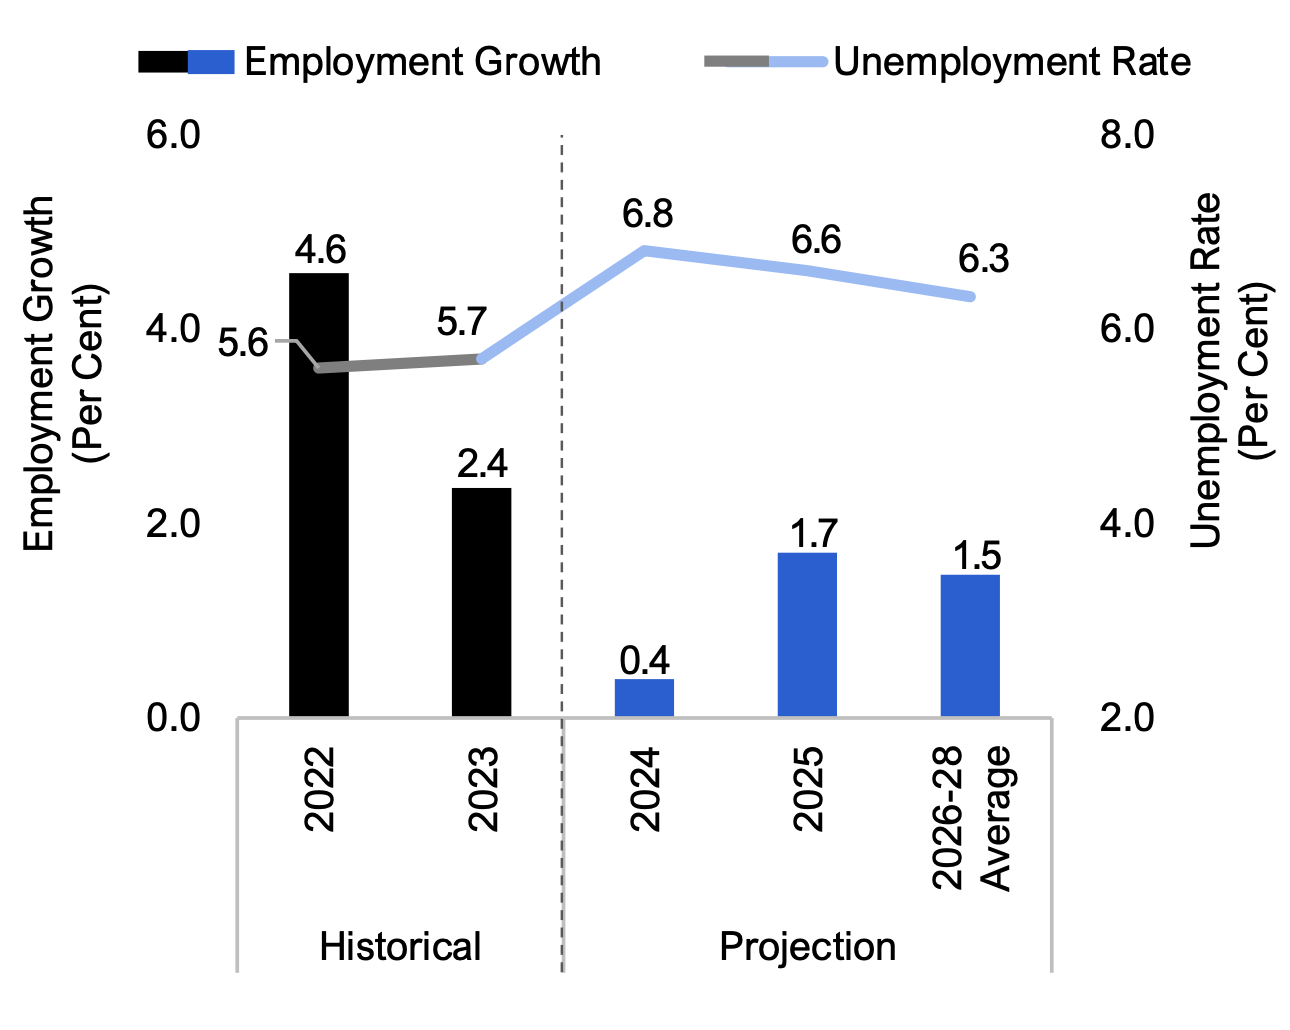
Source: Statistics Canada and FAO.
Ontario’s strong post-pandemic job creation moderated in 2023, with employment increasing by 183,200 jobs (2.4 per cent) compared to 338,300 jobs (4.6 per cent) created in 2022. The annual unemployment rate inched up to 5.7 per cent in 2023, slightly higher than the pre-pandemic rate of 5.6 per cent observed in 2019.
Ontario’s labour market performance softened through 2023, with the unemployment rate rising more than a full percentage point from April to December, reaching 6.3 per cent.[5]
In 2024, employment growth is projected to slow to 0.4 per cent and the annual unemployment rate is projected to increase to 6.8 per cent. The unemployment rate is projected to fall gradually over the remainder of the outlook as employment growth recovers.
Ontario’s nominal GDP growth to moderate
Figure 2.6 Ontario’s nominal GDP growth to moderate in 2023 and 2024
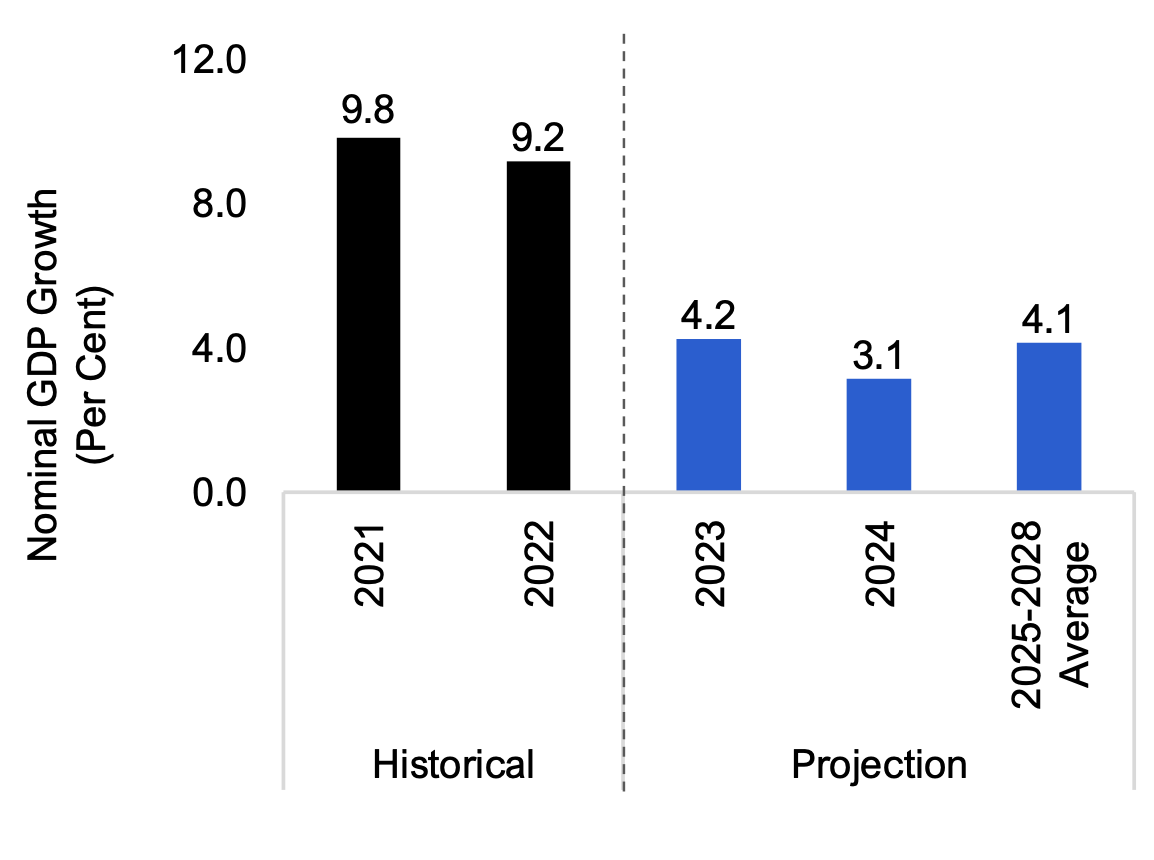
Source: Ontario Economic Accounts and FAO.
Ontario’s nominal GDP, which provides a broad measure of the tax base, expanded by an estimated 4.2 per cent in 2023, less than half the 9.2 per cent growth recorded in 2022. Labour income growth was resilient, with hourly wages extending strong gains in most industries throughout 2023, while corporate profits are expected to decline for a second consecutive year as businesses faced weaker sales growth and high interest on debt costs.
Nominal GDP growth is projected to moderate further to 3.1 per cent in 2024 as a softening labour market eases wage pressures and corporate profits continue to struggle. Over the 2025 to 2028 period, nominal GDP growth is expected to rebound and average 4.1 per cent annually, supported by stronger employment growth, sales gains and lower interest rates.
3. Budget and Debt Outlook
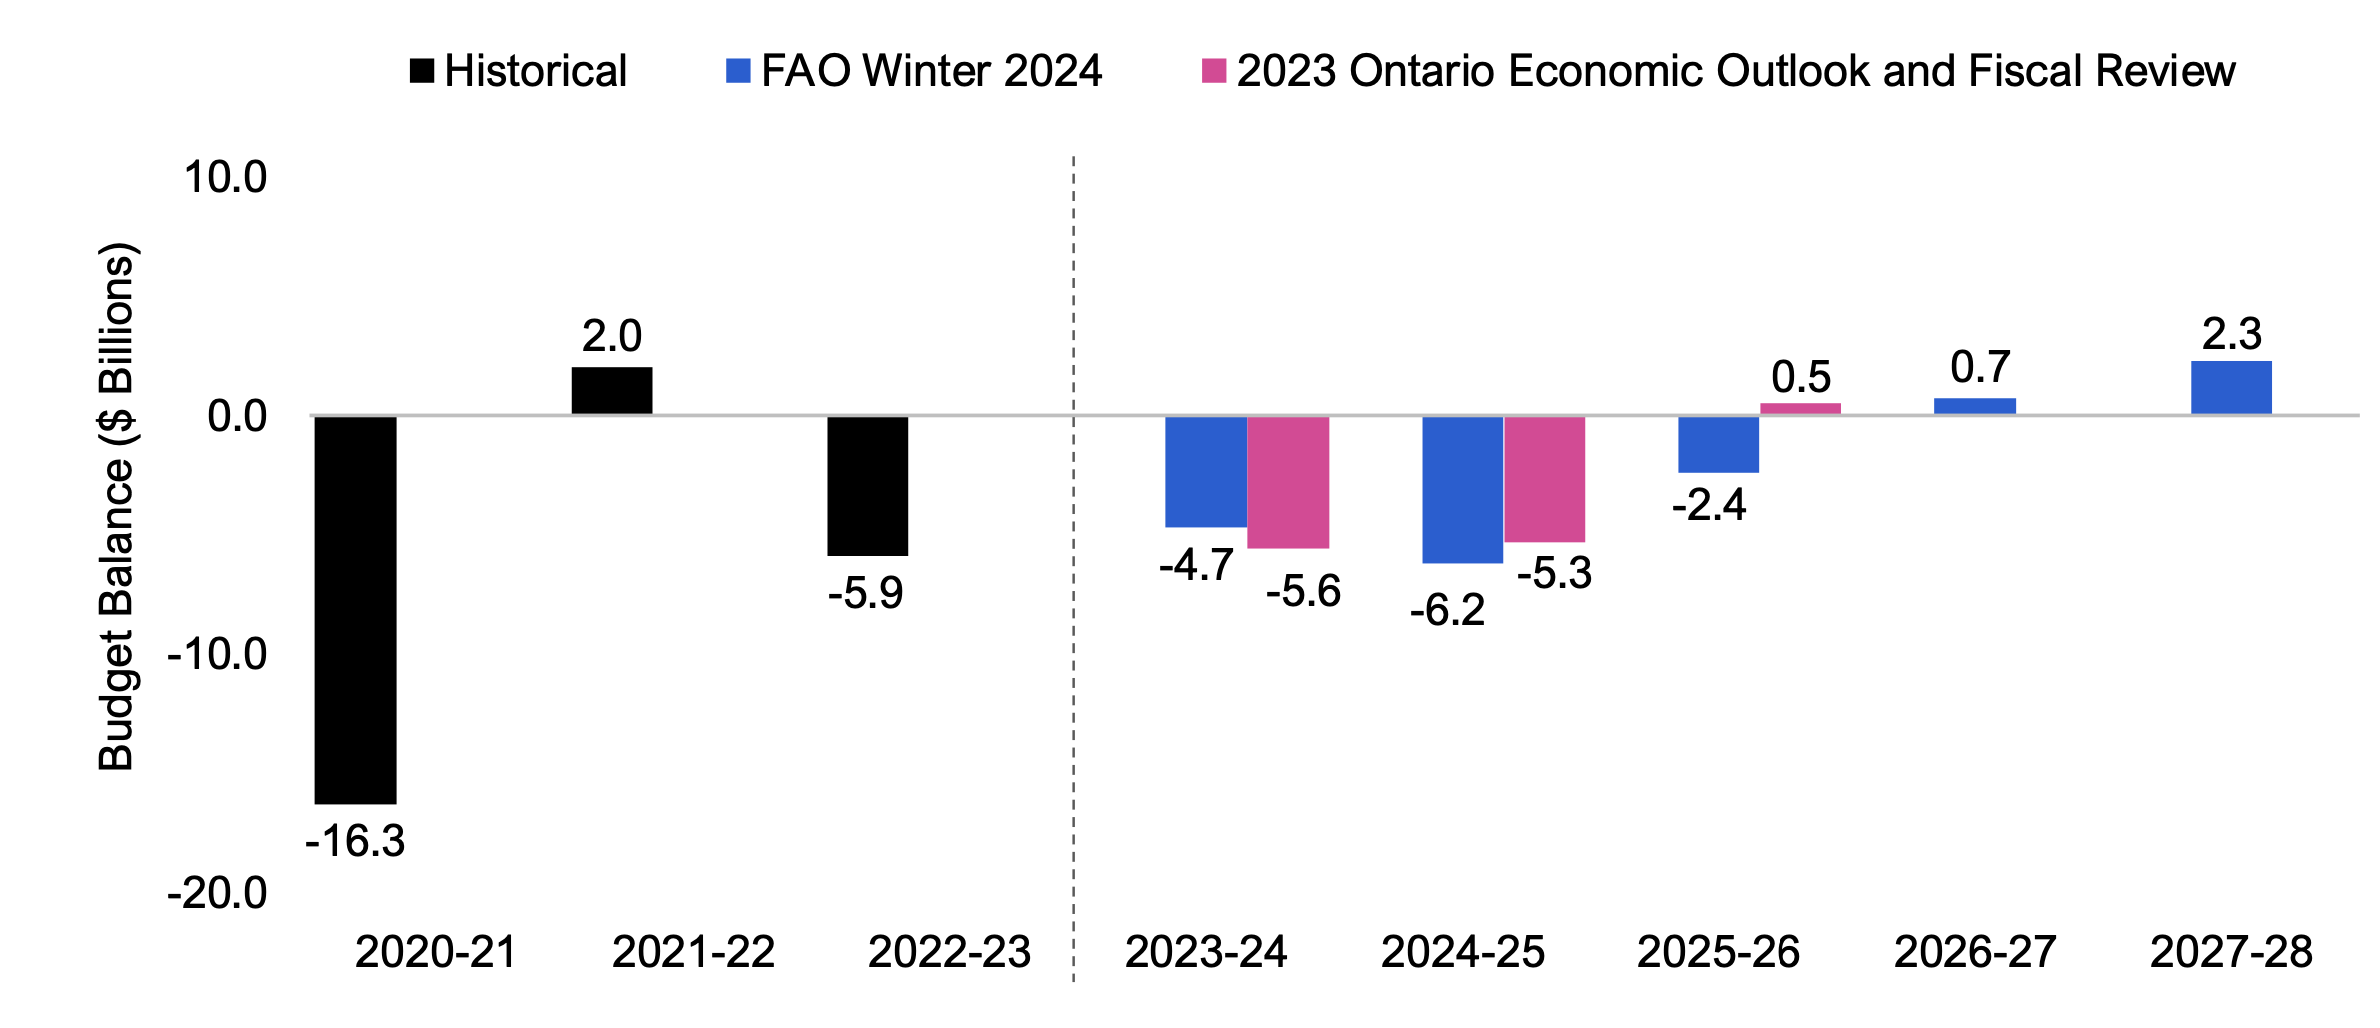
FAO projects balanced budget by 2026-27
Following a budget deficit of $5.9 billion in 2022-23, the FAO projects that Ontario’s budget deficit will decrease to $4.7 billion in 2023-24 and widen to $6.2 billion in 2024-25. Beyond 2024-25, the budget outlook is expected to improve as revenue gains outpace the growth in spending under current government policies and announced commitments, with the Province projected to record a balanced budget by 2026-27 and a budget surplus of $2.3 billion in 2027-28.
The FAO’s 2023-24 budget deficit projection of $4.7 billion is slightly smaller than the government’s $5.6 billion projected deficit in the 2023 Ontario Economic Outlook and Fiscal Review (FES). The FAO’s $0.9 billion smaller projected budget deficit for 2023-24 is comprised of:
- $4.9 billion in lower projected revenue;
- $4.8 billion in lower projected spending; and
- the exclusion of the government’s $1.0 billion budget reserve.
Figure 3.1 FAO projects budget deficits in the near term, followed by improvement
Source: Ontario Public Accounts, 2023 Ontario Economic Outlook and Fiscal Review and FAO
By 2025-26, the last year of the 2023 FES outlook, the government projects a $0.5 billion budget surplus. In contrast, the FAO expects Ontario to record a deficit of $2.4 billion. The $2.9 billion difference between the FAO’s outlook and the government’s projection for 2025-26 is comprised of:
- $4.6 billion in lower projected revenue;
- $0.3 billion in higher projected spending; and
- the exclusion of the government’s $2.0 billion budget reserve.
The FAO’s current budget outlook is a significant deterioration from the FAO’s Spring 2023 outlook, which expected growing budget surpluses over the forecast to 2027-28.[6] This significant downward revision is the result of lower than projected revenues and higher than projected spending (see the revenue and spending outlook chapters below for details). The FAO now expects the Province to record $74.1 billion more in net debt by 2027-28 when compared to the FAO’s spring projection. Despite this increase, Ontario’s net debt-to-GDP ratio is expected to remain below the government’s target.
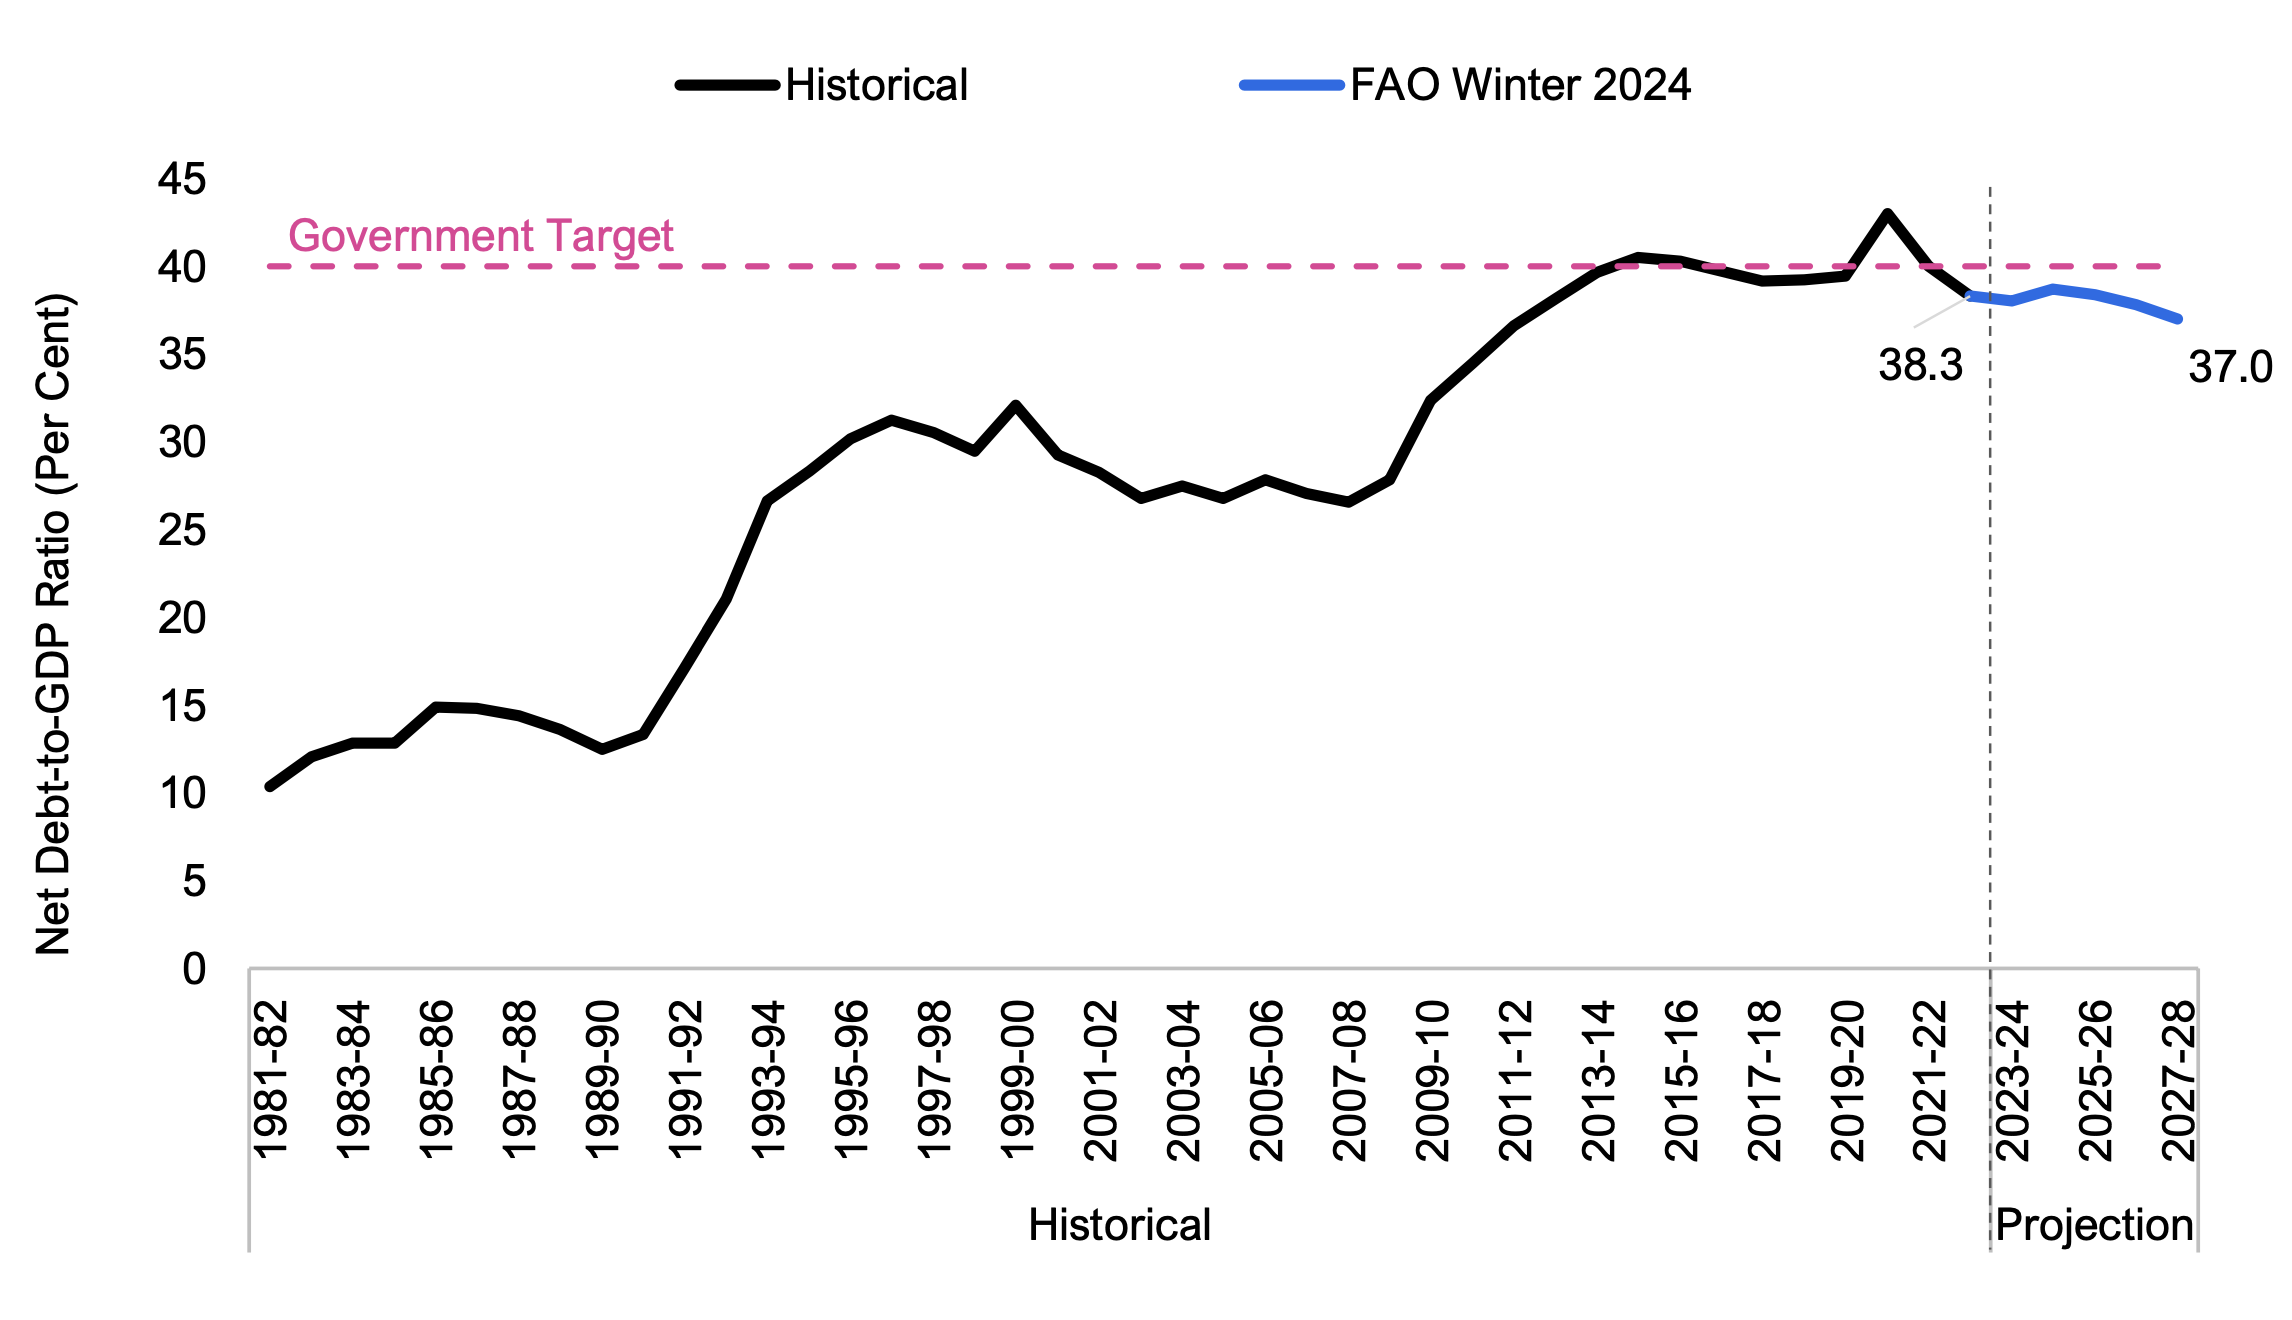
Ontario’s fiscal sustainability indicators
To assess Ontario’s fiscal sustainability, the FAO evaluates the projected trends in the net debt-to-GDP ratio and interest on debt as a share of revenue. Significant and prolonged deterioration in these indicators over time could raise concerns about the government’s ability to deliver on its budgetary commitments.
Net debt as a share of GDP is a fiscal sustainability indicator that provides information on the government’s ability to raise funds to service its debt obligations.[7] The FAO projects that the Province’s net debt-to-GDP ratio will increase from 38.3 per cent in 2022-23 to 38.7 per cent in 2024-25, before declining to 37.0 per cent by 2027-28 as GDP grows faster than the increase in net debt. Over the projection, the Province’s net debt-to-GDP ratio is expected to remain below the government’s target in the 2023 Ontario Budget of 40.0 per cent but above the historical average since 1981-82 of about 28 per cent.
Figure 3.2 Ontario’s net debt-to-GDP ratio is projected to improve
Source: Ontario Public Accounts, Ontario Economic Accounts and FAO
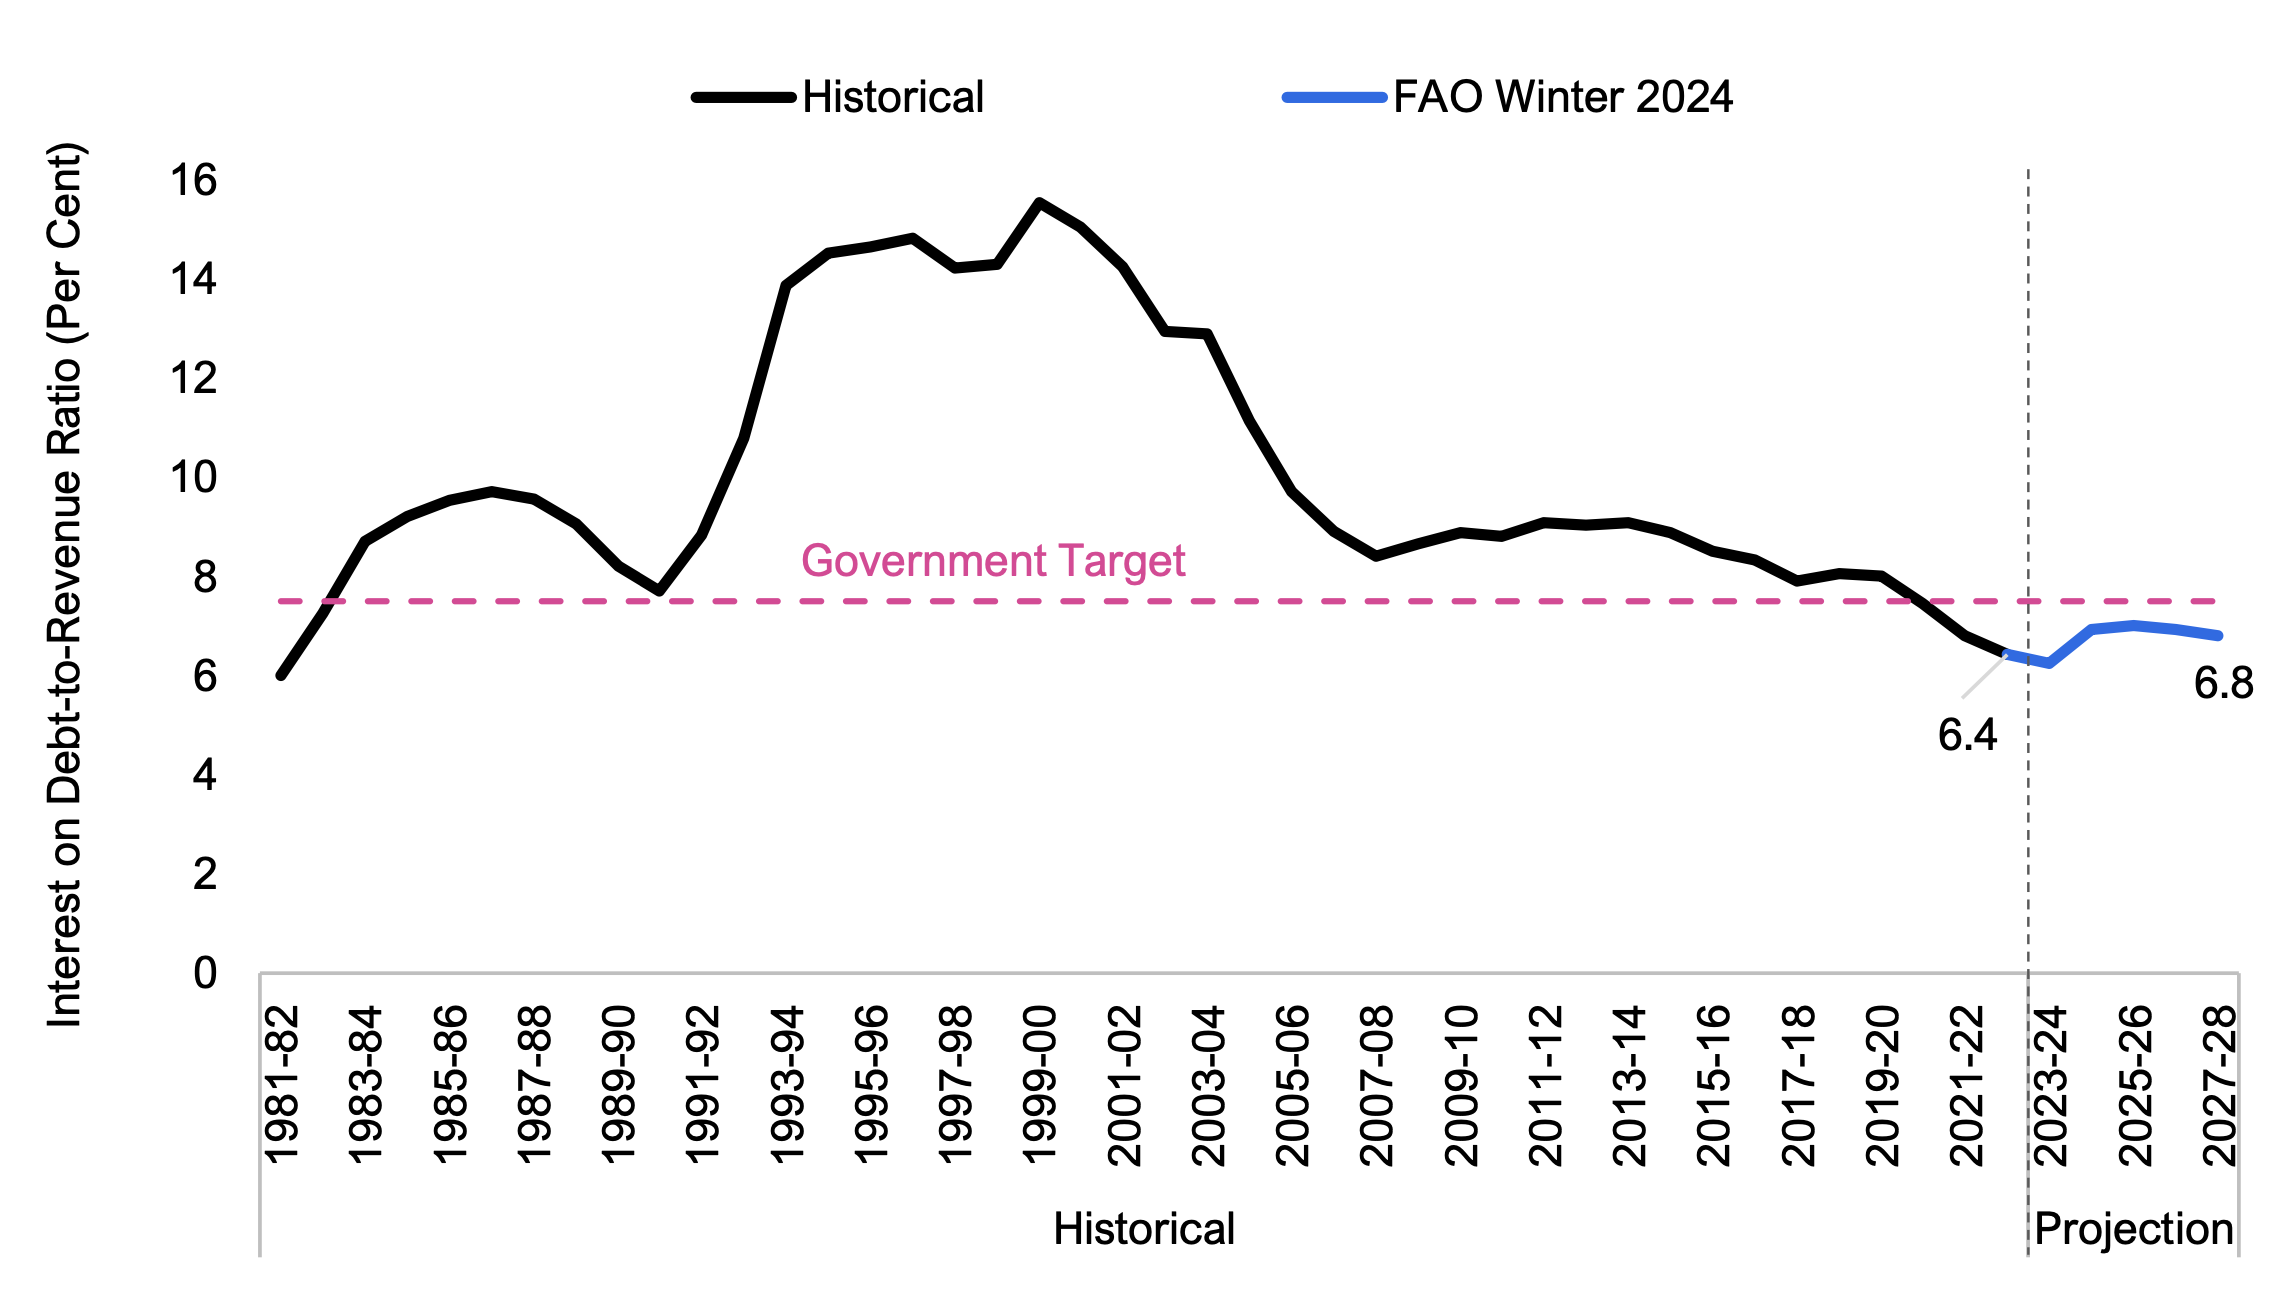
The ratio of interest on debt-to-revenue is a fiscal sustainability indicator of budgetary flexibility – a higher ratio indicates that the government has a smaller share of revenue available to spend on programs. Ontario’s debt interest payments as a share of revenue are projected to increase from 6.4 per cent in 2022-23 to 7.0 per cent in 2025-26, before declining slightly to 6.8 per cent by 2027-28, as Ontario is projected to return to budget surpluses by 2026-27. Over the projection, the Province’s interest on debt-to-revenue ratio is expected to remain below the government’s target in the 2023 Ontario Budget of 7.5 per cent and below the historical average since 1981-82 of 10.1 per cent.
Figure 3.3 Ontario’s interest on debt-to-revenue ratio is projected to deteriorate slightly
Source: Ontario Public Accounts and FAO
4. Revenue Outlook
Overview
Figure 4.1 Ontario’s revenue growth to moderate
Source: Statistics Canada, Ontario Public Accounts and FAO.
The FAO projects revenue growth will average 3.9 per cent per year from 2022-23 to 2027-28, lower than the 7.3 per cent average annual growth recorded during the COVID-19 pandemic. The moderation in revenue growth reflects slowing economic growth and the FAO's expectation that revenue growth will re-align with underlying economic activity.[8]
The 3.9 per cent average annual growth in total revenues from 2022-23 to 2027-28 incorporates the following:
- Tax revenue growth of 3.6 per cent per year, including personal income tax growth of 6.0 per cent, based on the FAO’s strong outlook for labour income; sales tax growth of 3.3 per cent, driven by the projected growth in consumer spending; and an average annual decline in corporations tax revenue of -0.8 per cent, reflecting the significant slump in corporate profits forecast for 2023.
- Federal government transfer revenue growth of 5.4 per cent annually, based on existing agreements with the federal government, including Canada Health Transfer growth of 6.1 per cent and Canada Social Transfer growth of 3.4 per cent.
- Revenue growth from government business enterprises and other non-tax revenues averaging 3.9 per cent per year, in line with underlying economic activity.
Comparison to Spring 2023 EBO revenue forecast
Compared to the Spring 2023 EBO, the FAO’s revenue projection has decreased by an average of $5.8 billion per year, for a cumulative total of $29.0 billion from 2023-24 to 2027-28, which is comprised of:
- $24.6 billion in lower projected personal income tax based on new information on 2022 tax returns and a downward revision to labour income in 2022 by Statistics Canada (released in November’s provincial economic accounts);[9]
- $8.3 billion in lower projected corporations tax due to a weaker projection for corporate profits over the outlook;
- $0.7 billion in lower revenue due to new economic information and forecast updates in all other taxes,[10] transfers from the Government of Canada, income from government business enterprises and other non-tax revenue; and
- $4.7 billion in higher projected sales tax revenue based on more up-to-date information from tax returns showing $0.3 billion higher revenue in 2022-23 and a stronger projection for household consumption.
Comparison to government revenue projection
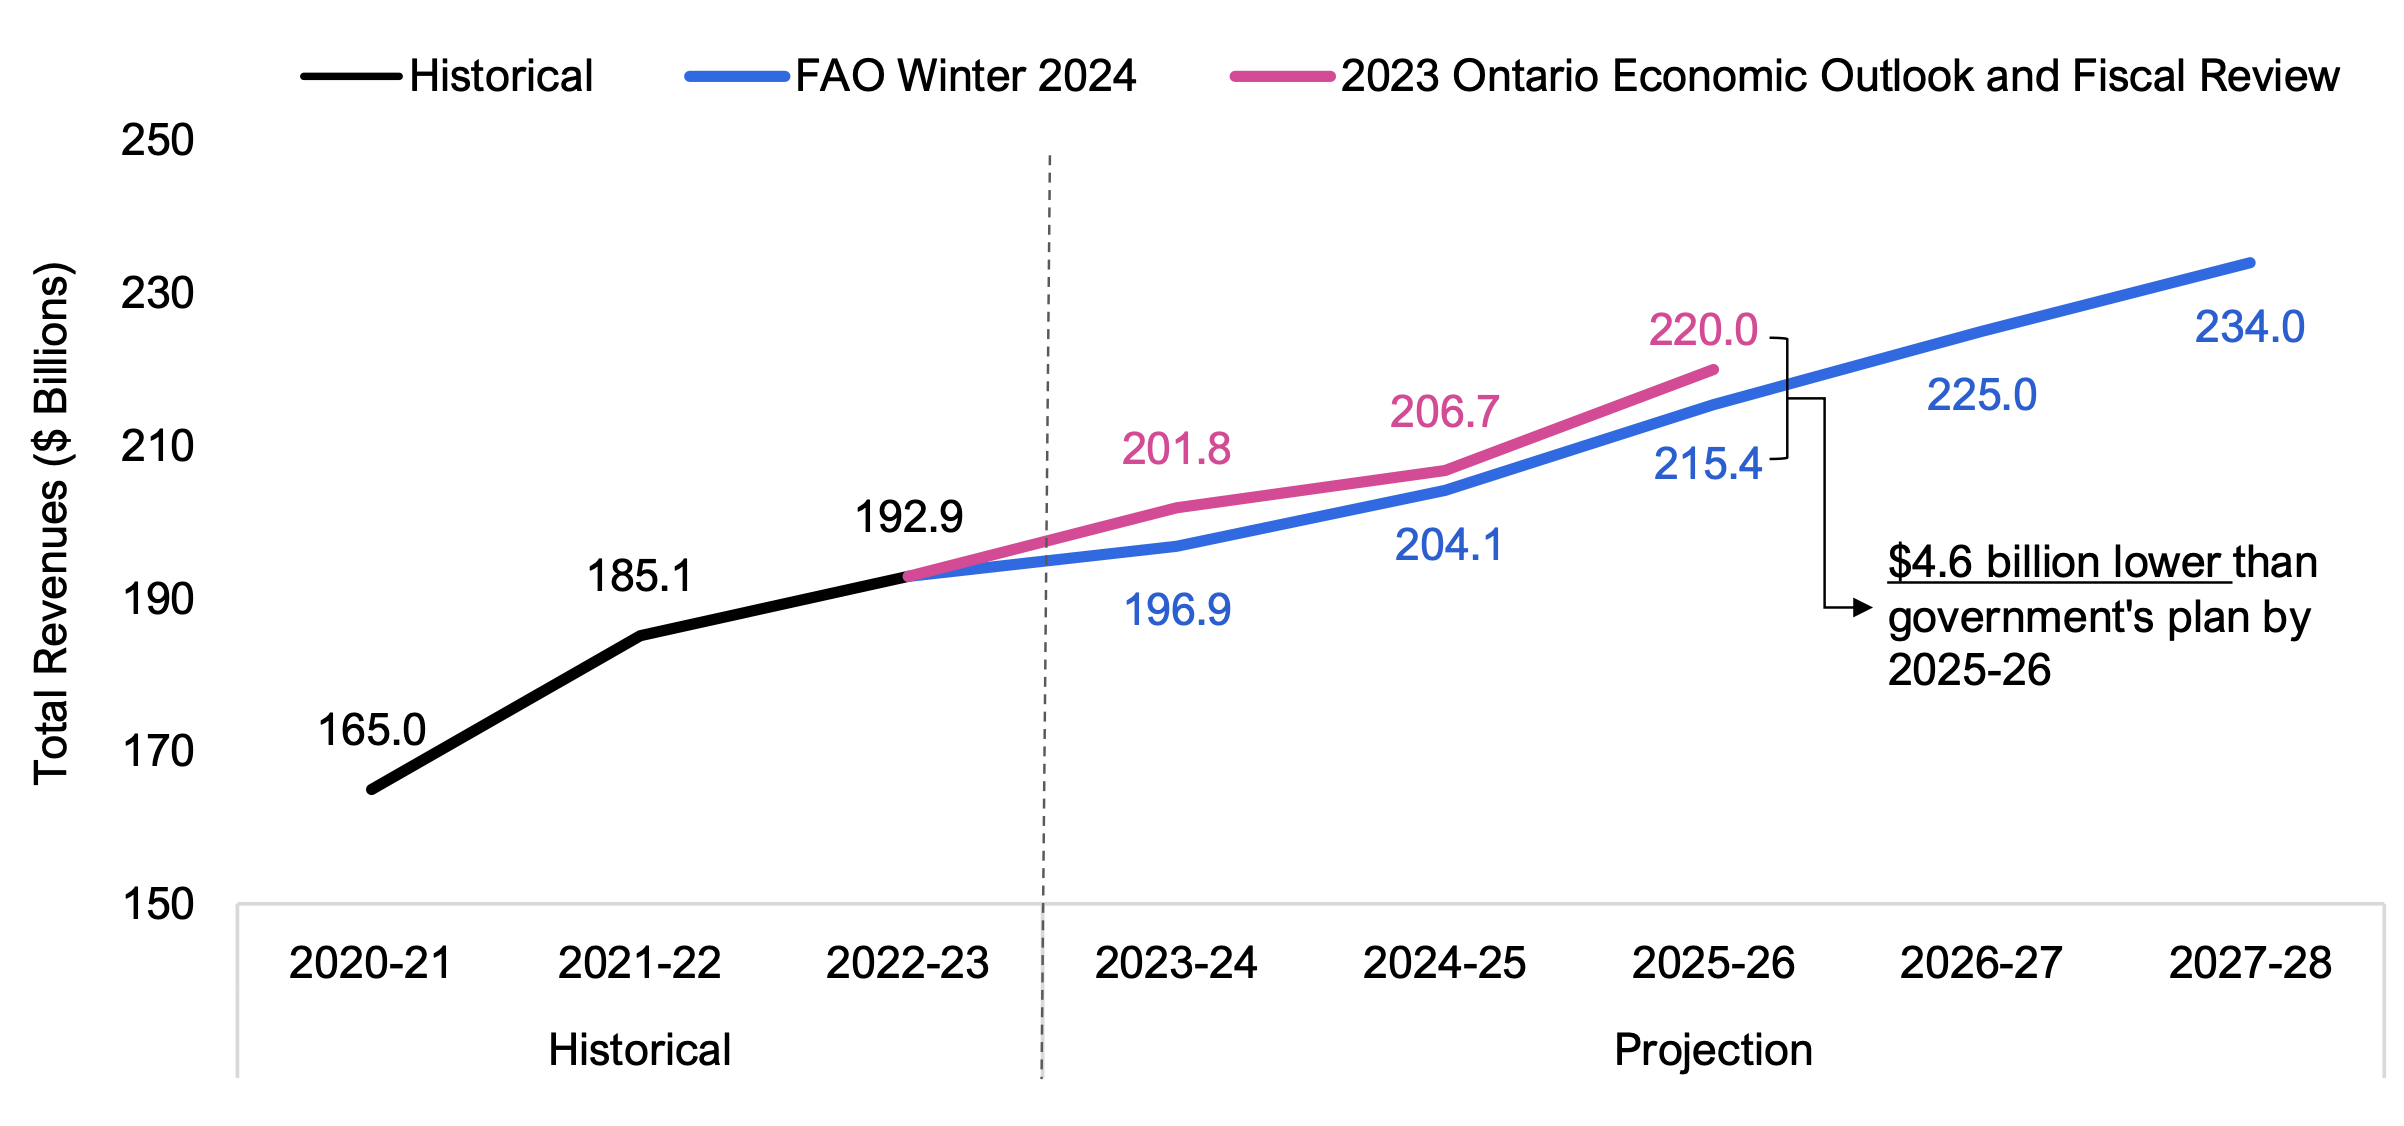
In 2023-24, the FAO projects $196.9 billion in total revenue, which is $4.9 billion lower than the government’s projection. By 2025-26, the last year of the government’s forecast, the difference narrows slightly to $4.6 billion.
Figure 4.2 Revenue projection, FAO compared to the government, $ billions
Source: Ontario Public Accounts, 2023 Ontario Economic Outlook and Fiscal Review and FAO
Of the $4.6 billion difference in the FAO’s revenue forecast in 2025-26 compared to the government’s, $4.2 billion results from the FAO’s weaker projection for sales tax and corporations tax revenues.
- The lower corporations tax revenue projection results from a weaker corporate profit forecast, due in part to downward revisions to economic data by Statistics Canada released after the publication of the FES.[11]
- The FAO assumes that sales tax revenues in 2022-23 will grow in line with economic drivers over the outlook. Despite having similar projections of the underlying economic drivers (which include household consumption and residential investment) over the outlook, the government’s projection of sales tax revenue is a cumulative $4.7 billion above the FAO’s from 2023-24 to 2025-26.
5. Spending Outlook
Overview
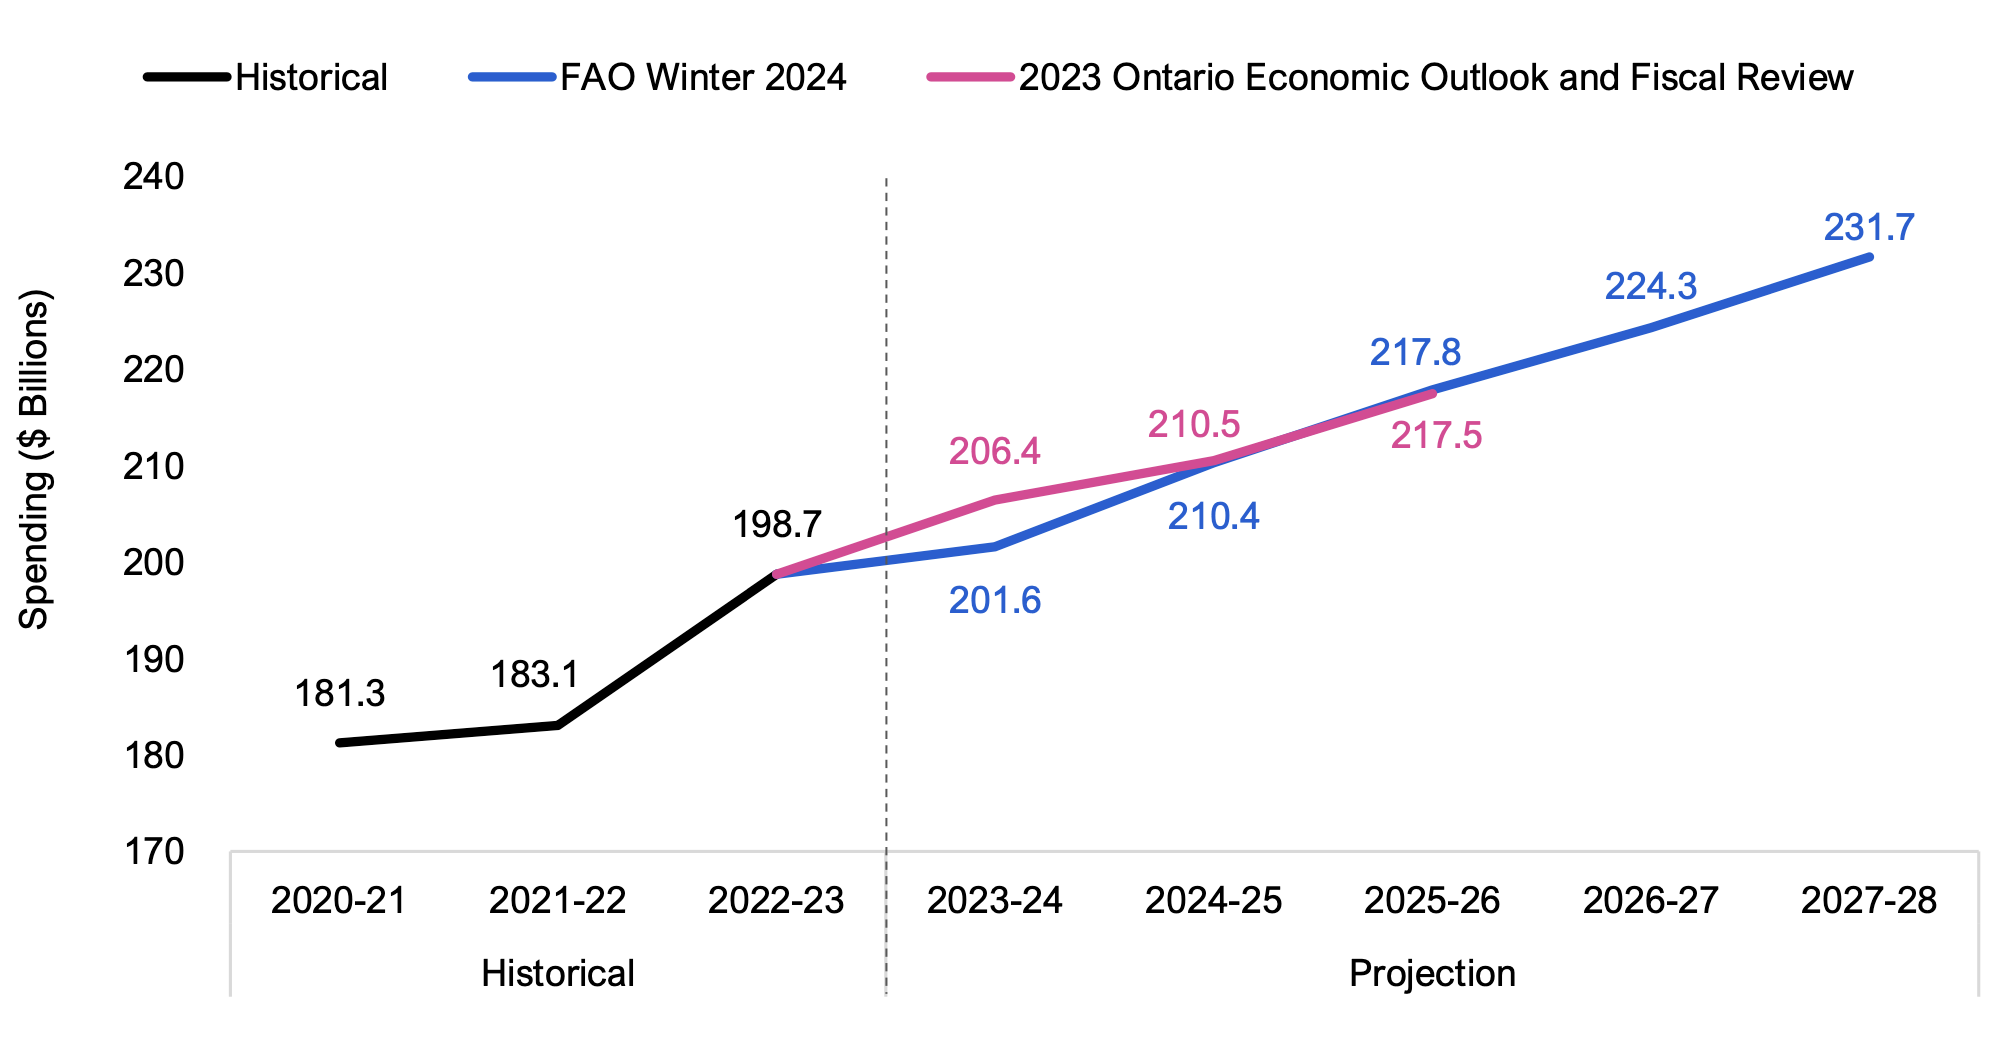
The FAO projects that the Province will spend $201.6 billion in 2023-24, an increase of $2.8 billion (1.4 per cent) from the previous year. By 2027-28, the FAO projects total spending will reach $231.7 billion, with an average annual growth rate of 3.1 per cent over the five-year period from 2022-23.
The government’s spending plan is similar to the FAO’s projection, with the exception of 2023-24 where the government’s spending plan is $4.8 billion above the FAO’s projection. This results in excess funds in 2023-24 that the FAO estimates are not required to support the cost of current programs and announced commitments. Excess funds can be used to introduce new programs, enhance existing programs or address spending pressures that materialize. Alternatively, if the Province decides not to use the excess funds, then these funds would be applied to improve the budget balance and reduce the Province’s net debt.
Figure 5.1 Spending projection, FAO compared to the government, $ billions
Note: Spending includes program spending and interest on debt expense.
Source: FAO analysis of the 2023 Ontario Economic Outlook and Fiscal Review and information provided by the Ministry of Finance.
Spending growth by sector
From 2022-23 to 2027-28, total spending is expected to grow by 3.1 per cent per year, lower than the 5.2 per cent average growth recorded from 2017-18 to 2022-23.[12] By comparison, inflation and population growth averaged a combined 4.6 per cent from 2017-18 to 2022-23 and are expected to average a combined 4.5 per cent from 2022-23 to 2027-28.
Figure 5.2 FAO’s spending projection by sector compared to historical, average annual growth (per cent)
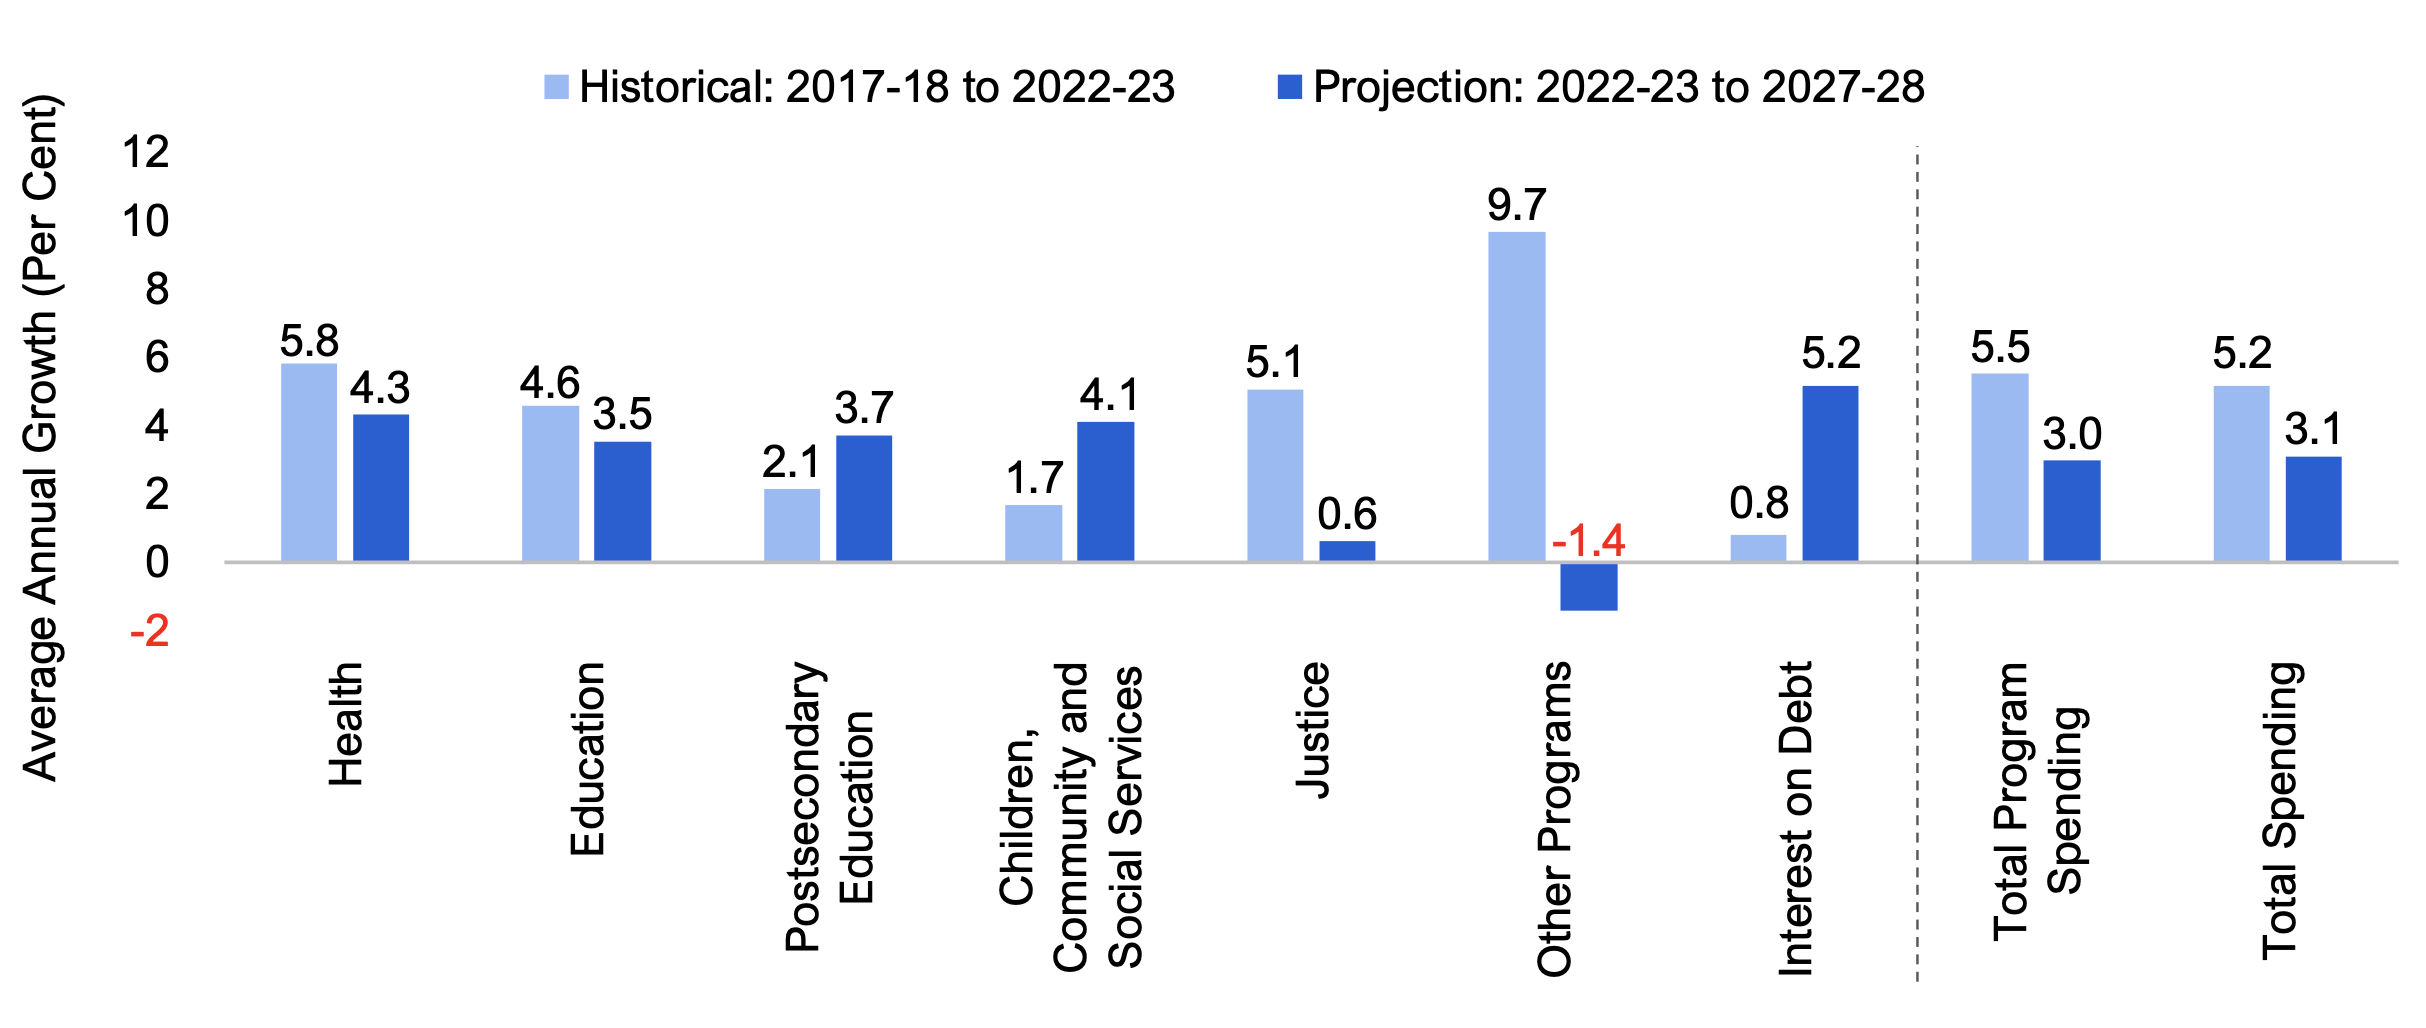
Note: Growth rates are impacted by temporary spending in 2022-23, which includes $6.3 billion for COVID-19-related supports and $6.3 billion in one-time payments for land and land-related claims with Indigenous communities. Excluding these one-time items, the FAO estimates average annual spending growth of 3.8 per cent from 2017-18 to 2022-23 and 4.5 per cent from 2022-23 to 2027-28.
Source: FAO analysis of the 2023 Ontario Economic Outlook and Fiscal Review and information provided by the Ministry of Finance.
From 2022-23 to 2027-28, the fastest growing sectors are expected to be interest on debt at 5.2 per cent average annual growth, followed by health (4.3 per cent), children, community and social services (4.1 per cent), postsecondary education (3.7 per cent) and education (3.5 per cent). ‘Other programs’ spending is projected to decline over the outlook, by negative 1.4 per cent per year, while justice spending is projected to increase by 0.6 per cent per year.
Comparison to Spring 2023 EBO spending forecast
Compared to the Spring 2023 EBO, the FAO’s spending projection has increased by an average of $6.7 billion per year, for a cumulative total of $33.4 billion from 2023-24 to 2027-28, of which:
- $16.6 billion is due to new government policy measures, including:
- a projected $10.1 billion in higher spending over five years on Ontario public sector salaries and wages due to awarded and expected compensation for the impact of wage restraint under Bill 124;[13]
- an estimated $3.2 billion in new spending due to the recently announced deal between the Province and the City of Toronto;[14] and
- $3.4 billion for all other new measures and program changes, largely for new health sector funding announced in the Fall Economic Statement; and
- $16.8 billion is due to economic, population and other forecast updates, including:
- a projected $4.7 billion in higher spending on Ontario public sector salaries and wages, primarily due to the impact of elevated inflation on new collective bargaining agreements;[15]
- an estimated $6.3 billion in higher spending on interest on debt to support the estimated $74.1 billion increase in net debt by 2027-28 when compared to the FAO’s spring projection; and
- a projected $5.8 billion in higher spending from updated cost estimates for existing programs and announced commitments, mostly due to forecast updates (largely in the ‘other programs’ sector) and the impact of higher projections for inflation and population growth.
Comparison to government spending plan
Compared to the FAO’s spending projection, the government’s total spending plan in the 2023 FES has $4.6 billion in excess funds from 2023-24 to 2025-26. All of the excess funds are in 2023-24, where the FAO’s projection is $4.8 billion lower than the government’s, primarily due to the FAO’s lower interest on debt projection and the contingency fund in the government’s spending plan. In 2024-25 and 2025-26, the FAO projects a small net shortfall of $0.2 billion.
| Sector | Spending Difference, Province vs. FAO, $ Millions | |||
|---|---|---|---|---|
| 2023-24 | 2024-25 | 2025-26 | Total | |
| Health | -948 | -132 | -1,155 | -2,235 |
| Education | -1,566 | -1,104 | -1,313 | -3,982 |
| Postsecondary Education | -57 | -20 | 81 | 3 |
| Children, Community and Social Services | 96 | -610 | -1,161 | -1,675 |
| Justice | 73 | -103 | -235 | -265 |
| Other Programs* | 6,073 | 1,946 | 3,380 | 11,399 |
| Program Spending Difference | 3,670 | -23 | -403 | 3,245 |
| Interest on Debt | 1,149 | 174 | 58 | 1,381 |
| Total Spending Difference | 4,820 | 151 | -345 | 4,626 |
By sector, the government’s spending plan contains three-year shortfalls in education ($4.0 billion), health ($2.2 billion), children, community and social services ($1.7 billion) and justice ($0.3 billion). These shortfalls are largely due to the government’s decision to provide compensation for the impact of wage restraint under Bill 124, which the FAO has included in the program sectors.
These shortfalls are offset by excess funds in ‘other programs’ ($11.4 billion), interest on debt ($1.4 billion) and postsecondary education ($3 million). The significant excess funds in ‘other programs’ is largely due to the government’s contingency fund, which is typically used to fund new programs, enhance existing programs or address spending pressures that materialize. The FAO does not include the contingency fund in its spending forecast as the purpose of the funds has not yet been announced.
6. Risks to the Economic and Budget Outlook
Risks
There are a number of risks that could impact the FAO’s economic and budget outlook over the projection. These factors pose both downside and upside risks to the FAO’s outlook.
Global economic uncertainty
Multiple geopolitical conflicts, volatility in global energy and commodity prices, and shipping delays could impact inflation and continue to overshadow the recovery in global trade and international investment. However, stronger economic activity in the United States could support a faster pace of growth in Ontario’s exports and increase provincial revenues.
Elevated inflation
If inflation proves more persistent than expected, the Bank of Canada may maintain its policy interest rate at a higher level for longer than anticipated. This would add further financial stress to households[16] and dampen the housing market and household spending. Slower than expected economic growth would negatively affect provincial revenues, while elevated inflation would apply upward pressure on program spending.
Public sector wages
The FAO has adjusted its spending outlook assumptions for public sector wage growth to account for the estimated impact of retroactive compensation for Bill 124 and higher than historical wage increases that have been awarded due to elevated inflation and labour market shortages.[17] However, many unions are still in negotiation or arbitration for new or revised collective agreements. Depending on the actual wage increases awarded in upcoming agreements, actual government spending on public sector wages may be higher or lower than the FAO’s spending projection.
The Ontario Infrastructure Bank and the upload of the Gardiner Expressway and Don Valley Parkway
The FAO’s spending outlook does not include the estimated cost of the newly announced Ontario Infrastructure Bank as the timing and structure of government funding is not yet known. Also, the FAO’s spending projection does not include the estimated cost of the upload to the Province of the Gardiner Expressway and Don Valley Parkway due to uncertainty surrounding the implementation of the upload. The FAO will update its spending projection to account for these measures as details are finalized.
Budget balance and net debt sensitivities
To illustrate the impact of potential policy changes on Ontario’s budget position, the FAO estimated the sensitivity of key budget indicators to changes in three main areas: tax policy, federal transfers and spending. For each policy item, Table 6.1 provides an estimate of the 2024-25 and 2027-28 change in the budget balance, the total change in net debt by 2027-28, and the change in the net debt-to-GDP ratio in 2027-28.
| Change in Budget Balance in: | Change in Net Debt by 2027-28 | Change in Net Debt-to-GDP Ratio by 2027-28 | ||
|---|---|---|---|---|
| 2024–25 | 2027–28 | |||
| Tax Policy | ||||
| Increasing/decreasing annual personal income taxes payable by $500 for the average taxpayer | +/-$5.3 billion | +/-$6.7 billion | +/-$23.9 billion | +/-1.9 ppt |
| A one percentage point increase/decrease to the 11.5 per cent provincial corporate tax rate | +/-$2.2 billion | +/-$2.7 billion | +/-$9.7 billion | +/-0.8 ppt |
| A one percentage point increase/decrease to the 8 per cent provincial HST rate | +/-$4.9 billion | +/-$6.2 billion | +/-$22.1 billion | +/-1.7 ppt |
| Federal Transfers | ||||
| A sustained one percentage point increase/decrease in the growth rate of the Canada Health Transfer | +/-$0.2 billion | +/-$1.0 billion | +/-$2.3 billion | +/-0.2 ppt |
| A sustained one percentage point increase/decrease in the growth rate of the Canada Social Transfer | +/-$0.1 billion | +/-$0.3 billion | +/-$0.8 billion | +/-0.1 ppt |
| Spending Policy | ||||
| A sustained one percentage point increase/decrease in the growth rate of health sector spending | +/-$0.9 billion | +/-$4.2 billion | +/-$9.8 billion | +/-0.8 ppt |
| A sustained one percentage point increase/decrease in the growth rate of education sector spending | +/-$0.4 billion | +/-$1.9 billion | +/-$4.4 billion | +/-0.3 ppt |
| A sustained one percentage point increase/decrease in Ontario public sector salaries and wages | +/-$0.6 billion | +/-$2.6 billion | +/-$6.2 billion | +/-0.5 ppt |
| A one percentage point increase/decrease in the cost of Provincial borrowing | +/-$0.4 billion | +/-$1.6 billion | +/-$4.2 billion | +/-0.3 ppt |
7. Appendix
| (Per Cent Growth) | 2021a | 2022a | 2023f | 2024f | 2025f-2028f Average* |
|---|---|---|---|---|---|
| Nominal GDP | |||||
| FAO | 9.8 | 9.2 | 4.2 | 3.1 | 4.1 |
| 2023 Ontario FES* | 9.8 | 9.2 | 3.6 | 2.9 | 4.5 |
| Labour Income | |||||
| FAO | 9.4 | 8.8 | 6.7 | 4.3 | 4.1 |
| 2023 Ontario FES | 9.4 | 8.8 | 6.3 | 3.9 | 4.5 |
| Corporate Profits | |||||
| FAO | 5.5 | -5.9 | -15.0 | 1.6 | 4.3 |
| 2023 Ontario FES | 5.5 | -5.9 | -9.2 | -3.1 | 6.2 |
| Household Consumption | |||||
| FAO | 7.5 | 13.2 | 6.0 | 3.4 | 4.1 |
| 2023 Ontario FES | 7.5 | 13.2 | 5.4 | 3.6 | 4.5 |
| 2021a | 2022a | 2023a | 2024f | 2025f-2028f Average* | |
|---|---|---|---|---|---|
| Real GDP (Per Cent Growth) | |||||
| FAO | 5.4 | 3.9 | 1.2 | 0.7 | 2.0 |
| 2023 Ontario FES* | 5.4 | 3.9 | 1.1 | 0.5 | 2.4 |
| Employment (Per Cent Growth) | |||||
| FAO | 5.2 | 4.6 | 2.4 | 0.4 | 1.5 |
| 2023 Ontario FES | 5.2 | 4.6 | 2.4 | 0.8 | 1.7 |
| Unemployment Rate (Per Cent) | |||||
| FAO | 8.1 | 5.6 | 5.7 | 6.8 | 6.4 |
| 2023 Ontario FES | 8.1 | 5.6 | 5.7 | 6.4 | 6.0 |
| CPI Inflation (Per Cent) | |||||
| FAO | 3.5 | 6.8 | 3.8 | 2.7 | 2.0 |
| 2023 Ontario FES | 3.5 | 6.8 | 3.8 | 2.5 | 2.1 |
| 3-month Treasury Bill Rate (Per Cent) | |||||
| FAO | 0.1 | 2.3 | 4.7 | 4.2 | 2.7 |
| 2023 Ontario FES | 0.1 | 2.3 | 4.7 | 4.4 | 2.8 |
| 10-year Government Bond Rate (Per Cent) | |||||
| FAO | 1.4 | 2.8 | 3.4 | 3.1 | 3.1 |
| 2023 Ontario FES | 1.4 | 2.8 | 3.4 | 3.3 | 3.2 |
| ($ Billions) | 2022-23a | 2023-24f | 2024-25f | 2025-26f | 2026-27f | 2027-28f |
|---|---|---|---|---|---|---|
| Revenue | ||||||
| Personal Income Tax | 44.2 | 49.6 | 51.7 | 54.2 | 56.7 | 59.2 |
| Annual Growth (Per Cent) | -5.4 | 12.3 | 4.1 | 4.9 | 4.6 | 4.4 |
| Sales Tax | 36.1 | 35.9 | 37.4 | 39.0 | 40.7 | 42.4 |
| Annual Growth (Per Cent) | 18.9 | -0.5 | 4.1 | 4.4 | 4.4 | 4.1 |
| Corporations Tax | 27.8 | 23.2 | 23.8 | 24.8 | 25.8 | 26.8 |
| Annual Growth (Per Cent) | 10.2 | -16.4 | 2.3 | 4.4 | 3.9 | 3.7 |
| All Other Taxes | 28.4 | 28.1 | 29.9 | 32.2 | 33.5 | 34.6 |
| Annual Growth (Per Cent) | -3.1 | -1.2 | 6.6 | 7.6 | 3.9 | 3.4 |
| Total Taxation Revenue | 136.5 | 136.9 | 142.8 | 150.3 | 156.7 | 163.0 |
| Annual Growth (Per Cent) | 3.7 | 0.3 | 4.3 | 5.3 | 4.3 | 4.0 |
| Transfers from Government of Canada | 31.3 | 34.5 | 35.9 | 37.0 | 39.0 | 40.6 |
| Annual Growth (Per Cent) | 2.1 | 10.4 | 3.9 | 3.1 | 5.5 | 4.1 |
| Income from Government Business Enterprise | 6.1 | 6.8 | 6.5 | 8.4 | 8.7 | 9.1 |
| Annual Growth (Per Cent) | -4.8 | 10.7 | -4.4 | 28.9 | 4.3 | 3.9 |
| Other Non-Tax Revenue | 19.0 | 18.7 | 19.0 | 19.8 | 20.5 | 21.3 |
| Annual Growth (Per Cent) | 16.1 | -1.4 | 1.7 | 3.9 | 3.9 | 3.6 |
| Total Revenue | 192.9 | 196.9 | 204.1 | 215.4 | 225.0 | 234.0 |
| Annual Growth (Per Cent) | 4.2 | 2.1 | 3.7 | 5.5 | 4.5 | 4.0 |
| Spending | ||||||
| Health Sector | 78.5 | 82.1 | 84.3 | 88.7 | 92.5 | 96.9 |
| Annual Growth (Per Cent) | 3.6 | 4.6 | 2.7 | 5.2 | 4.3 | 4.8 |
| Education Sector* | 36.2 | 38.0 | 39.2 | 40.6 | 42.1 | 43.1 |
| Annual Growth (Per Cent) | 14.7 | 4.9 | 3.3 | 3.5 | 3.5 | 2.4 |
| Children, Community and Social Services Sector | 18.1 | 19.3 | 20.5 | 21.1 | 21.7 | 22.2 |
| Annual Growth (Per Cent) | 6.2 | 6.4 | 6.1 | 3.1 | 2.6 | 2.4 |
| Postsecondary Education Sector | 11.6 | 12.2 | 12.6 | 12.9 | 13.4 | 14.0 |
| Annual Growth (Per Cent) | 9.6 | 4.6 | 3.1 | 3.0 | 3.8 | 4.0 |
| Justice Sector | 5.4 | 5.4 | 5.4 | 5.4 | 5.5 | 5.6 |
| Annual Growth (Per Cent) | 9.1 | -0.3 | 1.2 | -0.2 | 1.6 | 0.8 |
| Other Programs* | 36.5 | 32.3 | 34.1 | 33.9 | 33.5 | 34.0 |
| Annual Growth (Per Cent) | 19.5 | -11.5 | 5.6 | -0.8 | -1.1 | 1.5 |
| Total Program Spending | 186.4 | 189.3 | 196.2 | 202.7 | 208.7 | 215.7 |
| Annual Growth (Per Cent) | 9.3 | 1.6 | 3.7 | 3.3 | 2.9 | 3.4 |
| Interest on Debt | 12.4 | 12.3 | 14.2 | 15.1 | 15.6 | 15.9 |
| Annual Growth (Per Cent) | -1.5 | -0.7 | 15.2 | 6.6 | 3.2 | 2.3 |
| Total Spending | 198.7 | 201.6 | 210.4 | 217.8 | 224.3 | 231.7 |
| Annual Growth (Per Cent) | 8.5 | 1.4 | 4.4 | 3.5 | 3.0 | 3.3 |
| Budget Balance | -5.9 | -4.7 | -6.2 | -2.4 | 0.7 | 2.3 |
| ($ Billions) | 2022–23a | 2023–24f | 2024-25f | 2025-26f | 2026-27f | 2027-28f |
|---|---|---|---|---|---|---|
| Budget Balance | -5.9 | -4.7 | -6.2 | -2.4 | 0.7 | 2.3 |
| Accumulated Deficit | 246.8 | 251.5 | 257.7 | 260.1 | 259.4 | 257.1 |
| Net Debt | 400.5 | 415.2 | 435.6 | 452.2 | 464.4 | 472.6 |
| Net Debt-to-GDP (Per Cent) | 38.3 | 38.0 | 38.7 | 38.4 | 37.8 | 37.0 |
| FAO Revenue Projection Changes, $ Billions | ||||||
|---|---|---|---|---|---|---|
| 2023-24 | 2024-25 | 2025-26 | 2026-27 | 2027-28 | Total | |
| Spring 2023 EBO | 201.1 | 210.7 | 221.8 | 231.1 | 239.7 | - |
| New Government Measures | -0.3 | -0.2 | -0.1 | -0.1 | -0.1 | -0.8 |
| Forecast Updates | -3.8 | -6.4 | -6.3 | -6.0 | -5.7 | -28.2 |
| Total Changes | -4.2 | -6.6 | -6.4 | -6.1 | -5.8 | -29.0 |
| Winter 2024 EBO | 196.9 | 204.1 | 215.4 | 225.0 | 234.0 | - |
| FAO Program Spending Projection Changes, $ Billions | ||||||
|---|---|---|---|---|---|---|
| 2023-24 | 2024-25 | 2025-26 | 2026-27 | 2027-28 | Total | |
| Spring 2023 EBO | 198.1 | 203.4 | 211.2 | 216.3 | 223.3 | - |
| New Government Measures | 3.1 | 3.9 | 3.4 | 3.3 | 2.9 | 16.6 |
| Forecast Updates | 0.4 | 3.1 | 3.2 | 4.7 | 5.4 | 16.8 |
| Total Changes | 3.5 | 7.0 | 6.6 | 7.9 | 8.4 | 33.4 |
| Winter 2024 EBO | 201.6 | 210.4 | 217.8 | 224.3 | 231.7 | - |
| 2023-24 | 2024-25 | 2025-26 | |
|---|---|---|---|
| Budget Balance - 2023 Ontario Economic Outlook and Fiscal Review | -5.6 | -5.3 | 0.5 |
| Difference in FAO Projection (see Table Notes) | |||
| Revenue | -4.9 | -2.5 | -4.6 |
| Program Spending | 3.7 | 0.0 | -0.4 |
| Interest on Debt Expense | 1.1 | 0.2 | 0.1 |
| Reserve | 1.0 | 1.5 | 2.0 |
| Total Difference | 0.9 | -0.9 | -2.9 |
| Budget Balance - FAO Winter 2024 EBO | -4.7 | -6.2 | -2.4 |
Graphical Descriptions
| Real GDP Growth (Per Cent) | ||
|---|---|---|
| 2012-2019 | 2024-2028 | |
| World | 3.4 | 3.1 |
| Advanced economies | 1.9 | 1.7 |
| Emerging market and developing economies | 4.6 | 4.0 |
| Historical | Projection | ||||
|---|---|---|---|---|---|
| 2022 | 2023 | 2024 | 2025 | 2026-28 Average | |
| Annual CPI Inflation (Per Cent) | 6.8 | 3.8 | 2.7 | 2.1 | 2.0 |
| (Per Cent) | Historical | Projection | |||
|---|---|---|---|---|---|
| 2022 | 2023 | 2024 | 2025 | 2026-28 Average | |
| 3-month Treasury Bill Yield | 2.3 | 4.7 | 4.2 | 2.8 | 2.6 |
| 10-year Government of Canada Bond Yield | 2.8 | 3.4 | 3.1 | 2.9 | 3.2 |
| Historical | Projection | ||||
|---|---|---|---|---|---|
| 2021 | 2022 | 2023 | 2024 | 2025-28 Average | |
| Ontario Real GDP Growth (Per Cent) | 5.4 | 3.9 | 1.2 | 0.7 | 2.0 |
| Per Cent | Historical | Projection | |||
|---|---|---|---|---|---|
| 2022 | 2023 | 2024 | 2025 | 2026-28 Average | |
| Employment Growth | 4.6 | 2.4 | 0.4 | 1.7 | 1.5 |
| Unemployment Rate | 5.6 | 5.7 | 6.8 | 6.6 | 6.3 |
| Historical | Projection | ||||
|---|---|---|---|---|---|
| 2021 | 2022 | 2023 | 2024 | 2025-28 Average | |
| Nominal GDP Growth (Per Cent) | 9.8 | 9.2 | 4.2 | 3.1 | 4.1 |
| Budget Balance ($ Billions) | |||
|---|---|---|---|
| Historical | FAO Winter 2024 | 2023 Ontario Economic Outlook and Fiscal Review | |
| 2020-21 | -16.3 | ||
| 2021-22 | 2.0 | ||
| 2022-23 | -5.9 | ||
| 2023-24 | -4.7 | -5.6 | |
| 2024-25 | -6.2 | -5.3 | |
| 2025-26 | -2.4 | 0.5 | |
| 2026-27 | 0.7 | ||
| 2027-28 | 2.3 | ||
| Net Debt-to-GDP Ratio (Per Cent) | Historical | FAO Winter 2024 | Government Target | |
|---|---|---|---|---|
| Historical | 1981-82 | 10.4 | 40.0 | |
| 1982-83 | 12.1 | |||
| 1983-84 | 12.8 | |||
| 1984-85 | 12.9 | |||
| 1985-86 | 14.9 | |||
| 1986-87 | 14.8 | |||
| 1987-88 | 14.4 | |||
| 1988-89 | 13.6 | |||
| 1989-90 | 12.5 | |||
| 1990-91 | 13.4 | |||
| 1991-92 | 17.1 | |||
| 1992-93 | 21.1 | |||
| 1993-94 | 26.6 | |||
| 1994-95 | 28.3 | |||
| 1995-96 | 30.1 | |||
| 1996-97 | 31.2 | |||
| 1997-98 | 30.5 | |||
| 1998-99 | 29.4 | |||
| 1999-00 | 32.1 | |||
| 2000-01 | 29.3 | |||
| 2001-02 | 28.2 | |||
| 2002-03 | 26.8 | |||
| 2003-04 | 27.5 | |||
| 2004-05 | 26.8 | |||
| 2005-06 | 27.8 | |||
| 2006-07 | 27.1 | |||
| 2007-08 | 26.6 | |||
| 2008-09 | 27.8 | |||
| 2009-10 | 32.3 | |||
| 2010-11 | 34.5 | |||
| 2011-12 | 36.6 | |||
| 2012-13 | 38.2 | |||
| 2013-14 | 39.7 | |||
| 2014-15 | 40.5 | |||
| 2015-16 | 40.3 | |||
| 2016-17 | 39.7 | |||
| 2017-18 | 39.2 | |||
| 2018-19 | 39.3 | |||
| 2019-20 | 39.5 | |||
| 2020-21 | 43.0 | |||
| 2021-22 | 40.0 | |||
| 2022-23 | 38.3 | |||
| Projection | 2023-24 | 38.0 | ||
| 2024-25 | 38.7 | |||
| 2025-26 | 38.4 | |||
| 2026-27 | 37.8 | |||
| 2027-28 | 37.0 | |||
| Interest on Debt-to-Revenue Ratio (Per Cent) | Historical | FAO Winter 2024 | Government Target | |
|---|---|---|---|---|
| Historical | 1981-82 | 6.0 | 7.5 | |
| 1982-83 | 7.3 | |||
| 1983-84 | 8.7 | |||
| 1984-85 | 9.2 | |||
| 1985-86 | 9.5 | |||
| 1986-87 | 9.7 | |||
| 1987-88 | 9.6 | |||
| 1988-89 | 9.1 | |||
| 1989-90 | 8.2 | |||
| 1990-91 | 7.7 | |||
| 1991-92 | 8.8 | |||
| 1992-93 | 10.8 | |||
| 1993-94 | 13.9 | |||
| 1994-95 | 14.5 | |||
| 1995-96 | 14.6 | |||
| 1996-97 | 14.8 | |||
| 1997-98 | 14.2 | |||
| 1998-99 | 14.3 | |||
| 1999-00 | 15.5 | |||
| 2000-01 | 15.0 | |||
| 2001-02 | 14.2 | |||
| 2002-03 | 12.9 | |||
| 2003-04 | 12.9 | |||
| 2004-05 | 11.1 | |||
| 2005-06 | 9.7 | |||
| 2006-07 | 8.9 | |||
| 2007-08 | 8.4 | |||
| 2008-09 | 8.7 | |||
| 2009-10 | 8.9 | |||
| 2010-11 | 8.8 | |||
| 2011-12 | 9.1 | |||
| 2012-13 | 9.0 | |||
| 2013-14 | 9.1 | |||
| 2014-15 | 8.9 | |||
| 2015-16 | 8.5 | |||
| 2016-17 | 8.3 | |||
| 2017-18 | 7.9 | |||
| 2018-19 | 8.1 | |||
| 2019-20 | 8.0 | |||
| 2020-21 | 7.5 | |||
| 2021-22 | 6.8 | |||
| 2022-23 | 6.4 | |||
| Projection | 2023-24 | 6.2 | ||
| 2024-25 | 6.9 | |||
| 2025-26 | 7.0 | |||
| 2026-27 | 6.9 | |||
| 2027-28 | 6.8 | |||
| Average Annual Growth (Per Cent) | |||
|---|---|---|---|
| Historical | FAO Projection | ||
| Pre-pandemic (2013-14 to 2019-20) | Pandemic (2020-21 to 2022-23) | (2023-24 to 2027-28) | |
| Nominal GDP | 4.0 | 5.5 | 4.0 |
| Total Revenue | 3.8 | 7.3 | 3.9 |
| Total Revenues ($ Billions) | ||||
|---|---|---|---|---|
| Historical | FAO Winter 2024 | 2023 Ontario Economic Outlook and Fiscal Review | ||
| Historical | 2020-21 | 165.0 | ||
| 2021-22 | 185.1 | |||
| 2022-23 | 192.9 | |||
| Projection | 2023-24 | 196.9 | 201.8 | |
| 2024-25 | 204.1 | 206.7 | ||
| 2025-26 | 215.4 | 220.0 | ||
| 2026-27 | 225.0 | |||
| 2027-28 | 234.0 | |||
| Spending ($ Billions) | ||||
|---|---|---|---|---|
| Historical | FAO | 2023 Ontario Economic Outlook and Fiscal Review | ||
| Historical | 2020-21 | 181.3 | ||
| 2021-22 | 183.1 | |||
| 2022-23 | 198.7 | |||
| Projection | 2023-24 | 201.6 | 206.4 | |
| 2024-25 | 210.4 | 210.5 | ||
| 2025-26 | 217.8 | 217.5 | ||
| 2026-27 | 224.3 | |||
| 2027-28 | 231.7 | |||
| Average Annual Growth (Per Cent) | ||
|---|---|---|
| Sector | Historical 2017-18 to 2022-23 | Projection 2022-23 to 2027-28 |
| Health | 5.8 | 4.3 |
| Education | 4.6 | 3.5 |
| Postsecondary Education | 2.1 | 3.7 |
| Children, Community and Social Services | 1.7 | 4.1 |
| Justice | 5.1 | 0.6 |
| Other Programs | 9.7 | -1.4 |
| Interest on Debt | 0.8 | 5.2 |
| Total Program Spending | 5.5 | 3.0 |
| Total Spending | 5.2 | 3.1 |
Footnotes
[1] World Economic Outlook, International Monetary Fund, October 2023.
[2]Market Participants Survey: Third Quarter of 2023, Bank of Canada, November 2023.
[3] Since the FAO’s Spring 2023 Economic and Budget Outlook, the Ontario Ministry of Finance revised up its projection for Ontario’s 2023-2027 average annual population growth from 1.5 per cent to 2.2 per cent. The Ministry now expects over 500,000 more people in 2027. See: Ontario population projections.
[4] Examples of recently announced government plans include housing measures outlined in the federal government’s 2023 Fall Economic Statement such as increased funding for the Apartment Construction Loan Program and the Affordable Housing Fund, and agreements with Ontario municipalities through the Housing Accelerator Fund.
[5] The FAO will provide a detailed update in its annual labour market report in early 2024.
[6] FAO, Spring 2023 Economic and Budget Outlook.
[7] For more information on fiscal sustainability indicators, see Chapter 2 of the FAO’s Long-Term Budget Outlook: Assessing Ontario’s Fiscal Sustainability: 2021-2050 report.
[8] During the pandemic period, total revenue growth was much stronger than the underlying economic drivers would normally suggest. This strength was due in part to unprecedented government support for households and businesses, which helped support incomes during the pandemic. In addition, much higher inflation raised the growth in personal income (PIT) taxes above the rate of personal income growth in part because the top two PIT brackets are not indexed for inflation. Sales taxes (HST) grew more strongly than household consumption, reflecting the significant increase in home prices, which are subject to HST.
[9] This resulted in a $6.1 billion downward revision to the 2022-23 personal income tax (PIT) revenue base, which lowers the entire PIT projection.
[10] Taxation revenue excluding personal income tax, sales tax and corporations tax.
[11] Annual corporate profits (net operating surplus) in Ontario in 2022 were revised down from an initial estimate of 4.3 per cent growth in the Ontario Economic Accounts to a 5.9 per cent decline in Statistics Canada’s latest release of the Provincial and Territorial Economic Accounts (November 2023), released after the publication of the FES.
[12] Growth rates are impacted by temporary spending in 2022-23, which includes $6.3 billion for COVID-19-related supports and $6.3 billion in one-time payments for land and land-related claims with Indigenous communities. Excluding these one-time items, the FAO estimates average annual spending growth of 3.8 per cent from 2017-18 to 2022-23 and 4.5 per cent from 2022-23 to 2027-28.
[13] The FAO’s current spending forecast now assumes that all union and non-union public sector employees that were subjected to Bill 124 (the Protecting a Sustainable Public Sector for Future Generations Act, 2019) will receive wage increases to adjust for the impact of the legislation. While, as of the writing of this report, the government has appealed the decision by the Ontario Superior Court of Justice that declared Bill 124 to be void and of no effect, retroactive wage increases have already been awarded through both arbitration and government decisions. For example, in 2023, the Ontario Nurses’ Association, the College Employer Council and some Ontario Public Service Employees Union (OPSEU) bodies were awarded retroactive wage increases for the impact of Bill 124, and the government has agreed with the Elementary Teachers’ Federation of Ontario to provide retroactive compensation. The Province has also recorded a $2.5 billion contingent liability in the 2022-23 Public Accounts of Ontario to recognize the potential impact of retroactive payments. Overall, the FAO estimates that the cost to the Province to provide wage increases to adjust for the impact of Bill 124 from 2022-23 to 2027-28 will total $13.7 billion.
[14] The FAO’s estimate includes funding for transit and homelessness, a portion of which is conditional on federal government support. The FAO’s estimate excludes the cost for the upload of the Gardiner Expressway and Don Valley Parkway as details regarding this transaction remain uncertain. See Ontario and Toronto Reach a New Deal, Ontario News Release, November 27, 2023.
[15] The FAO’s Spring 2023 EBO spending forecast assumed that wage growth would be in line with long-term historical averages for upcoming collective agreements. However, the FAO’s spending forecast now assumes base salary wage growth of between 3.0 per cent to 3.5 per cent for 2023-24 and 2024-25, followed by a return to a historical average of approximately 2.4 per cent. The FAO’s new wage assumption is based on observed wage growth terms in new public sector agreements. For example, the Province reached agreements with approximately 55,000 education workers who are members of the Canadian Union of Public Employees (CUPE) that provided an average annual wage increase of more than 3.0 per cent per year for four years, and Ontario Nurses’ Association members were awarded wage increases of 3.5 per cent in 2023 and 3.0 per cent in 2024. Overall, the FAO estimates that the impact of elevated inflation on the cost of Ontario public sector salaries and wages will total $8.0 billion from 2023-24 to 2027-28.
[16] Ontario’s household debt-to-income ratio rose to a record high in early 2022 and has remained highly elevated through the first three quarters of 2023. Statistics Canada: National Balance Sheet Accounts: Table: 36-10-0665-01.
[17] For example, in July 2023, Ontario Nurses’ Association members were awarded wage increases of 3.5 per cent in 2023 and 3.0 per cent in 2024. In the decision, the arbitrator cited high inflation and severe shortages of Registered Nurses as reasons for awarding higher wage increases than the prior three years. See https://www.ona.org/wp-content/uploads/participating-hospitals-ona-2023-hospital-decision.pdf.