


Click here for an interactive map of School Board Indicators.
1. Summary
- This report examines how provincial funding is allocated to Ontario’s 72 district school boards and reviews differences across English Public, English Catholic, French Public and French Catholic school systems. In addition, the report analyzes the demographic composition of Ontario’s students and the availability of French-system and Catholic-system school spaces; analyzes school board spending, budget balance and accumulated surplus patterns; and discusses academic performance by school board and system.
- Additional information for each school board is available on the FAO’s website at: https://tinyurl.com/yh5xncud.
School Boards and Enrolment
- In 2021-22, there were approximately 2.0 million children enrolled in Ontario’s public schools across the four school systems. The English Public school system is the largest, with 31 school boards and 1.3 million students enrolled in 2021-22, followed by the English Catholic system, with 29 school boards and 554,739 students, the French Catholic system, with eight school boards and 76,501 students, and the French Public system, with four school boards and 34,588 students.
- English Public and Catholic school boards had higher average enrolment (42,965 students and 19,129 students in 2021-22, respectively) compared to French Public and French Catholic school boards (8,647 students and 9,563 students, respectively).
- French school boards cover larger geographic areas. On average, French Public school boards cover 54,715 square kilometres, while French Catholic school boards cover 25,392 square kilometres. The English Public and English Catholic school boards cover significantly smaller territory, on average, at 7,060 square kilometres and 6,995 square kilometres, respectively.
- Section 23 of the Canadian Charter of Rights and Freedoms guarantees the right to access French-language education in Ontario for the children of French-language rights-holders. In 2021, there were 268,250 school-aged children and youth whose parents were French-language rights-holders.
- In 2021, there were 158,309 total spaces[1] in French-system schools (Public and Catholic) for the Province’s 268,250 school-aged children and youth whose parents were French-language rights-holders, resulting in a coverage rate of 59.0 per cent.
- There were large regional differences in coverage. In 2021, 30 out of 49 census divisions in Ontario had a coverage rate below 50 per cent, 12 of which, with a combined 5,195 children and youth with French-language rights-holding parents, had no French-system schools at all. Within the Greater Toronto and Hamilton Area (GTHA), coverage ranged from 19 per cent (Peel) to 37 per cent (Hamilton), while Ottawa had a coverage rate of 71 per cent.
- The Province supports separate schools for Roman Catholic children in Ontario. The FAO estimates that, in 2021, there were 570,116 school-aged children and youth in Ontario who identified as Catholic or had at least one Catholic parent.
- In 2021, there were 725,416 spaces in Catholic schools, leading to a coverage rate of 127.2 per cent.
- Of the province’s 49 census divisions, 38 had Catholic-system coverage rates greater than 100 per cent, and eight had coverage rates below 100 per cent but greater than 50 per cent. Of the remaining three census divisions, one had a coverage rate of 36 per cent (Lennox and Addington) and two, Haliburton and Manitoulin, had no Catholic-system schools.
Provincial Operating Funding for School Boards
- In the 2021-22 school year, the Ministry of Education provided an estimated $26.7 billion in operating funding to school boards through three programs: $25.4 billion through a collection of grants called the Grants for Student Needs (GSN), $1.3 billion through the Priorities and Partnership Fund (PPF), and $23 million through the Ontario Languages Projects (OLP) program.
- On a per-student basis, school boards received an average of $13,364 in provincial funding in 2021-22. However, the amount of per-student funding varied significantly by school board, ranging from $11,729 per student for the Halton Catholic District School Board (DSB) to $35,192 per student for the Conseil scolaire de district (CSD) catholique des Aurores boréales.
- By school system, on a per-student basis, the English Public and English Catholic systems received $13,027 and $13,252 in 2021-22, respectively. French-language school systems received higher per-student funding at $18,585 per student for the French Public system and $17,680 per student for the French Catholic system.
- The primary factor that determines provincial funding to school boards is student enrolment, as measured by school boards’ Average Daily Enrolment (ADE). However, there are additional key factors that explain the difference in per-student funding between school boards and school systems, including: base funding (some provincial grants provide a minimum fixed amount to each school board regardless of size), distance and dispersion (additional funding is provided to school boards with schools that are far apart from one another),[2] remoteness (additional funding is provided to school boards with schools that are far from an urban centre), and additional funding for French-language instruction.
- On average, French-system school boards receive higher per-student funding because they have lower enrolment, have higher dispersion, are more remote, and receive targeted French-language funding.
Total School Board Revenue
- In the 2021-22 school year, Ontario school boards recorded $29.0 billion in revenue, which included operating funding provided by the Province and own source revenue[3] ($27.3 billion), revenue for infrastructure projects ($1.6 billion), which is largely funded by the Province, and federal operating transfers ($0.2 billion).
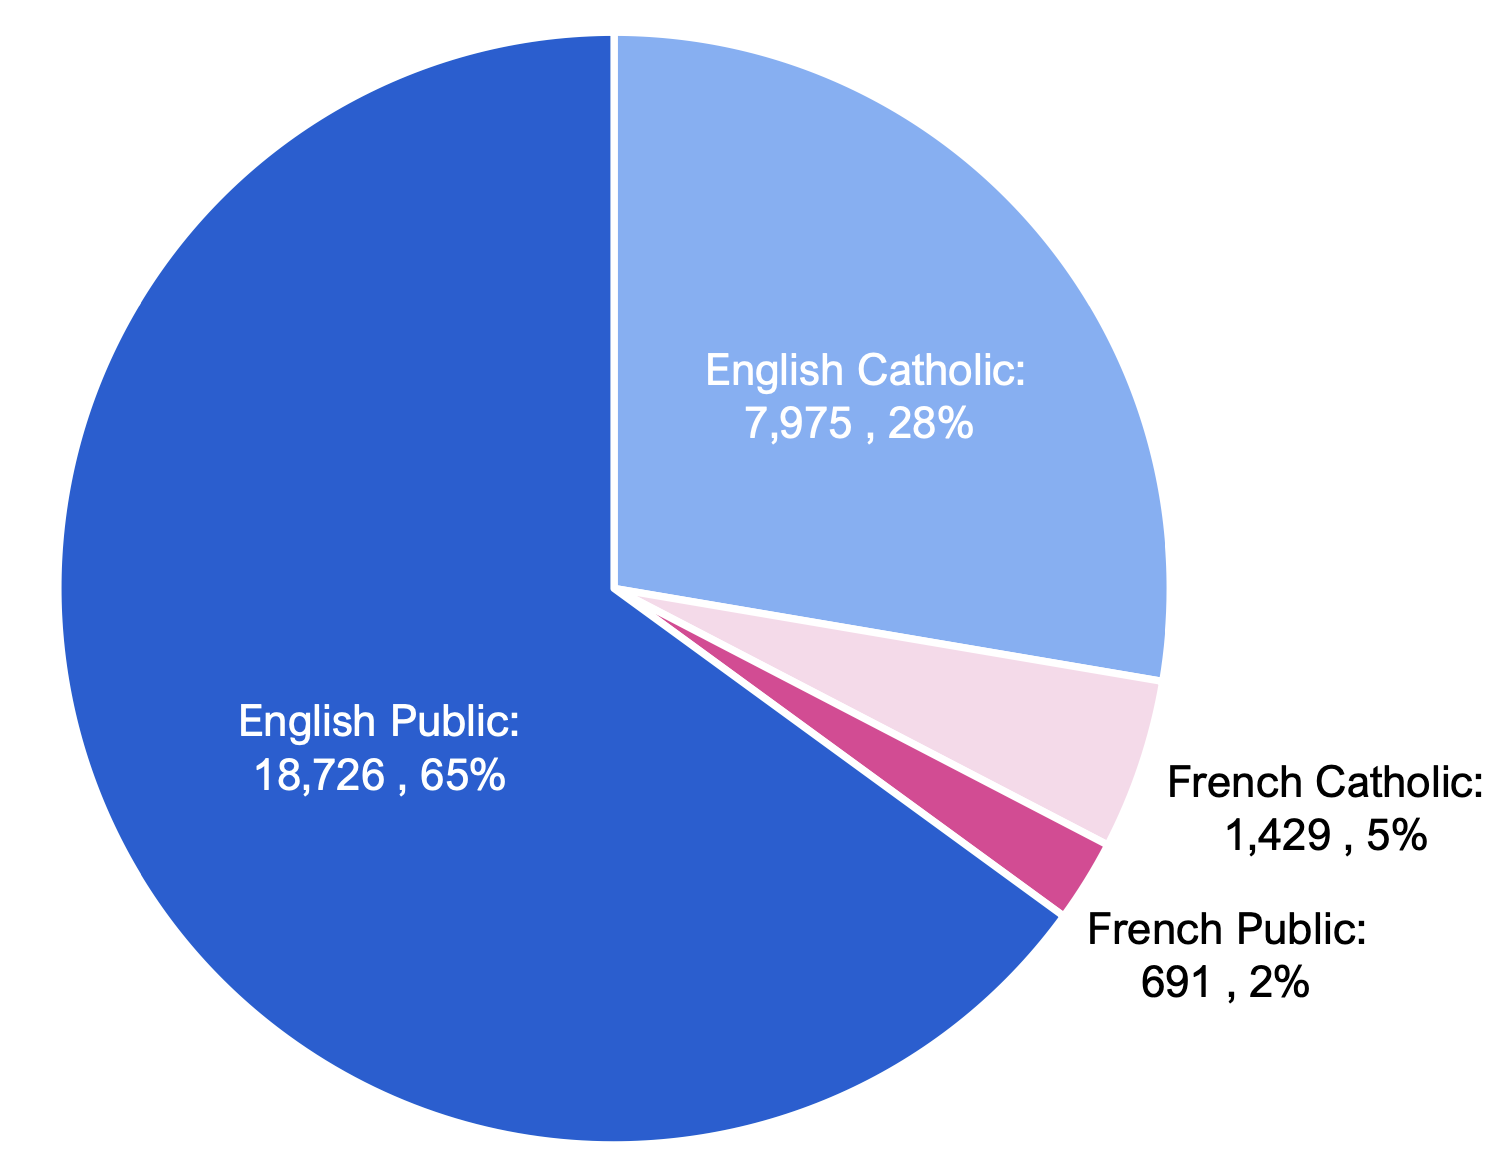
- Of the $29.0 billion in total school board revenue, English Public school boards accounted for $18.8 billion (64.9 per cent), followed by English Catholic school boards at $8.0 billion (27.6 per cent). French Catholic and French Public school boards had significantly lower total revenue at $1.5 billion (5.0 per cent) and $0.7 billion (2.4 per cent).
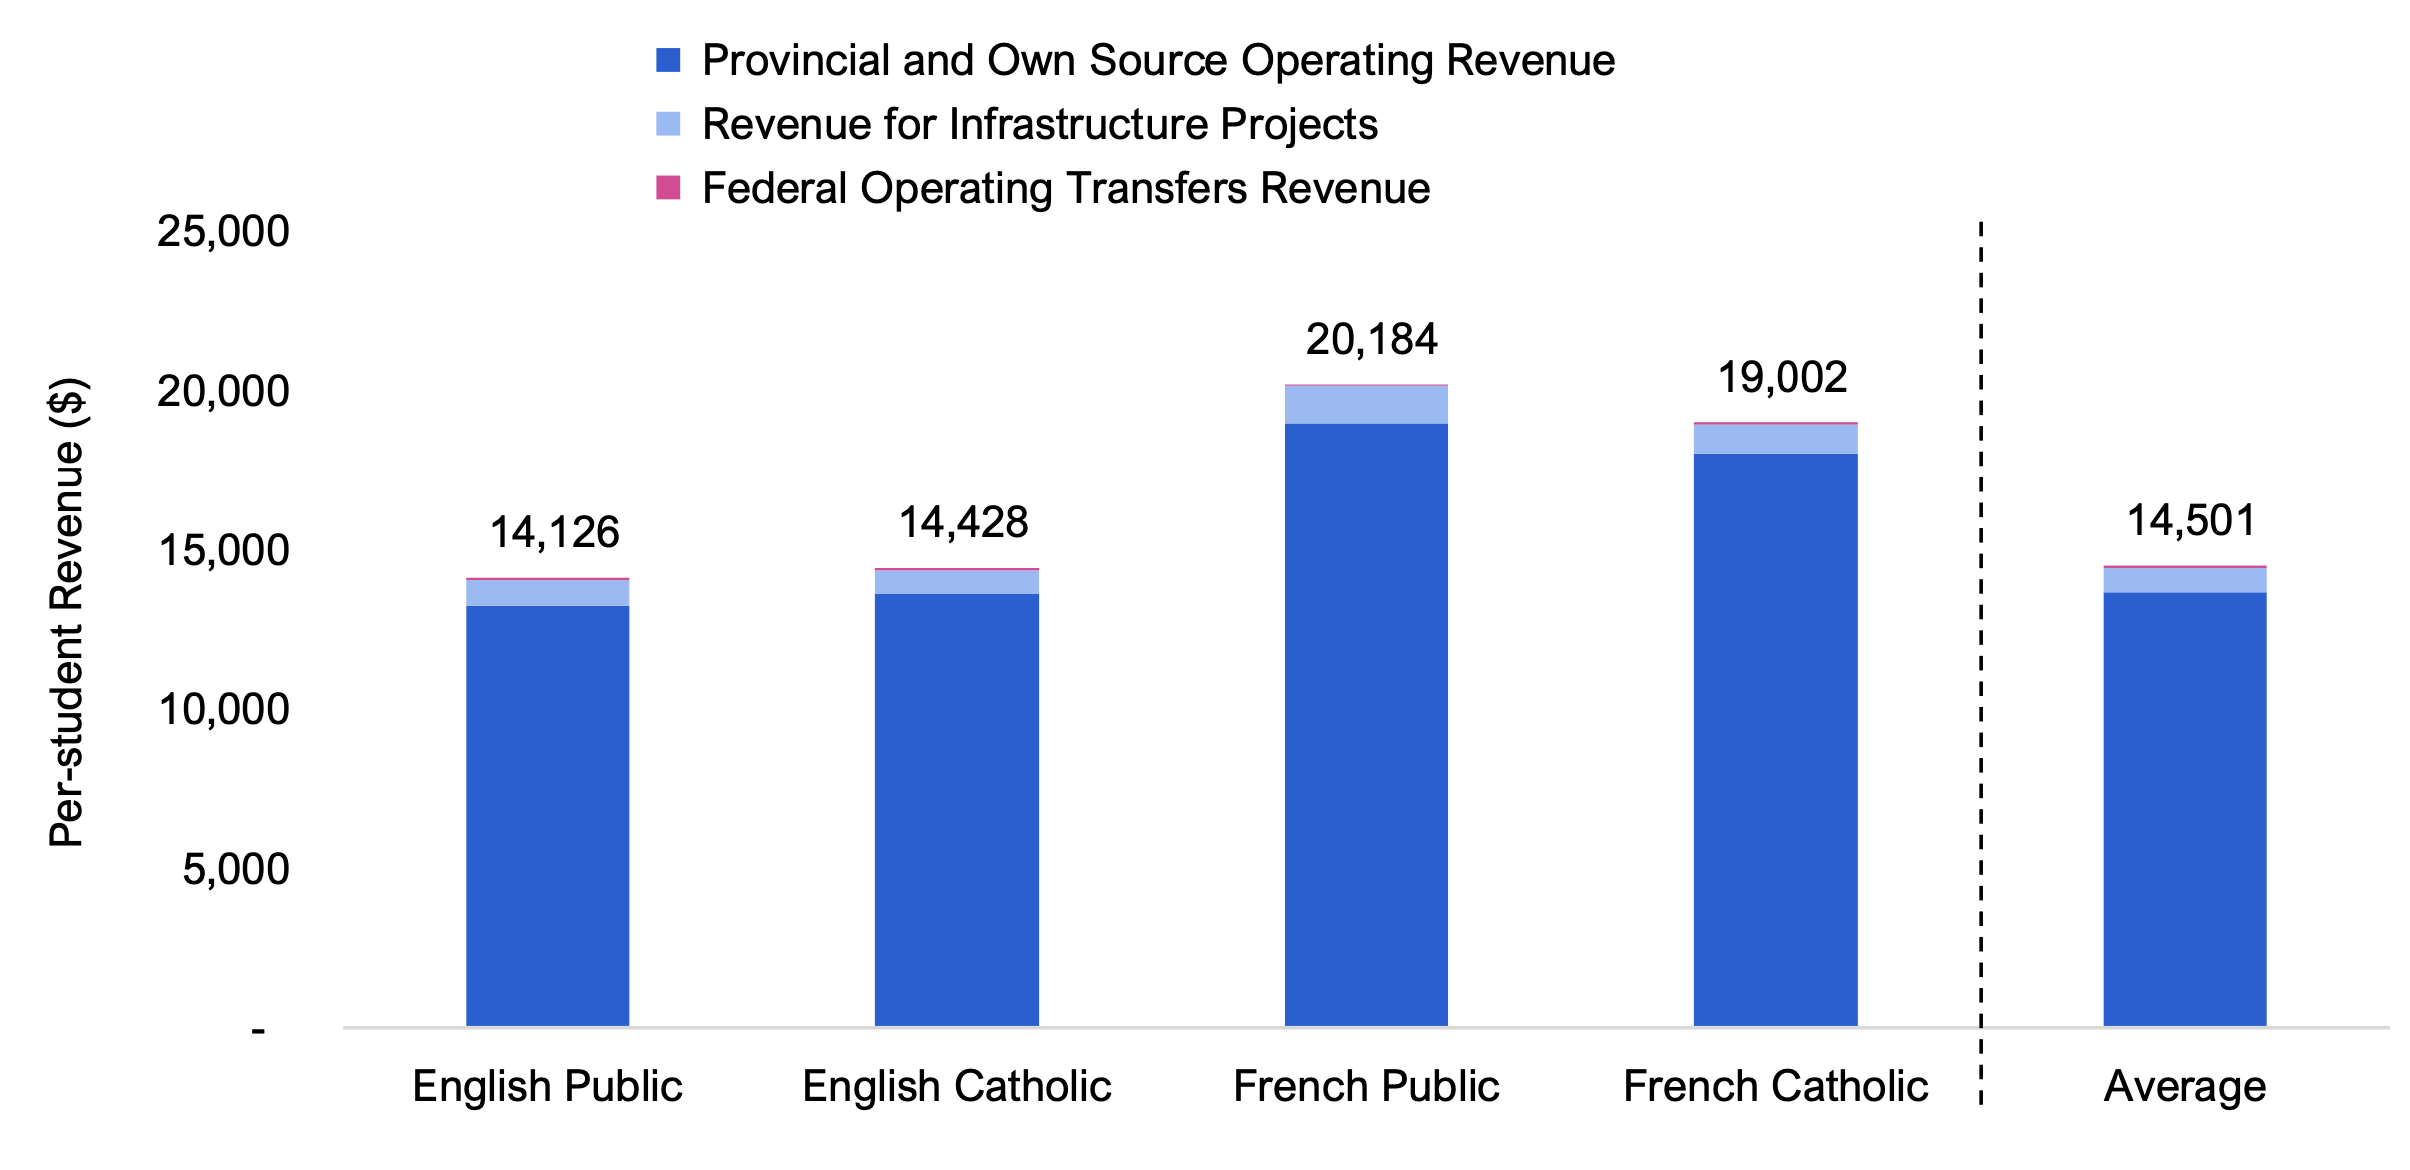
- On a per-student basis, school boards recorded an average of $14,501 in revenue per student in 2021-22. The English Public and English Catholic systems recorded $14,126 and $14,428, respectively, in revenue per student in 2021-22. French school systems recorded higher per-student revenue at $20,184 per student for the French Public system and $19,002 per student for the French Catholic system.
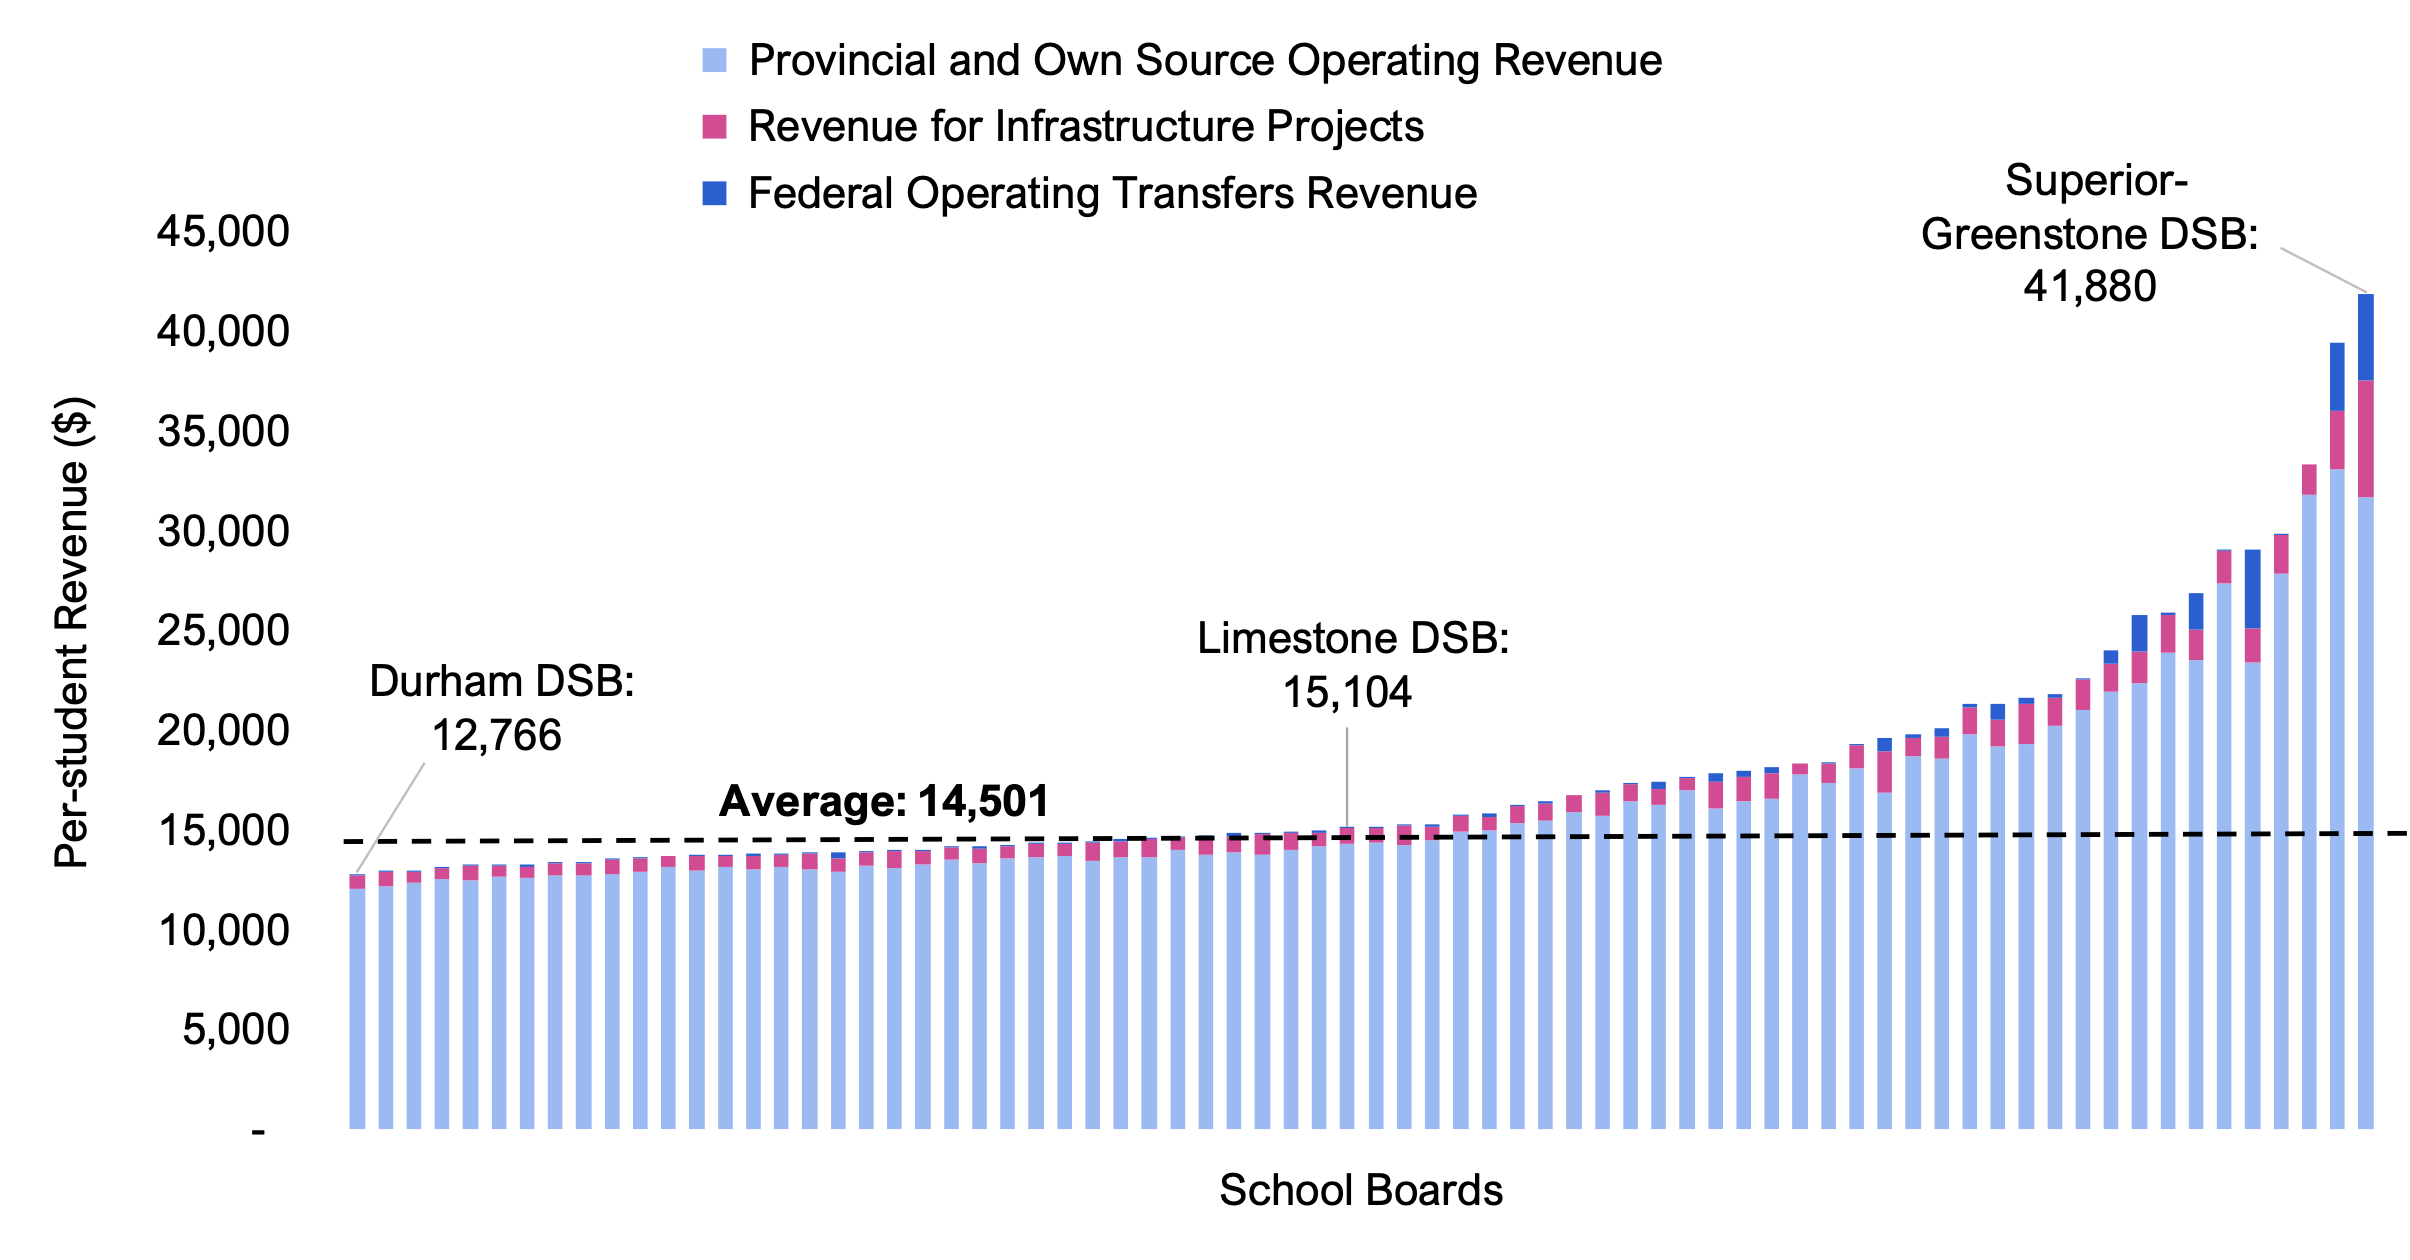
- By school board, the amount of per-student revenue varied significantly, ranging from $12,766 per student (Durham DSB) to $41,880 per student (Superior-Greenstone DSB).
- The variation in per-student revenue is largely driven by provincial operating funding programs as discussed above and in Chapter 4.
Total School Board Spending
- In the 2021-22 school year, school boards spent $28.8 billion. The largest category of school board spending was teacher compensation, which totaled $13.8 billion. The next largest category was non-teacher instruction, which totaled $7.6 billion, followed by spending on pupil accommodation ($2.9 billion), infrastructure ($1.6 billion), transportation ($1.2 billion), administration ($0.7 billion) and other spending ($0.9 billion).
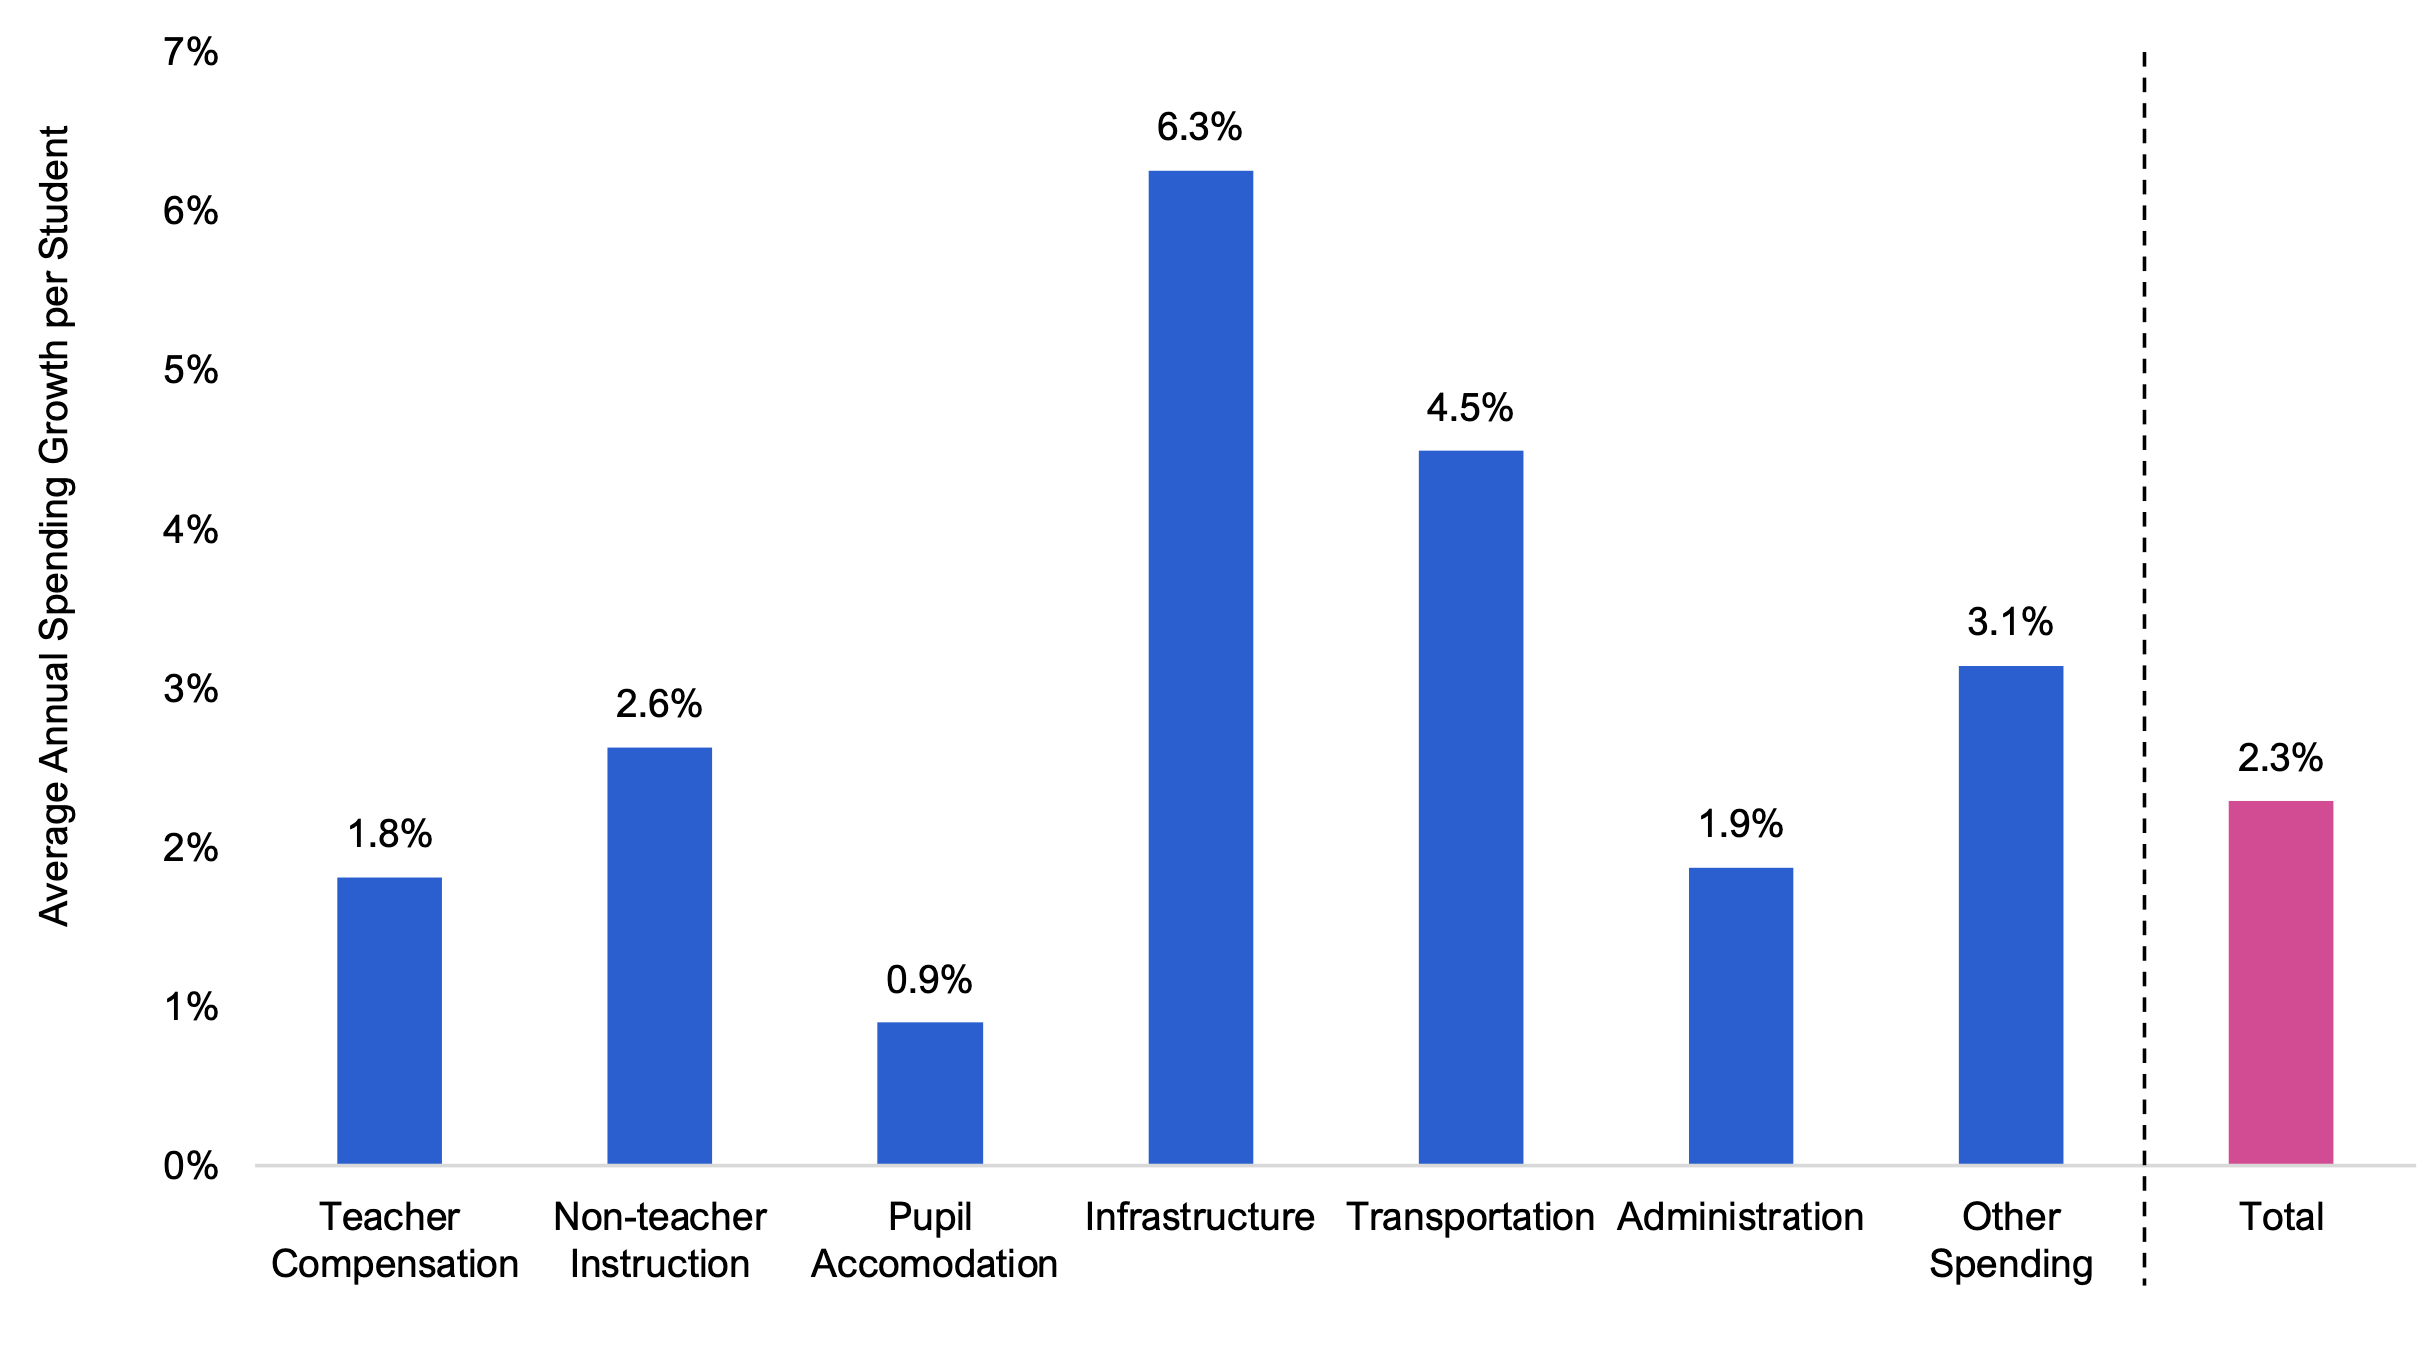
- On a per-student basis, school boards spent an average of $14,426 per student in the 2021-22 school year. In the six years from 2015-16 to 2021-22, total school board per-student spending grew at an average annual rate of 2.3 per cent, compared to an average annual inflation rate of 2.5 per cent over this period.
- By category, infrastructure spending grew the fastest, at an average annual rate of 6.3 per cent. This was followed by transportation spending, which grew at 4.5 per cent annually, other spending at 3.1 per cent, non-teacher instruction spending at 2.6 per cent, administration at 1.9 per cent, teacher compensation at 1.8 per cent and pupil accommodation at 0.9 per cent.
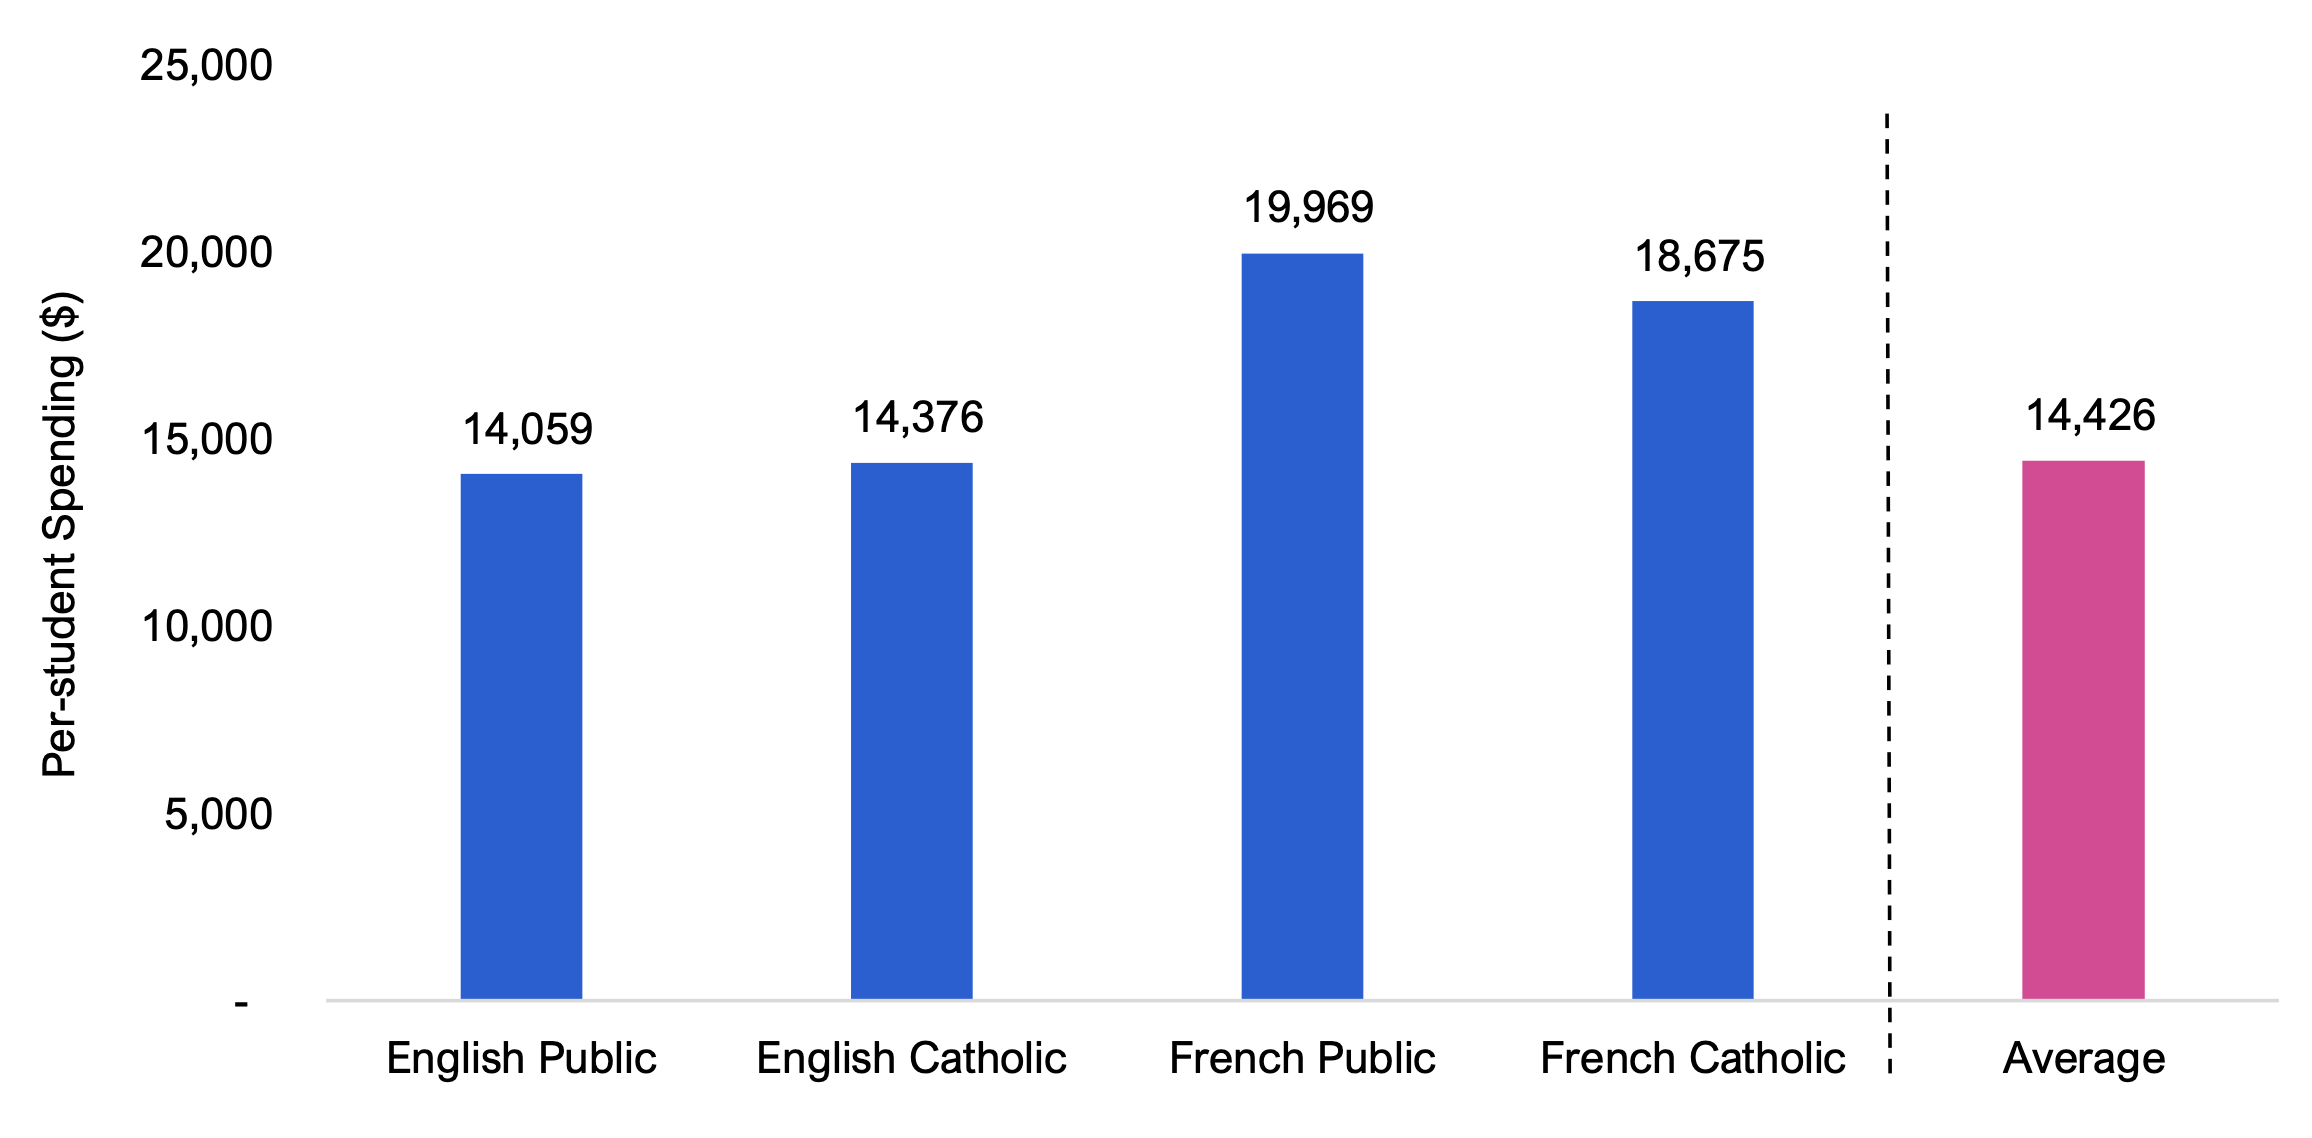
- On a per-student basis, the English Public and English Catholic systems spent $14,059 and $14,376, respectively, in 2021-22. French-language school systems spent more per student, at $19,969 per student for the French Public system and $18,675 per student for the French Catholic system.
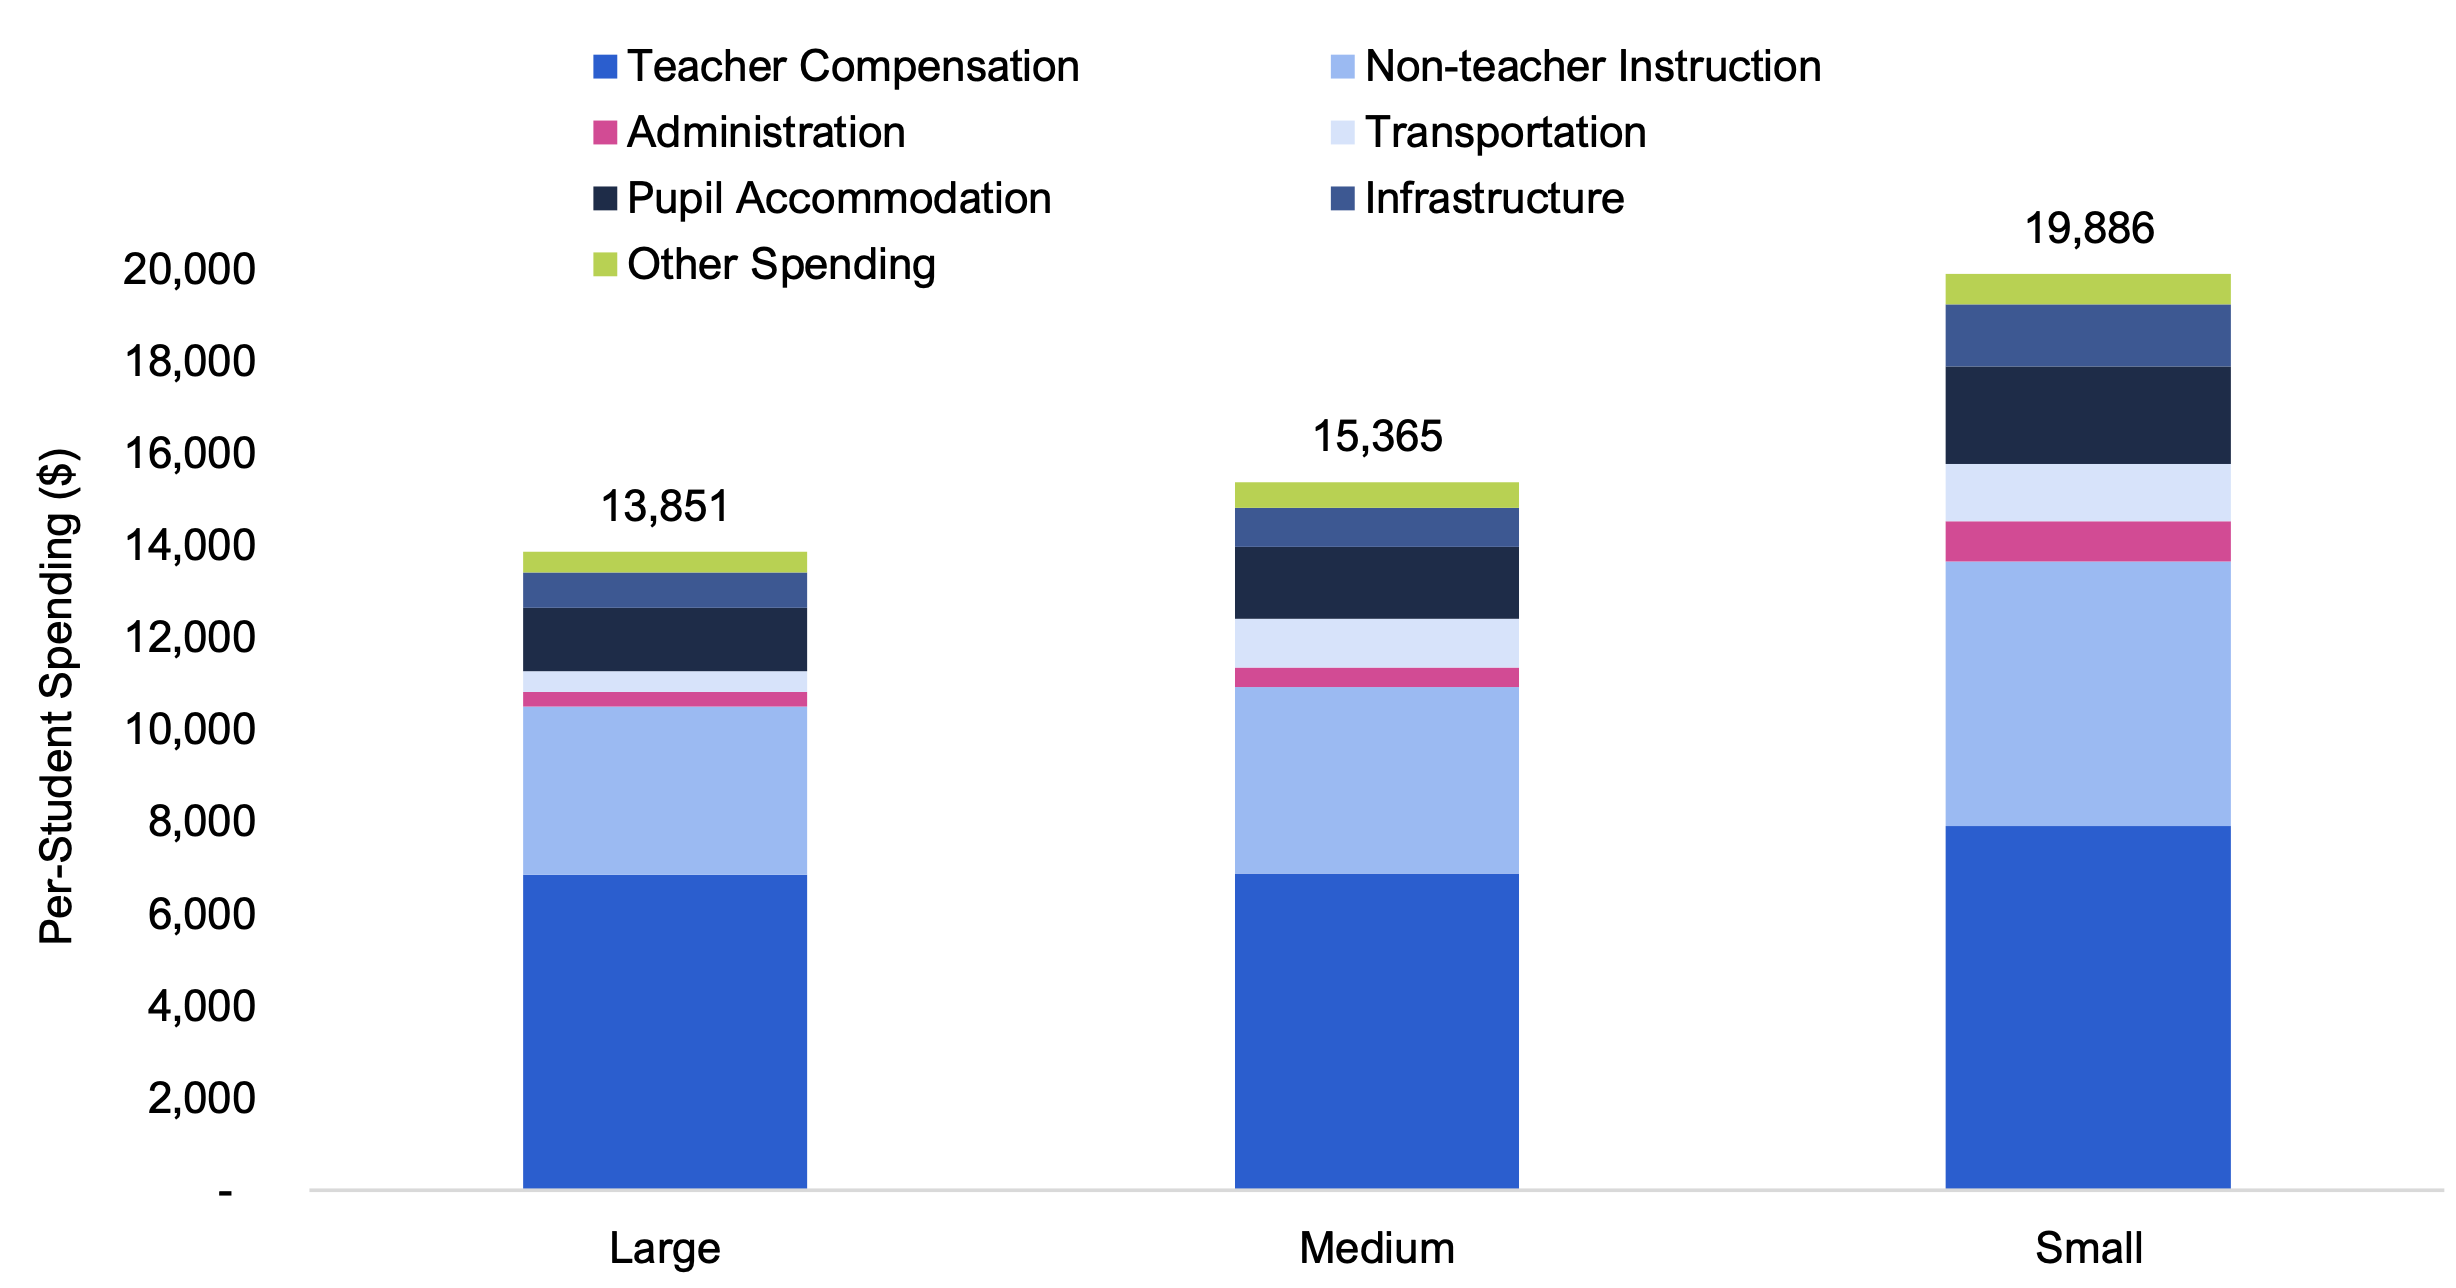
- Generally, smaller school boards tend to have higher total spending per student compared to larger school boards.[4] In 2021-22, small school boards spent an average of $19,886 per-student, while medium-sized school boards spent $15,365 per-student and large school boards spent $13,851 per-student.
- Overall, this reflects the ability of school boards with higher enrolment levels to spread fixed costs over a larger student population and therefore spend less per student. It also reflects that many of the smaller school boards are in locations that are remote, rural and disperse, and may face higher costs for providing student transportation, as well as supplies, equipment and services.
Spending on Teacher Salaries
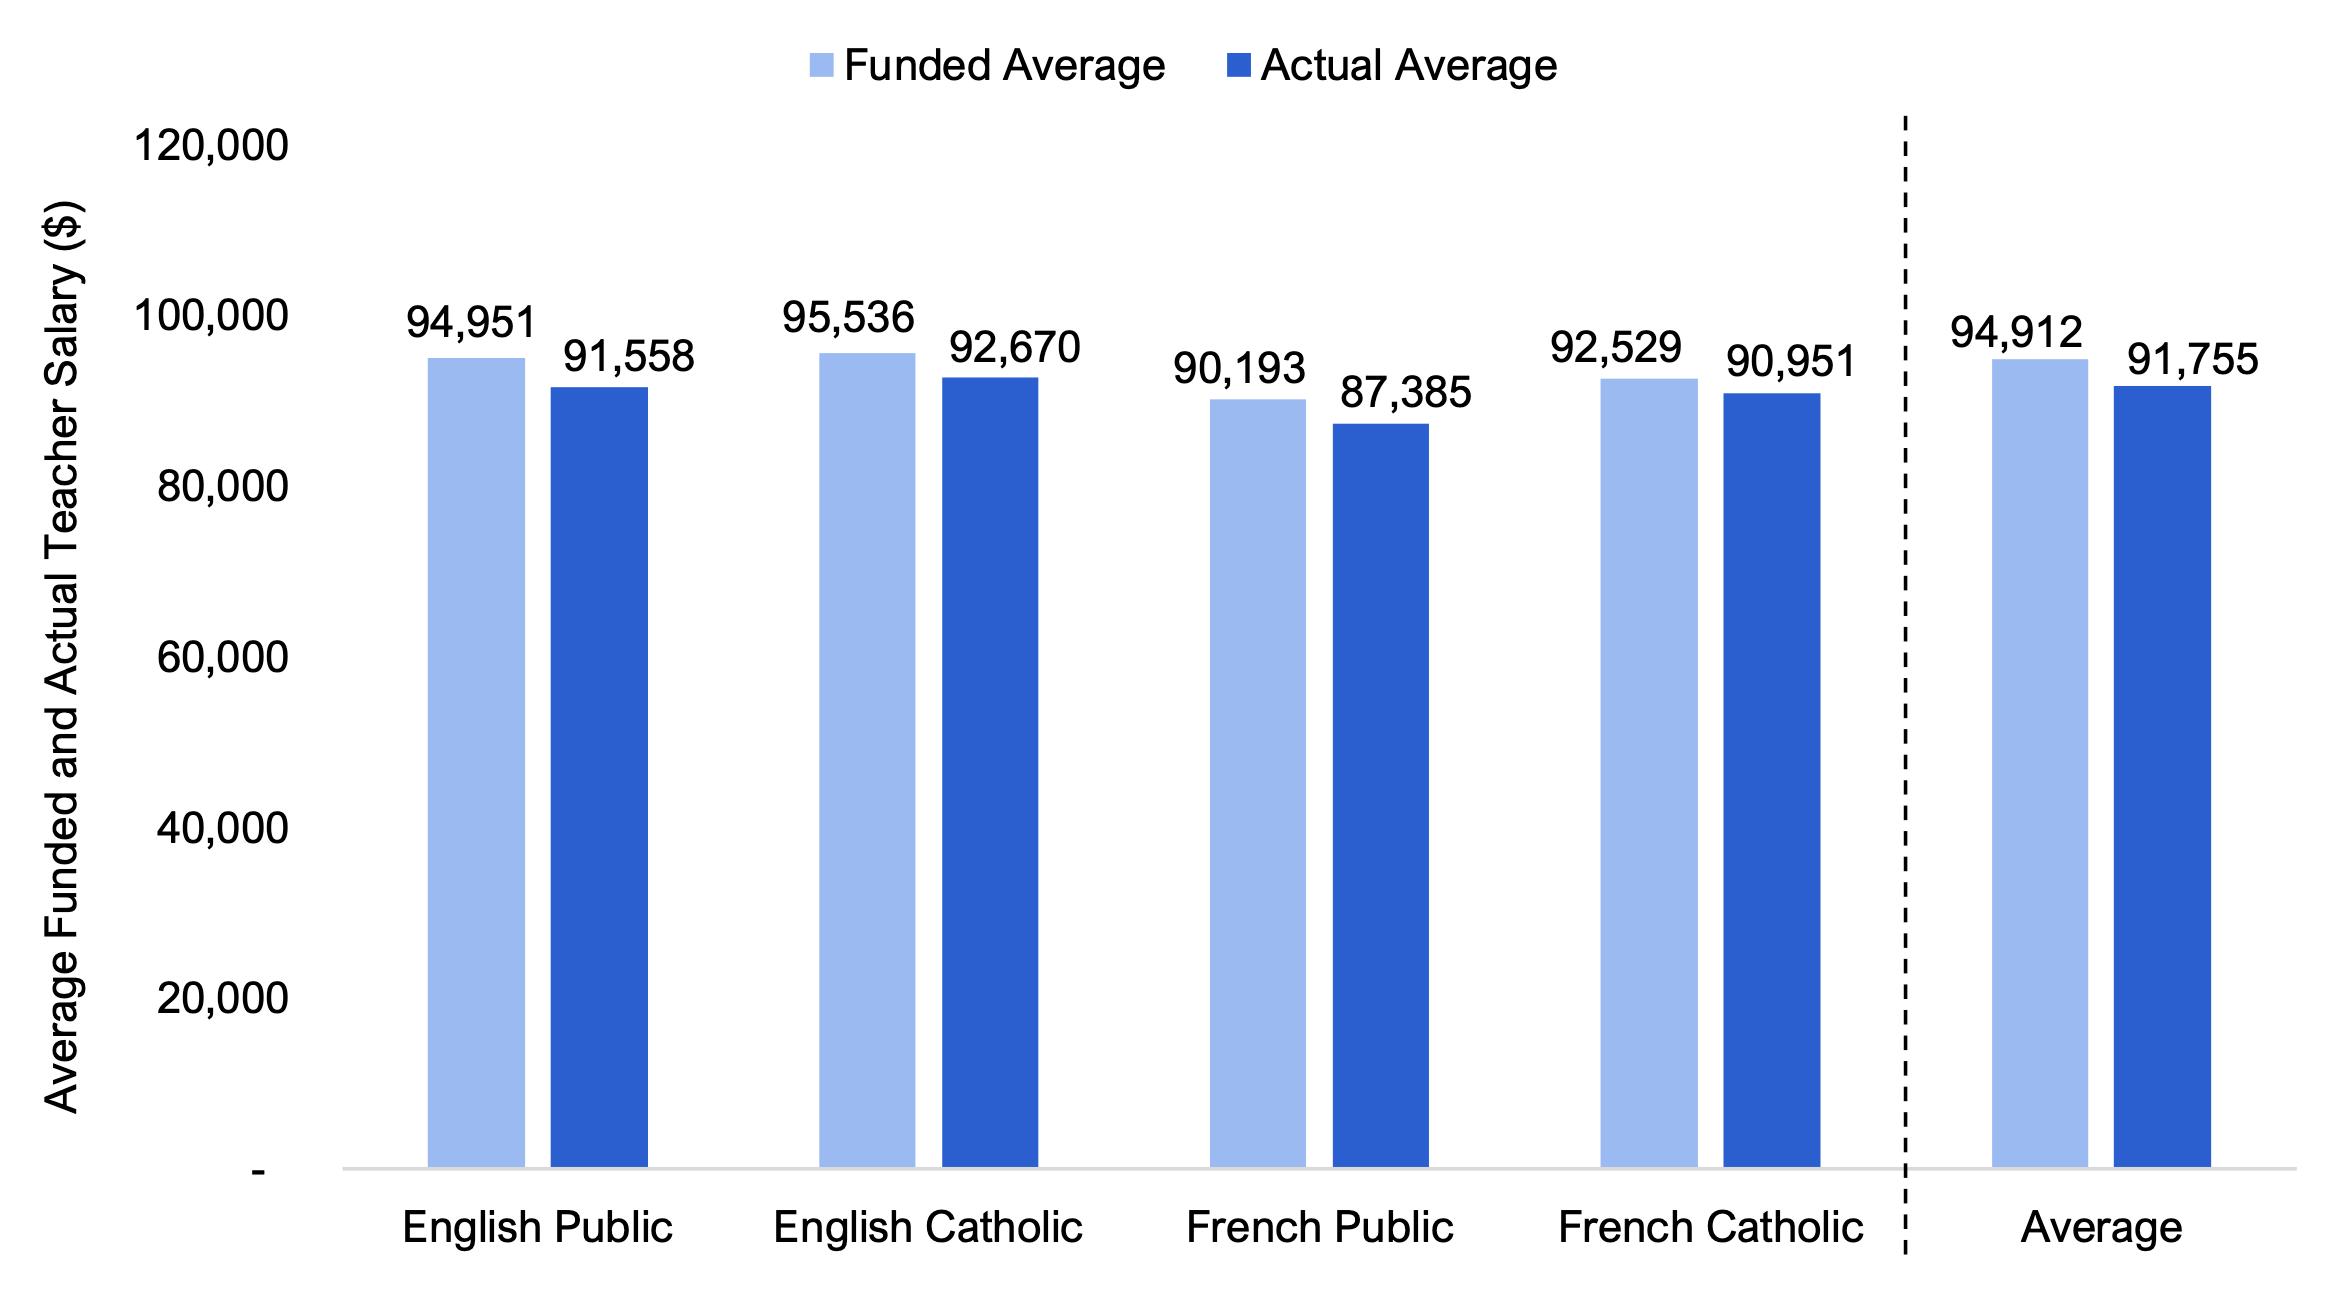
- The Province funds teachers’ salaries primarily through two grants within the GSN: the Pupil Foundation Grant, which provides equal base funding per teacher, and the Cost Adjustment and Teacher Qualifications and Experience Grant, which varies based on the educational qualifications and teaching experience of the teachers in each school board. In 2021-22, the average funded teacher salary was $94,912.
- The English Catholic and English Public school systems had the highest average funded teacher salaries, at $95,536 and $94,951, respectively. The French Catholic and French Public school systems had lower average funded salaries, at $92,529 and $90,193, respectively. The differences in average funded salaries suggest that, on average, teachers in the English school systems had higher qualifications or more seniority relative to the teachers in the French school systems.
- Actual average teacher salaries are different from the funded average because each school board has its own salary grid that reflects regional differences in cost of living and the supply of teachers, in addition to differences in teacher qualifications and experience. In the 2021-22 school year, the average actual teacher salary was $91,755.
- The English Catholic school system had the highest average actual teacher salary at $92,670, followed by the English Public system ($91,558), French Catholic system ($90,951) and French Public system ($87,385). This indicates that, on average, school boards are using a portion of funds notionally provided by the Province to support teacher salaries for other purposes.
- Across all school systems, small school boards, which are typically more remote, had the highest average actual teacher salaries at $93,260, while medium-sized and large school boards had lower average actual teacher salaries at $91,663 and $91,668, respectively.
School Board Budget Balance and Accumulated Surplus
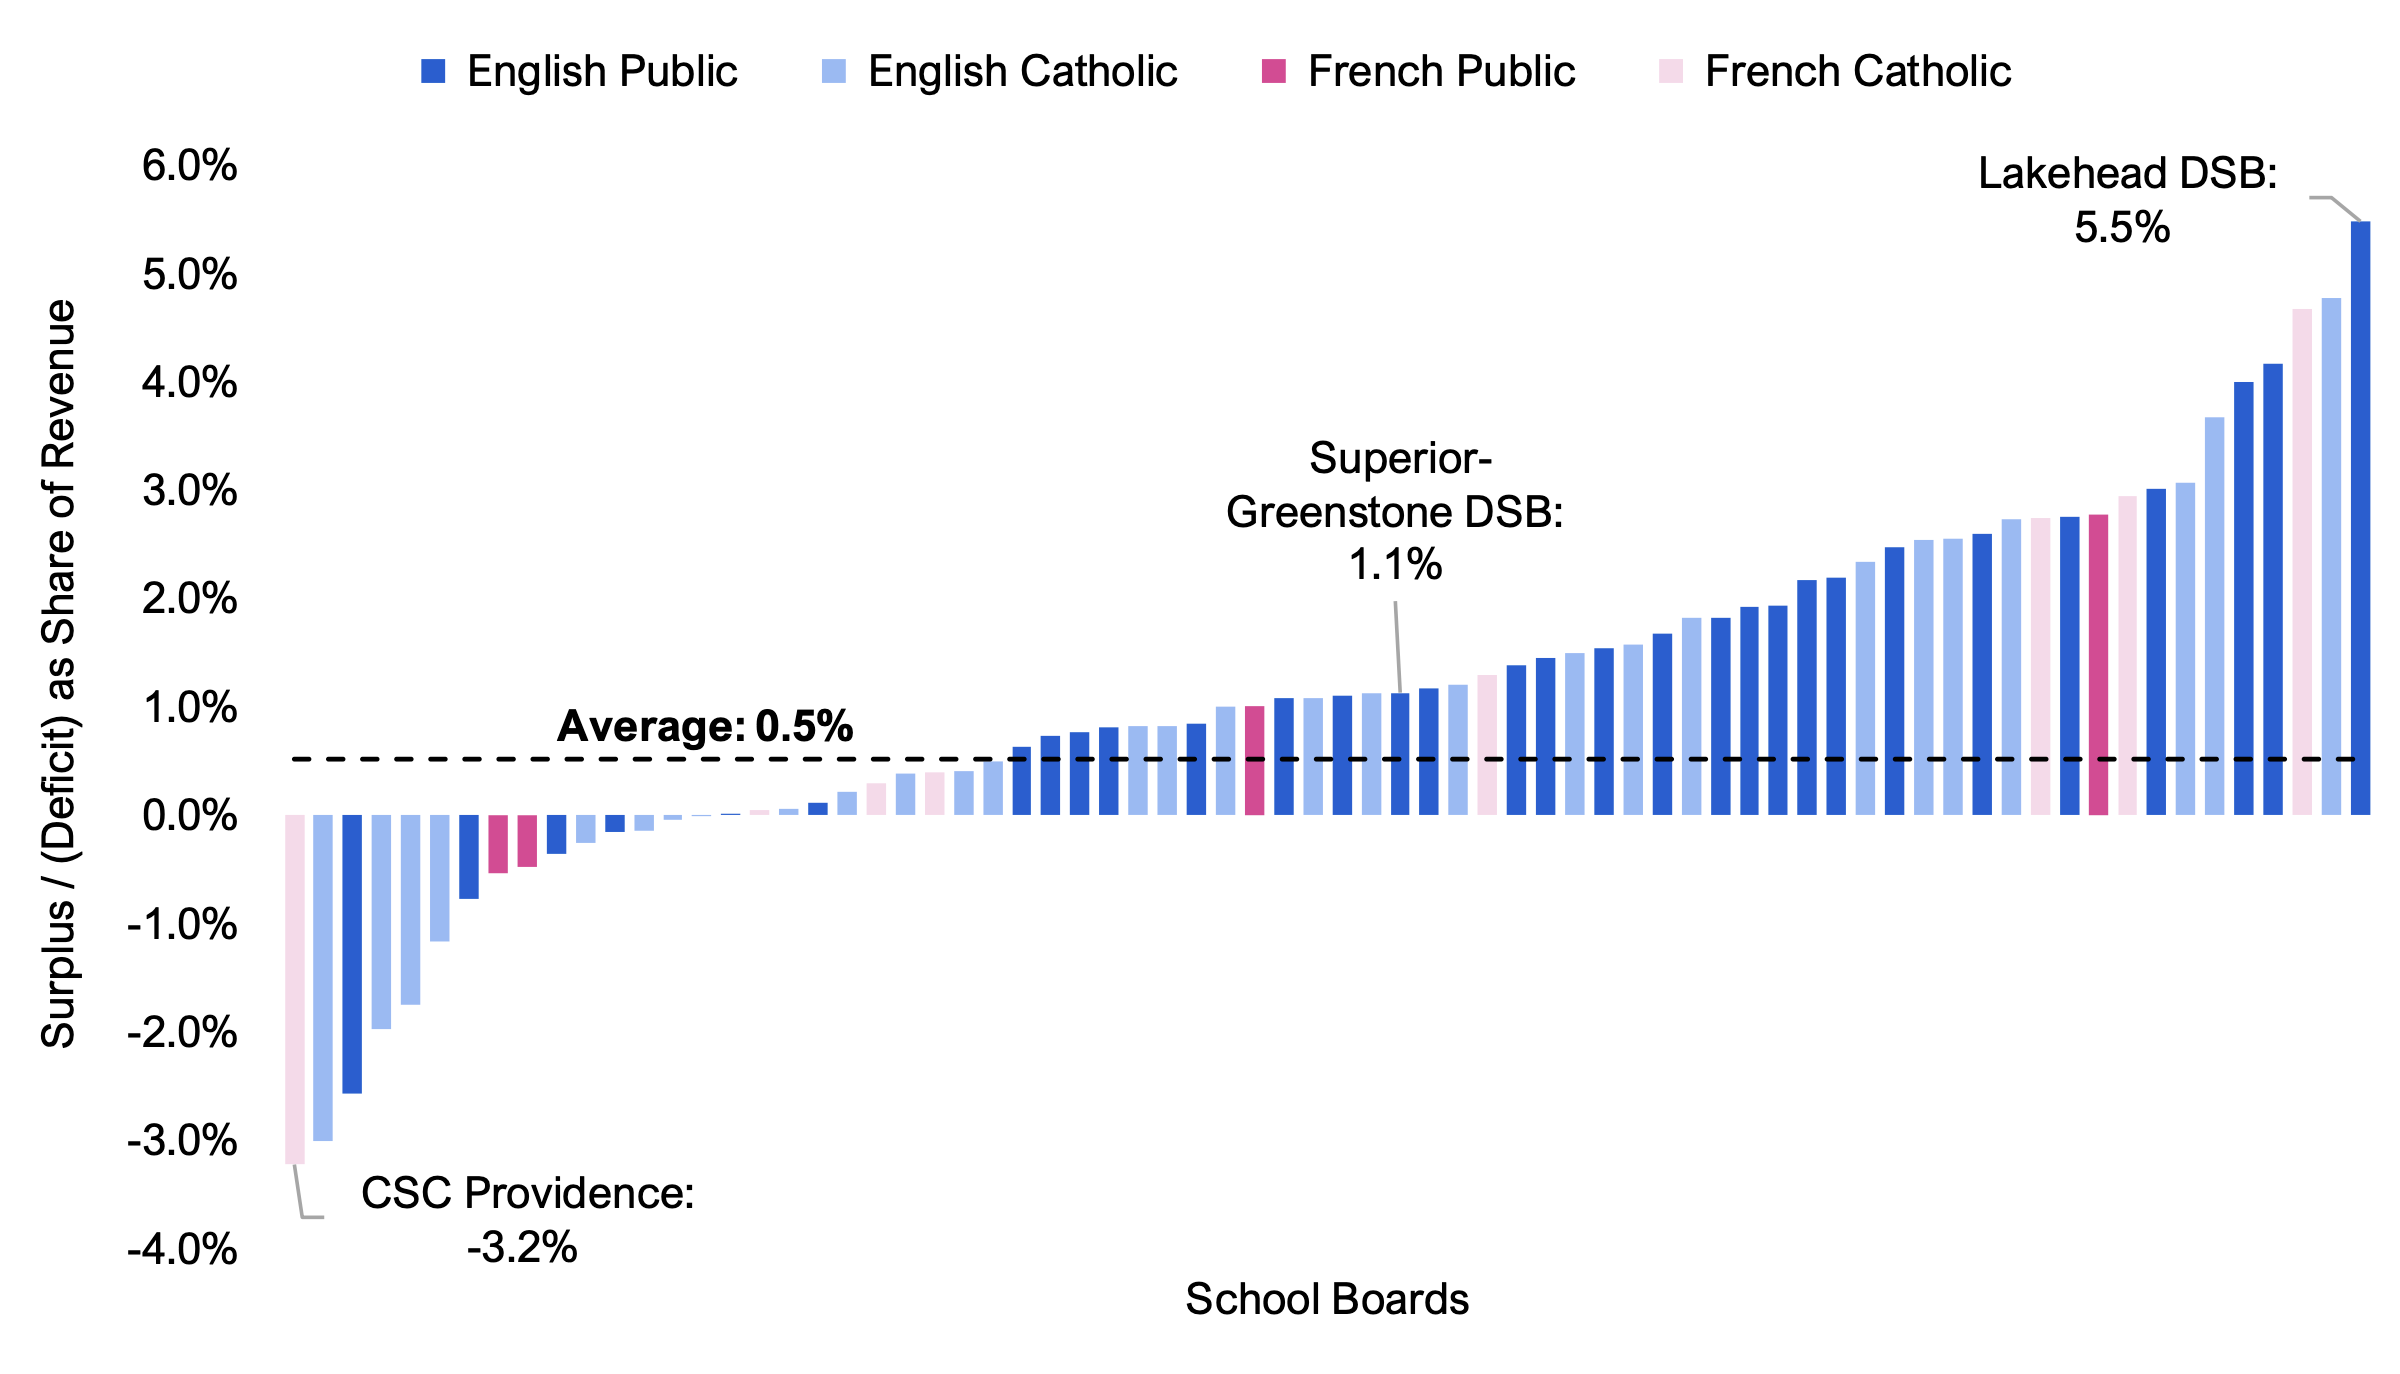
- In 2021-22, school boards had a combined budget surplus of $0.1 billion, representing 0.5 per cent of total school boards’ revenue. Of the Province’s 72 school boards, 57 recorded budget surpluses for the 2021-22 school year, while the remaining 15 school boards recorded budget deficits. The school board with the largest surplus as a share of revenue was the Lakehead DSB (5.5 per cent) and the school board with the largest deficit as a share of revenue was CSC Providence (-3.2 per cent).
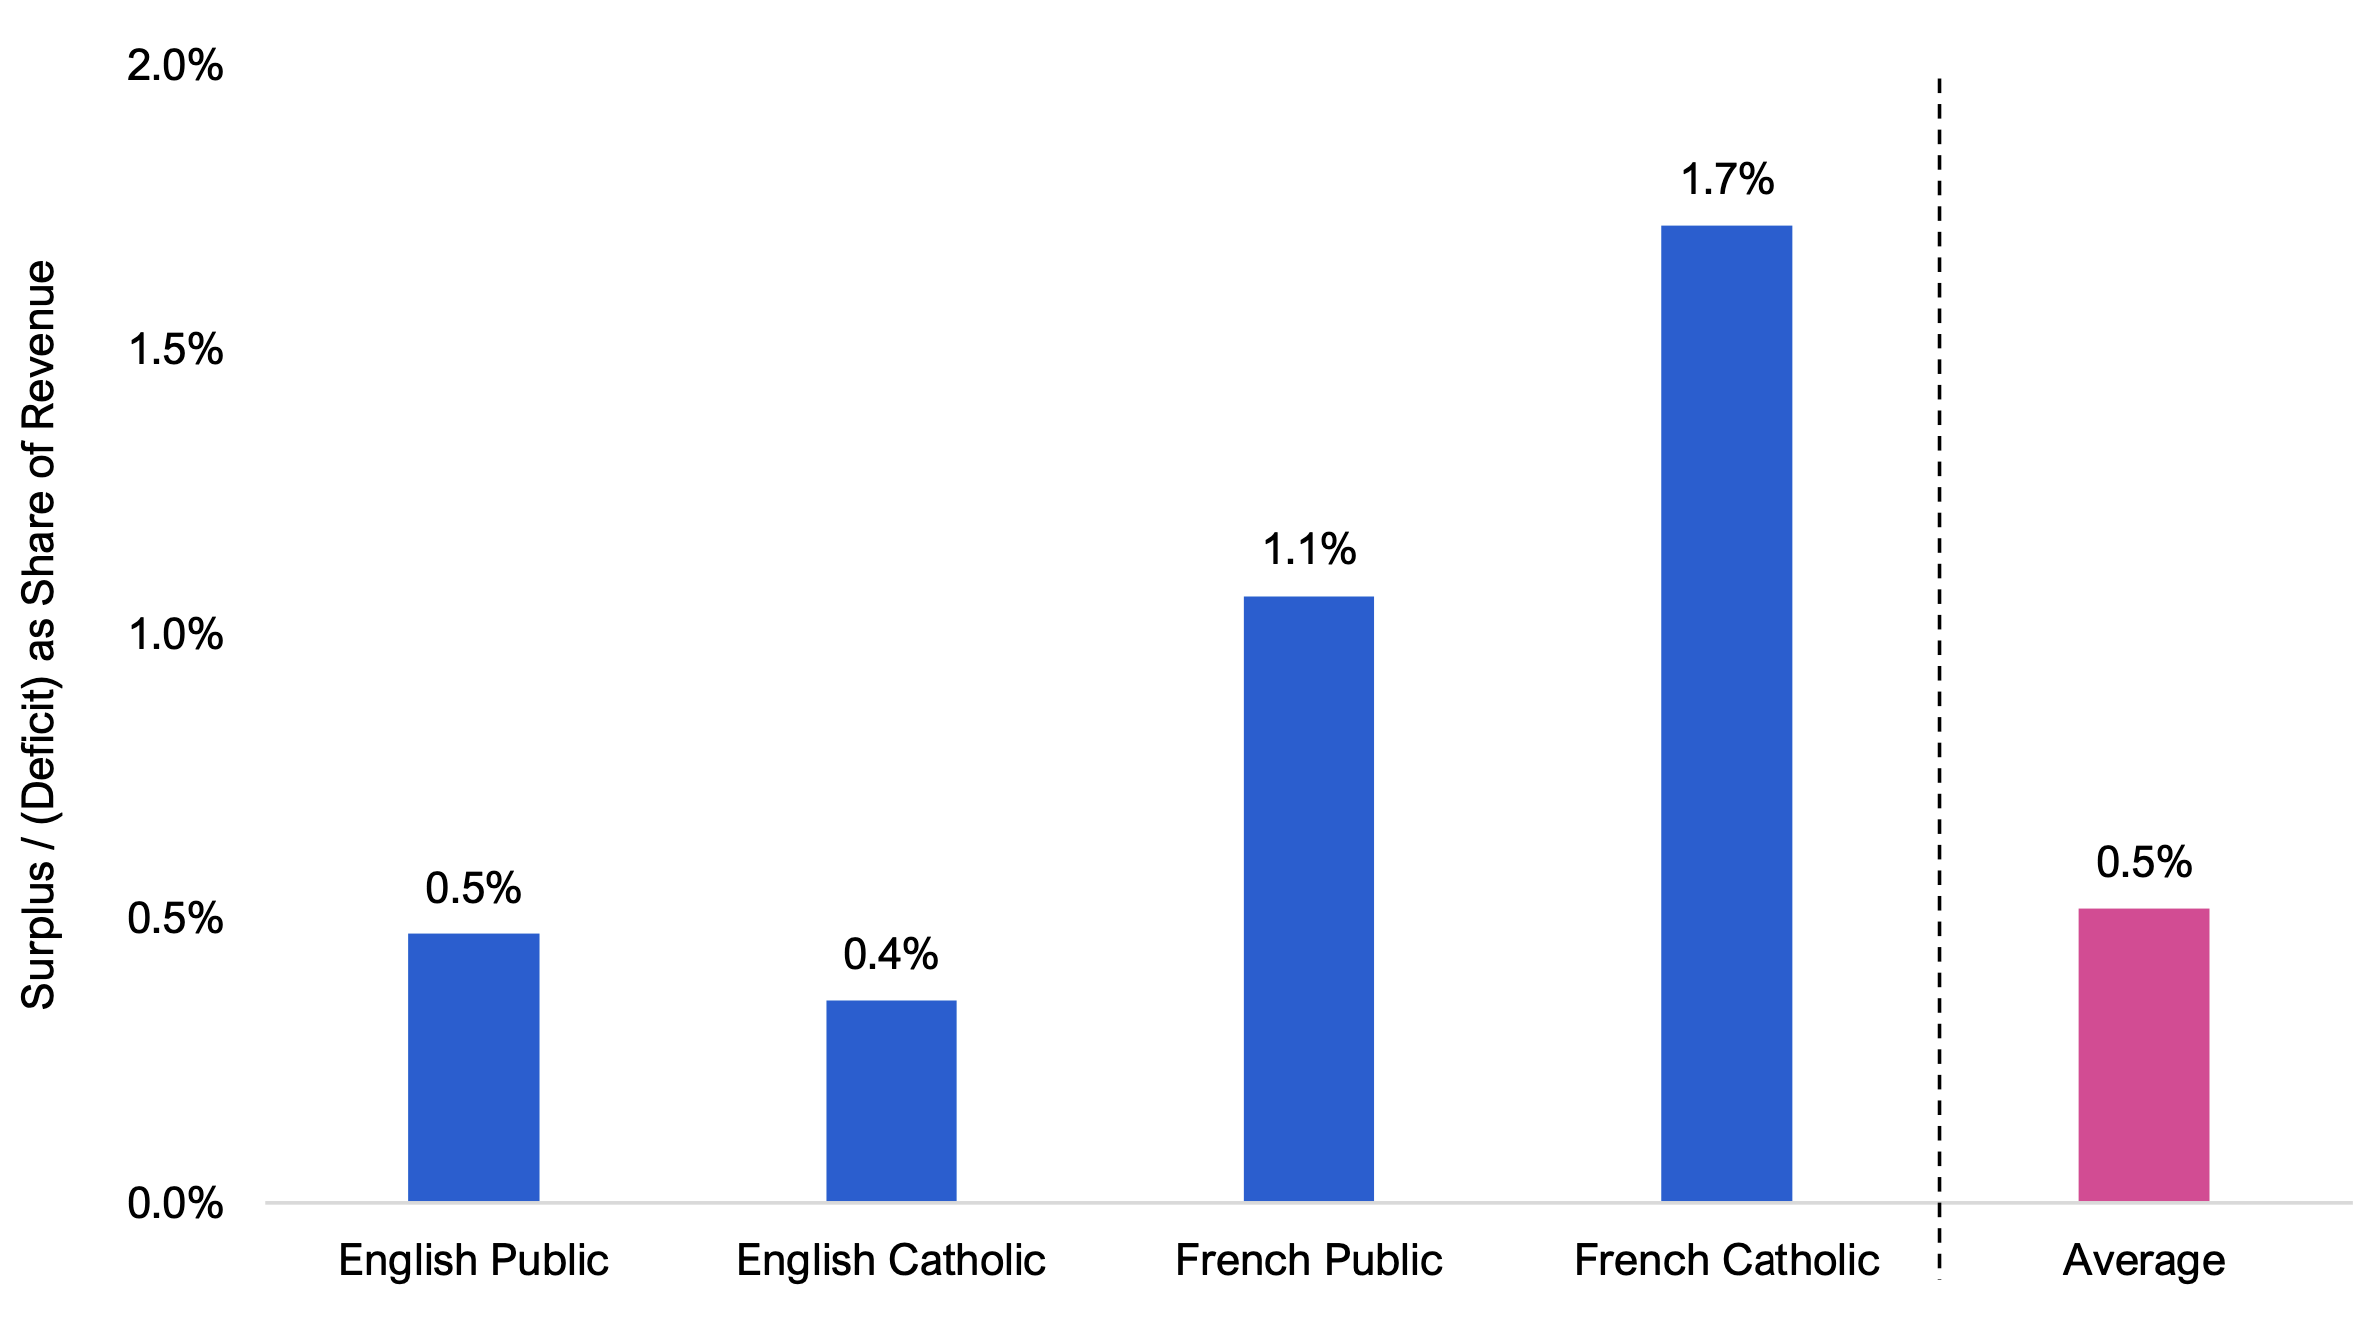
- By school system, the French Catholic system had the highest average surplus as a share of revenue (1.7 per cent), followed by the French Public system (1.1 per cent), English Public system (0.5 per cent) and English Catholic system (0.4 per cent).
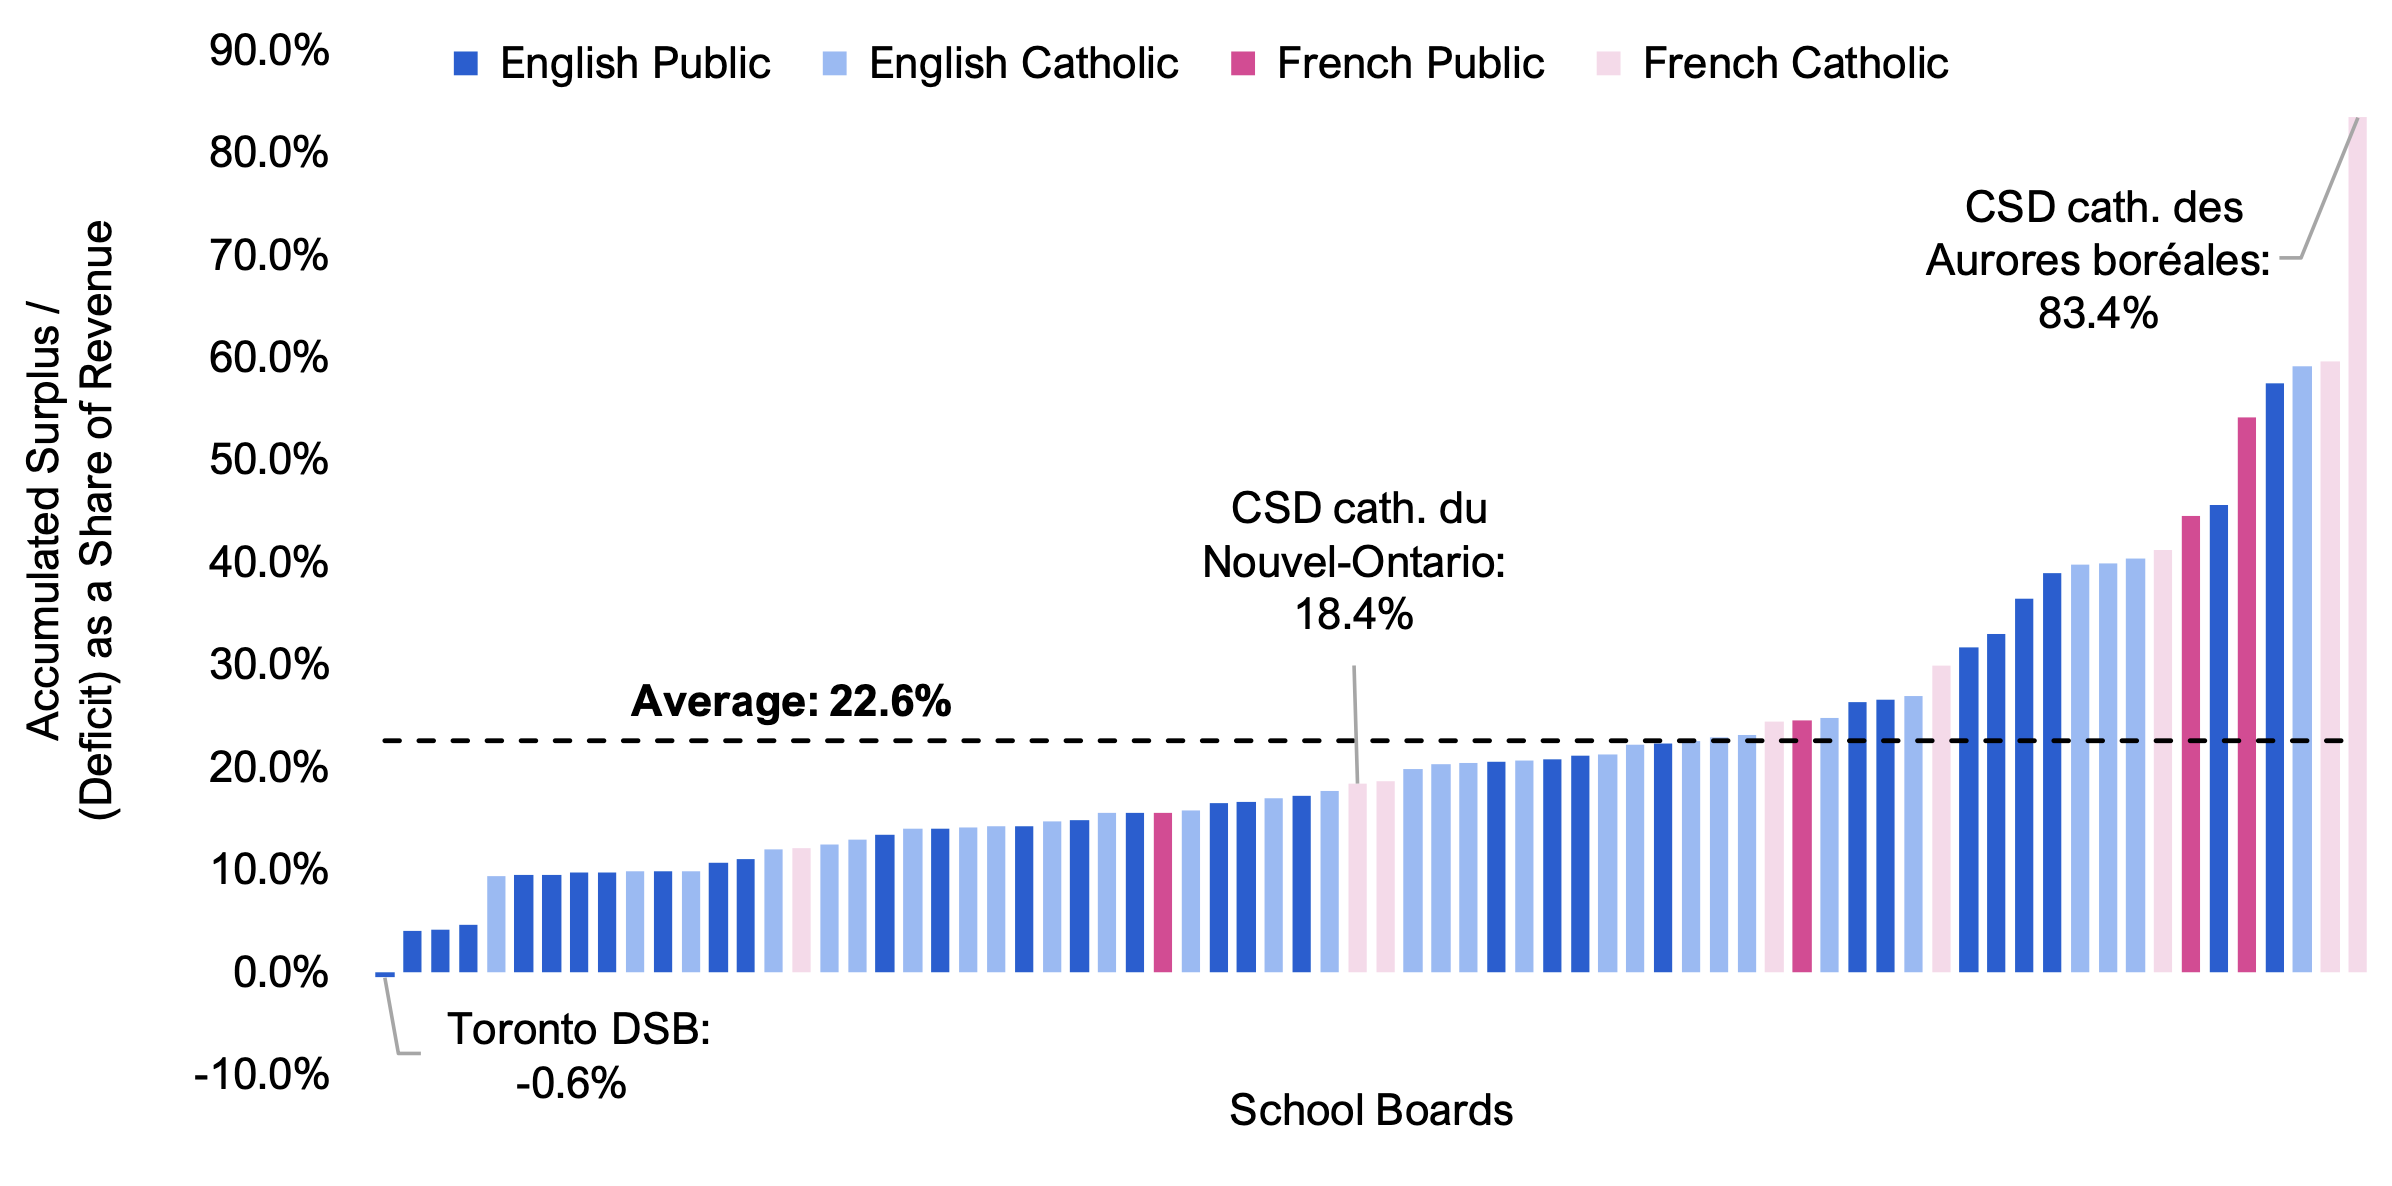
- As of the end of the 2021-22 school year (August 31, 2022), school boards had a combined accumulated surplus[5] of $6.6 billion,[6] representing 22.6 per cent of 2021-22 revenue. Of the Province’s 72 school boards, 71 had an accumulated surplus, while only one school board (the Toronto DSB) had an accumulated deficit.
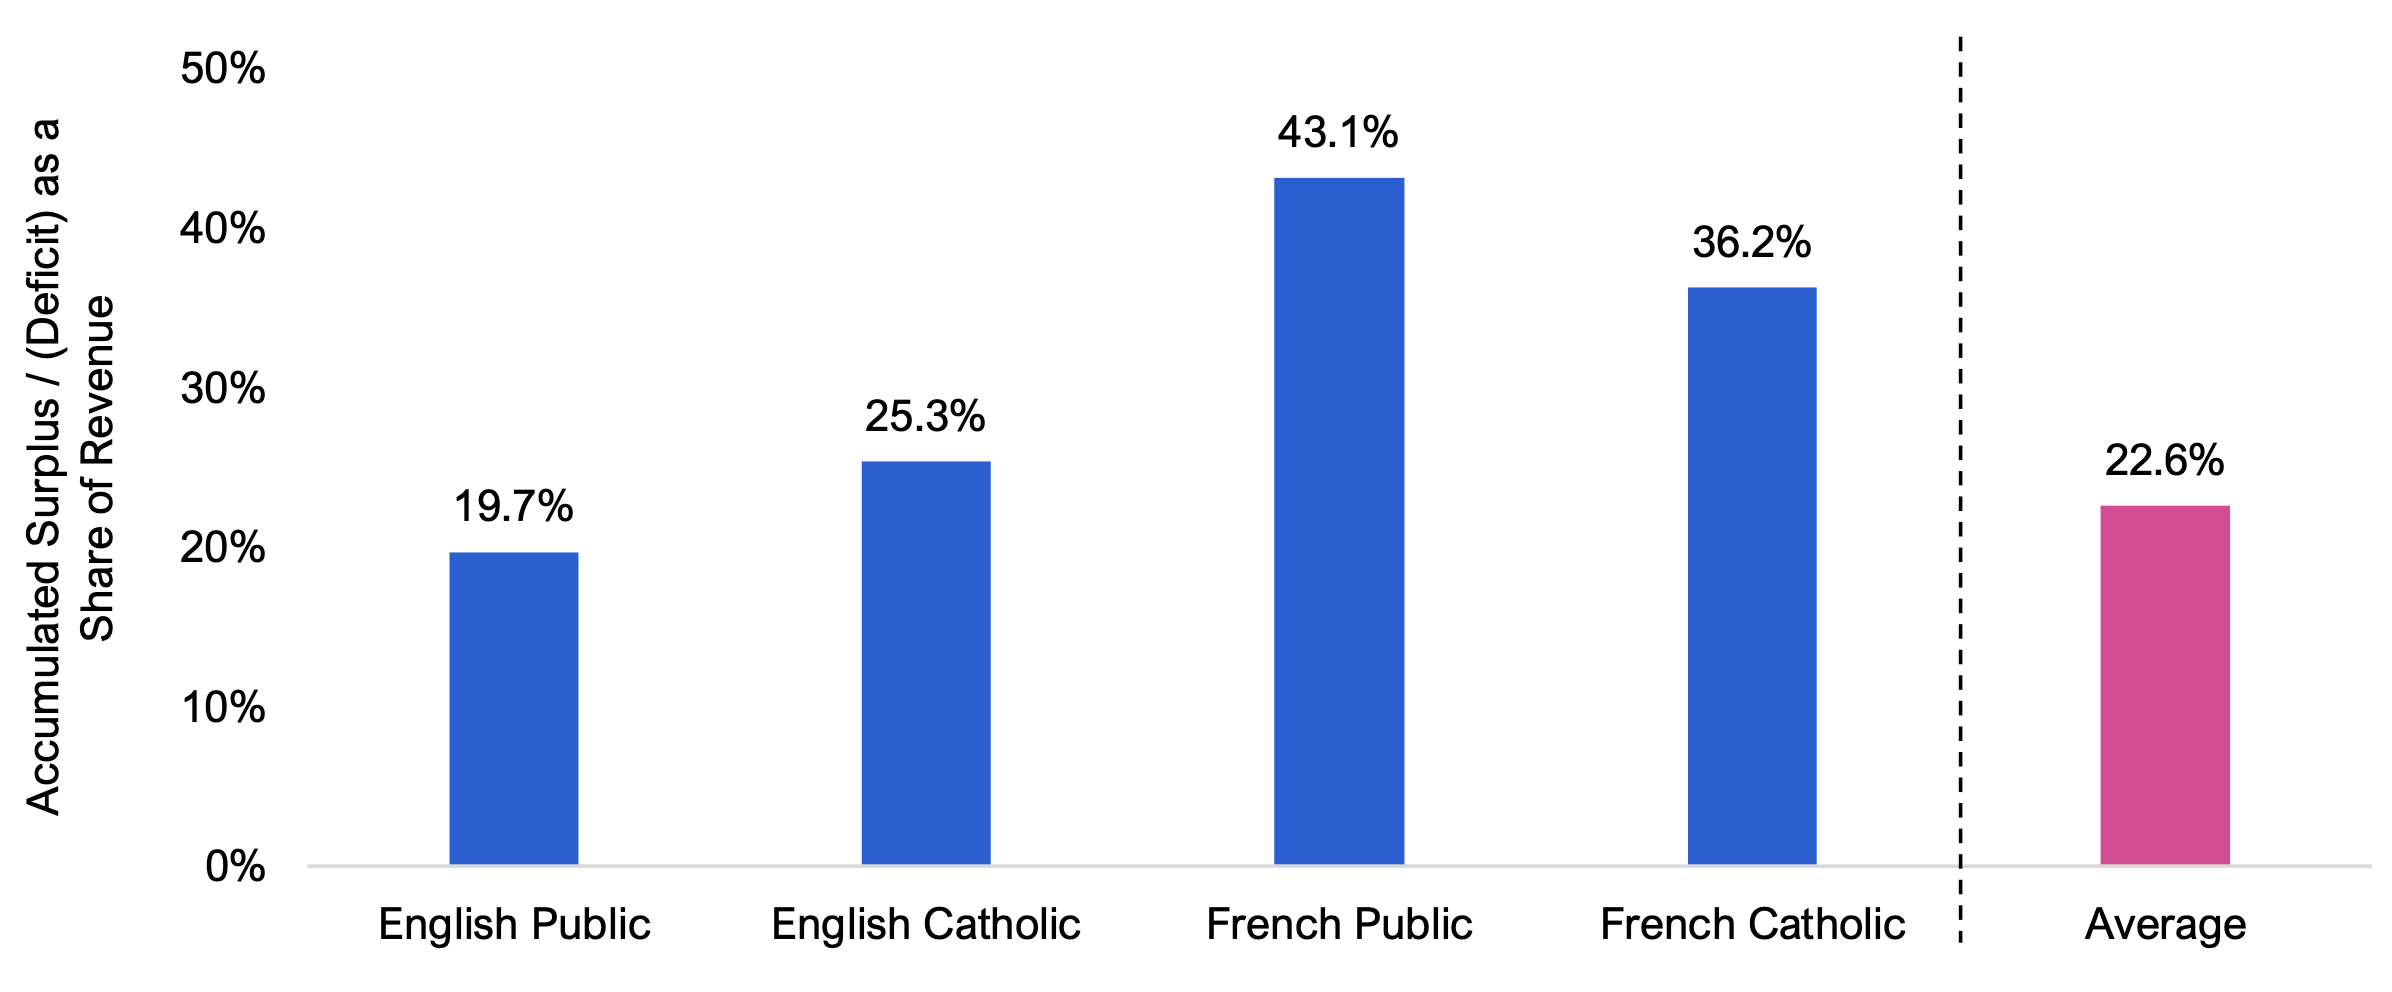
- By school system, the French Public system had the largest accumulated surplus as a share of 2021-22 revenue (43.1 per cent), followed by the French Catholic system (36.2 per cent), the English Catholic system (25.3 per cent) and the English Public system (19.7 per cent).
Student Outcomes by School Board and System
- The Education Quality and Accountability Office (EQAO) administers a province-wide standardized testing program each year to assess students’ academic outcomes in reading, writing and math. These test results are used by the Ministry of Education to measure the success of education policies and evaluate the performance of Ontario’s education system.[7]
- In 2021-22, 53.1 per cent of administered tests across grades 3, 6 and 9 were assessed as meeting or exceeding the EQAO standard for math, 80.0 per cent of tests met or exceeded the standard for reading and 74.9 per cent of tests met or exceeded the standard for writing. Across all disciplines and grades, the FAO estimates that the province-wide average pass rate (the share of tests administered that were assessed as meeting or exceeding the provincial standard) was 67.7 per cent.
- By school system, the French Public school boards had the best performance overall, with an average EQAO pass rate of 74.2 per cent across all tested grades and disciplines, followed by French Catholic school boards, with a pass rate of 70.7 per cent. The pass rates for the English Catholic and English Public school systems were 69.0 per cent and 66.8 per cent, respectively.
- Across all four school systems, on average, school boards that were more rural, more remote, more disperse and smaller had lower average EQAO pass rates. For example, across all school systems, the average EQAO pass rates in urban and ‘leans urban’ school boards[8] were 68.5 per cent and 70.7 per cent, respectively. In contrast, the average EQAO pass rates in rural and ‘leans rural’ school boards were 60.2 per cent and 63.6 per cent, respectively.
- By school board, of the top 10 school boards with the highest average EQAO pass rates, one was an urban school board, seven were ‘leans urban’ school boards, one was a ‘leans rural’ school board and one was a rural school board. Conversely, of the 10 school boards with the lowest average EQAO pass rates, four were rural school boards, four were ‘leans rural’ school boards and two were ‘leans urban’ school boards.
- The FAO found that higher per-student funding did not result in higher average EQAO pass rates.
- Overall, of the 26 school boards with EQAO pass rates at or above the provincial average (67.7 per cent), 16 had below average provincial per-student funding levels (below $13,364 per student).
- Despite receiving higher per-student funding, schools in rural areas typically have fewer educational supports. For instance, rural schools are less likely to have a full-time vice principal, special education teacher, librarian, psychologist and social worker.[9] In addition, rural students face different socio-economic circumstances compared to students in urban and suburban areas, which can affect their educational achievement.[10]
2. Introduction
In the 2021-22 school year, Ontario’s publicly funded education system served approximately two million students in over 4,800 elementary and secondary schools. The system is overseen by the Ontario Ministry of Education, which sets curriculum standards, establishes policies and provides the majority of the funding for the system.
The Education Act makes education compulsory for all children in Ontario between the ages of six and 18, with full-time attendance required from the ages of six to 16. In addition, Section 23 of the Canadian Charter of Rights and Freedoms guarantees the right to access French-language education in Ontario for the children of those who qualify as French-language rights-holders. Similarly, section 93 of the Constitution Act, 1867 guarantees certain rights and allows the Province to support separate schools for Roman Catholic children in Ontario.
Consequently, the public education system in Ontario is organized into 72 district school boards across four school systems: English Public, English Catholic, French Public and French Catholic. Each district school board has its own board of trustees and is responsible for administering its own schools. The largest school system, the English Public system, encompasses 31 school boards, while the second largest school system, the English Catholic system, consists of 29 school boards. The French Catholic and French Public systems consist of eight and four school boards, respectively.
Purpose and Structure
In response to a request from a Member of Provincial Parliament, this report examines how provincial funding is allocated to Ontario’s 72 district school boards and reviews differences across English Public, English Catholic, French Public and French Catholic school systems. In addition, the report analyzes the demographic composition of Ontario’s students and the availability of French-system and Catholic-system school spaces, analyzes school board spending, budget balance and accumulated surplus patterns, and discusses academic performance by school board and system.
The report is divided into the following chapters:
- Chapter 3 provides an overview of Ontario’s school boards, school-aged children and youth demographics, enrolment rates, and access to education for French and Catholic school-aged children and youth.
- Chapter 4 describes how the Province allocates operating funding to its 72 district school boards and four school systems. Specifically, it explains many of the factors that impact per-student funding levels among the Province’s school boards.
- Chapter 5 analyzes total school board revenue, from provincial and other sources, and explains variances in per-student revenue levels.
- Chapter 6 examines differences in spending patterns across the 72 school boards and four school systems, including spending on teacher salaries.
- Chapter 7 details budget balance and accumulated surplus patterns across school boards and systems.
- Chapter 8 reviews academic outcomes by analyzing Education Quality and Accountability Office (EQAO) standardized testing results.
Scope
The purpose of this report is to examine Ontario’s 72 district school boards and four school systems. (All subsequent references to ‘school boards’ in this report refer to district school boards (DSBs).) In addition to district school boards, there are approximately 1,300 students who receive their education through 10 school authorities consisting of three geographically isolated boards, six hospital-based school authorities and one Protestant school board. School authorities are outside the scope of this report. There are also Provincial and Demonstration Schools and Consortium Centre Jules-Léger that are also outside the scope of this report. Further, this report does not examine private school education or home schooling in Ontario. Finally, provincial funding for the Ontario Teachers’ Pension Plan (OTPP) is outside the scope of this report and is not included in the report’s discussion of school board spending, and teacher and other staff compensation.
Additional Information
For additional information on student enrolment, funding, revenue, spending, budget balance and accumulated surplus, EQAO performance and other characteristics for each school board, please visit the FAO’s website at: https://tinyurl.com/yh5xncud.
3. School Boards and Enrolment
Overview
In 2021-22, approximately 2.0 million students were enrolled in Ontario’s public schools, of which 1.4 million students were enrolled in elementary schools while 605,000 were enrolled in secondary schools.[11]
Geographically, Ontario’s students are concentrated in southern Ontario. The FAO estimates that one million students or 51.3 per cent of all students lived in the Greater Toronto and Hamilton Area (GTHA) in 2021, and an additional 154,000 (7.7 per cent) lived in Ottawa.
Figure 3.1 Student density, by census subdivision, 2021, students per square kilometre
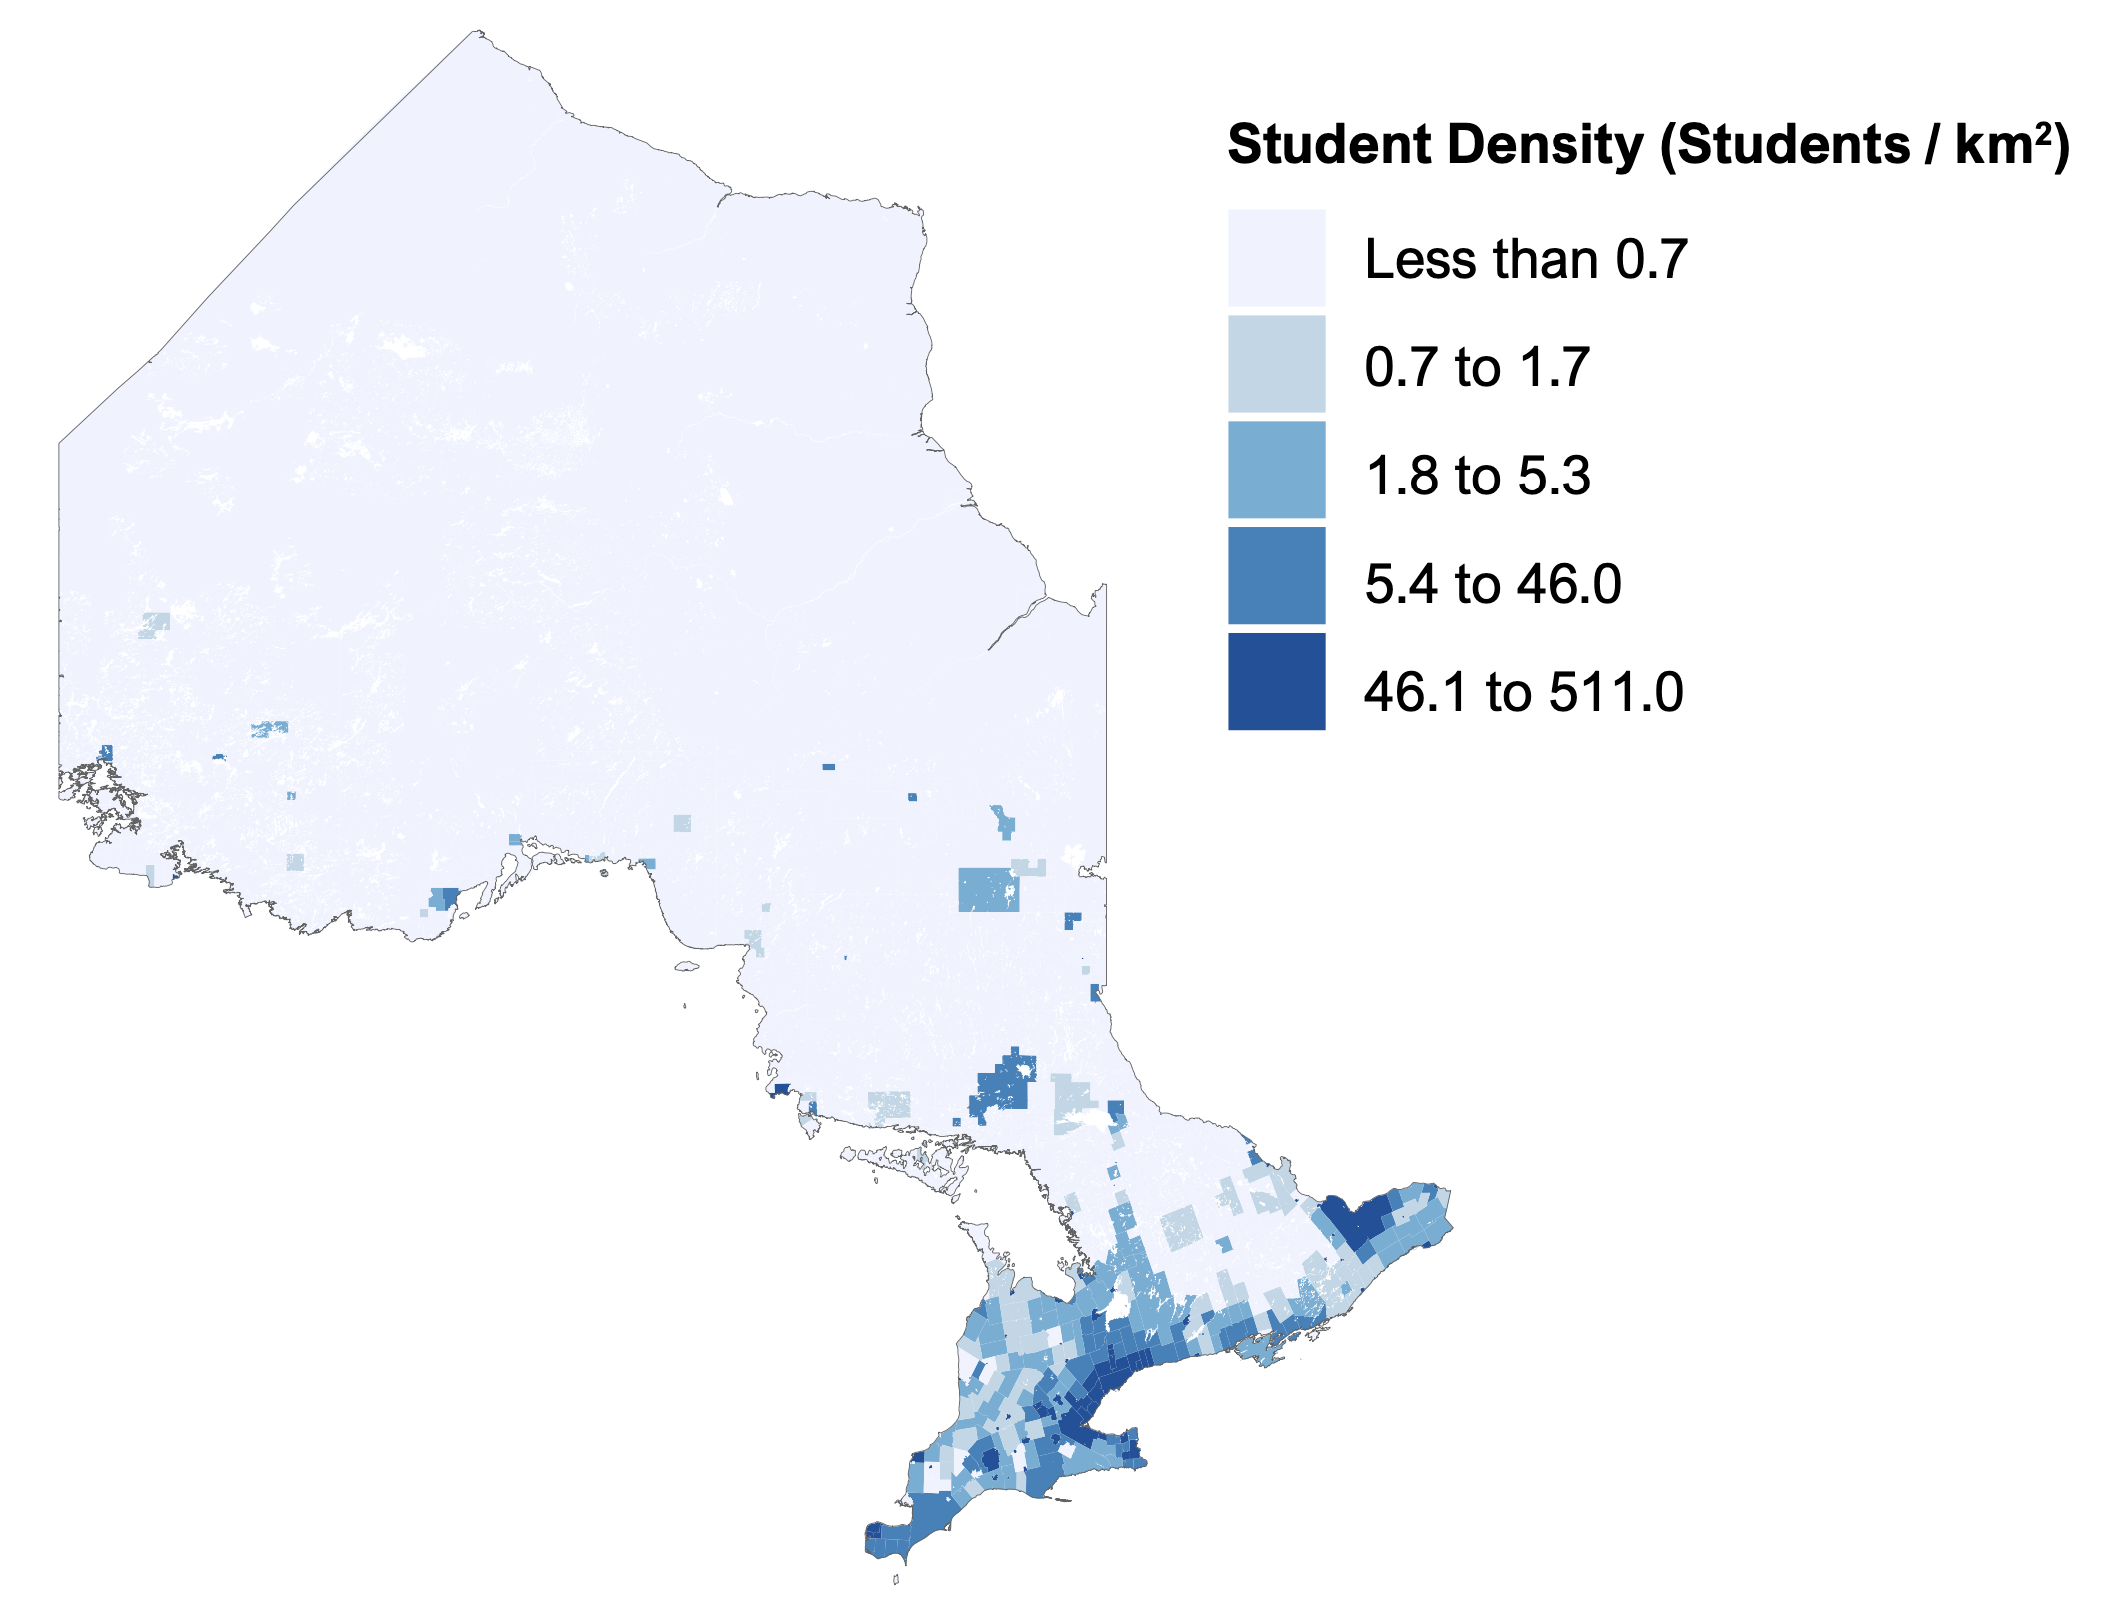
Note: A census subdivision is a municipality or equivalent geographic area, as defined by Statistics Canada.
Source: Statistics Canada and FAO analysis of information provided by the Province.
Enrolment by School System and School Board
Of the Province’s four school systems, the English Public school system is the largest, with 31 school boards and 1.3 million students enrolled in 2021-22 (66.7 per cent of total student enrolment). The second largest school system is the English Catholic system, with 29 school boards and 555,000 students (27.8 per cent). Compared to the English school systems, the French school systems have fewer school boards and are responsible for fewer students. The French Catholic system has eight boards with 77,000 students (3.8 per cent) and the French Public system has four boards with 35,000 students (1.7 per cent).
In addition to higher total enrolment, the English Public and English Catholic school systems have higher average enrolment by school board. In the 2021-22 school year, English Public school boards had average enrolment of 42,965 students, while English Catholic school boards had average enrolment of 19,129 students. The French Catholic and French Public systems had lower average school board enrolment in 2021-22, at 9,563 students and 8,647 students, respectively.
While the French school systems operate fewer school boards, their boards cover a larger geographic area. On average, French Public system school boards cover 54,715 square kilometres, while French Catholic system school boards cover 25,392 square kilometres. The English Public and English Catholic school boards cover significantly smaller territory, on average, at 7,060 square kilometres and 6,995 square kilometres, respectively.
| School System | Enrolment | Share of Students (%) | Number of School Boards | Average Enrolment by School Board | Average Geographic Area by School Board (km2) |
|---|---|---|---|---|---|
| English Public | 1,331,907 | 66.7 | 31 | 42,965 | 7,060 |
| English Catholic | 554,739 | 27.8 | 29 | 19,129 | 6,995 |
| French Public | 34,588 | 1.7 | 4 | 8,647 | 54,715 |
| French Catholic | 76,501 | 3.8 | 8 | 9,563 | 25,392 |
| Total | 1,997,736 | 100 | 72 | 27,746 | 11,251 |
From 2015-16 to 2021-22, total elementary and secondary school enrolment has grown by an average of 0.3 per cent per year. By school system, the French Public and French Catholic school systems have outpaced the English systems, growing at 3.1 per cent and 0.6 per cent per year, respectively. In contrast, enrolment in English Public schools has increased by 0.4 per cent per year and in English Catholic schools by 0.1 per cent per year, from 2015-16 to 2021-22.[12].
Figure 3.2 Average annual enrolment growth by school system, 2015-16 to 2021-22, per cent
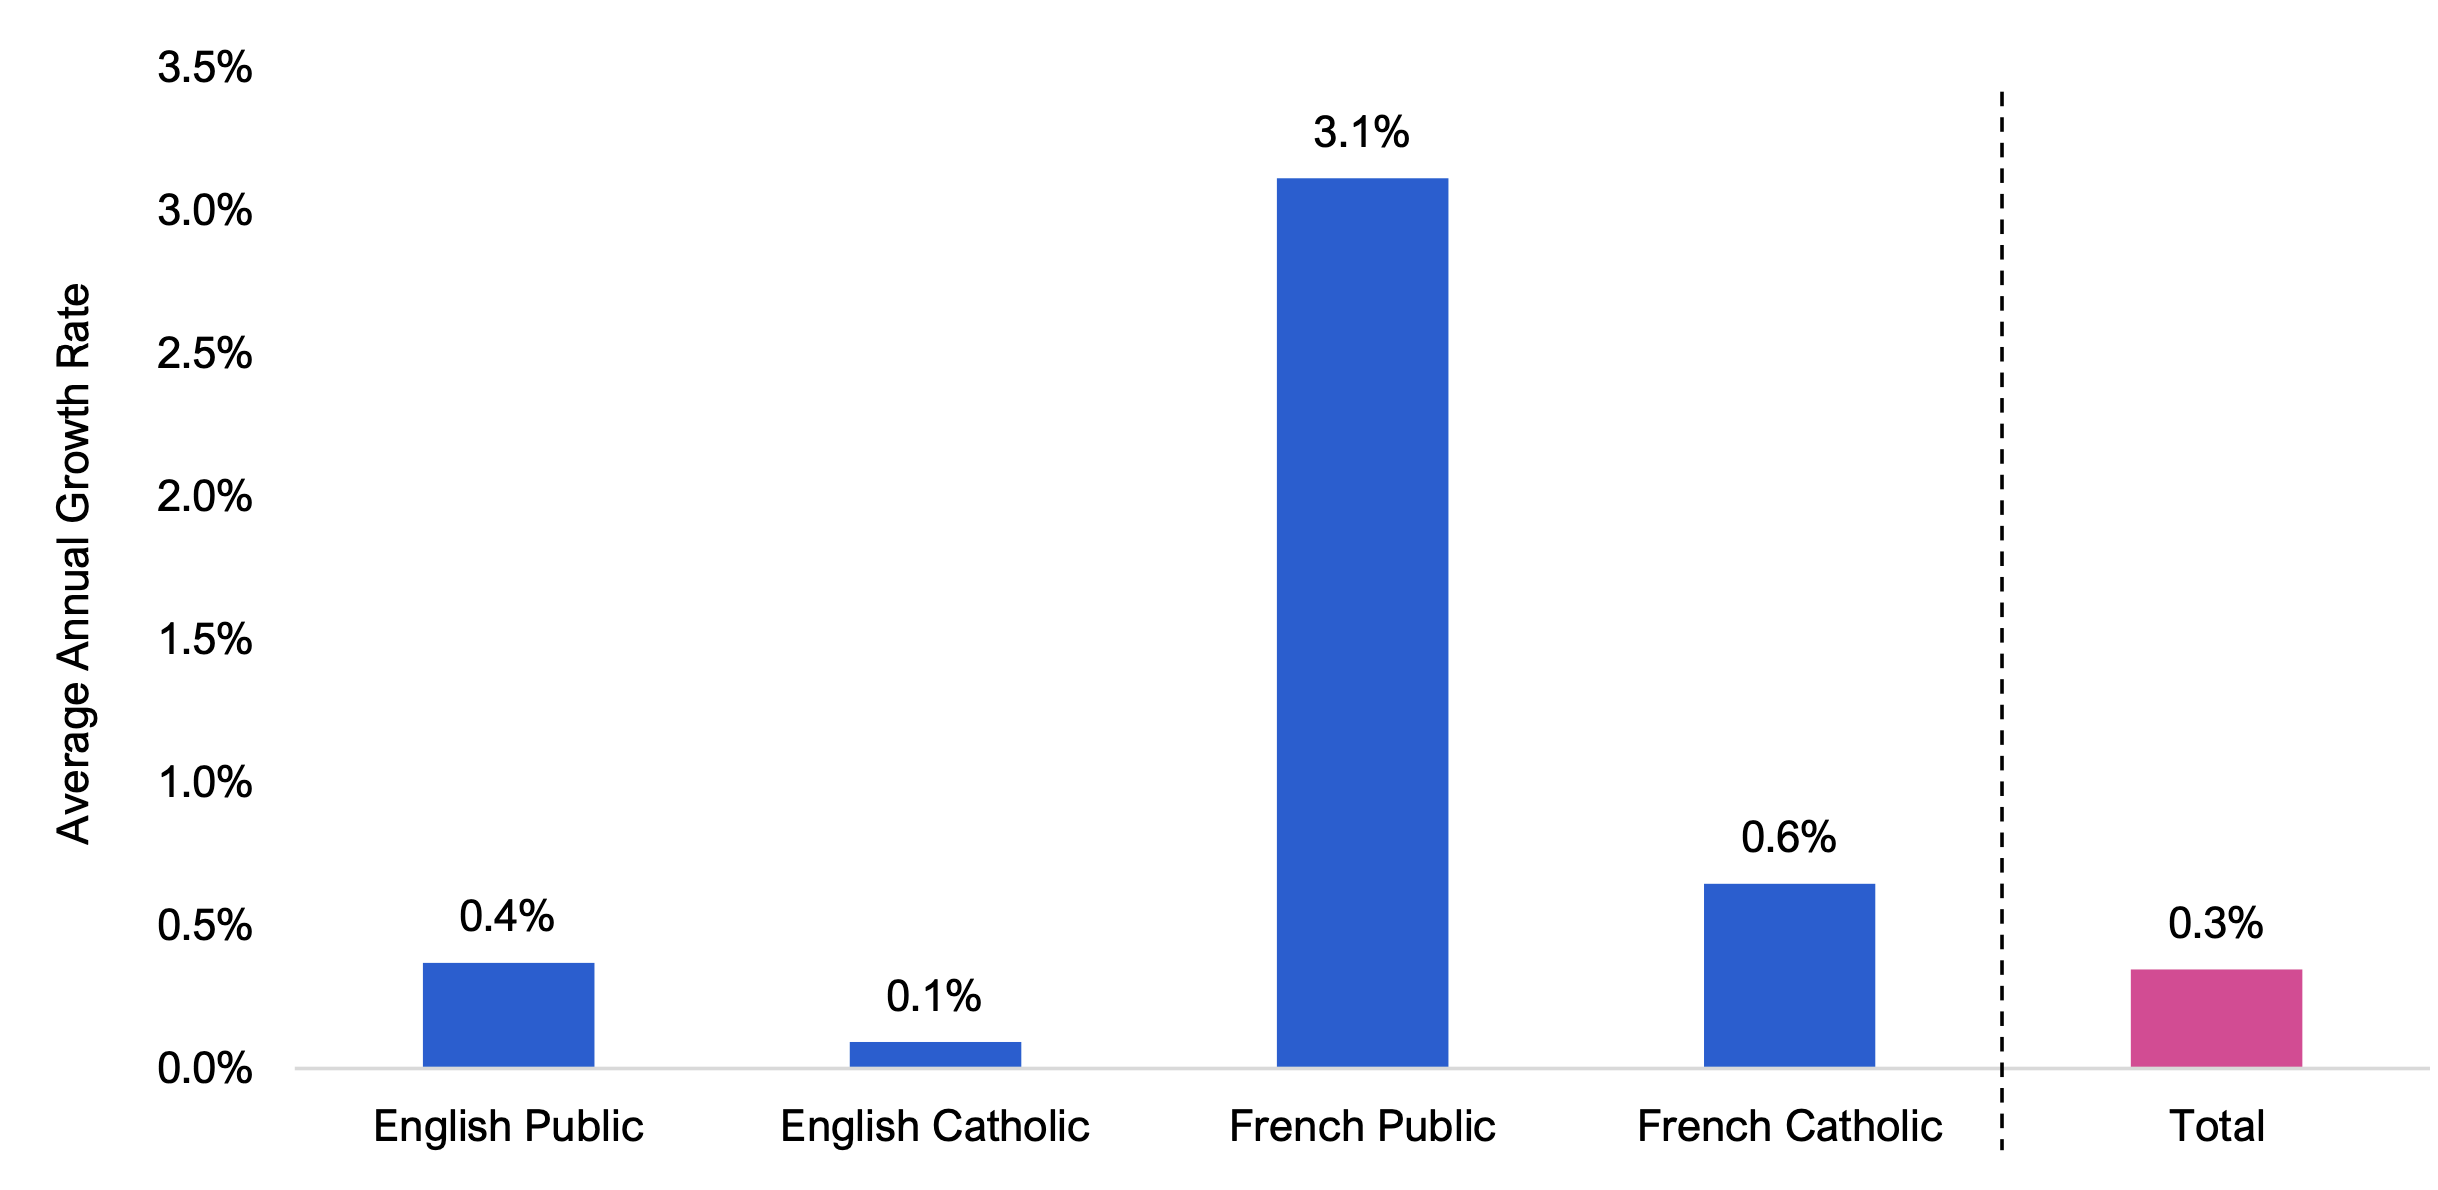
Note: Overall enrolment growth between 2015-16 and 2021-22 was impacted by lower enrolment in 2020-21 and 2021-22 due to the COVID-19 pandemic. For the period of 2015-16 to 2022-23, which includes a normalization of enrolment after the pandemic, the average annual increase for total enrolment was 0.5 per cent. English Public and English Catholic systems had average annual growth of 0.6 per cent and 0.2 per cent, respectively, from 2015-16 to 2022-23, while the French Public and French Catholic systems had average annual growth of 2.9 per cent and 0.5 per cent, respectively. In this report, enrolment refers to Average Daily Enrolment (ADE), which is a full-time equivalent measure of student enrolment based on two count dates during the school year in October and March.
Source: FAO analysis of information provided by the Province.
Children of French-language Rights-holders
In Ontario, schools in the French systems are available to students whose parents are “French-language rights-holders”, which includes parents whose first language learned and still understood is French, parents who received their elementary education in a French-system school within Canada and parents whose child attends/attended a French-system school within Canada.[13] French-system schools also accept recent immigrants who do not speak either French or English and may admit other students whose parents are not rights-holders.
In 2021, there were 268,250 school-aged children and youth whose parents were French-language rights-holders.[14] The areas with the largest concentration of school-aged children and youth whose parents are French-language rights-holders were: Ottawa (55,250), Toronto (34,720), Peel (19,675), York (15,495), Essex (11,555), Prescott and Russell (10,925), and Greater Sudbury (10,775).[15].
Figure 3.3 Ontario school-aged children and youth whose parents are French-language rights-holders by census division, 2021
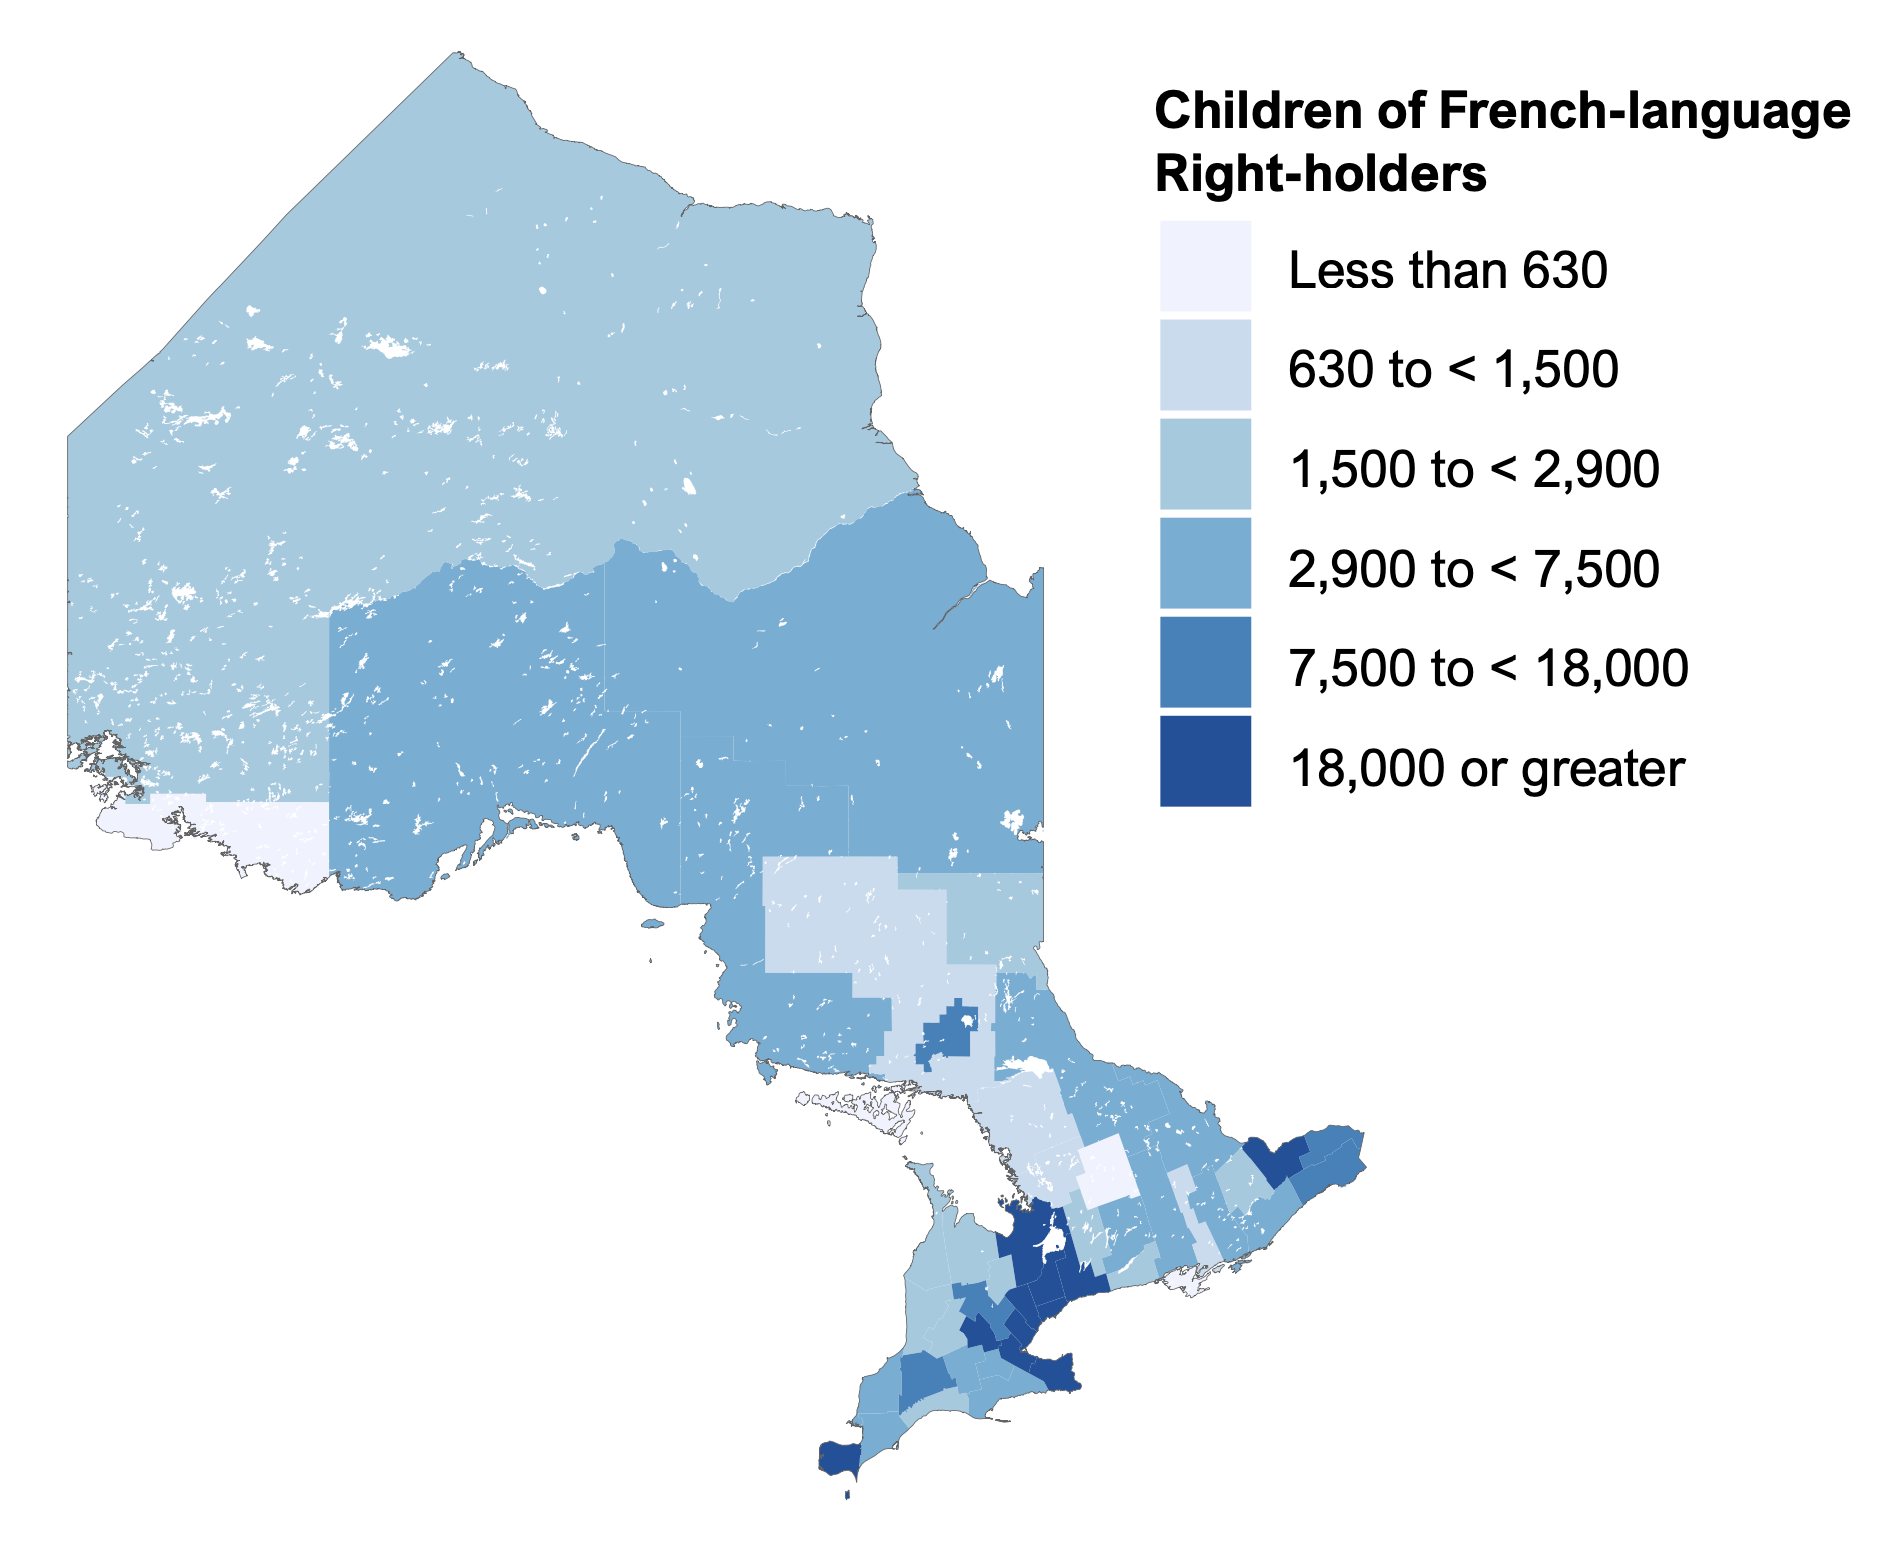
Note: Statistics Canada defines “school-aged children and youth” as children and youth aged five to 17. A census division refers to an intermediate geographic area (between a municipality and the province level) as defined by Statistics Canada.
Source: Statistics Canada, Census of Population, 2021.
In 2021, there were 158,309 total spaces[16] available in schools in French systems (Public and Catholic) for the Province’s 268,250 school-aged children and youth whose parents were French-language rights-holders, resulting in a coverage rate of 59.0 per cent. As a result, there were approximately 109,941 more children eligible to attend French-system schools than there were spaces available.
Figure 3.4 Ontario school-aged children and youth with French-language rights-holding parents versus spaces in French-language systems (Public and Catholic) schools, 2021-22
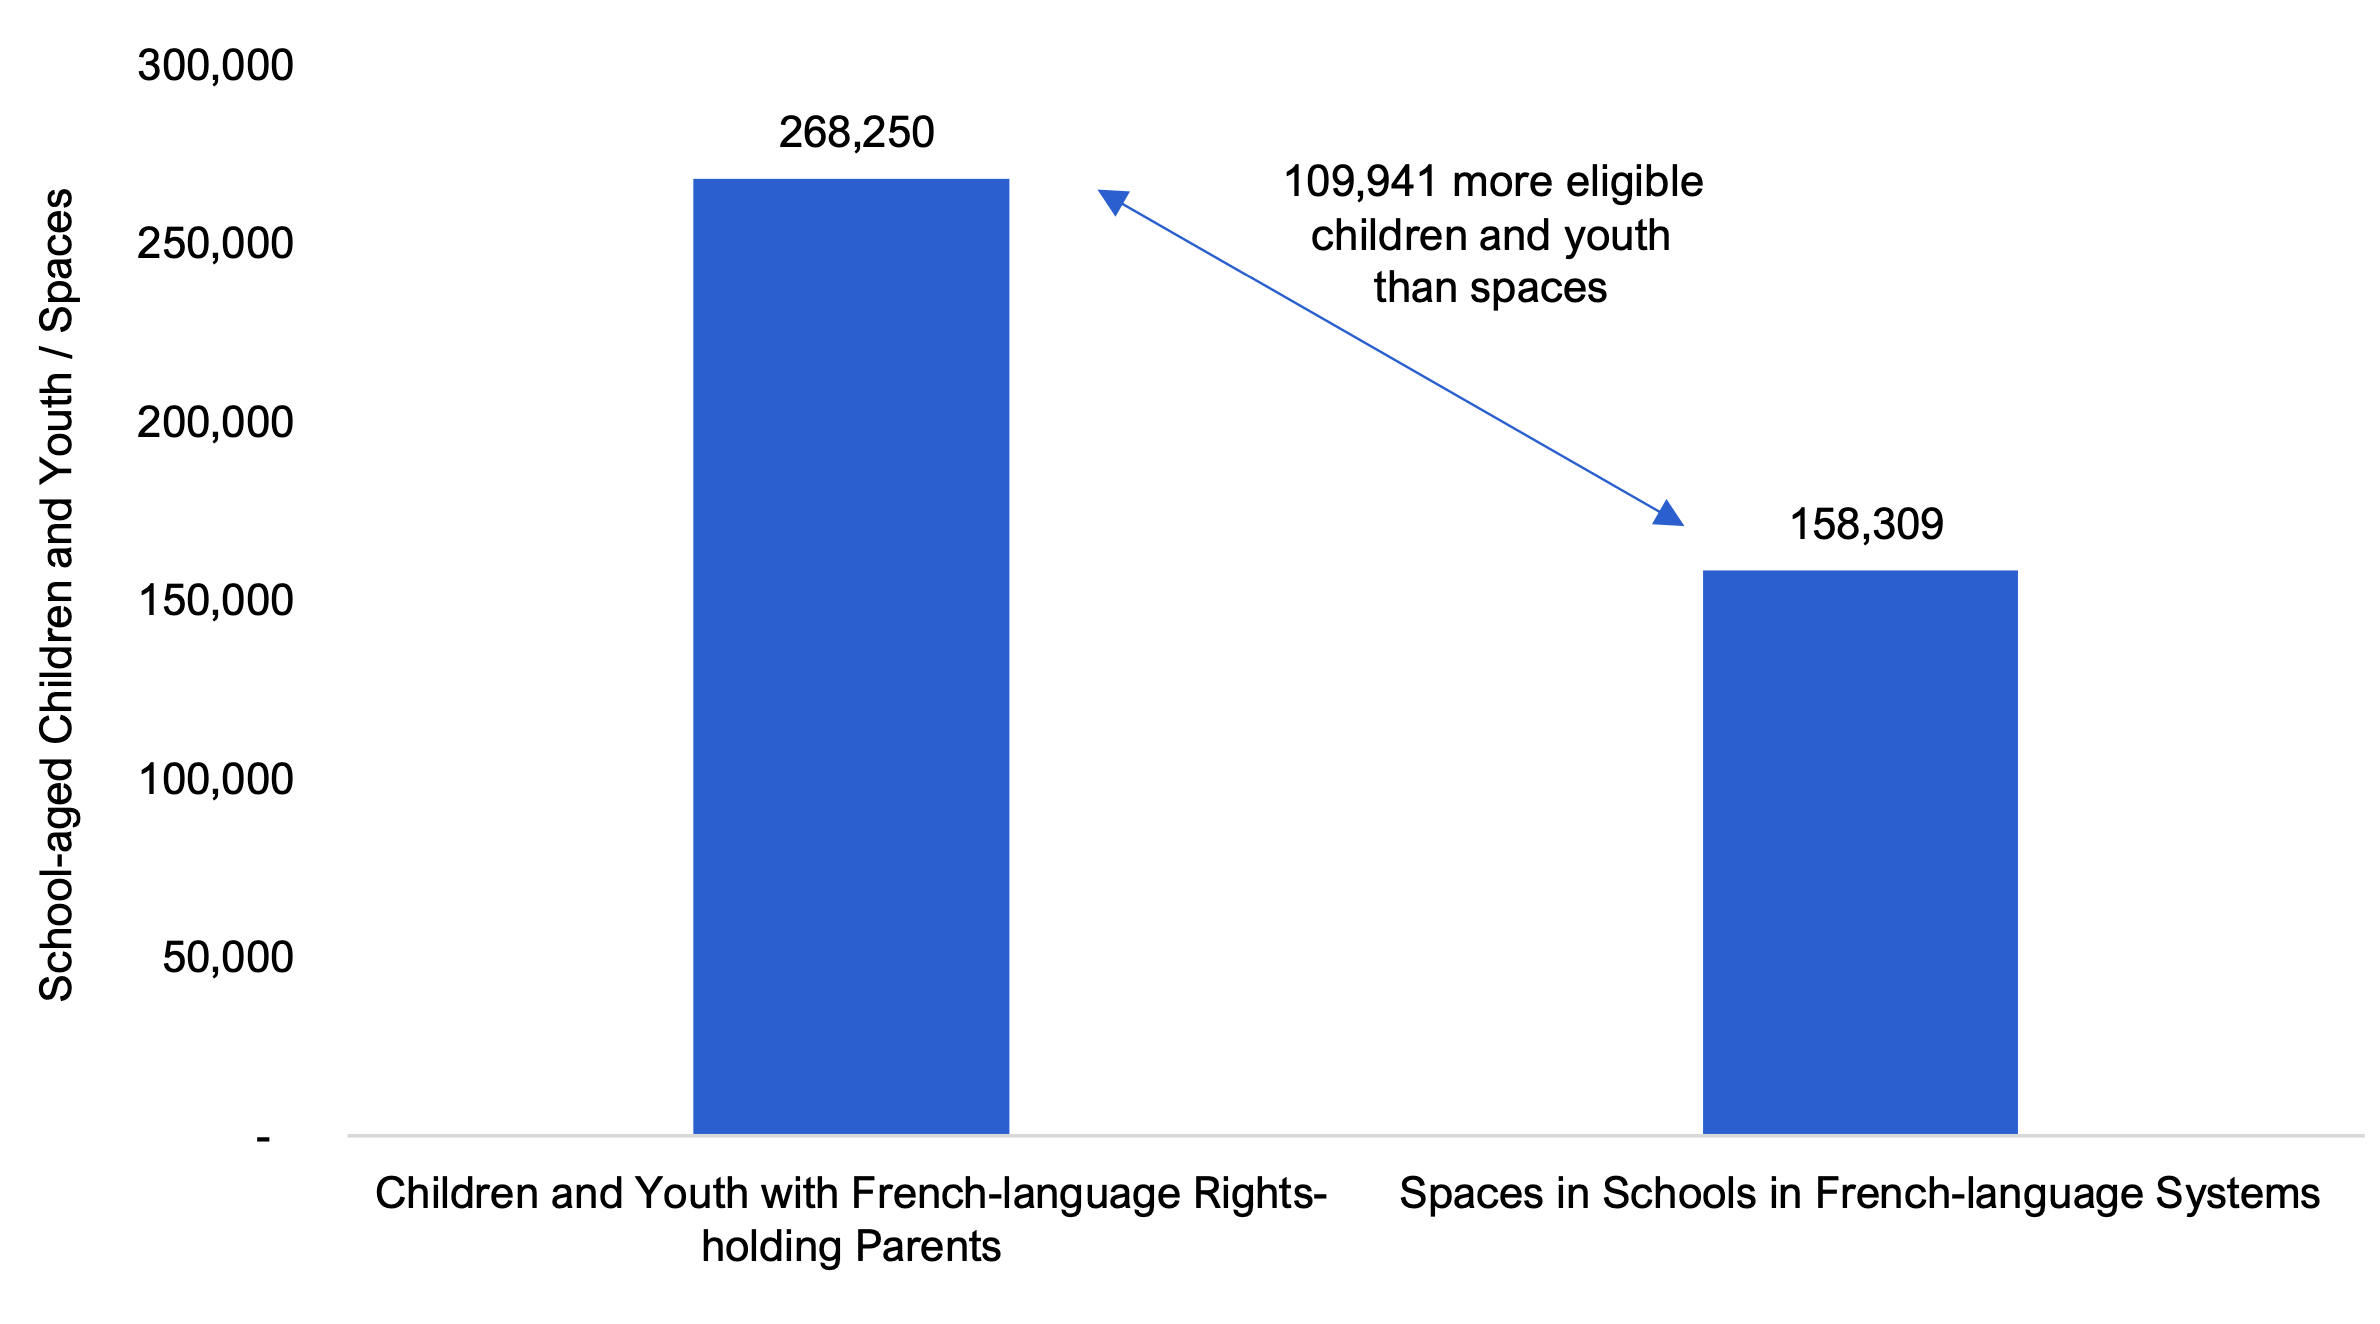
Source: Statistics Canada and FAO analysis of information provided by the Province.
There are also large regional differences in coverage for children and youth whose parents are French-language rights-holders. Thirty out of 49 census divisions[17] in Ontario had French-language rights-holders coverage rates below 50 per cent, 12 of which, with a combined 5,195 children and youth with French-language rights-holding parents, had no French-system schools at all. Most of these census divisions without French-system schools were in the Muskoka-Kawarthas and Stratford-Bruce Peninsula regions. Within the GTHA, coverage ranged from 19 per cent (Peel) to 37 per cent (Hamilton), while Ottawa had a coverage rate of 71 per cent.
Figure 3.5 Share of spaces in French-language school systems (Public and Catholic) vs. children and youth whose parents are French-language rights-holders, by census division, 2021
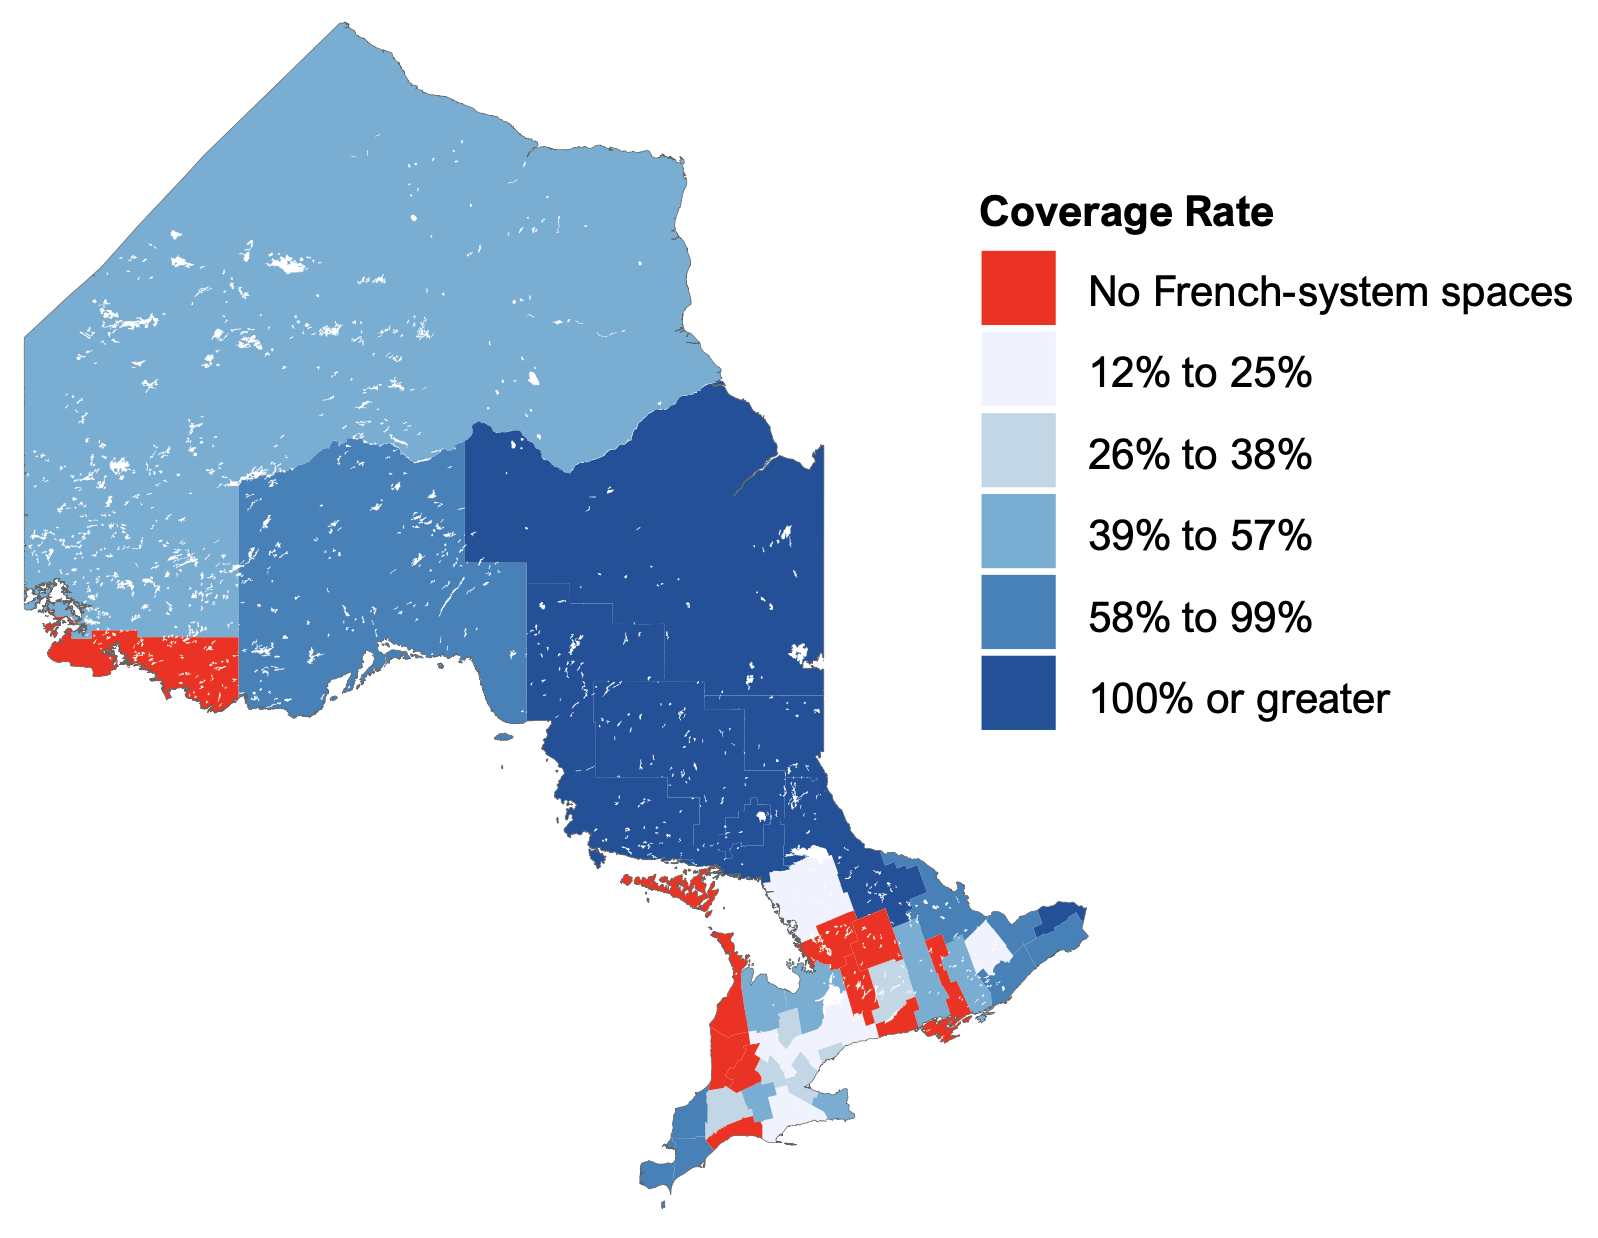
Note: The coverage rate represents the share of spaces in French-system schools (Public and Catholic) relative to the number of children and youth with French-language rights-holding parents by census division. A census division refers to an intermediate geographic area (between a municipality and the province level) as defined by Statistics Canada.
Source: Statistics Canada and FAO analysis of information provided by the Province.
Overall, a lack of available French-system school spaces combined with geographic proximity to French-system schools could be a barrier to French-language rights-holding parents who may otherwise want their children to attend French-system schools. According to Statistics Canada, attendance in French-system schools by children and youth whose parents are French-language rights-holders declines sharply as the distance between a child’s place of residence and the nearest French-system school increases.[18] In Ontario, less than half of children (46.7 per cent) eligible for French-language education are within walking distance (i.e., within two kilometres) of a French-system school.[19]
Catholic Children and Youth
Schools in Catholic systems (elementary and secondary) are available to school-aged children and youth who are baptized as Catholic or have at least one Catholic parent.[20] In addition, Catholic elementary schools may choose to accept non-Catholic students[21] and Catholic secondary schools are required to accept non-Catholic students.[22]
The FAO estimates that in 2021, 570,116 school-aged children and youth in Ontario identified as Catholic or had at least one Catholic parent.[23] The regions with the highest concentration of children and youth who identified as Catholic or had at least one Catholic parent were the GTHA, Ottawa, Essex, Waterloo and Simcoe.
Figure 3.6 School-aged children and youth who identify as Catholic or have at least one Catholic parent by census division, 2021
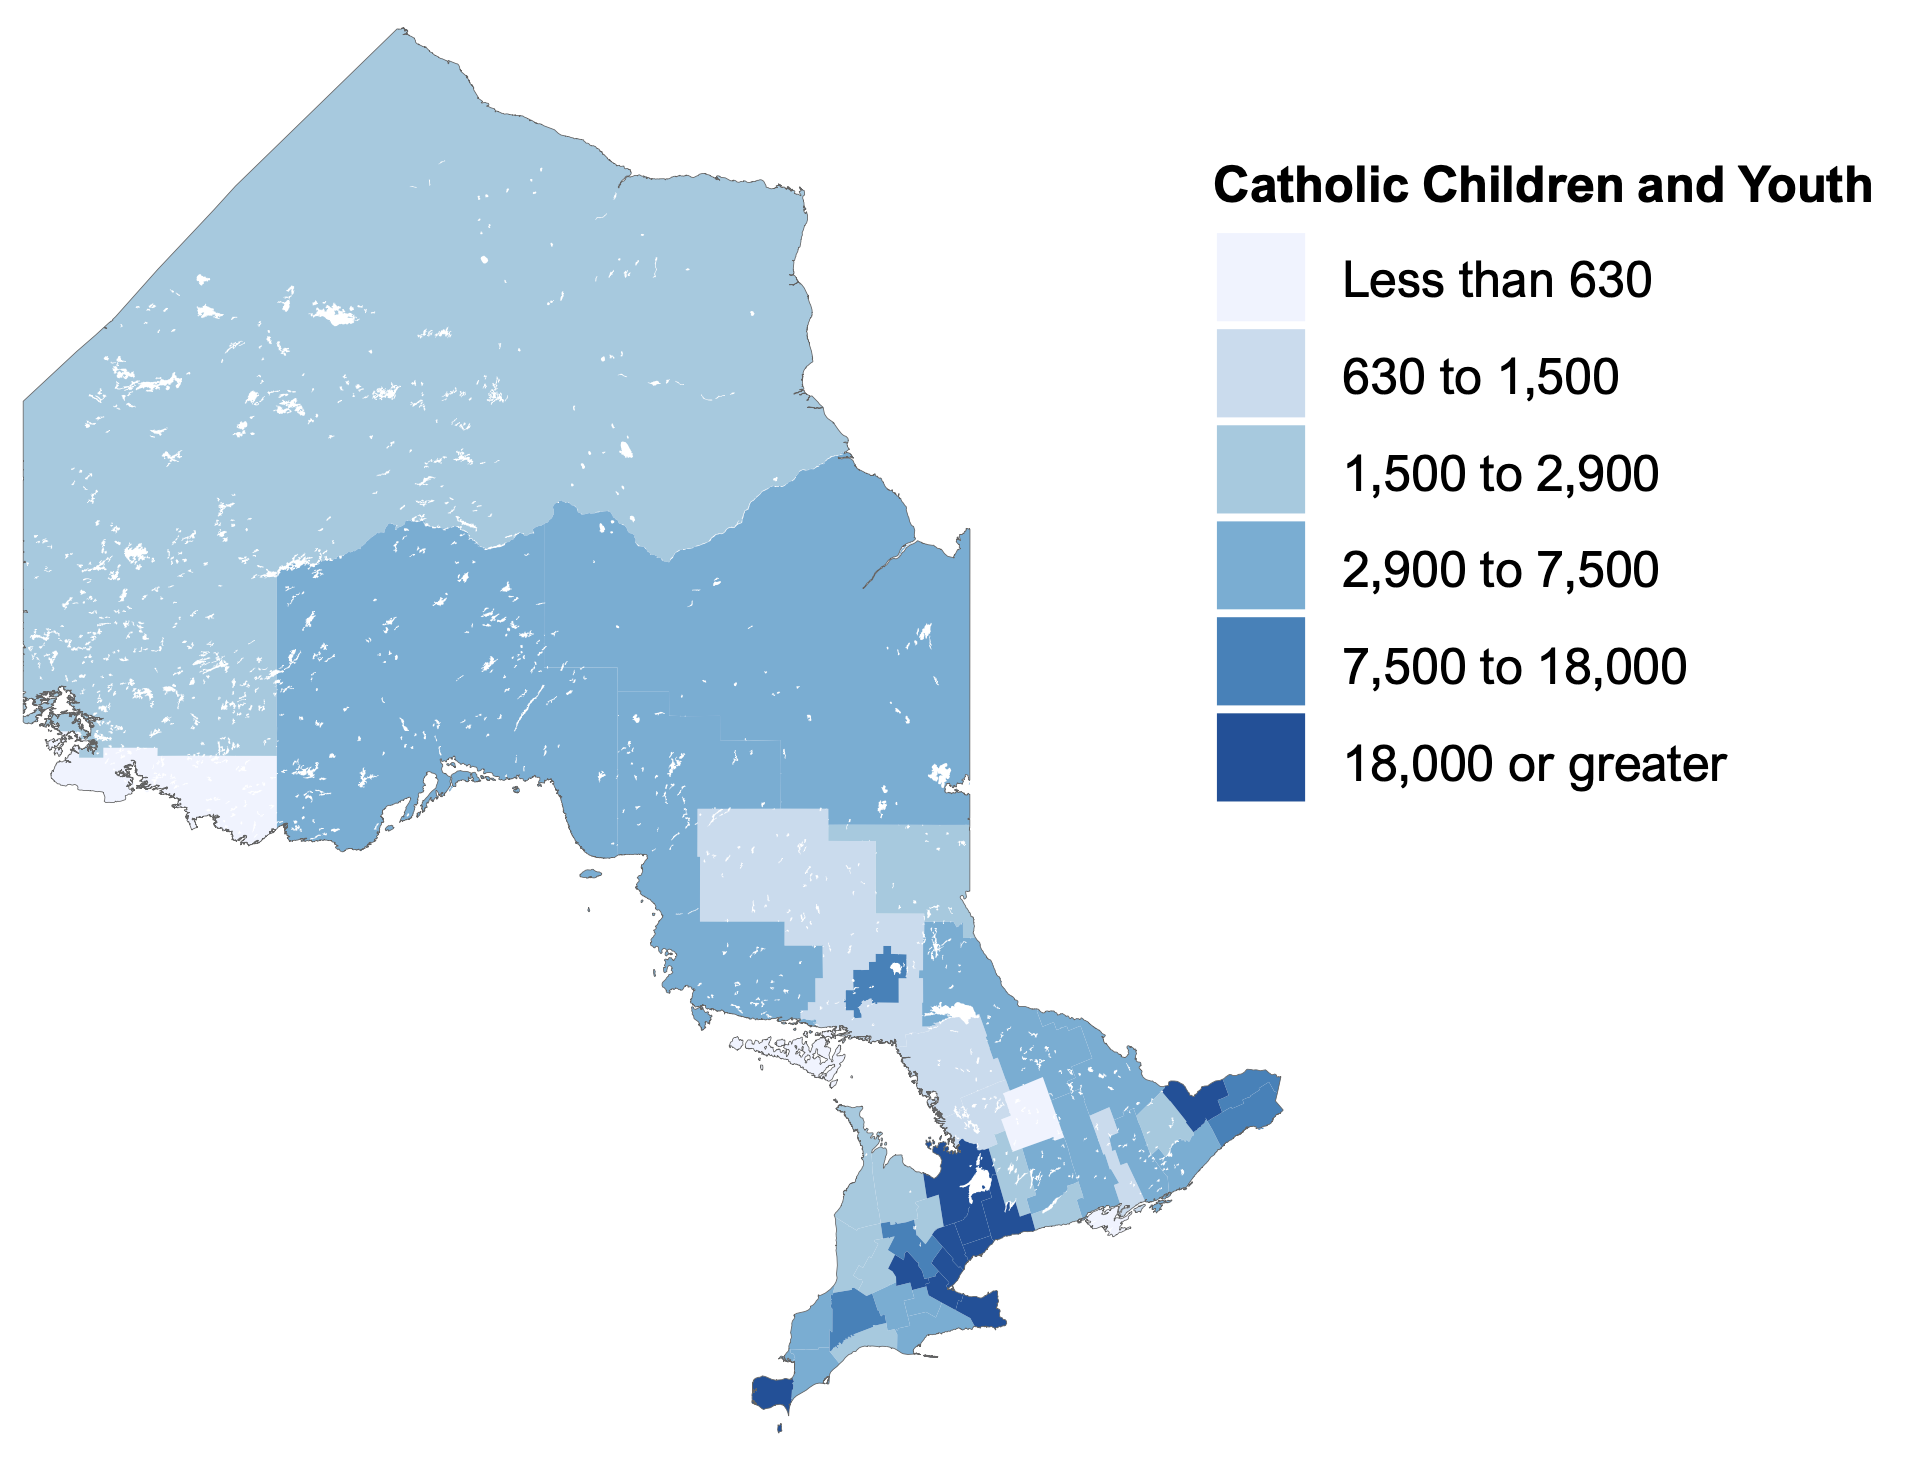
Note: A census division refers to an intermediate geographic area (between a municipality and the province level) as defined by Statistics Canada.
Source: FAO estimate using population demographic data from Statistics Canada, “Population estimates”, December 12, 2022, 2011 National Household Survey data, and “Religion by visible minority and generation status,” October 26, 2022.
In 2021, there were 725,416 spaces in Catholic schools compared to an estimated 570,116 school-aged children and youth who identified as Catholic or had at least one Catholic parent, leading to a coverage rate of 127.2 per cent. In other words, there were 155,300 more spaces in Catholic schools than there were school-aged children and youth who identified as Catholic or had at least one Catholic parent. As a result, there were more than sufficient spaces province-wide to provide a Catholic education to all school-aged children and youth who identified as Catholic or had at least one Catholic parent.
Figure 3.7 Ontario school-aged children and youth who identify as Catholic or have at least one Catholic parent vs. spaces in Catholic schools (English and French), 2021-22
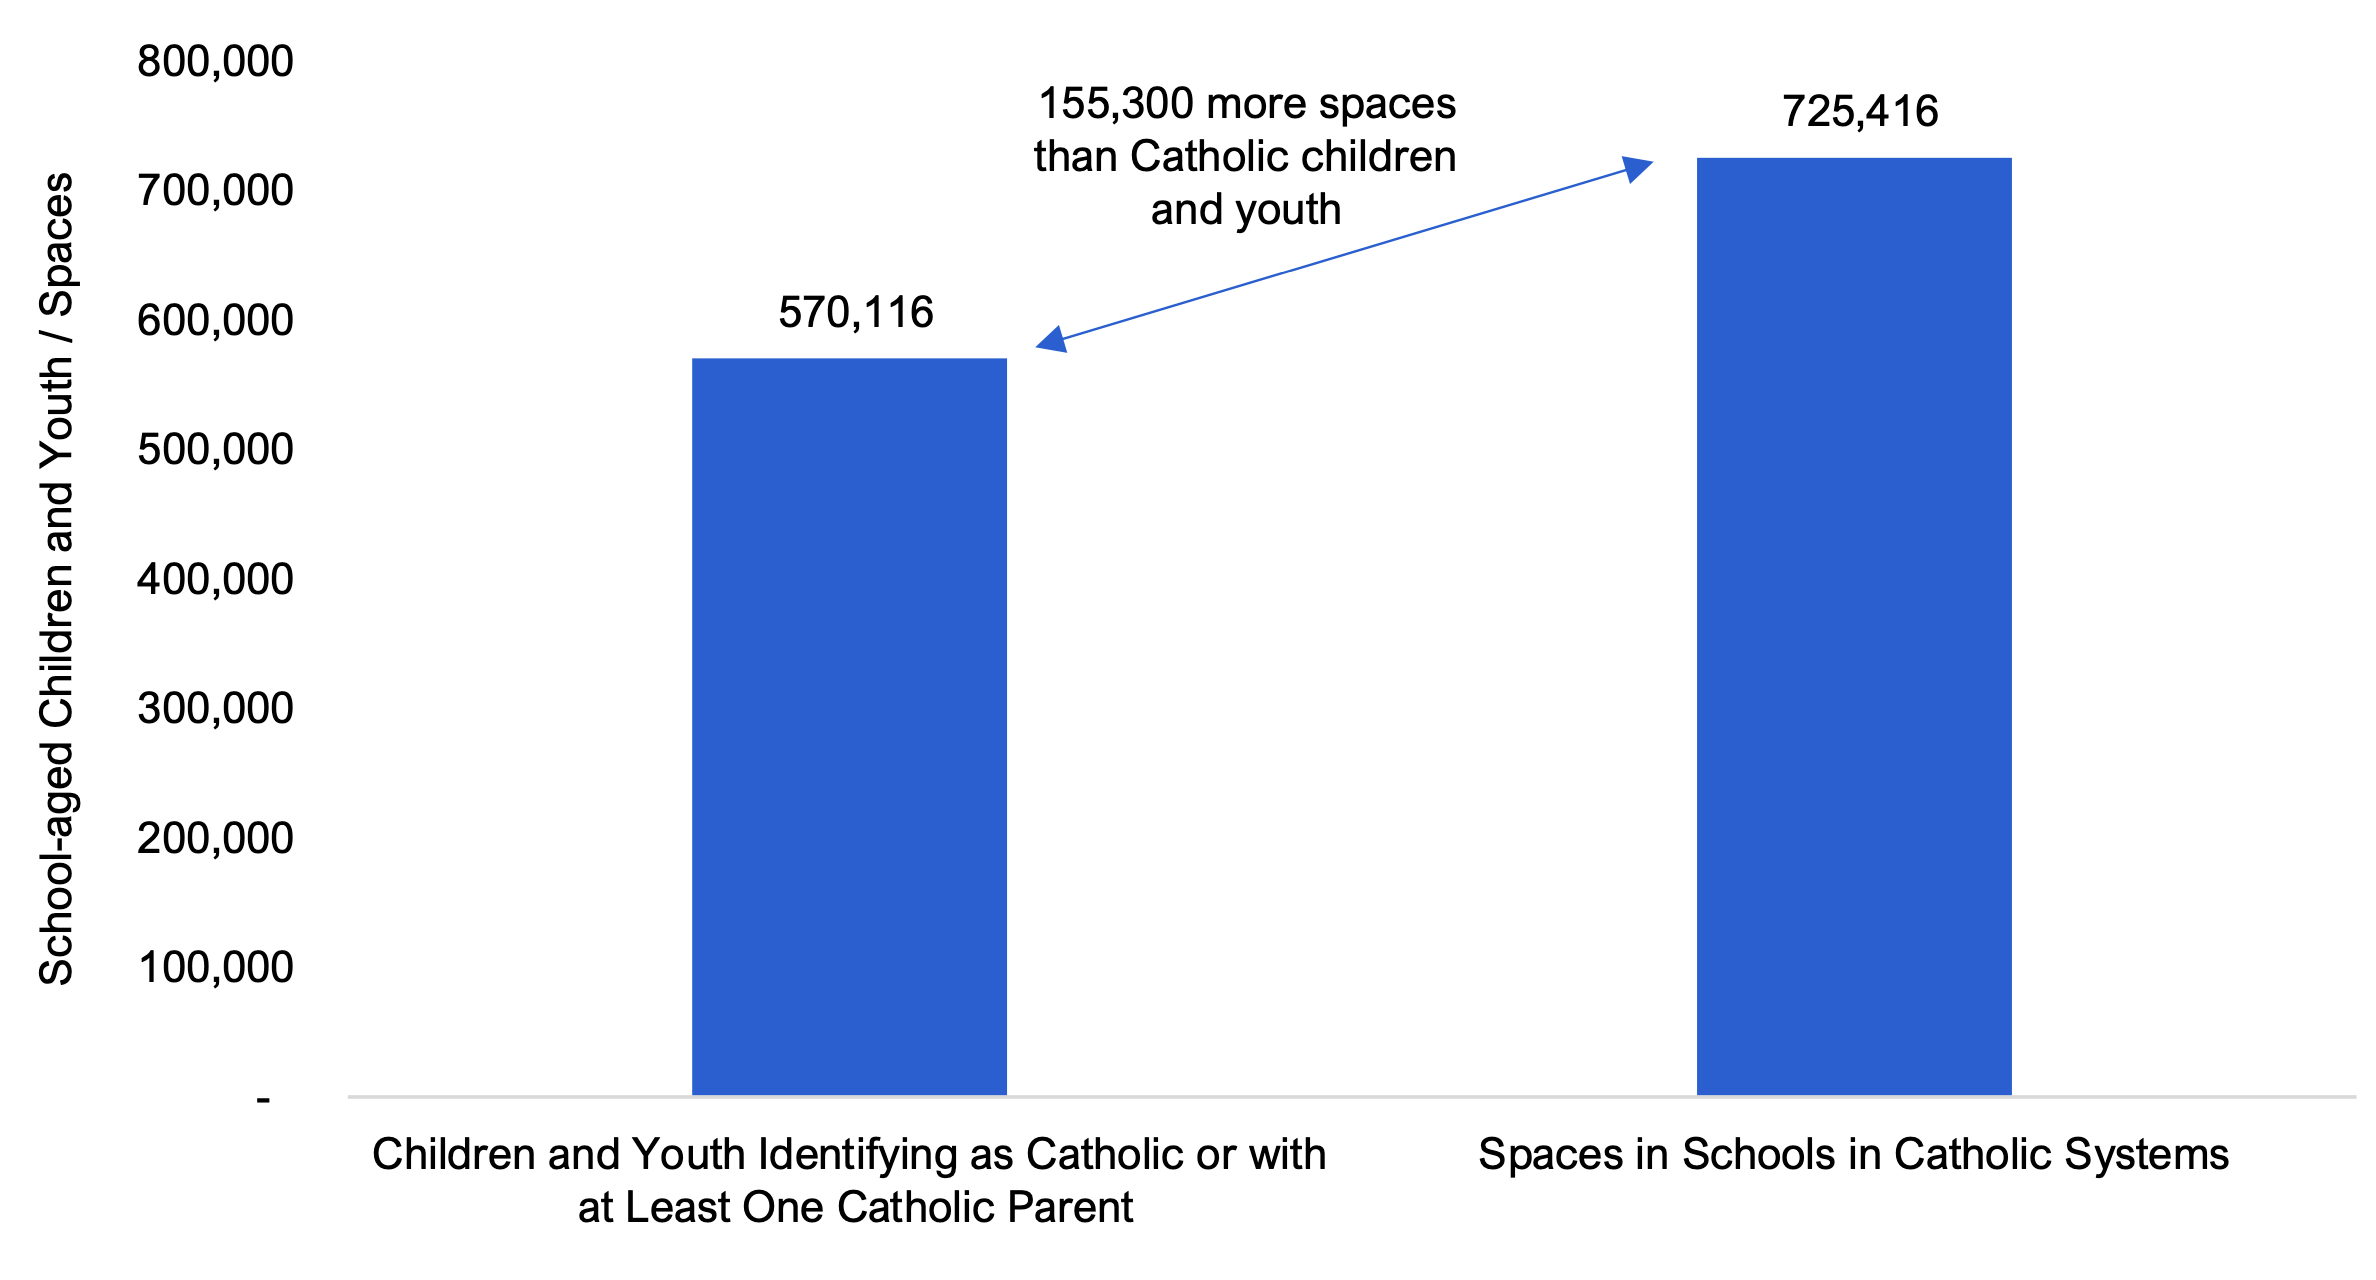
Source: Statistics Canada and FAO analysis of information provided by the Province.
Province-wide, capacity in Catholic schools significantly exceeded the number of school-aged children and youth who identified as Catholic or had at least one Catholic parent. Of the province’s 49 census divisions, 38 had Catholic-system coverage rates greater than 100 per cent, and an additional eight had coverage rates below 100 per cent but greater than 50 per cent. Of the remaining three census divisions, one had a coverage rate of 36 per cent (Lennox and Addington) and two, Haliburton and Manitoulin, had no schools in Catholic systems.
Figure 3.8 Share of spaces in Catholic school systems (English and French) vs. school-aged children and youth who identify as Catholic or have at least one Catholic parent, by census division, 2021
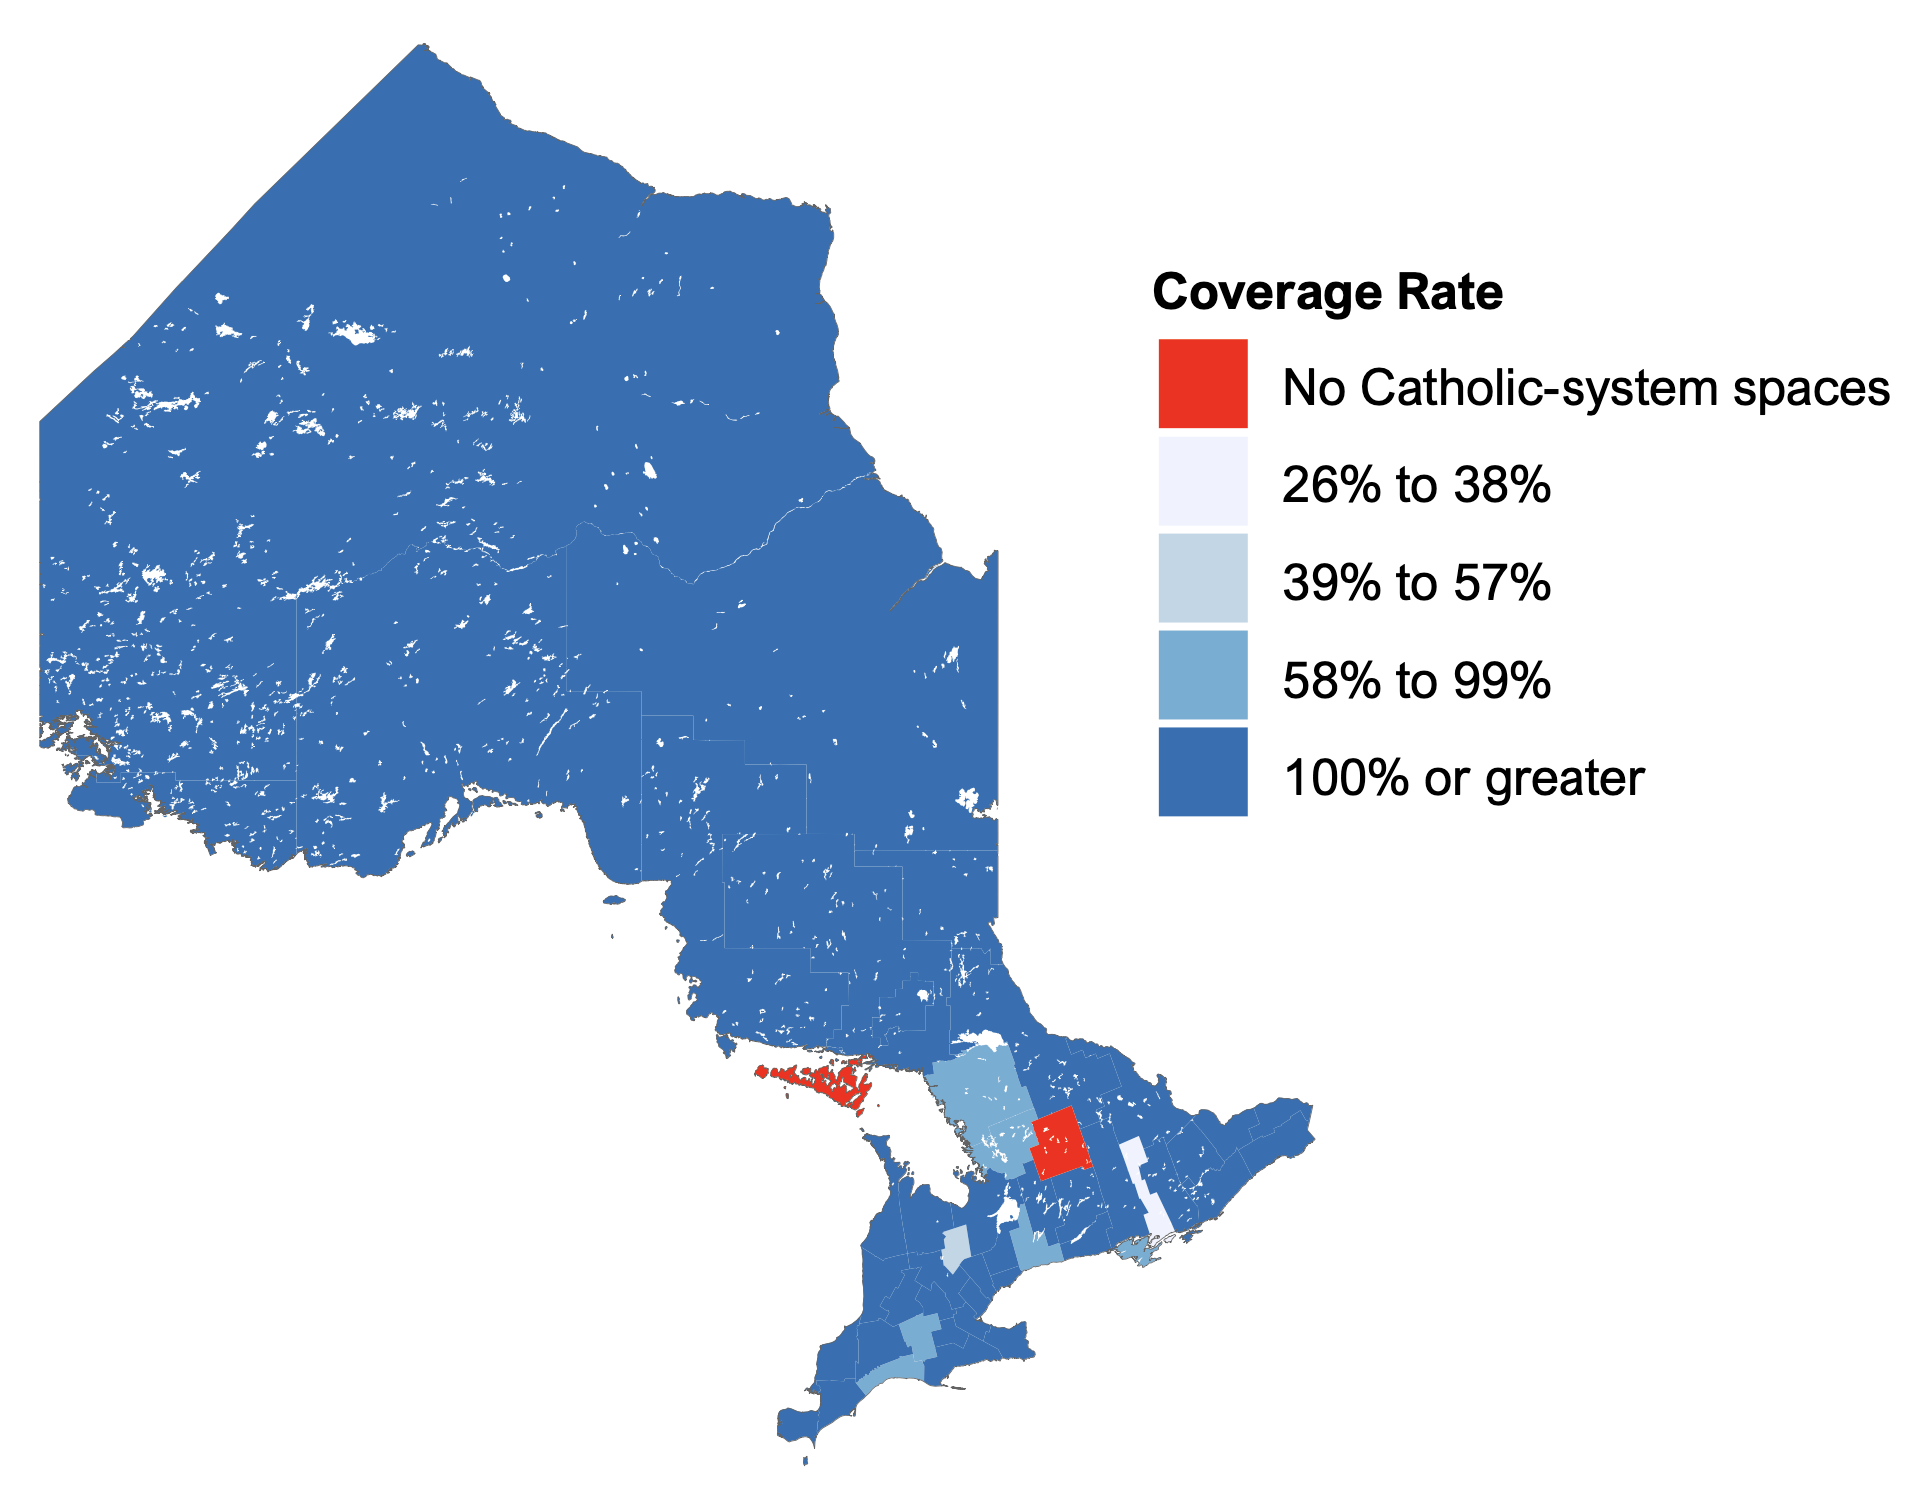
Note: The coverage rate represents the share of spaces in Catholic-system schools (English and French) relative to the number of school-age children and youth in Ontario who identify as Catholic or have at least one Catholic parent. A census division refers to an intermediate geographic area (between a municipality and the province level) as defined by Statistics Canada.
Source: Statistics Canada and FAO analysis of information provided by the Province.
4. Provincial Operating Funding for School Boards
Ontario’s education system is overseen by the Ministry of Education, which sets curriculum standards, establishes policies and provides the majority of the funding for the system. In the 2021-22 school year, the ministry provided an estimated $26.7 billion to school boards through three programs: $25.4 billion through a collection of grants called the Grants for Student Needs (GSN),[24] $1.3 billion through the Priorities and Partnership Fund (PPF) and $23 million through the Ontario Languages Projects (OLP) program.[25]
Per-student Funding by School Board and School System
On a per-student basis, school boards received an average of $13,364 in provincial funding per student in 2021-22. However, the amount of per-student funding varied significantly by school board, ranging from $11,729 per student for the Halton Catholic District School Board (DSB) to $35,192 per student for the Conseil scolaire de district (CSD) catholique des Aurores boréales.[26]
Figure 4.1 Provincial funding to school boards per student, 2021-22 school year, dollars
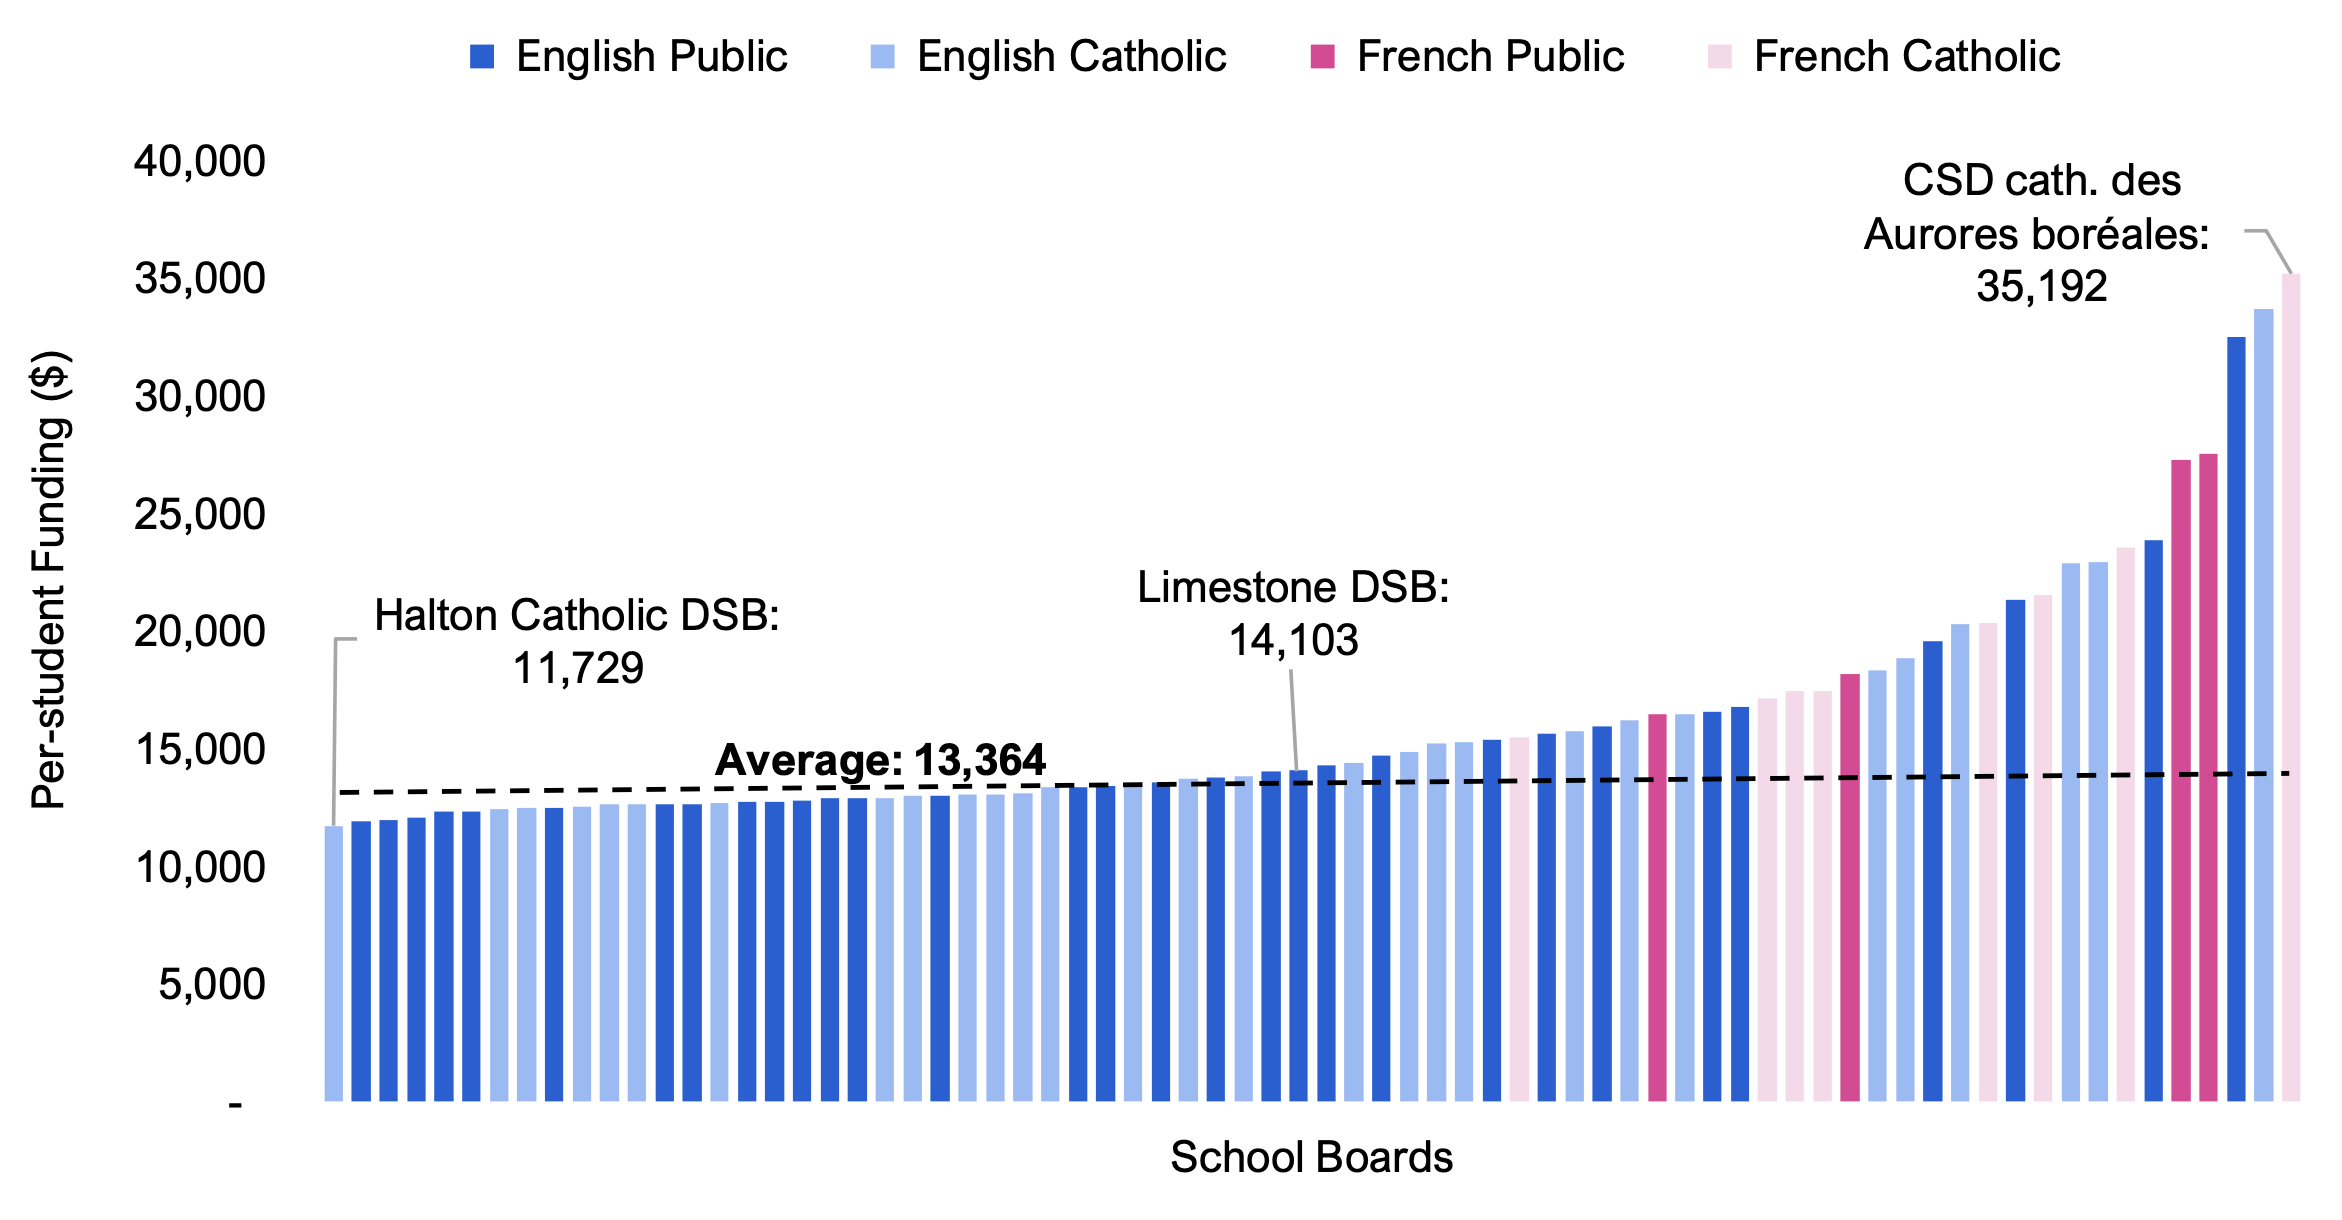
Source: 2021-22 school board financial statements and FAO analysis of information provided by the Province.
By school system, on a per-student basis, the English Public and English Catholic systems received $13,027 and $13,252 in 2021-22, respectively. French-language school systems received, on average, higher per-student funding at $18,585 per student for the French Public system and $17,680 per student for the French Catholic system.
There are four primary factors that explain the difference in per-student funding between school boards and school systems: enrolment, dispersion, remoteness and urban factor, and French-language instruction. The remainder of this chapter will discuss these factors by the Province’s three main funding streams.
Figure 4.2 Provincial per-student funding by school system, 2021-22 school year, dollars
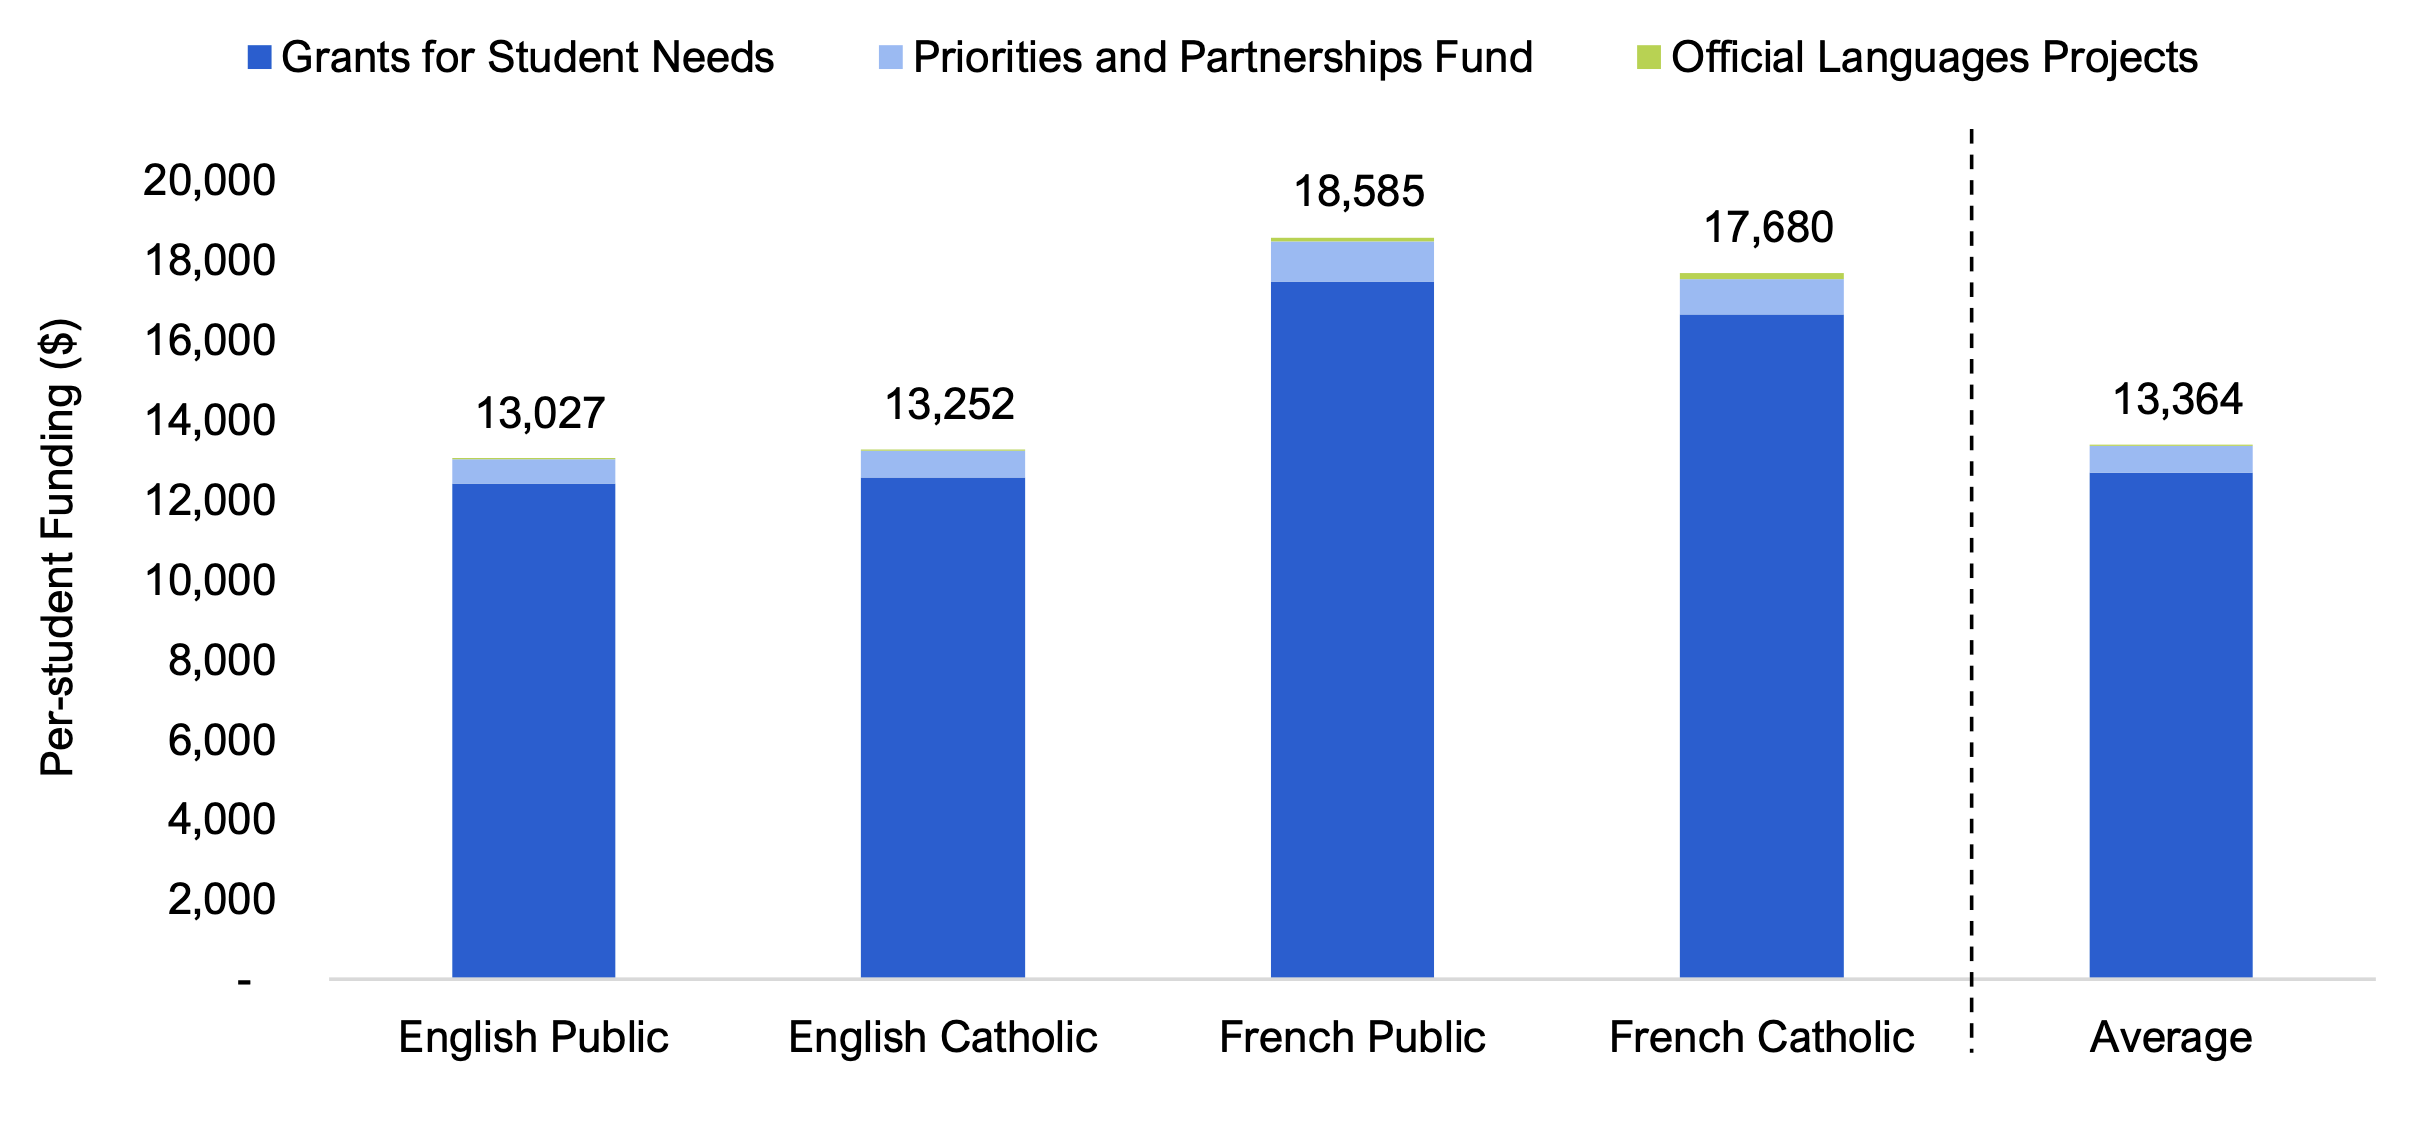
Source: FAO analysis of information provided by the Province.
Grants for Student Needs
The GSN is a collection of 17 grants that provide funding to school boards for teachers, administration, school operations and maintenance, supplies and equipment, pupil transportation and other needs. The main purpose of the GSN is to ‘provide a fair allocation for all students’ across Ontario, regardless of the school board or school system they are enrolled in.[27] The overall GSN funding envelope is determined by the Province. To fund the GSN, education property tax revenues are remitted directly to school boards from municipalities and then the Province provides grants to school boards to top up funding to meet required GSN amounts.
Each of the 17 grants within the GSN has its own funding formula. Across most of the grants, the primary factor that determines funding is student enrolment, as measured by school boards’ Average Daily Enrolment (ADE). However, recognizing that some school boards may face higher costs and have unique circumstances, many of the GSN grants are designed to provide additional funding to school boards that are smaller (i.e., have lower enrolment), have schools that are distant and disperse (i.e., their schools are far apart from one another),[28] are remote (i.e., far from an urban centre) and are French-language based.
Similarly, the Province recognizes school boards will also face higher costs to support students with special education needs, students who are recent immigrants, Indigenous students and students from lower socio-economic status. As a result, many GSN grants provide different levels of funding to each school board, relative to their student enrolment characteristics.
| GSN Grant | Total Funding ($ millions) | Enrolment | Base Funding* | Remoteness & Urban Factor | Distance & Dispersion | French-language | Other |
|---|---|---|---|---|---|---|---|
| Pupil Foundation Grant | 11,297 | ✓ | |||||
| Special Education Grant | 3,132 | ✓ | ✓ | ✓ | ✓ | ✓ | ✓ |
| Cost Adjustment and Teacher Qualifications and Experience Grant | 2,382 | ✓ | ✓ | ||||
| School Operations Allocation | 2,172 | ✓ | ✓ | ✓ | |||
| School Foundation Grant | 1,559 | ✓ | ✓ | ✓ | ✓ | ||
| Student Transportation Grant | 1,126 | ✓ | ✓ | ||||
| Language Grant | 894 | ✓ | ✓ | ✓ | |||
| Learning Opportunities Grant | 543 | ✓ | ✓ | ✓ | ✓ | ||
| Geographic Circumstances Grant | 218 | ✓ | ✓ | ✓ | ✓ | ✓ | |
| All Other Grants | 2,048 | ✓ | ✓ | ✓ | ✓ | ✓ | ✓ |
| GSN Total | 25,372 |
The largest GSN grant is the Pupil Foundation Grant, which accounted for $11.3 billion in funding to school boards in 2021-22. The Pupil Foundation Grant is responsible for funding classroom costs, including teachers, early childhood educators, textbooks, supplies, and computers and other equipment. The allocation of the Pupil Foundation Grant is entirely determined by enrolment. As a result, all school boards received approximately the same amount of funding on a per-student basis ($5,655) through this grant.
The second largest grant is the Special Education Grant, which accounted for $3.1 billion in funding in 2021-22. The Special Education Grant provides school boards with targeted funding to support students who require special education programs, services and equipment. While the Special Education Grant is primarily allocated based on enrolment (both overall enrolment and enrolment of students with special education needs), some other factors that impact a school board’s allocation include equal base funding across school boards for certain components,[29] differentiated funding for remote, French-language and Northern school boards, and funding tied to regional socio-economic status. As a result, school board allocations for the Special Education Grant ranged from $1,370 per student to $4,789 per student.
The grant with the largest variation in per-student funding is the Geographic Circumstances Grant, the purpose of which is to provide additional support to school boards that face higher costs because of their geography. Funding is allocated primarily based on school board enrolment, remoteness, and distance and dispersion. It also includes targeted funding for French-language school boards. The Toronto DSB and the Toronto Catholic DSB received no funding from this grant. Other urban school boards received less than $1 per student, while smaller, more remote school boards received up to $6,054 per student.
The Language Grant provides funding to English-language school boards for the ‘English as a Second Language’ and ‘French as a Second Language’ programs. It also provides funding to French-language school boards for the ‘French as a First Language’, ‘Actualisation linguistique en francais’ and ‘Programme d’appui aux nouveaux arrivants’ programs. The FAO estimates that on a per-student basis, the Language Grant provided an average of $354 in funding per-student to English-language school boards and $2,043 per student in funding to French-language school boards.
Other notable grants with moderate variation in per-student funding levels include:
- the Cost Adjustment and Teacher Qualifications and Experience Grant, which primarily provides additional funding for teachers’ salaries above benchmark levels to reflect additional qualifications and experience. On average, this grant provided $1,193 in funding per-student. Per-student funding by school board ranged from $557 to $1,669.
- the School Operations Allocation, which provided an average of $1,087 in funding per student in 2021-22 to address the costs of operating school facilities (such as lighting, heating, maintenance and cleaning). By school board, per-student funding levels ranged from $989 to $3,988.
- the School Foundation Grant, which primarily funds school administration, including principals and vice-principals. On average, this grant provided school boards with an average of $781 per student in funding. By school board, per-student funding levels ranged from $689 to $2,253.
- the Student Transportation Grant, which provided an average of $564 per student in 2021-22 to transport students to and from school. In the 2021-22 school year, funding was largely allocated based on school boards’ 1997 actual transportation expenditures and adjusted for enrolment growth from 1997. These expenditures were influenced by each board’s geography, including its geographic area, dispersion and enrolment density. Per-student funding levels by school board ranged from $276 to $1,912.
- the Learning Opportunities Grant, which provides funding for programs to support students who are at risk of poor academic achievement. On average, this grant provided $272 per student in funding. By school board, per-student funding ranged from $85 to $673.
GSN Per-student Funding by School Board
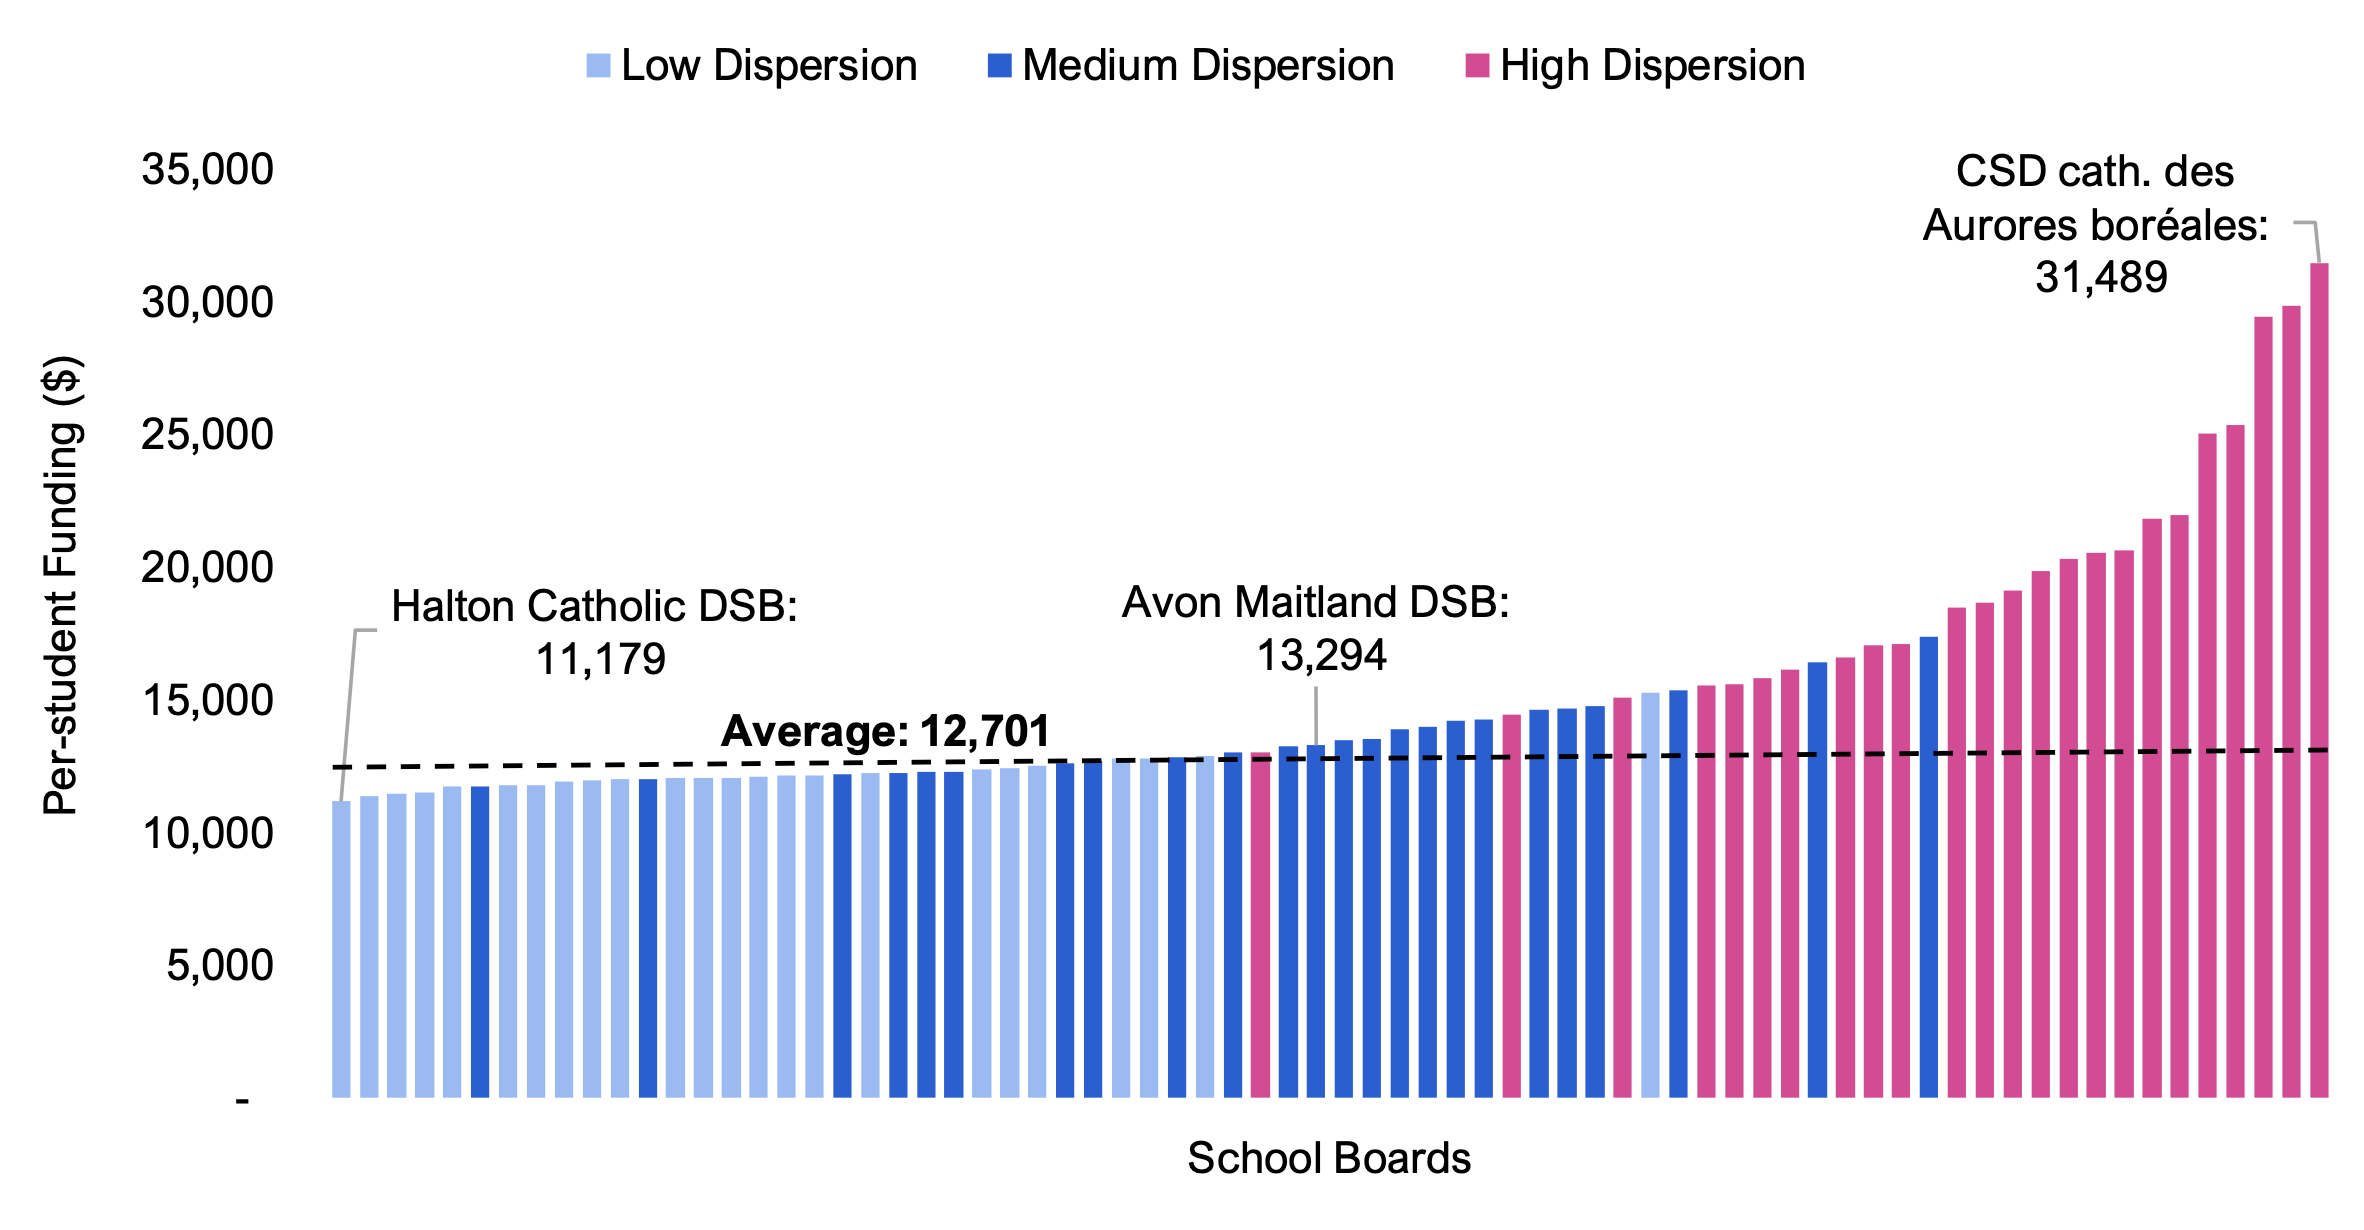
In 2021-22, the GSN provided $25.4 billion in funding or $12,701 per student. Average funding per student can differ greatly depending on the factors discussed above, such as enrolment, dispersion, remoteness and urban factor, and French-language instruction. As a result, the GSN program provided per-student funding that ranged from a low of $11,179 for the Halton Catholic DSB to a high of $31,489 for the CSD catholique des Aurores boréales, reflecting the diversity of needs and circumstances among different school boards.
Figure 4.3 GSN funding per student, by school board, 2021-22 school year, dollars
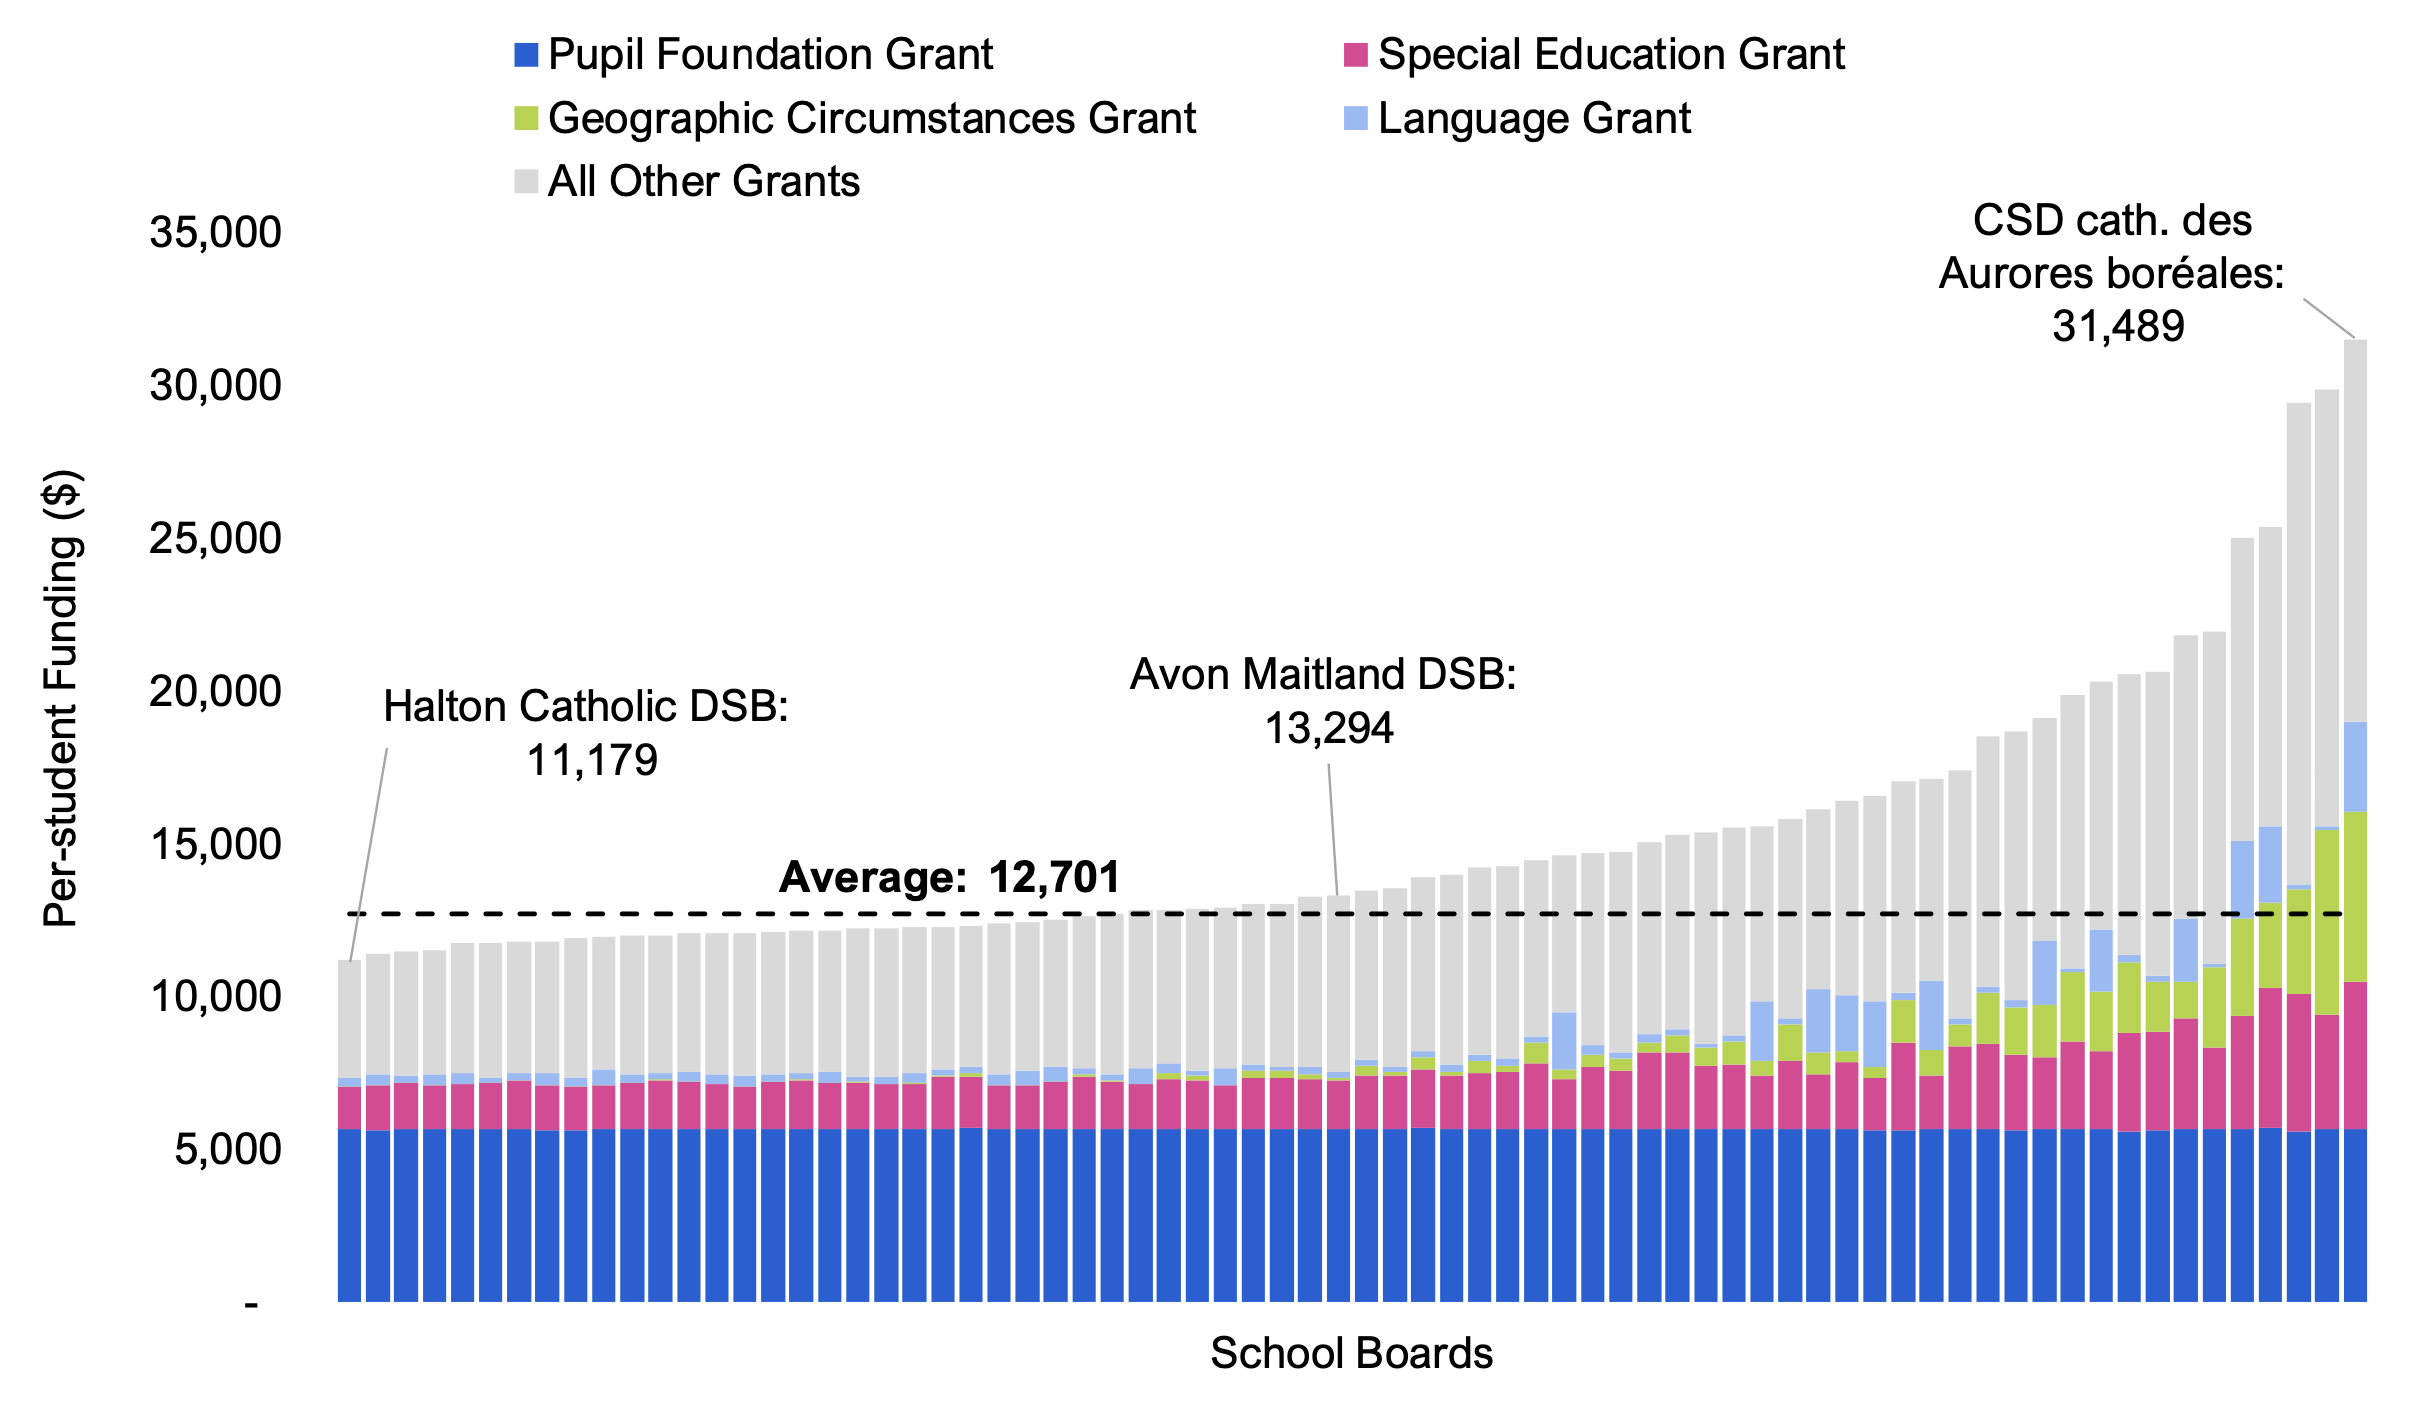
Source: FAO analysis of information provided by the Province.
Key Factors Driving Differences in GSN Per-student Funding
The FAO examined which school boards had the highest and lowest per-student GSN funding levels. The school boards that received the highest per-student funding included CSD catholique des Aurores boréales ($31,489), the Superior-Greenstone DSB ($29,858), the Superior North Catholic DSB ($29,452), CSP du Grand Nord de l’Ontario ($25,360) and CSP du Nord-Est de l’Ontario ($25,026).
The school boards that received the lowest per-student GSN funding included the Halton Catholic DSB ($11,179), the Halton DSB ($11,386), the Durham DSB ($11,465), the Waterloo Region DSB ($11,522) and the Waterloo Catholic DSB ($11,734).
| School Board Characteristics | |||||
|---|---|---|---|---|---|
| School Board | Per-student GSN Funding ($) | School System | Enrolment | Dispersion (km) | Remoteness (km) |
| Top Ten | |||||
| CSD catholique des Aurores boréales | 31,489 | French Catholic | 815 | 189 | 1,255 |
| Superior-Greenstone DSB | 29,858 | English Public | 1,189 | 73 | 967 |
| Superior North Catholic DSB | 29,452 | English Catholic | 610 | 91 | 1,038 |
| CSP du Grand Nord de l’Ontario | 25,360 | French Public | 2,629 | 104 | 363 |
| CSP du Nord-Est de l’Ontario | 25,026 | French Public | 2,024 | 124 | 313 |
| Rainy River DSB | 21,956 | English Public | 2,034 | 50 | 1,584 |
| CSD catholique Franco-Nord | 21,829 | French Catholic | 2,535 | 25 | 312 |
| Kenora Catholic DSB | 20,625 | English Catholic | 1,233 | 84 | 1,709 |
| Northwest Catholic DSB | 20,540 | English Catholic | 1,189 | 129 | 1,587 |
| CSD catholique des Grandes Rivières | 20,333 | French Catholic | 5,494 | 49 | 654 |
| Top 10 Average | 23,188 | - | 1,975 | 77 | 810 |
| Bottom Ten | |||||
| Halton Catholic DSB | 11,179 | English Catholic | 35,844 | 7 | <151 |
| Halton DSB | 11,386 | English Public | 65,803 | 6 | <151 |
| Durham DSB | 11,465 | English Public | 74,094 | 6 | <151 |
| Waterloo Region DSB | 11,522 | English Public | 64,153 | 5 | <151 |
| Waterloo Catholic DSB | 11,734 | English Catholic | 24,231 | 7 | <151 |
| Simcoe County DSB | 11,746 | English Public | 54,367 | 12 | <151 |
| Durham Catholic DSB | 11,791 | English Catholic | 21,459 | 7 | <151 |
| York Region DSB | 11,811 | English Public | 124,808 | 6 | <151 |
| York Catholic DSB | 11,922 | English Catholic | 50,315 | 7 | <151 |
| Peel DSB | 11,970 | English Public | 150,607 | 4 | <151 |
| Bottom 10 Average | 11,704 | - | 66,568 | 6 | <151 |
The school boards with the highest and lowest per-student funding exhibited different characteristics.[30] The top 10 school boards in per-student funding had low enrolment (under 5,500 students), were situated in remote locations and their schools were disperse. Half of the top 10 school boards were French-language boards (Public and Catholic). In contrast, the bottom 10 school boards in per-student funding had significantly higher enrolment (over 21,400 students), were in much less remote areas, and had schools with low levels of dispersion. All of the bottom 10 boards were English-language (Public and Catholic).
Enrolment and Base Funding
Although most of the overall GSN funding is allocated to school boards equally on a per-student basis, several GSN grants include fixed or minimum base funding amounts for every school board. The result is that smaller school boards receive more GSN funding on a per-student basis. Of the top 10 school boards with the highest per-student funding in 2021-22, all were considered ‘small’ school boards.[31] Conversely, of the 10 school boards with the lowest per-student funding, nine were considered ‘large’ school boards and one was a ‘medium-sized’ school board.
Figure 4.4 School board size and per-student GSN funding, 2021-22 school year
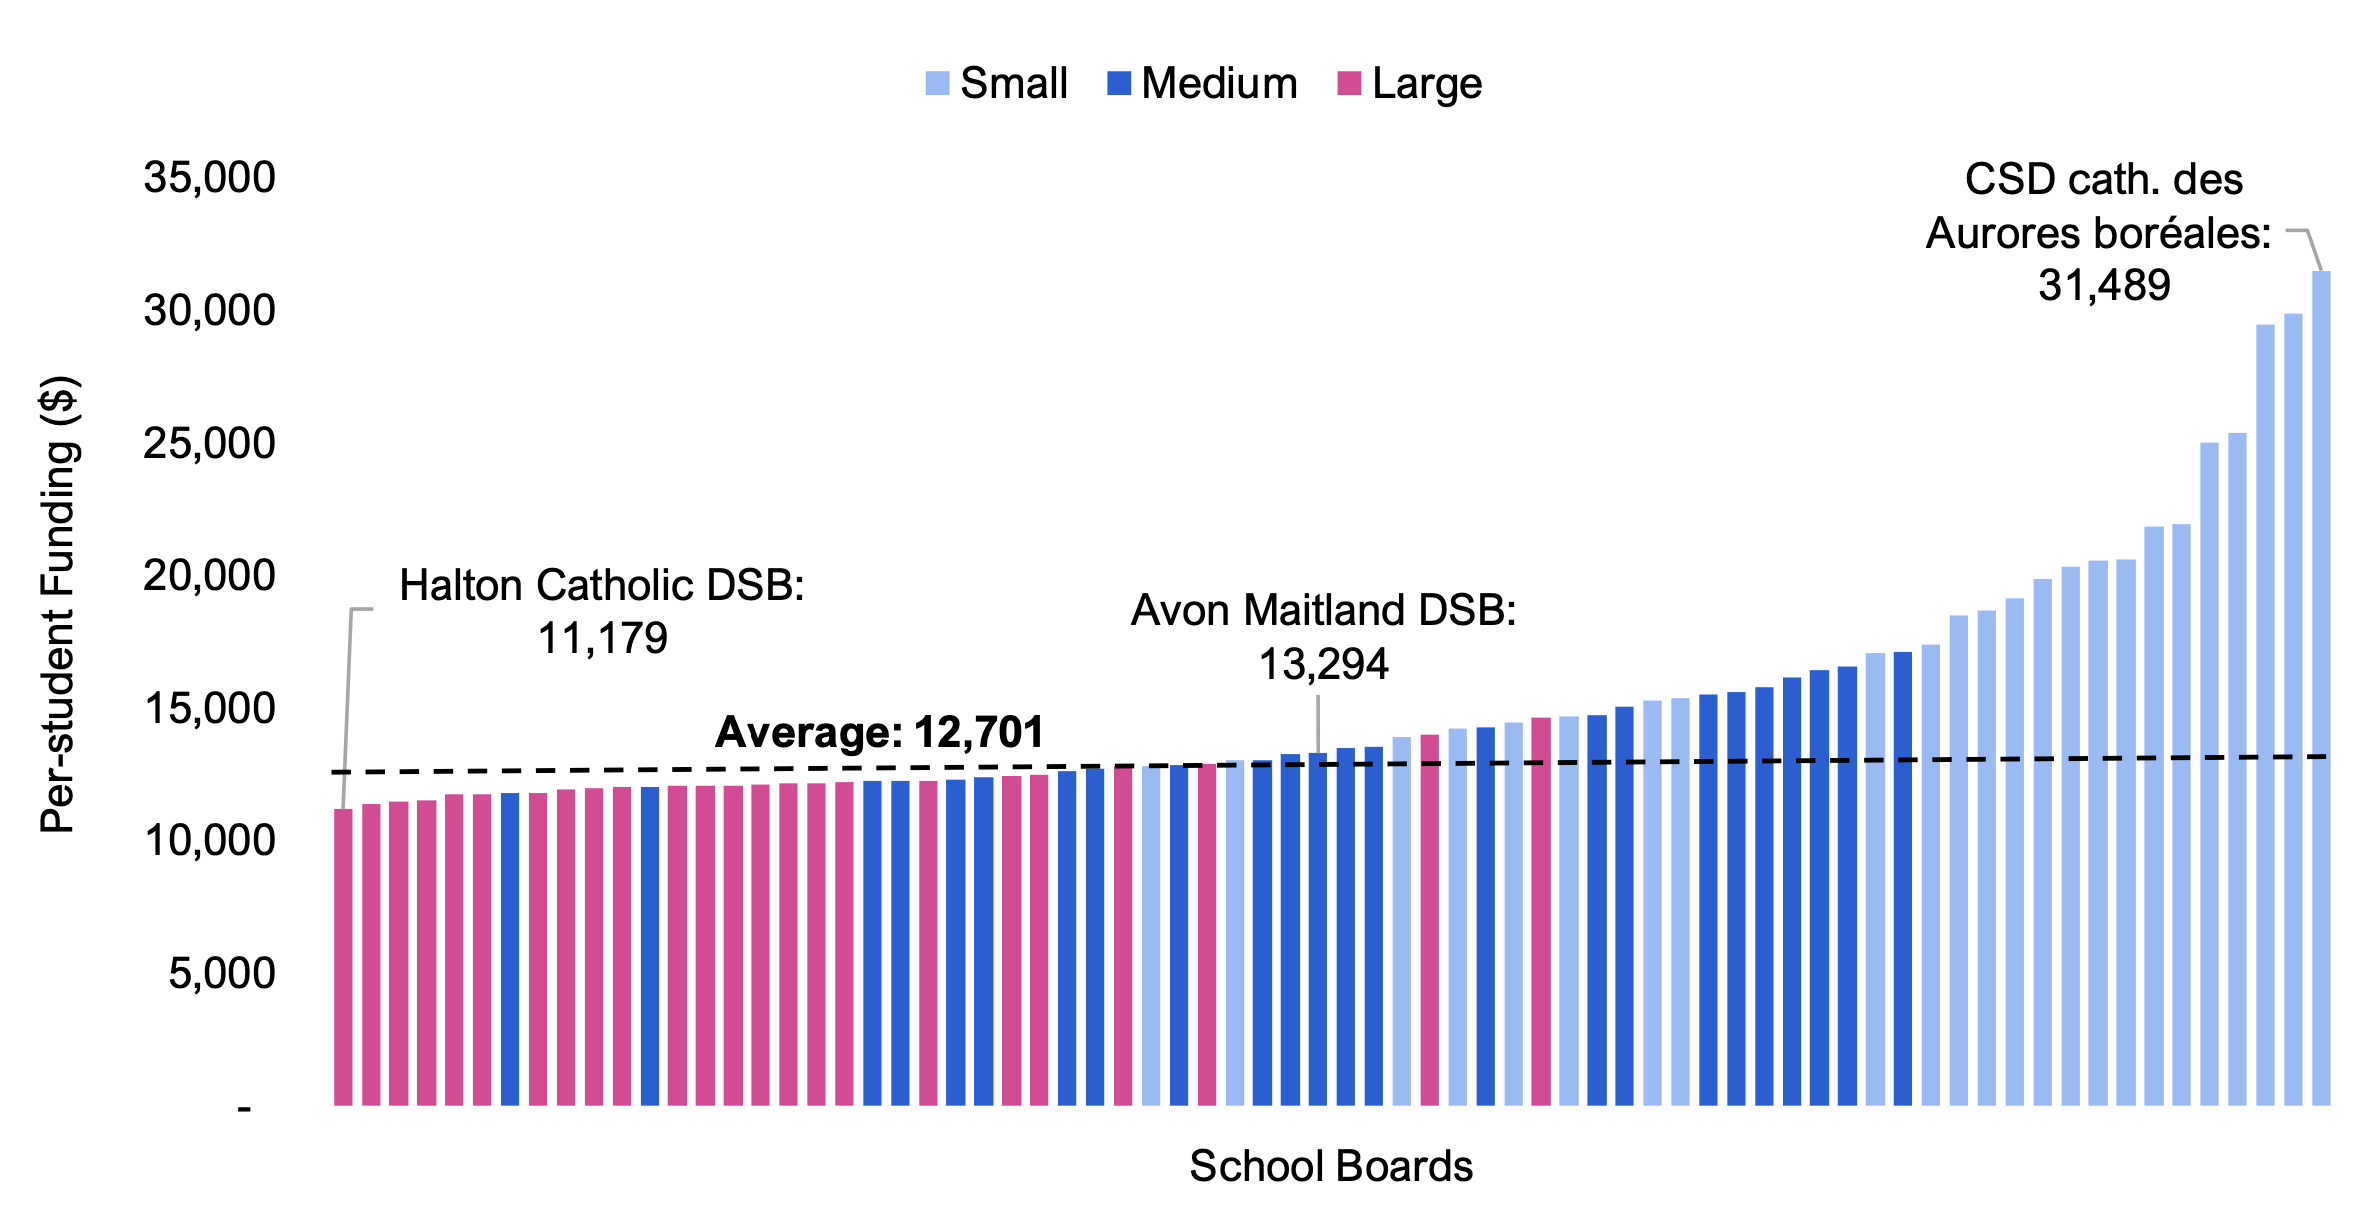
Note: Small school boards refer to the 24 school boards with the lowest enrolment (less than 8,895 students), medium-sized school boards refer to the 24 school boards with enrolment between 8,895 and 22,502 students and large school boards refer to the 24 school boards with the highest enrolment (greater than 22,502 students).
Source: FAO analysis of information provided by the Province.
On average, the English school systems have higher enrolment than the French school systems. In 2021-22, the average school board size of the English Public school system was 42,965 students and the English Catholic school system was 19,129 students. This compares to the French Catholic and French Public school systems’ average school board sizes of 9,563 students and 8,647 students, respectively. As a result, GSN grants with a fixed base funding amount provide smaller French-language school systems with more funding on a per-student basis.
Dispersion[32]
Dispersion refers to a weighted average of the distance, in kilometres, between schools within a school board, as well as the distance between a school board’s central office and each of its schools.[33] Higher dispersion reflects a greater average distance between a school board’s schools, and between its central office and its schools. School boards that are more disperse receive additional funding through several GSN grants, including the Geographic Circumstances Grant.
Of the 10 school boards with the highest per-student funding, all had ‘high dispersion’ (greater than 24.5 kilometres). For the 10 school boards with the lowest per-student funding, nine had low dispersion (less than 10.4 kilometres) and one had medium dispersion (between 10.4 kilometres and 24.5 kilometres).
Figure 4.5 School board dispersion and per-student GSN funding, 2021-22 school year
Note: Dispersion refers to a weighted average of the distance, in kilometres, between schools within a school board, as well as the distance between a school board’s central office and each of its schools. Low dispersion refers to the 24 school boards with the lowest dispersion (less than 10.4 kilometres), medium dispersion refers to the 24 school boards with dispersion between 10.4 kilometres and 24.5 kilometres, and high dispersion refers to the 24 school boards with the highest dispersion (greater than 24.5 kilometres).
Source: FAO analysis of information provided by the Province.
There are significant variances in dispersion levels by school system. The English Public school system and the English Catholic school system had an average dispersion of 8.8 kilometres and 9.9 kilometres, respectively. The French-language school systems had significantly higher dispersion of 45.1 kilometres for the French Public system and 32.1 kilometres for the French Catholic system. Therefore, the French-language school systems received higher funding through the GSN sub-grants that consider dispersion, such as the Geographic Circumstances Grant.
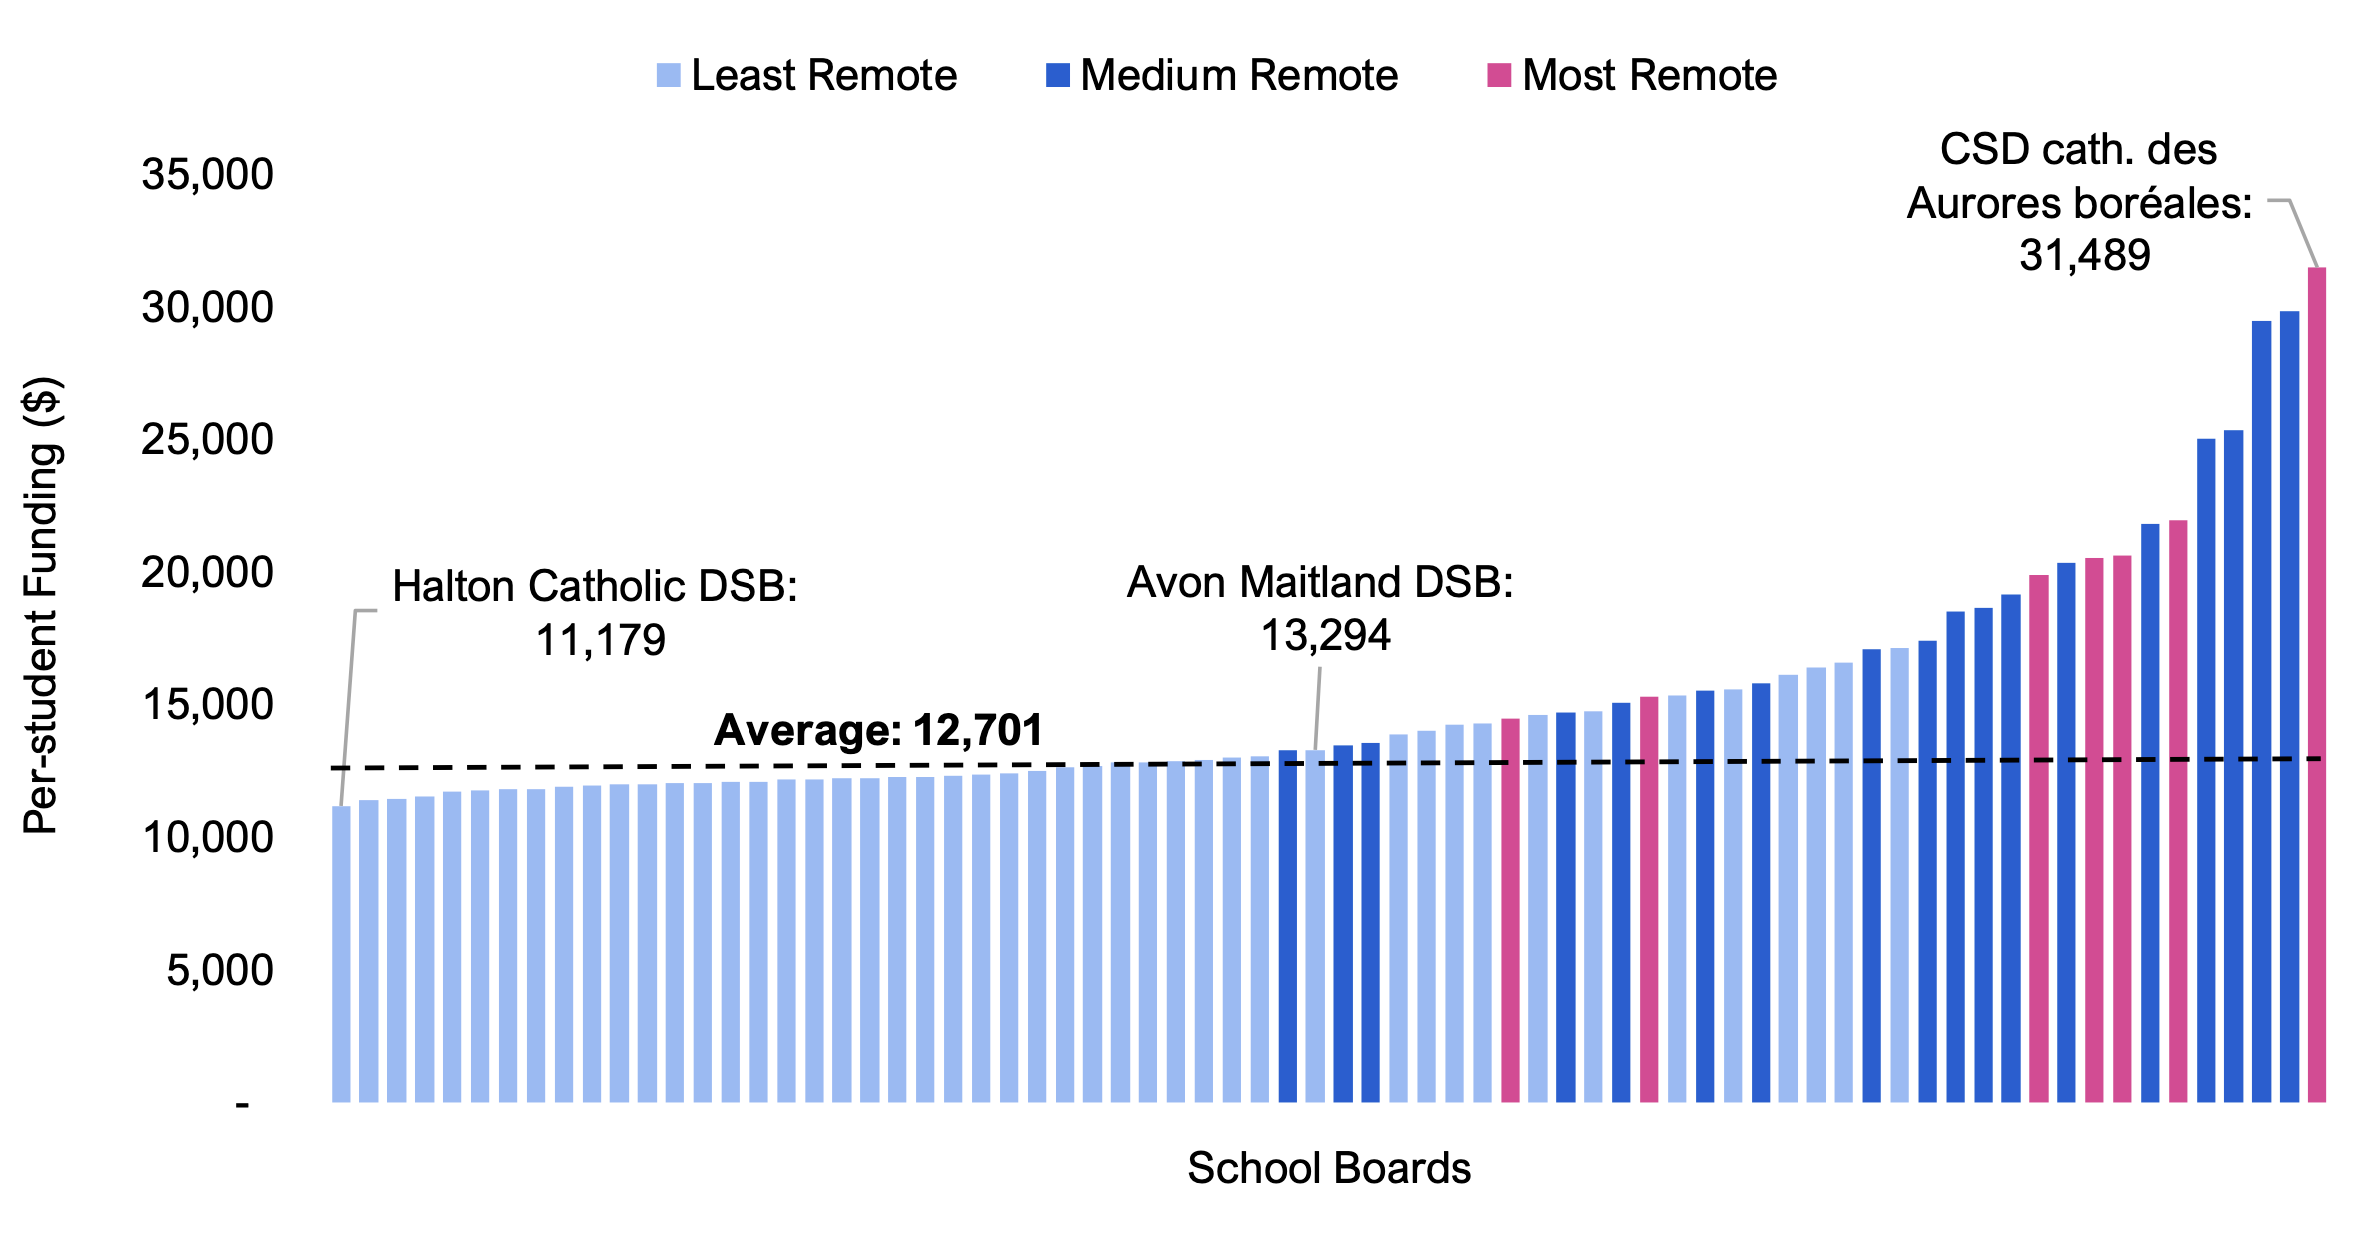
Remoteness and Urban Factor
Remoteness and urban factor are also used to determine school board funding allocations under the GSN. For the GSN funding formula, the Ministry of Education defines remoteness as the distance from a school board’s central office to the nearest major city with a population of at least 200,000. The Province allocates additional funding on a per-student basis to school boards with central offices that are at least 151 kilometres away from a major city, with school boards with central offices that are over 1,150 kilometres away from a major city receiving the most funding. Of the 10 school boards with the highest per-student GSN funding levels, six were ‘medium remote’ (between 151 kilometres and 1,150 kilometres away from a major city) and four were among the ‘most remote’ (greater than 1,150 kilometres away from a major city). Of the 10 school boards with the lowest per-student GSN funding, all were among the ‘least’ remote, with a distance of less than 151 kilometres away from a major city.
Figure 4.6 School board remoteness and per-student GSN funding, 2021-22 school year
Note: Least remote refers to school boards with central offices that are less than 151 kilometres from a major city (i.e., a city with a population of at least 200,000), medium remote refers to school boards with central offices that are between 151 kilometres and 1,150 kilometres from a major city, and most remote refers to school boards with central offices that are greater than 1,150 kilometres away from a major city.
Source: FAO analysis of information provided by the Province.
The Ministry of Education also assigns each school board an ‘urban factor’, ranging from zero (most urban) to one (most rural). A school board’s urban factor is determined by the average population size of each school’s census subdivision.[34] Of the Province’s 72 school boards, the FAO classified six as urban, 21 as ‘leans urban’, 35 as ’leans rural’ and 10 as rural. Six of the 10 rural school boards are located in northern Ontario, while all of the Province’s six urban school boards are located in southern or eastern Ontario, either in the GTHA or Ottawa.[35]
Of the 10 school boards with the highest per-student GSN funding levels, five were rural, four were ‘leans rural’ and one was ‘leans urban’. Of the 10 school boards with the lowest per-student GSN funding levels, eight were ‘leans urban’ and two were ‘leans rural’.
Figure 4.7 School board urban factor and per-student GSN funding, 2021-22 school year
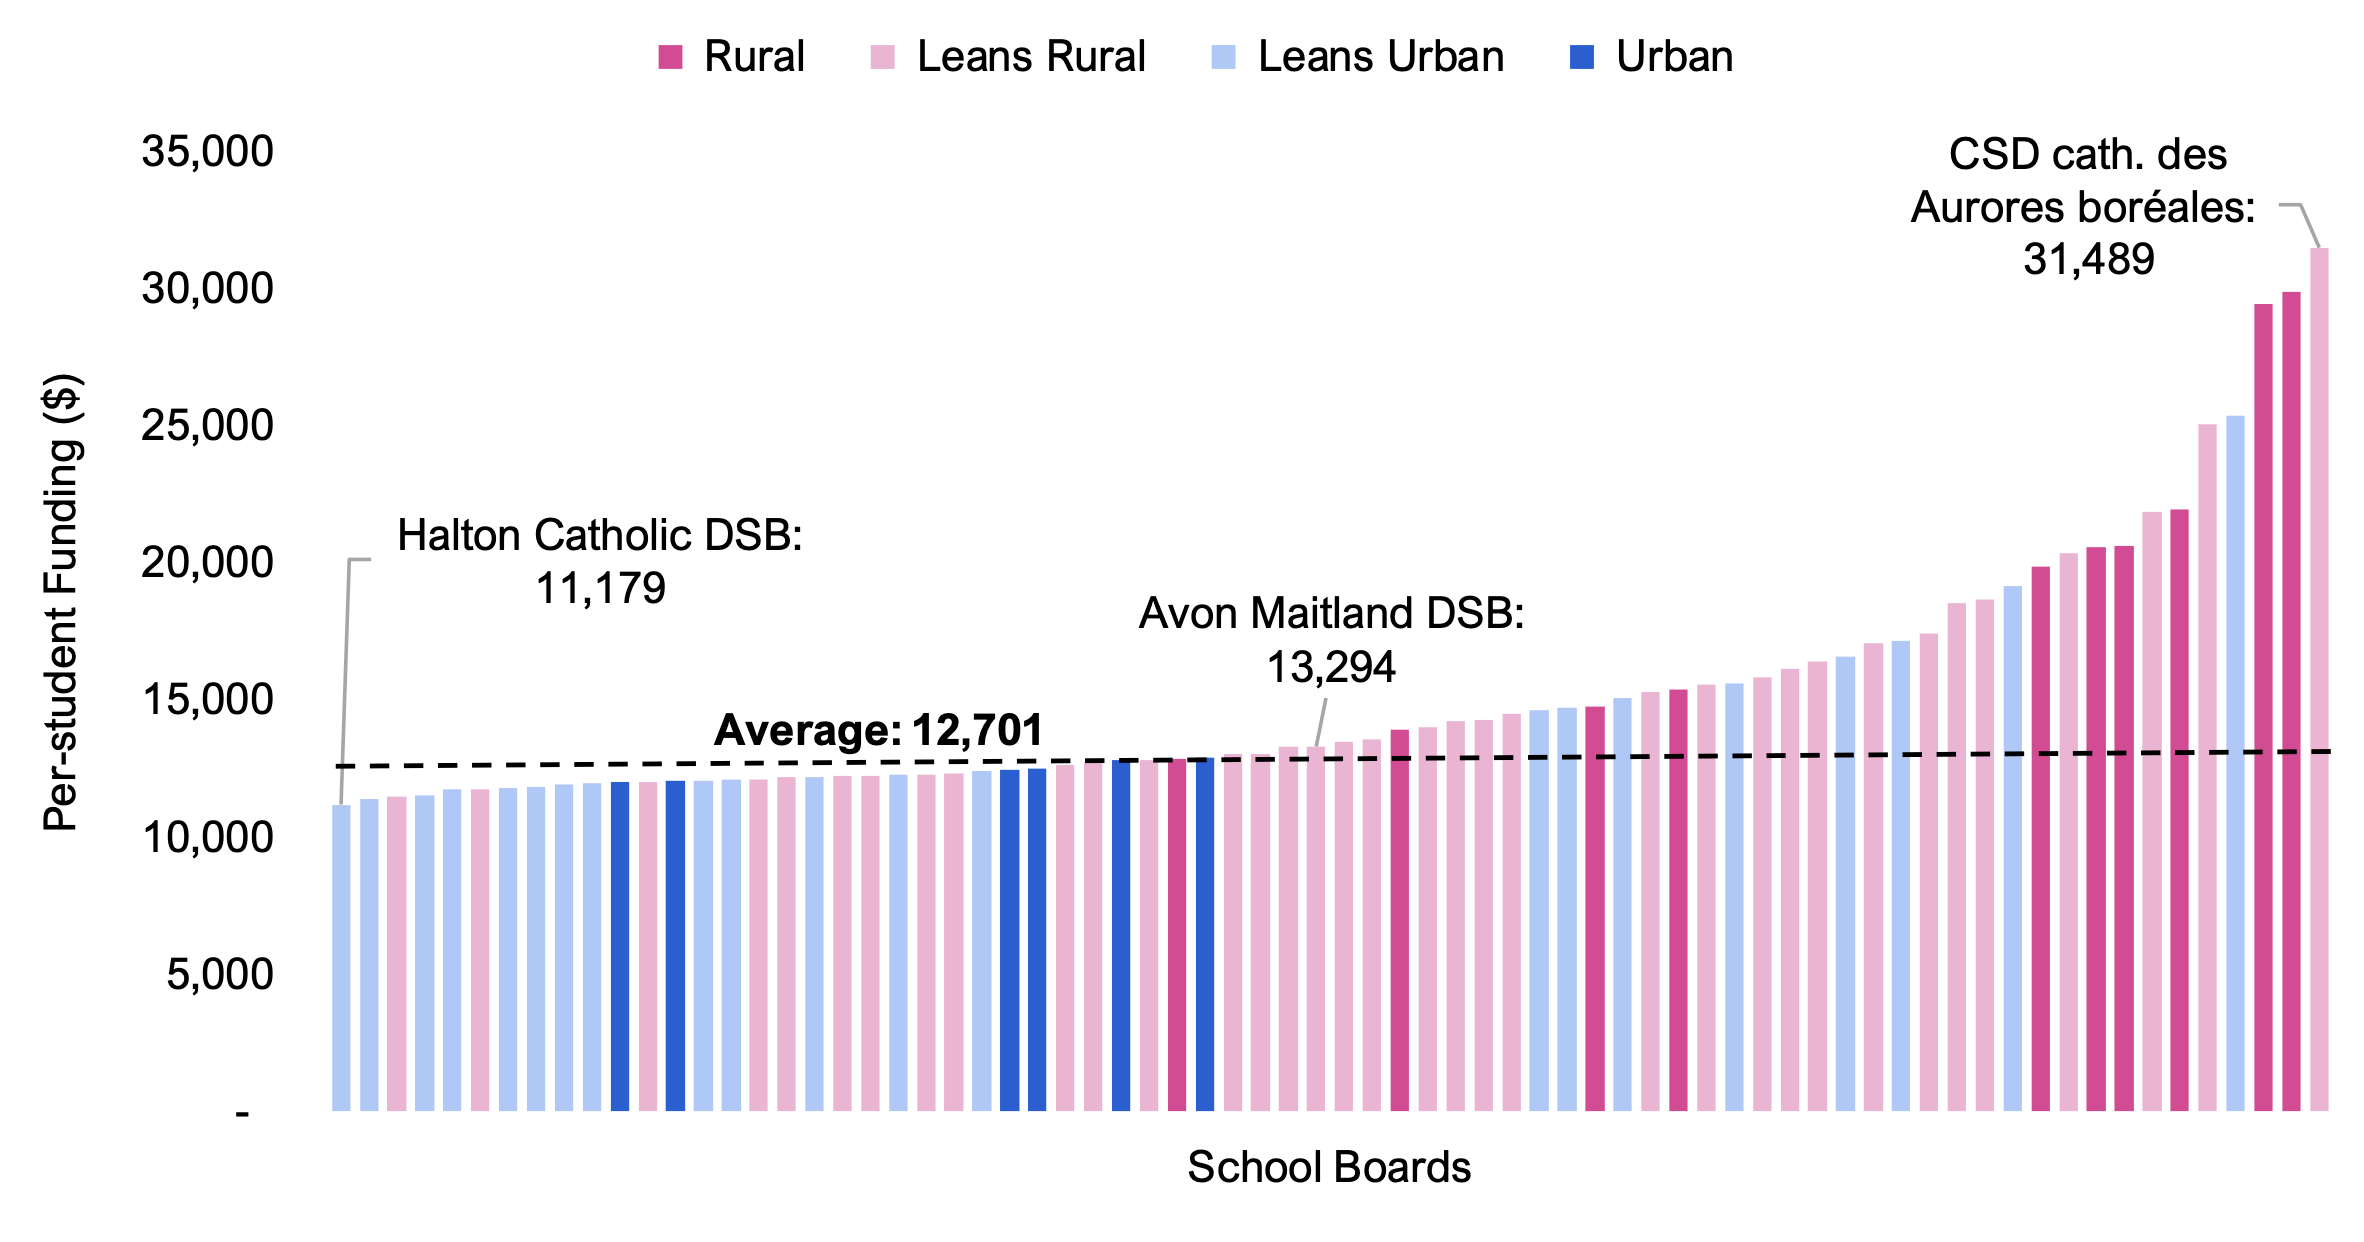
Note: The Ministry of Education assigns each school board an “Urban Factor” ranging from zero (most urban) to one (most rural) that is calculated based on the average population of its schools’ census subdivisions (CSDs), weighted by enrolment. Schools in a CSD with less than 25,000 people receive a score of one, schools in a CSD with 200,000 or more people receive a score of zero, and schools in CSDs with between 25,000 and 199,999 people receive a score between zero and one. The FAO defines ‘urban’ as an urban factor of zero, ‘leans urban’ as an urban factor greater than zero and less than or equal to 0.5, ‘leans rural’ as an urban factor greater than 0.5 and less than one, and ‘rural’ as an urban factor of one
Source: FAO analysis of information provided by the Province.
On average, English-language school systems tend to be less remote than French-language systems. In the English Public school system and the English Catholic school system, 6.7 per cent and 6.6 per cent of students, respectively, were in school boards located more than 151 kilometres from a major city compared to 13.5 per cent of students in French Public school boards and 19.4 per cent of students in French Catholic school boards. The result is that school boards within the French-language school systems, on average, received more per-student funding through some GSN grants, such as the Geographic Circumstances Grant, because, on average, they are more remote.
The French Catholic school system is also the most rural, with 37.5 per cent of students attending school in ‘leans rural’ school boards, and the remaining 62.5 per cent of students attending students in ‘leans urban’ school boards. Conversely, the French Public school system is the least rural, with 5.9 per cent of students attending school in ‘leans rural’ school boards and the remaining 94.1 per cent of students attending school in ‘leans urban’ school boards. The English Public school system had a combined one-third of students in either ‘leans rural’ (30.8 per cent) or rural (2.5 per cent) school boards, and the remaining two-thirds of students in either ‘leans urban’ (40.1 per cent) or urban (26.6 per cent) school boards. Finally, the English Catholic system had approximately one-quarter of students in either ‘leans rural’ (23.4 per cent) or rural (2.2 per cent) school boards, and the remaining nearly three-quarters of students in ‘leans urban’ (45.9 per cent) or urban school boards (28.5 per cent). The result is that school boards within the French Catholic system, which comprises eight of the Province’s 12 French-language school boards, received additional per-student funding because they are more rural.
| School System | Urban | Leans Urban | Leans Rural | Rural |
|---|---|---|---|---|
| English Public | 26.6 | 40.1 | 30.8 | 2.5 |
| English Catholic | 28.5 | 45.9 | 23.4 | 2.2 |
| French Public | - | 94.1 | 5.9 | - |
| French Catholic | - | 62.5 | 37.5 | - |
| Average | 25.6 | 43.5 | 28.6 | 2.3 |
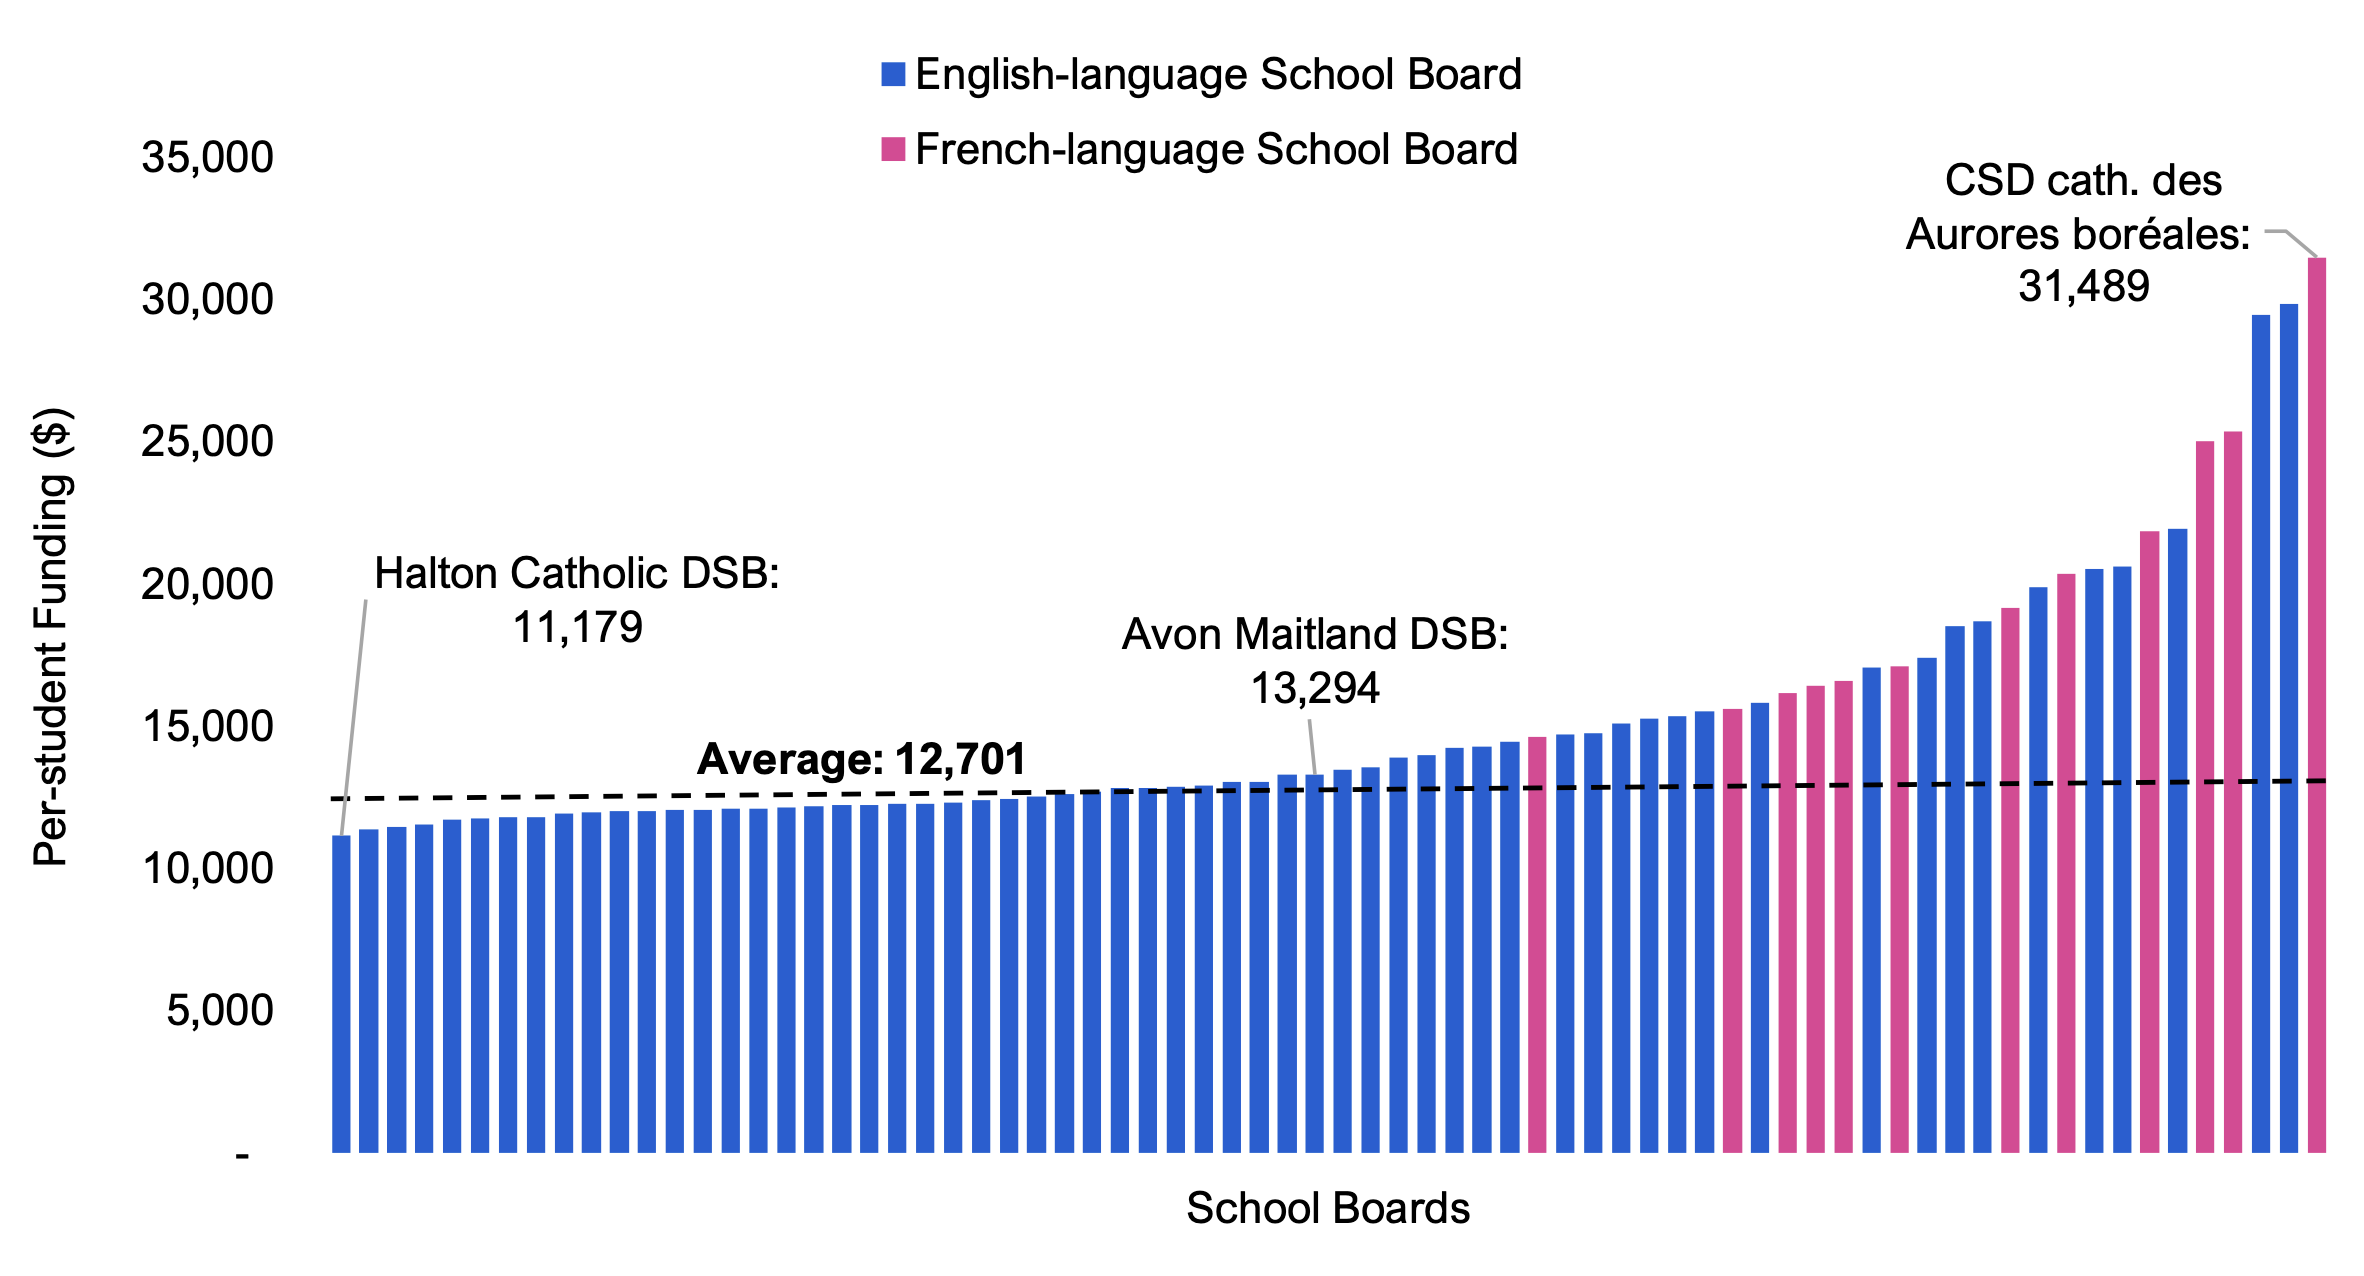
French-language Instruction
As noted above, the GSN’s Language Grant provides funding to English-language school boards for the ‘English as a Second Language’ and ‘French as a Second Language’ programs. The Language Grant also provides funding to French-language school boards for the ‘French as a First Language’, ‘Actualisation linguistique en francais’ and ‘Programme d’appui aux nouveaux arrivants’ programs. The FAO estimates that, on a per-student basis, the Language Grant provided an average of $354 in funding per student to English-language school boards and $2,043 per student in funding to French-language school boards. In addition, French-language school boards receive additional funding through the School Foundation Grant, the Special Education Grant and the Geographic Circumstances Grant. Overall, of the 10 school boards with the highest per-student funding, half were French-language boards and half were English-language boards. Of the 10 school boards with the lowest per-student funding, all were English-language boards.
Figure 4.8 Per-student GSN Language Grant funding by school board, 2021-22 school year
Source: FAO analysis of information provided by the Province.
Priorities and Partnership Fund (PPF)
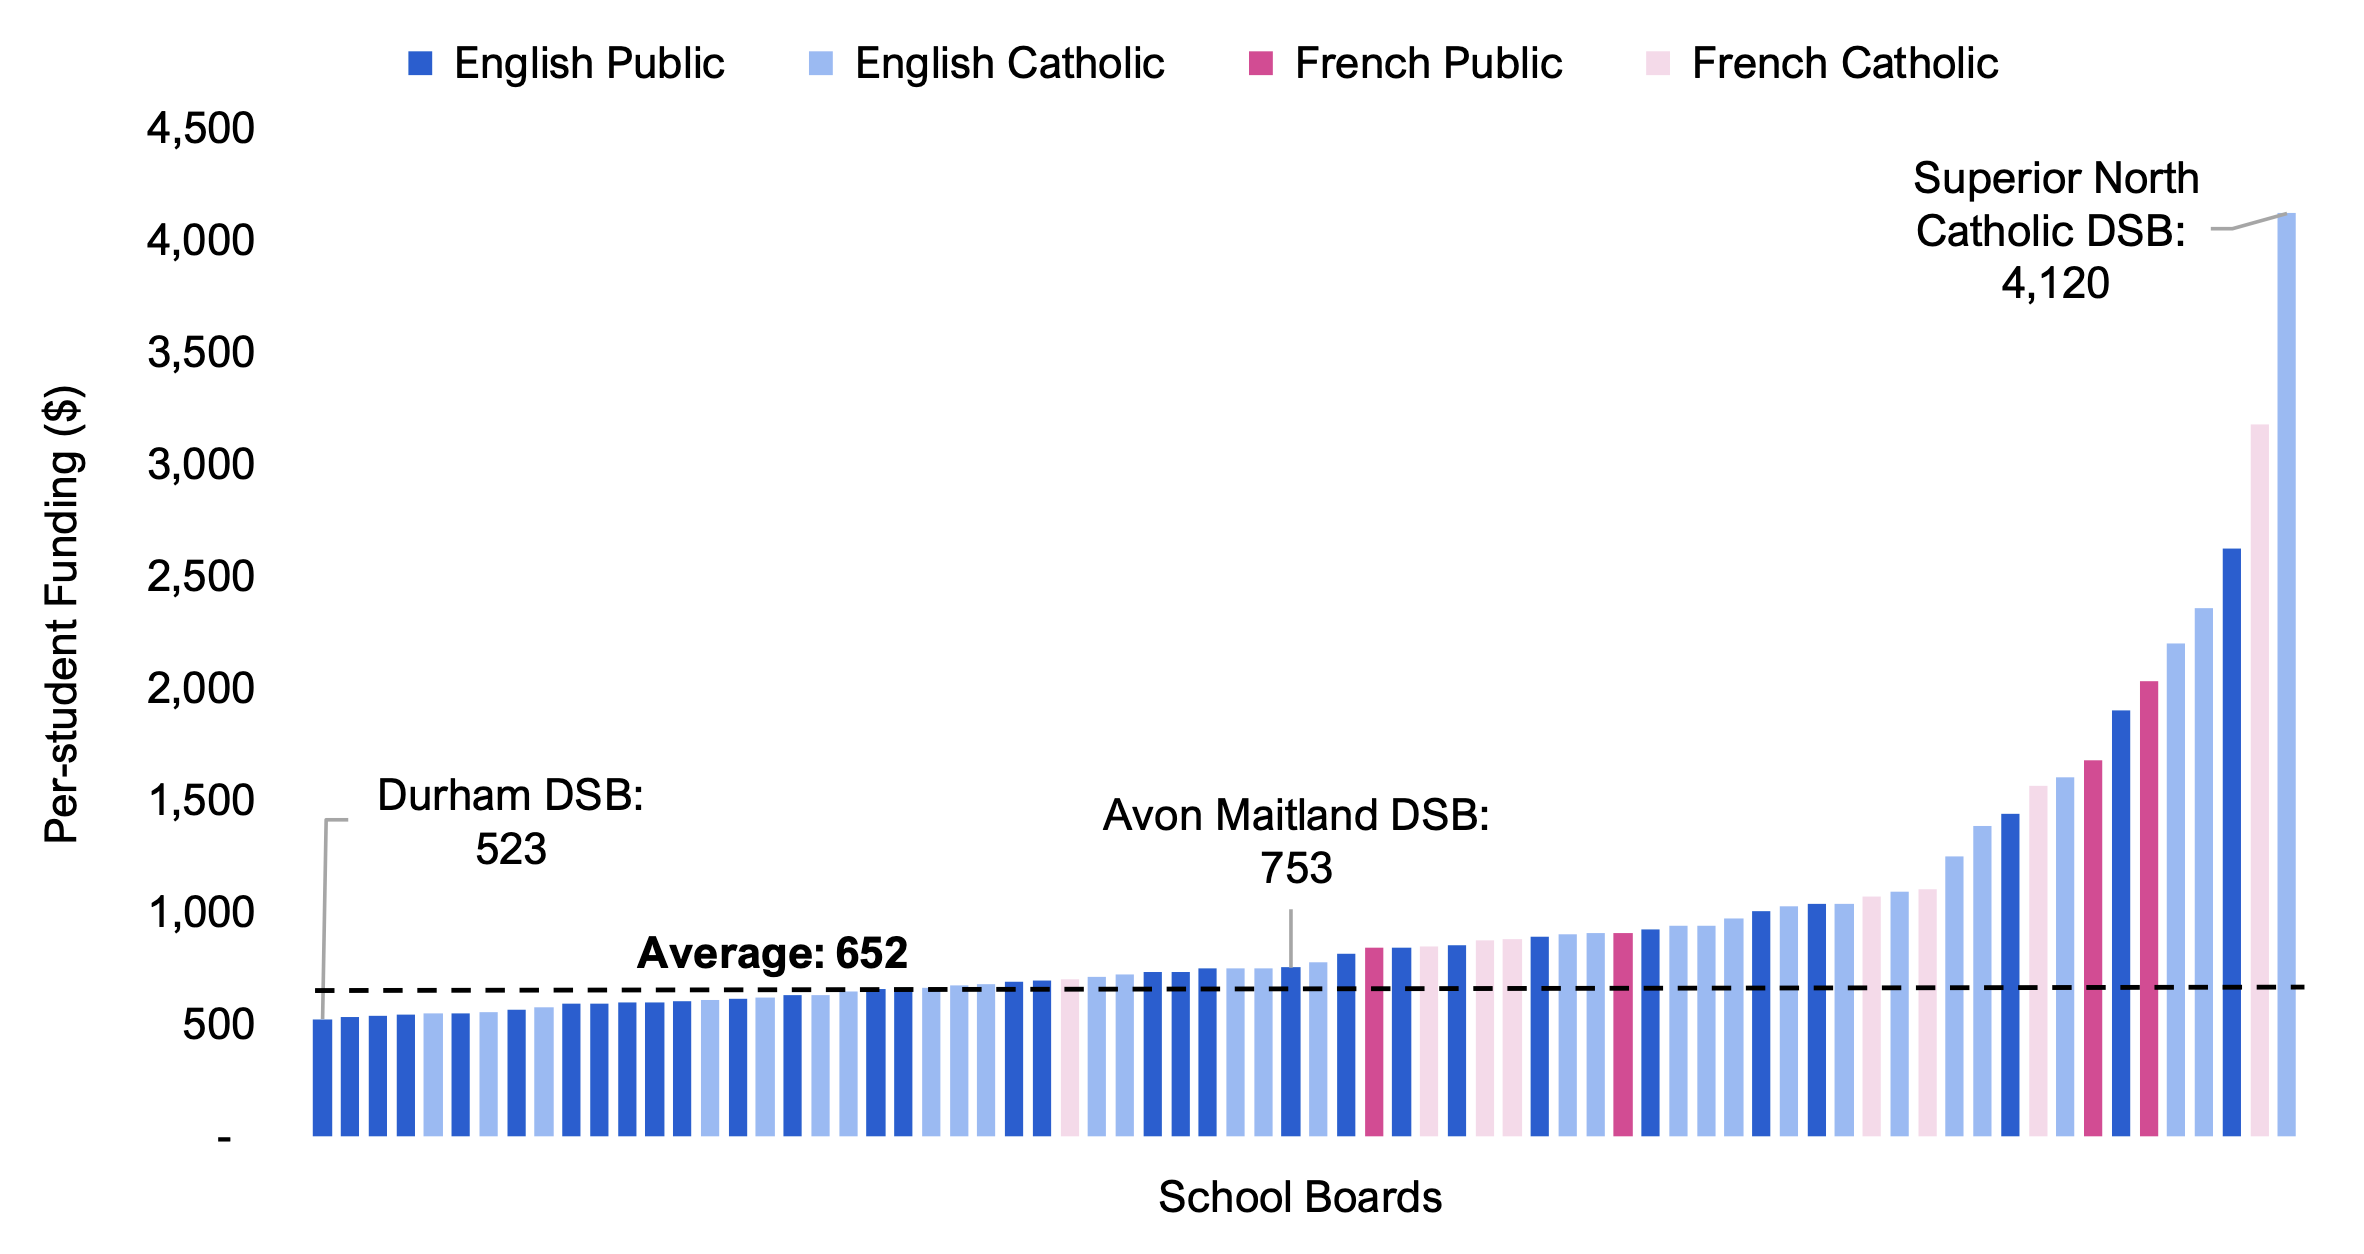
The Priorities and Partnership Fund (PPF) provides additional funding for specific government priorities such as tutoring, mental health supports, and anti-racism and equity initiatives. Overall, in 2021-22, the PPF provided $1.3 billion in funding or $652 per-student in funding. By school board, this ranged from $523 per-student for the Durham DSB to $4,120 per-student for the Superior-North Catholic DSB.
By school system, the French Public and French Catholic school boards received the highest average per-student PPF funding, at $1,001 and $890, respectively. In contrast, the English Catholic and English Public school systems received average per-student PPF funding of $687 and $615, respectively.
Figure 4.9 Priorities and Partnership Fund per-student funding, 2021-22 school year, dollars
Source: FAO analysis of information provided by the Province.
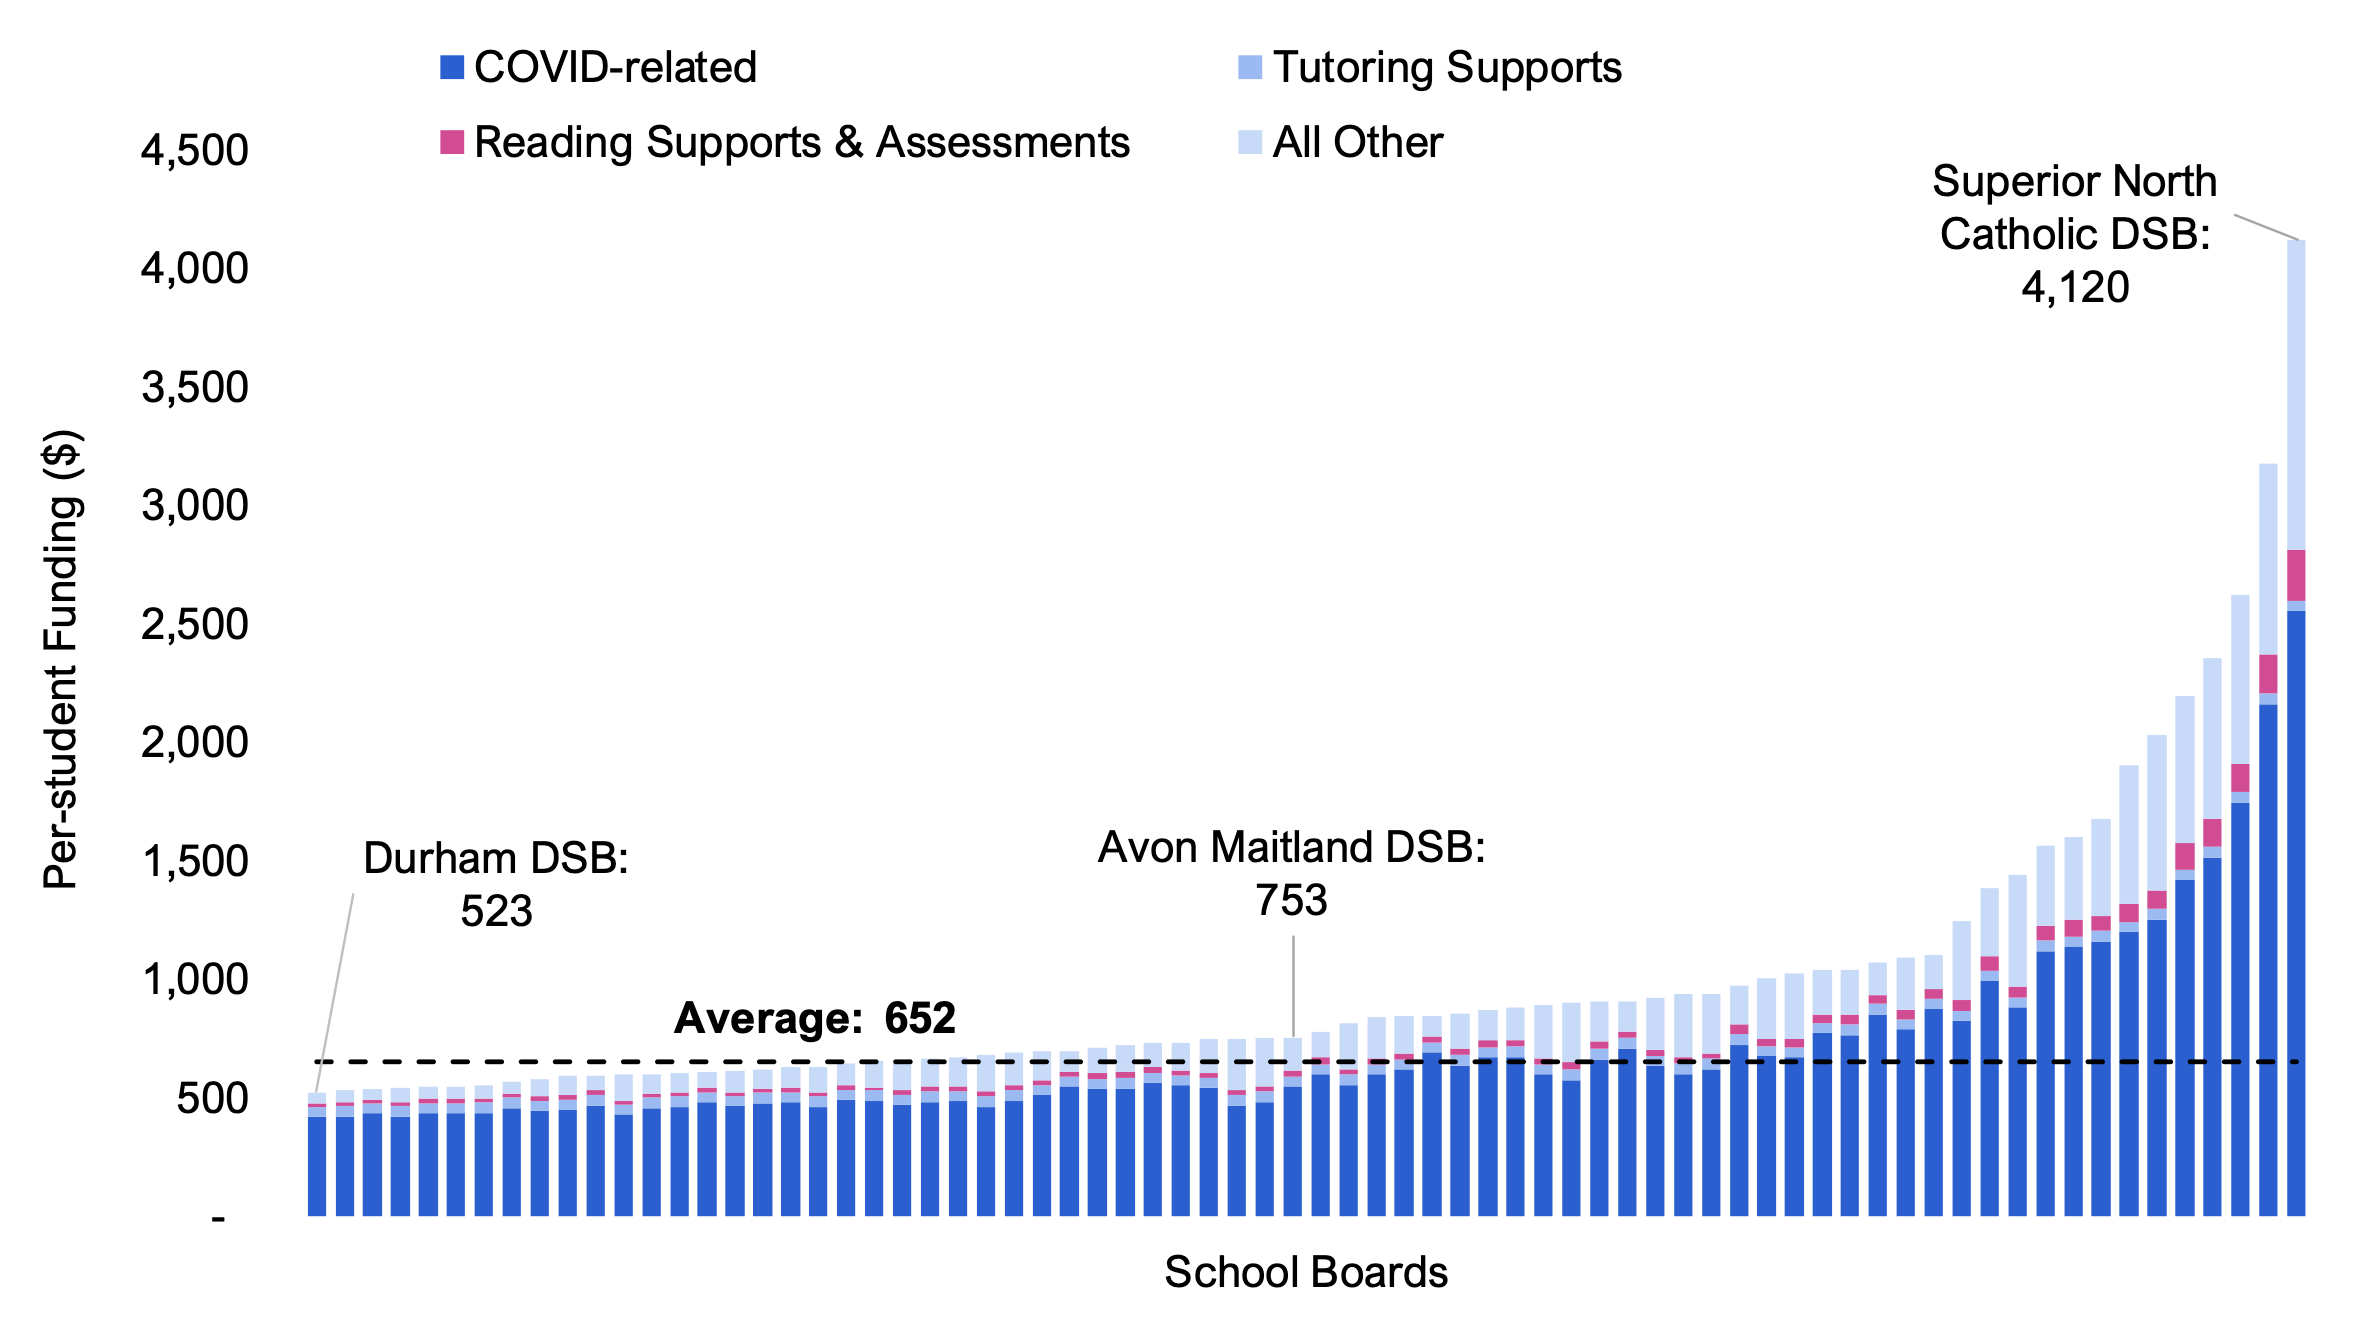
In the 2021-22 school year, the largest PPF allocation was for COVID-19-related support ($979 million), including stabilization funding, staffing support, transportation health and safety, ventilation in schools, mental health and other supports. The next largest sub-program within the PPF was the Tutoring Supports Program, which had an allocation of $88 million. Other PPF sub-programs included: Reading Supports and Assessments ($40 million), Math Strategy ($40 million), Connectivity at Schools Program ($39 million), Personal Support Worker (PSW) Student Financial Support ($31 million), Specialist High Skills Major (SHSM) Expansion ($12 million) and the Excellence in Administration Fund ($11 million). All other remaining sub-programs accounted for $64 million in funding to school boards.
Unlike with the GSN, there is no published funding formula or guidelines for the PPF’s school board allocations. However, funding is partially allocated based on school board enrolment.
| Sub-program | Total Allocation ($ million) | School Board PPF Per-student Funding Allocations | ||
|---|---|---|---|---|
| Average ($) | Lowest ($) | Highest ($) | ||
| COVID-19-related Funding | 979 | 490 | 419 | 2,555 |
| Tutoring Supports Program | 88 | 44 | 40 | 48 |
| Reading Supports and Assessments | 40 | 20 | 11 | 212 |
| Math Strategy | 40 | 20 | 7 | 331 |
| Connectivity at Schools Program | 39 | 19 | 0 | 325 |
| Personal Support Worker (PSW) Student Financial Support | 31 | 15 | 0 | 158 |
| Specialist High Skills Major (SHSM) Expansion | 12 | 6 | 0 | 73 |
| Excellence in Education Administration Fund | 11 | 5 | 0 | 246 |
| Other Sub-programs | 64 | 32 | 15 | 408 |
| Total | 1,303 | 652 | 523 | 4,210 |
The school boards that received the largest per-student PPF funding allocations in 2021-22 include Superior North Catholic DSB ($4,120), CSD catholique des Aurores boréales ($3,175), Superior-Greenstone DSB ($2,623), Northwest Catholic DSB ($2,356) and Kenora Catholic DSB ($2,198). These school boards are all remote boards with low enrolment and high dispersion. All these boards were also within the “Top 10 School Boards” for GSN per-student funding.
The school boards that received the smallest per-student PPF allocations include the Durham DSB ($523), the Halton DSB ($530), the Peel DSB ($539), the York Region DSB ($541) and the Halton Catholic DSB ($546). These school boards are all English-language, urban boards with high enrolment and low dispersion. All these boards were also within the “Bottom 10 School Boards” for GSN per-student funding.
Figure 4.10 Priorities and Partnership Fund per-student allocations, 2021-22 school year, dollars
Source: FAO analysis of information provided by the Province.
Official Languages Projects Program
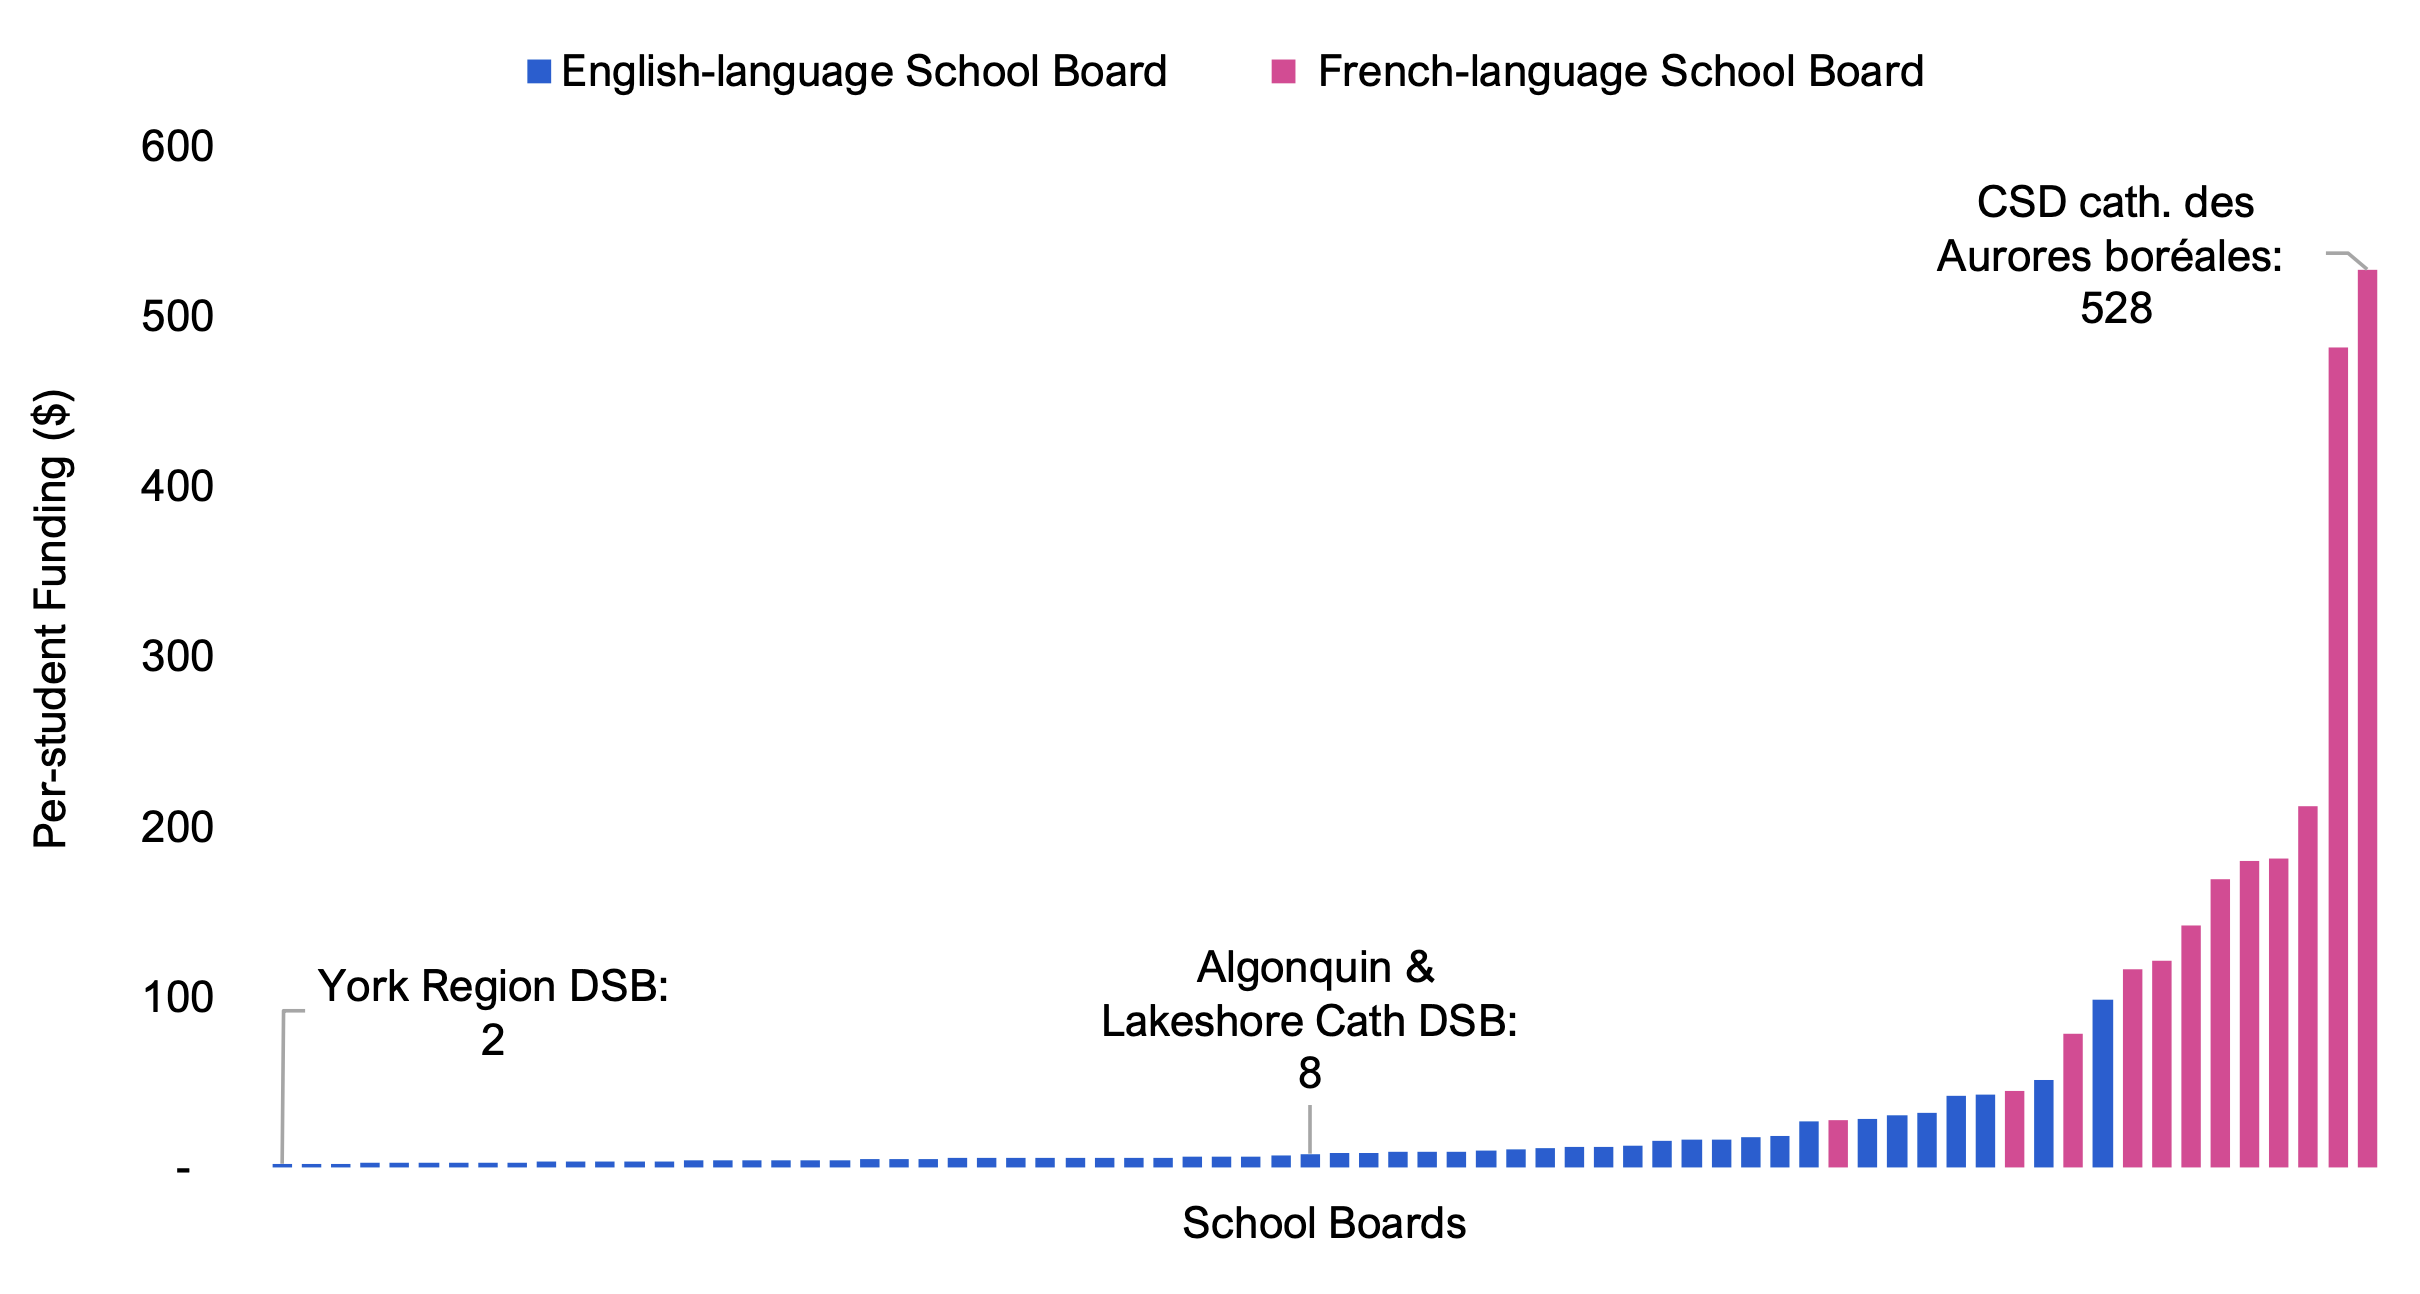
The Official Languages Projects (OLP) program provides funding for French-language education in Ontario. This program is designed and administered by the Province but funded by the federal government. In 2021-22, the OLP program provided an average of $11 per student in funding. On average, English-language school boards received $4 per student and French-language school boards received $130 per student. By school board, funding ranged from $2 per student for the York Region DSB, Toronto DSB and Peel DSB, to $528 per student for CSD catholique des Aurores boréales.
Figure 4.11 Official Languages Projects program per-student funding, 2021-22 school year, dollars
Source: 2021-22 school board financial statements and FAO analysis of information provided by the Province.
5. Total School Board Revenue
In the 2021-22 school year, Ontario school boards recorded $29.0 billion in revenue, which included operating funding provided by the Province (as discussed in Chapter 4) and revenue from other sources. The largest revenue source was provincial operating and own source operating revenue, which accounted for $27.3 billion (94.1 per cent) in revenue in 2021-22, followed by revenue for infrastructure projects ($1.6 billion or 5.4 per cent) and federal operating transfers ($0.2 billion or 0.5 per cent).
Provincial operating and own source operating revenue is funded by provincial grants, primarily the Grants for Student Needs (GSN) and the Priorities and Partnership Fund, as well as from school boards’ own revenue sources, such as fundraising, investments and international student fees.
Revenue for infrastructure projects[36] is funded largely through the Province’s School Board Capital Grants program, as well as through the School Renewal Allocation within the GSN. There are two main sub-programs within the School Board Capital Grants program: the Capital Priorities program and the School Condition Improvement (SCI) program. The Capital Priorities program funds the building of new schools and the expansion of existing schools to address increasing enrolment and to replace schools in poor condition. The SCI program funds school renewal and rehabilitation, such as repairs to foundations, roofs and windows, plumbing, and heating and cooling systems. The School Renewal Allocation within the GSN similarly funds school renewal, including building maintenance, replacing HVAC systems and increasing building accessibility.
In addition to the Province’s capital programs, in 2021-22, the Province and federal government jointly funded the time-limited Investing in Canada Infrastructure Program (ICIP), which primarily supported projects to improve air quality in schools.
Finally, federal operating transfer revenue reflects payments made by the federal government to support Indigenous students and various other programs.
Revenue by School System and School Board
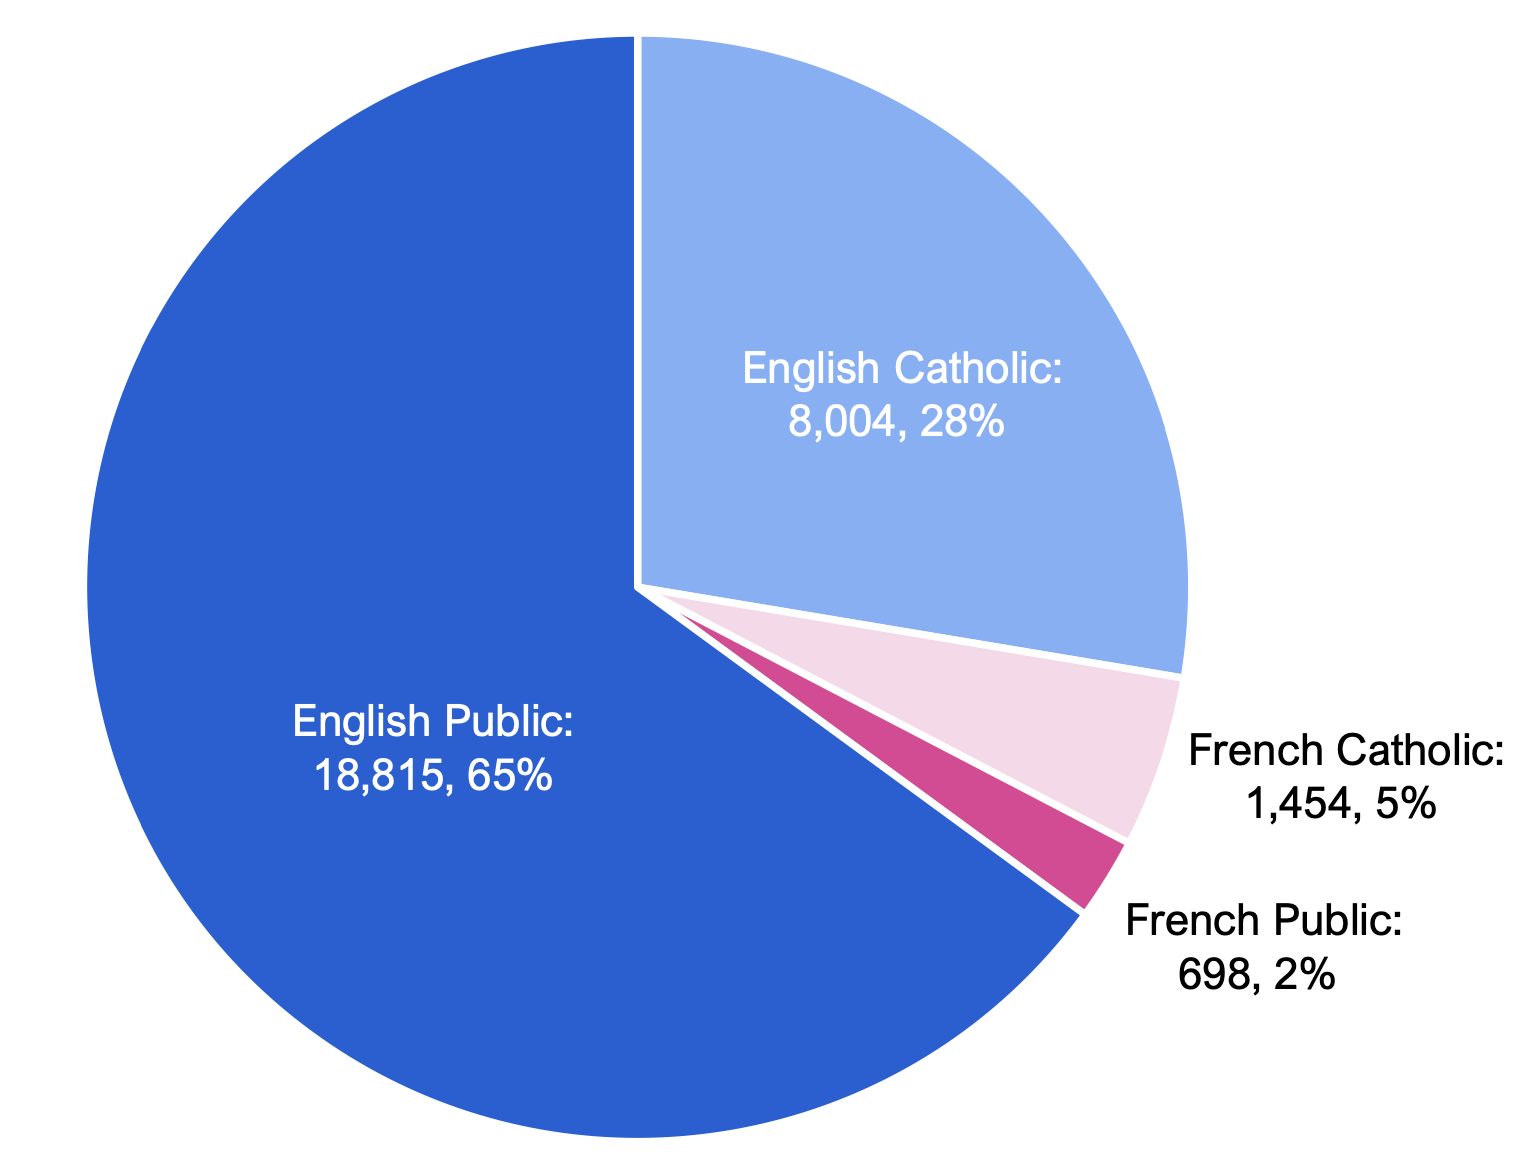
Of the $29.0 billion in total school board revenue, English Public school boards accounted for $18.8 billion (64.9 per cent), followed by English Catholic school boards at $8.0 billion (27.6 per cent). French Catholic and French Public school boards had significantly lower total revenue at $1.5 billion (5.0 per cent) and $0.7 billion (2.4 per cent), respectively.
Figure 5.1 School board revenue, by school system, 2021-22 school year, $ millions
Source: 2021-22 school board financial statements and FAO analysis of information provided by the Province.
On a per-student basis, school boards recorded an average of $14,501 in revenue per student in 2021-22. The English Public and English Catholic systems recorded $14,126 and $14,428, respectively, in revenue per student in 2021-22. French school systems recorded higher per-student revenue at $20,184 per student for the French Public system and $19,002 per-student for the French Catholic system.
Figure 5.2 School board revenue per student, by school system, 2021-22 school year, dollars
Source: 2021-22 school board financial statements and FAO analysis of information provided by the Province.
By school board, the amount of per-student revenue varied significantly, ranging from $12,766 per student (Durham DSB) to $41,880 per student (Superior-Greenstone DSB). The variation in per-student revenue is largely driven by provincial operating funding, which is determined by different school board characteristics (see discussion in Chapter 4) as well as school boards’ ability to generate their own revenue. Per-student revenue is also impacted by differences in revenue for infrastructure projects and from federal operating transfers.
For a breakdown of school board revenue by individual school board, visit the FAO’s website at: https://tinyurl.com/yh5xncud.
Figure 5.3 Revenue per student, by school board and source, 2021-22 school year, dollars
Source: 2021-22 school board financial statements and FAO analysis of information provided by the Province.
6. Total School Board Spending
The Ministry of Education sets the funding envelope for school boards based on its estimate for required spending on teachers, transportation, facilities, and other supplies and services. However, school boards have the flexibility to spend their funds differently based on local priorities.
In the 2021-22 school year, school boards spent $28.8 billion. The largest category of school board spending was teacher compensation, which totaled $13.8 billion. The next largest category was non-teacher instruction, which totaled $7.6 billion, followed by spending on pupil accommodation ($2.9 billion), infrastructure ($1.6 billion), transportation ($1.2 billion), administration ($0.7 billion) and other spending ($0.9 billion).
| Expense Category | Description | Spending ($ millions) | Share of Total (%) | Spending per-Student ($) |
|---|---|---|---|---|
| Teacher Compensation | Teacher salaries and benefits | 13,791 | 48 | 6,903 |
| Non-teacher Instruction | Education assistants, principals and other staff, supplies, computers, libraries and school offices | 7,635 | 26 | 3,822 |
| Pupil Accommodation | School operations, maintenance and other expenses | 2,911 | 10 | 1,457 |
| Infrastructure | Amortization of capital assets | 1,616 | 6 | 809 |
| Transportation | Spending related to the transportation of students to and from school | 1,195 | 4 | 598 |
| Administration | Spending on school board trustees and administration | 740 | 3 | 370 |
| Other Spending | Spending related to school-generated funds (largely for field trips, fundraising activities, student council, and student activities and clubs) and all other spending | 931 | 3 | 466 |
| Total Spending | 28,820 | 100 | 14,426 |
On a per-student basis, school boards spent an average of $14,426 per student in the 2021-22 school year. The category with the highest average per-student spending was teacher compensation ($6,903), followed by non-teacher instruction ($3,822), pupil accommodation ($1,457), infrastructure ($809), transportation ($598), other spending ($466) and administration ($370).
In the six years from 2015-16 to 2021-22, total school board per-student spending grew at an average annual rate of 2.3 per cent, compared to an average annual inflation rate of 2.5 per cent over this period. By category, infrastructure spending grew the fastest, at an average annual rate of 6.3 per cent. This was followed by transportation spending, which grew at 4.5 per cent annually, led by an 11.9 per cent increase in per-student transportation spending in 2021-22, a year of heightened fuel inflation.[37] Other spending increased at an average annual rate of 3.1 per cent, followed by non-teacher instruction spending at 2.6 per cent, administration at 1.9 per cent, teacher compensation at 1.8 per cent and pupil accommodation at 0.9 per cent.
Figure 6.1 Average annual growth in spending per student, by spending category, 2015-16 to 2021-22, per cent
Source: FAO analysis of information provided by the Province.
Spending by School System and School Board
Of the $28.8 billion in total school board spending, English Public school boards accounted for $18.7 billion (65.0 per cent), followed by English Catholic school boards at $8.0 billion (27.7 per cent). French Catholic and French Public school boards had significantly lower spending at $1.4 billion (5.0 per cent) and $0.7 billion (2.4 per cent), respectively.
Figure 6.2 Total spending by school system, 2021-22 school year, $ millions
Source: FAO analysis of information provided by the Province.
On a per-student basis, school boards recorded an average of $14,426 in spending per student in 2021-22. The English Public and English Catholic systems spent $14,059 and $14,376, respectively, per student in 2021-22. French school systems spent more per-student, at $19,969 per student for the French Public system and $18,675 per student for the French Catholic system.
Figure 6.3 Spending per student, by school system, 2021-22 school year, dollars
Source: FAO analysis of information provided by the Province.
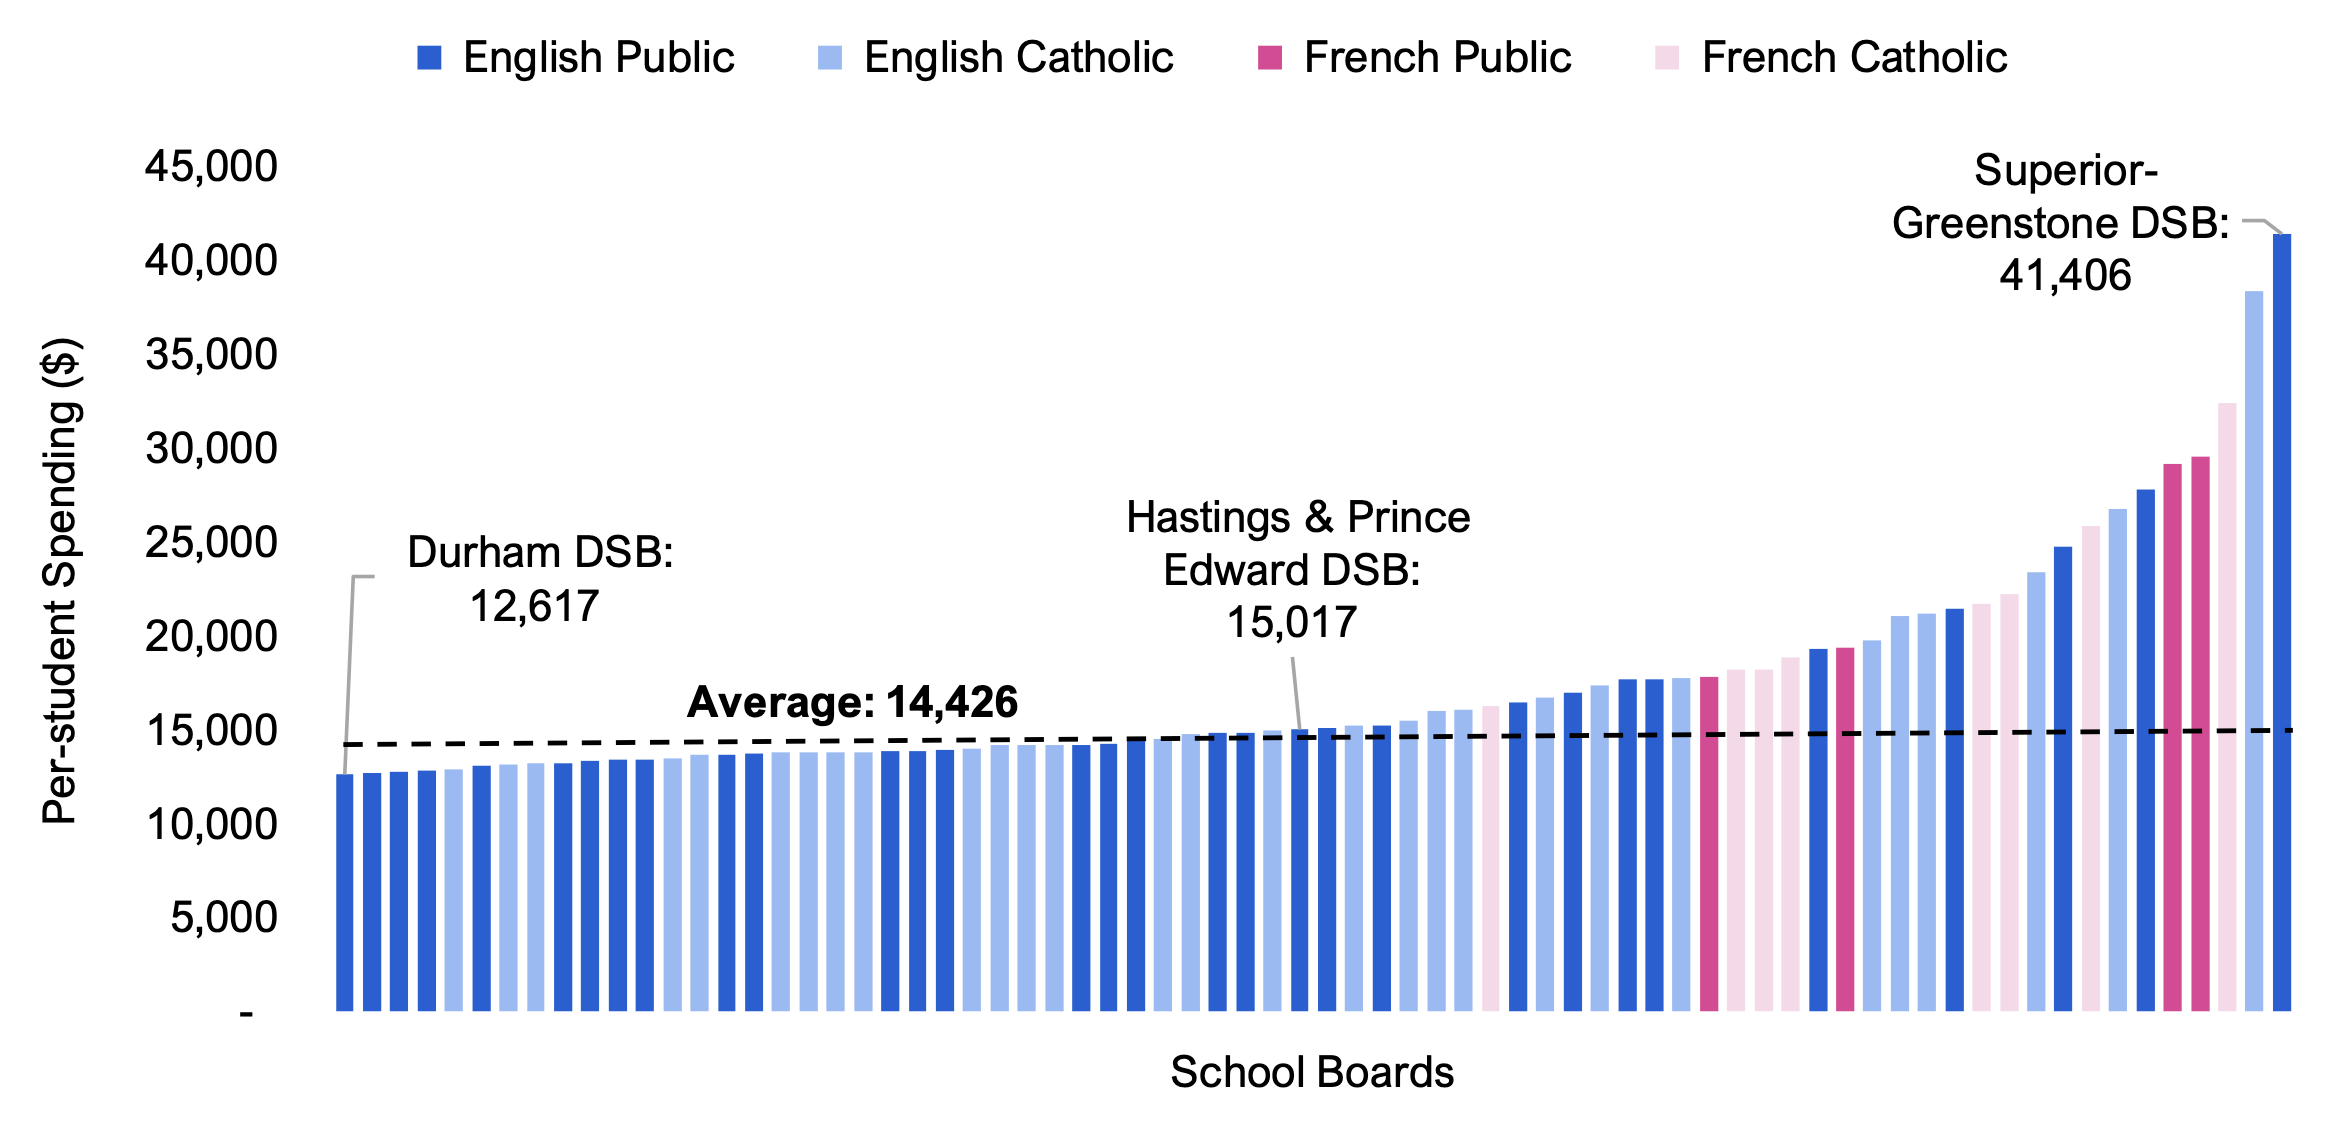
By school board, the amount of per-student spending varied significantly, ranging from $12,617 per student (Durham DSB) to $41,406 per student (Superior-Greenstone DSB).
For a breakdown of school board spending by individual school board, visit the FAO’s website at: https://tinyurl.com/yh5xncud.
Figure 6.4 Spending per student, by school board, 2021-22 school year, dollars
Source: FAO analysis of information provided by the Province.
School Board Spending by Enrolment
Generally, smaller school boards tend to have higher total spending per student compared to larger school boards.[38] In 2021-22, small school boards spent the most per student, with total spending of $19,886 per student. Medium-sized school boards spent less, with total spending of $15,365 per student in 2021-22. Large school boards spent the least per student, at $13,851 per student in 2021-22. Of the 12 French-language school boards, six are classified by the FAO as small, five are medium-sized and one is large, resulting in above-average per-student spending in French-language systems.
Figure 6.5 Spending per student, by school board size, 2021-22 school year, dollars
Note: Small school boards refer to the 24 school boards with the lowest enrolment (less than 8,895 students), medium-sized school boards refer to the 24 school boards with enrolment between 8,895 and 22,502 students, and large school boards refer to the 24 school boards with the highest enrolment (greater than 22,502 students).
Source: FAO analysis of information provided by the Province.
Across every spending category, small school boards spent more per student than medium-sized school boards, and medium-sized school boards spent more than large school boards.
- In 2021-22, the largest variance was for spending on non-teacher instruction. Small school boards spent an average of $5,756 per student on non-teacher instruction compared to $4,041 per student for medium-sized school boards and $3,646 per student for large school boards.
- Per-student spending on teacher compensation had the second largest variance. In 2021-22, small school boards spent an average of $7,893 per student, medium-sized school boards spent an average of $6,884 per student and large school boards spent an average of $6,845 per student.
- Small school boards spent, on average, $874 per student on administration in 2021-22, compared to $429 per student for medium-sized school boards and $324 per student for large school boards.
- Small school boards spent an average of $1,230 per student for transportation in 2021-22, compared to $1,051 per student for medium-sized school boards and $449 per-student for large school boards.
Overall, the higher per-student spending of smaller school boards compared to larger school boards reflects the ability of school boards with higher enrolment levels to spread fixed costs over a larger student population and therefore spend less per student overall. It also reflects that many of the smaller school boards are in locations that are remote, rural and disperse, and may face higher costs for providing student transportation, as well as supplies, equipment and services. Smaller school boards also have smaller average class sizes, which results in higher spending per student on teacher compensation.
Spending on Teacher Salaries
The Province funds teachers’ salaries primarily through two grants within the GSN: the Pupil Foundation Grant and the Cost Adjustment and Teacher Qualifications and Experience Grant. In 2021-22, school boards received equal base funding of $79,304 per teacher under the Pupil Foundation Grant. School boards also received additional funding through the Cost Adjustment and Teacher Qualifications and Experience Grant, which varies based on the educational qualifications and teaching experience of the teachers in each school board. In 2021-22, the average funded teacher salary was $94,912. The English Catholic and English Public school systems had the highest average funded teacher salaries, at $95,536 and $94,951, respectively. The French Catholic and French Public school systems had lower average funded salaries, at $92,529 and $90,193, respectively. The differences in average funded salaries between the English and French school systems suggest that, on average, teachers in the English school systems had higher qualifications or more seniority relative to the teachers in the French school systems.
Actual average teacher salaries are different from the funded average because each school board has its own salary grid that reflects regional differences in cost of living and the supply of teachers, in addition to differences in teacher qualifications and experience. In the 2021-22 school year, the average actual teacher salary was $91,755. The English-language school systems had higher average teacher salaries, with teachers in the English Public system receiving average salaries of $91,558, and teachers in the English Catholic system receiving average salaries of $92,670. Teachers in the French Catholic and French Public systems received average salaries of $90,951 and $87,385, respectively. This indicates that, on average, school boards are using a portion of funds notionally provided by the Province to support teacher salaries for other purposes.
Figure 6.6 Average funded and actual teacher salaries, by school system, 2021-22 school year, dollars
Source: FAO analysis of information provided by the Province.
Across all school systems, small school boards, which are typically more remote, had the highest average actual salaries, while medium-sized and large school boards had the lowest average actual salaries. Overall, small school boards had an average actual salary of $93,260, compared to $91,663 and $91,668 for medium-sized and large school boards, respectively.
| School System | Small | Medium | Large | Overall |
|---|---|---|---|---|
| English Public | 94,205 | 92,680 | 91,356 | 91,558 |
| English Catholic | 93,512 | 91,866 | 92,878 | 92,670 |
| French Public | 91,443 | 86,540 | - | 87,385 |
| French Catholic | 91,853 | 91,448 | 89,564 | 90,951 |
| Average | 93,260 | 91,663 | 91,668 | 91,755 |
7. School Board Budget Balance and Accumulated Surplus
In 2021-22, school boards recorded $29.0 billion in revenue and spent $28.8 billion, resulting in a combined budget surplus of $0.1 billion, representing 0.5 per cent of total school boards’ revenue. Of the Province’s 72 school boards, 57 recorded budget surpluses for the 2021-22 school year, while the remaining 15 school boards recorded budget deficits.[39] The school board with the largest surplus as a share of revenue was the Lakehead DSB (5.5 per cent) and the school board with the largest deficit was CSC Providence (-3.2 per cent).
Figure 7.1 School boards’ budget balance as a share of revenue, 2021-22 school year, per cent
Source: 2021-22 school board financial statements and FAO analysis of information provided by the Province.
By school system, the French Catholic system had the highest average surplus as share of revenue (1.7 per cent), followed by the French Public system (1.1 per cent), English Public system (0.5 per cent) and English Catholic system (0.4 per cent).
Figure 7.2 School system budget balance as a share of revenue, 2021-22 school year, per cent
Source: 2021-22 school board financial statements and FAO analysis of information provided by the Province.
As of the end of the 2021-22 school year (August 31, 2022), school boards had a combined accumulated surplus[40] of $6.6 billion,[41] representing 22.6 per cent of 2021-22 revenue. Of the Province’s 72 school boards, 71 had an accumulated surplus, while only one school board had an accumulated deficit. The school board with the largest accumulated surplus as a share of 2021-22 revenue was CSD catholique des Aurores boréales (83.4 per cent) and the school board with an accumulated deficit was the Toronto DSB (-0.6 per cent).
Figure 7.3 School boards’ accumulated surplus / (deficit) as a share of 2021-22 revenue, as of August 31, 2022, per cent
Note: Accumulated surplus / (deficit) is the sum of school boards’ budget surpluses and deficits over time
Source: 2021-22 school board financial statements and FAO analysis of information provided by the Province.
By school system, the French Public system had the largest accumulated surplus as a share of 2021-22 revenue (43.1 per cent), followed by the French Catholic system (36.2 per cent), the English Catholic system (25.3 per cent) and the English Public system (19.7 per cent).
Figure 7.4 School system accumulated surplus / (deficit) as a share of 2021-22 revenue, as of August 31, 2022, per cent
Note: Accumulated surplus / (deficit) is the sum of school boards’ budget surpluses and deficits over time.
Source: 2021-22 school board financial statements and FAO analysis of information provided by the Province.
Budget Balance and Accumulated Surplus under the Education Act
Section 231 of the Education Act requires that school boards generally plan for balanced budgets as defined under the Act and applicable regulations (see Ontario Regulation 488/10).[42] Notably, under the Education Act and regulations, the definitions of balanced budgets and accumulated surpluses are different from public sector accounting standards (PSAS) used for Ontario Budgets and the Public Accounts of Ontario. Education Act-compliant financial definitions exclude certain revenues and expenses, such as employee future benefits, interest to be accrued, revenues recognized for lands and funds raised by parent council.[43] As a result of these differences, school boards’ Education Act-compliant accumulated surplus was $2.6 billion in 2021-22 compared to $6.6 billion under PSAS rules.
While the Education Act requires that school boards generally plan for balanced budgets, some school boards may end the fiscal year with an Education Act-compliant budget deficit due to unexpected factors. If a school board incurs a budget deficit during the fiscal year, it must account for the deficit when preparing budgets for the next fiscal year.
8. Student Outcomes by School Board and System
The Education Quality and Accountability Office (EQAO) administers a province-wide standardized testing program each year to assess students’ academic outcomes. These test results are used by the Ministry of Education to measure the success of education policies and evaluate the performance of Ontario’s education system.[44]
Students are tested in grades 3, 6 and 9 to assess their reading, writing and math skills.[45] Students’ scores range from ‘Below Level 1’ (“The student has not demonstrated sufficient achievement of curriculum expectations”) to ‘Level 4’ (“The student has demonstrated the required knowledge and skills”). Students scoring at least ‘Level 3’ (“The student has demonstrated most of the required knowledge and skills”) are at or above the provincial standard.
In 2021-22, 53.1 per cent of administered EQAO tests across grades 3, 6 and 9 were assessed as meeting or exceeding the EQAO standard for math, 80.0 per cent of administered tests met or exceeded the standard for reading and 74.9 per cent of administered tests met or exceeded the standard for writing.[46] Across all disciplines and grades, the FAO estimates that the province-wide average EQAO pass rate (the share of tests administered that were assessed as meeting or exceeding the provincial standard) was 67.7 per cent.
Figure 8.1 Share of administered EQAO tests across all disciplines and grades that met or exceeded the provincial standard, 2021-22, per cent
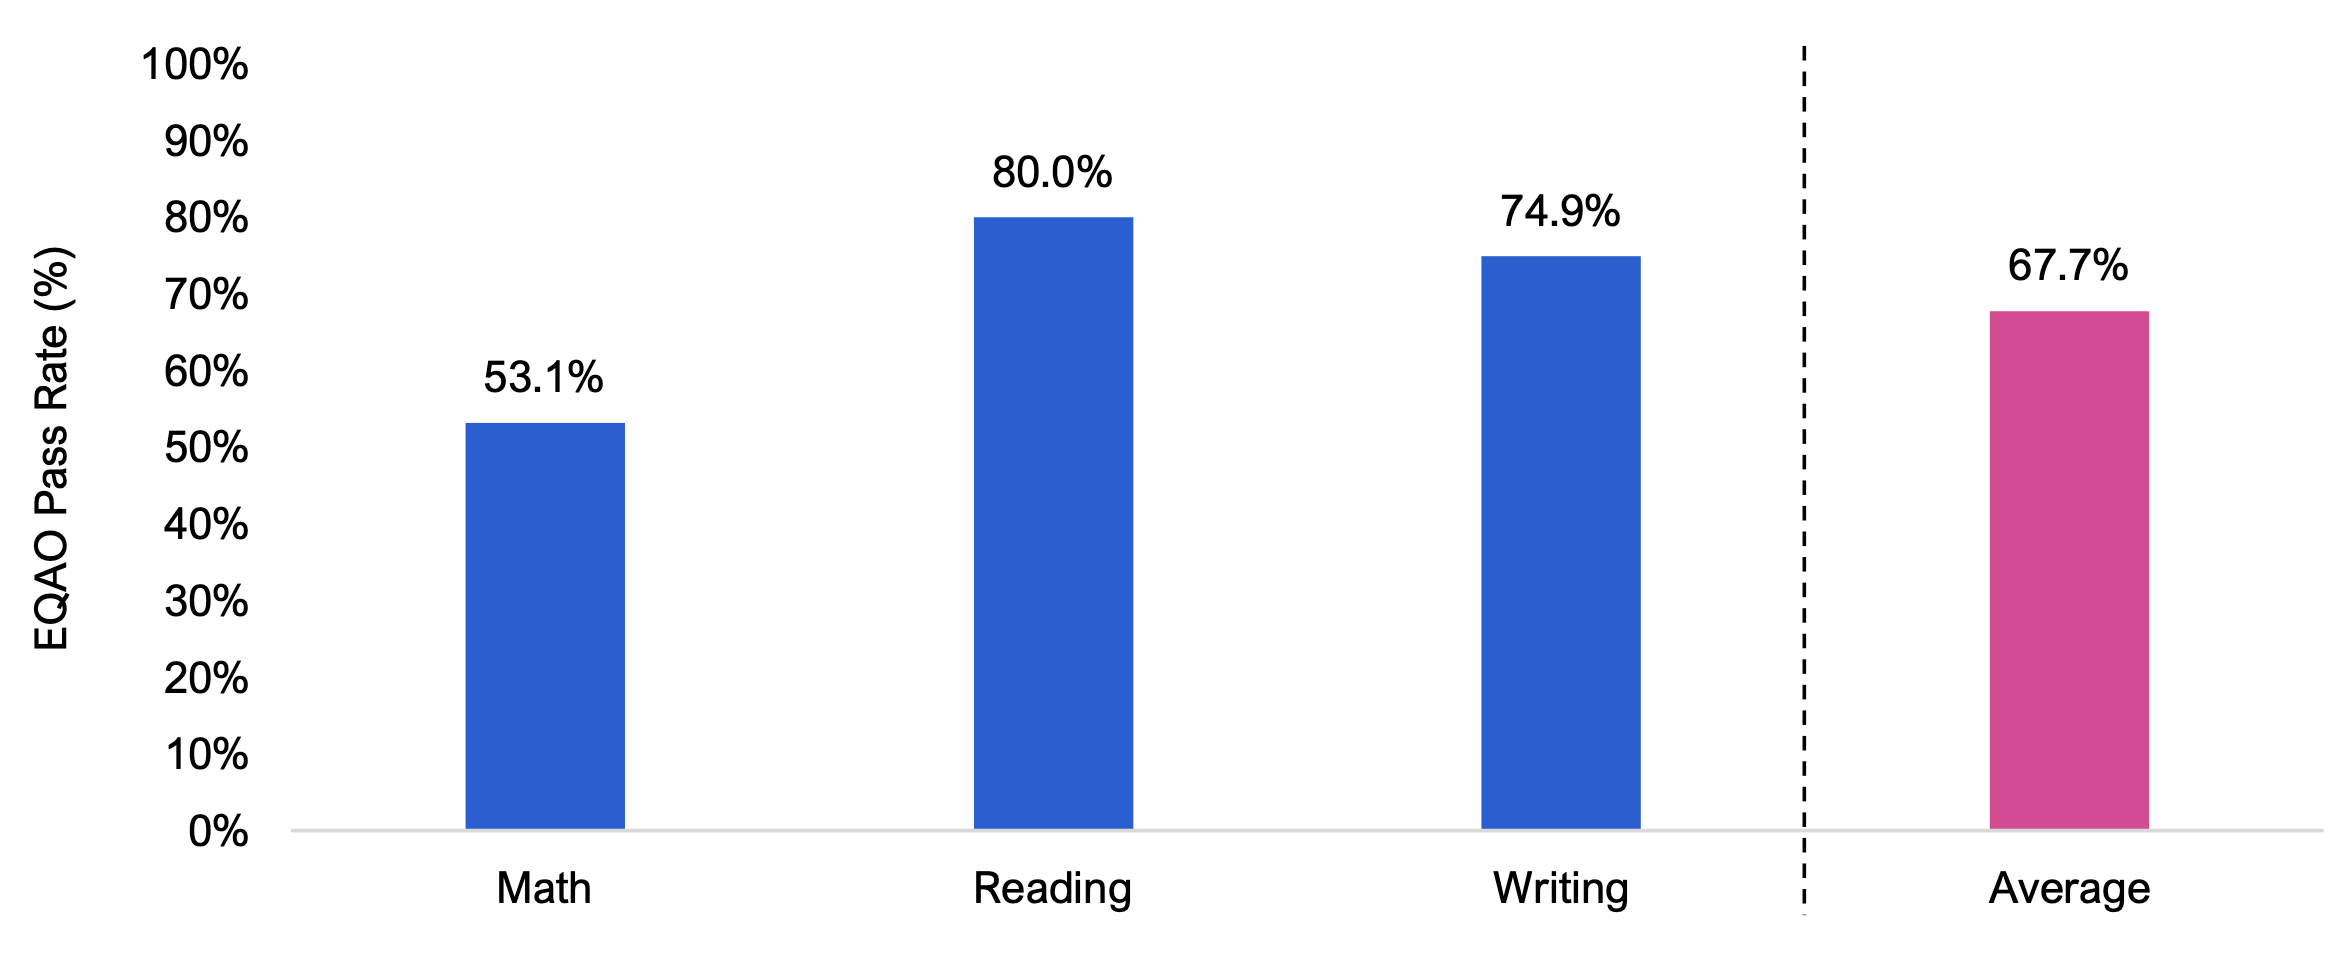
Note: EQAO results are assessed on a level basis, the highest being “Level 4”, the lowest being “Below Level 1”. Tests assessed at “Level 3” or above meet or exceed the provincial standard. The average pass rate is the share of tests administered across all disciplines and grades that were assessed as meeting or exceeding the provincial standard
Source: FAO analysis of information provided by the Province.
The EQAO average pass rate varied significantly by school board.[47] Conseil scolaire Viamonde had the best performance, with an average EQAO pass rate of 78.3 per cent across all tested grades and disciplines. Conversely, Superior-Greenstone DSB had the lowest average EQAO pass rate at 43.9 per cent.
Figure 8.2 EQAO average pass rate by school board, 2021-22 school year, per cent
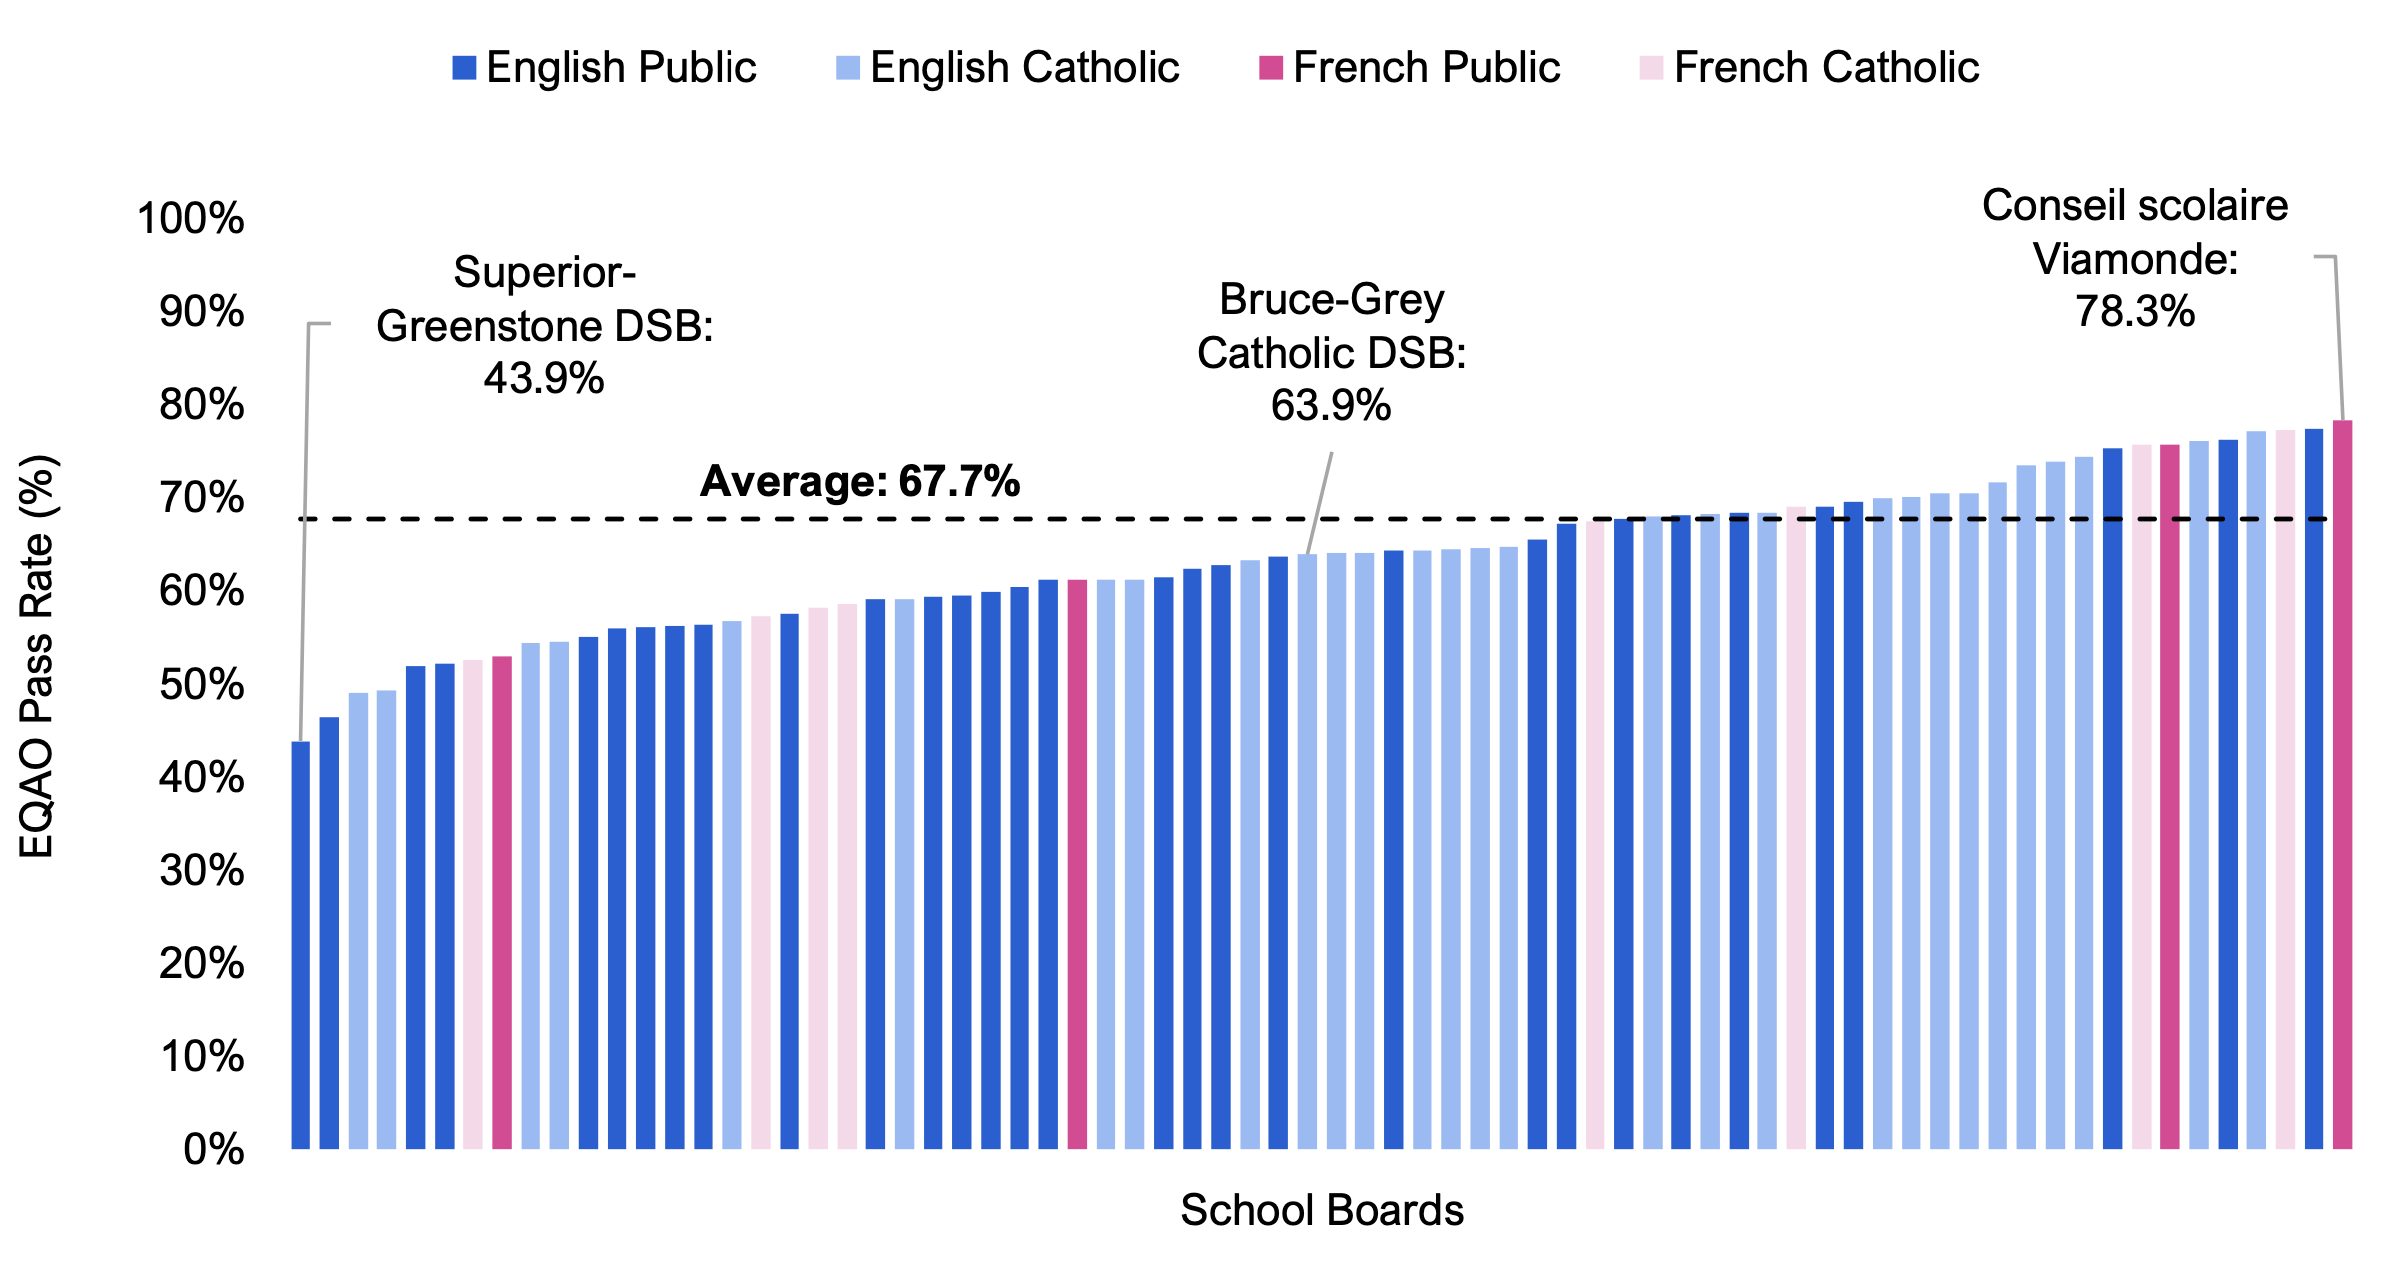
Note: EQAO results are assessed on a level basis, the highest being “Level 4”, the lowest being “Below Level 1”. Tests assessed at “Level 3” or above meet or exceed the provincial standard. The average pass rate is the share of tests administered across all disciplines and grades that were assessed as meeting or exceeding the provincial standard.
Source: 2021-22 school board financial statements and FAO analysis of information provided by the Province.
By school system, the French Public school boards had the best performance overall, with an average EQAO pass rate of 74.2 per cent across all tested grades and disciplines, followed by French Catholic school boards, with a pass rate of 70.7 per cent. The pass rates for the English Catholic and English Public school systems were 69.0 per cent and 66.8 per cent, respectively.[48]
Figure 8.3 EQAO average pass rate by school system, 2021-22 school year, per cent
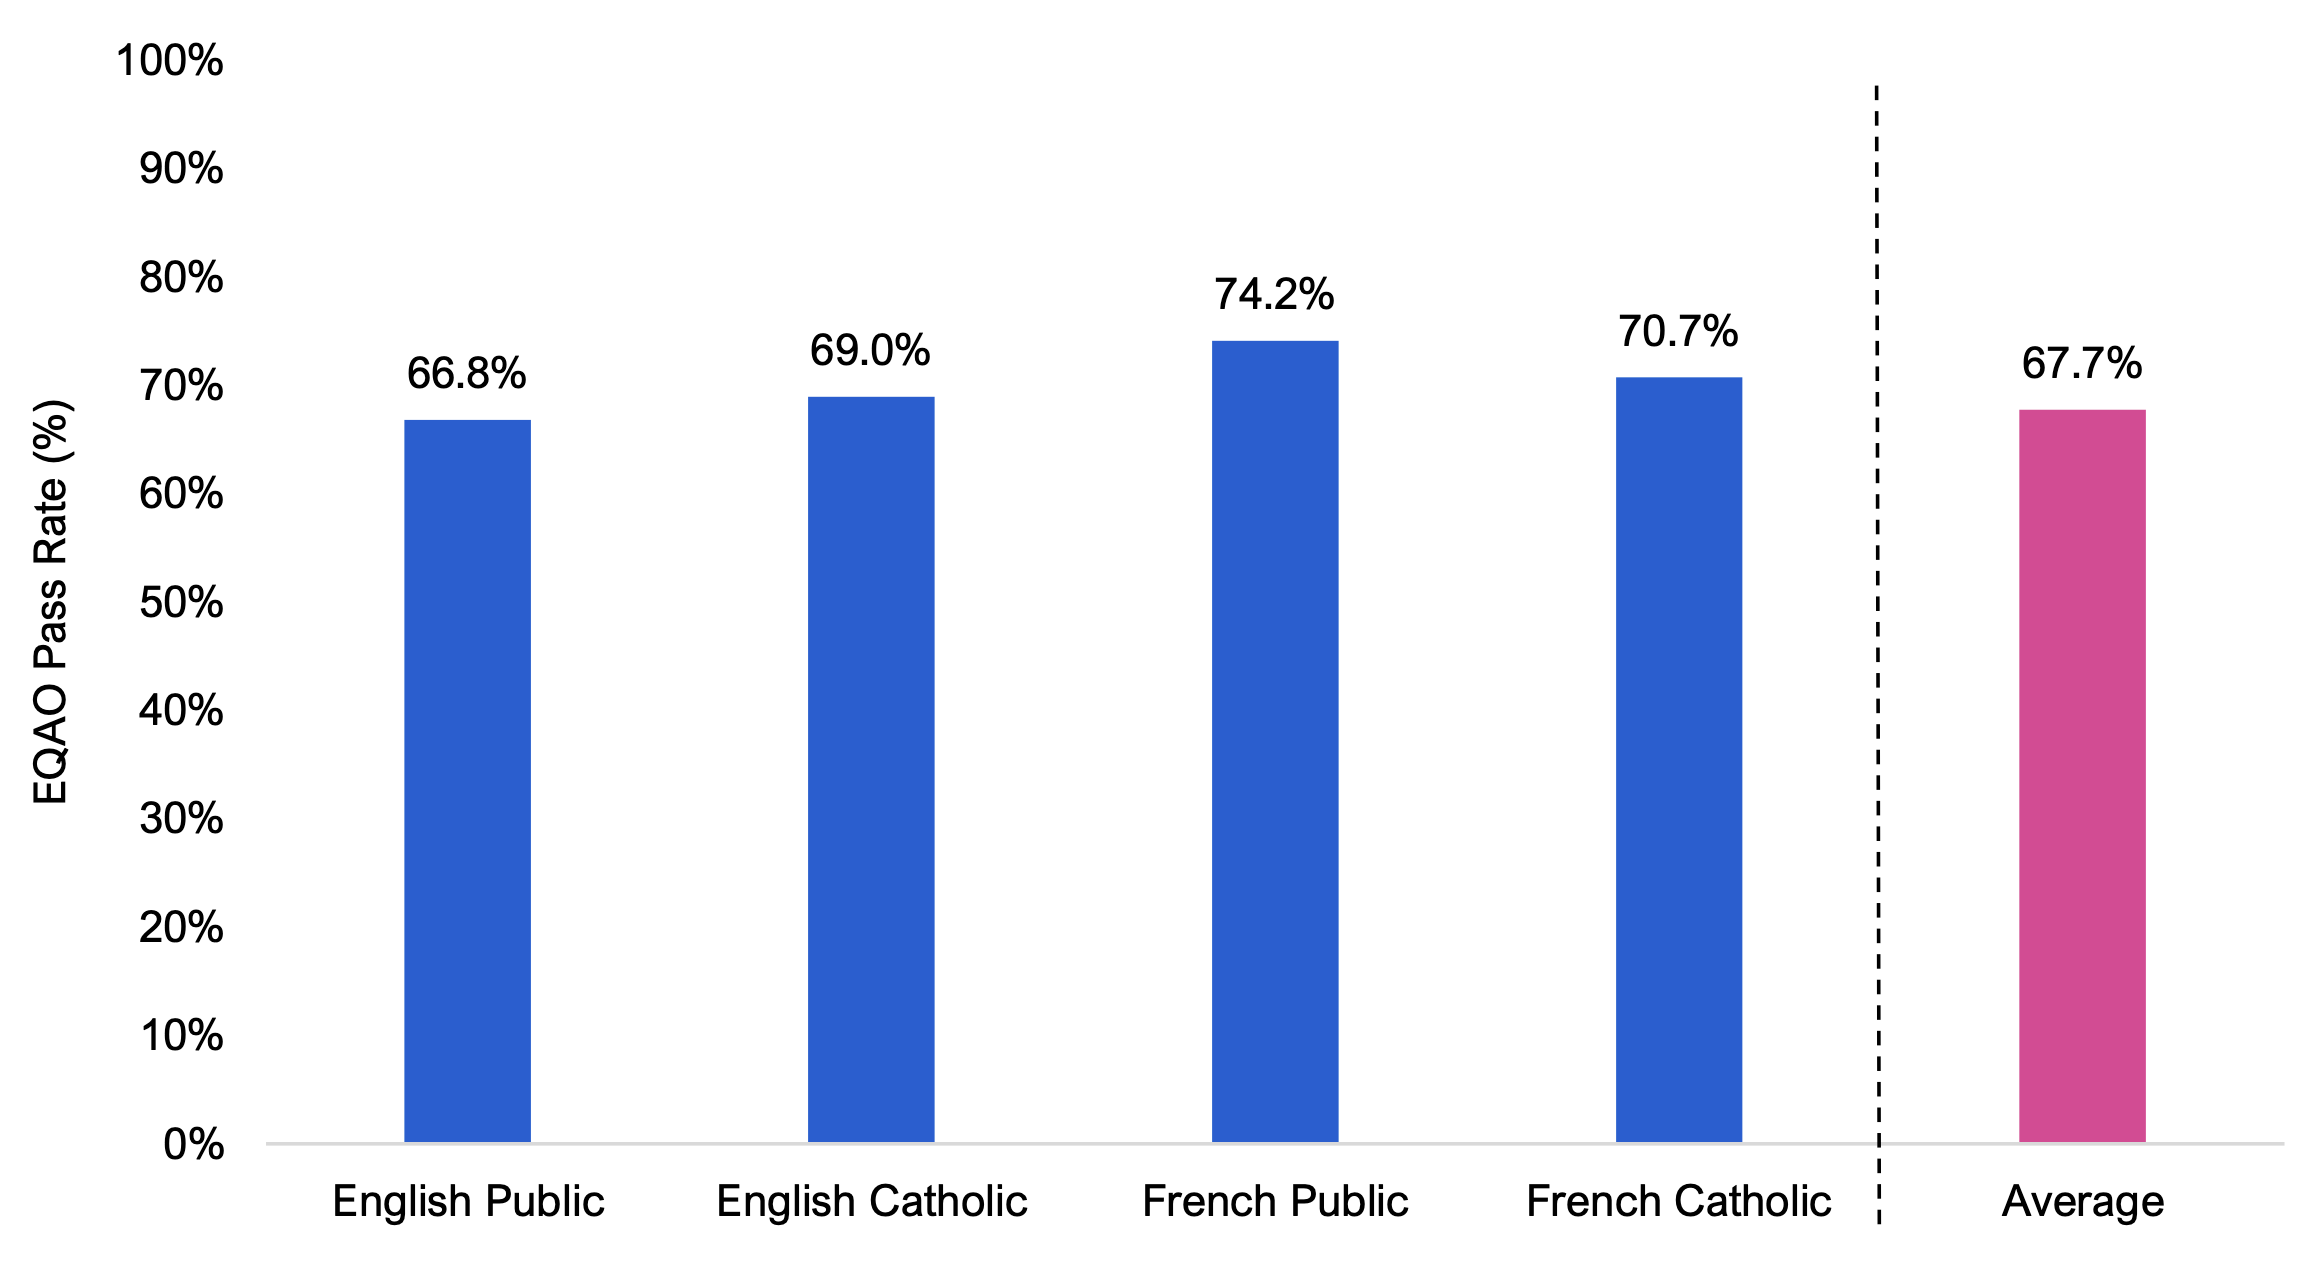
Note: EQAO results are assessed on a level basis, the highest being “Level 4”, the lowest being “Below Level 1”. Tests assessed at “Level 3” or above meet or exceed the provincial standard. The average pass rate is the share of tests administered across all disciplines and grades that were assessed as meeting or exceeding the provincial standard
Source: FAO analysis of information provided by the Province.
Across all four school systems, on average, school boards that were more rural, more remote, more disperse and smaller had lower EQAO pass rates. For example, across all school systems, the average EQAO pass rates in urban and ‘leans urban’ school boards[49] were 68.5 per cent and 70.7 per cent, respectively. In contrast, the average EQAO pass rates in rural and ‘leans rural’ school boards were 60.2 per cent and 63.6 per cent, respectively. In each of the four school systems, the average EQAO pass rate was higher for urban and ‘leans urban’ school boards than for rural and ‘leans rural’ school boards.[50]
| School System | Urban | Leans Urban | Leans Rural | Rural | Overall |
|---|---|---|---|---|---|
| English Public | 67.6 | 69.7 | 63.5 | 57.8 | 66.8 |
| English Catholic | 70.3 | 71.2 | 64.0 | 66.7 | 69.0 |
| French Public | - | 75.0 | 61.1 | - | 74.2 |
| French Catholic | - | 74.4 | 64.5 | - | 70.7 |
| Average | 68.5 | 70.7 | 63.6 | 60.2 | 67.7 |
By school board, of the top 10 school boards with the highest average EQAO pass rates, one was an urban school board, seven were ‘leans urban’ school boards, one was a ‘leans rural’ school board and one was a rural school board. Conversely, of the 10 school boards with the lowest average EQAO pass rates, four were rural school boards, four were ‘leans rural’ school boards and two were ‘leans urban’ school boards.
Figure 8.4 Average EQAO pass rate by school board and urban factor, 2021-22 school year, per cent
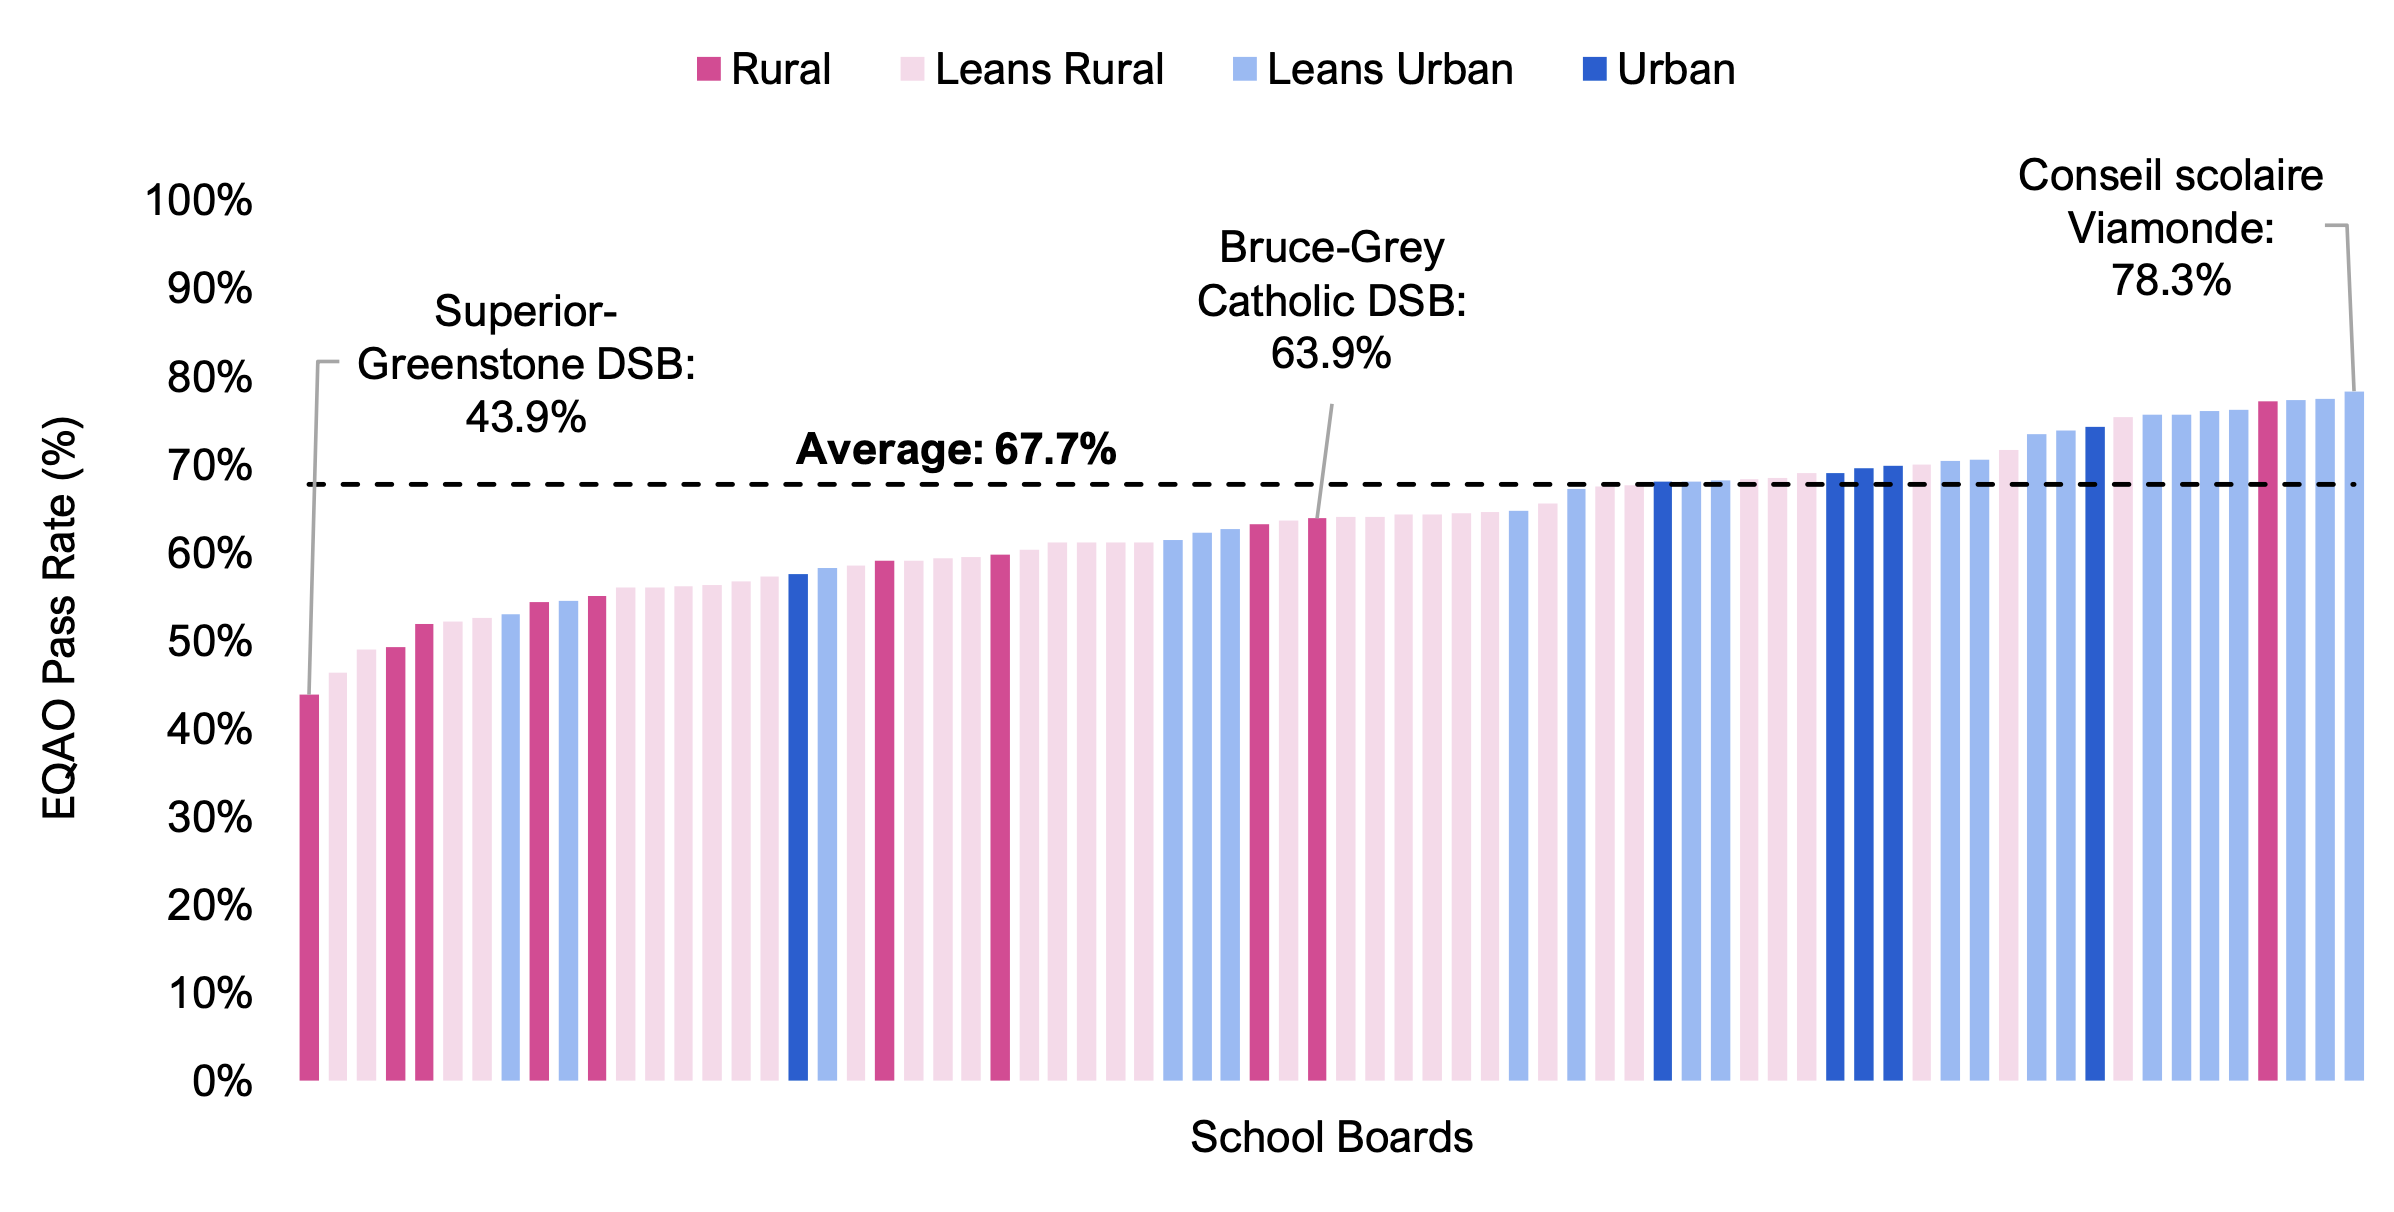
Note: The average pass rate is the share of tests administered across all disciplines and grades that were assessed as meeting or exceeding the provincial standard. The Ministry of Education assigns each school board an “Urban Factor” ranging from zero (most urban) to one (most rural) that is calculated based on the average population of its schools’ census subdivisions (CSDs), weighted by enrolment. Schools in a CSD with less than 25,000 people receive a score of one, schools in a CSD with 200,000 or more people receive a score of zero, and schools in CSDs with between 25,000 and 199,999 people receive a score between zero and one. The FAO categorizes school boards as ‘urban’ if they have an urban factor of zero, ‘leans urban’ if they have an urban factor greater than zero and less than or equal to 0.5, ‘leans rural’ if they have an urban factor greater than 0.5 and less than one, and ‘rural’ if they have an urban factor of one.
Source: FAO analysis of information provided by the Province.
Finally, the FAO found that higher per-student funding did not result in higher EQAO pass rates. Overall, of the 26 school boards with EQAO pass rates at or above the provincial average (67.7 per cent), 16 had below average provincial per-student funding levels (below $13,364 per student).
Figure 8.5 EQAO average pass rate vs. per-student funding, by school board, 2021-22 school year
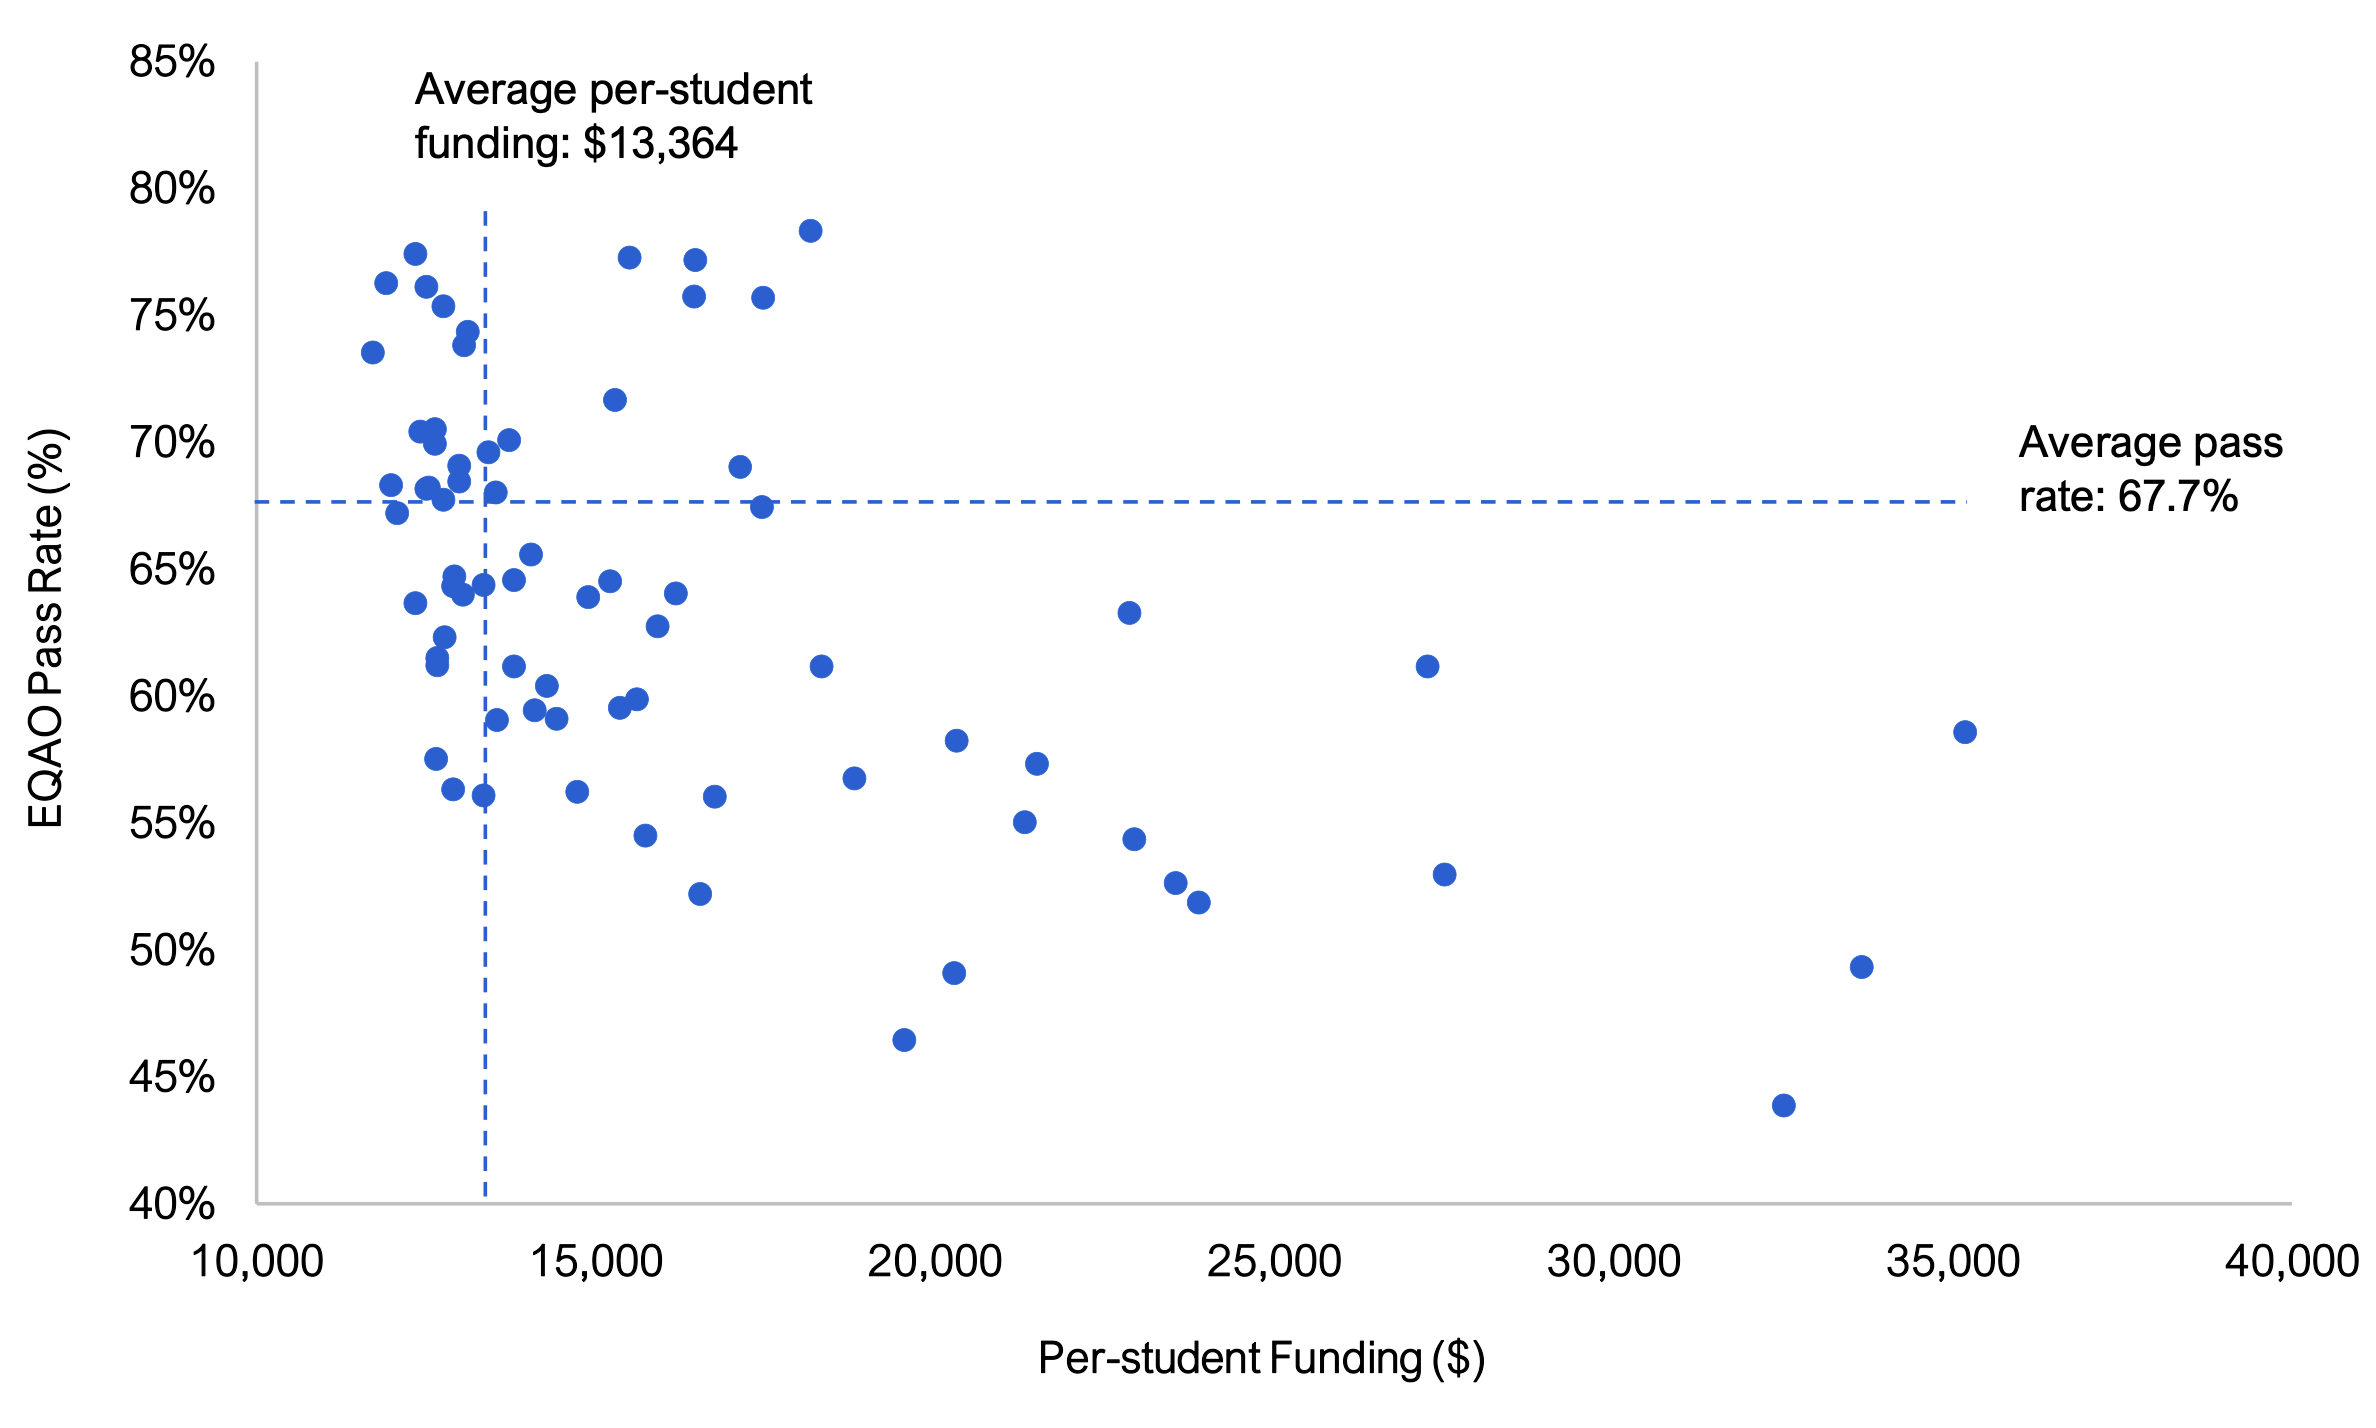
Note: Each dot represents one of Ontario’s 72 school boards. The average pass rate is the share of tests administered across all disciplines and grades that were assessed as meeting or exceeding the provincial standard
Source: FAO analysis of information provided by the Province.
School boards that are more rural, on average, receive more funding per student from the Province (as discussed in Chapter 4). There were four school boards with an average pass rate below 50.0 per cent: the Superior Greenstone DSB (pass rate of 43.9 per cent), the DSB Ontario North East (46.4 per cent), the Northeastern Catholic DSB (49.0 per cent) and the Superior North Catholic DSB (49.3 per cent). All four school boards are rural or ‘leans rural’ and received per-student funding significantly above the provincial average of $13,364.
Despite receiving higher per-student funding, schools in rural areas typically have fewer educational supports. For instance, rural schools are less likely to have a full-time vice principal, special education teacher, librarian, psychologist and social worker.[51] In addition, rural students face different socio-economic circumstances compared to students in urban and suburban areas, which can affect their educational achievement.[52]
Graphical Descriptions
Figure 3.1 shows where students in Ontario are concentrated. The FAO estimates that one million students or 51.3 per cent of all students lived in the Greater Toronto and Hamilton Area (GTHA) in 2021, and an additional 154,000 (7.7 per cent) lived in Ottawa.
| School System | Average Annual Growth Rate |
|---|---|
| English Public | 0.4 |
| English Catholic | 0.1 |
| French Public | 3.1 |
| French Catholic | 0.6 |
| Total | 0.3 |
Figure 3.3 shows the number of children and youth whose parents are French-language rights-holders in each of Ontario’s 49 census divisions. The areas with the largest concentration of school-aged children and youth whose parents are French-language rights-holders are: Ottawa (55,250), Toronto (34,720), Peel (19,675), York (15,495), Essex (11,555), Prescott and Russell (10,925), and Greater Sudbury (10,775).
| Number of School-Aged Children and Youth / Spaces | |
|---|---|
| Children and Youth with French-language Rights-holding Parents | 268,250 |
| Spaces in Schools in French-language Systems | 158,309 |
Figure 3.5 show the coverage rates for French-language school system spaces by census division for the 2021-22 school year. Of the Province’s 49 census division, 30 have a French-language rights-holder coverage ratio below 50 per cent, including 12 census divisions with no French-language schools at all. Most of these census divisions without French-language schools are in the Muskoka-Kawarthas and Stratford-Bruce Peninsula regions.
Figure 3.6 shows the number of school-aged children and youth who identify as Catholic or have at least one Catholic parent in each of Ontario’s 49 census divisions. The regions with the highest concentration of school-aged children and youth who identified as Catholic or had at least one Catholic parent were the GTHA, Ottawa, Essex, Waterloo and Simcoe.
| School-aged Children and Youth / Spaces | |
|---|---|
| Children and Youth Identifying as Catholic or with at Least One Catholic Parent | 570,116 |
| Spaces in Schools in Catholic Systems | 725,416 |
Figure 3.8 show the coverage rates for Catholic school system spaces by census division for the 2021-22 school year. Of the Province’s 49 census division, 38 have a Catholic-system coverage rate greater than 100 per cent, and an additional eight have coverage ratios below 100 per cent but greater than 50 per cent. Of the remaining three census divisions, one has a coverage rate of 36 per cent (Lennox and Addington) and two, Haliburton and Manitoulin, have no Catholic-system schools.
Figure 4.1 shows per-student funding by school board, broken down by system. On average, the French Public and French Catholic school boards received higher per-student funding than English Public and English Catholic school boards.
| School System | Per-student Funding ($) | |||
|---|---|---|---|---|
| Grants for Student Needs | Priorities and Partnerships Fund | Official Languages Projects | Total | |
| English Public | 12,409 | 615 | 4 | 13,027 |
| English Catholic | 12,559 | 687 | 6 | 13,252 |
| French Public | 17,468 | 1,001 | 117 | 18,585 |
| French Catholic | 16,655 | 890 | 135 | 17,680 |
| Average | 12,701 | 652 | 11 | 13,364 |
Figure 4.3 shows per-student GSN funding by school board. The values range from a low of $11,179 for the Halton Catholic DSB to a high of $31,489 for the CSD catholique des Aurores boréales, with an overall average of $12,701.
Figure 4.4 shows per-student GSN funding by school board, broken down by school board size (small, medium and large). The values range from a low of $11,179 for the Halton Catholic DSB to a high of $31,489 for the CSD catholique des Aurores boréales, with an overall average of $12,701. On average, smaller school boards received higher per-student GSN funding and larger school boards received lower per-student GSN funding.
Figure 4.5 shows per-student GSN funding by school board, broken down by school board dispersion (low dispersion, medium dispersion, and high dispersion). The values range from a low of $11,179 for the Halton Catholic DSB to a high of $31,489 for the CSD catholique des Aurores boréales, with an overall average of $12,701. On average, high dispersion school boards received higher per-student GSN funding and low dispersion school boards received lower per-student GSN funding.
Figure 4.6 shows per-student GSN funding by school board, broken down by school board remoteness (least remote, medium remote, and most remote). The values range from a low of $11,179 for the Halton Catholic DSB to a high of $31,489 for the CSD catholique des Aurores boréales, with an overall average of $12,701. On average, medium remote and most remote school boards received higher per-student GSN funding and least remote school boards received lower per-student GSN funding.
Figure 4.7 shows per-student GSN funding by school board, broken down by school board urban factor (rural, leans rural, leans urban, and urban). The values range from a low of $11,179 for the Halton Catholic DSB to a high of $31,489 for the CSD catholique des Aurores boréales, with an overall average of $12,701. On average, school boards that are “rural” or “leans rural” receive higher per-student funding than school boards that are “urban” or “leans urban”.
Figure 4.8 shows per-student GSN funding by school board, broken down by English-language and French-language. The values range from a low of $11,179 for the Halton Catholic DSB to a high of $31,489 for the CSD catholique des Aurores boréales, with an overall average of $12,701. On average, French-language school boards received higher per-student GSN funding than English-language school boards.
Figure 4.9 shows per-student Priorities and Partnership Fund (PPF) funding by school board, broken down by school system. The values range from a low of $523 for the Durham DSB to a high of $4,120 for the Superior North Catholic DSB, with an overall average of $652. On average, French Catholic and French Public school boards received higher per-student PPF funding than English Public and English Catholic school boards.
Figure 4.10 shows per-student Priorities and Partnership Fund (PPF) funding by school board and allocation (COVID-related, tutoring supports, reading supports & assessments, all other). The values range from a low of $523 for the Durham DSB to a high of $4,120 for the Superior North Catholic DSB, with an overall average of $652.
Figure 4.11 shows per-student Official Languages Projects program funding by school board, broken down by English-language and French-language. The values range from a low of $2 for the York Region DSB to a high of $528 for the CSD catholique des Aurores boréales. On average, French-language school boards received higher per-student Official Languages Projects program funding than English-language school boards.
| School System | School Board Revenue ($ millions) | Share of Revenue (%) |
|---|---|---|
| English Public | 18,815 | 65 |
| English Catholic | 8,004 | 28 |
| French Public | 698 | 2 |
| French Catholic | 1,454 | 5 |
| School System | Per-student Revenue ($) | |||
|---|---|---|---|---|
| Provincial and Own Source Operating Revenue | Revenue for Infrastructure Projects | Federal Operating Transfers Revenue | Total | |
| English Public | 13,262 | 776 | 88 | 14,126 |
| English Catholic | 13,632 | 734 | 62 | 14,428 |
| French Public | 18,985 | 1,168 | 31 | 20,184 |
| French Catholic | 18,011 | 935 | 57 | 19,002 |
| Average | 13,646 | 777 | 79 | 14,501 |
Figure 5.3 shows per-student revenue by school board and source (provincial and own source operating revenue, revenue for infrastructure projects and federal operating transfers revenue). The values range from a low of $12,766 for the Durham DSB to a high of $41,880 for the Superior-Greenstone DSB, with an overall average of $14,501.
| Spending Category | Average Annual Spending Growth per Student (%) |
|---|---|
| Teacher Compensation | 1.8 |
| Non-Teacher Instruction | 2.6 |
| Pupil Accommodation | 0.9 |
| Infrastructure | 6.3 |
| Transportation | 4.5 |
| Administration | 1.9 |
| Other Spending | 3.1 |
| Total | 2.3 |
| Total Spending ($ millions) | Share of Spending (%) | |
|---|---|---|
| English Public | 18,726 | 65 |
| English Catholic | 7,975 | 28 |
| French Public | 691 | 2 |
| French Catholic | 1,429 | 5 |
| Per-student Spending ($) | |
|---|---|
| English Public | 14,059 |
| English Catholic | 14,376 |
| French Public | 19,969 |
| French Catholic | 18,675 |
| Average | 14,426 |
Figure 6.4 shows per-student spending by school board, broken down by school system. The values range from a low of $12,617 for the Durham DSB to a high of $41,406 for the Superior-Greenstone DSB, with an overall average of $14,426. On average, the French Catholic and French Public system schools have higher spending per-student than the English Public and English Catholic system schools.
| Per-student Funding ($) | ||||||||
|---|---|---|---|---|---|---|---|---|
| Teacher Compensation |
Non-Teacher Instruction |
Administration | Transportation | Pupil Accommodation |
Infrastructure | Other Spending |
Total | |
| Small | 6,845 | 3,646 | 324 | 449 | 1,391 | 767 | 431 | 19,886 |
| Medium | 6,884 | 4,041 | 429 | 1,051 | 1,556 | 842 | 563 | 15,365 |
| Large | 7,893 | 5,756 | 874 | 1,230 | 2,127 | 1,352 | 655 | 13,851 |
| School System | Average Funded and Actual Teacher Salary ($) | |
|---|---|---|
| Actual Average | Funded Average | |
| English Public | 91,558 | 94,951 |
| English Catholic | 92,670 | 95,536 |
| French Public | 87,385 | 90,193 |
| French Catholic | 90,951 | 92,529 |
| Average | 91,755 | 94,912 |
Figure 7.1 shows school boards’ budget balance as a share of revenue by school board, broken down by school system. The values range from a low of -3.2 per cent for the CSC Providence to a high of 5.5 per cent for the Lakehead DSB, with an overall average of 0.5 per cent.
| School System | Surplus / (Deficit) as Share of Revenue (%) |
|---|---|
| English Public | 0.5 |
| English Catholic | 0.4 |
| French Public | 1.1 |
| French Catholic | 1.7 |
| Average | 0.5 |
Figure 7.3 shows school boards’ accumulated surplus / (deficit) as a share of revenue by school board, broken down by school system. The values range from a low of -0.6 per cent for the Toronto DSB to a high of 83.4 per cent for the CSD catholique du Nouvel-Ontario, with an overall average of 22.6 per cent.
| School System | Accumulated Surplus / (Deficit) as a Share of 2021-22 Revenue (%) |
|---|---|
| English Public | 19.7 |
| English Catholic | 25.3 |
| French Public | 43.1 |
| French Catholic | 36.2 |
| Average | 22.6 |
| Discipline | EQAO Pass Rate (%) |
|---|---|
| Math | 53.1 |
| Reading | 80.0 |
| Writing | 74.9 |
| Average | 67.7 |
Figure 8.2 shows EQAO average pass rates by school board, broken down by school system. The values range from a low of 43.9 per cent for the Superior-Greenstone DSB to a high of 78.3 per cent for the Conseil scolaire Viamonde, with an overall average of 67.7 per cent.
| School System | EQAO Pass Rate (%) |
|---|---|
| English Public | 66.8 |
| English Catholic | 69.0 |
| French Public | 74.2 |
| French Catholic | 70.7 |
| Average | 67.7 |
Figure 8.4 shows average EQAO pass rates by school board, broken down by urban factor (rural, leans rural, leans urban, urban). The values range from a low of 43.9 per cent for the Superior-Greenstone DSB to a high of 78.3 per cent for the Conseil scolaire Viamonde. On average, rural and ‘leans rural’ schools had lower average EQAO pass rates than urban and ‘leans urban’ schools.
Figure 8.5 shows average EQAO pass rates by school board, against per-student funding. The school boards with the highest per-student funding had lower-than-average EQAO pass rates.
Footnotes
[1] Spaces refers to school facilities’ On the Ground (OTG) capacity. Maximum enrolment may exceed capacity (for example, through the use of portable classrooms).
[2] Dispersion is calculated by the Ministry of Education as the average distance between schools within a board, weighted at 0.8, and the average distance between a school board’s central office and each of its schools, weighted at 0.2. Distance is a similar concept which refers to the distance between a school and the next closest school within the same board.
[3] School boards’ own source revenue includes fundraising, investments and international student fees.
[4] Small school boards refer to the 24 school boards with the lowest enrolment (less than 8,895 students), medium-sized school boards refer to the 24 school boards with enrolment between 8,895 and 22,502 students, and large school boards refer to the 24 school boards with the highest enrolment (greater than 22,502 students).
[5] Accumulated surplus / (deficit) is the sum of school boards’ budget surpluses and deficits over time.
[6] In contrast, as of March 31, 2022, the Province had an accumulated deficit of $238.2 billion.
[7] Education Quality and Accountability Office, “Business Plan 2020–2023”, December 18, 2019, p. 6 and Ontario News Release, “Province Takes Action to Ensure Students Catch Up”, October 20, 2022.
[8] The FAO classified school boards as urban, ‘leans urban’, ‘leans rural’ and rural based on the Ministry of Education’s Urban Factor index. See Chapter 4 for more details.
[9] People for Education, “2021-2022 Annual Ontario School Survey Data Handbook”, September 2022.
[10] For a discussion of factors affecting Ontario student achievement, see Taylor Boyd, “Education Reform in Ontario: Building Capacity Through Collaboration,” 2022; Canadian Council on Learning, “The rural-urban gap in education”, 2006; Statistics Canada and Human Resources Development Canada, “Understanding the rural-urban reading gap”, 2002.
[11] In this report, enrolment refers to Average Daily Enrolment (ADE), which is a full-time equivalent measure of student enrolment based on two count dates during the school year in October and March.
[12] Overall enrolment growth between 2015-16 and 2021-22 was impacted by lower enrolment in 2020-21 and 2021-22 due to the COVID-19 pandemic. For the period of 2015-16 to 2022-23, which includes a normalization of enrolment after the pandemic, the average annual increase for total enrolment was 0.5 per cent. English Public and English Catholic systems had average annual growth of 0.6 per cent and 0.2 per cent, respectively, from 2015-16 to 2022-23, while the French Public and French Catholic systems had average annual growth of 2.9 per cent and 0.5 per cent, respectively.
[13] The Canadian Charter of Rights and Freedoms, Section 23.
[14] Statistics Canada, Census of Population, 2021. Statistics Canada defines “school-aged children and youth” as children and youth aged five to 17.
[15] Statistics Canada, Census of Population, 2021.
[16] Spaces refers to school facilities’ On the Ground (OTG) capacity. Maximum enrolment may exceed capacity (for example, through the use of portable classrooms).
[17] A census division refers to an intermediate geographic area (between a municipality and the province level) as defined by Statistics Canada.
[18] Statistics Canada, “897,000 children are eligible for instruction in the minority official language in Canada”, November 11, 2022, Table 6.
[19] Statistics Canada, “897,000 children are eligible for instruction in the minority official language in Canada”, November 11, 2022, Table 5.
[20] For example, see the admission criteria for York Region Catholic DSB, Waterloo Catholic DSB and CSD cath. des Grandes Rivières.
[21] For example, see Waterloo Catholic DSB and York Region Catholic DSB.
[22] Education Act, R.S.O. 1990 Section 42(1) and 42(2).
[23] FAO estimate using population demographic data from Statistics Canada, “Population estimates”, December 12, 2022, 2011 National Household Survey data, and “Religion by visible minority and generation status”, October 26, 2022.
[24] Reflects year-end allocations which are different from the projected allocations that are published by the Ministry of Education at the start of the school year.
[25] The Ministry of Education also provides school boards with capital funding for infrastructure investments and additional operating funding is provided to school boards through a small number of programs overseen by other ministries.
[26] For a breakdown of school board funding by individual school board, visit the FAO’s website at: https://tinyurl.com/yh5xncud.
[27] GSN Technical Paper: 2021-22, p. 9.
[28] Dispersion is calculated as the average distance between schools within a board, weighted at 0.8, and the average distance between a school board’s central office and each of its schools, weighted at 0.2. Distance is a similar concept which refers to the distance between a school and the next closest school within the same board.
[29] For example, in 2021-22, the Special Education Grant provided a minimum of $472,762 in base funding to every district school board for collaboration and integration. This is equivalent to $775 per student for the smallest school board and $2 per student for the largest school board. The result is that smaller school boards receive higher average funding on a per-student basis.
[30] For details on each school board’s characteristics, revenue and expenses, and EQAO performance, please visit the FAO’s website at: https://tinyurl.com/yh5xncud.
[31] Small school boards refer to the 24 school boards with the lowest enrolment (less than 8,895), medium-sized school boards refer to the 24 school boards with enrolment between 8,895 and 22,502 and large school boards refer to the 24 school boards with the highest enrolment (greater than 22,502).
[32] A similar concept to dispersion is distance, which refers to the distance between a school and the next closest school within the same board. Schools are classified as ‘regular schools’ (schools that are less than 10 kilometres away from the next closest school for elementary schools, or less than 20 kilometres away for secondary schools), ‘distant schools’ (between 10 kilometres and 20 kilometres away for the next closest school for elementary schools, or between 20 kilometres away and 45 kilometres away for secondary schools), and ‘supported schools’ (more than 20 kilometres away from the next closest elementary school or 45 kilometres away for the next closest secondary school).
[33] The Ministry of Education’s calculation for dispersion includes the average distance between schools within a board, weighted at 0.8, and the average distance between a school board’s central office and each of its schools, weighted at 0.2.
[34] The Ministry of Education assigns each school board an “Urban Factor” ranging from zero (most urban) to one (most rural) that is calculated based on the average population of its schools’ census subdivisions (CSDs), weighted by enrolment. Schools in a CSD with less than 25,000 people receive a score of one, schools in a CSD with 200,000 or more people receive a score of zero, and schools in CSDs with between 25,000 and 199,999 people receive a score between zero and one. The FAO classified school boards as ‘urban’ if they have an urban factor of zero, ‘leans urban’ if they have an urban factor greater than zero and less than or equal to 0.5, ‘leans rural’ if they have an urban factor greater than 0.5 and less than one, and ‘rural’ if they have an urban factor of one.
[35] The Province provides additional funding for remote and rural school boards in northern Ontario through the Special Education Grant and the Transportation Grant.
[36] Revenue for infrastructure projects does not reflect the amount of cash received by school boards for infrastructure projects for any given year. Instead, based on accounting rules, revenue for infrastructure projects represents the amount of revenue received for an infrastructure project, recognized over the useful life of the asset.
[37] Excluding the significant increase in fuel prices in 2021-22, transportation spending grew at an average annual rate of 3.1 per cent from 2015-16 to 2020-21.
[38] Small school boards refer to the 24 school boards with the lowest enrolment (less than 8,895 students), medium-sized school boards refer to the 24 school boards with enrolment between 8,895 and 22,502 students, and large school boards refer to the 24 school boards with the highest enrolment (greater than 22,502 students).
[39] For details on each school board’s characteristics, revenue and expenses, and EQAO performance, please visit the FAO’s website at: https://tinyurl.com/yh5xncud.
[40] Accumulated surplus / (deficit) is the sum of school boards’ budget surpluses and deficits over time.
[41] In contrast, as of March 31, 2022, the Province had an accumulated deficit of $238.2 billion.
[42] One exception is that a school board may plan to run a budget deficit if that deficit is covered by a budget surplus from a previous year.
[43] Ontario Regulation 488/10.
[44] Education Quality and Accountability Office, “Business Plan 2020–2023”, December 18, 2019, p. 6 and Ontario News Release, “Province Takes Action to Ensure Students Catch Up”, October 20, 2022.
[45] In addition to the EQAO reading, writing and math assessments, students in Grade 10 complete the Ontario Secondary School Literacy Test (OSSLT) in grade 10.
[46] Reading and writing are only assessed at the Grade 3 and Grade 6 levels.
[47] For details on each school board’s characteristics, revenue and expenses, and EQAO performance, please visit the FAO website at: https://tinyurl.com/yh5xncud.
[48] These results are largely consistent across grade levels and disciplines, with the French-language school systems outperforming the English-language school systems. One exception is for writing, where the four school systems performed similarly. In addition, the separate 2021-22 Ontario Secondary School Literacy Test pass rates by school system followed a similar trend to overall EQAO pass rates. For the English Public and English Catholic school systems, 82.0 per cent of students successfully completed the literacy test. For the French Catholic and French Public school systems, 88.5 per cent and 90.3 per cent of students, respectively, successfully completed the literacy test.
[49] The Ministry of Education assigns each school board an “Urban Factor” ranging from zero (most urban) to one (most rural) that is calculated based on the average population of its schools’ census subdivisions (CSDs), weighted by enrolment. Schools in a CSD with less than 25,000 people receive a score of one, schools in a CSD with 200,000 or more people receive a score of zero, and schools in CSDs with between 25,000 and 199,999 people receive a score between zero and one. The FAO classified school boards as ‘urban’ if they have an urban factor of zero, ‘leans urban’ if they have an urban factor greater than zero and less than or equal to 0.5, ‘leans rural’ if they have an urban factor greater than 0.5 and less than one, and ‘rural’ if they have an urban factor of one.
[50] The trend of urban and ‘leans urban’ school boards outperforming rural and ‘leans rural’ school boards was largely consistent across disciplines and grade levels.
[51] People for Education, “2021-2022 Annual Ontario School Survey Data Handbook”, September 2022.
[52] For a discussion of factors affecting Ontario student achievement, see Taylor Boyd, “Education Reform in Ontario: Building Capacity Through Collaboration” 2022; Canadian Council on Learning, “The rural-urban gap in education”, 2006; Statistics Canada and Human Resources Development Canada, “Understanding the rural-urban reading gap”, 2002.