


1. Summary
This report analyzes the Ministry of Children, Community and Social Services’ (MCCSS) spending plan as set out in the 2024 Ontario Budget and the 2024-25 Expenditure Estimates. The report discusses the FAO’s spending projection by vote-item from 2023-24 to 2028-29 and identifies key assumptions, issues and uncertainties.
2024-25 Expenditure Estimates Spending Plan
- Chapter 3 reviews MCCSS’s 2024-25 spending plan of $19.9 billion, as outlined in the 2024-25 Expenditure Estimates, by program vote (Supply Bill spending), standalone legislation (statutory) spending, and other spending (consolidation and other adjustments).
- The largest vote is the Children and Adult Services Program at $19.7 billion, or 98.9 per cent of planned MCCSS spending in 2024-25. Within this vote are four key vote-items that represent the majority of MCCSS spending: Financial and Employment Supports, Supports to Individuals and Families, Children and Youth at Risk, and the Ontario Child Benefit.
Ministry Spending Outlook to 2028-29
- Based on current program design and announced commitments, the FAO projects that MCCSS spending will grow at an average annual rate of 3.4 per cent, from $19.3 billion in 2023-24 to $22.9 billion in 2028-29. In contrast, in the 2024 Ontario Budget, the Province projects that MCCSS spending will grow at an average annual rate of 1.1 per cent, from $19.4 billion in 2023-24 to $20.1 billion in 2026-27, the last year of the government’s projection.[1]
- Overall, the FAO estimates that the Province has allocated $3.7 billion less than required to fund existing programs and announced commitments. The FAO projects funding shortfalls of $0.7 billion in 2024-25, growing to $1.2 billion in 2025-26 and $1.8 billion in 2026-27.
Financial and Employment Supports (Vote-Item 702-3)
- This vote-item, which accounted for about 53 per cent of ministry spending in 2023-24, provides financial and employment assistance to households in financial need through the Ontario Disability Support Program (ODSP) and Ontario Works program (OW). The FAO projects that spending on Financial and Employment Supports will grow at an average annual rate of 4.5 per cent from $10,272 million in 2023-24 to $12,808 million in 2028-29.
- The largest program is ODSP – Financial Assistance, which is projected to grow at an average annual rate of 5.6 per cent from $5,866 million in 2023-24 to $7,703 million in 2028-29. The FAO’s projection is driven by growth in ODSP cases and the government’s policy to index allowances to inflation.
- The FAO estimates that the number of ODSP cases will increase at an average annual rate of 2.8 per cent from 368,093 in 2023-24 to 422,704 in 2028-29.
- From 2018 to 2022, ODSP allowances were frozen and inflation-adjusted allowances declined from an average of $16,075 per case in 2018-19 to $14,576 in 2022-23. The government increased rates by five per cent in 2022 and indexed ODSP allowances to inflation going forward. As a result, the FAO estimates that inflation-adjusted allowances will increase to an average of $15,646 in 2028-29, which is still lower than when rates were frozen in 2018.
- The second largest program is OW – Financial Assistance, which is projected to grow at an average annual rate of 2.6 per cent from $2,875 million in 2023-24 to $3,265 million in 2028-29. The FAO’s projection is driven by growth in OW cases and assumes OW allowances remain frozen.
- The FAO estimates that the number of OW cases will increase at an average annual rate of 2.7 per cent from 244,750 in 2023-24 to 278,963 in 2028-29.
- OW allowances have been frozen since 2018, which resulted in a 15 per cent decline in inflation-adjusted OW allowances from an average of $11,154 in 2018-19 to $9,485 in 2023-24. Assuming the freeze continues, the FAO estimates that inflation-adjusted OW allowances will decline by an additional 10 per cent to an average of $8,511 per case by the end of 2028-29.
Supports to Individuals and Families (Vote-Item 702-21)
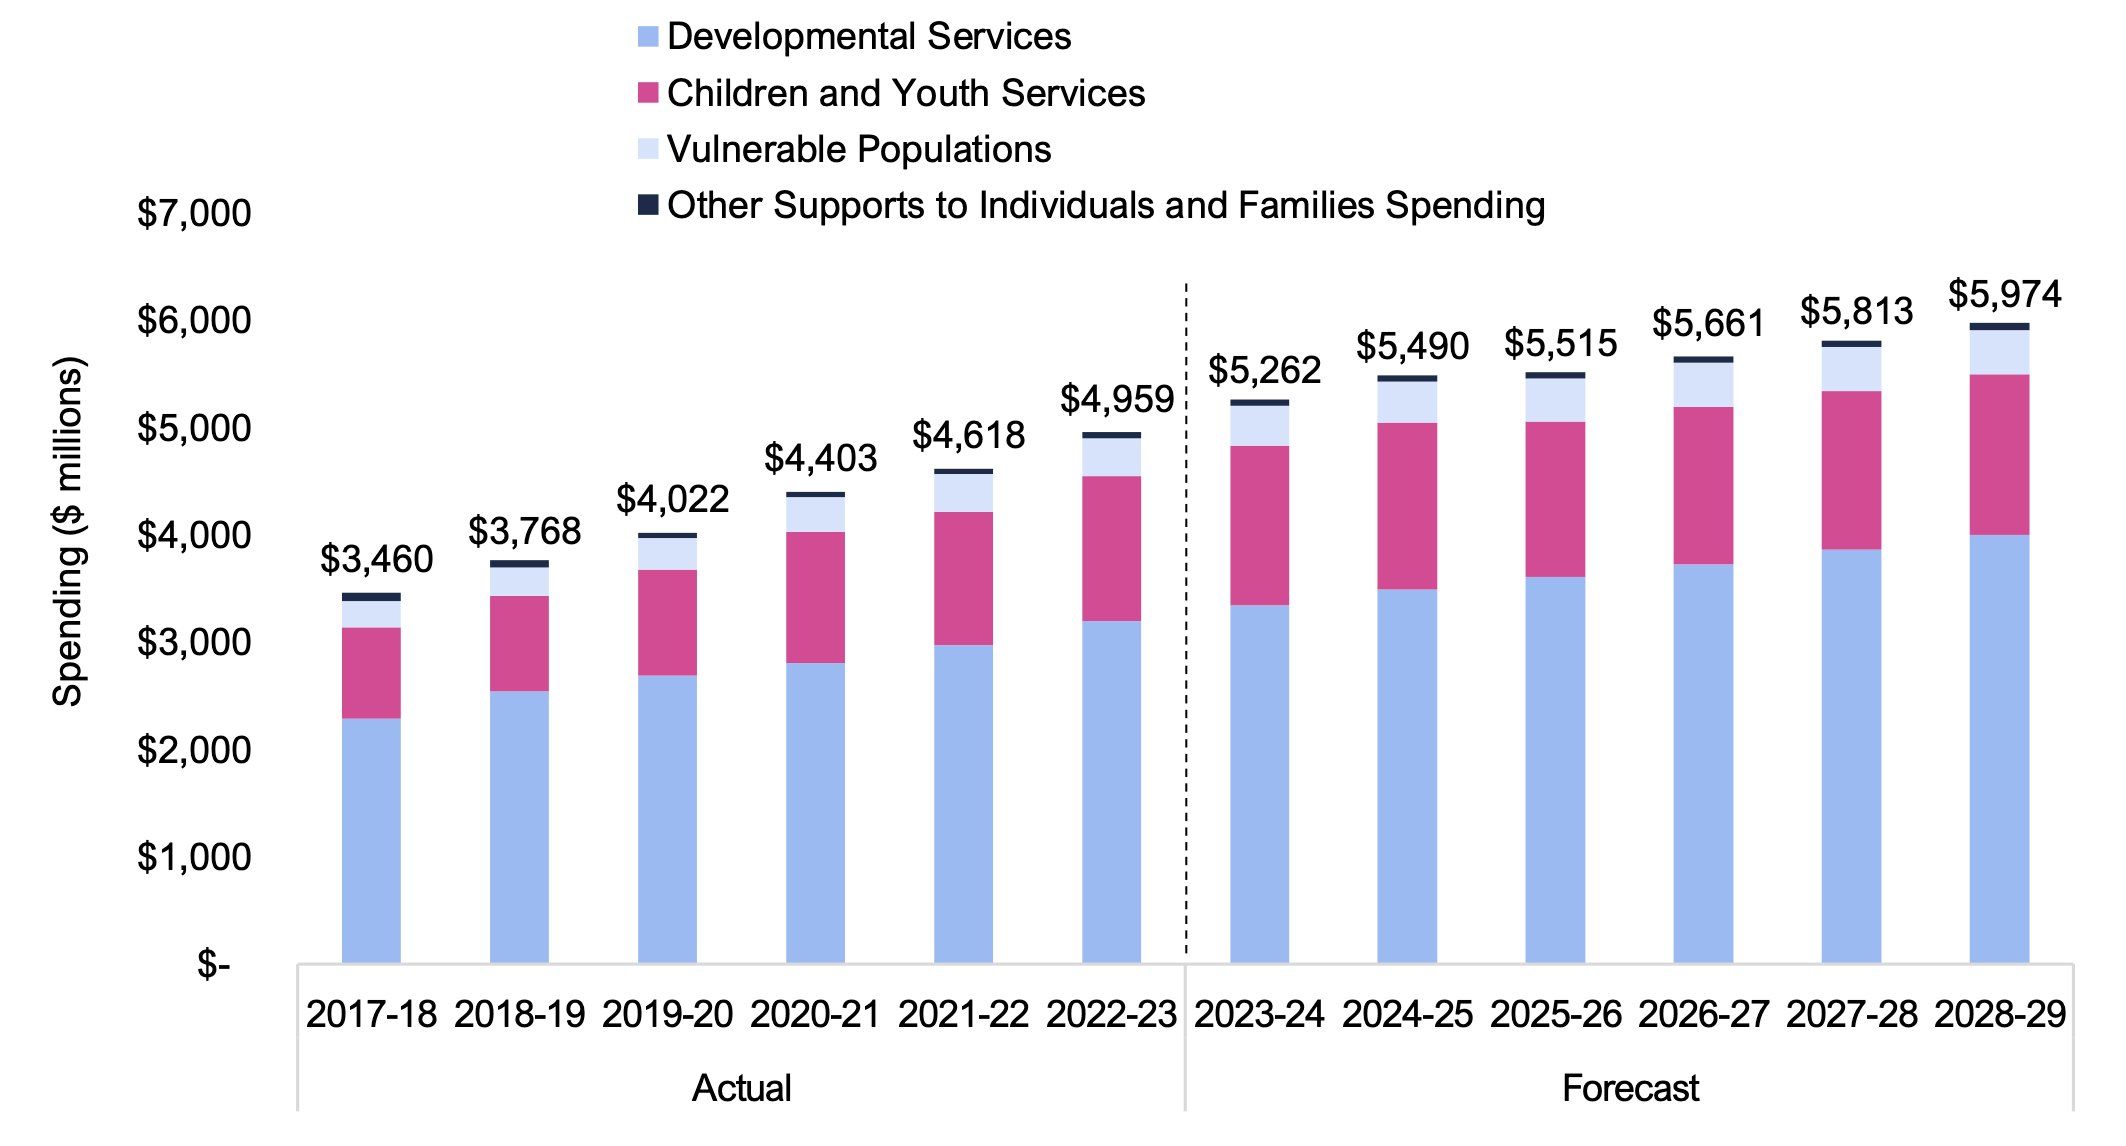
- This vote-item, which accounted for about 27 per cent of ministry spending in 2023-24, provides targeted supports for adults, youth and children with disabilities, victims of violence, and Indigenous peoples. The FAO projects that spending on Supports to Individuals and Families will grow at an average annual rate of 2.6 per cent from $5,262 million in 2023-24 to $5,974 million in 2028-29.
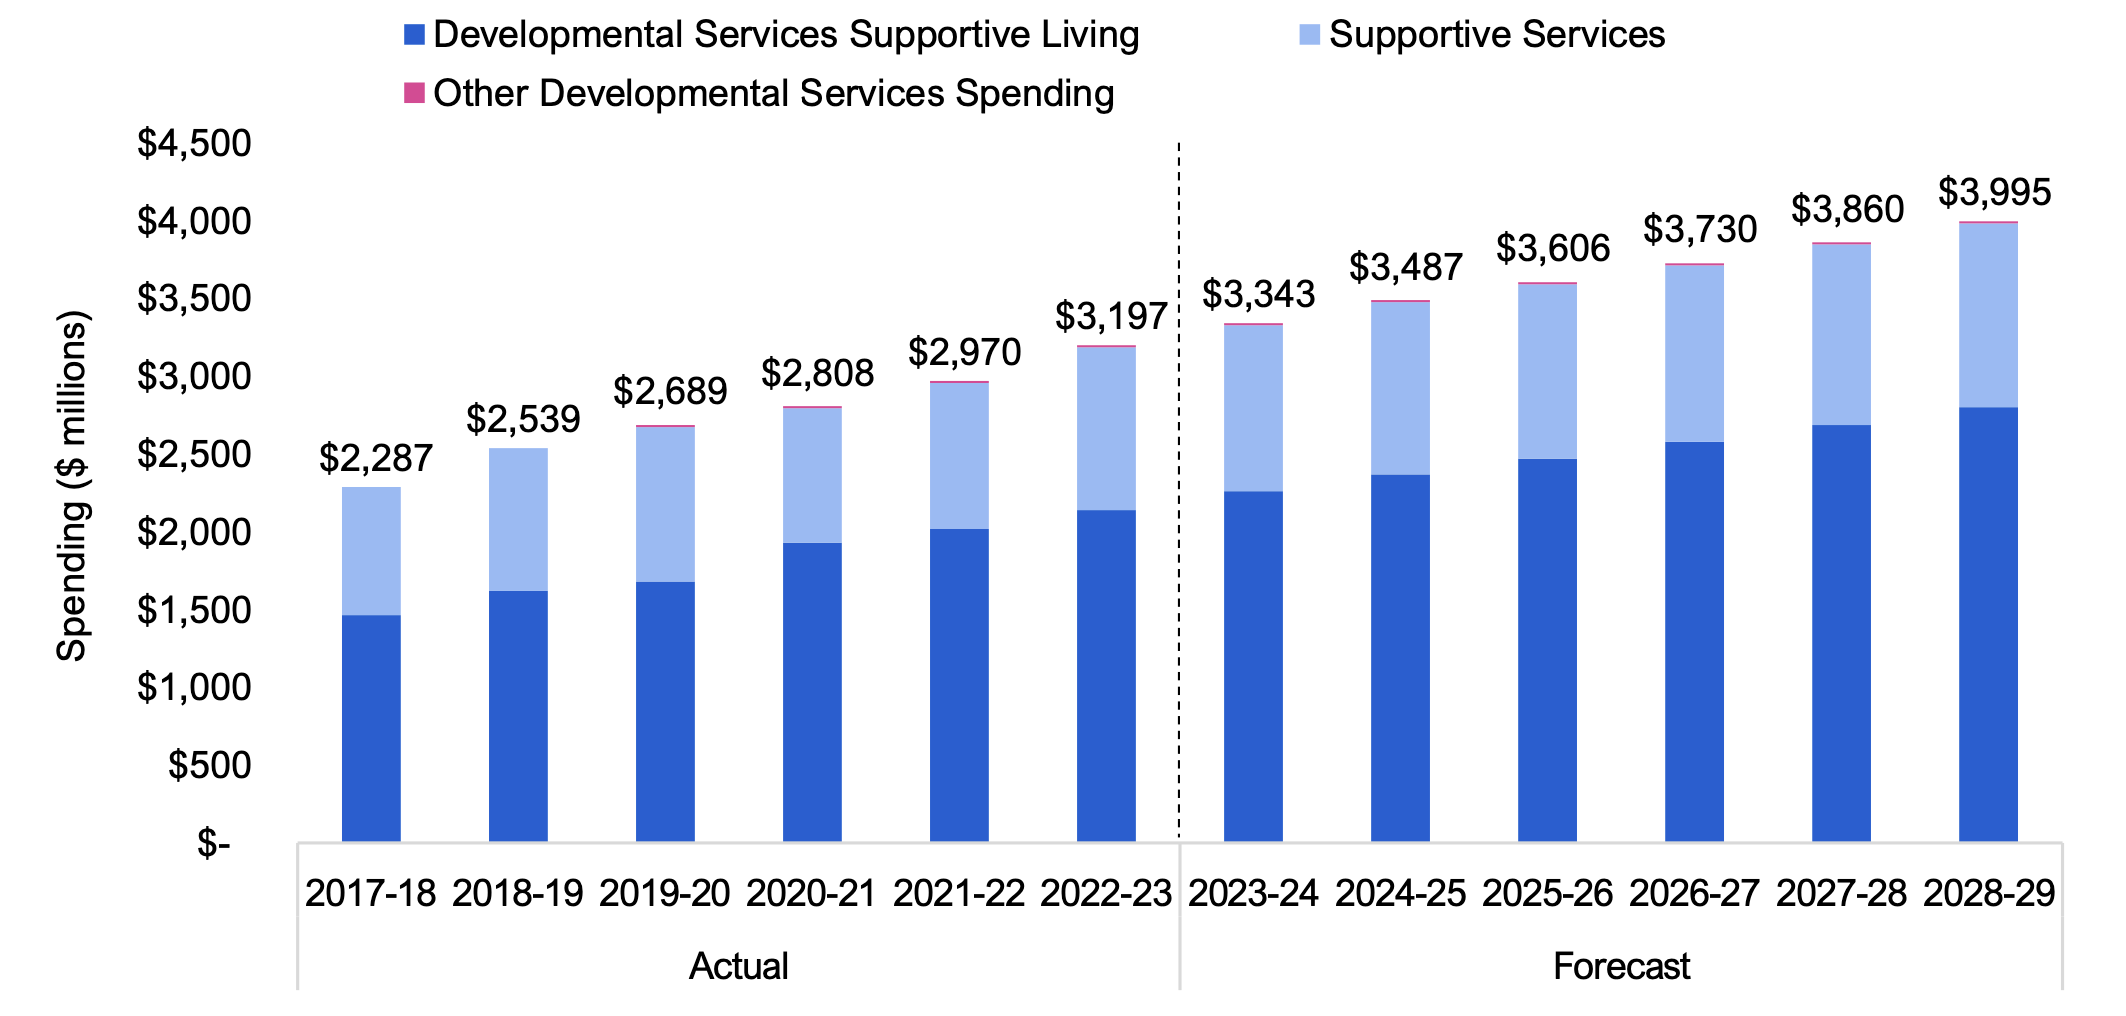
- The largest sub-item is Developmental Services, which is projected to grow at an average annual rate of 3.6 per cent from $3,343 million in 2023-24 to $3,995 million in 2028-29. Developmental Services consists of two key programs:
- Developmental Services Supportive Living: The FAO estimates that spending will grow at an average annual rate of 4.4 per cent from $2,262 million in 2023-24 to $2,804 million in 2028-29. Growth is driven by increases in spending per supportive living placement due to inflation and rising placement costs for new intakes. Based on the historical trend, the FAO projects that the number of clients served will remain constant over the projection.
- Supportive Services: The FAO estimates that spending will grow at an average annual rate of 2.0 per cent from $1,068 million in 2023-24 to $1,177 million in 2028-29. Spending growth is driven by increases in the number of Passport program recipients, a program that provides direct funding to eligible adults with developmental disabilities.
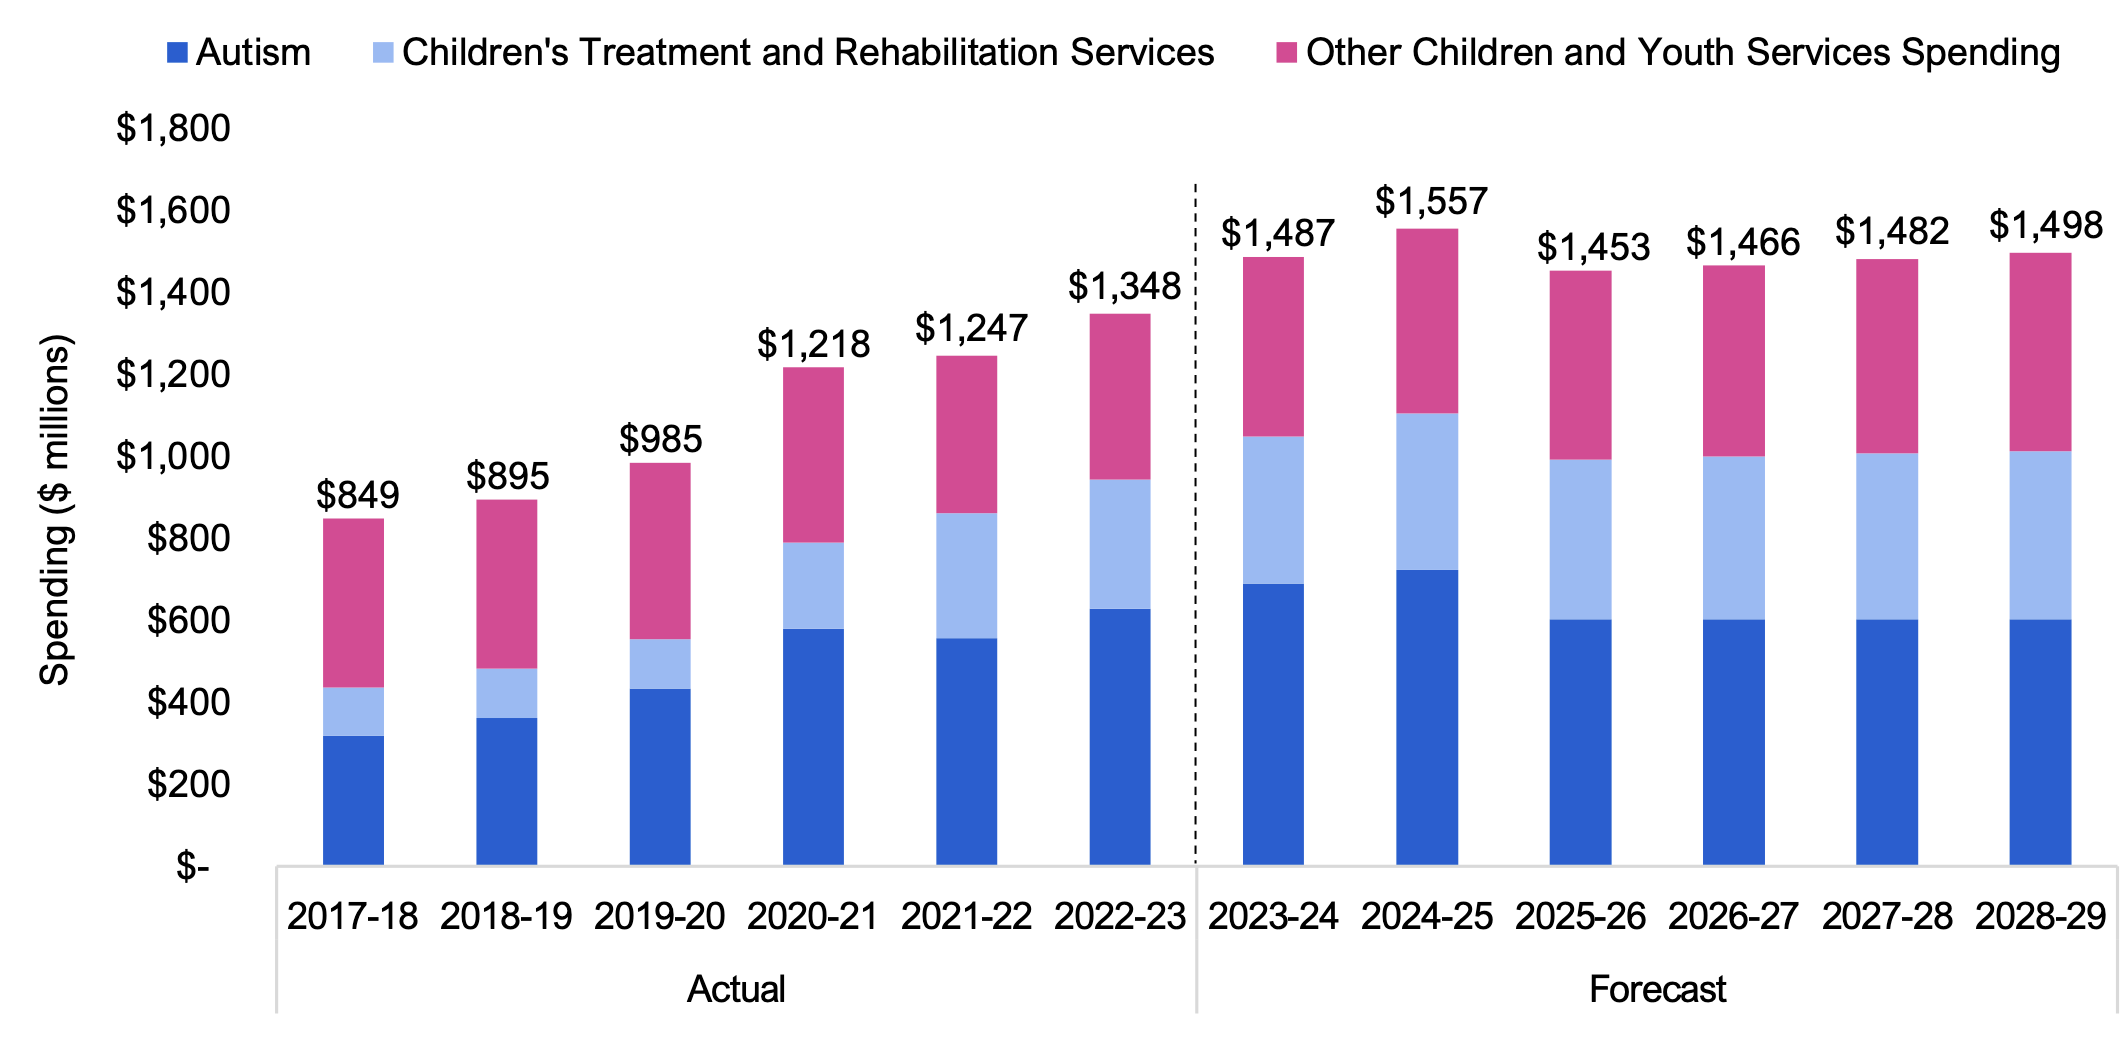
- The second largest sub-item is Children and Youth Services, which is projected to grow at an average annual rate of 0.2 per cent from $1,487 million in 2023-24 to $1,498 million in 2028-29. The largest program within Children and Youth Services is:
- Autism: In the 2024 Ontario Budget, the Province announced a one-time investment of $120 million for the Autism program, for a total budget of $723 million in 2024-25. Since the Province has not committed to maintain the additional spending, the FAO assumes that funding will return to $600 million from 2025-26 onwards, which has been the historical commitment since 2019.
- The FAO estimates that the annual Autism program funding level of $600 million, starting in 2025-26, would be sufficient to provide the full annual funding allocation for core clinical services to approximately 10,142 children and youth. If the Province were to maintain the Autism program’s 2024-25 funding of $723 million going forward, then the FAO estimates that this would be sufficient to provide the full annual funding allocation for core clinical services to 12,629 children and youth.
- Autism: In the 2024 Ontario Budget, the Province announced a one-time investment of $120 million for the Autism program, for a total budget of $723 million in 2024-25. Since the Province has not committed to maintain the additional spending, the FAO assumes that funding will return to $600 million from 2025-26 onwards, which has been the historical commitment since 2019.
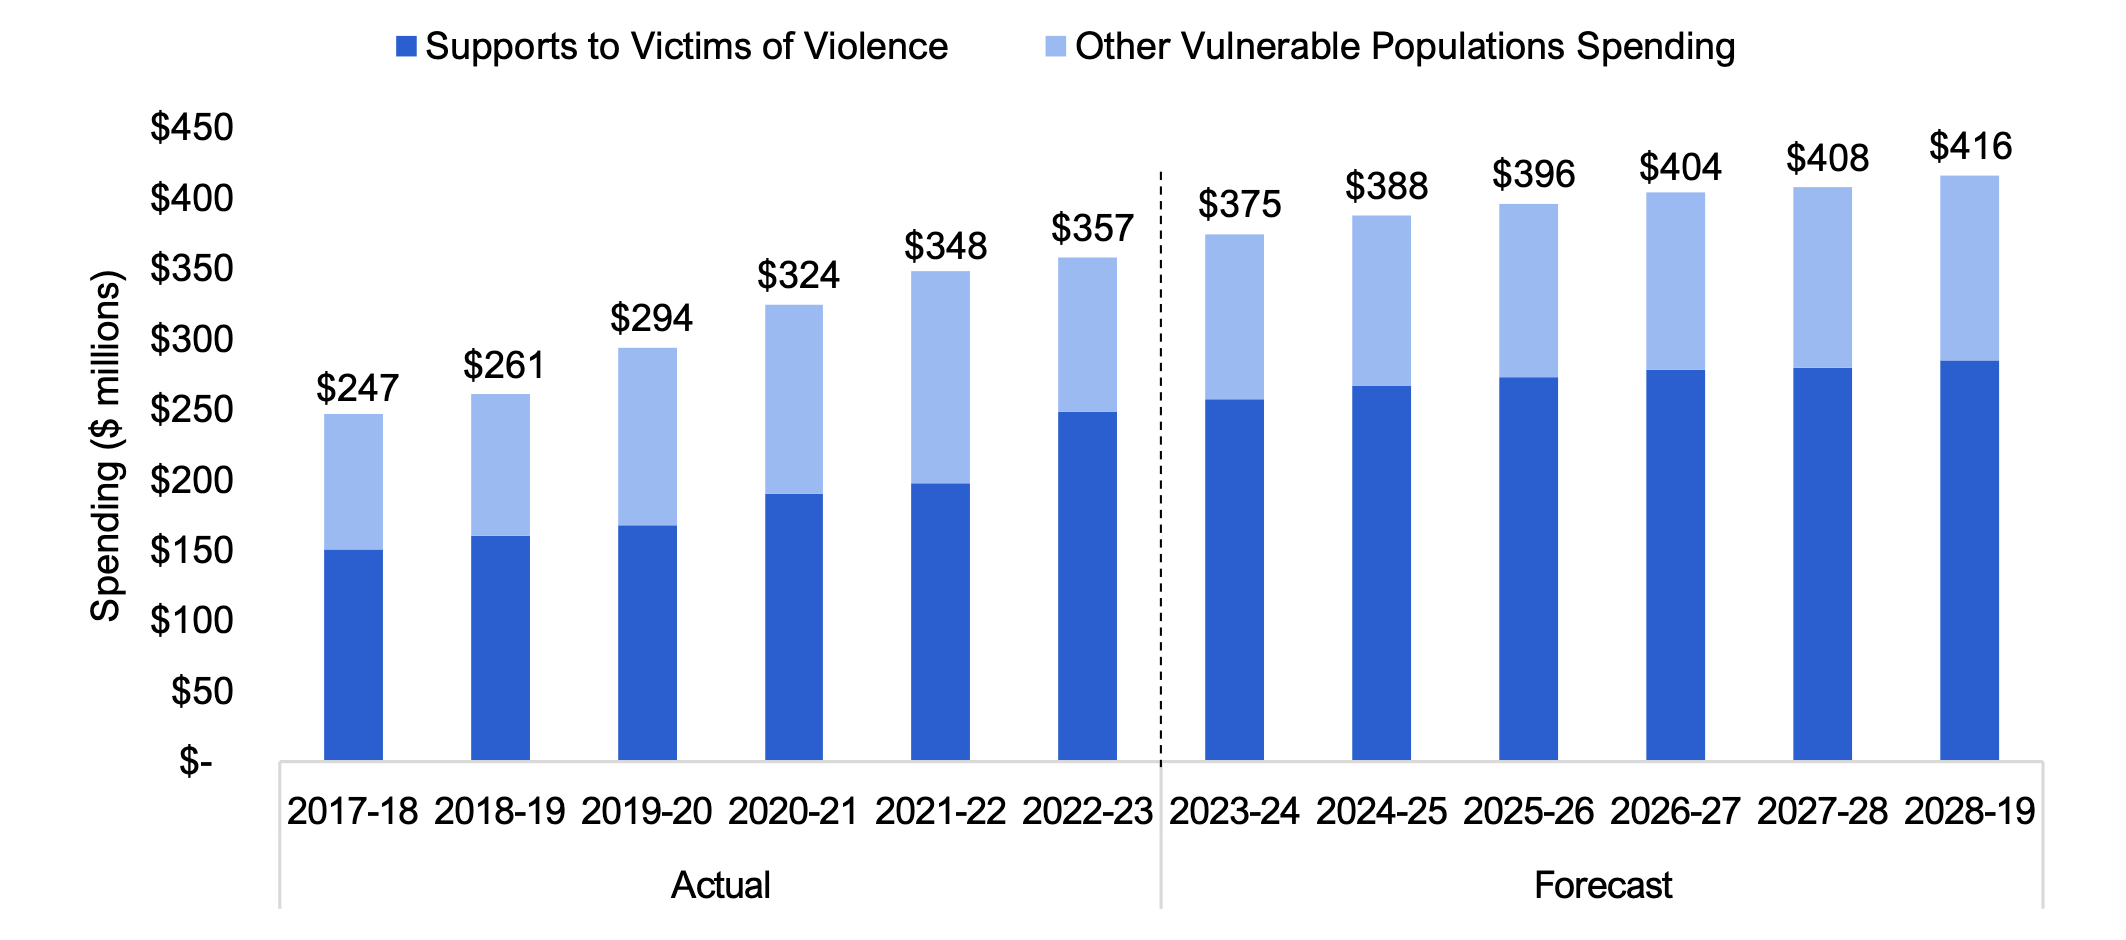
- The third largest sub-item is Vulnerable Populations, which is projected to grow at an average annual rate of 2.1 per cent from $375 million in 2023-24 to $416 million in 2028-29. The largest program within Vulnerable Populations is:
- Supports to Victims of Violence: The FAO estimates that spending will grow at an average annual rate of 2.1 per cent from $257 million in 2023-24 to $285 million in 2028-29. The FAO’s forecast is driven by inflation and assumes no growth in the number of beds at emergency shelters.
Children and Youth at Risk (Vote-Item 702-20)
- This vote-item, which accounted for about 11 per cent of ministry spending in 2023-24, provides targeted supports for children and youth in the child welfare system and the youth justice system. Spending is projected to grow at an average annual rate of 0.8 per cent from $2,167 million in 2023-24 to $2,255 million in 2028-29.
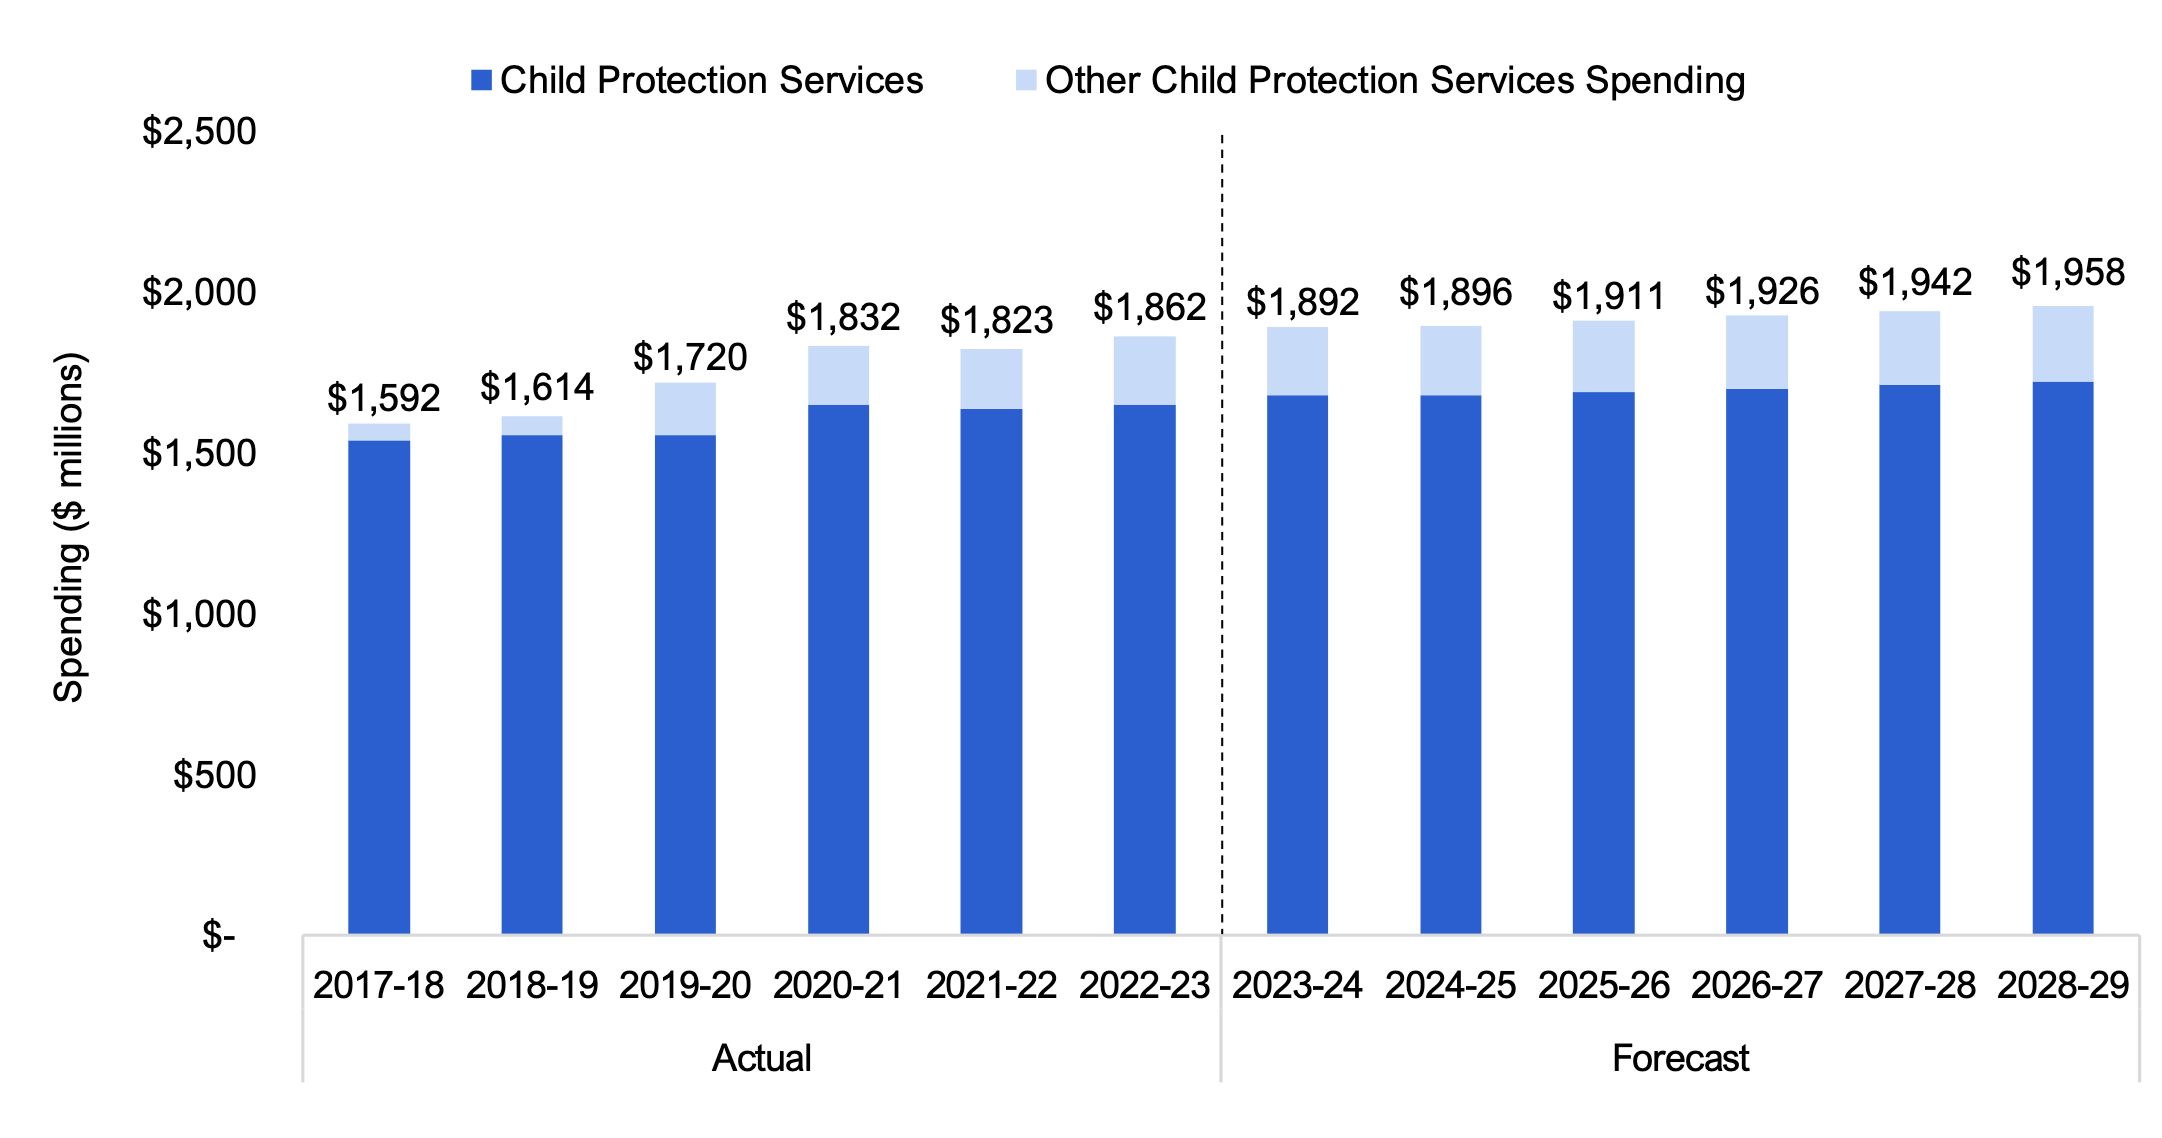
- The largest sub-item is Child Protection Services, which is projected to grow at an average annual rate of 0.7 per cent from $1,892 million in 2023-24 to $1,958 million in 2028-29. The FAO’s forecast assumes that the historical trend of flatlined direct service spending will continue, partially due to declines in ongoing protection cases, which have decreased by 49.6 per cent from a peak of 28,236 in 2012-13 to an estimated 14,230 in 2023-24. The largest group within ongoing protection cases is children and youth in the care of a Children’s Aid Society, which experienced a decline of 32.7 per cent from 17,273 in 2012-13 to 11,632 in 2023-24.
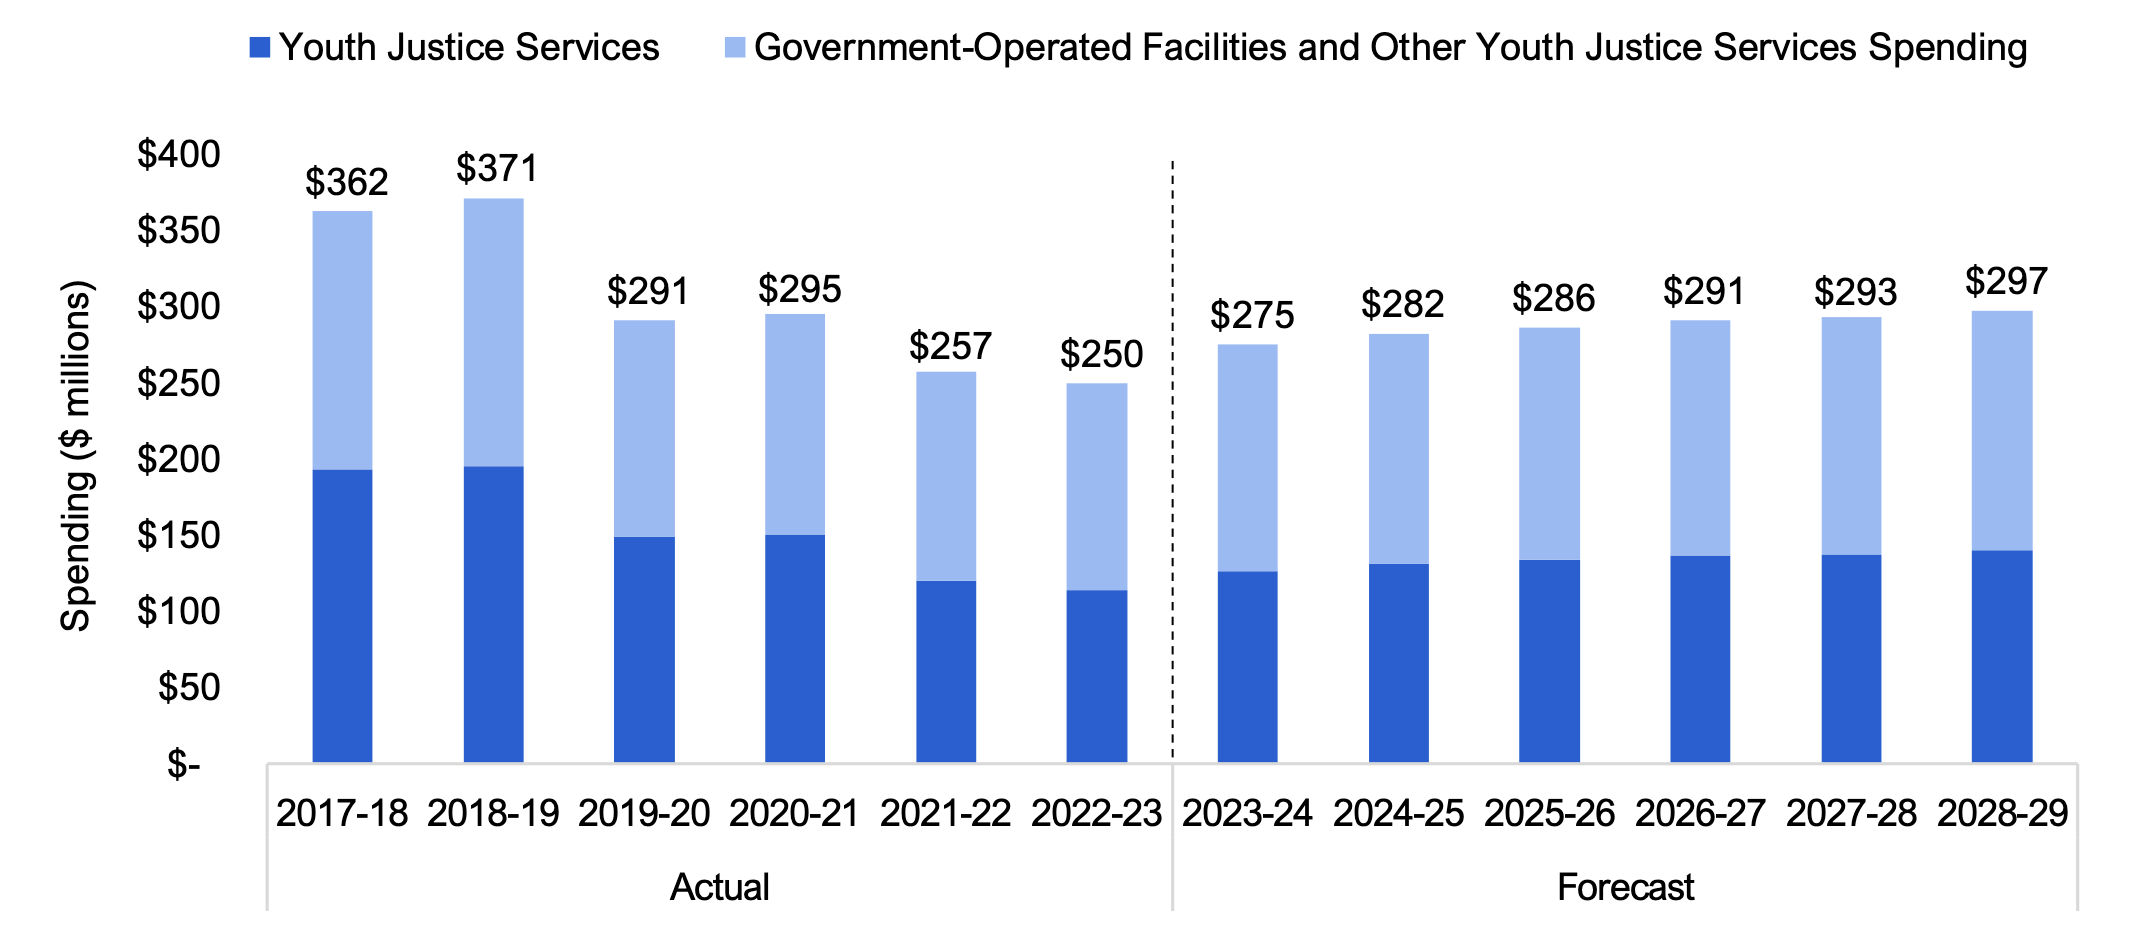
- The second largest sub-item is Youth Justice Services, which is projected to grow at an average annual rate of 1.6 per cent from $275 million in 2023-24 to $297 million in 2028-29. The FAO assumes that capacity in the youth justice system will remain constant at 2023-24 levels, and spending growth will be driven primarily by wage growth and inflation.
Ontario Child Benefit (Vote-Item 702-22)
- This vote-item, which accounted for about six per cent of ministry spending in 2023-24, provides tax-free payments to help low- and moderate-income families provide for their children. Spending is projected to grow at an average annual rate of 3.6 per cent from $1,236 million in 2023-24 to $1,472 million in 2028-29. The FAO’s projection is driven by projected growth in benefit rates and in Ontario’s child population.
All Other Spending
- All Other Spending, which accounted for about two per cent of ministry spending in 2023-24, includes the Ministry Administration Program (Vote 701), Family Responsibility Office (Vote-Item 702-7), Children, Youth and Social Services Information and Information Technology Cluster (Vote-Item 702-26), the Office of Women’s Social and Economic Opportunity (Vote-Item 702-28), the Children, Community and Social Services Capital Program (Vote 704), statutory spending, and consolidation adjustments. Spending is projected to decline at an average annual rate of -2.4 per cent from $389 million in 2023-24 to $343 million in 2028-29, largely due to projected declines in capital spending and consolidation adjustments.
2. Introduction
This report reviews the Ministry of Children, Community and Social Services’ (MCCSS) spending plan in the 2024 Ontario Budget and the 2024-25 Expenditure Estimates. The report is organized as follows:
- Chapter 3 provides an overview of the ministry’s spending plan in the 2024 Ontario Budget and the 2024-25 Expenditure Estimates.
- Chapter 4 discusses the FAO’s projection for MCCSS spending from 2023-24 to 2028-29, based on current program design and announced commitments, and compares this spending projection against the ministry’s spending plan in the 2024 Ontario Budget.
- Chapters 5 through 9 review the FAO’s projected spending by the ministry’s four largest vote-items and all other spending, and identify key assumptions, issues and uncertainties behind the FAO’s spending forecast.
3. Spending Plan
Overview
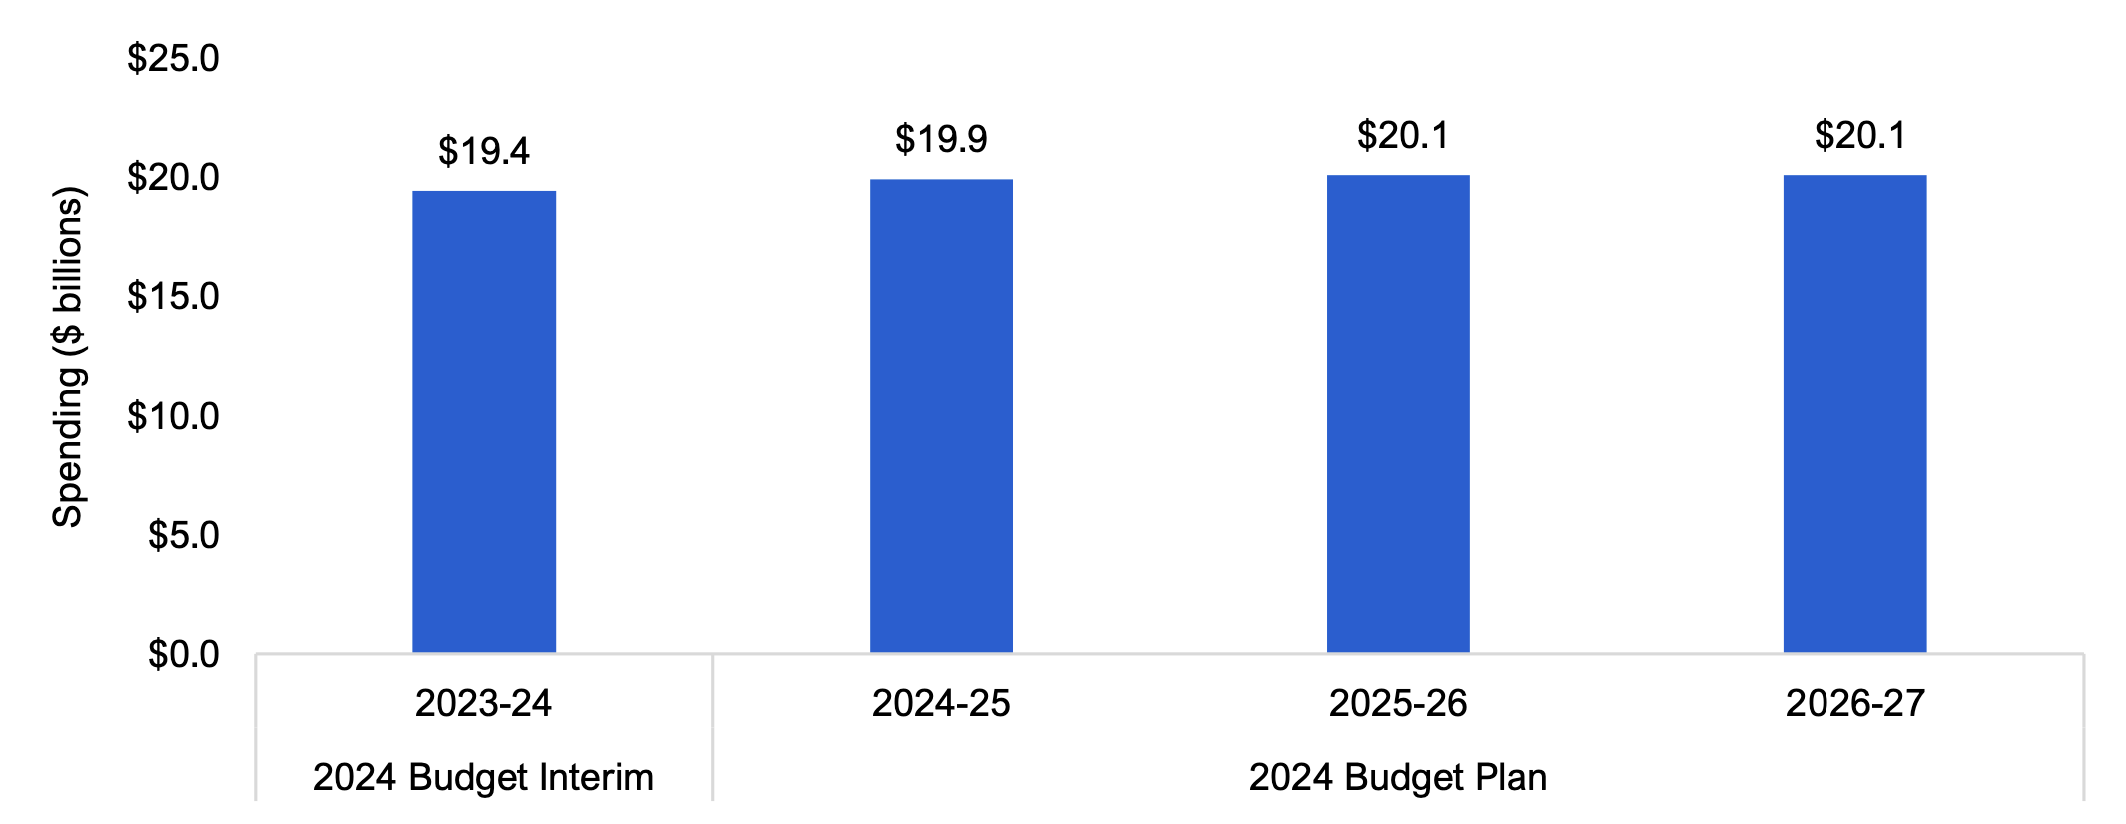
In the 2024 Ontario Budget, the Province projects that the Ministry of Children, Community and Social Services spent $19.4 billion in 2023-24. Going forward, MCCSS spending is expected to increase to $19.9 billion in 2024-25 and $20.1 billion in 2025-26 and 2026-27. Overall, from 2023-24 to 2026-27, the Province plans to increase MCCSS spending by an average annual rate of 1.1 per cent.
Figure 3.1 Ministry of Children, Community and Social Services spending plan in the 2024 Ontario Budget, $ billions
Source: 2024 Ontario Budget
Accessible version
| 2024 Budget Interim | 2024 Budget Plan | |||
|---|---|---|---|---|
| 2019-20 | 2022-23 | 2023-24 | 2024-25 | |
| MCCSS Spending Plan | 19.4 | 19.9 | 20.1 | 20.1 |
2024-25 Spending Plan by Expenditure Estimates Categories
MCCSS’s 2024-25 spending plan of $19.9 billion is detailed in the 2024-25 Expenditure Estimates. In the Expenditure Estimates, the ministry’s spending plan is grouped into three broad categories:
- $20.0 billion in ‘Supply Bill spending’ that is authorized annually by the legislature (known as spending ‘to be voted’);
- -$138 million in ‘consolidation adjustments’, which mainly consist of adjustments to account for MCCSS spending that is recorded as spending in other program sectors; and
- $77 million in spending that is authorized by standalone legislation (known as ‘statutory spending’).
The $20.0 billion in Supply Bill spending is divided into programs called votes, sub-programs called items, accounts and then account details. MCCSS spending has three votes, with those votes containing 11 items. The largest vote is the Children and Adult Services Program at $19.7 billion or 98.9 per cent of planned MCCSS spending in 2024-25. Within the Children and Adult Services Program, the largest vote-item is Financial and Employment Supports at $10.5 billion or 52.7 per cent of planned ministry spending.
Consolidation adjustments of -$138 million include $146 million in spending related to revenues raised by Children’s Aid Societies from third parties (such as federal government contributions through the Children’s Special Allowances Program). This is more than offset by a $283 million negative adjustment, primarily to account for MCCSS spending that is reflected as spending in the health, education and postsecondary education sectors.
Standalone legislation (i.e., spending authorized by legislation other than the Supply Bill) accounts for $77 million or 0.4 per cent of planned MCCSS spending. This spending is largely for bad debt expense and amortization.
| Vote | Item | Program Name | 2024-25 Expenditure Estimates ($ millions) |
Share of Total (%) |
|---|---|---|---|---|
| 701 | 1 | Ministry Administration | 69 | 0.3 |
| 2 | Strategic Policy | 28 | 0.1 | |
| Total Ministry Administration Program (Vote 701) | 98 | 0.5 | ||
| 702 | 3 | Financial and Employment Supports | 10,506 | 52.7 |
| 7 | Family Responsibility Office | 41 | 0.2 | |
| 20 | Children and Youth at Risk | 2,180 | 10.9 | |
| 21 | Supports to Individuals and Families | 5,517 | 27.7 | |
| 22 | Ontario Child Benefit | 1,333 | 6.7 | |
| 26 | Children, Youth and Social Services Information and Information Technology Cluster | 80 | 0.4 | |
| 28 | Office of Women’s Social and Economic Opportunity | 54 | 0.3 | |
| Total Children and Adult Services Program (Vote 702) | 19,712 | 98.9 | ||
| 704 | 1 | Children, Community and Social Services Infrastructure | 178 | 0.9 |
| 2 | Children, Community and Social Services Business Applications and Software | <1 | 0.0 | |
| Total Children, Community and Social Services Capital Program (Vote 704) | 178 | 0.9 | ||
| Total Supply Bill (Voted) Spending | 19,987 | 100.3 | ||
| Consolidation Adjustments | -138 | -0.7 | ||
| Standalone Legislation (i.e., Statutory) Spending | 77 | 0.4 | ||
| Total Ministry of Children, Community and Social Services Spending Plan | 19,926 | 100.0 |
Over 98 per cent of planned MCCSS spending in 2024-25 flows through four vote-items:
- Financial and Employment Supports (Vote-Item 702-3) is the largest vote-item, representing 52.7 per cent of planned ministry spending. This vote-item primarily consists of transfer payments that provide financial assistance to households in financial need through the Ontario Disability Support Program (ODSP) and Ontario Works (OW) program. These households can also receive employment supports and benefits to help them find work, and health benefits such as help paying for medications under the Ontario Drug Benefit Plan.
- Supports to Individuals and Families (Vote-Item 702-21) represents 27.7 per cent of planned ministry spending. This vote-item provides targeted supports for adults, youth and children with disabilities, victims of violence, and Indigenous peoples.
- Children and Youth at Risk (Vote-Item 702-20) represents 10.9 per cent of planned ministry spending. This vote-item funds child protection, child welfare and youth justice services.
- The Ontario Child Benefit (Vote-Item 702-22) represents 6.7 per cent of planned ministry spending. This vote-item is a tax-free payment to help low- to moderate-income families provide for their children.
- All Other Spending represents the remaining 2.0 per cent of planned ministry spending in 2024-25. This category includes the Ministry Administration Program (Vote 701), Family Responsibility Office (Vote-Item 702-7), Children, Youth and Social Services Information and Information Technology Cluster (Vote-Item 702-26), the Office of Women’s Social and Economic Opportunity (Vote-Item 702-28), the Children, Community and Social Services Capital Program (Vote 704), statutory spending, and consolidation adjustments.
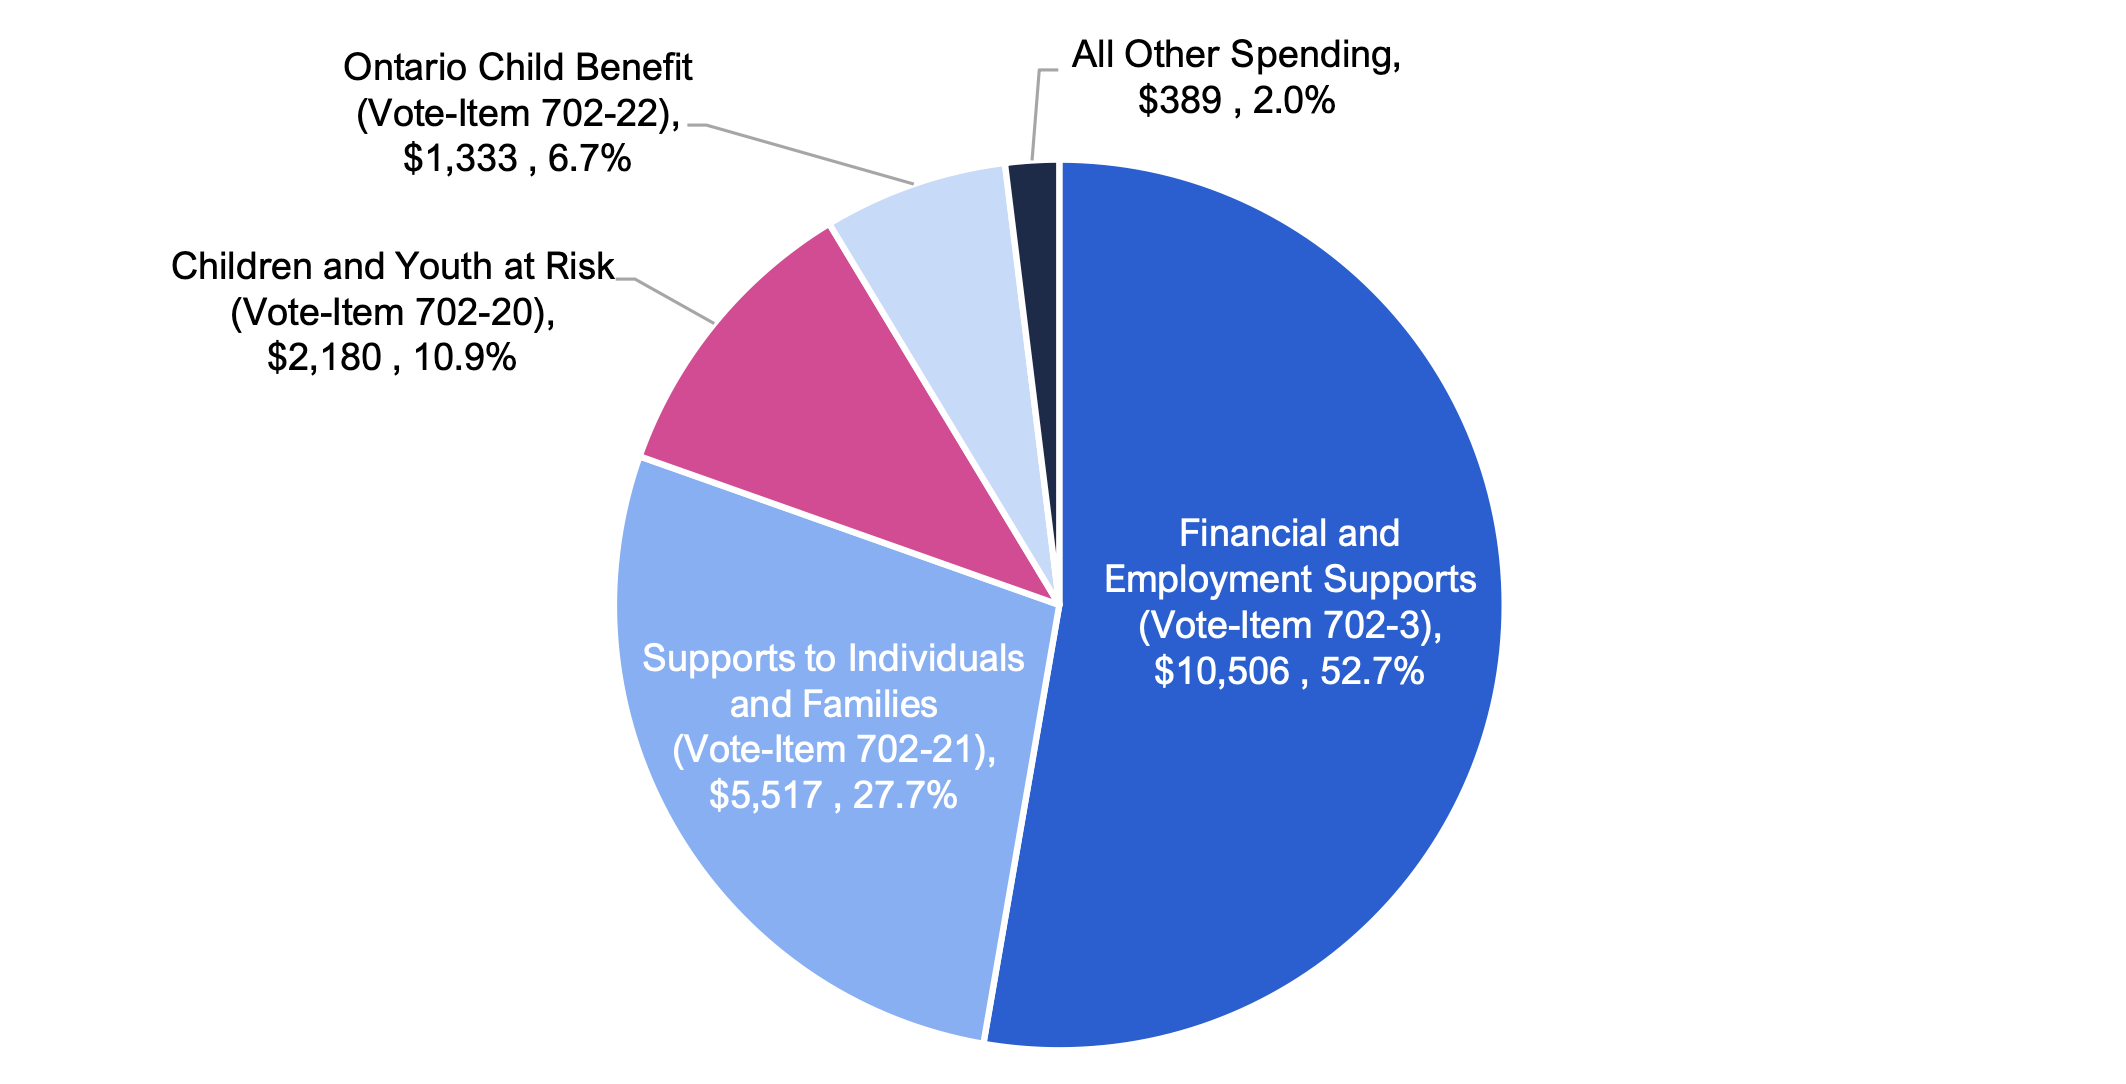
Figure 3.2 Ministry of Children, Community and Social Services 2024-25 spending plan by the largest vote-items, $ millions
Source: 2024-25 Expenditure Estimates.
Accessible version
| MCCSS Spending Plan by Largest Vote-Items | 2024-25 Expenditure Estimates ($ millions) | Share of Total (%) |
|---|---|---|
| Financial and Employment Supports (Vote-Item 702-3) | 10,506 | 52.7 |
| Supports to Individuals and Families (Vote-Item 702-21) | 5,517 | 27.7 |
| Children and Youth at Risk (Vote-Item 702-20) | 2,180 | 10.9 |
| Ontario Child Benefit (Vote-Item 702-22) | 1,333 | 6.7 |
| All Other Spending | 389 | 2.0 |
4. Spending Plan Analysis
The remainder of this report reviews the FAO’s projection for MCCSS spending from 2023-24 to 2028-29. This chapter compares the FAO’s projection against MCCSS’s spending plan in the 2024 Ontario Budget. Chapters 5 through 8 explain the FAO’s projected spending by the four largest vote-items. Chapter 9 reviews the FAO’s spending projection for all other spending.
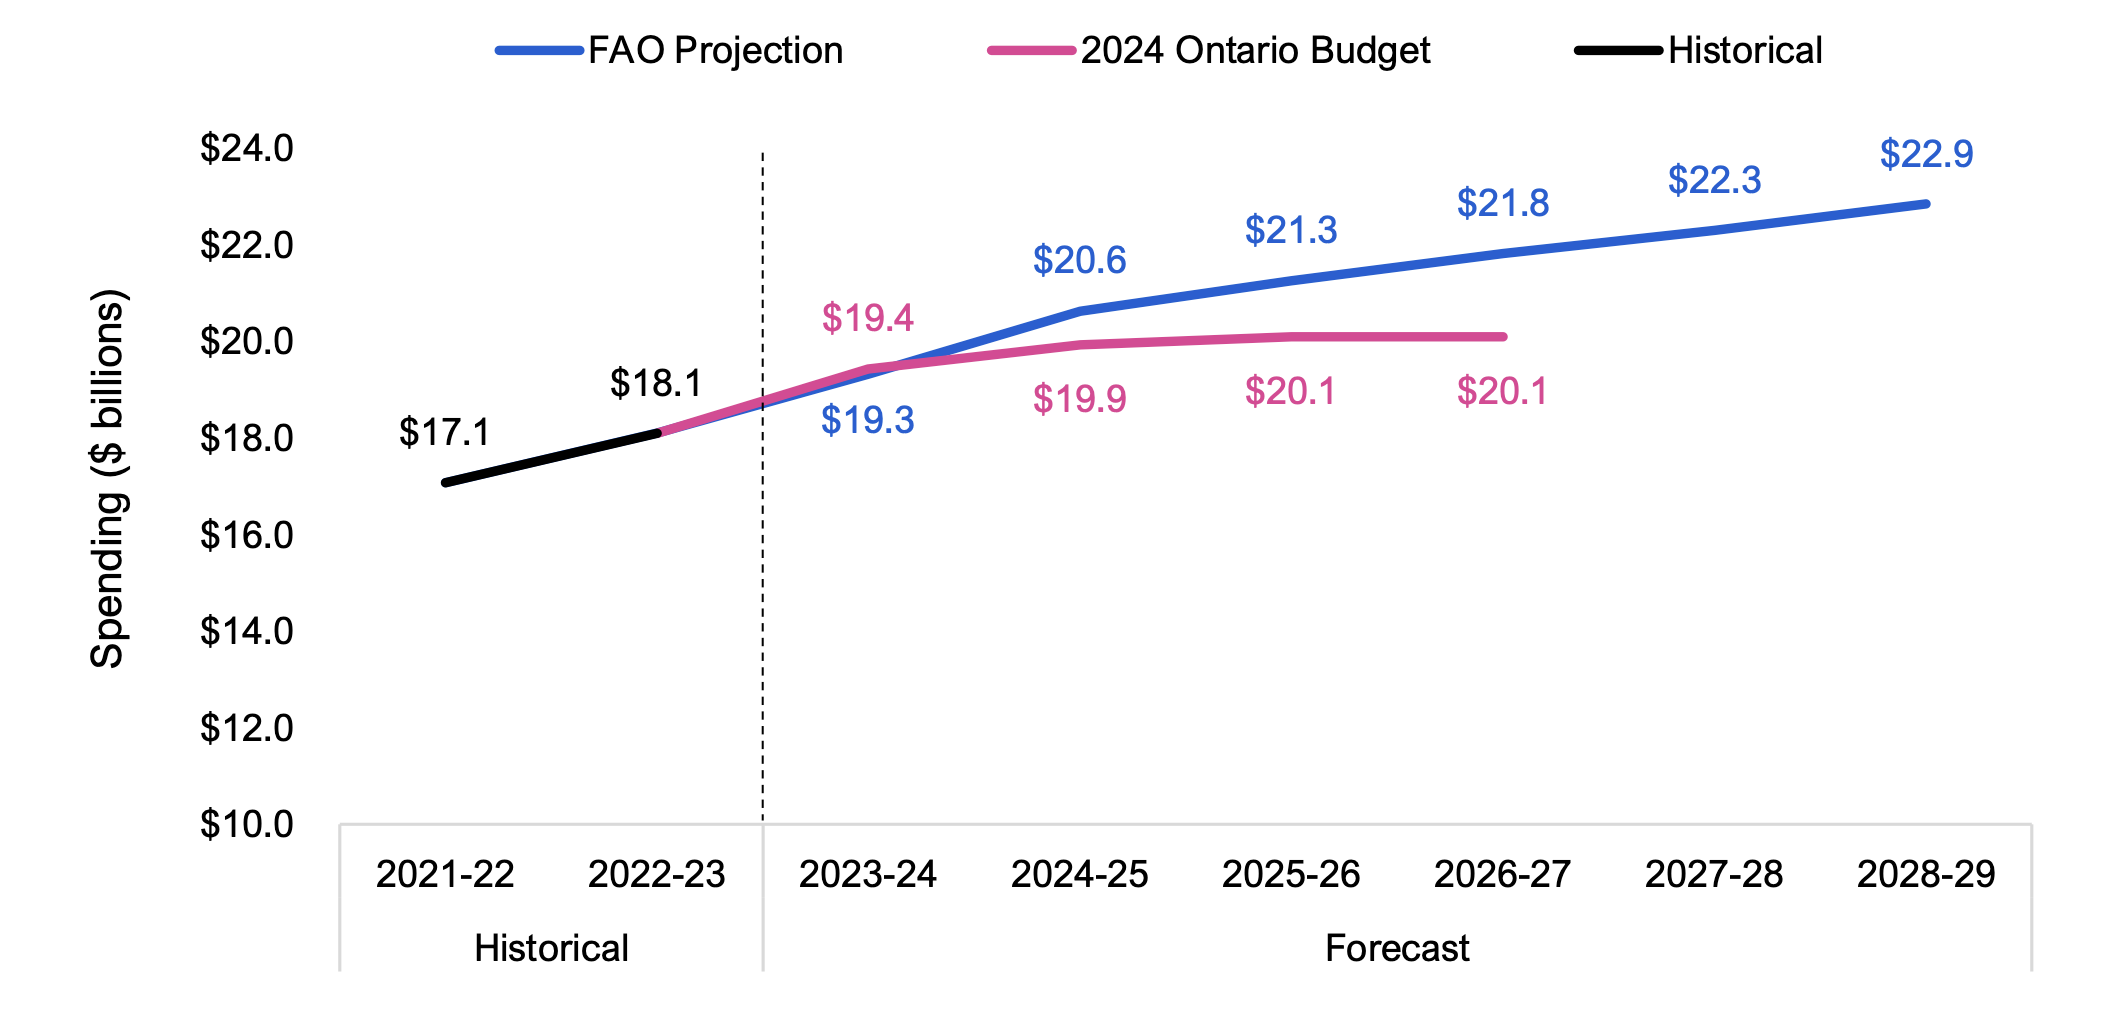
Based on current program design and announced commitments, the FAO projects MCCSS spending will grow at an average annual rate of 3.4 per cent, from $19.3 billion in 2023-24 to $22.9 billion in 2028-29. In contrast, in the 2024 Ontario Budget, the Province projects MCCSS spending will grow at an average annual rate of 1.1 per cent, from $19.4 billion in 2023-24 to $20.1 billion in 2026-27, the last year of the government’s projection.[2]
Figure 4.1 MCCSS spending projections, FAO vs. 2024 Ontario Budget, $ billions
Source: Public Accounts of Ontario, 2024 Ontario Budget, and FAO analysis of information provided by MCCSS and Treasury Board Secretariat
Accessible version
| Historical | Forecast | |||||||
|---|---|---|---|---|---|---|---|---|
| 2021-22 | 2022-23 | 2023-24 | 2024-25 | 2025-26 | 2026-27 | 2027-28 | 2028-29 | |
| Historical | 17.1 | 18.1 | ||||||
| 2024 Ontario Budget | 19.4 | 19.9 | 20.1 | 20.1 | ||||
| FAO Projection | 19.3 | 20.6 | 21.3 | 21.8 | 22.3 | 22.9 | ||
For the 2023-24 fiscal year, which ended on March 31, 2024, the FAO estimates that MCCSS spent $19.3 billion, $0.1 billion less than projected by the Province in the 2024 Ontario Budget. This difference is largely due to the FAO forecast incorporating government spending information as of April 22, 2024, while the 2024 Ontario Budget, which was released on March 26, 2024, was based on earlier information.
Over the three-year outlook in the 2024 Ontario Budget, from 2024-25 to 2026-27, the FAO projects that the spending plan for MCCSS is not sufficient to fund existing ministry programs and announced commitments. The FAO projects funding shortfalls of $0.7 billion in 2024-25, growing to $1.2 billion in 2025-26 and $1.8 billion in 2026-27. Cumulatively, over the three-year period from 2024-25 to 2026-27, the Province has allocated $3.7 billion less than required for MCCSS to fund its existing programs and announced commitments.
The $0.7 billion shortfall in 2024-25 is largely due to differences in the projected cost of the Ontario Works – Financial Assistance (OW) program. MCCSS’s spending request for the OW program of $2.7 billion in the 2024-25 Expenditure Estimates is $0.7 billion lower than the FAO’s estimated $3.3 billion cost for the program, likely due to the FAO’s higher caseload projection. Beyond 2024-25, the Province does not publicly publish spending by program; therefore, the FAO cannot disclose additional details on the source of the funding shortfalls in 2025-26 and 2026-27.
| Vote-Item | 2023-24 FAO Spending Projection | 2028-29 FAO Spending Projection | Average Annual Growth Rate (%) 2023-24 to 2028-29 | Share of Growth (%) 2023-24 to 2028-29 |
|---|---|---|---|---|
| Financial and Employment Supports (Vote-Item 702-3) | 10,272 | 12,808 | 4.5% | 71.9% |
| Ontario Disability Support Program – Financial Assistance | 5,866 | 7,703 | 5.6% | 52.1% |
| Ontario Works – Financial Assistance | 2,875 | 3,265 | 2.6% | 11.1% |
| Ontario Drug Benefit Plan | 1,104 | 1,436 | 5.4% | 9.4% |
| Other Financial and Employment Supports Spending | 427 | 404 | -1.1% | -0.7% |
| Supports to Individuals and Families (Vote-Item 702-21) | 5,262 | 5,974 | 2.6% | 20.2% |
| Developmental Services | 3,343 | 3,995 | 3.6% | 18.5% |
| Children and Youth Services | 1,487 | 1,498 | 0.2% | 0.3% |
| Vulnerable Populations | 375 | 416 | 2.1% | 1.2% |
| Other Supports to Individuals and Families Spending | 58 | 65 | 2.3% | 0.2% |
| Children and Youth at Risk (Vote-Item 702-20) | 2,167 | 2,255 | 0.8% | 2.5% |
| Child Protection Services | 1,892 | 1,958 | 0.7% | 1.9% |
| Youth Justice Services | 275 | 297 | 1.6% | 0.6% |
| Ontario Child Benefit (Vote-Item 702-22) | 1,236 | 1,472 | 3.6% | 6.7% |
| All Other Spending | 389 | 343 | -2.4% | -1.3% |
| Total Ministry Spending | 19,326 | 22,853 | 3.4% | 100% |
The above table breaks down the FAO’s spending projection by the four largest vote-items and all other spending, highlighting the largest components of MCCSS spending and spending growth. Overall, the FAO projects MCCSS spending will grow at an average annual rate of 3.4 per cent from $19.3 billion in 2023-24 to $22.9 billion in 2028-29.
- Over two-thirds of the growth in MCCSS spending stems from increased Financial and Employment Supports spending, which is projected to grow at an average annual rate of 4.5 per cent from 2023-24 to 2028-29, driven largely by increases in ODSP – Financial Assistance payments.
- Supports to Individuals and Families spending is projected to grow at an average annual rate of 2.6 per cent, driven by increases in Developmental Services spending.
- Children and Youth at Risk spending is projected to grow at an average annual rate of 0.8 per cent.
- Spending on the Ontario Child Benefit is projected to grow at an average annual rate of 3.6 per cent.
- All Other Spending is projected to decline by an average annual rate of -2.4 per cent.
The remaining chapters describe the four largest vote-items and all other spending, discuss the FAO’s spending outlook from 2023-24 to 2028-29, and identify key assumptions as well as relevant client and performance metrics.
5. Financial and Employment Supports (Vote-Item 702-3)
The Financial and Employment Supports vote-item includes spending for programs that provide financial assistance to households in financial need through the Ontario Disability Support Program (ODSP) and Ontario Works program (OW). These households can also receive employment supports and benefits to help them find work, and health benefits such as help paying for medications under the Ontario Drug Benefit Plan. These programs, often referred to as social assistance, accounted for an estimated 53.2 per cent of total ministry spending in 2023-24. Spending for Financial and Employment Supports largely consists of three transfer payments: Ontario Disability Support Program – Financial Assistance, Ontario Works – Financial Assistance and Ontario Drug Benefit Plan.
The FAO projects that spending on Financial and Employment Supports will grow at an average annual rate of 4.5 per cent between 2023-24 and 2028-29, from $10,272 million to $12,808 million. This includes:
- an increase in spending on Ontario Disability Support Program – Financial Assistance from $5,866 million to $7,703 million (a 5.6 per cent average annual growth rate);
- an increase in spending on Ontario Works – Financial Assistance from $2,875 million to $3,265 million (a 2.6 per cent average annual growth rate);
- an increase in spending on Ontario Drug Benefit Plan for ODSP and OW recipients from $1,104 million to $1,436 million (a 5.4 per cent average annual growth rate); and
- a decrease in Other Financial and Employment Supports Spending from $427 million to $404 million (a -1.1 per cent average annual decline).
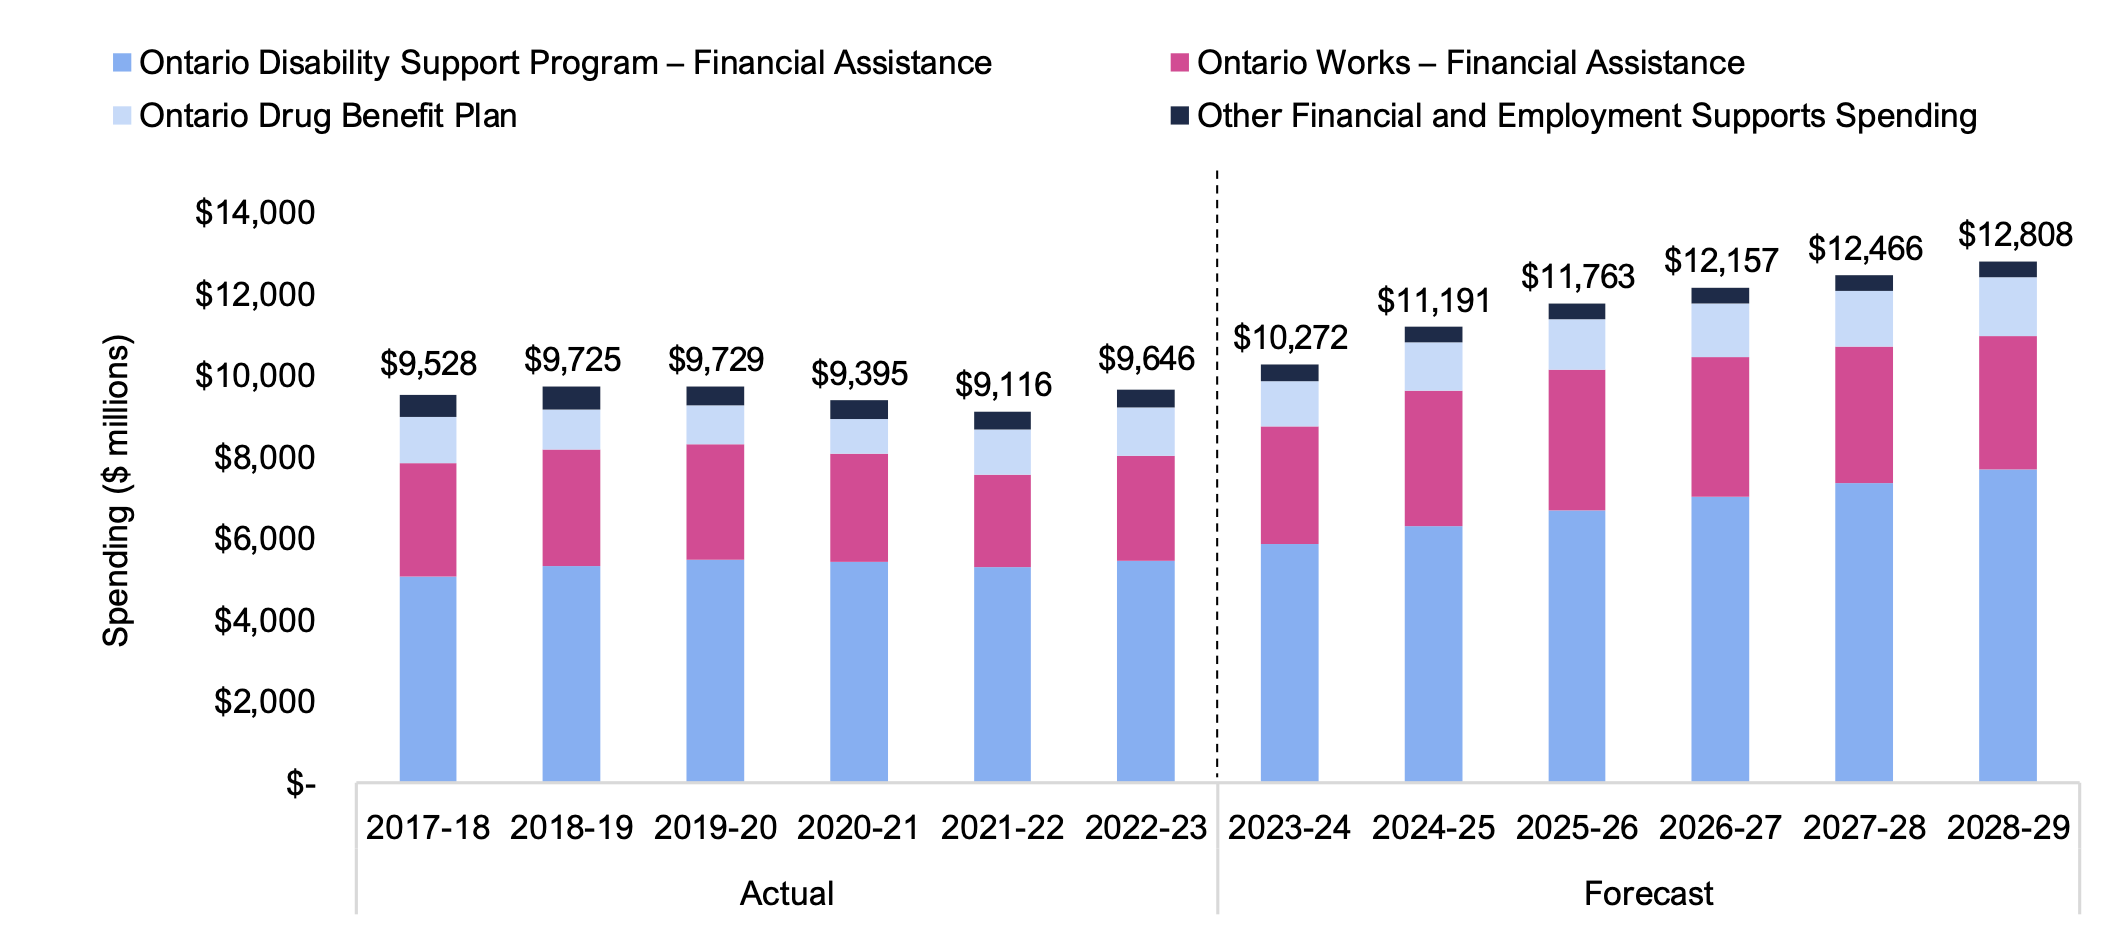
Figure 5.1 FAO projected Financial and Employment Supports (Vote-Item 702-3) spending, $ millions
Source: Public Accounts of Ontario, 2024 Ontario Budget, and FAO analysis of information provided by MCCSS and Treasury Board Secretariat
Accessible version
| Actual | Forecast | |||||||||||
|---|---|---|---|---|---|---|---|---|---|---|---|---|
| 2017-18 | 2018-19 | 2019-20 | 2020-21 | 2021-22 | 2022-23 | 2023-24 | 2024-25 | 2025-26 | 2026-27 | 2027-28 | 2028-29 | |
| Ontario Disability Support Program – Financial Assistance | 5,070 | 5,325 | 5,486 | 5,430 | 5,306 | 5,456 | 5,866 | 6,308 | 6,682 | 7,020 | 7,355 | 7,703 |
| Ontario Works – Financial Assistance | 2,766 | 2,850 | 2,824 | 2,640 | 2,249 | 2,580 | 2,875 | 3,329 | 3,452 | 3,438 | 3,344 | 3,265 |
| Ontario Drug Benefit Plan | 1,132 | 991 | 956 | 868 | 1,107 | 1,166 | 1,104 | 1,183 | 1,250 | 1,312 | 1,372 | 1,436 |
| Other Financial and Employment Supports Spending | 560 | 559 | 463 | 458 | 454 | 444 | 427 | 371 | 379 | 387 | 395 | 404 |
| Total | 9,528 | 9,725 | 9,729 | 9,395 | 9,116 | 9,645 | 10,272 | 11,191 | 11,763 | 12,157 | 12,466 | 12,808 |
Ontario Disability Support Program – Financial Assistance
Program Overview
The Ontario Disability Support Program (ODSP) is the largest MCCSS program. ODSP consists of two transfer payments, the largest of which is ODSP – Financial Assistance, accounting for over 30 per cent of ministry spending.[3]
ODSP – Financial Assistance provides direct financial assistance to Ontarians with disabilities and their families. To receive support, an individual must be an adult resident in Ontario who is in financial need and has limited assets.[4] The individual must also establish that they meet the program’s definition of a person with a disability or be a member of a prescribed class (such as individuals over 65 who are not eligible for Old Age Security).[5]
The majority of ODSP expenditures are for monthly allowances provided to individuals to cover basic needs such as food and other personal necessities, and shelter costs incurred through rent and utility related payments. Monthly allowances are primarily determined by the individual’s household income, living arrangements, whether the individual has a spouse, and the number and age of any dependants.[6] Additional allowances are available for parents caring for children with severe disabilities, individuals in northern areas without year-round road access, individuals with special dietary needs, and individuals who are pregnant or breastfeeding. In addition to allowances, individuals may also be eligible to receive health and disability-related benefits.[7] In 2023-24, the FAO estimates there was an average of 368,093 ODSP cases and the average annual ODSP allowance was $15,095 per case.[8]
Spending Forecast
The FAO projects that spending on ODSP – Financial Assistance will grow from $5.9 billion in 2023-24 to $7.7 billion by 2028-29, representing an average annual growth rate of 5.6 per cent. This growth rate significantly outpaces the estimated 2.5 per cent average annual growth rate from 2017-18 to 2023-24. The increase is due to relatively strong projected growth in the number of cases and, starting in 2022, the indexation of allowances to inflation for basic needs and shelter supports.
The FAO estimates that the number of ODSP cases will increase at an average annual rate of 2.8 per cent from 368,093 in 2023-24 to 422,704 in 2028-29. The primary factor driving growth in ODSP cases is population growth and, to a lesser extent, expected increases in utilization rates due to Ontario’s aging population.[9] The FAO’s projected growth in cases is similar to what was observed prior to the pandemic where annual case growth averaged 3.0 per cent from 2014-15 to 2019-20. However, during the pandemic, there was a decline in ODSP cases, which the ministry partly attributes to a decrease in referrals from the Ontario Works program. Fewer individuals claimed Ontario Works due to temporary federal COVID-19 income supports, resulting in fewer new recipients of Ontario Works being considered for referral to ODSP.
Figure 5.2 Actual and projected average monthly number of Ontario Disability Support Program cases, by fiscal year
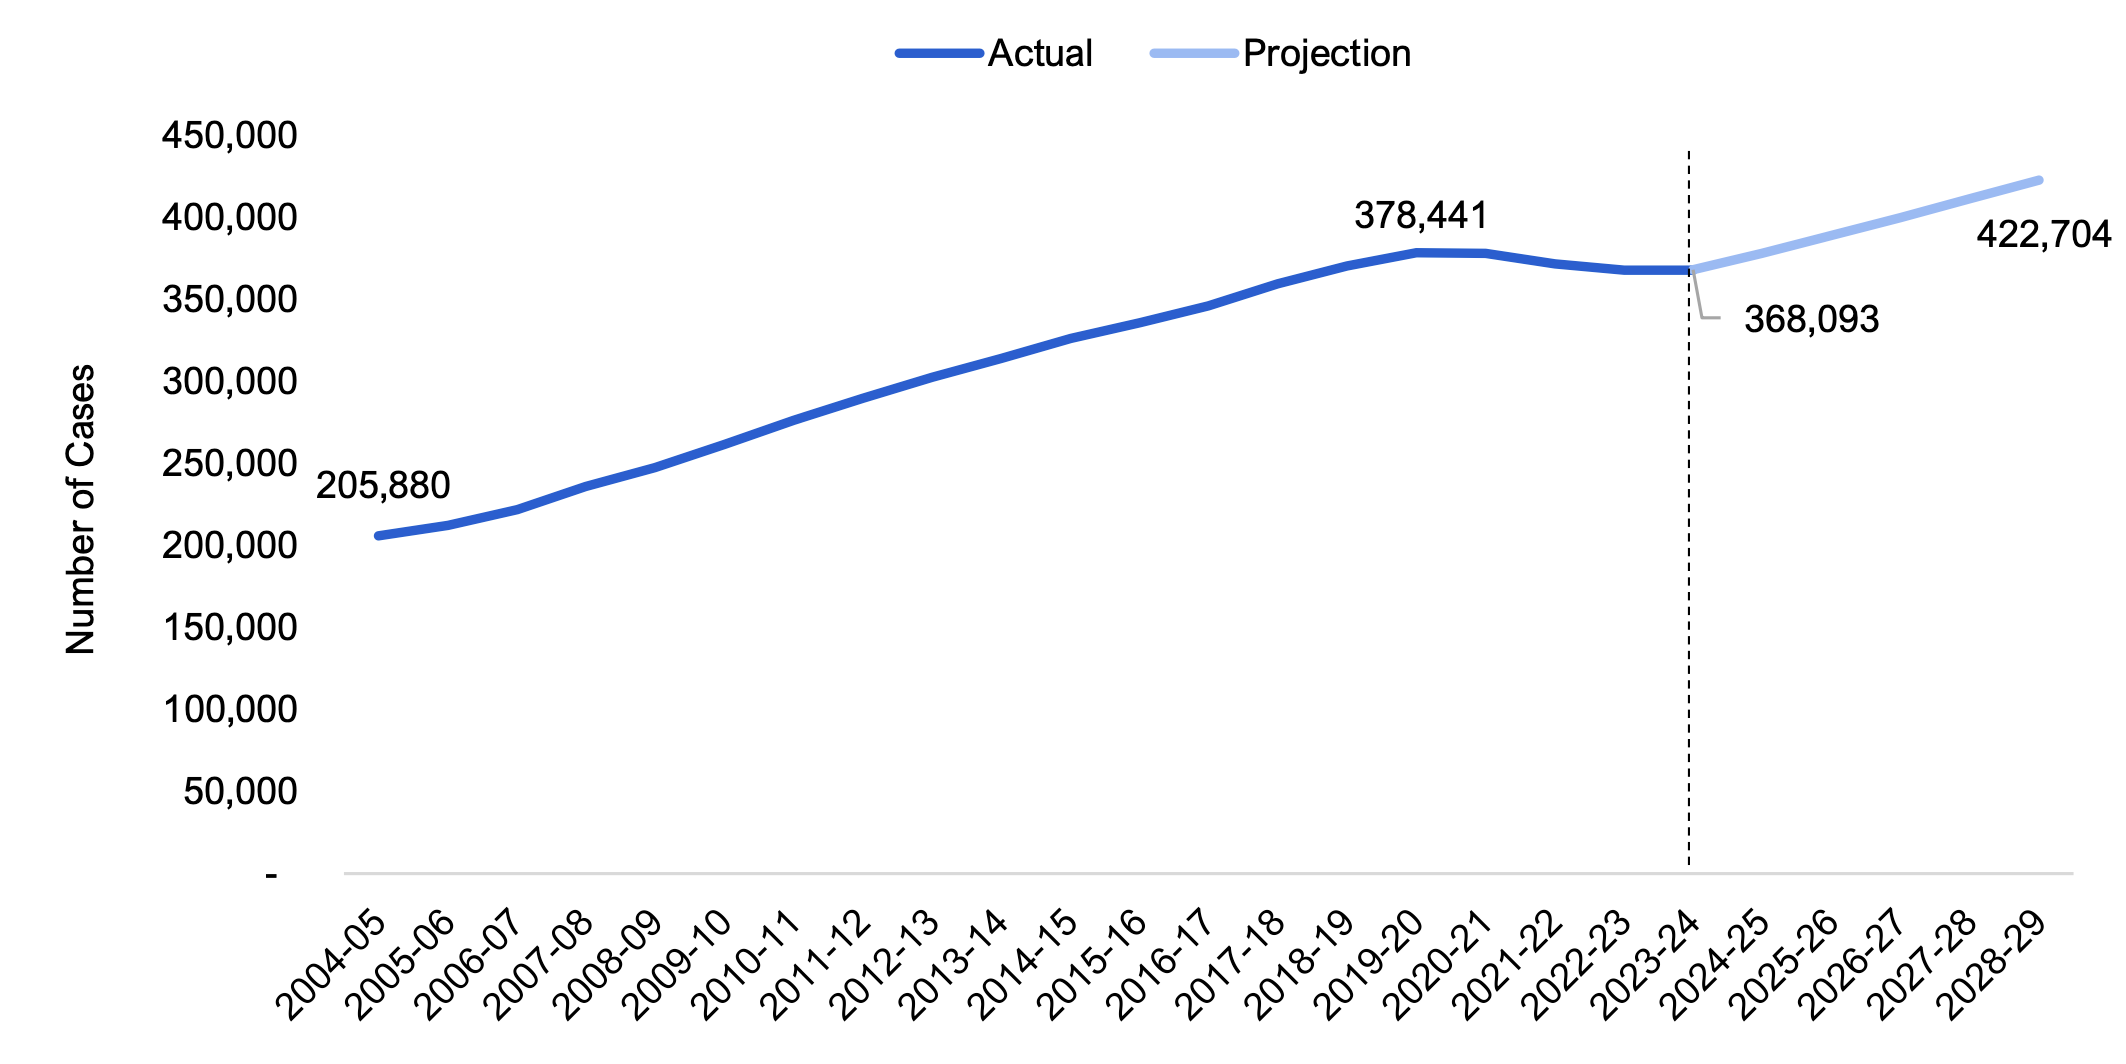
Note: One case refers to a single individual or a family unit receiving ODSP.
Source: FAO analysis of information provided by MCCSS
Accessible version
| Fiscal Year | Number of Cases | |
|---|---|---|
| Historical | 2004-05 | 205,880 |
| 2005-06 | 212,058 | |
| 2006-07 | 221,718 | |
| 2007-08 | 235,672 | |
| 2008-09 | 247,476 | |
| 2009-10 | 261,509 | |
| 2010-11 | 276,191 | |
| 2011-12 | 289,676 | |
| 2012-13 | 302,733 | |
| 2013-14 | 314,033 | |
| 2014-15 | 326,293 | |
| 2015-16 | 335,933 | |
| 2016-17 | 346,070 | |
| 2017-18 | 359,330 | |
| 2018-19 | 370,674 | |
| 2019-20 | 378,441 | |
| 2020-21 | 378,145 | |
| 2021-22 | 371,462 | |
| 2022-23 | 367,828 | |
| Projection | 2023-24 | 368,093 |
| 2024-25 | 378,076 | |
| 2025-26 | 388,678 | |
| 2026-27 | 399,731 | |
| 2027-28 | 411,168 | |
| 2028-29 | 422,704 |
In 2022, the government committed to increase allowance rates at the rate of inflation, with an initial increase of five per cent in September 2022.[10] The government also increased the amount of employment income ODSP recipients with disabilities could earn without affecting their allowances from $200 to $1,000 in February 2023.[11]
The five per cent allowance increase in 2022 represented the first increase in ODSP allowances since 2018. As a result of the pause in increases from 2018 to 2022, the FAO estimates that inflation-adjusted ODSP allowances declined from an average of $16,075 per case in 2018-19 to $14,576 in 2022-23 before increasing to $15,095 in 2023-24. Going forward, the FAO estimates that inflation-adjusted ODSP allowances will increase to approximately $15,646 per case in 2028-29.[12] However, despite these increases, inflation-adjusted allowance rates will be lower in 2028-29 than when rates were frozen in 2018.
Figure 5.3 Average annual Ontario Disability Support Program allowance per case in inflation-adjusted (2023-24) dollars, by fiscal year
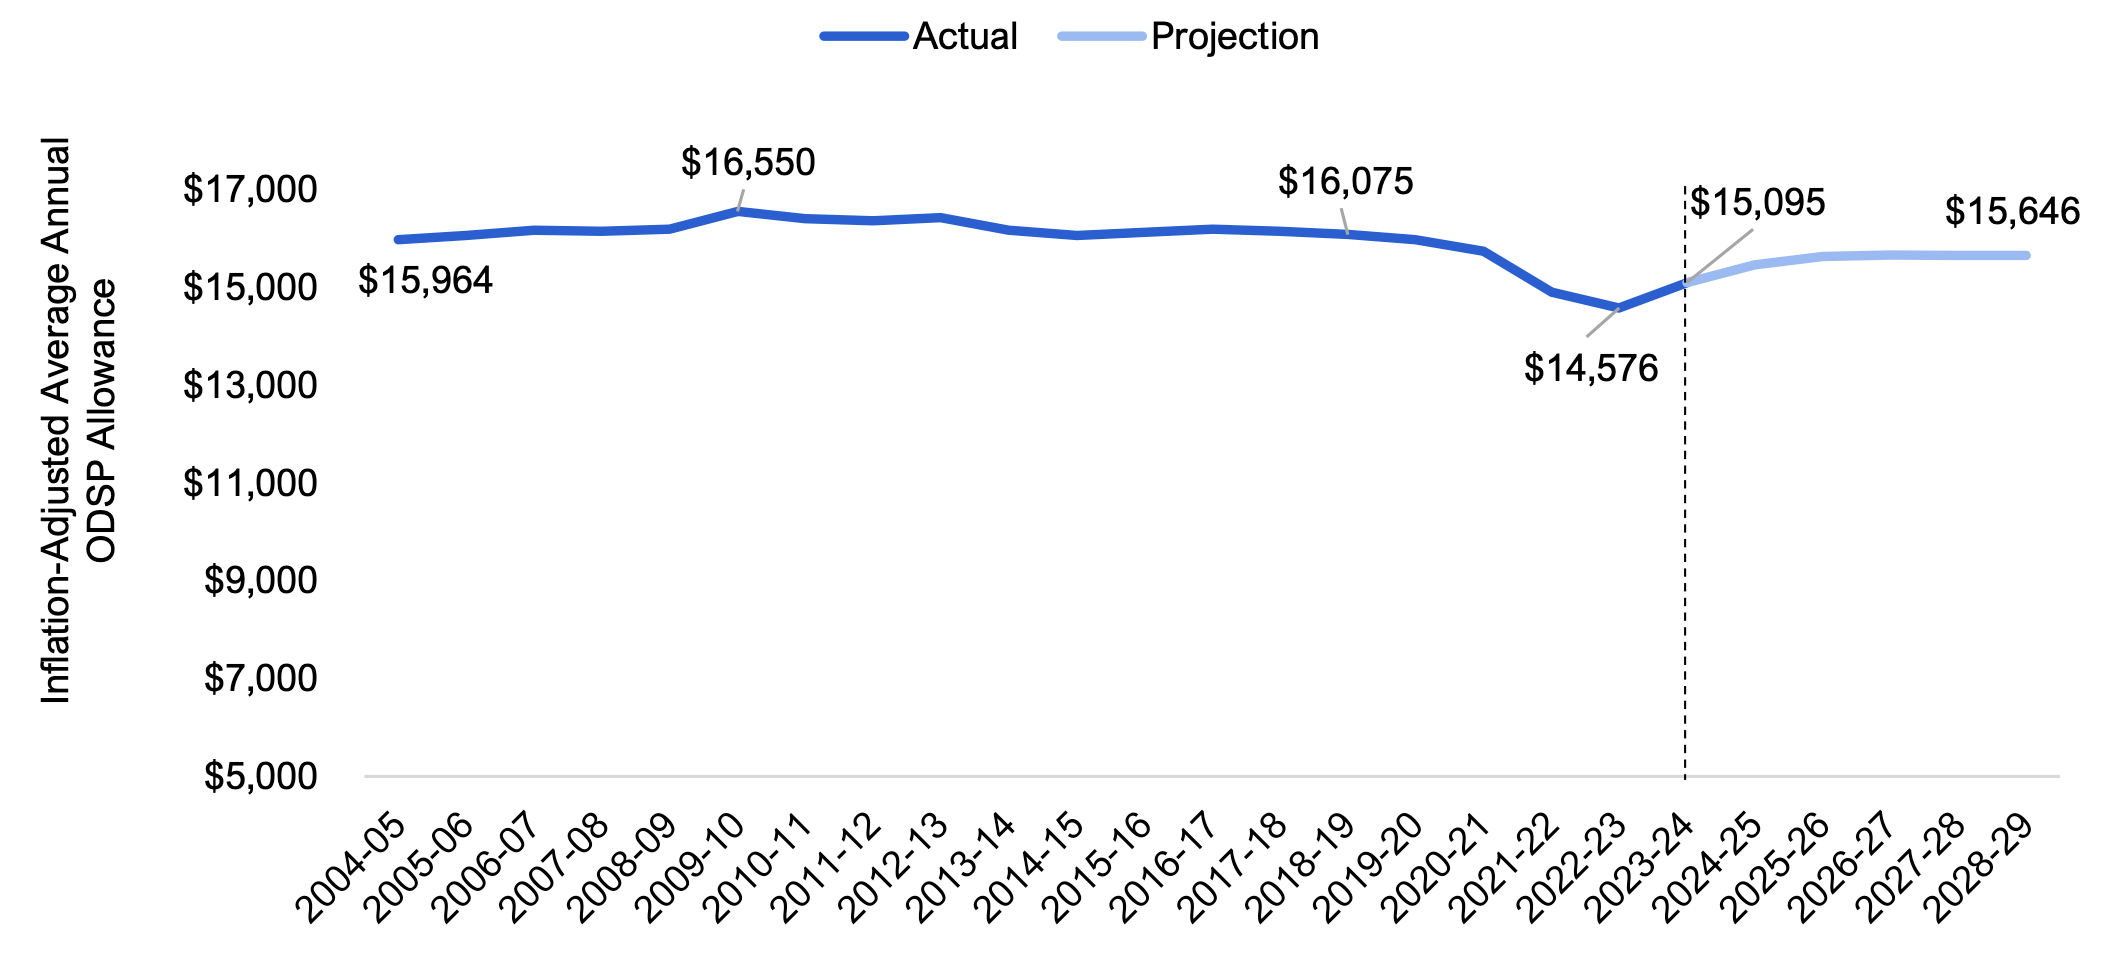
Note: The inflation-adjusted average annual ODSP allowance amount includes municipal expenditures between 2004-05 to 2010-11, when municipalities paid a portion of ODSP allowances.
Source: FAO analysis of information provided by MCCSS
Accessible version
| Fiscal Year | Inflation-Adjusted Average Annual ODSP Allowance ($) | |
|---|---|---|
| Historical | 2004-05 | 15,964 |
| 2005-06 | 16,052 | |
| 2006-07 | 16,166 | |
| 2007-08 | 16,147 | |
| 2008-09 | 16,197 | |
| 2009-10 | 16,550 | |
| 2010-11 | 16,408 | |
| 2011-12 | 16,363 | |
| 2012-13 | 16,429 | |
| 2013-14 | 16,171 | |
| 2014-15 | 16,051 | |
| 2015-16 | 16,125 | |
| 2016-17 | 16,194 | |
| 2017-18 | 16,143 | |
| 2018-19 | 16,075 | |
| 2019-20 | 15,977 | |
| 2020-21 | 15,745 | |
| 2021-22 | 14,906 | |
| 2022-23 | 14,576 | |
| Projection | 2023-24 | 15,095 |
| 2024-25 | 15,464 | |
| 2025-26 | 15,626 | |
| 2026-27 | 15,658 | |
| 2027-28 | 15,649 | |
| 2028-29 | 15,646 |
Starting in 2025-26, the average ODSP allowance per case may be reduced due to the introduction of the new federal Canada Disability Benefit (CDB), which is expected to begin in July 2025.[13] Based on current ODSP guidelines, the CDB is not exempt from ODSP income eligibility calculations. If the CDB is not exempted, individuals’ ODSP allowances would then be subject to clawbacks. The FAO has not included the impact of the CDB in its forecast, as information on the CDB’s design and potential changes to ODSP income exemption guidelines have not yet been finalized.
Ontario Works – Financial Assistance
Program Overview
The Ontario Works – Financial Assistance program provides financial assistance to Ontarians in financial need.[14] To receive support, an individual must be an adult resident in Ontario who is in financial need and has limited assets,[15] and the recipient must also participate in employment activities.[16]
Most Ontario Works expenditures are for monthly allowances provided to individuals to cover basic needs such as food and other personal necessities, and shelter costs incurred through rent and utility related payments. Monthly allowances are primarily determined by the individual’s household income,[17] whether the individual has a spouse, and the number and age of any dependants.[18] Additional allowances are available for individuals with special circumstances such as those living in northern areas without year-round road access, individuals with special dietary needs, and individuals who are pregnant or breastfeeding. In 2023-24, the FAO estimates that there was an average of 244,750 OW cases with an average annual OW allowance of $9,485 per case.[19]
Spending Forecast
The FAO estimates that spending on Ontario Works – Financial Assistance will grow at an average annual rate of 2.6 per cent from $2.9 billion in 2023-24 to $3.3 billion in 2028-29. This spending growth is due to projected increases in the number of individuals receiving allowances combined with the assumption of no changes to OW allowance rates, which have been frozen since 2018.
The FAO estimates that the number of OW cases will increase at an average annual rate of 2.7 per cent from 244,750 in 2023-24 to 278,963 in 2028-29. This follows a period from 2020-21 to 2022-23 where OW cases were temporarily reduced due to the increase in federal income supports during the COVID-19 pandemic, falling from 240,545 cases in 2019-20 to 189,981 cases in 2021-22. However, with the expiry of temporary federal COVID-19 income supports, the projected slowdown in the labour market and increases in international migration,[20] the FAO estimates that OW cases will rise to a peak of 294,626 cases in 2025-26 and will then gradually decline over the remainder of the outlook to 2028-29, similar to the experience following the 2008-09 recession.
Figure 5.4 Actual and projected average monthly number of Ontario Works cases, by fiscal year
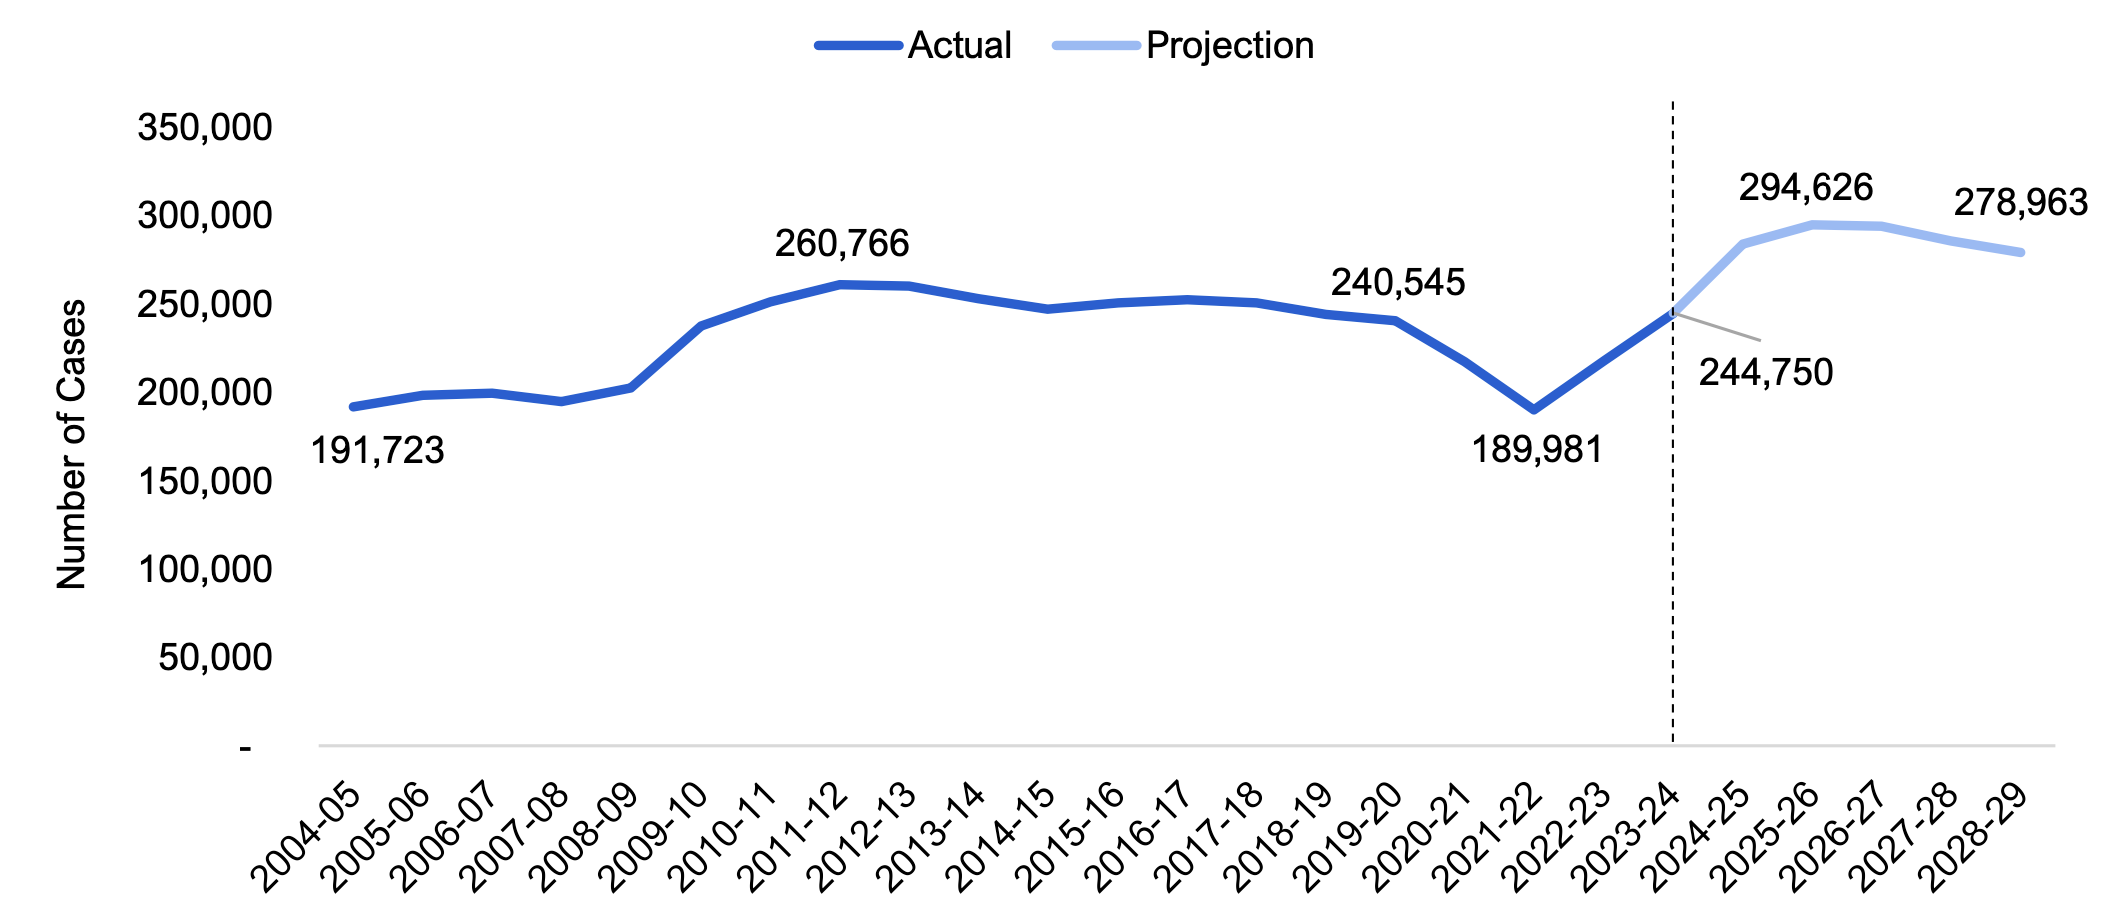
Note: One case refers to a single individual or a family unit receiving Ontario Works financial assistance.
Source: FAO analysis of information provided by MCCSS.
Accessible version
| Fiscal Year | Number of Cases | |
|---|---|---|
| Historical | 2004-05 | 191,723 |
| 2005-06 | 198,377 | |
| 2006-07 | 199,242 | |
| 2007-08 | 194,920 | |
| 2008-09 | 202,181 | |
| 2009-10 | 237,634 | |
| 2010-11 | 251,280 | |
| 2011-12 | 260,766 | |
| 2012-13 | 259,819 | |
| 2013-14 | 252,767 | |
| 2014-15 | 246,903 | |
| 2015-16 | 250,640 | |
| 2016-17 | 252,247 | |
| 2017-18 | 250,292 | |
| 2018-19 | 243,875 | |
| 2019-20 | 240,545 | |
| 2020-21 | 217,234 | |
| 2021-22 | 189,981 | |
| 2022-23 | 217,639 | |
| Projection | 2023-24 | 244,750 |
| 2024-25 | 283,908 | |
| 2025-26 | 294,626 | |
| 2026-27 | 293,556 | |
| 2027-28 | 285,589 | |
| 2028-29 | 278,963 |
The FAO assumes no changes to OW allowance rates as rates have been frozen since 2018 and the Province has no stated policy to increase allowance rates.[21] This will result in continued reductions in allowance rates after adjusting for inflation. The FAO estimates that the inflation-adjusted average annual allowance per case declined by 15 per cent from $11,154 in 2018-19 to $9,485 in 2023-24. Assuming the freeze continues, the FAO estimates that the inflation-adjusted average OW allowance will decline by an additional 10 per cent to $8,511 per case by the end of 2028-29.
Figure 5.5 Average annual Ontario Works allowance per case in inflation-adjusted (2023-24) dollars, by fiscal year
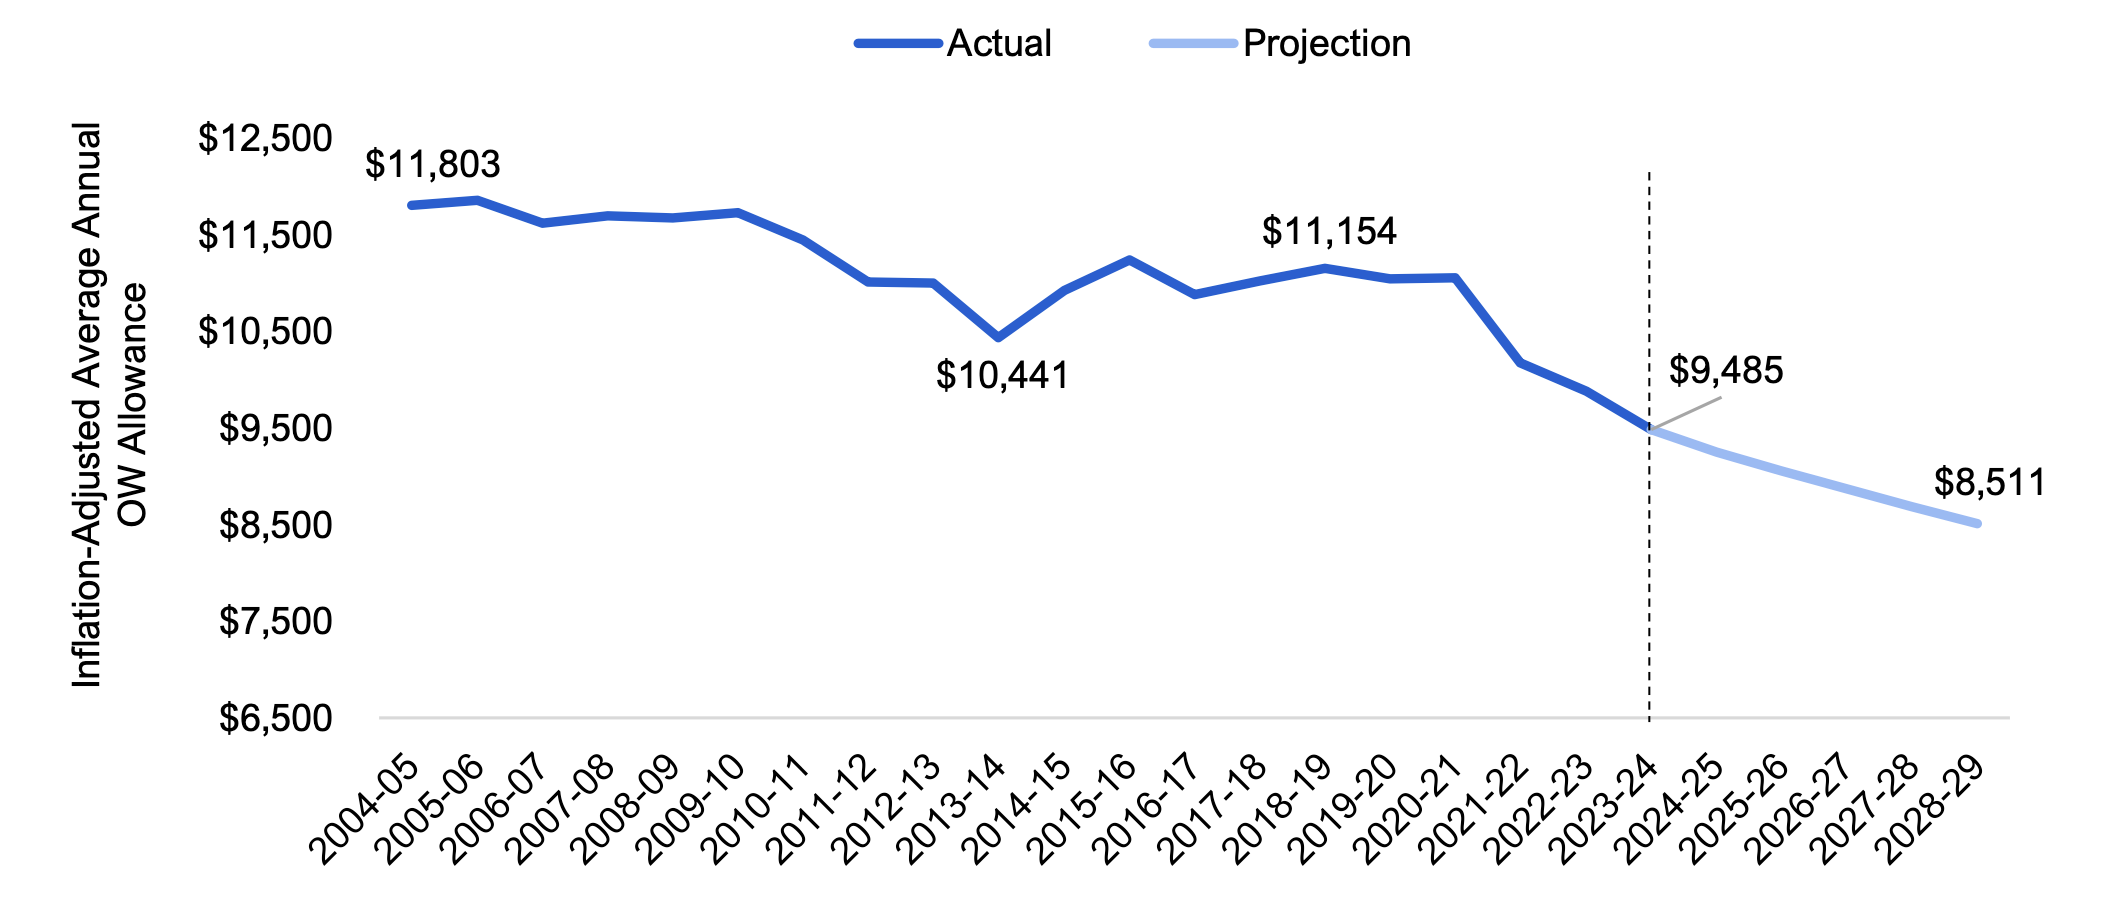
Note: The inflation-adjusted average annual OW allowance amount includes municipal expenditures between 2004-05 to 2017-18, when municipalities paid a portion of OW allowances.
Source: FAO analysis of data provided by MCCSS
Accessible version
| Fiscal Year | Inflation-Adjusted Average Annual OW Allowance ($) | |
|---|---|---|
| Historical | 2004-05 | 11,803 |
| 2005-06 | 11,860 | |
| 2006-07 | 11,625 | |
| 2007-08 | 11,695 | |
| 2008-09 | 11,672 | |
| 2009-10 | 11,728 | |
| 2010-11 | 11,453 | |
| 2011-12 | 11,015 | |
| 2012-13 | 11,002 | |
| 2013-14 | 10,441 | |
| 2014-15 | 10,924 | |
| 2015-16 | 11,245 | |
| 2016-17 | 10,880 | |
| 2017-18 | 11,025 | |
| 2018-19 | 11,154 | |
| 2019-20 | 11,047 | |
| 2020-21 | 11,054 | |
| 2021-22 | 10,177 | |
| 2022-23 | 9,882 | |
| Projection | 2023-24 | 9,485 |
| 2024-25 | 9,251 | |
| 2025-26 | 9,056 | |
| 2026-27 | 8,868 | |
| 2027-28 | 8,687 | |
| 2028-29 | 8,511 |
Ontario Drug Benefit Plan
Program Overview
Households receiving financial support under the Ontario Disability Support Program or Ontario Works are also eligible for coverage of the cost of prescription drugs under the Ontario Drug Benefit Plan. The Ontario Drug Benefit Plan also includes some programs intended to maintain coverage for the cost of prescription drugs for families who no longer qualify for ODSP or OW but have higher drug costs relative to their income.[22]
Spending Forecast
The FAO projects that spending on the Ontario Drug Benefit Plan will increase from $1.1 billion in 2023-24 to $1.4 billion in 2028-29, for an average annual growth rate of 5.4 per cent. This growth in spending reflects an estimated 2.6 per cent average annual growth in the cost of drugs per case and a 2.7 per cent average annual growth in the total number of ODSP and OW cases.
Other Financial and Employment Supports Spending
Other expenses in the Financial and Employment Supports vote-item include transfer payments for ODSP and OW employment supports as well as ministry administration expenses, primarily salaries and wages, and employee benefits. The FAO projects that Other Financial and Employment Supports Spending will decline from $427 million in 2023-24 to $404 million in 2028-29, for an average annual decline of -1.1 per cent. This decline is largely due to the Province’s plan to shift funding and responsibility for some employment supports to Employment Ontario, a similar program run by the Ministry of Labour, Immigration, Training and Skills Development.[23]
6. Supports to Individuals and Families (Vote-Item 702-21)
The Supports to Individuals and Families vote-item includes spending for programs that provide targeted supports for adults, youth and children with disabilities, victims of violence, and Indigenous peoples. The vote-item accounted for an estimated 27.2 per cent of total ministry spending in 2023-24. Spending for Supports to Individuals and Families largely consists of the sub-items Developmental Services, Children and Youth Services and Vulnerable Populations.
The FAO projects that spending on Supports to Individuals and Families will increase from $5,262 million in 2023-24 to $5,974 million in 2028-29, for an average annual growth rate of 2.6 per cent. This includes:
- an increase in spending on the Developmental Services sub-item from $3,343 million to $3,995 million (a 3.6 per cent average annual growth rate);
- an increase in spending on the Children and Youth Services sub-item from $1,487 million to $1,498 million (a 0.2 per cent average annual growth rate);
- an increase in spending on the Vulnerable Populations sub-item from $375 million to $416 million (a 2.1 per cent average annual growth rate); and
- an increase in Other Supports to Individuals and Families Spending from $58 million to $65 million (a 2.3 per cent average annual growth rate).
Figure 6.1 FAO projected Supports to Individuals and Families spending, $ millions
Source: Public Accounts of Ontario, 2024 Ontario Budget, and FAO analysis of information provided by MCCSS and Treasury Board Secretariat
Accessible version
| Actual | Forecast | |||||||||||
|---|---|---|---|---|---|---|---|---|---|---|---|---|
| 2017-18 | 2018-19 | 2019-20 | 2020-21 | 2021-22 | 2022-23 | 2023-24 | 2024-25 | 2025-26 | 2026-27 | 2027-28 | 2028-29 | |
| Developmental Services | 2,287 | 2,539 | 2,689 | 2,808 | 2,970 | 3,197 | 3,343 | 3,487 | 3,606 | 3,730 | 3,860 | 3,995 |
| Children and Youth Services | 849 | 895 | 985 | 1,218 | 1,247 | 1,348 | 1,487 | 1,557 | 1,453 | 1,466 | 1,482 | 1,498 |
| Vulnerable Populations | 247 | 261 | 294 | 324 | 348 | 357 | 375 | 388 | 396 | 404 | 408 | 416 |
| Other Supports to Individuals and Families Spending | 78 | 73 | 55 | 53 | 53 | 56 | 58 | 59 | 60 | 62 | 63 | 65 |
| Total | 3,460 | 3,768 | 4,022 | 4,403 | 4,618 | 4,959 | 5,262 | 5,490 | 5,515 | 5,661 | 5,813 | 5,974 |
Developmental Services (Sub-Item)
Within the Supports to Individuals and Families vote-item, Developmental Services funds programs and services primarily targeted towards adults with developmental disabilities:
- The Developmental Services Supportive Living program funds living arrangements for adults with developmental disabilities.
- The Supportive Services program funds services primarily for adults with developmental disabilities, such as community participation, employment supports and specialized services.
- Other Developmental Services Spending primarily includes ministry administrative expenses such as salaries and wages, and employee benefits.
Spending on Developmental Services is expected to grow at an average annual rate of 3.6 per cent between 2023-24 and 2028-29, from $3,343 million to $3,995 million.
Figure 6.2 FAO projected Developmental Services spending, $ millions
Source: Public Accounts of Ontario, 2024 Ontario Budget, and FAO analysis of information provided by MCCSS and Treasury Board Secretariat
Accessible version
| Actual | Forecast | |||||||||||
|---|---|---|---|---|---|---|---|---|---|---|---|---|
| 2017-18 | 2018-19 | 2019-20 | 2020-21 | 2021-22 | 2022-23 | 2023-24 | 2024-25 | 2025-26 | 2026-27 | 2027-28 | 2028-29 | |
| Developmental Services Supportive Living | 1,464 | 1,622 | 1,680 | 1,933 | 2,015 | 2,138 | 2,262 | 2,369 | 2,472 | 2,579 | 2,689 | 2,804 |
| Supportive Services | 823 | 917 | 996 | 862 | 943 | 1,047 | 1,068 | 1,104 | 1,120 | 1,137 | 1,156 | 1,177 |
| Other Developmental Services Spending | – | – | 12 | 12 | 13 | 13 | 13 | 13 | 14 | 14 | 14 | 15 |
| Total | 2,287 | 2,539 | 2,689 | 2,808 | 2,970 | 3,197 | 3,343 | 3,487 | 3,606 | 3,730 | 3,860 | 3,995 |
Developmental Services Supportive Living
Program Overview
Developmental Services Supportive Living funds a variety of living arrangements for individuals with developmental disabilities, including group homes, host families, supported independent living and intensive support. In 2023-24, the program cost an estimated $2.3 billion and served approximately 18,000 individuals, the majority of whom were in group homes.
Spending Forecast
The FAO estimates that spending on Developmental Services Supportive Living will grow at an average annual rate of 4.4 per cent from $2.3 billion in 2023-24 to $2.8 billion in 2028-29. This growth is driven entirely by increases in spending per client, which the FAO estimates will rise from $123,826 in 2023-24 to $153,494 by 2028-29, due to inflation and rising placement costs for new intakes.[24]
The FAO’s projection assumes that there will be no growth in the number of clients served, which continues the general trend observed since 2017-18. From 2017-18 to 2022-23, the number of people served has remained relatively constant, ranging between 19,328 and 18,266. This lack of growth in the number of people served has contributed to a growing waitlist for supportive living. From 2017-18 to 2022-23, the number of people waiting for a supportive living placement increased 49 per cent, from 18,152 in 2017-18 to 27,028 in 2022-23.[25]
Figure 6.3 Eligible individuals served and on waitlists for Developmental Services Supportive Living, by fiscal year
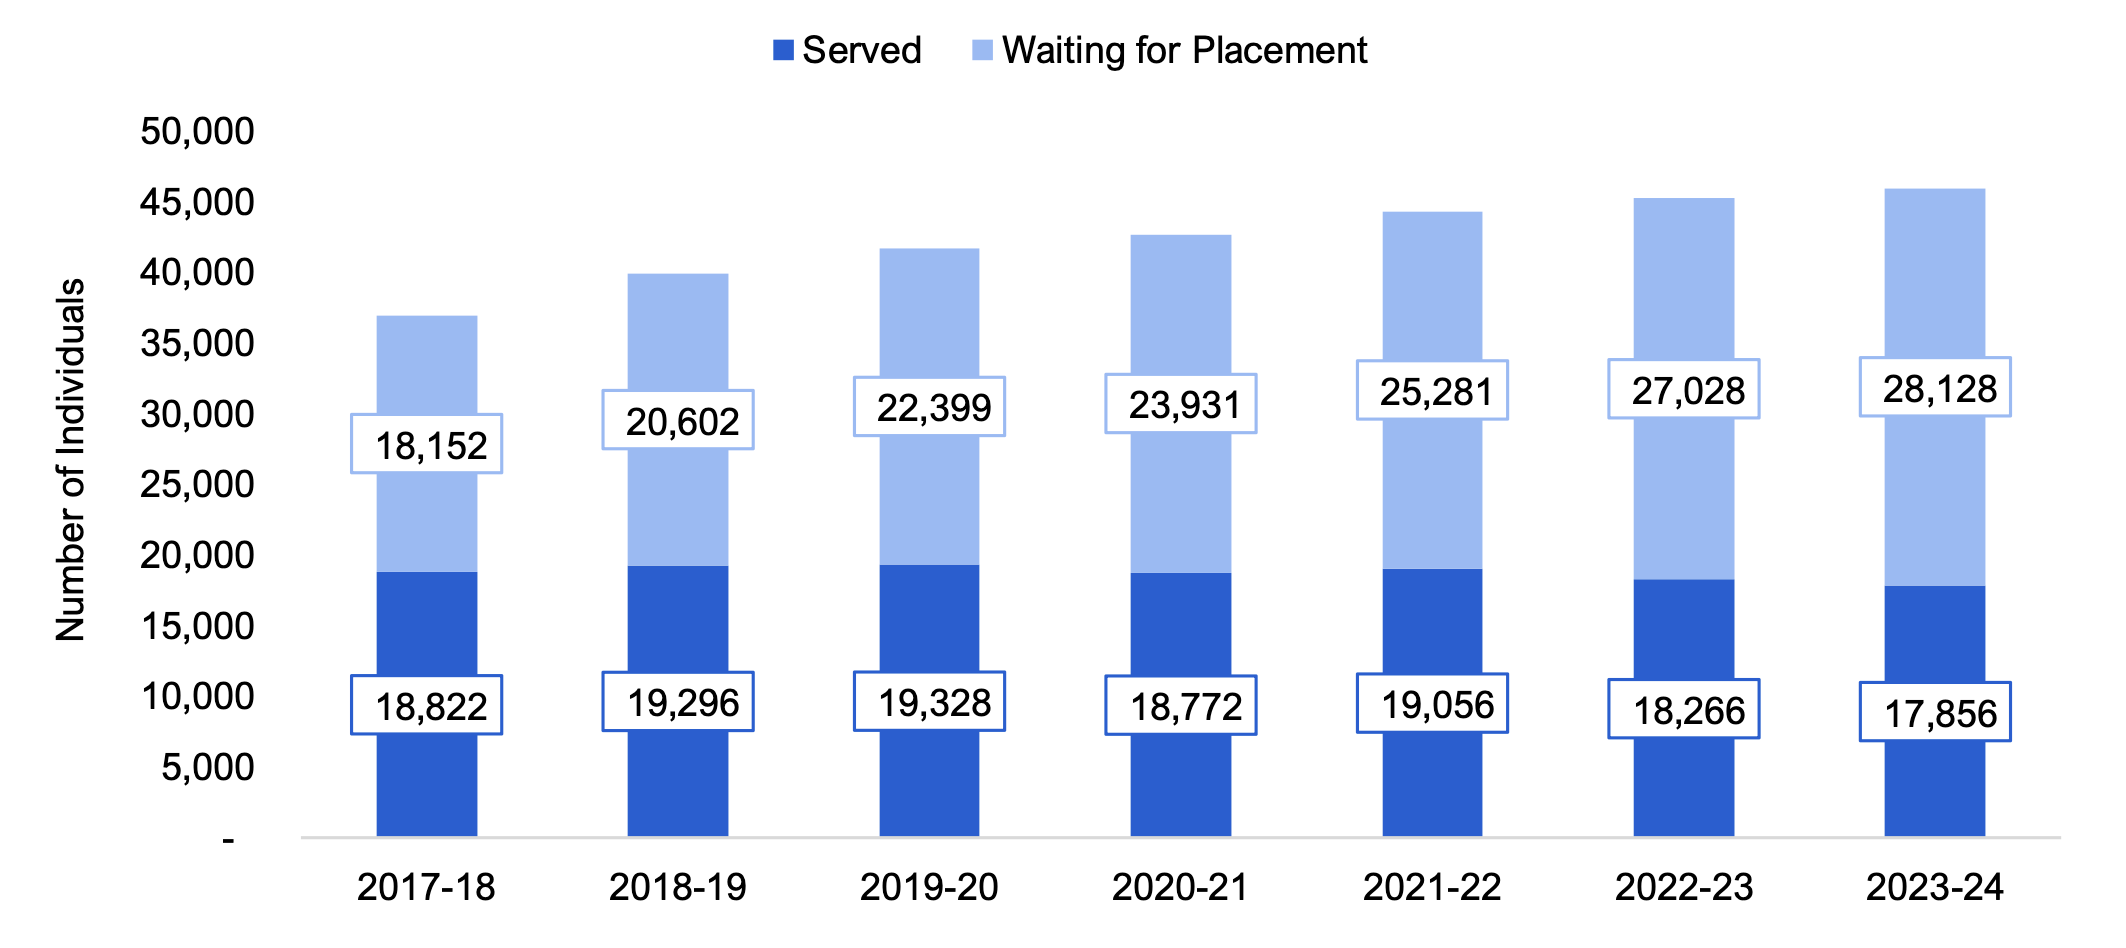
Note: 2023-24 values are interim as of December 2023. The number of people waiting for placement represents clients who have had their needs assessment and does not include those who are seeking placement but are still unassessed. In addition, the values for waiting for placement may include individuals already in a placement who are waiting for a different placement.
Source: FAO analysis of information provided by MCCSS
Accessible version
| 2017-18 | 2018-19 | 2019-20 | 2020-21 | 2021-22 | 2022-23 | 2023-24 | |
|---|---|---|---|---|---|---|---|
| Served | 18,822 | 19,296 | 19,328 | 18,772 | 19,056 | 18,266 | 17,856 |
| Waiting for Placement | 18,152 | 20,602 | 22,399 | 23,931 | 25,281 | 27,028 | 28,128 |
Supportive Services
Program Overview
Supportive Services funds a variety of services for individuals, mainly adults, with developmental disabilities, such as community participation, professional and specialized supports, employment supports, and caregiver respite. Supportive Services are provided through direct funding to recipients through the Passport program or agency-delivered services:
- The Passport program provides direct funding to eligible adults with developmental disabilities for supportive services. As of July 1, 2022, all clients eligible for supportive services are eligible to receive $5,500 per year in Passport program funding. In addition to the minimum direct funding of $5,500, beneficiaries may be eligible to receive additional Passport program funding up to a maximum of $44,275 based on their assessed need, priority and available funding.[26]
- Agency-delivered services provide a range of supportive services to adults and children with developmental disabilities such as community participation supports, professional and specialized services, caregiver respite, and employment supports. The largest category of services is community participation supports, representing an estimated 43 per cent of agency-delivered services spending in 2023-24.
In 2023-24, the Supportive Services program cost $1.1 billion, which consisted of an estimated $555 million for Passport program funding and $513 million for agency-delivered services.
Spending Forecast
The FAO estimates that spending on Supportive Services will grow at an average annual rate of 2.0 per cent from $1.1 billion in 2023-24 to $1.2 billion in 2028-29. This growth is driven by increases in Passport funding, which the FAO estimates will grow at an average annual rate of 3.2 per cent from $555 million in 2023-24 to $650 million in 2028-29. The FAO forecast assumes funding for agency-delivered services will increase to $527 million in 2024-25 and remain constant at that level, reflecting historical spending trends from 2017-18 to 2022-23.
The FAO’s projected growth in Passport program funding is driven by growth in the number of Passport recipients, which totalled 65,146 in 2023-24.[27] The FAO projects that the number of recipients will increase to 80,087 in 2028-29, which represents an estimate of the number of people with developmental disabilities in Ontario who will seek supportive services.[28]
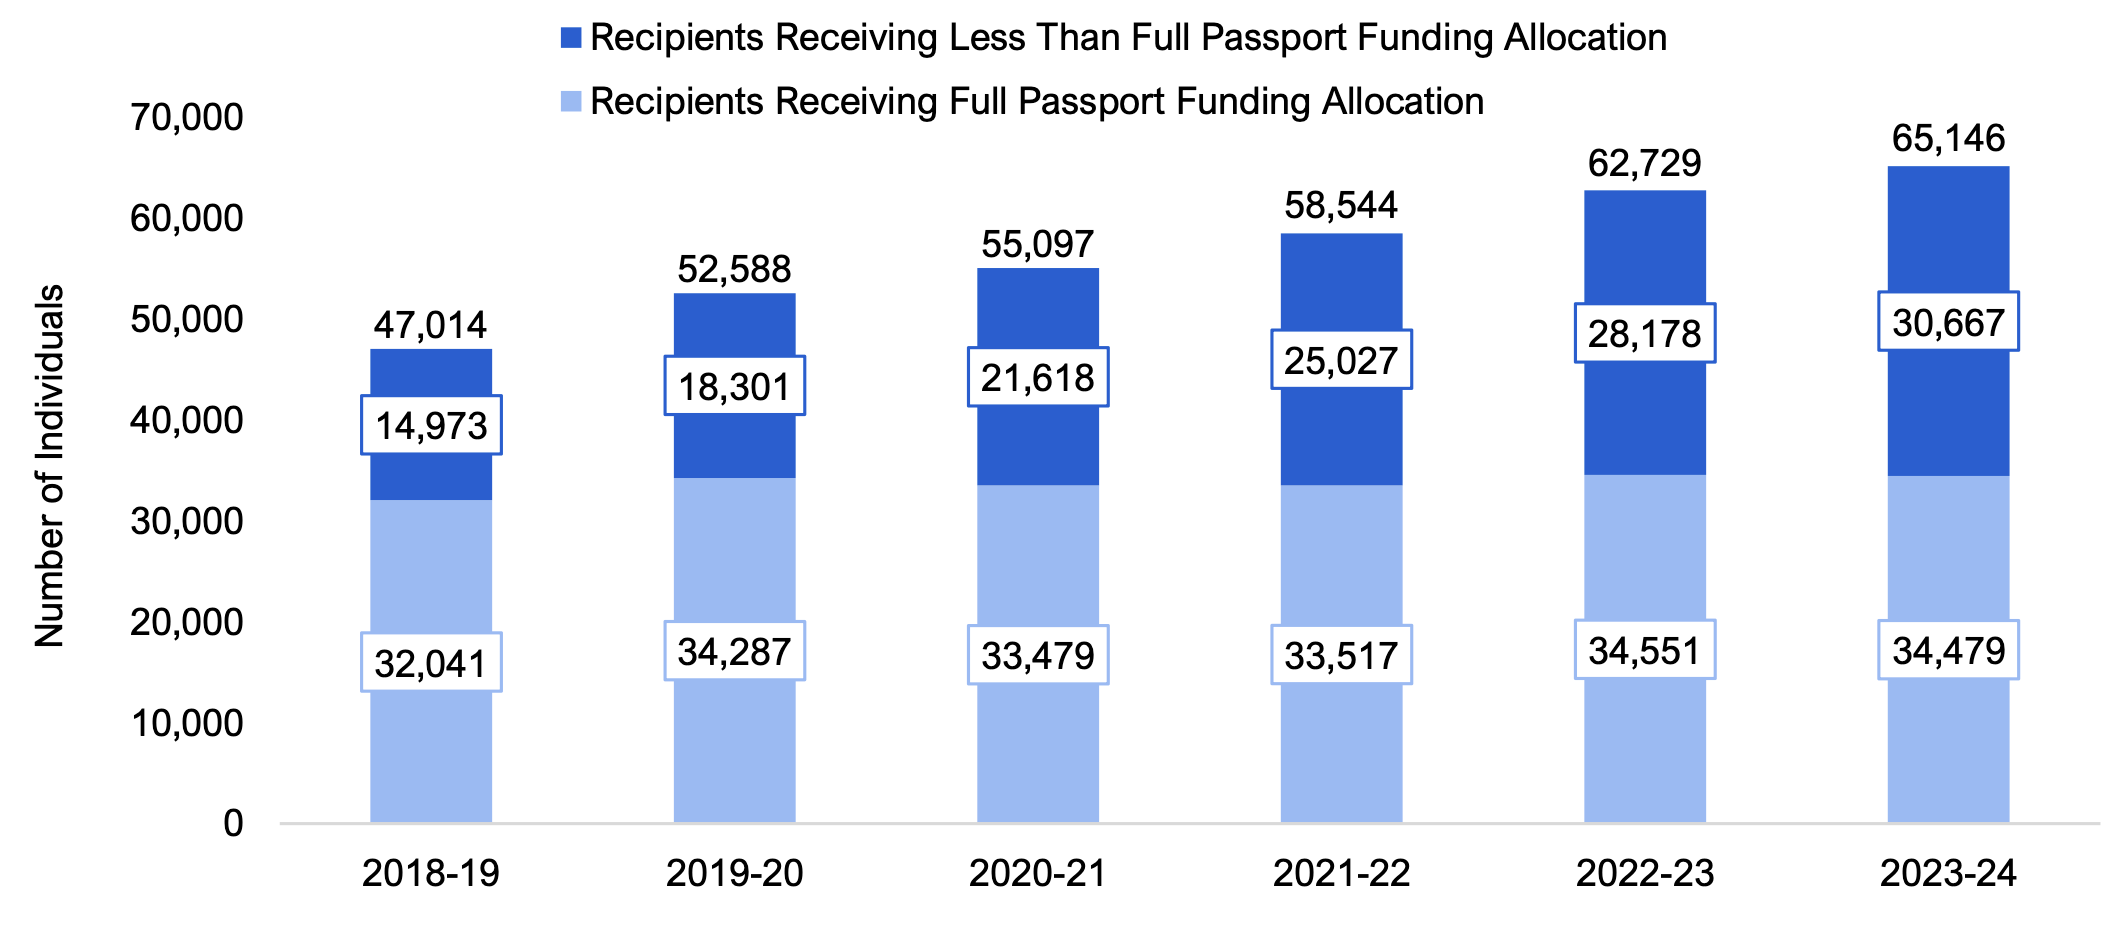
However, the FAO forecast assumes most new Passport recipients will not receive their full funding allocation amount based on their assessed need. This continues the trend observed since 2018-19 when MCCSS began providing all eligible adults with the minimum direct amount of Passport funding. From 2018-19 to 2023-24, the number of recipients receiving their full funding allocation increased at an average annual rate of 1.5 per cent from 32,041 in 2018-19 to 34,479 in 2023-24. In contrast, the number of Passport recipients receiving less than their full funding allocation grew at an average annual rate of 15.4 per cent from 14,973 in 2018-19 to 30,667 in 2023-24. As a result, the FAO forecast assumes program growth will be driven by new recipients receiving less than their full funding amount, which consists mostly of recipients receiving the minimum funding amount while waiting for additional funding to become available.
Figure 6.4 Number of people receiving Passport funding, by fiscal year
Note: 2023-24 values are interim as of December 2023.
Source: FAO analysis of information provided by MCCSS.
Accessible version
| 2018-19 | 2019-20 | 2020-21 | 2021-22 | 2022-23 | 2023-24 | |
|---|---|---|---|---|---|---|
| Recipients Receiving Full Passport Funding Allocation | 32,041 | 34,287 | 33,479 | 33,517 | 34,551 | 34,479 |
| Recipients Receiving Less Than Full Passport Funding Allocation | 14,973 | 18,301 | 21,618 | 25,027 | 28,178 | 30,667 |
| Total | 47,014 | 52,588 | 55,097 | 58,544 | 62,729 | 65,146 |
Regarding agency-delivered services, from 2024-25 to 2028-29, the FAO’s spending forecast remains constant at $527 million per year, reflecting historically flat spending levels from 2017-18 to 2022-23. The FAO’s forecast assumes no overall increase in the number of client services provided, which has varied from a high of 161,497 in 2019-20 to a low of 117,098 in 2022-23. During this period, the number of clients waiting for agency-delivered services increased from 26,747 in 2017-18 to 42,358 in 2022-23.
Other Developmental Services Spending
Other Developmental Services Spending, which includes ministry administrative expenses such as salaries and wages, and employee benefits, is projected to grow from an estimated $13.0 million in 2023-24 to $14.6 million in 2028-29 for an average annual growth rate of 2.3 per cent, mainly driven by projected wage growth.
Children and Youth Services (Sub-Item)
Within the Supports to Individuals and Families vote-item, Children and Youth Services funds programs and services primarily targeted towards children and youth with disabilities:
- Autism funds services for children and youth with autism spectrum disorder.
- Children’s Treatment and Rehabilitation Services funds rehabilitation services for children and youth with physical disabilities, developmental disabilities or communication difficulties and disorders, in addition to respite services and direct funding.
- Other Children and Youth Services Spending primarily includes the Complex Special Needs program, the Child and Youth Community Supports program, the Healthy Families program, and ministry administrative expenses such as salaries and wages, and employee benefits.
Spending on Children and Youth Services is expected to grow at an average annual rate of 0.2 per cent between 2023-24 and 2028-29, from $1,487 million to $1,498 million.
Figure 6.5 FAO projected spending on Children and Youth Services, $ millions
Source: Public Accounts of Ontario, 2024 Ontario Budget, and FAO analysis of information provided by MCCSS and Treasury Board Secretariat
Accessible version
| Actual | Forecast | |||||||||||
|---|---|---|---|---|---|---|---|---|---|---|---|---|
| 2017-18 | 2018-19 | 2019-20 | 2020-21 | 2021-22 | 2022-23 | 2023-24 | 2024-25 | 2025-26 | 2026-27 | 2027-28 | 2028-29 | |
| Autism | 318 | 361 | 434 | 580 | 558 | 628 | 691 | 723 | 600 | 600 | 600 | 600 |
| Children’s Treatment and Rehabilitation Services | 119 | 122 | 121 | 210 | 305 | 317 | 357 | 382 | 389 | 396 | 403 | 411 |
| Other Children and Youth Service Spending | 413 | 411 | 430 | 428 | 384 | 403 | 439 | 452 | 464 | 469 | 479 | 488 |
| Total | 849 | 895 | 985 | 1,218 | 1,247 | 1,348 | 1,487 | 1,557 | 1,453 | 1,466 | 1,482 | 1,498 |
Autism
Program Overview
The Autism program funds services for children and youth with autism spectrum disorder (ASD). The Autism program includes funding for core clinical services and other services provided through the new Ontario Autism Program (OAP), which launched August 2020. It also includes other services outside of the new OAP, such as Diagnostic Hubs and Capacity Building Initiatives, and legacy programs (i.e., OAP behaviour plans, Childhood Budgets and Interim One-Time Funding). Children and youth who have been diagnosed with ASD by a qualified professional can register with the new OAP to access services and funding supports.
By the end of 2023-24, there were 70,176 children registered with the new OAP and the Province spent an estimated $691 million on the Autism program for the fiscal year. Autism program spending can be broken into two broad categories: new OAP Services and other services.
New OAP Services includes services funded under Ontario’s new Autism program, launched in August 2020. In 2023-24, an estimated $480 million was spent on new OAP services. These services can be broadly grouped into core clinical services and other services administered by the OAP.
- Core Clinical Services: Services include applied behaviour analysis, speech language pathology, occupational therapy and mental health services. Under the new OAP, children and youth must wait to be invited to apply for core clinical services based on their date of registration for the program. Once accepted and assessed, children and youth can be allocated between $6,600 to $65,000 in yearly core clinical services funding. In 2023-24, an estimated $307 million in payments for core clinical services were issued to families.[29]
- Other services administered by the OAP: Outside of core clinical services, registered children and youth may be eligible to access other services offered by the new OAP, including Foundational Family Services, Caregiver Mediated Early Years Programs, Entry to School Services, Urgent Response Services and the School Support Program.[30] In 2023-24, an estimated $173 million was spent on other services administered by the OAP.
Other services include legacy services such as OAP Behaviour Plans, Childhood Budgets and Interim One-Time Funding.[31] The majority of children and youth who received services under these legacy programs have already been or continue to be transitioned into core clinical services under the new OAP. In addition, other services include Diagnostic Hubs,[32] Capacity Building Initiatives,[33] Other Autism Services[34] and AccessOAP Operational Costs.[35] In 2023-24, an estimated $211 million was spent on other services.
Spending Forecast
In July 2019, the Province committed to increase the Autism program budget to $600 million annually as part of the introduction of the new OAP, which was later re-iterated in 2021.[36] Over the last two years, the Province has exceeded this commitment, spending $628 million in 2022-23 and an estimated $691 million in 2023-24. The 2024 Ontario Budget committed an additional $120 million in 2024-25, for a total budget of $723 million. Given that the Province has not committed to maintain the additional Autism program spending past 2024-25, the FAO’s forecast assumes that the Province will return to its previous commitment of $600 million in annual funding from 2025-26 onwards.
In the 2024 Ontario Budget, the Province committed to enroll 20,000 children and youth in core clinical services.[37] As of February 29, 2024, a total of 19,966 children and youth had been enrolled in core clinical services and 14,290 children and youth had received payments.
In 2023-24, children in core clinical services received an average annual funding commitment of approximately $34,000. Based on this 2023-24 average funding allocation per child, the FAO estimates that the annual Autism program funding level of $600 million, starting in 2025-26, would be sufficient to provide full funding for core clinical services to approximately 10,142 children and youth annually.[38] If the Province were to maintain the Autism program’s 2024-25 funding level at $723 million, then the FAO estimates that this would be sufficient to provide 12,629 children and youth with full annual funding for core clinical services.
Children’s Treatment and Rehabilitation Services
Program Overview
Children’s Treatment and Rehabilitation Services provides services for children and youth with special needs such as speech-language pathology, occupational therapy and physiotherapy, which may be provided in community-based settings or in schools.[39] Services also include respite services and/or direct funding to provide breaks to families, and growth and development opportunities for children and youth with special needs.[40]
In 2022-23, Children’s Treatment and Rehabilitation Services spent $317 million on services delivered by Children’s Treatment Centres and Surrey Place, Respite and Special Services at Home, and direct funding to families. As of 2022-23, 61,654 children and youth received community-based services and 82,936 received school-based services under Children’s Treatment and Rehabilitation Services. In addition, there were 26,263 children and youth waiting for community-based services and 58,347 waiting for school-based services.
| Number of Children and Youth Receiving Services | Number of Children and Youth Waiting for Services | Average Wait Time for Assessment (days) | Average Wait Time for Service Initiation (days) | Average Total Wait Time (days) | |
|---|---|---|---|---|---|
| Community-based Services | 61,654 | 26,263 | 115 | 36 | 151 |
| School-based Services | 82,936 | 58,347 | 427 | 56 | 483 |
Spending Forecast
The FAO forecasts that spending on Children’s Treatment and Rehabilitation Services will increase from $357 million in 2023-24 to $411 million in 2028-29, representing an average annual growth rate of 2.8 per cent. The FAO’s forecast is driven by inflation and incorporates a portion of the recent provincial announcement of $45 million in new annual funding for children’s rehabilitation services.[41]
Other Children and Youth Services Spending
Other spending under Children and Youth Services includes:
- Complex Special Needs, which includes Individualized Supports funding for individual children and youth whose needs exceed what local base-funded services can support, and Community Enhancement funding to expand local service capacity to support children and youth with complex special needs and their families. Complex Special Needs also includes Coordinated Services Planning, Fetal Alcohol Spectrum Disorder, the Integrated Pathway for Children and Youth with Extensive Needs initiative, and out-of-home care services.
- The Child and Youth Community Supports program, which funds early intervention programs to identify and help preschool children with disabilities, as well as the student nutrition program.
- The Healthy Families program, which provides prevention, early identification and intervention services to families of newborns and young children with risks to healthy child development; primary health care for vulnerable pregnant women and families with children; and initiatives focused on monitoring growth and development of young children.
- Other spending, which includes ministry administrative expenses such as salaries and wages, and employee benefits.
Spending on Other Children and Youth Services programs is projected to increase from $439 million in 2023-24 to $488 million in 2028-29, representing an average annual growth rate of 2.2 per cent. This outlook is based on inflation, a 2023 Ontario Budget investment of $12 million over three years to support children and youth with complex special needs,[42] and a portion of the provincial announcement of $45 million in new annual funding, which is included in the Child and Youth Community Supports program.[43]
Vulnerable Populations (Sub-Item)
Within the Supports to Individuals and Families vote-item, Vulnerable Populations funds programs primarily targeted towards victims of violence, deaf individuals and Indigenous peoples.
- The Supports to Victims of Violence program provides supports (such as emergency shelter and counselling) to individuals who are at risk or have experienced human trafficking, gender-based violence, and/or sexual assault.
- Other Vulnerable Populations Spending primarily includes the Supports to Community Living program, the Indigenous Healing and Wellness Strategy, and ministry administrative expenses such as salaries and wages, and employee benefits.
Spending on these programs is expected to grow at an average annual rate of 2.1 per cent between 2023-24 and 2028-29, from $375 million to $416 million.
Figure 6.6 FAO projected spending on programs for Vulnerable Populations, $ millions
Source: Public Accounts of Ontario, 2024 Ontario Budget, and FAO analysis of information provided by MCCSS and Treasury Board Secretariat
Accessible version
| Actual | Forecast | |||||||||||
|---|---|---|---|---|---|---|---|---|---|---|---|---|
| 2017-18 | 2018-19 | 2019-20 | 2020-21 | 2021-22 | 2022-23 | 2023-24 | 2024-25 | 2025-26 | 2026-27 | 2027-28 | 2028-29 | |
| Supports to Victims of Violence | 151 | 160 | 168 | 190 | 198 | 248 | 257 | 267 | 273 | 278 | 280 | 285 |
| Other Vulnerable Populations Spending | 96 | 101 | 126 | 134 | 150 | 109 | 118 | 121 | 123 | 126 | 128 | 131 |
| Total | 247 | 261 | 294 | 324 | 348 | 357 | 375 | 388 | 396 | 404 | 408 | 416 |
Supports to Victims of Violence
Program Overview
Supports to Victims of Violence provides a wide range of services aimed at helping victims of violence find safety and rebuild their lives free of violence. Supports and services offered primarily target women and their dependants who are at risk or have experienced human trafficking, gender-based violence, crime, and/or sexual assault. These supports include, but are not limited to, counselling services, referral services, residential and shelter support, a 24/7 provincial crisis phone line, and transitional and housing supports.
Spending Forecast
The FAO projects that spending on Supports to Victims of Violence will grow at an average annual rate of 2.1 per cent, increasing from $257 million in 2023-24 to $285 million by 2028-29. The FAO’s projection is driven by inflation and incorporates a portion of the 2024 Ontario Budget commitment of $13.5 million over three years to support women, children, youth and others who are at increased risk of violence or exploitation.[44]
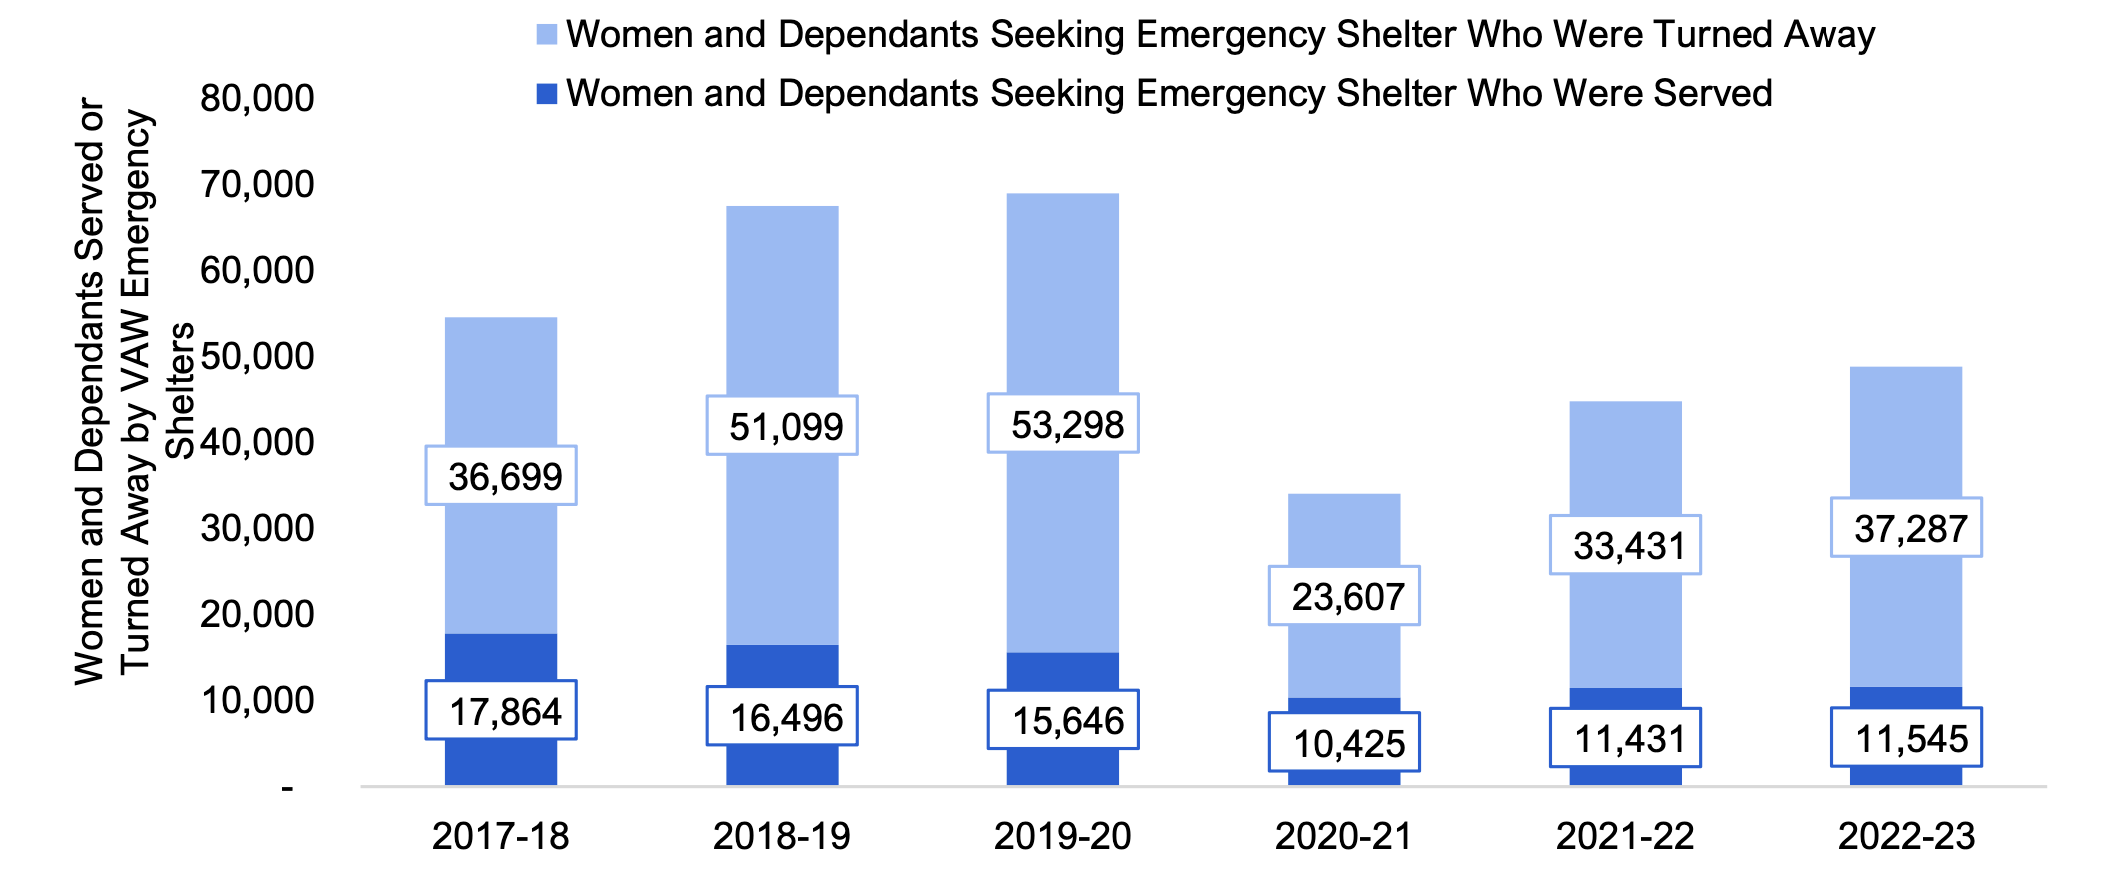
The largest program within Supports to Victims of Violence is the Violence Against Women (VAW) emergency shelter and supports, which funds emergency shelters for women who are victims of violence and their dependants. In 2022-23, the program cost $93 million and funded 2,018 shelter beds, serving a total of 11,545 women and their dependants. The FAO’s forecast assumes no increase in the number of beds, which has declined from 2,335 in 2017-18 to 2,018 in 2022-23. During this period of declining beds, fewer women and dependants were served, decreasing from 17,864 in 2017-18 to 11,545 in 2022-23. Over this period, the FAO estimates that the number of women and dependants turned away from VAW shelter services varied from a low of 23,607 in 2020-21, during the COVID-19 pandemic, to a high of 53,298 in 2019-20.
Figure 6.7 Number of individuals seeking Violence Against Women emergency shelter and supports, by fiscal year
Note: There may be some overlap between the individuals served and turned away as some women and dependants seeking VAW emergency shelter services may have also been served or turned away at another point.
Source: FAO analysis of data provided by MCCSS
Accessible version
| 2017-18 | 2018-19 | 2019-20 | 2020-21 | 2021-22 | 2022-23 | |
|---|---|---|---|---|---|---|
| Women and Dependants Seeking Emergency Shelter Who Were Served | 17,864 | 16,496 | 15,646 | 10,425 | 11,431 | 11,545 |
| Women and Dependants Seeking Emergency Shelter Who Were Turned Away | 36,699 | 51,099 | 53,298 | 23,607 | 33,431 | 37,287 |
Other Vulnerable Populations Spending
Other Vulnerable Populations Spending includes:
- the Supports to Community Living program, which provides interpreters for adults who are deaf, deafened and hard of hearing, and intervenors for individuals who are deafblind, as well as homelessness initiatives and other community services;
- the Indigenous Healing and Wellness Strategy program, which funds Indigenous-designed and delivered programs and services to support Indigenous healing, health and wellness, and to reduce violence against Indigenous women and children;[45] and
- other spending, which includes ministry administrative expenses such as salaries and wages, and employee benefits.
Other Vulnerable Populations Spending is projected to increase from $118 million in 2023-24 to $131 million in 2028-29, representing an average annual growth rate of 2.1 per cent. The FAO assumes that spending on these programs will grow at the rate of inflation.
Other Supports to Individuals and Families Spending
Other Supports to Individuals and Families Spending includes the Regional Delivery sub-item,[46] which consists primarily of salaries and wages, and employee benefits. The FAO projects spending will increase from $58 million in 2023-24 to $65 million in 2028-29, reflecting an average annual growth rate of 2.3 per cent, mainly driven by projected wage growth and inflation.
7. Children and Youth at Risk (Vote-Item 702-20)
The Children and Youth at Risk vote-item includes spending for programs that provide targeted supports primarily for children and youth in the child welfare system and youth justice system. In 2023-24, the vote-item accounted for an estimated 11.2 per cent of total ministry spending. Spending for Children and Youth at Risk includes the sub-items Child Protection Services and Youth Justice Services.
The FAO projects that spending on Children and Youth at Risk will grow at an average annual rate of 0.8 per cent between 2023-24 and 2028-29, from $2,167 million to $2,255 million. This includes:
- an increase in spending on the Child Protection Services sub-item from $1,892 million to $1,958 million (a 0.7 per cent average annual growth rate);[47] and
- an increase in spending on the Youth Justice Services sub-item from $275 million to $297 million (a 1.6 per cent average annual growth rate).
Figure 7.1 FAO projected spending on Children and Youth at Risk, $ millions
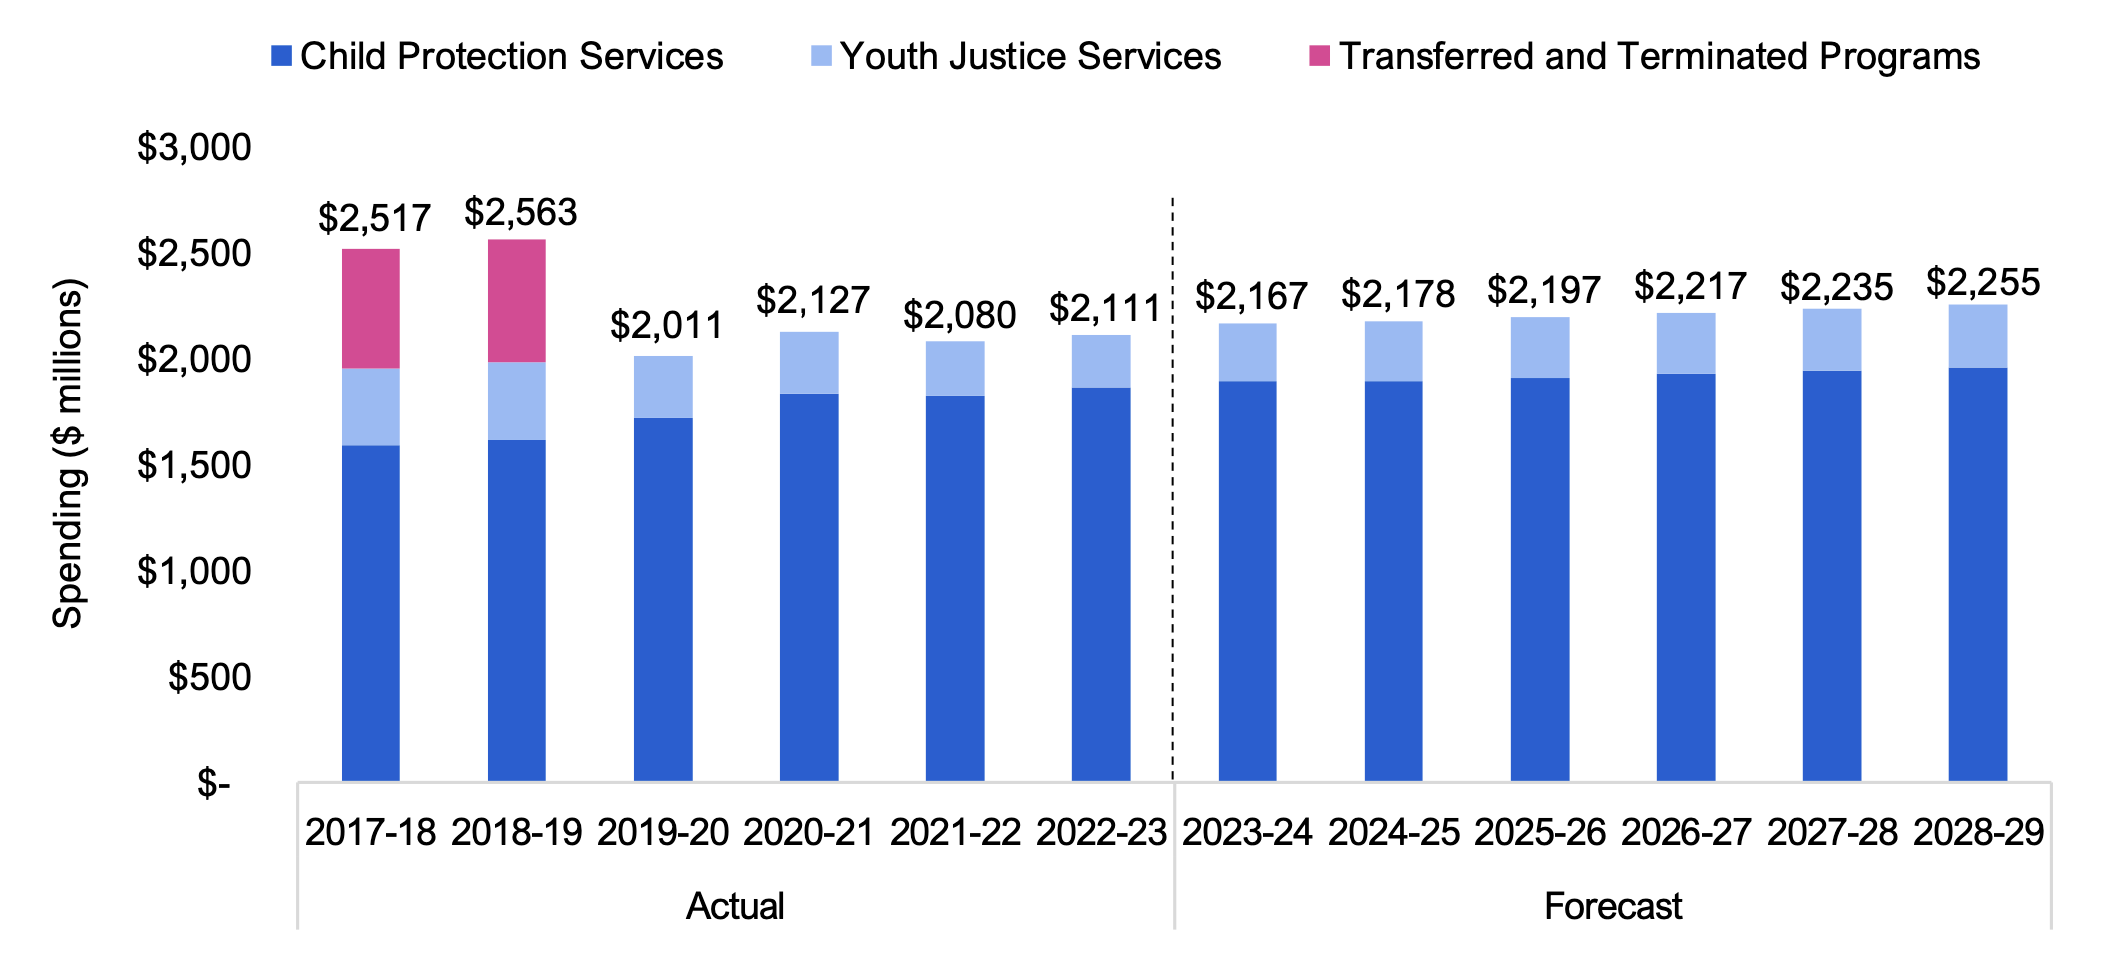
Note: Transferred and Terminated Programs includes the Child and Youth Mental Health program and the Child Protection Transformation Fund.
Source: Public Accounts of Ontario, 2024 Ontario Budget, and FAO analysis of information provided by MCCSS and Treasury Board Secretariat.
Accessible version
| Actual | Forecast | |||||||||||
|---|---|---|---|---|---|---|---|---|---|---|---|---|
| 2017-18 | 2018-19 | 2019-20 | 2020-21 | 2021-22 | 2022-23 | 2023-24 | 2024-25 | 2025-26 | 2026-27 | 2027-28 | 2028-29 | |
| Child Protection Services | 1,592 | 1,614 | 1,720 | 1,832 | 1,823 | 1,862 | 1,892 | 1,896 | 1,911 | 1,926 | 1,942 | 1,958 |
| Youth Justice Services | 362 | 371 | 291 | 295 | 257 | 250 | 275 | 282 | 286 | 291 | 293 | 297 |
| Transferred and Terminated Programs | 563 | 578 | – | – | – | – | – | – | – | – | – | – |
| Total | 2,517 | 2,563 | 2,011 | 2,127 | 2,080 | 2,111 | 2,167 | 2,178 | 2,197 | 2,217 | 2,235 | 2,255 |
Child Protection Services (Sub-Item)
Within the Children and Youth at Risk vote-item, the Child Protection Services sub-item is responsible for programs and services for children and youth in the child welfare system:
- the Child Protection Services transfer payment funds Children’s Aid Societies, which are responsible for delivering a range of services to help protect children and youth experiencing or at risk of experiencing abuse or neglect; and
- Other Child Protection Services Spending includes spending on the Child Welfare – Community and Prevention Supports, Child Welfare Indigenous Community and Prevention Supports transfer payments, and ministry administration and other expenses.
Spending on Child Protection Services is expected to grow at an average annual rate of 0.7 per cent between 2023-24 and 2028-29, from $1,892 million to $1,958 million.
Figure 7.2 FAO projected spending on programs for Child Protection Services, $ millions
Note: Child Protection Services spending includes ministry reclassifications and child welfare supports starting in 2019-20.
Source: Public Accounts of Ontario, 2024 Ontario Budget, and FAO analysis of information provided by MCCSS and Treasury Board Secretariat
Accessible version
| Actual | Forecast | |||||||||||
|---|---|---|---|---|---|---|---|---|---|---|---|---|
| 2017-18 | 2018-19 | 2019-20 | 2020-21 | 2021-22 | 2022-23 | 2023-24 | 2024-25 | 2025-26 | 2026-27 | 2027-28 | 2028-29 | |
| Child Protection Services | 1,538 | 1,556 | 1,556 | 1,649 | 1,636 | 1,650 | 1,681 | 1,678 | 1,689 | 1,700 | 1,712 | 1,724 |
| Other Child Protection Services | 54 | 57 | 163 | 184 | 187 | 211 | 211 | 217 | 222 | 226 | 230 | 235 |
| Total | 1,592 | 1,614 | 1,720 | 1,832 | 1,823 | 1,862 | 1,892 | 1,896 | 1,911 | 1,926 | 1,942 | 1,958 |
Child Protection Services
Program Overview
MCCSS is responsible for administering Ontario’s child welfare system. The Child Protection Services (CPS) transfer payment funds Children’s Aid Societies, which aim to help protect children under 18 who are experiencing or are at risk of experiencing abuse, including physical, sexual, and/or emotional abuse, and neglect or abandonment.
The majority of CPS expenditures are in investigations and direct service. Investigation expenditures include costs for investigation and assessment of children and youth who may be in need of protection. Direct service expenditures relate to ongoing child protection cases, which include the cost of supporting children and youth in the care of a Children’s Aid Society and children who remain at home but continue to receive supports and services from a Children’s Aid Society.
In 2023-24, MCCSS spent an estimated $1.7 billion on Child Protection Services. This included an estimated $0.2 billion to fund 65,841 investigations of reported abuse and neglect of children and youth under 18. MCCSS also spent approximately $1.4 billion to fund an estimated 14,230 ongoing protection cases, which include 11,632 children and youth in the care of a Society.[48]
Spending Forecast
The FAO projects CPS spending will grow at an average annual rate of 0.5 per cent from $1,681 million in 2023-24 to $1,724 million by 2028-29. The FAO projection is based on historical trends and includes the 2023 Ontario Budget commitment of $170 million over three years to allow youth leaving care to receive services and supports up to the age of 23.[49]
The average annual growth rate of 0.5 per cent is due to the assumption that direct service expenditures, which comprises about 81 per cent of CPS spending, will flatline over the forecast. This reflects the historical trend of flatlined direct service spending, which has averaged $1.3 billion since 2008-09. This lack of spending growth is partially due to declines in ongoing protection cases, which have decreased 49.6 per cent from a peak of 28,236 in 2012-13 to an estimated 14,230 in 2023-24. The largest group within ongoing protection cases is children and youth in care, which experienced a decline of 32.7 per cent from 17,273 in 2012-13 to an estimated 11,632 in 2023-24.
The FAO projects investigations expenditures will increase at an average annual rate of 4.2 per cent from $218 million in 2023-24 to $267 million in 2028-29, which is similar to its historical growth rate. From 2008-09 to 2019-20, spending increased by an average annual rate of 3.8 per cent. Over this period, approximately 82,719 investigations were completed annually. However, from 2020-21 to 2022-23, an average of 63,872 investigations were completed due in part to a drop in the number of referrals to Children’s Aid Societies during the COVID-19 pandemic.[50] The number of investigations in 2023-24 increased to approximately 65,841; however, this was still significantly below the pre-pandemic average.
Figure 7.3 Number of children and youth in care, ongoing open protection cases, and investigations completed, by fiscal year
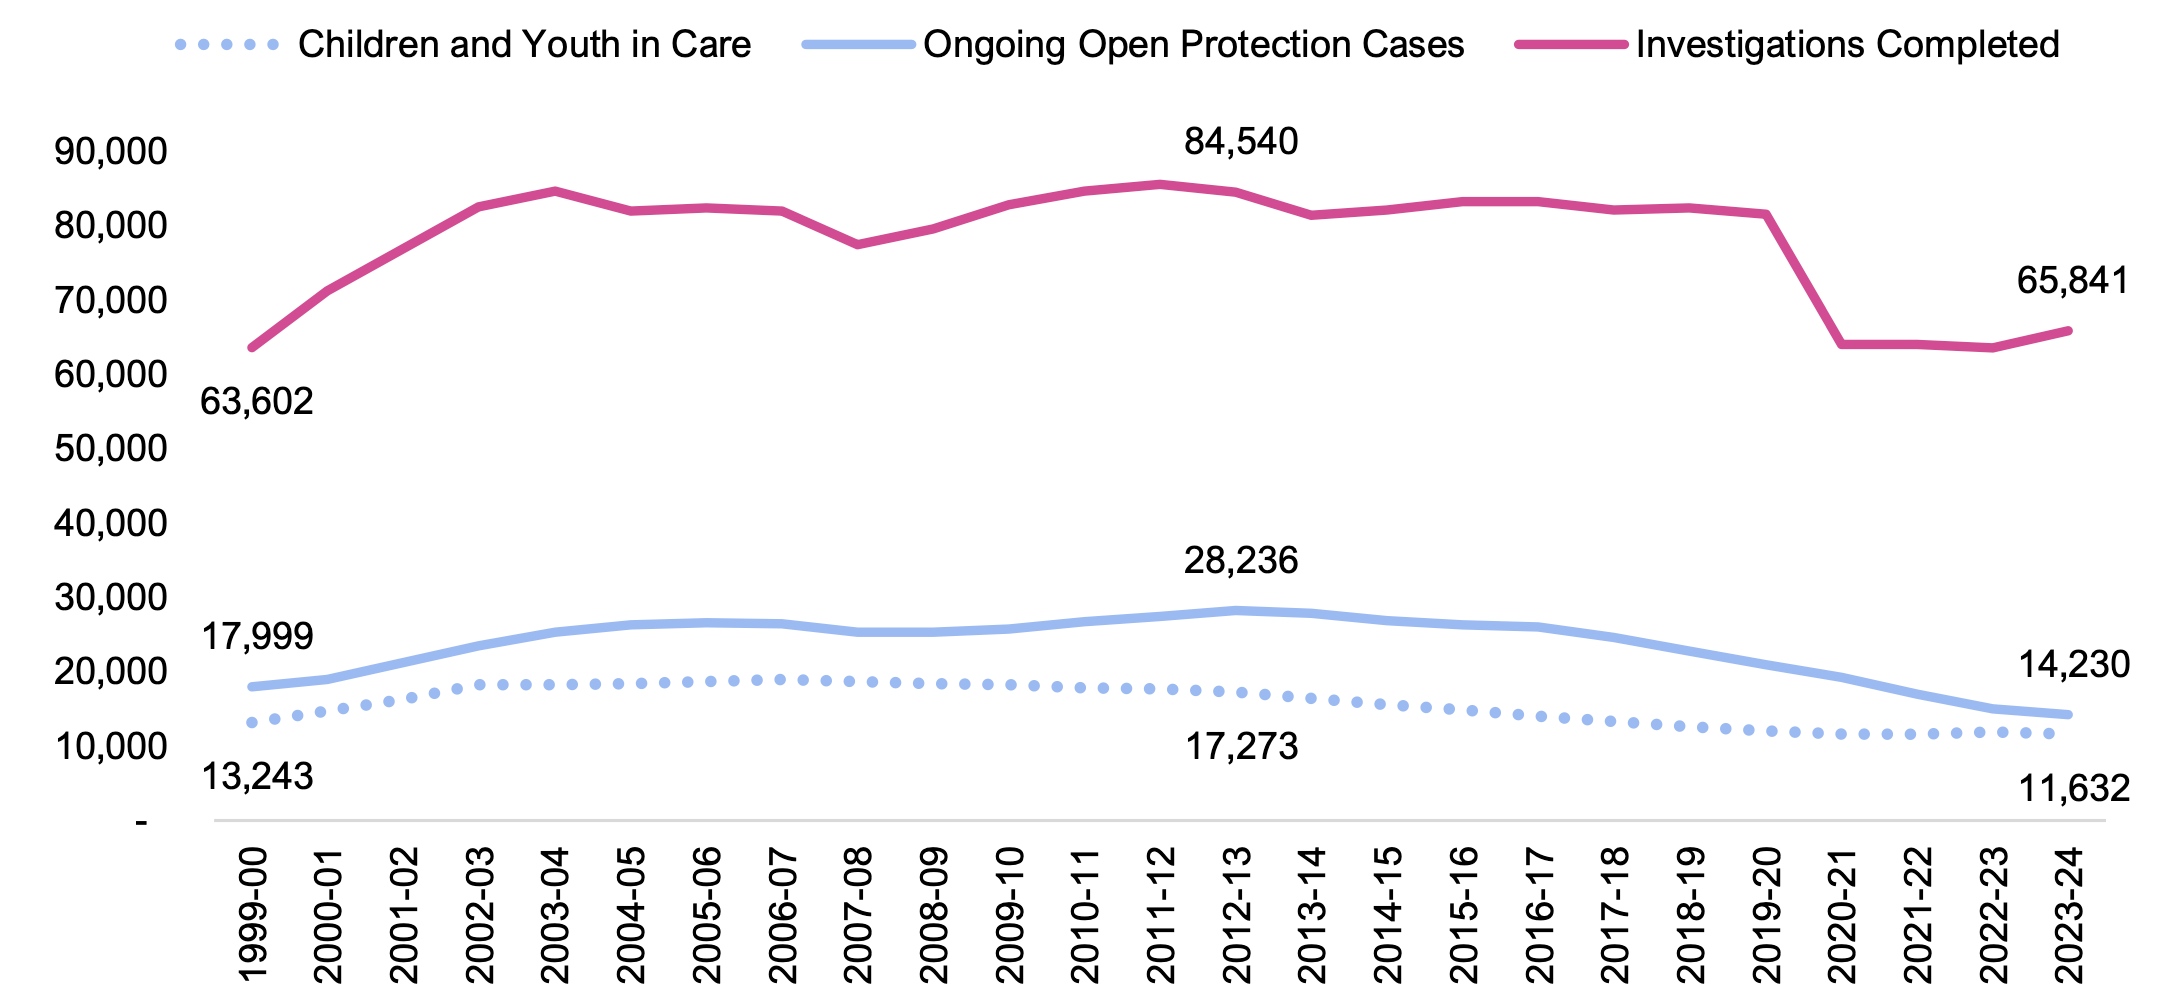
Note: 2023-24 values are based on full-year forecasts from Children’s Aid Societies. “Ongoing Open Protection Cases” includes “Children and Youth in Care.” Children and Youth in Care generally refers to children and youth who have been removed from home and are in the care of a Children’s Aid Society, excluding kinship care.
Source: FAO analysis of information provided by MCCSS
Accessible version
| Fiscal Year | Ongoing Open Protection Cases | Children and Youth in Care | Investigations Completed |
|---|---|---|---|
| 1999-00 | 17,999 | 13,243 | 63,602 |
| 2000-01 | 18,970 | 14,753 | 71,169 |
| 2001-02 | 21,227 | 16,218 | 76,816 |
| 2002-03 | 23,451 | 18,216 | 82,506 |
| 2003-04 | 25,323 | 18,283 | 84,564 |
| 2004-05 | 26,370 | 18,434 | 81,963 |
| 2005-06 | 26,531 | 18,660 | 82,395 |
| 2006-07 | 26,377 | 18,960 | 81,907 |
| 2007-08 | 25,280 | 18,668 | 77,357 |
| 2008-09 | 25,291 | 18,459 | 79,476 |
| 2009-10 | 25,738 | 18,212 | 82,786 |
| 2010-11 | 26,682 | 17,868 | 84,548 |
| 2011-12 | 27,386 | 17,697 | 85,526 |
| 2012-13 | 28,236 | 17,273 | 84,540 |
| 2013-14 | 27,829 | 16,434 | 81,393 |
| 2014-15 | 26,931 | 15,625 | 82,026 |
| 2015-16 | 26,289 | 14,813 | 83,229 |
| 2016-17 | 25,983 | 13,980 | 83,214 |
| 2017-18 | 24,553 | 13,323 | 82,072 |
| 2018-19 | 22,742 | 12,634 | 82,363 |
| 2019-20 | 20,995 | 12,015 | 81,454 |
| 2020-21 | 19,184 | 11,655 | 64,022 |
| 2021-22 | 16,933 | 11,599 | 64,054 |
| 2022-23 | 15,025 | 11,890 | 63,540 |
| 2023-24 | 14,230 | 11,632 | 65,841 |
Other Child Protection Services Spending
Other Child Protection Services Spending includes:
- the Child Welfare – Community and Prevention Supports transfer payment, which supports community and prevention supports, child welfare program improvements, permanency for children and youth in care, community capacity building programs, Alternative Dispute Resolution services, the Youth Outreach Worker Program, and initiatives to support youth leaving care;
- the Child-Welfare – Indigenous Community and Prevention Supports transfer payment,which provides a coordinated system of Indigenous-led community-based prevention programs and services for First Nations, Inuit, Métis and urban Indigenous children and youth, families, individuals and communities, including the Family Well-Being program; and
- ministry administrative expenses such as salaries and wages, and employee benefits.
Other Child Protection Services Spending is projected to increase from $211 million in 2023-24 to $235 million in 2028-29, representing an average annual growth rate of 2.1 per cent.[51]
Youth Justice Services (Sub-Item)
Within the Children and Youth at Risk vote-item, Youth Justice Services funds programs and services for youth between the ages of 12 and 17 who are in or at risk of conflict with the law. It consists of:
- the Youth Justice Services transfer payment, which funds the agency-operated facilities for youth in custody or detention, and other non-custodial services; and
- government-operated facilities and other Youth Justice Services spending, which funds custody and detention facilities that are directly operated by the provincial government, and administrative costs and other expenses.
Spending on Youth Justice Services is expected to grow at an average annual rate of 1.6 per cent between 2023-24 and 2028-29, from $275 million to $297 million.
Figure 7.4 FAO projected Youth Justice Services spending, $ millions
Source: Public Accounts of Ontario, 2024 Ontario Budget, and FAO analysis of information provided by MCCSS and Treasury Board Secretariat
Accessible version
| Actual | Forecast | |||||||||||
|---|---|---|---|---|---|---|---|---|---|---|---|---|
| 2017-18 | 2018-19 | 2019-20 | 2020-21 | 2021-22 | 2022-23 | 2023-24 | 2024-25 | 2025-26 | 2026-27 | 2027-28 | 2028-29 | |
| Youth Justice Services | 193 | 195 | 149 | 150 | 120 | 114 | 126 | 131 | 134 | 137 | 137 | 140 |
| Government-Operated Facilities and Other Youth Justice Services Spending | 169 | 176 | 142 | 145 | 138 | 136 | 149 | 151 | 152 | 154 | 155 | 157 |
| Total | 362 | 371 | 291 | 295 | 257 | 250 | 275 | 282 | 286 | 291 | 293 | 297 |
Program Overview
MCCSS administers Ontario’s youth justice system and provides a range of programs and services to youth between the ages of 12 and 17 (at the time of the offence) who are in or at risk of conflict with the law. The Youth Justice Services sub-item funds agency- and government-operated custody and detention facilities as well as non-custody and detention-related programs.[52]
Spending Forecast
The FAO projects that spending on the Youth Justice Services sub-item will grow at an average annual rate of 1.6 per cent, increasing from $275 million in 2023-24 to $297 million by 2028-29. In 2023-24, agency- and government-operated facilities had a combined capacity of 402 beds. The FAO assumes capacity will hold constant at the 2023-24 level, and spending growth will be driven primarily by wage growth and inflation.
Between 2004 and 2022, there was a 73 per cent reduction in youth charged with offences in Ontario.[53] Similarly, the average number of youth in custody or detention declined by 75 per cent from 982 youth in 2004-05 to 245 youth in 2022-23. These reductions are partly attributed by the ministry to the federal Youth Criminal Justice Act (2002), which aimed to reduce the incarceration of youth by increasing focus on prevention, diversion and community-based programs.[54] At the same time, capacity in the youth justice system fell by 80 per cent from 1,863 spaces in 2004-05 to 365 spaces in 2022-23, with the last significant decline due to the closure of youth detention centres in 2021 that were operating under capacity.[55]
However, youth crime has undergone a recent uptick, with a 26 per cent increase in youth charged with offences in Ontario in 2022 and a 42 per cent increase in the severity of violent crime, as measured by the Youth Violent Crime Severity Index (YVCSI).[56] Consequently, the average number of youth in custody and detention increased from 195 in 2021-22 to an estimated 293 in 2023-24.[57] MCCSS attributes the rising trend to more complex cases within the youth justice system that require greater mental health, education, and other supports and interventions. Given the challenging nature of projecting the factors that contribute to youth crime, the FAO has assumed that youth crime rates and the number of spaces available to hold youth in custody are maintained at current levels to 2028-29.
Figure 7.5 Youth in the youth justice system and capacity, by fiscal year
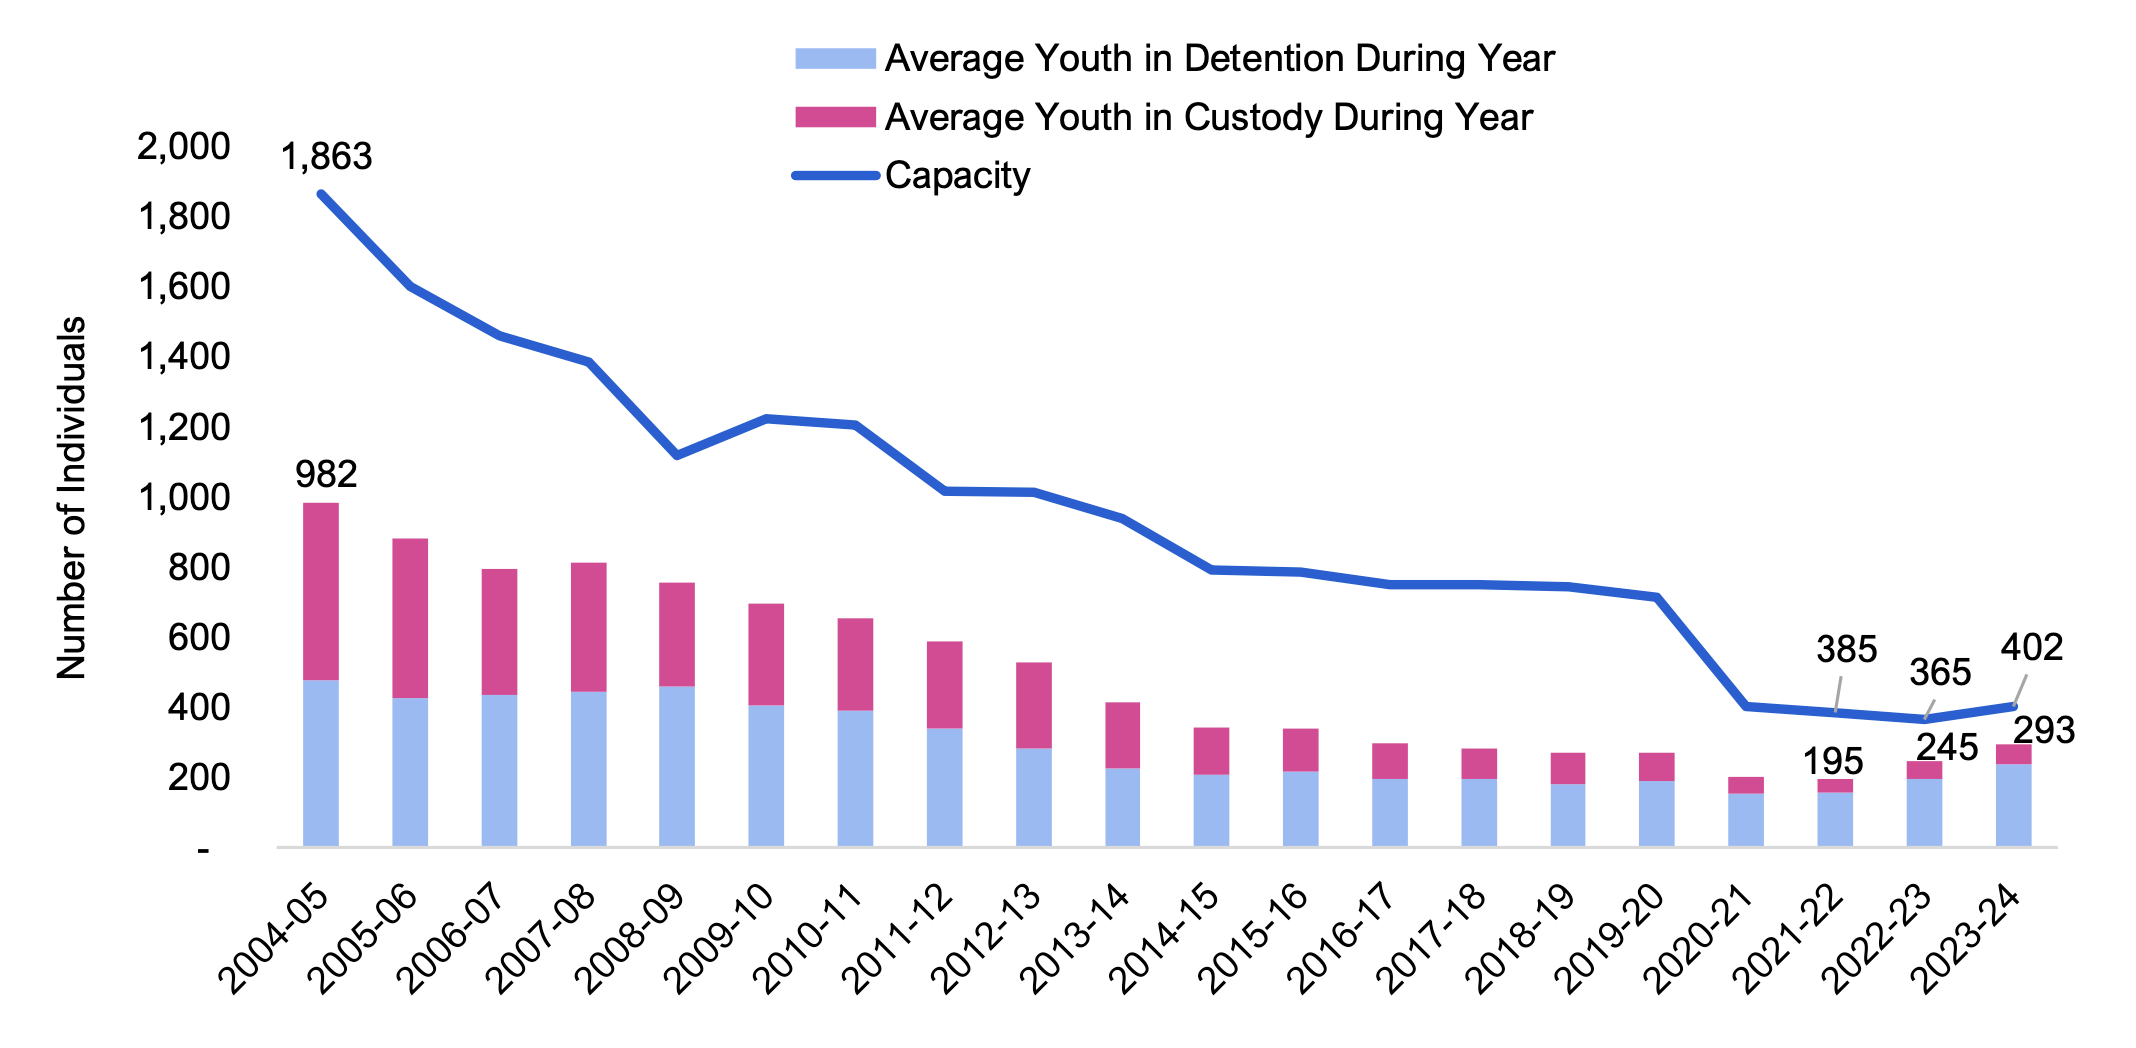
Note: Youth in detention represents those held in a correctional facility until their trial date is determined by the court, while youth in custody are those held in a correctional facility based on a conviction or sentence imposed by the court. 2023-24 values are as of February 29, 2024.
Source: FAO analysis of information provided by MCCSS.
Accessible version
| Fiscal Year | Average Youth in Detention During the Year | Average Youth in Custody During the Year | Sum of Youth in Detention and Custody | Capacity |
|---|---|---|---|---|
| 2004-05 | 478 | 504 | 982 | 1,863 |
| 2005-06 | 426 | 454 | 880 | 1,599 |
| 2006-07 | 435 | 361 | 795 | 1,458 |
| 2007-08 | 445 | 367 | 811 | 1,385 |
| 2008-09 | 458 | 298 | 756 | 1,117 |
| 2009-10 | 404 | 293 | 697 | 1,221 |
| 2010-11 | 389 | 264 | 653 | 1,205 |
| 2011-12 | 338 | 249 | 587 | 1,017 |
| 2012-13 | 283 | 246 | 529 | 1,013 |
| 2013-14 | 224 | 189 | 413 | 939 |
| 2014-15 | 208 | 133 | 341 | 792 |
| 2015-16 | 217 | 123 | 340 | 786 |
| 2016-17 | 194 | 102 | 296 | 750 |
| 2017-18 | 194 | 87 | 281 | 750 |
| 2018-19 | 180 | 90 | 270 | 742 |
| 2019-20 | 189 | 80 | 269 | 714 |
| 2020-21 | 153 | 49 | 202 | 403 |
| 2021-22 | 156 | 39 | 195 | 385 |
| 2022-23 | 195 | 50 | 245 | 365 |
| 2023-24 | 237 | 56 | 293 | 402 |
8. Ontario Child Benefit (Vote-Item 702-22)
Program Overview
The Ontario Child Benefit vote-item funds the Ontario Child Benefit (OCB), a tax-free payment to help low- to moderate-income families provide for their children. OCB payments are delivered with the federal Canada Child Benefit in a single monthly payment. From July 2023 to June 2024, families may receive up to $134 per month for each child under 18 years of age.[58] In addition, the Ontario Child Benefit Equivalent provides funding equal to the OCB directly to Children’s Aid Societies in respect of children and youth in care. In 2023-24, the Ontario Child Benefit vote-item represented an estimated 6.4 per cent of total ministry spending.
Spending Forecast
The FAO projects that OCB spending will increase at an average annual rate of 3.6 per cent from 2023-24 to 2028-29, from $1,236 million to $1,472 million. This forecast is driven by projected growth in benefit rates and in Ontario’s child population.
Figure 8.1 FAO projected Ontario Child Benefit spending, $ millions
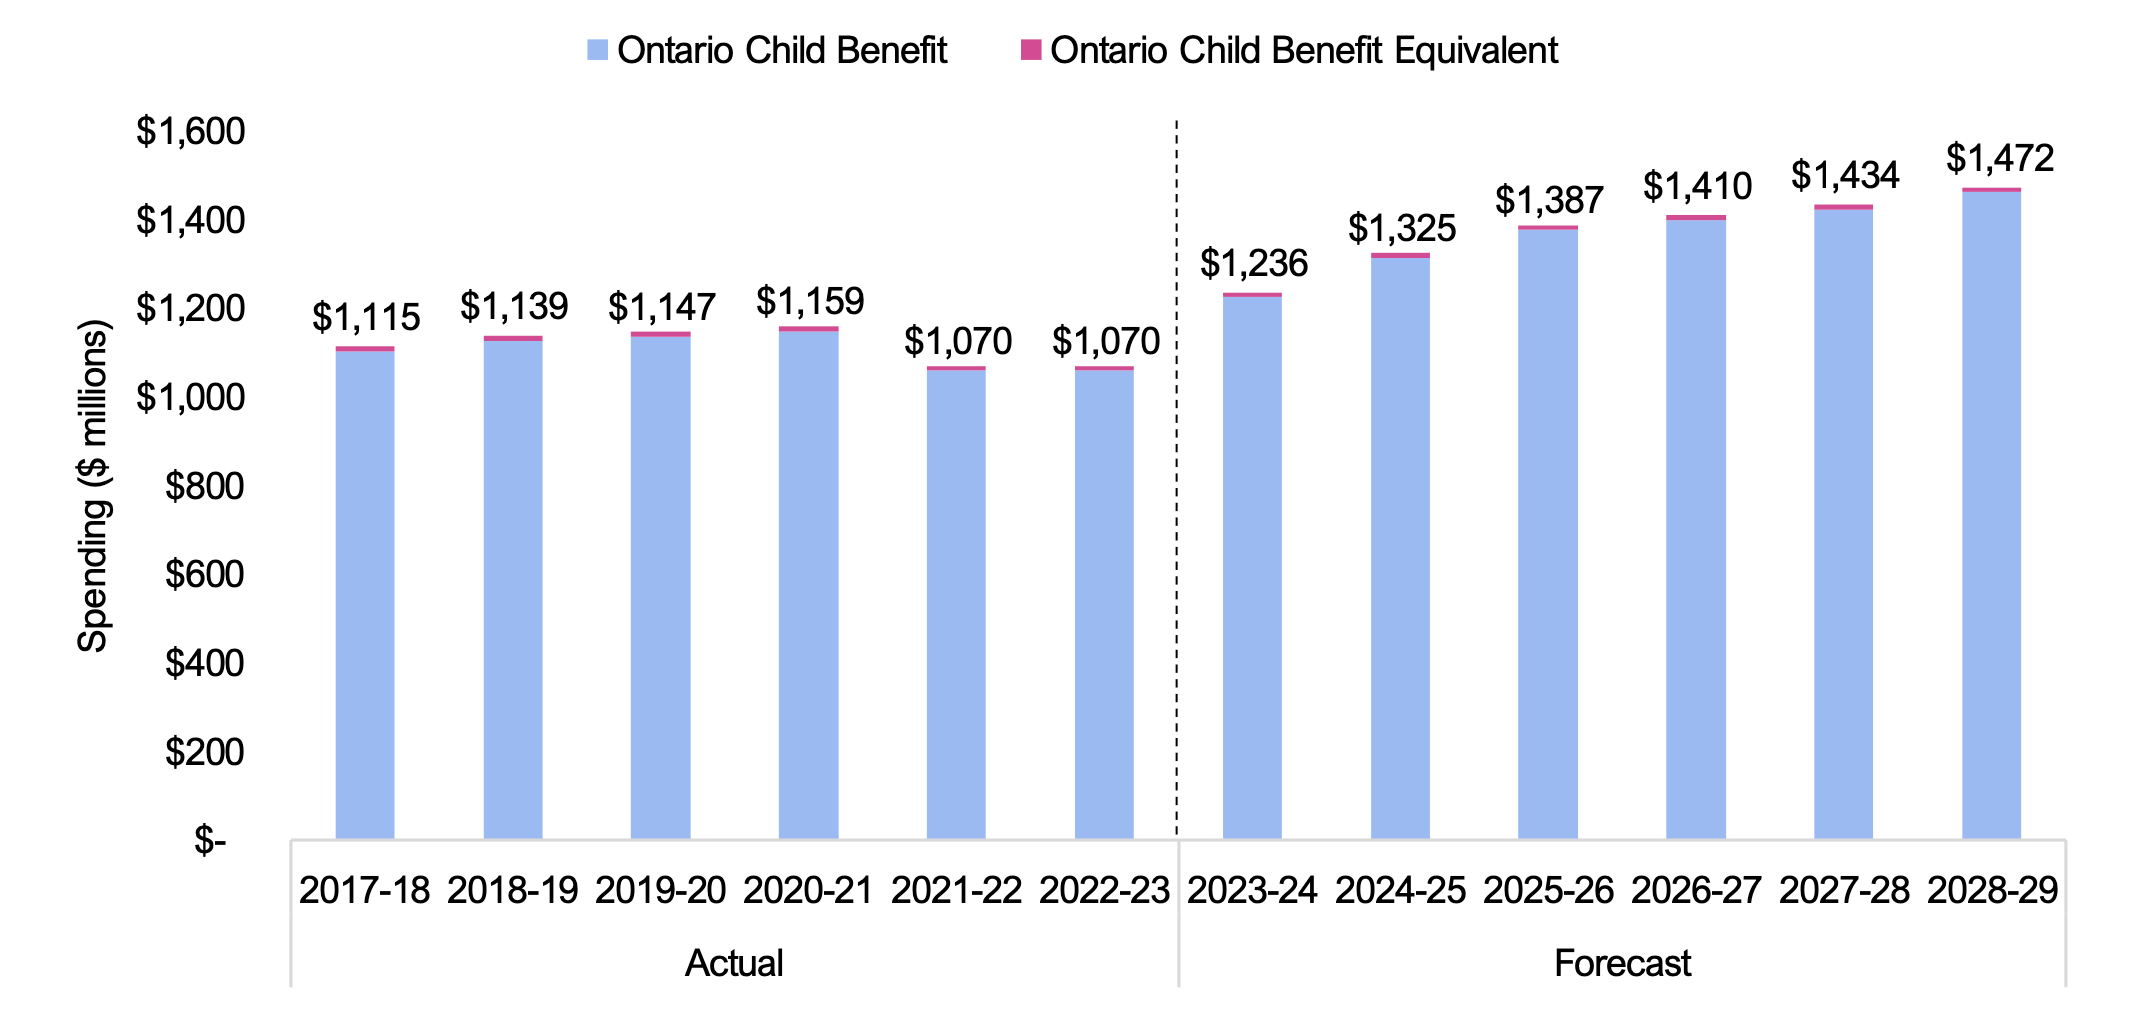
Source: Public Accounts of Ontario, 2024 Ontario Budget, and FAO analysis of information provided by MCCSS and Treasury Board Secretariat
Accessible version
| Actual | Forecast | |||||||||||
|---|---|---|---|---|---|---|---|---|---|---|---|---|
| 2017-18 | 2018-19 | 2019-20 | 2020-21 | 2021-22 | 2022-23 | 2023-24 | 2024-25 | 2025-26 | 2026-27 | 2027-28 | 2028-29 | |
| Ontario Child Benefit | 1,102 | 1,127 | 1,135 | 1,148 | 1,060 | 1,060 | 1,226 | 1,314 | 1,377 | 1,400 | 1,424 | 1,462 |
| Ontario Child Benefit Equivalent | 13 | 12 | 11 | 11 | 10 | 10 | 10 | 10 | 10 | 10 | 10 | 10 |
| Total | 1,115 | 1,139 | 1,147 | 1,159 | 1,070 | 1,070 | 1,236 | 1,325 | 1,387 | 1,410 | 1,434 | 1,472 |
OCB eligibility is calculated based on the family’s adjusted net income from the prior year. Increased federal COVID-19 income supports in 2020 and 2021 temporarily boosted some family incomes above the OCB income eligibility thresholds and reduced the number of OCB recipients and average benefits, which, in turn, reduced the program’s spending in 2021-22 and 2022-23. In 2023-24, estimated OCB spending exceeded pre-pandemic levels as spending grew by about 16 per cent, which was the first increase since 2020-21.
The FAO’s projection of 3.6 per cent average annual spending growth from 2023-24 to 2028-29 consists of a 2.7 per cent average annual growth in benefits[59] and 0.9 per cent annual growth in Ontario’s child population. OCB benefits are indexed to inflation; however, a lag in the inflation calculation means that high inflation in 2022 and 2023 will lead to a corresponding 4.5 per cent increase in the maximum benefit in July of 2024 from $134 per month to $140 per month.[60] Beyond 2024, the FAO projects growth in benefits to moderate in line with the FAO’s inflation forecast, increasing at an average annual rate of 2.3 per cent from a maximum of $140 per month in 2024 to $153 per month in 2028.
9. All Other Spending
All Other Spending is projected to decrease from $389 million in 2023-24 to $343 million in 2028-29, representing an average annual decline of -2.4 per cent. In 2023-24, this category accounted for an estimated 2.0 per cent of total ministry spending.
All Other Spending includes:
- Ministry Administration Program (Vote 701), which provides overall direction and administrative support. Spending for this program is projected to increase from $120 million in 2023-24 to $134 million by 2028-29, representing an average annual increase of 2.2 per cent. The FAO’s forecast is driven mainly by inflation and projected wage growth in ministry collective agreements.
- Family Responsibility Office (Vote-Item 702-7), which collects and distributes child and spousal support payments. Spending for this vote-item is projected to increase from $45 million in 2023-24 to $50 million by 2028-29, representing an average annual increase of 2.3 per cent, driven mainly by inflation and projected wage growth.
- Children, Youth and Social Services Information and Information Technology Cluster (Vote-Item 702-26), which provides information technology advice and operations to support the business and mandate of MCCSS. Spending for this vote-item is projected to increase from $94 million in 2023-24 to $104 million by 2028-29, representing an average annual increase of 2.2 per cent, driven mainly by inflation and projected wage growth.
- Office of Women’s Social and Economic Opportunity (Vote-Item 702-28), which consists of funding for Violence Prevention Initiatives and Economic Empowerment Initiatives. Spending for this vote-item is projected to increase from $24 million in 2023-24 to $74 million by 2028-29, representing an average annual growth rate of 25.7 per cent.[61]
- Children, Community and Social Services Capital Program (Vote 704), which funds infrastructure projects. The FAO projects that spending for this vote totalled $160 million in 2023-24 and will decrease to $126 million by 2028-29, representing an average annual decline of -4.6 per cent.
- Statutory Appropriations, which include ministerial salaries, bad debt expense and amortization. Spending is expected to decrease from $86 million in 2023-24 to $77 million in 2028-29, representing an average annual decline of -2.1 per cent.
- Consolidation adjustments, which include spending related to revenues raised by Children’s Aid Societies. These revenues are more than offset by reductions to account for MCCSS spending that is reflected as spending in the health, education and postsecondary education sectors, among other adjustments. The FAO projects that consolidation adjustments totalled -$139 million in 2023-24 and will decrease to -$222 million in 2028-29.
Footnotes
[1] The FAO’s MCCSS spending projection grows at an average annual rate of 4.2 per cent from 2023-24 to 2026-27.
[2] The FAO’s MCCSS spending projection grows at an average annual rate of 4.2 per cent from 2023-24 to 2026-27.
[3] Ontario Disability Support Program – Employment Assistance spending is included in Other Financial and Employment Supports in the FAO forecast.
[4] The prescribed asset limits for a benefit unit (i.e., case) are $40,000 for a single recipient, $50,000 for a couple and $500 for each dependant other than a spouse. See Ministry of Children, Community and Social Services, ODSP Policy Directives for Income Support.
[5] For more details on eligibility for ODSP, see Ministry of Children, Community and Social Services, Ontario Disability Support Program eligibility for income support.
[6] For more details on maximum monthly allowances, see Government of Ontario, ODSP Policy Directives for Income Support.
[7] Government of Ontario, ODSP health and disability benefits.
[8] One case refers to a single individual or a family unit on ODSP. The average annual ODSP allowance per case excludes payments for Assistance for Children with Severe Disabilities and other benefits.
[9] Don Kerr et al. (2019), From Temporary Financial Assistance to Longer Term Income Support: Probing the Growth in Ontario’s Disability Support Program, Canadian Review of Social Policy/RCPS 79:11-31.
[10] In July 2023, Ontario raised ODSP allowances by 6.5 per cent, in line with inflation for the previous year. Government of Ontario, Ontario’s Plan to Build Supporting Stronger Province and Economy.
[11] After the initial $1,000 of employment income, every additional dollar of income reduces ODSP benefits by 75 cents. Previously, ODSP recipients could earn up to $200 of employment income, with every additional dollar of income reducing ODSP benefits by 50 cents.
[12] Annual increases are based on changes in the average Ontario Consumer Price Index (CPI) between 12-month periods, i.e., the increase in July 2024 will be based on the change in Ontario CPI averages from October 2022 to September 2023 and the average from October 2021 to September 2022.
[13] Government of Canada, Budget 2024.
[14] Ontario Works – Employment Assistance costs are included in Other Financial and Employment Supports in the FAO forecast.
[15] The prescribed asset limits for a benefit unit are $10,000 for a single recipient, $15,000 for a couple and $500 for each dependant other than a spouse. Government of Ontario, OW Policy Directives for Income Support.
[16] Ontario Works Act, 1997.
[17] OW recipients can earn up to $200 in employment income without affecting their OW allowances. After the initial $200, every additional dollar of income reduces OW allowances by 50 cents.
[18] For more details on maximum monthly allowances, see Government of Ontario, OW Policy Directives for Income Support.
[19] The number of OW cases and average OW allowances include single cases, couples cases and sole support parent cases. One case refers to a single individual or a family unit.
[20] City of Toronto Employment & Social Services, 2024 Budget Notes Toronto Employment & Social Services; and Region of Peel, Income Support, 2024–2027 Business Plan and 2024 Budget.
[21] MCCSS confirmed to the FAO that it has no current plan in place to make any changes to eligibility or allowance rates for Ontario Works.
[22] Individuals who are no longer eligible for ODSP and OW may still receive coverage for prescription drugs through the Ontario Drug Benefit Plan from the Extended Health Benefit and Transitional Health Benefit. For more details, see Ministry of Children, Community and Social Services, Ontario Disability Support Program, policy directives for income support: 9.10 – Extended health benefit; and Ministry of Children, Community and Social Services, Ontario Disability Support Program policy directives for income support: 9.19 – Transitional health benefit.
[23] Government of Ontario, Building a Strong Foundation for Success: Reducing Poverty in Ontario.
[24] The FAO’s estimate is based on a historical inflation-adjusted per-resident average annual growth rate of 2.2 per cent, which is based on inflation-adjusted per-resident cost growth from 2005-06 to 2019-20, excluding the effect of new spending measures in the 2007, 2012, 2017 and 2018 Ontario budgets.
[25] The number of people waiting for placement represents those waiting who have had their needs assessment and does not include those who are seeking placement but are still unassessed.
[26] Once individuals complete their application package at a Developmental Services Ontario (DSO) agency, they are assigned a priority score. Based on information provided by MCCSS to the FAO, MCCSS determines a cut-off depending on available program funding, with individuals above this cut-off receiving full Passport program funding. See also Office of the Auditor General of Ontario, Value-for-Money Audit: Supportive Services for Adults with Developmental Disabilities.
[27] 2023-24 values are interim as of December 2023.
[28] The number of individuals seeking supportive services is based on a constant prevalence rate of 0.65 per cent of Ontario’s adult population (15 and older) and an assumed utilization rate of 90 per cent, similar to other income benefits. See Ontario Human Rights Commission, By the Numbers: A statistical profile of people with mental health and addiction disabilities in Ontario.
[29] The amount of payments issued differs from funding allocated due to timing differences between when funding is allocated, when funding agreements are signed, when payments are issued (often in multiple installments) and when expenses are incurred and reconciled.
[30] For more information about these programs, see Ontario Autism Program.
[31] For more information on historical changes to the Autism program, see the FAO’s 2020 report, A Financial Review of Autism Services and Program Design Considerations for the New Ontario Autism Program.
[32] Diagnostic Hubs provide autism assessments for children and youth and connect them with services in their communities.
[33] Capacity Building Initiatives include funding for a workforce capacity fund, training initiatives for Indigenous cultural competency and transition funding.
[34] Other Autism Services includes navigation services for registered children and youth, as well as respite seasonal camps and other specialized supports.
[35] AccessOAP is responsible for intake and registration for the OAP, service navigation and care coordination, carrying out the determination of needs process, and funding and reconciliation for core clinical services.
[36] Government of Ontario, Ontario Expanding Supports for Families of Children with Autism.
[37] 2024 Ontario Budget, p. 96.
[38] The FAO assumes that, of the $600 million annual Autism program budget, an estimated $345 million would be for core clinical services.
[39] Outside of the scope of this report are the Ministry of Health’s children’s hospital rehabilitation programs, which provide speech-language pathology, occupational therapy and physiotherapy services to children.
[40] Children and youth with special needs includes individuals with physical and developmental disabilities and/or who are medically fragile and/or technology dependent.
[41] For more details, see Government of Ontario, Ontario Connecting Children and Youth to Care Close to Home, July 19, 2023.
[42] 2023 Ontario Budget, p. 92.
[43] For more details, see Government of Ontario, Ontario Connecting Children and Youth to Care Close to Home, July 19, 2023.
[44] 2024 Ontario Budget, p. 108.
[45] Government of Ontario, Indigenous Healing and Wellness Strategy.
[46] Regional Delivery operates five regional offices that support transfer payment agencies to deliver ministry-funded programs such as Developmental Services, Violence Against Women and other programs. For more details, see MCCSS, Regional offices for the Ministry of Children, Community and Social Services.
[47] Starting in 2022-23, Children’s Aid Societies (CAS) were consolidated into the Province’s financial statements. The FAO includes CAS consolidation spending in All Other Spending, discussed in Chapter 9.
[48] The 2023-24 values for investigations, ongoing protection cases, and children and youth in care are based on full-year forecasts from Children’s Aid Societies.
[49] The FAO’s projection also incorporates a portion of the 2024 Ontario Budget commitment to support women, children, youth and others who are at increased risk of violence or exploitation. For more details, see 2024 Ontario Budget 2024 Ontario Budget, p. 108.
[50] CBC News, “Children’s Aid Society worries COVID-19 is silencing vulnerable children”, April 22, 2020.
[51] The FAO’s projection also incorporates a portion of the 2024 Ontario Budget commitment to support women, children, youth and others who are at increased risk of violence or exploitation. For more details, see 2024 Ontario Budget, p. 108.
[52] Non-custody and detention-related programs/services include alternative to custody, community partnerships, Indigenous services, mental health/specialized programming, prevention, and reintegration/rehabilitation (including probation services).
[53] Statistics Canada. Table 35-10-0177-01 Incident-based crime statistics, by detailed violations, Canada, provinces, territories, Census Metropolitan Areas and Canadian Forces Military Police.
[54] Government of Ontario, Ministry of Children, Community and Social Services (Archived – Published plans and annual reports 2019-2020).
[55] CTV News, Province closing 26 youth detention centres, including several in northeastern Ontario, March 3, 2021.
[56] Statistics Canada, Crime severity index and weighted clearance rates, Canada, provinces, territories and Census Metropolitan Areas.
[57] Interim data as of February 29, 2024.
[58] Canada Revenue Agency, Canada Child Benefit and related federal, provincial, and territorial programs.
[59] The FAO’s forecast incorporates the indexation of benefit rates and family income eligibility thresholds, and projected changes in household income.
[60] Annual increases are based on changes in the average Ontario Consumer Price Index (CPI) between 12-month periods. The increase in July 2024 was based on the change in the average Ontario CPI from October 2022 to September 2023 and the average from October 2021 to September 2022. For more details, see Ministry of Finance, Personal income tax rates and credits.
[61] The FAO’s forecast incorporates the 2022 Federal Budget investment of $539.3 million over five years, starting in 2022-23, to support provinces and territories in their efforts to implement the 10-year National Action Plan to End Gender-Based Violence. As per the bilateral agreement, Ontario will receive a maximum of $18.7 million in 2023-24, and $47.8 million in 2024-25, 2025-26 and 2026-27, and the FAO’s forecast assumes that funding will continue at $47.8 million annually thereafter.