


Summary
- This report describes Ontario’s recent economic performance based on the latest economic indicators.
- In the fourth quarter of 2023, Ontario’s real GDP, the broadest measure of economic activity, was unchanged, continuing a pattern of slowing growth underway since the Bank of Canada began raising interest rates in early 2022, to return inflation to its 2% target.
- The latest economic indicators suggest that Ontario’s economy improved modestly in the first quarter of 2024, with gains in employment, retail sales, housing market activity and exports. However, business activity softened, as manufacturing sales and wholesale trade both declined slightly.
- Ontario’s economic weakness in the last quarter of 2023 and modest gains in the first quarter of 2024 are consistent with the FAO’s latest economic forecast published in its Spring 2024 Economic and Budget Outlook (EBO).[1]
Introduction and Background
The Ontario Economic Monitor presents an overview of the latest trends in the Ontario economy based on the most recent economic data as of May 15, 2024.
Each quarter, the Government of Ontario (the Province) releases the Ontario Economic Accounts (OEA) that provides data on Gross Domestic Product (GDP), a comprehensive measure of economic activity in Ontario. The OEA is produced by the Ontario Ministry of Finance and is released approximately four months after the quarter closes.[2] The OEA is available on the Province’s Ontario Economic Accounts website.
In addition, there are many monthly economic indicators produced by Statistics Canada and other organizations that provide insight into Ontario’s economy, and form part of the underlying data used to produce the OEA. This report focusses on these indicators, which are typically released one to two months after the data is collected and provides more up-to-date information on Ontario’s economic performance in the most recent quarter.[3]
The report is laid out in the following sections:
- A summary of the Ontario Economic Accounts (OEA) that describes the province’s economic performance in the fourth quarter of 2023 (2023 Q4);
- A summary of the most recent monthly economic indicators for Ontario’s households and businesses in 2024 Q1; and
- An assessment of the FAO’s latest forecast given these recent economic trends.
For definitions of the various economic indicators shown in this report, as well as technical definitions of economic concepts, see the report’s Glossary. For information on the data used, see the report’s Methodology.
2023 Fourth Quarter Ontario Economic Accounts
The Ontario Economic Accounts (OEA) for the fourth quarter (October to December) of 2023 were released on April 11, 2024. They provide a comprehensive assessment of Ontario’s recent economic performance.
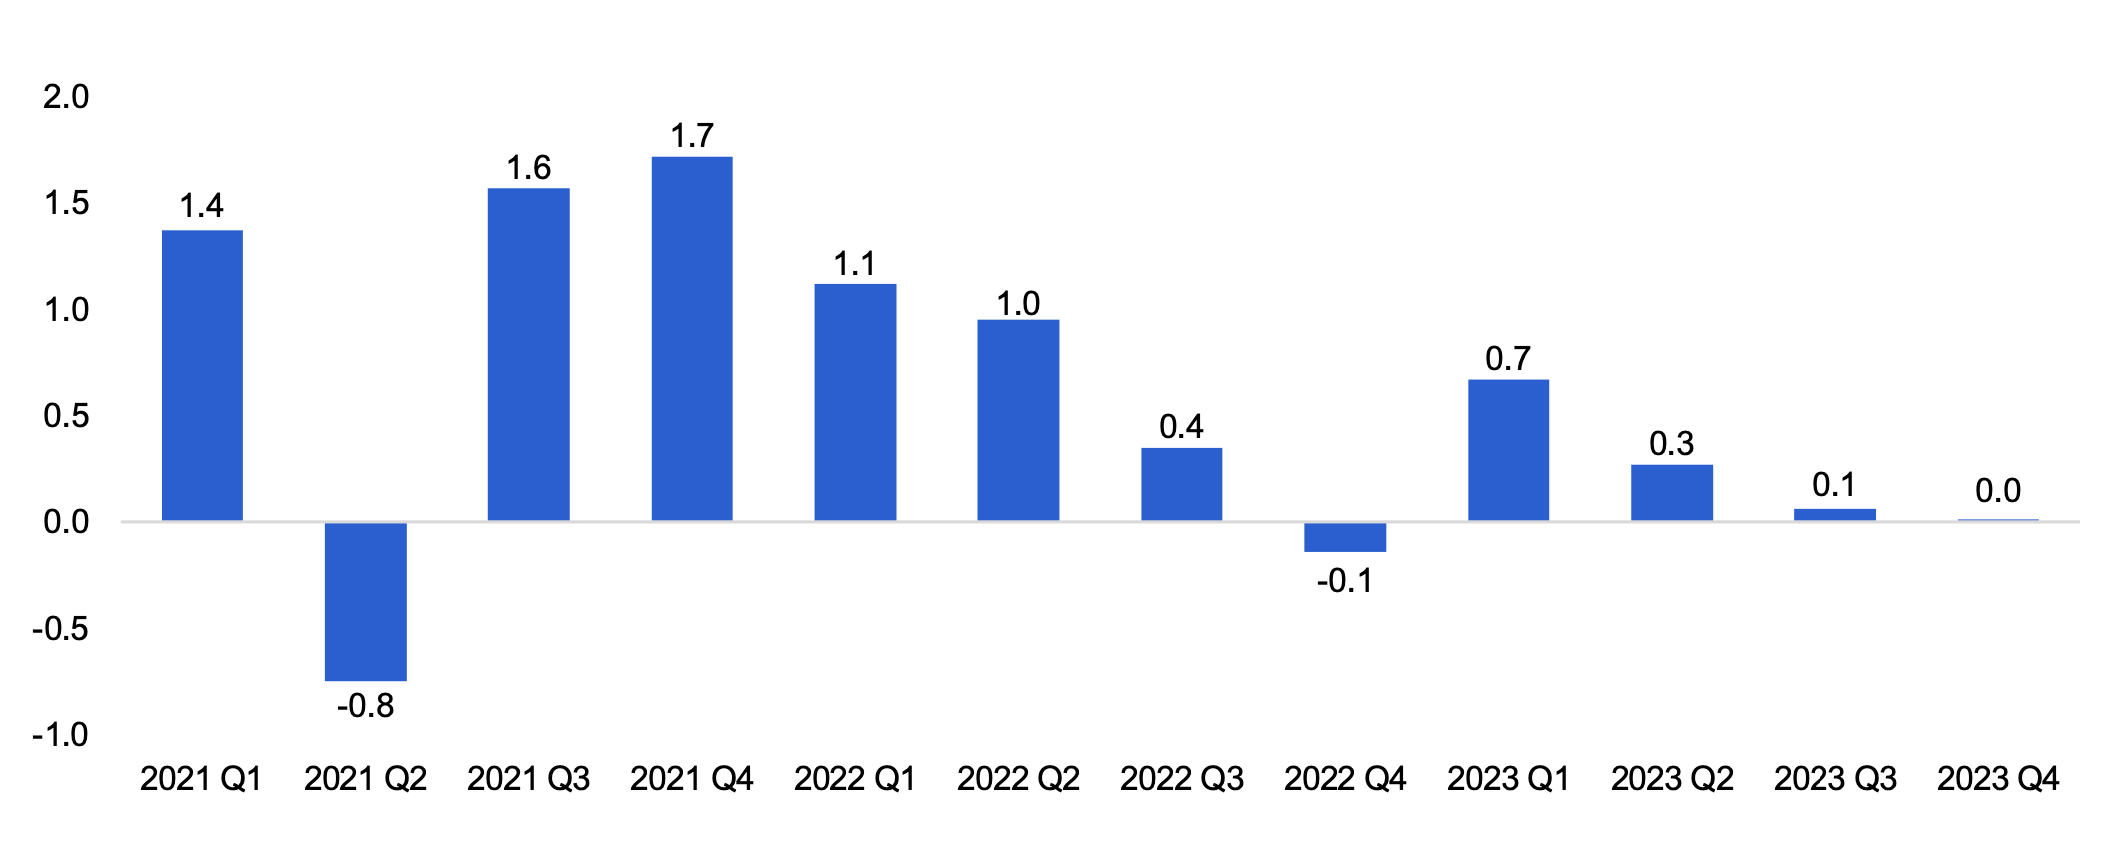
Real Gross Domestic Product (GDP) was unchanged in 2023 Q4, after recording modest growth of 0.1% in 2023 Q3. In 2023 Q4, gains in household expenditures (0.3%), government investment (1.2%) and an improvement in net trade (exports minus imports), were offset by declines in residential construction (‑0.3%), non-residential construction (‑3.0%), and machinery and equipment investment (‑1.3%).
Figure 1 Real GDP growth (seasonally adjusted, quarter-over-quarter, %)
Source: Ontario Economic Accounts and FAO
Accessible Version
| Per Cent Growth | |
|---|---|
| 2021 Q1 | 1.4 |
| 2021 Q2 | -0.8 |
| 2021 Q3 | 1.6 |
| 2021 Q4 | 1.7 |
| 2022 Q1 | 1.1 |
| 2022 Q2 | 1.0 |
| 2022 Q3 | 0.4 |
| 2022 Q4 | -0.1 |
| 2023 Q1 | 0.7 |
| 2023 Q2 | 0.3 |
| 2023 Q3 | 0.1 |
| 2023 Q4 | 0.0 |
Since the rebound following the early stages of the COVID-19 pandemic, where growth averaged 2.5% per quarter (2020 Q3 to 2022 Q1), economic activity in Ontario has slowed to an average 0.3% per quarter (2022 Q2 to 2023 Q4). The recent slow growth is about half the quarterly average of 0.6% from 2011 to 2019 and has coincided with the rise in the Bank of Canada’s policy interest rate, which increased from 0.25% at the start of 2022 to 5.00% by July 2023, where it has remained. Higher interest rates raise financing costs for households and businesses, slowing economic activity.
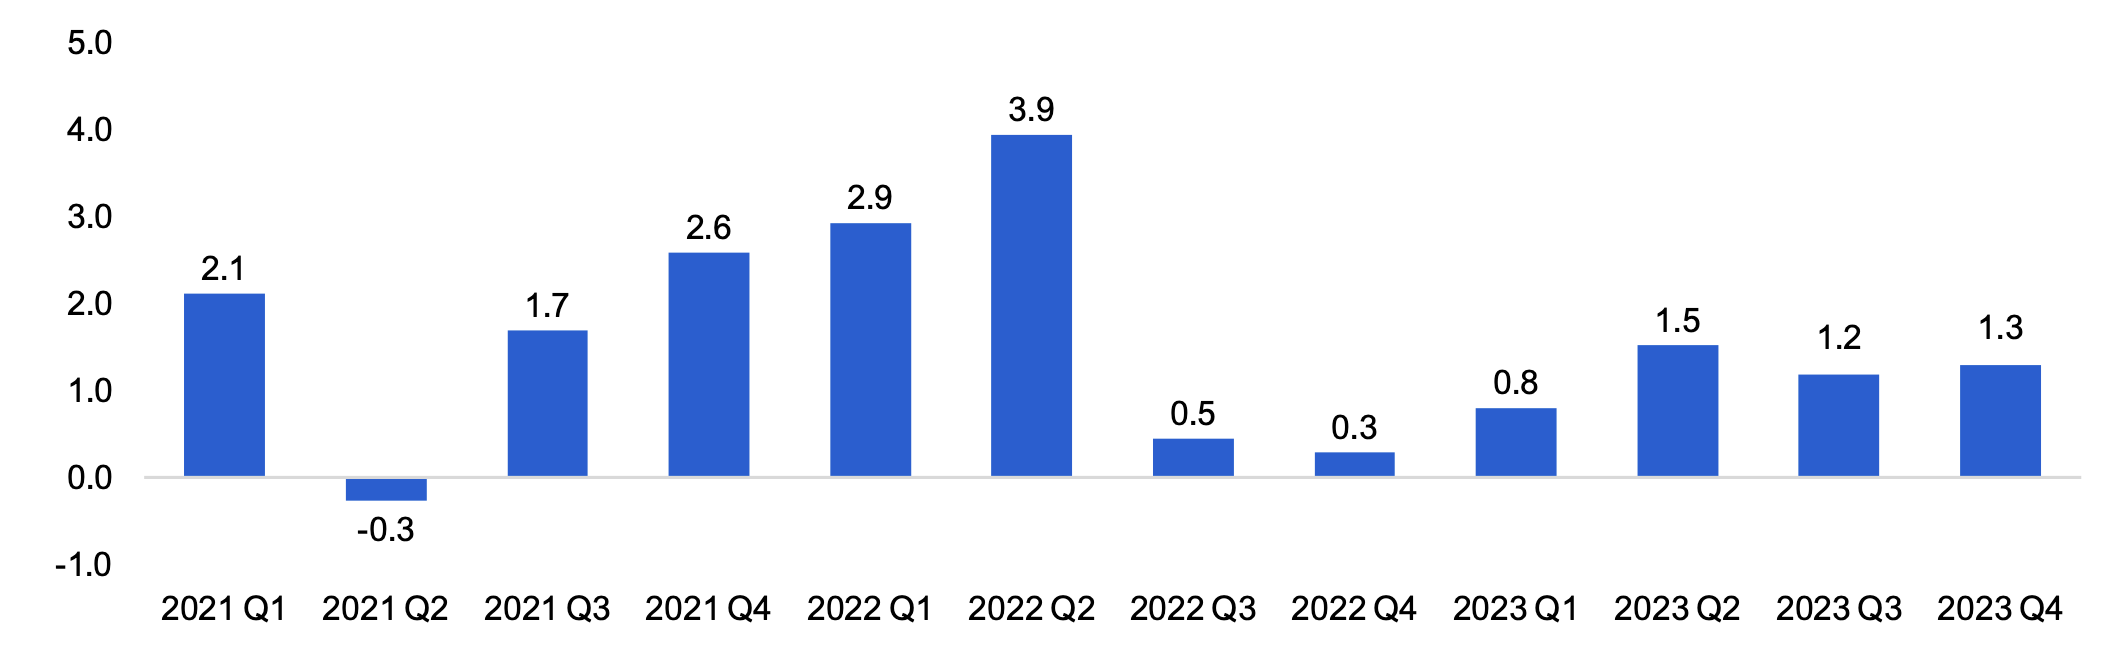
Nominal GDP, the broadest measure of the tax base, increased 1.3% in 2023 Q4, reflecting gains in labour income (0.7%), corporate profits (5.2%) and unincorporated business income (3.5%). Labour income has recorded consistent gains since mid-2020, while corporate profits have struggled and were 27.0% below their peak reached in 2021 Q1.
Figure 2 Nominal GDP growth (seasonally adjusted, quarter-over-quarter, %)
Source: Ontario Economic Accounts and FAO
Accesible Version
| Per Cent Growth | |
|---|---|
| 2021 Q1 | 2.1 |
| 2021 Q2 | -0.3 |
| 2021 Q3 | 1.7 |
| 2021 Q4 | 2.6 |
| 2022 Q1 | 2.9 |
| 2022 Q2 | 3.9 |
| 2022 Q3 | 0.5 |
| 2022 Q4 | 0.3 |
| 2023 Q1 | 0.8 |
| 2023 Q2 | 1.5 |
| 2023 Q3 | 1.2 |
| 2023 Q4 | 1.3 |
For more detailed information on Ontario’s economic performance in 2023 Q4, see the Ontario Economic Accounts.
Ontario’s 2024 First Quarter Economic Indicators
Available economic indicators suggest that Ontario’s economy grew modestly in 2024 Q1.
Households
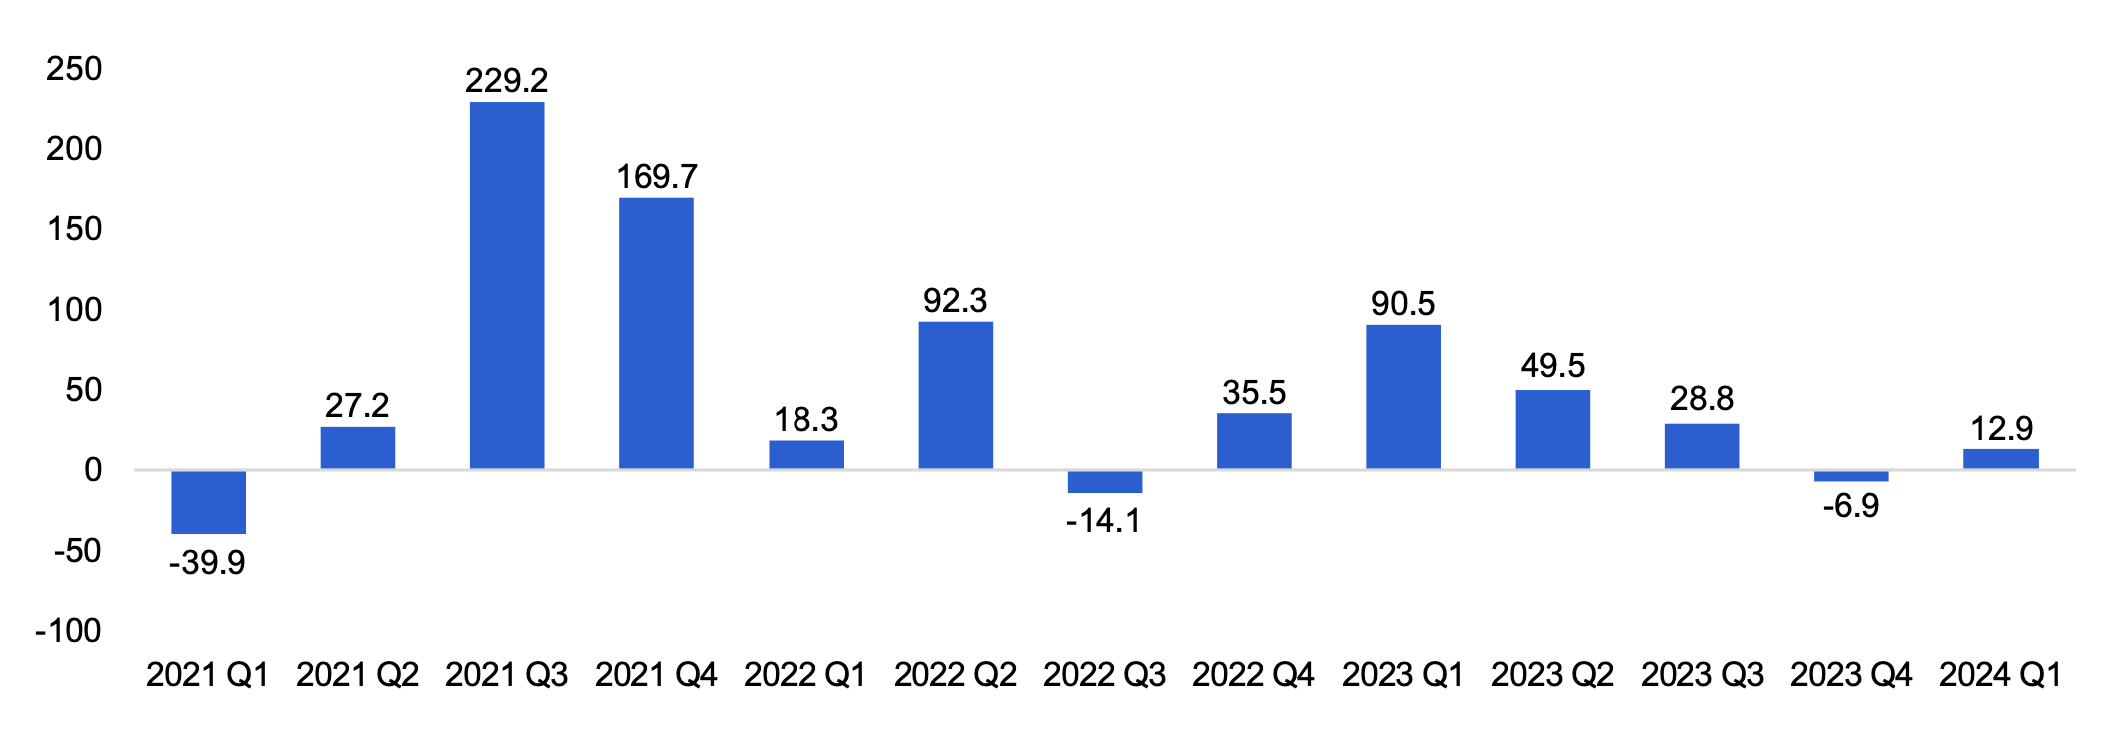
Employment in Ontario rose by 12,900 jobs in 2024 Q1, an increase of 0.2%, after a decline of 0.1% in 2023 Q4. The modest increase in employment in 2024 Q1 marked a continuation of Ontario’s weak job market performance underway since mid-2023 and resulted in an increase in the unemployment rate to 6.5% in 2024 Q1, up more than a full percentage point from 5.2% in 2023 Q1.
Job gains in 2024 Q1 were concentrated in part-time positions (+39,600), while full-time employment declined (‑26,700). The public sector accounted for all job growth in the quarter (+30,500), while private-sector employment (‑11,400) and the number of self-employed (‑6,300) both declined.
Core-age workers (age 24 to 54) accounted for the majority of the increase in employment (+20,300), while there were smaller gains among workers aged 55 and older (+6,700). Youth employment (age 15 to 24) declined by ‑14,100.
By industry, finance (+15,800), education (+12,400) and professional services (+9,500) saw the largest employment gains, while accommodation and food services (‑15,400), health care and social assistance (‑7,800) and agriculture (‑4,800) had the largest declines.
Figure 3 Change in employment (seasonally adjusted, quarter-over-quarter, thousands)
Source: Statistics Canada Table 14-10-0287-01 and FAO
Accessible Version
| Thousands | |
|---|---|
| 2021 Q1 | -39.9 |
| 2021 Q2 | 27.2 |
| 2021 Q3 | 229.2 |
| 2021 Q4 | 169.7 |
| 2022 Q1 | 18.3 |
| 2022 Q2 | 92.3 |
| 2022 Q3 | -14.1 |
| 2022 Q4 | 35.5 |
| 2023 Q1 | 90.5 |
| 2023 Q2 | 49.5 |
| 2023 Q3 | 28.8 |
| 2023 Q4 | -6.9 |
| 2024 Q1 | 12.9 |
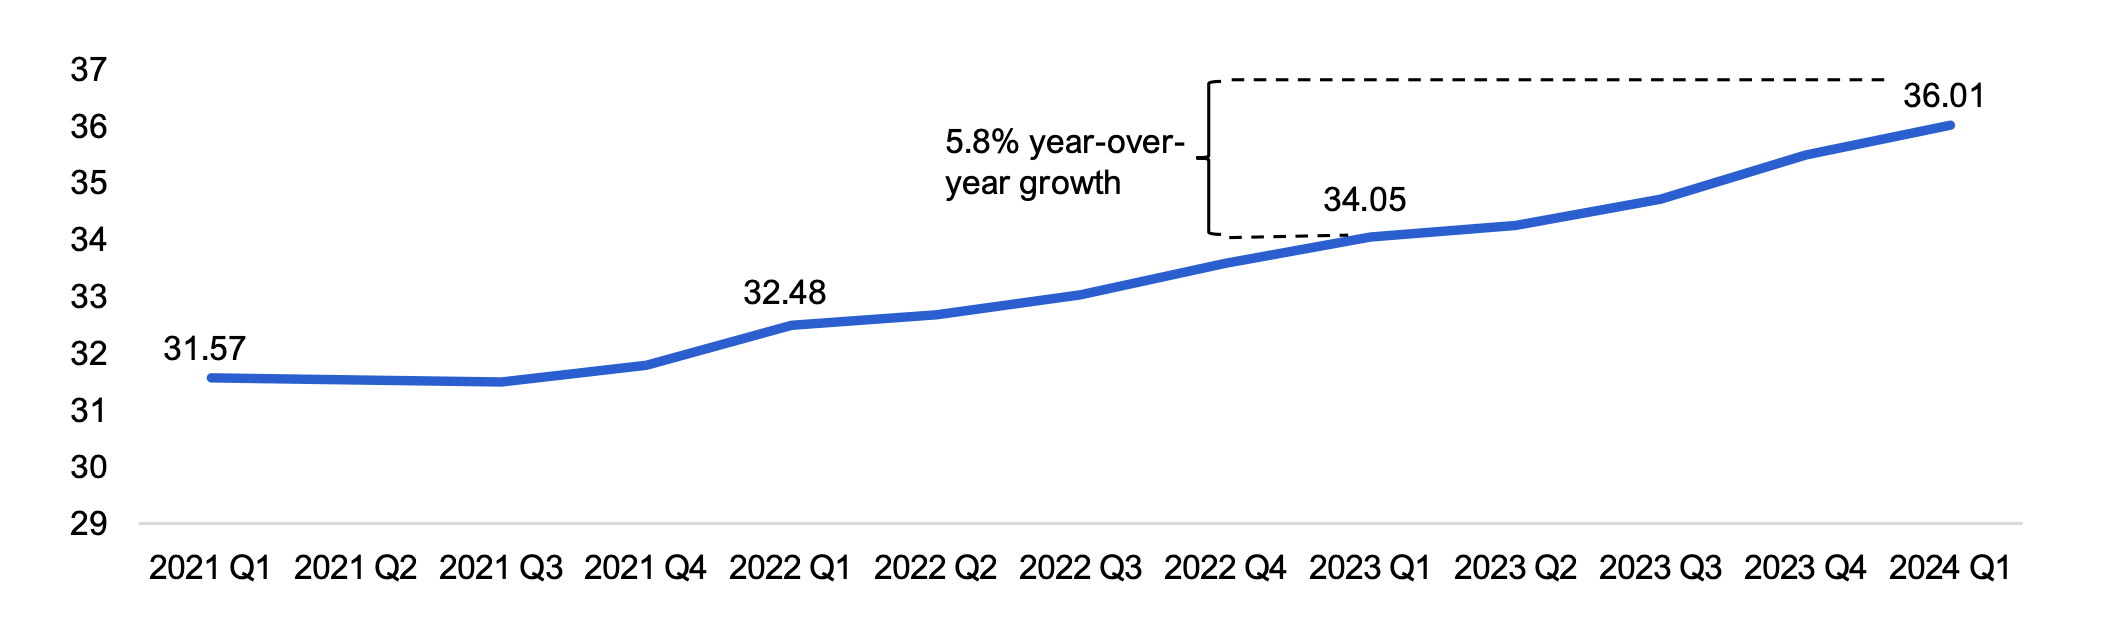
Average hourly wages grew 5.8% in 2024 Q1 when compared to 2023 Q1, reaching $36.01 an hour. Hourly wage growth was broad-based across most major industries, with wages in services-producing industries increasing 5.9% and goods-producing industries rising 5.3%. Industries with the fastest wage growth were wholesale and retail trade (8.8%), construction (7.6%), healthcare (7.2%) and accommodation and food services (7.2%). Wage growth has been strong since 2022, reflecting elevated inflation and high job vacancies over most of the period.
Figure 4 Average hourly wages (non-seasonally adjusted, dollars per hour)
Source: Statistics Canada Table 14-10-0063-01 and FAO
Accessible Version
| Dollars per hour | |
|---|---|
| 2021 Q1 | 31.57 |
| 2021 Q2 | 31.54 |
| 2021 Q3 | 31.49 |
| 2021 Q4 | 31.79 |
| 2022 Q1 | 32.48 |
| 2022 Q2 | 32.68 |
| 2022 Q3 | 33.02 |
| 2022 Q4 | 33.58 |
| 2023 Q1 | 34.05 |
| 2023 Q2 | 34.25 |
| 2023 Q3 | 34.71 |
| 2023 Q4 | 35.49 |
| 2024 Q1 | 36.01 |
Retail sales grew 0.9% in 2024 Q1 in Ontario,[4] with growth driven primarily by sporting goods and hobby retailers, general merchandise retailers, food and gasoline sales. Ontario retail sales growth has been weak since mid-2022, reflecting the impact of high interest rates, which has prompted some consumers to postpone or cut back on discretionary spending.[5]
Figure 5 Retail sales growth (seasonally adjusted, quarter-over-quarter, %)
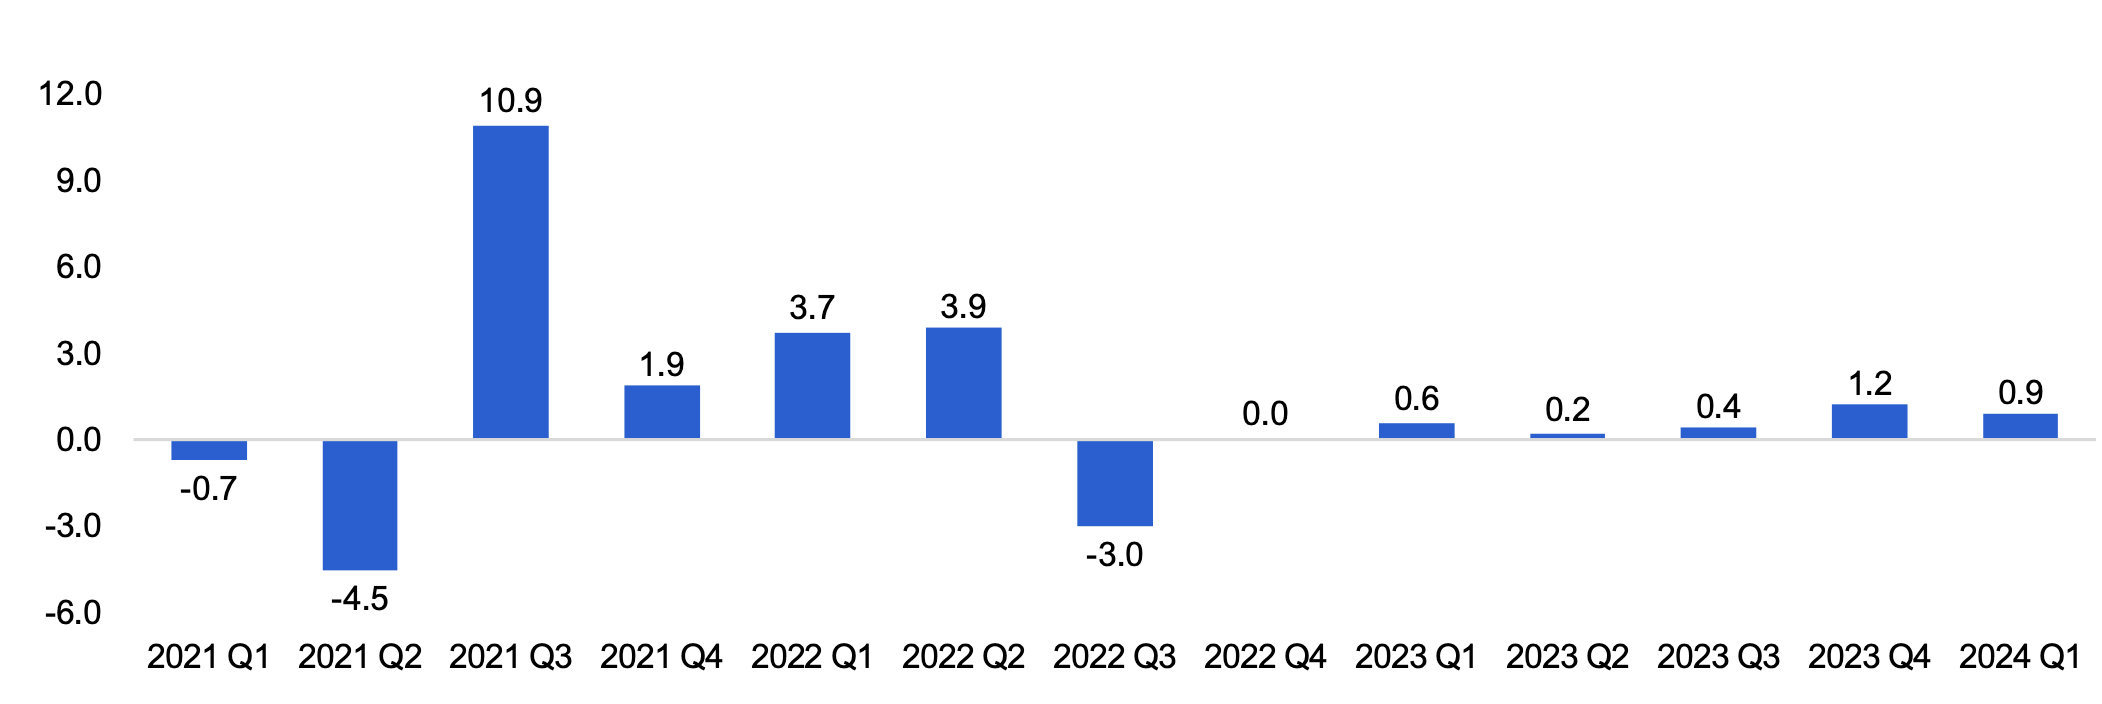
Source: Statistics Canada Table 20-10-0056-01 and FAO
Accessible Version
| Per Cent Growth | |
|---|---|
| 2021 Q1 | -0.7 |
| 2021 Q2 | -4.5 |
| 2021 Q3 | 10.9 |
| 2021 Q4 | 1.9 |
| 2022 Q1 | 3.7 |
| 2022 Q2 | 3.9 |
| 2022 Q3 | -3.0 |
| 2022 Q4 | 0.0 |
| 2023 Q1 | 0.6 |
| 2023 Q2 | 0.2 |
| 2023 Q3 | 0.4 |
| 2023 Q4 | 1.2 |
| 2024 Q1 | 0.9 |
The Ontario Consumer Price Index (CPI) inflation rate[6] was 2.6% in 2024 Q1, the lowest rate since 2021 Q1. Of the major CPI components, shelter costs increased by the largest amount (5.4%), followed by health and personal care (3.3%), alcohol and tobacco (3.2%), transportation (2.9%) and food (2.7%). The costs of both household operations, furnishings and equipment (‑1.9%) and clothing (‑0.6%) declined.
Inflation has continued to slow after reaching 7.5% in 2022 Q2, the highest quarterly rate in Ontario since 1983 Q1. The decline in inflation coincided with a rapid increase in interest rates by the Bank of Canada, improved supply chains and easing consumer demand. Inflation rates in most major categories have declined from their recent peaks, although to a lesser extent for shelter, healthcare products, and alcohol and tobacco.
CPI inflation in both Canada and Ontario has recently fallen below 3%. While current inflation rates are within the Bank of Canada’s 1% to 3% target range, the Bank aims to keep inflation at 2% in the medium term.
Figure 6 CPI inflation rate (non-seasonally adjusted, year-over-year, %)
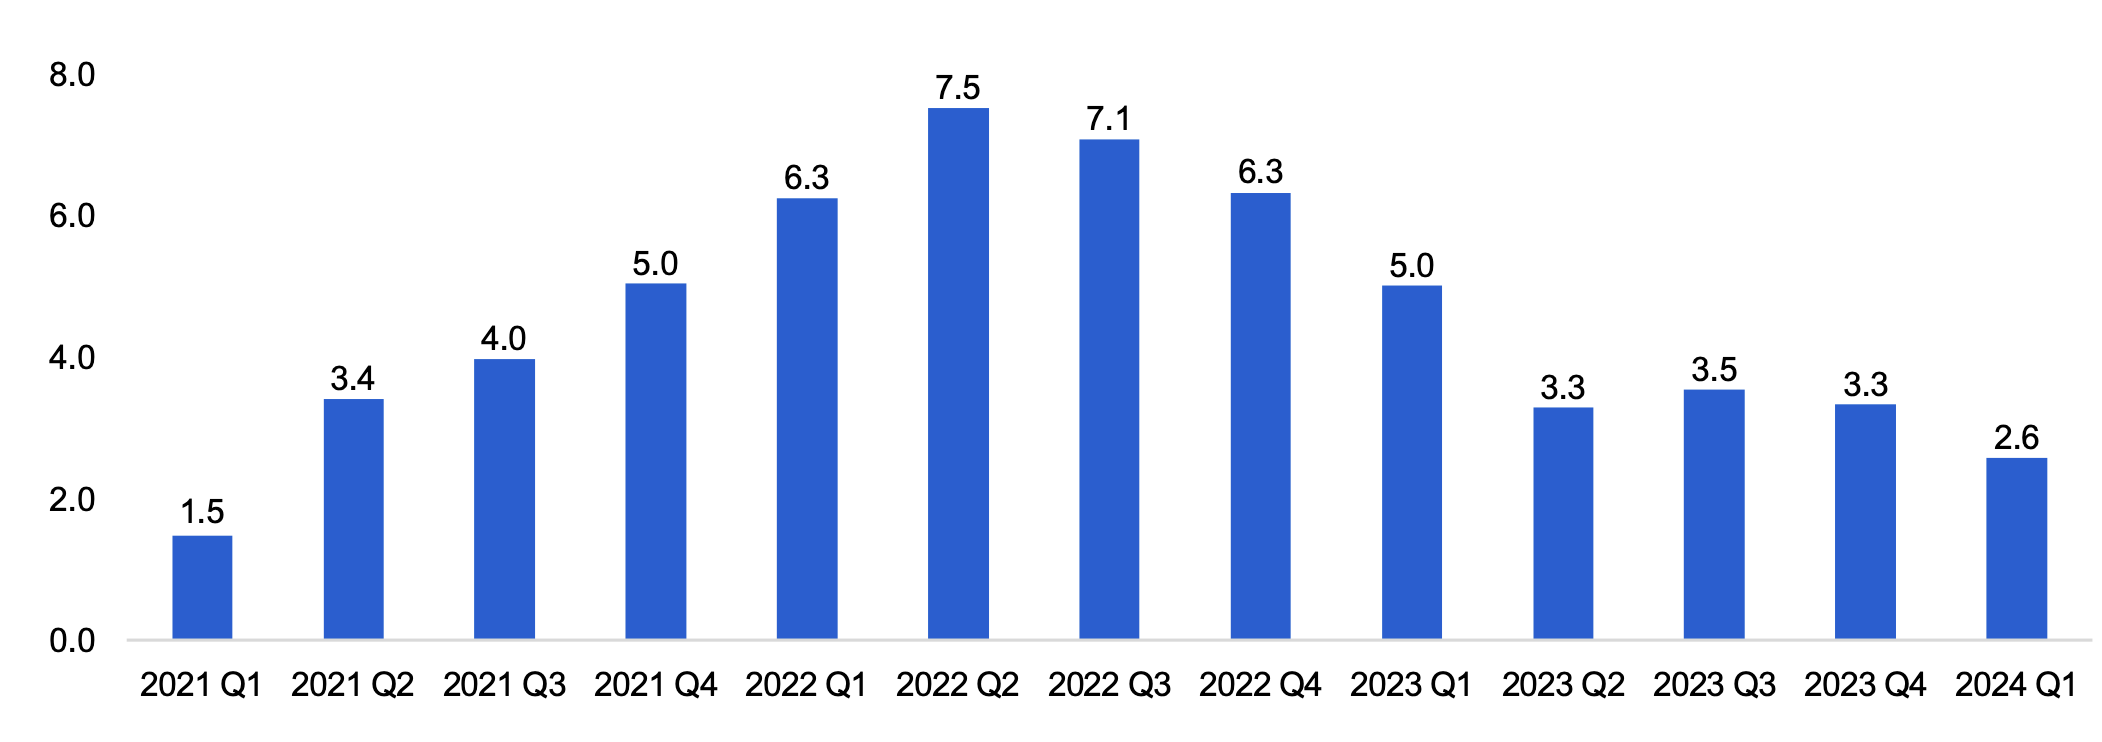
Source: Statistics Canada Table 18-10-0004-01 and FAO.
Accessible Version
| Per Cent | |
|---|---|
| 2021 Q1 | 1.5 |
| 2021 Q2 | 3.4 |
| 2021 Q3 | 4.0 |
| 2021 Q4 | 5.0 |
| 2022 Q1 | 6.3 |
| 2022 Q2 | 7.5 |
| 2022 Q3 | 7.1 |
| 2022 Q4 | 6.3 |
| 2023 Q1 | 5.0 |
| 2023 Q2 | 3.3 |
| 2023 Q3 | 3.5 |
| 2023 Q4 | 3.3 |
| 2024 Q1 | 2.6 |
Ontario home resales rose 12.4% in 2024 Q1 from the previous quarter, with 43,000 units sold. While home resales activity increased in 2024 Q1, it was lower than average resales seen from 2017 to 2019 of 51,800 units per quarter, and much lower than the peak of resales recorded from 2020 Q3 to 2022 Q1, which averaged 68,400 units per quarter. Despite robust population growth, home resales activity has declined in tandem with the increase in mortgage rates, starting in early 2022. This has caused home carrying costs to rise rapidly.
Figure 7 Housing resales (seasonally adjusted, thousands of units)
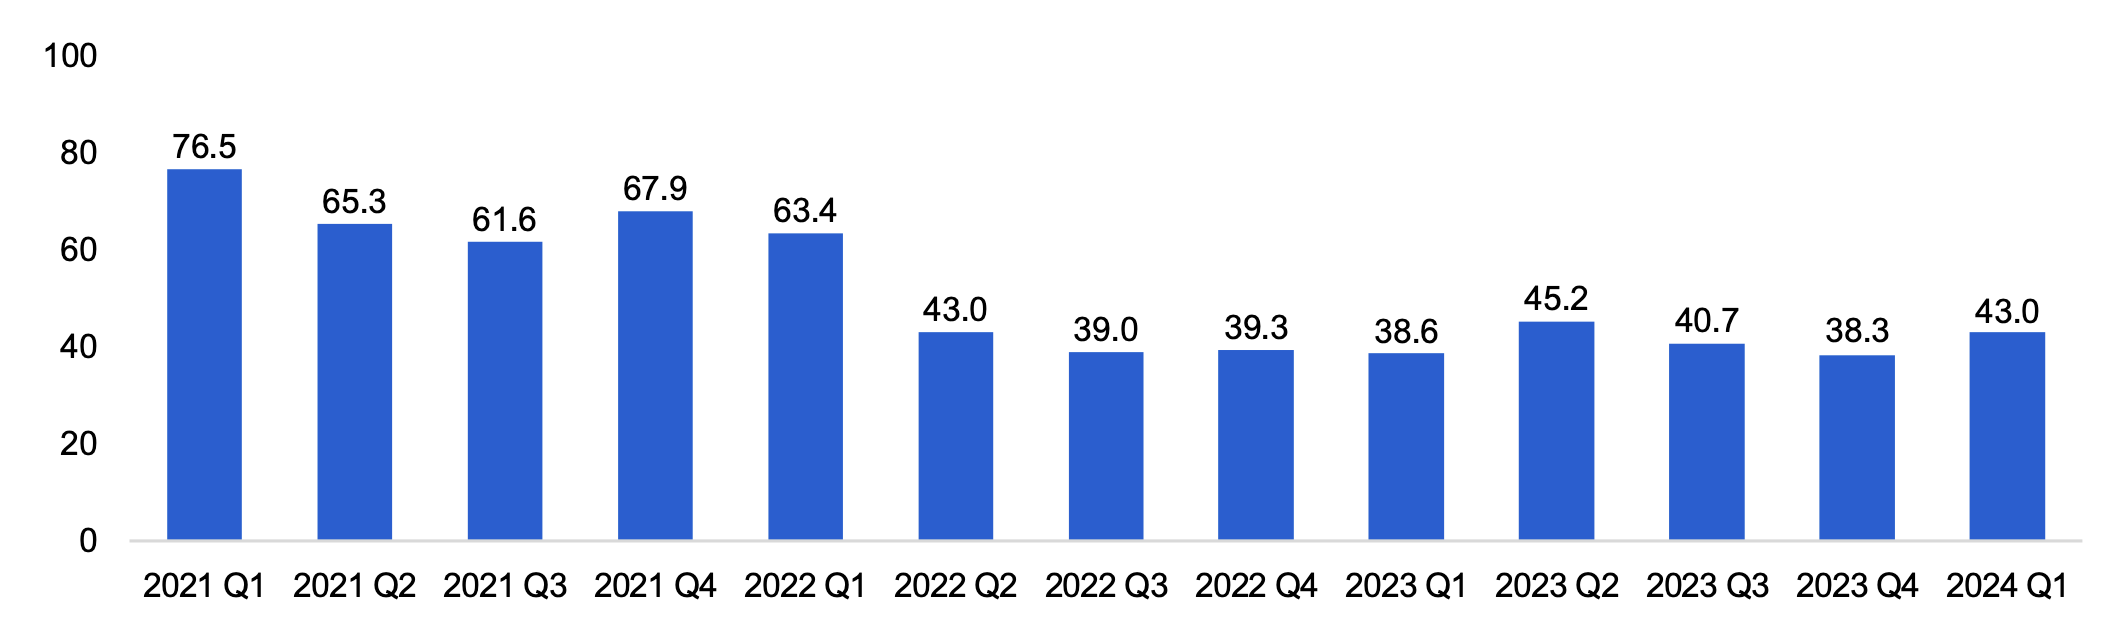
Source: Canadian Real Estate Association and FAO.
Accessible Version
| Thousands of units | |
|---|---|
| 2021 Q1 | 76.5 |
| 2021 Q2 | 65.3 |
| 2021 Q3 | 61.6 |
| 2021 Q4 | 67.9 |
| 2022 Q1 | 63.4 |
| 2022 Q2 | 43.0 |
| 2022 Q3 | 39.0 |
| 2022 Q4 | 39.3 |
| 2023 Q1 | 38.6 |
| 2023 Q2 | 45.2 |
| 2023 Q3 | 40.7 |
| 2023 Q4 | 38.3 |
| 2024 Q1 | 43.0 |
Home resale prices in Ontario averaged $840,000 in 2024 Q1. The average resale home price has fallen $180,300 (or ‑17.7%) since reaching a peak of $1,020,300 in the first quarter of 2022.
Figure 8 Average home resale prices (seasonally adjusted, $ thousands)
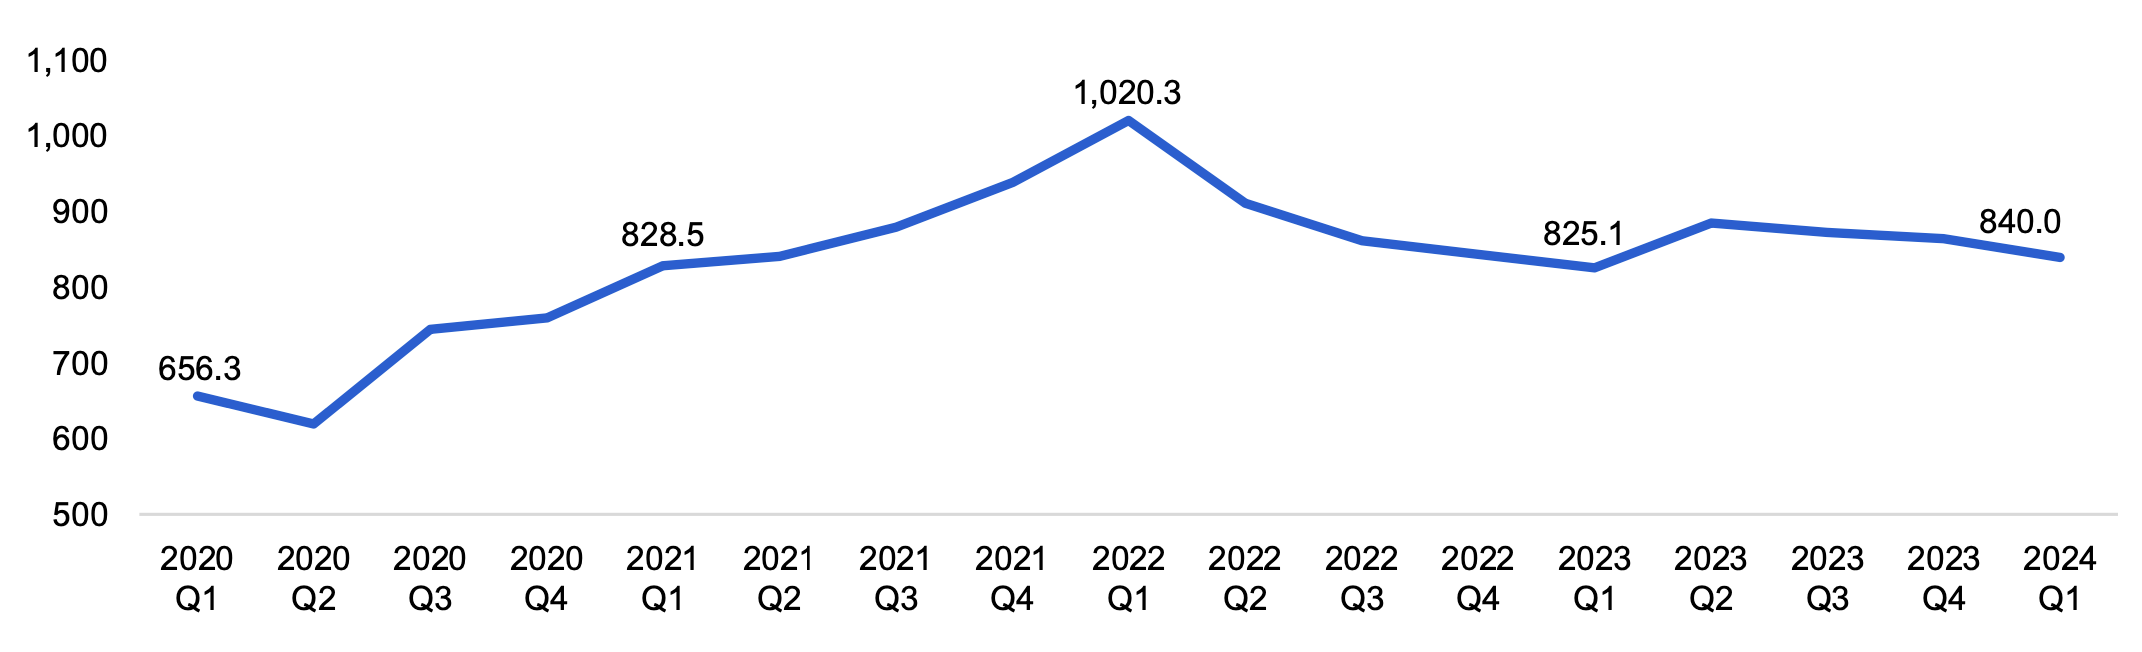
Source: Canadian Real Estate Association and FAO
Accessible Version
| Thousand dollars | |
|---|---|
| 2020 Q1 | 656.3 |
| 2020 Q2 | 619.4 |
| 2020 Q3 | 745.0 |
| 2020 Q4 | 759.2 |
| 2021 Q1 | 828.5 |
| 2021 Q2 | 841.3 |
| 2021 Q3 | 878.8 |
| 2021 Q4 | 937.9 |
| 2022 Q1 | 1020.3 |
| 2022 Q2 | 910.6 |
| 2022 Q3 | 861.6 |
| 2022 Q4 | 843.1 |
| 2023 Q1 | 825.1 |
| 2023 Q2 | 885.1 |
| 2023 Q3 | 872.2 |
| 2023 Q4 | 863.8 |
| 2024 Q1 | 840.0 |
Housing starts[7] in 2024 Q1 totalled 18,200 units in Ontario, a 1.7% decline from the 18,500 units started in 2023 Q1. In 2024 Q1, 86% of total housing starts were multiple unit dwellings, the highest share since records began in 1955, while 14% were single detached homes, the lowest share on record.
Figure 9 Housing starts (non-seasonally adjusted, thousands of units)
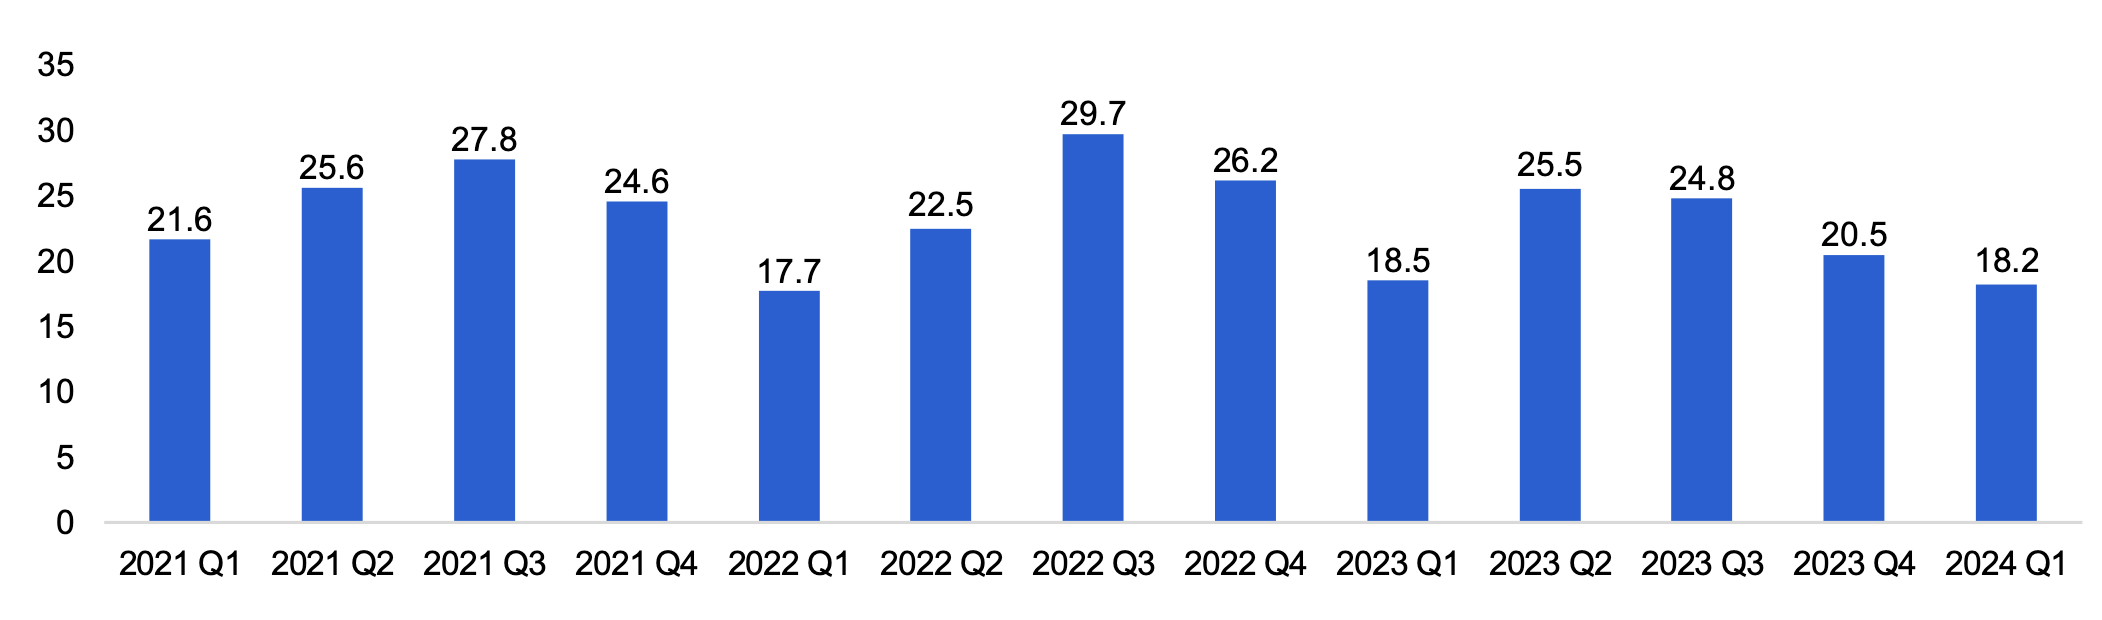
Source: Statistics Canada Table 34-10-0135-01 and FAO
Accessible Version
| Thousands of units | |
|---|---|
| 2021 Q1 | 21.6 |
| 2021 Q2 | 25.6 |
| 2021 Q3 | 27.8 |
| 2021 Q4 | 24.6 |
| 2022 Q1 | 17.7 |
| 2022 Q2 | 22.5 |
| 2022 Q3 | 29.7 |
| 2022 Q4 | 26.2 |
| 2023 Q1 | 18.5 |
| 2023 Q2 | 25.5 |
| 2023 Q3 | 24.8 |
| 2023 Q4 | 20.5 |
| 2024 Q1 | 18.2 |
Implication of recent housing starts
In February 2022, the Ontario Housing Affordability Task Force recommended that the Province set a goal of building 1.5 million homes over the next 10 years to improve housing affordability.[8] The government announced in 2022 that it would adopt this recommendation[9] and cited the units started in 2021 as progress toward this 1.5 million home commitment.
Figure 10 Progress towards the government’s commitment to achieve 1.5 million homes by 2031
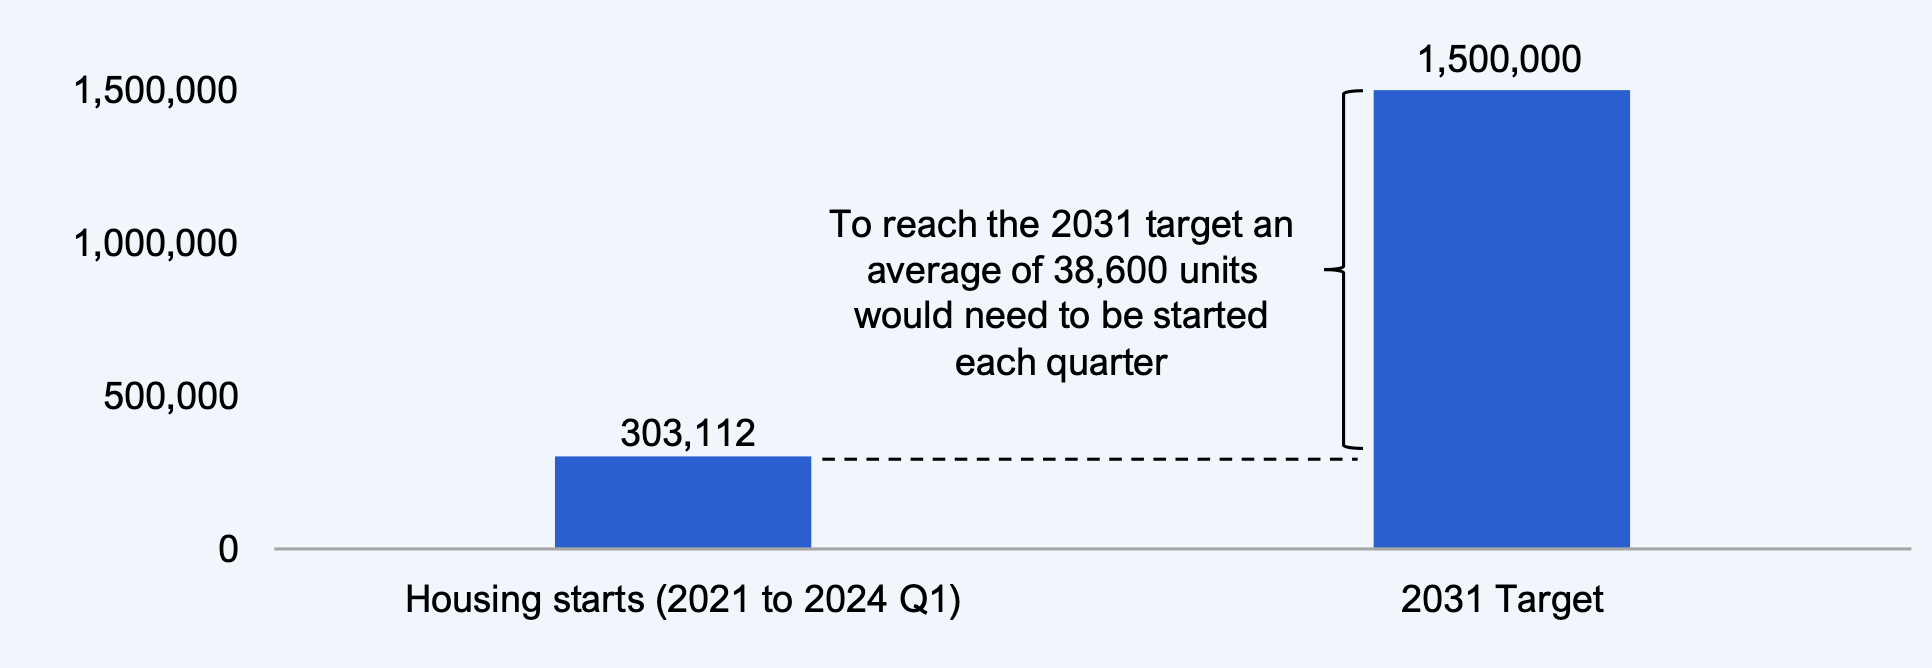
Source: Statistics Canada Table 34-10-0135-01 and FAO.
Accessible Version
| Units | |
|---|---|
| Housing starts (2021 to 2024 Q1) | 303,112 |
| 2031 Target | 1,500,000 |
From 2021 Q1 to 2024 Q1, Ontario has started 303,112 housing units, an average rate of around 23,300 units per quarter. To reach the government’s 1.5 million target by the end of 2031, an average of 38,600 units would need to be started each quarter, a 66% increase in the pace of units started per quarter since 2021 and about 4,200 above the highest number of starts ever recorded of 34,400 in 1973 Q3.[10]
Businesses
Manufacturing sales declined by 0.5% in 2024 Q1 after a 4.5% decline in 2023 Q4, which was affected by plant shutdowns in the auto sector and labour strikes in the United States. Durable goods sales fell 1.6% in 2024 Q1, largely reflecting a drop in transportation equipment, along with smaller declines in furniture, wood products, fabricated metal and non-metallic minerals sales. Non-durable goods sales increased by 1.0%, reflecting increases in plastics and chemical manufacturing.
Figure 11 Manufacturing sales growth (seasonally adjusted, quarter-over-quarter, %)
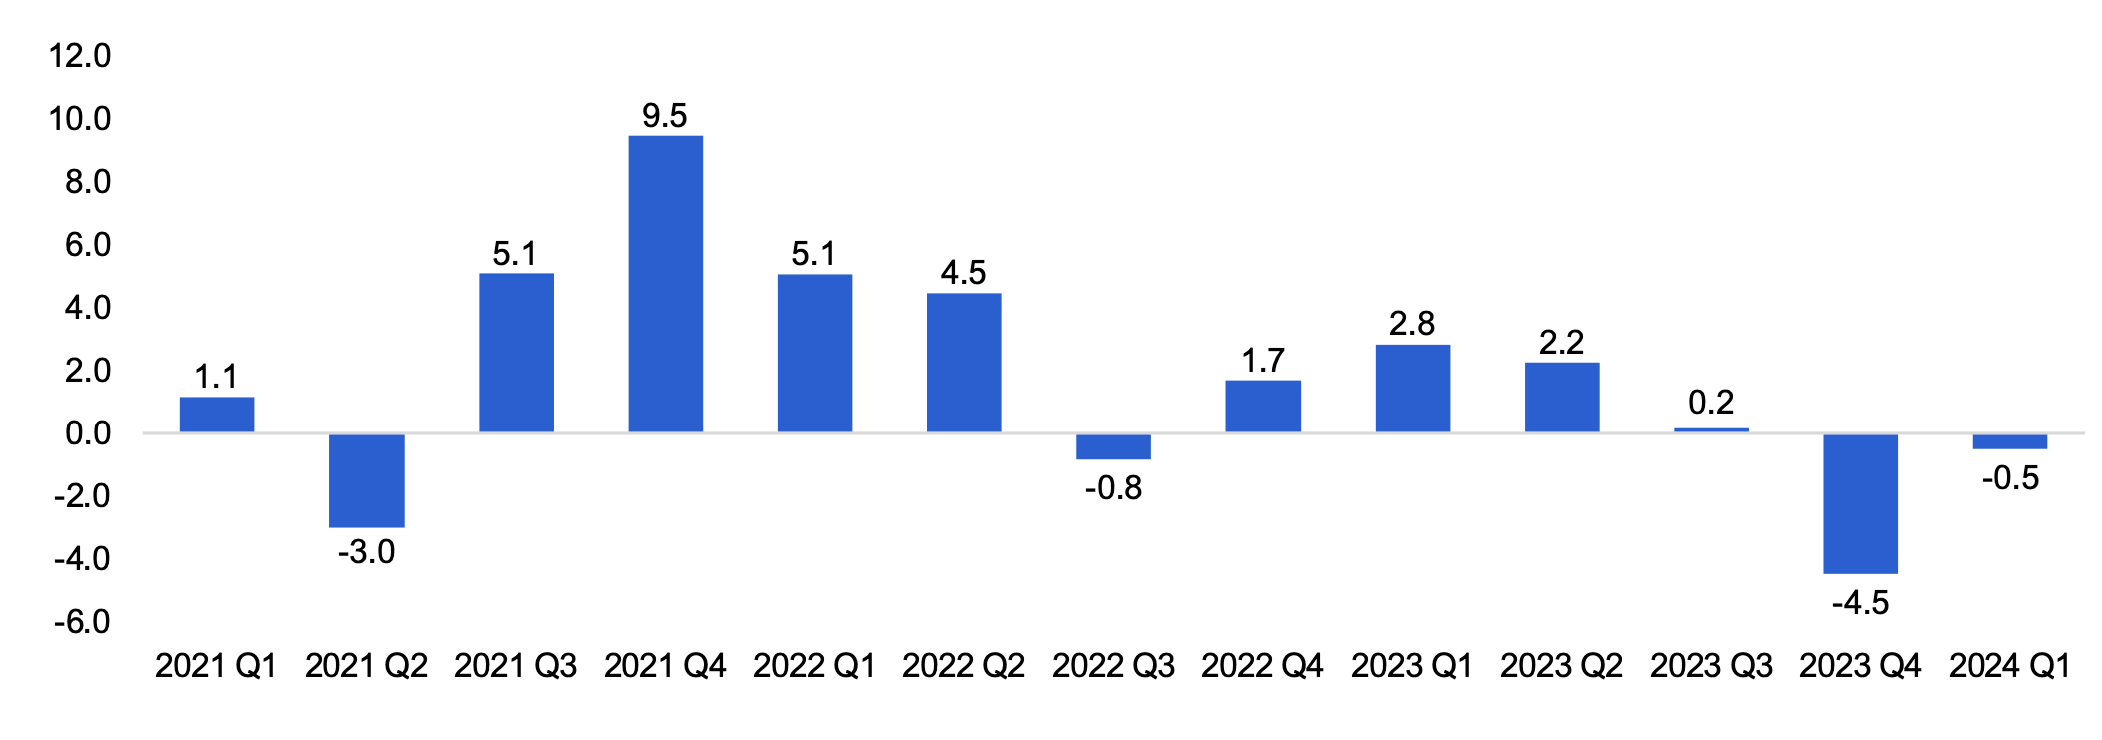
Source: Statistics Canada Table 16-10-0048-01 and FAO.
Accessible Version
| Per cent | |
|---|---|
| 2021 Q1 | 1.1 |
| 2021 Q2 | -3.0 |
| 2021 Q3 | 5.1 |
| 2021 Q4 | 9.5 |
| 2022 Q1 | 5.1 |
| 2022 Q2 | 4.5 |
| 2022 Q3 | -0.8 |
| 2022 Q4 | 1.7 |
| 2023 Q1 | 2.8 |
| 2023 Q2 | 2.2 |
| 2023 Q3 | 0.2 |
| 2023 Q4 | -4.5 |
| 2024 Q1 | -0.5 |
Wholesale trade, which measures sales of bulk items, declined by 0.3% in 2024 Q1, following a 3.0% drop in 2023 Q4. The decline in 2024 Q1 was largely the result of falling sales of autos, as well as declines in the sales of food and farm products.
Figure 12 Wholesale trade growth (seasonally adjusted, quarter-over-quarter, %)
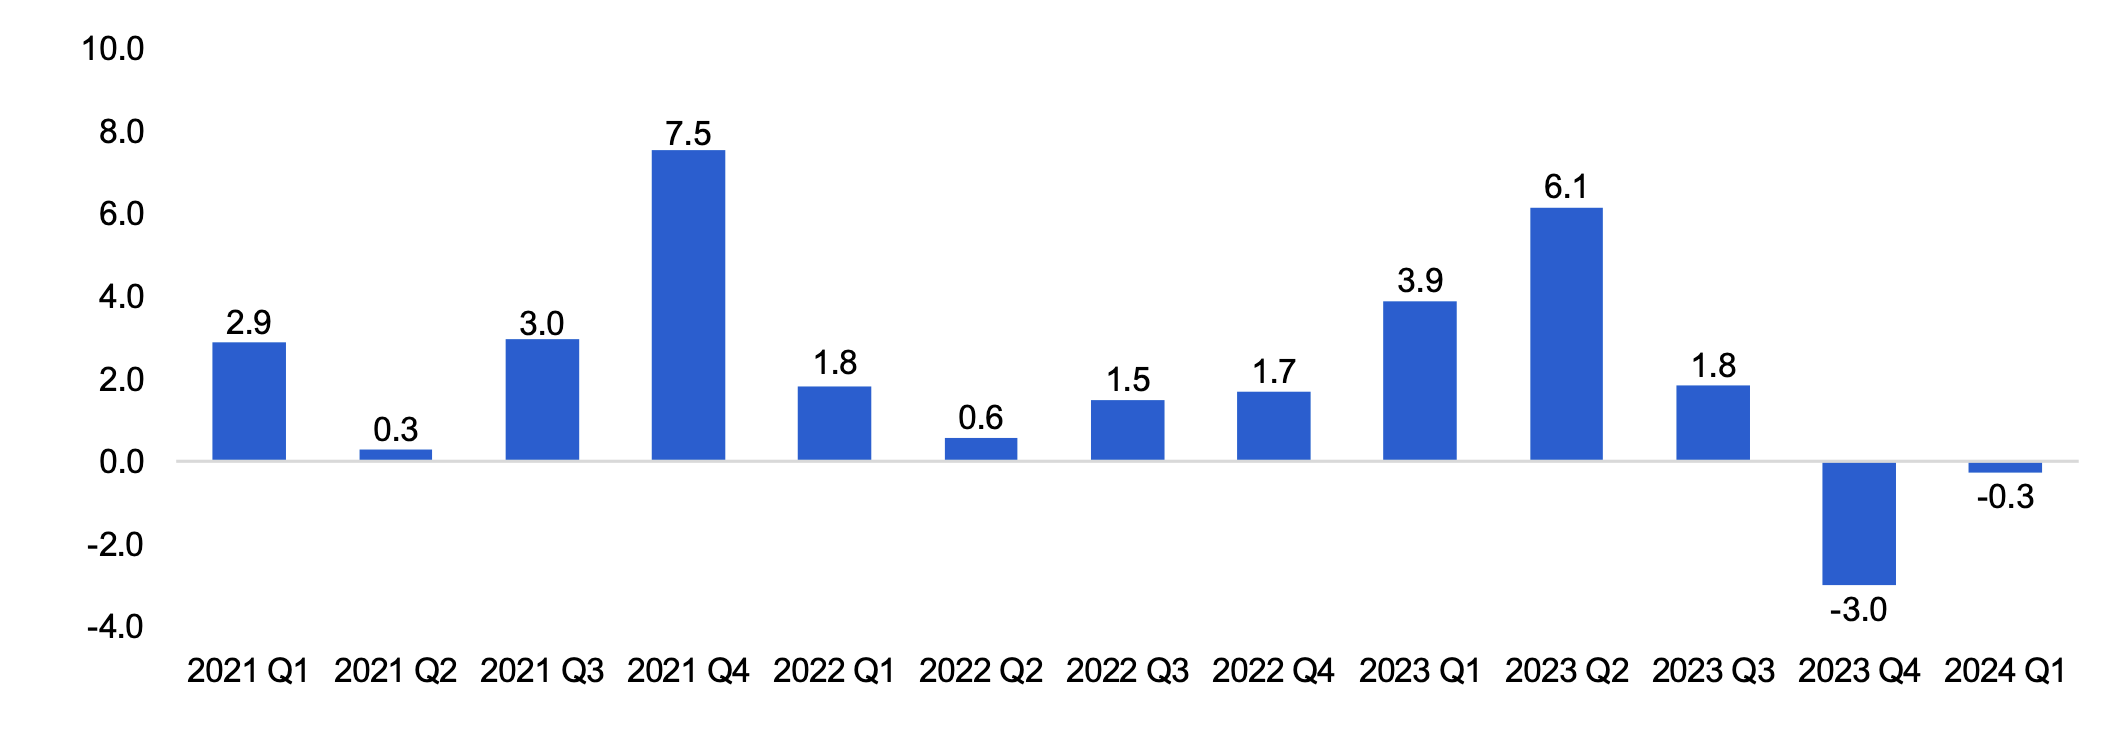
Source: Statistics Canada Table 20-10-0074-01 and FAO.
Accessible Version
| Per cent | |
|---|---|
| 2021 Q1 | 2.9 |
| 2021 Q2 | 0.3 |
| 2021 Q3 | 3.0 |
| 2021 Q4 | 7.5 |
| 2022 Q1 | 1.8 |
| 2022 Q2 | 0.6 |
| 2022 Q3 | 1.5 |
| 2022 Q4 | 1.7 |
| 2023 Q1 | 3.9 |
| 2023 Q2 | 6.1 |
| 2023 Q3 | 1.8 |
| 2023 Q4 | -3.0 |
| 2024 Q1 | -0.3 |
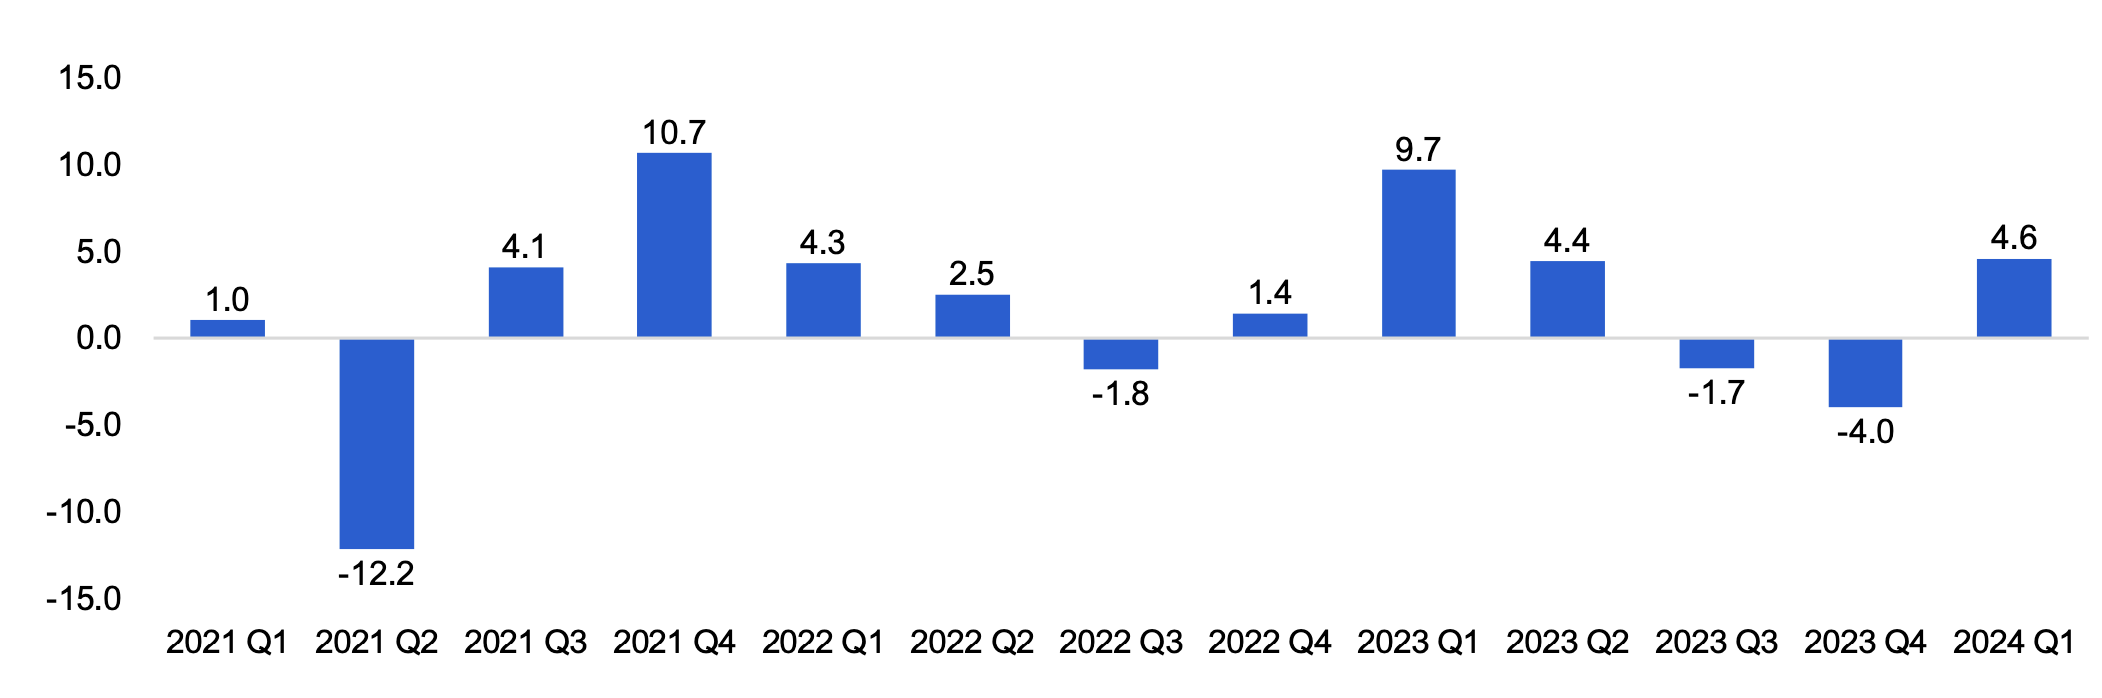
International merchandise exports, which account for all goods leaving the country through Ontario, increased by 4.6% in 2024 Q1, following two consecutive quarterly declines.[11] The increase in exports reflected gains in metal and non-metallic mineral products, which offset declines in autos.
Figure 13 International merchandise export growth (seasonally adjusted, quarter-over-quarter, %)
Note: International merchandise export growth is based on FAO estimates using Statistics Canada Table 12-10-0175-01 and Table 12-10-0163-01.
Source: Statistics Canada Table 12-10-0175-01, Table 12-10-0163-01 and FAO.
Accessible Version
| Per Cent | |
|---|---|
| 2021 Q1 | 1.0 |
| 2021 Q2 | -12.2 |
| 2021 Q3 | 4.1 |
| 2021 Q4 | 10.7 |
| 2022 Q1 | 4.3 |
| 2022 Q2 | 2.5 |
| 2022 Q3 | -1.8 |
| 2022 Q4 | 1.4 |
| 2023 Q1 | 9.7 |
| 2023 Q2 | 4.4 |
| 2023 Q3 | -1.7 |
| 2023 Q4 | -4.0 |
| 2024 Q1 | 4.6 |
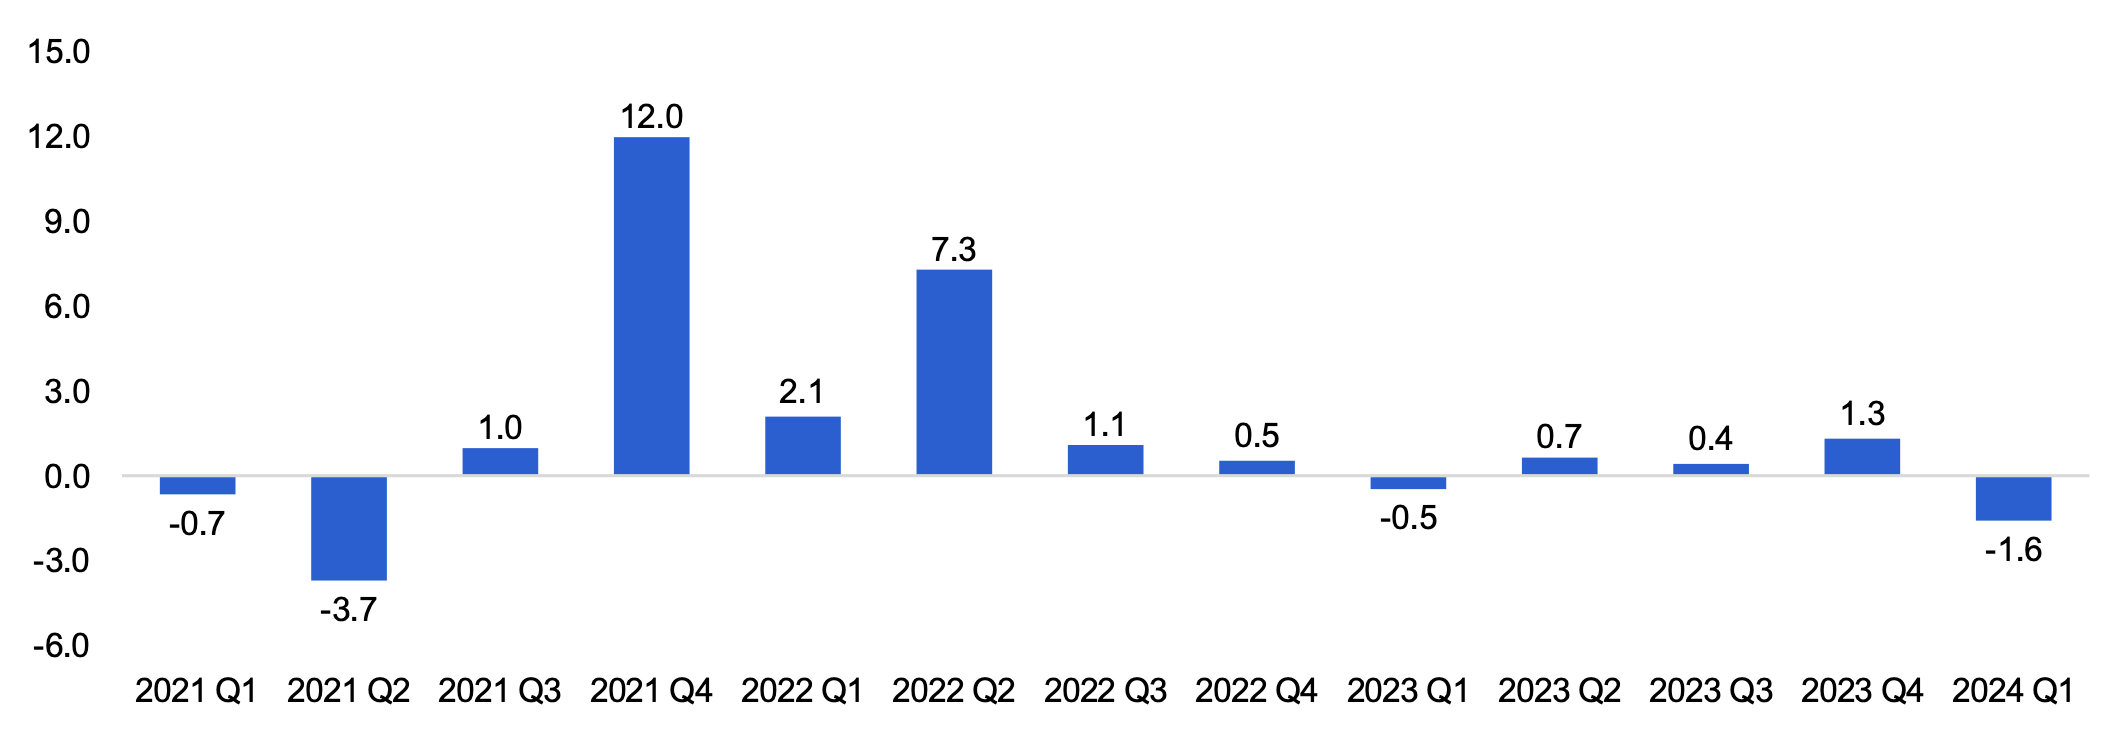
International merchandise imports, which measures international goods entering Ontario, declined 1.6% in 2024 Q1, after increasing in the previous three quarters. The decline reflected a reduction in auto imports as well as imports of metal and non-metallic minerals products.
Figure 14 International merchandise import growth (seasonally adjusted, quarter-over-quarter, %)
Note: International merchandise import growth is based on FAO estimates using Statistics Canada Table 12-10-0175-01 and Table 12-10-0163-01.
Source: Statistics Canada Table 12-10-0175-01, Table 12-10-0163-01 and FAO.
Accessible Version
| Per Cent | |
|---|---|
| 2021 Q1 | -0.7 |
| 2021 Q2 | -3.7 |
| 2021 Q3 | 1.0 |
| 2021 Q4 | 12.0 |
| 2022 Q1 | 2.1 |
| 2022 Q2 | 7.3 |
| 2022 Q3 | 1.1 |
| 2022 Q4 | 0.5 |
| 2023 Q1 | -0.5 |
| 2023 Q2 | 0.7 |
| 2023 Q3 | 0.4 |
| 2023 Q4 | 1.3 |
| 2024 Q1 | -1.6 |
Implications of Recent Economic Trends
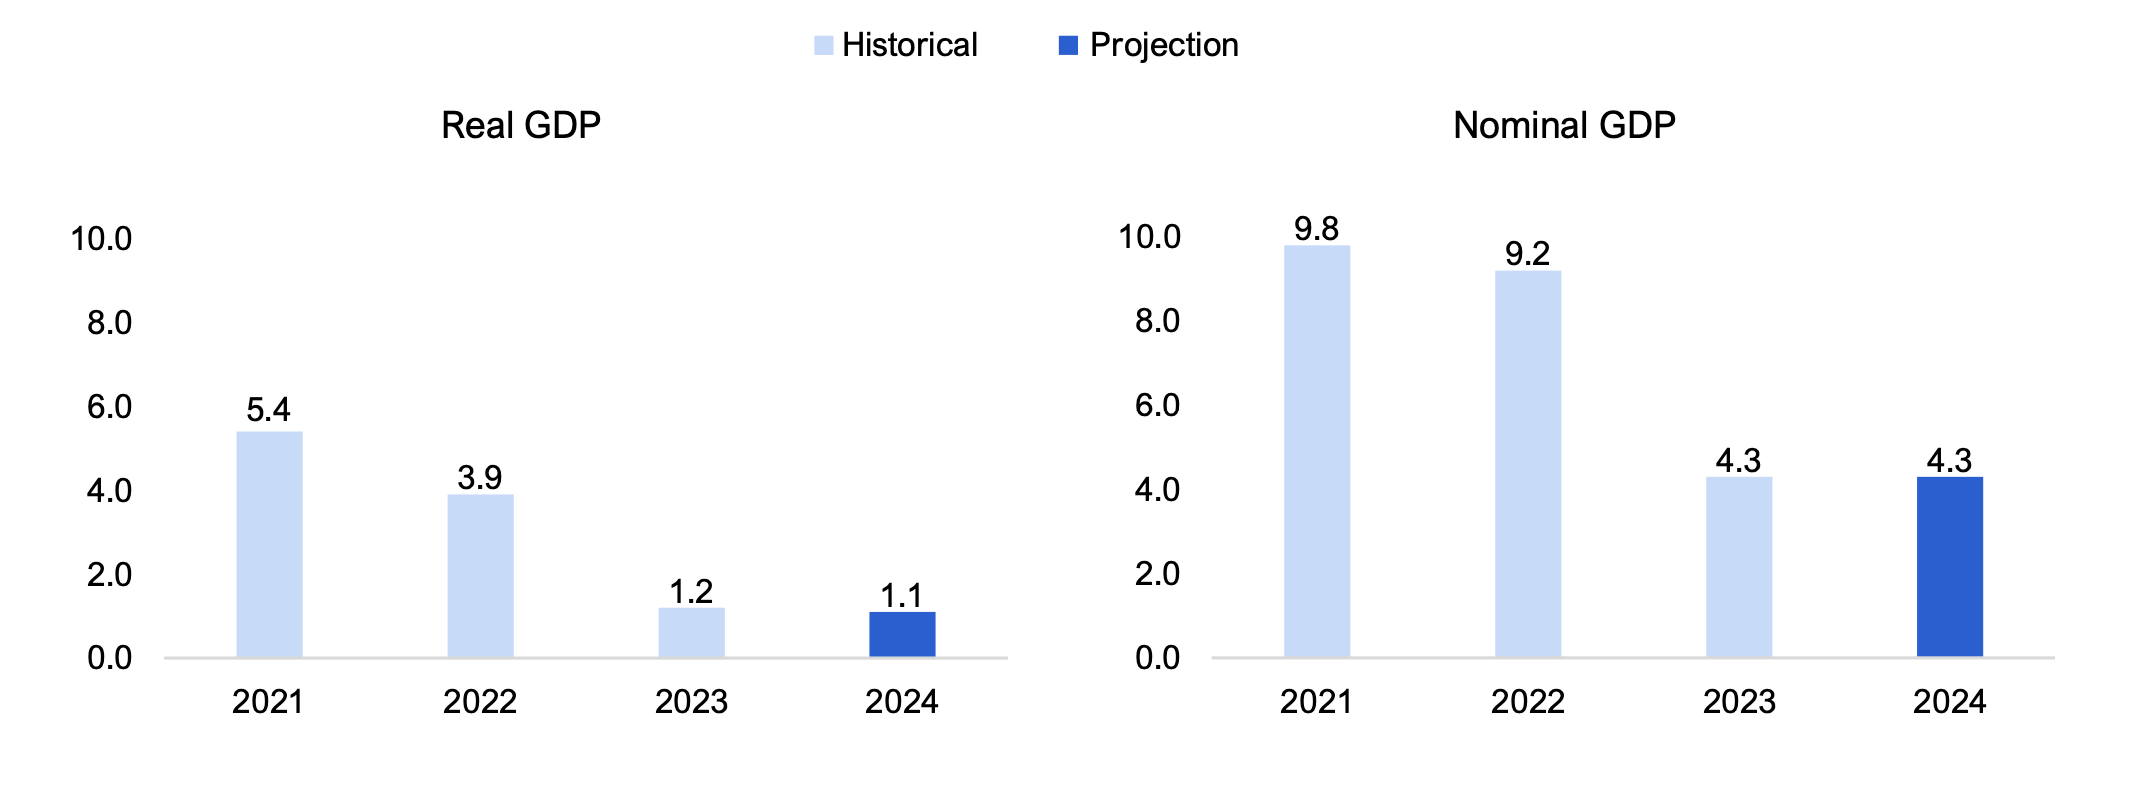
The weakness in Ontario’s economic growth in the last quarter of 2023 and the modest pick up in the first quarter of 2024 is consistent with the FAO’s latest economic forecast published in its Spring 2024 Economic and Budget Outlook (EBO).[12] The FAO’s latest projection expects annual real GDP growth to slow slightly from 1.2% in 2023 to 1.1% in 2024. For nominal GDP, the FAO expects growth of 4.3% in 2024, the same increase observed in 2023.
Figure 15 FAO’s Spring 2024 economic growth projection (%)
Source: Ontario Economic Accounts and FAO, Spring 2024 Economic and Budget Outlook
Accessible Version
| Real GDP | Nominal GDP | |||
|---|---|---|---|---|
| Year | Historical | Projection | Historical | Projection |
| 2021 | 5.4 | 9.8 | ||
| 2022 | 3.9 | 9.2 | ||
| 2023 | 1.2 | 4.3 | ||
| 2024 | 1.1 | 4.3 | ||
The FAO will continue to monitor Ontario’s economic performance and incorporate any changes into upcoming Economic and Budget Outlook reports.
Glossary
Economic Indicators
Gross Domestic Product (GDP)
GDP is a broad indicator of economic activity that measures the value of goods and services produced by an economy. GDP is measured on both an expenditure and income basis.
Employment and unemployment rate
Employment from Statistics Canada’s Labour Force Survey estimates the number of individuals who did any work at a job or business (whether paid or unpaid) or those who had a job but were not at work due to factors unrelated to their job (e.g., their own illness or a labour dispute). The unemployment rate represents the number of people actively looking for work but not having a job as a proportion of the labour force. These two indicators are the most common measures of labour market performance.
Average hourly wages
Hourly wages are measured before taxes and other deductions, and include tips, commissions and bonuses for both hourly and salaried workers. It indicates wage inflation and labour market tightness.
Retail sales
Retail sales are the value of finished goods sold by retailers to the general public. It provides information on household spending by major commodity type.
Housing resales
Home resales data show the number of existing houses sold and is the most common measure of housing market activity.
Housing prices
The average price of existing houses sold. It is the most common measure of home prices that provides an indication of the strength of the housing market.
Housing starts
Housing starts measures the number of housing units where construction has been started, including single and multiple unit dwellings. It provides a measure of change in the level of the housing stock and can be compared to population growth to provide information on housing supply adequacy.
Manufacturing sales
The value of goods manufactured in Ontario that have been shipped to a customer.It is a measure of industrial production.
Wholesale trade
The value of merchandise sold in large quantities to retailers, business and institutional clients (such as governments). It provides insight into general business sector activity.
International merchandise exports and imports
The value of merchandise shipped out of the country from Ontario (exports) or into Ontario from outside the country (imports). International merchandise trade plays an important role in economic growth and provides information on the province’s competitiveness with other jurisdictions.
Technical Definitions
Real dollars
Values reflect prices after adjusting for inflation.
Seasonally adjusted
Data that has been adjusted to reflect seasonal factors that may impact the data.
Non-seasonally adjusted
Data that has not been adjusted to reflect seasonal factors.
Year-over-year (Y/Y)
Comparing data from a particular time period, with data from the same time period a year ago. For example, Y/Y growth in 2023 Q4 would compare 2023 Q4 data with 2022 Q4 data. Y/Y data mostly removes the impact of seasonal factors.
Quarter-over-quarter (Q/Q)
Comparing data from one quarter to the next. For example, Q/Q growth in 2023 Q4 would compare 2023 Q4 data with 2023 Q3 data. Q/Q growth may suffer from seasonal factors unless data is seasonally adjusted.
Methodology
Data used in this report are primarily presented on a quarterly basis. Growth of economic indicators, which are adjusted for seasonality, are presented from one quarter to the next (Q/Q). For indicators that are not seasonally adjusted, growth rates are presented from the same quarter of the previous year (Y/Y) to avoid the impact of seasonal factors on economic trends. Indicators are presented in current dollars unless otherwise specified.
For some economic data, including retail sales, manufacturing sales and wholesale trade, the final month of the quarter may not yet be available at the time of the report’s publication. In these cases, Statistics Canada’s national preliminary estimate is used to estimate Ontario’s growth in that month.
Footnotes
[1] See the FAO’s Spring 2024 Economic and Budget Outlook.
[2] For example, the April 2024 OEA release describes economic activity from October to December 2023. The Fiscal Sustainability, Transparency and Accountability Act, 2019 states that the quarterly Ontario Economic Accounts should be released within 45 days of the Statistics Canada release of the National Income and Expenditure Accounts.
[3] Some of these data are regularly revised, and the growth rates presented in this report may differ from updated data published at a later date.
[4] March data was not available at the time of publication, so the Canadian preliminary indicator provided by Statistics Canada was used to calculate the 2024 Q1 Ontario value. See Statistics Canada’s Retail trade, February 2024.
[5] See the Bank of Canada’s Canadian Survey of Consumer Expectations—First Quarter of 2024.
[6] Measured on a year-over-year basis.
[7] Canada Mortgage and Housing Corporation (CMHC) defines a housing unit as being a “structurally separate set of self-contained living premises [with] … a private entrance from outside the building or from a common hall, lobby or stairway inside the building. The entrance must be one that can be used without passing through another separate […] unit”. See CMHC’s Starts and Completions Survey and Market Absorption Survey Methodology.
[8] See Report of the Ontario Housing Affordability Task Force.
[9] See More Homes Built Faster.
[10] In addition to housing starts, the government has included new and upgraded long-term care beds and additional residential units (laneway, garden and basement suites) in its 2023 progress on housing supply. See page 133 in the 2024 Ontario Budget.
[11] International merchandise export and import growth is based on FAO estimates using Statistics Canada Table 12-10-0175-01 and Table 12-10-0163-01.
[12] See the FAO’s Spring 2024 Economic and Budget Outlook.