


1 | Summary
This report reviews the Government of Ontario’s (the Province’s) housing and homelessness programs, identifies recent program and spending changes, and projects the impact of the Province’s housing and homelessness programs on core housing need [1] and chronic homelessness. [2]
Provincial Housing Programs
-
The Province’s housing programs provide subsidized housing to eligible low- and moderate-income households in Ontario. These programs fall under two main categories: social housing and affordable housing.
- Social housing units are operated by municipal organizations, housing co-operatives and non-profit organizations. These organizations primarily offer housing units where tenants pay rent-geared-to-income (RGI), meaning that rent is limited to 30 per cent of the household’s gross income.
- Affordable housing programs provide construction grants to developers who, in return, create affordable (i.e., below-market rent) housing units in their buildings. Affordable housing programs also provide rent supplements, offer homeownership assistance that provides households with forgivable down payment loans, and fund home and rental repairs.
- In 2018-19, approximately 297,200 households received support through the Province’s housing programs. 189,000 households lived in RGI housing, 93,600 households lived in below-market rent housing units, 7,200 households received rent supplements and 7,300 households benefited from homeownership assistance.
-
The Province’s housing programs are jointly funded with the federal government through agreements that commit both federal and provincial funding. In total, from 2013-14 to 2018-19, the Province spent $5.0 billion on its housing programs, of which the federal government funded $3.3 billion, or 67 per cent. The Province contributed the remaining $1.7 billion, or 33 per cent.
[3]
- In 2018-19, the Province spent $701 million on its housing programs. This is in line with historical spending levels between 2013-14 and 2015-16 but significantly lower than housing programs spending in 2016-17 ($1.2 billion) and 2017-18 ($1.0 billion) due to time-limited programs (e.g., the Social Infrastructure Fund) and programs that were introduced in 2016-17 but cancelled by 2018-19 (e.g., the Social Housing Apartment Improvement Program funded through the cap and trade program).
-
The level of support offered to households under the Province’s housing programs varies depending on the type of housing support provided and reflects differences in program design.
- In 2018, households in RGI housing units received an average annual subsidy of $6,300, while households in below-market rent housing units received an average annual subsidy of $3,800 and rent supplements provided households with an average of $4,500.
- In comparison, the FAO estimates that the average core housing need affordability gap was approximately $4,000 in 2018. This represents the average amount of before-tax income needed to remove a household from core housing need.
- Consequently, RGI units and rent supplements were sufficient, on average, to eliminate the affordability gap and remove a household from core housing need. On the other hand, the average subsidy provided by below-market rent units ($3,800) was less than the average core housing need affordability gap ($4,000), implying that the average household living in a below-market rent unit was not removed from core housing need. Overall, the FAO found that in 2018, 31 per cent of renters who received support from the Province’s housing programs were still in core housing need.
-
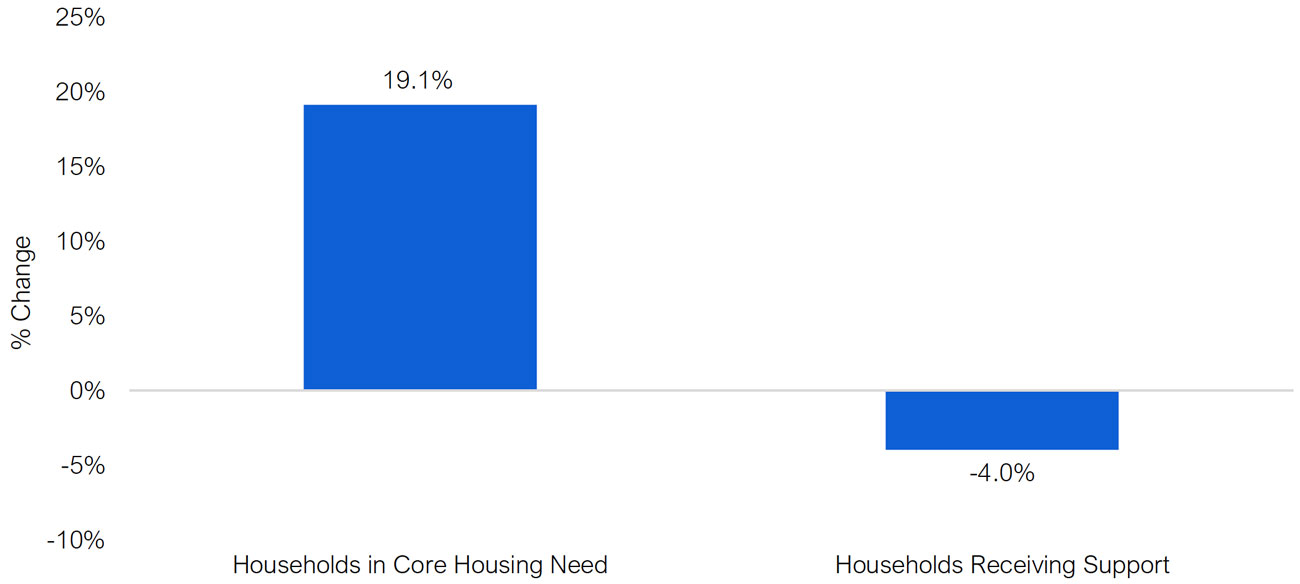
Since 2011, the number of Ontario households in core housing need has increased while the number of households receiving housing support from provincial programs has decreased.
- Between 2011 and 2018, the number of households in core housing need grew from 616,900 to 735,000, an increase of 118,100 households, or 19.1 per cent.
- Over the same period, the number of households receiving housing support declined by 12,300 or 4.0 per cent, from 309,500 to 297,200 households.
- The increase in the number of households in core housing need, combined with a decline in households receiving housing support, led to an increase in the wait list for social housing. The Province’s social housing wait list increased by 27 per cent over this time period, [4] with many households waiting over 10 years for a placement in social housing.
Outlook for the Province’s Housing Programs
-
Between 2018-19 and 2027-28, over 80 per cent of committed federal-provincial funding for the Province’s housing programs will expire and be replaced by three new programs
[5]
created under the federal-provincial National Housing Strategy (NHS).
- Under the NHS, the Province and federal government have committed to spend $4.0 billion through the Province’s housing programs from 2019-20 to 2027-28. [6] This consists of $2.9 billion of federal support and $1.1 billion of provincial spending.
-
After accounting for expiring funding and the new NHS commitments, the FAO projects that the Province’s annual spending on housing programs will be lower than 2018-19 levels until 2024-25, as new funding from NHS programs will not make up for lost funding under expiring agreements.
- From 2019-20 to 2027-28, annual spending on the Province’s housing programs will average $696 million. This is significantly lower than average annual spending by the Province from 2014-15 to 2018-19, at $856 million per year.
- The FAO projects that the number of households supported by the Province’s housing programs will reach 352,500 in 2027-28, an increase of 55,300 from 2018-19. [7] This represents the net increase in housing support from the NHS programs.
-
The FAO estimates that the total number of households in core housing need will increase to 815,500 households in 2027, an increase of 80,500 households from 2018.
[8]
- Population growth and higher housing costs will more than offset household income growth and the incremental support provided by provincial housing programs through the NHS.
- Only half (or 27,100) of the 55,300 additional households that will receive support under the Province’s housing programs in 2027-28 are expected to be removed from core housing need. This is largely due to the new Canada-Ontario Housing Benefit (COHB) portable rent supplement program under the NHS. Although this program is designed to target vulnerable populations, [9] the FAO estimates that the level of support provided will not be sufficient to remove most recipients from core housing need.
Homelessness Programs Overview
- The FAO estimates that over 16,000 Ontarians are homeless on any given night, of which between 40 and 60 per cent are experiencing chronic homelessness. [10]
-
The Province’s homelessness programs centre on the commitment to end chronic homelessness by the end of 2025.
[11]
- The Province administers three homelessness programs, which focus on two primary objectives: that people experiencing homelessness can obtain and retain housing and that people at risk of homelessness are able to remain in their housing.
- In addition, the Province’s housing programs play a role in addressing homelessness by helping households experiencing or at risk of homelessness access affordable housing. [12]
- From 2013-14 to 2020-21, provincial spending on base homelessness programs [13] has grown at an annual average rate of 8.0 per cent due to new spending commitments to address chronic homelessness. The number of households supported by homelessness programs also grew by approximately five per cent per year between 2014-15 and 2018-19.
Will the Province End Chronic Homelessness by 2025?
The FAO concluded that it is unlikely that the Province will achieve its goal of ending chronic homelessness in Ontario by 2025 without new policy measures for the following reasons:
- The municipalities of Ottawa and Toronto both report increased shelter usage since 2014, driven primarily by growth in the number of families using shelters and increases in the length of time individuals are staying in shelters. This reflects the growing difficulty for homeless individuals and families to acquire housing and exit homelessness.
- Over the next three years, the FAO projects that the Province’s base homelessness programs spending will grow at an annual average of 3.4 per cent, increasing from $403 million in 2019-20 to $446 million in 2022-23. This spending growth is significantly lower than the 8.0 per cent spending growth from 2013-14 to 2020-21.
- The Province’s 2020-2025 Poverty Reduction Strategy does not commit any additional homelessness programs spending (beyond the 3.4 per cent average annual growth noted above [14] ) or address the Province’s commitment to end chronic homelessness. However, the new poverty reduction strategy does note that increasing the supply of affordable housing under the NHS is a key measure to support people at risk of or experiencing homelessness.
-
The FAO has identified two key indicators to measure the impact of the Province’s housing programs on homelessness in Ontario.
-
The first indicator relates to the ability of individuals experiencing homelessness to exit homelessness through access to housing programs support. From 2011-12 to 2018-19, the number of households that received provincial housing programs support decreased by 4.0 per cent. This contributed to an increase in the number of households in core housing need of 19 per cent and a 27 per cent increase in the wait list for social housing.
- Looking forward, the FAO is projecting that the number of households in core housing need will increase from 735,000 households in 2018 to 815,500 households in 2027. The projected growth in core housing need will lead to increased demand for housing programs support, leading to an even longer wait list by 2027. Therefore, the Province’s ability to reduce chronic homelessness by providing individuals experiencing homelessness with access to affordable housing through housing programs support will be limited.
-
The second indicator relates to housing need among households at risk of homelessness. This is measured by the number of households living in poverty that spend 50 per cent or more of their income on shelter costs. These ‘high housing need’ households are at an elevated risk of losing their housing and experiencing homelessness.
- Overall, the FAO projects that the number of households in ‘high housing need’ will decrease by approximately 19,600 households from 2018 to 2025, primarily due to the COHB program, which prioritizes higher need households. [15] However, by 2025, there will still be an estimated 159,800 ‘high housing need’ households in Ontario that are at an elevated risk of losing their housing and experiencing homelessness.
-
The first indicator relates to the ability of individuals experiencing homelessness to exit homelessness through access to housing programs support. From 2011-12 to 2018-19, the number of households that received provincial housing programs support decreased by 4.0 per cent. This contributed to an increase in the number of households in core housing need of 19 per cent and a 27 per cent increase in the wait list for social housing.
2 | Introduction
Housing Need in Ontario
In 2019, the Government of Canada recognized access to adequate housing as a fundamental human right. In its National Housing Strategy Act , the federal government affirmed that housing is “essential to the inherent dignity and well-being” of a person and recognized the impact of access to affordable housing on social, economic, health and environmental outcomes. [16] Households that are unable to afford adequate housing must often choose between being unable to afford other necessities or living in housing that is inadequate for their needs. An inability to access affordable housing also places households at risk of becoming homeless and prevents people that are homeless from acquiring housing.
Core housing need is an indicator developed by the Canada Mortgage and Housing Corporation (CMHC) to identify households who need housing-related financial assistance. A household is in core housing need if it does not live in acceptable housing and its before-tax income is not sufficient to access acceptable housing. Housing is considered acceptable when the total cost of housing is equal to or less than 30 per cent of a household’s before-tax income, there are enough bedrooms to accommodate the size of the household and the housing is not in need of major repairs.
Between 2011 and 2018, the number of households in core housing need in Ontario increased from 616,900 [17] to 735,000. [18] This increase resulted from growth in home resale prices and market rents, which significantly outpaced income growth, [19] but also from demographic changes and a reduction in housing support under the Province’s housing programs. Overall, in 2018, 13.9 per cent of households in Ontario were in core housing need, which was higher than the Canadian average of 11.6 per cent and was the second highest rate among all provinces. [20] The high rate of core housing need in Ontario is largely driven by housing unaffordability, with over 90 per cent of core need households living in residences that are considered unaffordable based on their income. [21]
Figure 2-1 Ontario has the second highest rate of core housing need in Canada (%), 2018
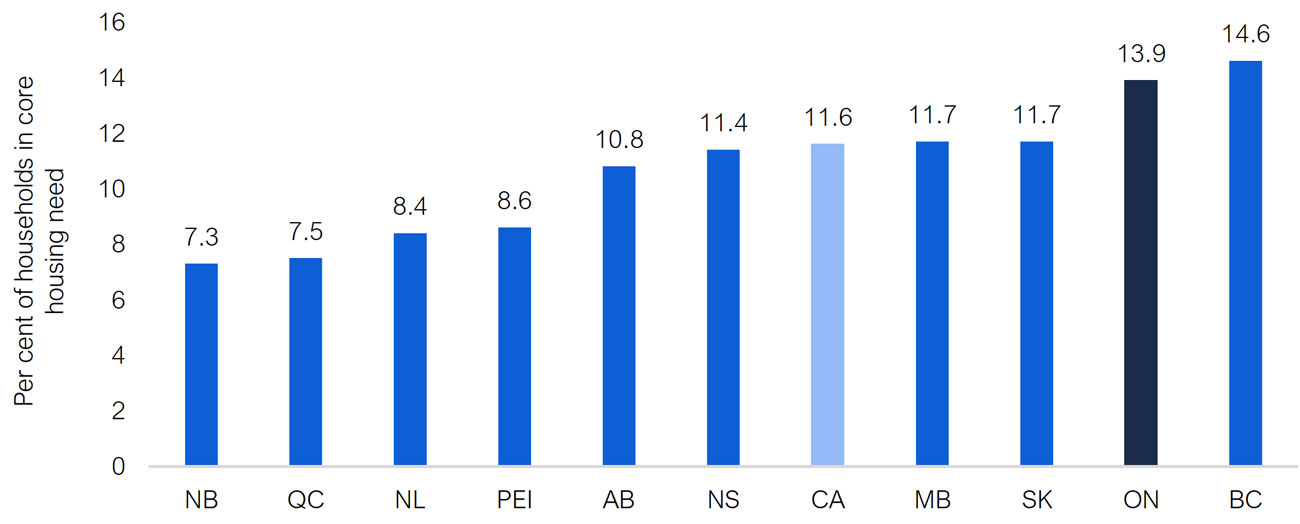
Source: Canadian Housing Survey, 2018 and FAO.
High housing costs relative to incomes also place households at risk of becoming homeless and prevent people that are homeless from acquiring housing. The FAO estimates that in 2018, over 179,000 high need [22] households in Ontario lived in housing that was “deeply unaffordable.” These households live in poverty and spend more than half their income on the cost of shelter. ‘High housing need’ households are considered to be at risk of homelessness because they do not have the income to acquire acceptable market housing.
Housing unaffordability also prevents homeless individuals and families from acquiring acceptable housing. In 2018, Ontario municipalities reported that there were over 16,000 Ontarians experiencing homelessness on any given night. [23] Most of these Ontarians stay in municipally run shelters and treatment facilities, but also live outdoors. Further, as housing becomes more unaffordable, Ontario households are living in homeless provisional accommodation, such as emergency shelters, for longer periods of time. [24] Nearly all homeless individuals and families in Ontario report that they want stable, permanent housing, and many cite a lack of access to affordable housing as the key barrier preventing them from exiting homelessness. [25]
Provincial Housing and Homelessness Programs
To address housing need in Ontario, the Government of Ontario (the Province), through the Ministry of Municipal Affairs and Housing (MMAH), delivers housing and homelessness programs in collaboration with the federal government and municipalities. [26] MMAH’s housing programs provide assistance to low- and moderate-income households and households in core housing need through direct subsidies for rent, home and rental repairs, funding the construction of below-market rent units, and providing forgivable homeownership loans.
The ministry’s homelessness programs assist households that are experiencing homelessness or are at risk of homelessness. These programs provide funding for emergency shelters and transitional and supportive housing to assist people experiencing homelessness, and financial aid and other services to prevent people at risk of homelessness from losing their homes.
In 2019-20, the ministry spent $661 million on housing programs and $403 million on homelessness programs for a total of $1.1 billion.
Figure 2-2 The Province spent $1.1 billion on housing and homelessness programs in 2019-20 ($ millions)
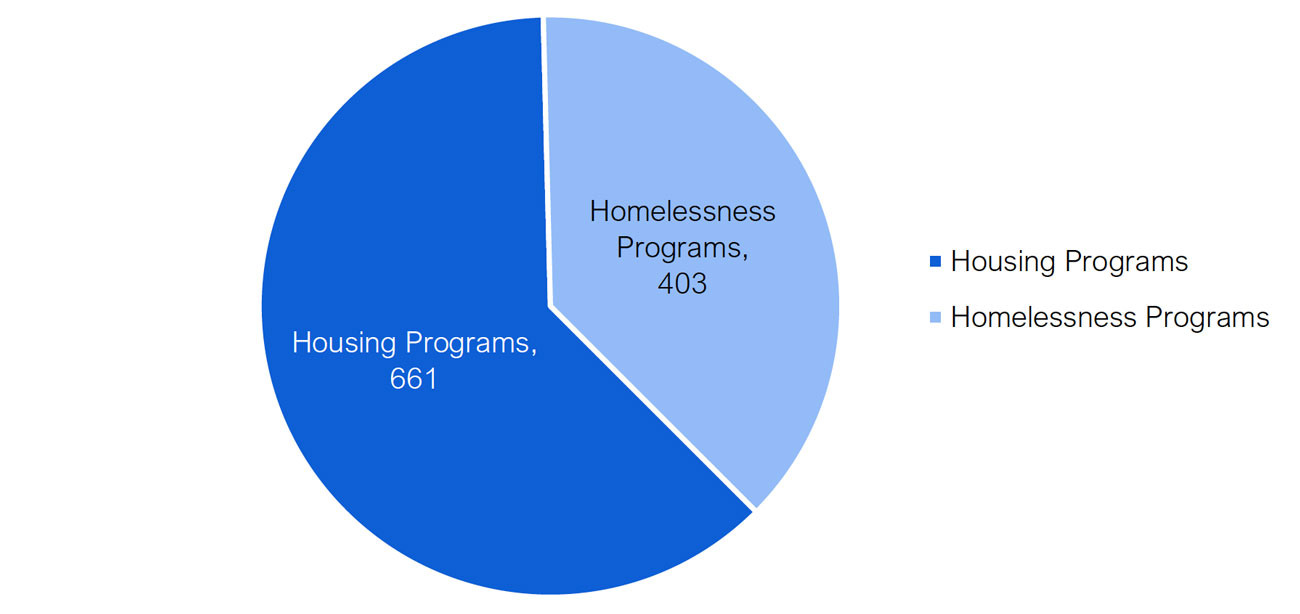
Source: FAO analysis of information provided by MMAH.
Recent Developments
The Province’s housing programs are partly funded through a series of agreements with the Government of Canada. Between 2018-19 and 2027-28, over 80 per cent of committed federal-provincial funding for the Province’s housing programs was set to expire. However, on April 30, 2018, the Province and the federal government signed a new 10-year bilateral agreement that will replace the expiring funding for Ontario housing programs while also increasing overall support. This agreement is part of the federal government’s National Housing Strategy (NHS) and commits $4.0 billion of federal-provincial spending on housing programs in Ontario over the 10-year period.
The Province’s homelessness programs centre on its commitment to end chronic homelessness by the end of 2025. This commitment resulted from a recommendation from the Expert Advisory Panel on Homelessness in 2015 and formed a centrepiece of the Province’s 2016 Long-Term Affordable Housing Strategy (LTAHS). [27] Although the commitment to end chronic homelessness by 2025 was made prior to the June 2018 provincial election and the change in government, MMAH confirmed with the FAO that the commitment to end chronic homelessness by the end of 2025 remains government policy.
Purpose and Structure of this Report
The purpose of this report is to review the Province’s housing and homelessness programs, identify recent program and spending changes, and project the impact of the Province’s housing and homelessness programs on core housing need and chronic homelessness. The report first looks at existing housing programs spending and how the number of households supported by provincial programs has changed over time. The report then discusses recent program changes and the transition in funding from legacy housing programs to new programs under the NHS. Next, the report presents the FAO’s housing programs spending forecast and analyzes the impact of the Province’s housing programs on the supply of subsidized housing and core housing need. The report concludes with an analysis of the Province’s homelessness programs and the commitment to end chronic homelessness.
- Chapter 3 provides an overview of the Province’s housing programs, provincial spending on housing programs from 2013-14 to 2018-19, the number of households that received support and the implications for core housing need in Ontario.
- Chapter 4 discusses recent changes to the Province’s housing programs, including the impact of expiring federal-provincial funding agreements and the Province’s objectives under the NHS.
- Chapter 5 projects housing programs spending through 2027-28 and forecasts how the Province’s housing programs under the NHS will affect housing supply and core housing need in Ontario.
- Chapter 6 reviews the Province’s commitment to end chronic homelessness in Ontario by 2025 and discusses the potential impact of the NHS on this commitment.
Appendix B provides more information on the development of this report, including an overview of the FAO’s methodology and assumptions.
3 | Housing Programs Overview
Housing Programs Spending from 2013-14 to 2018-19
In 2018-19, the Province spent $701 million on housing programs. This is in line with historical spending levels between 2013-14 and 2015-16 but significantly lower than housing programs spending in 2016-17 and 2017-18. Housing programs spending reached $1.2 billion and $1.0 billion in 2016-17 and 2017-18, respectively, due to time-limited programs, and programs that were introduced in 2016-17 but cancelled by 2018-19. These included programs created through the Province’s Climate Change Action Plan that were cancelled in 2018 and the federal government’s Social Infrastructure Fund (SIF), which was in place from 2016-17 to 2018-19.
Figure 3-1 Ontario housing programs spending, 2013-14 to 2018-19 ($ millions)
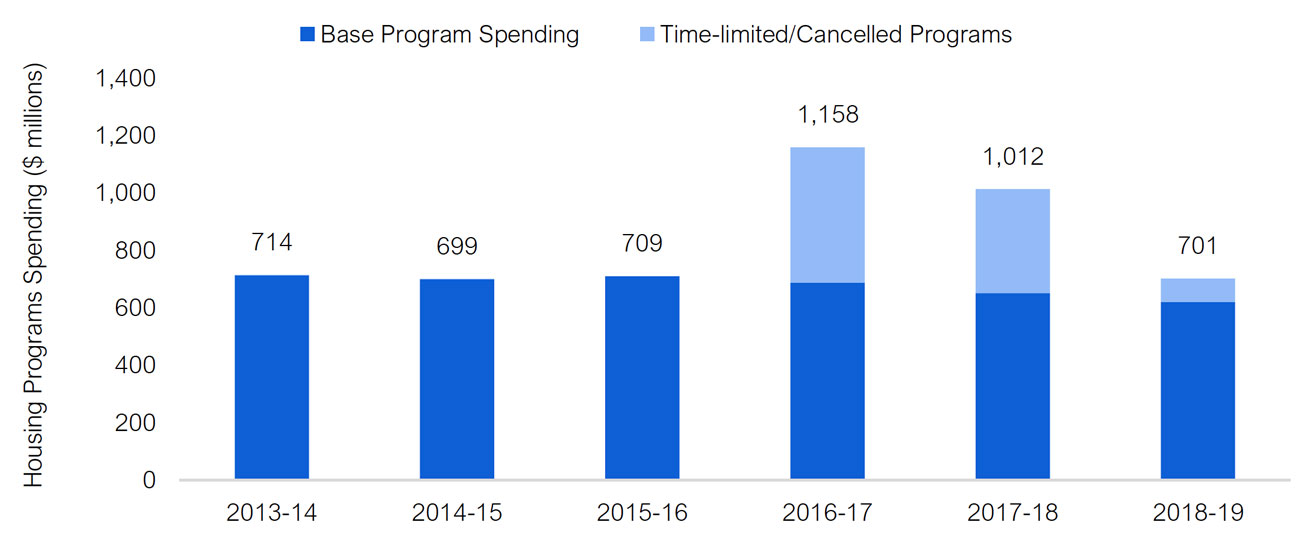
Source: FAO analysis of information provided by MMAH.
In total, time-limited and cancelled programs increased housing spending by $914 million from 2016-17 to 2018-19, including $397 million of temporary funding for existing housing programs under the SIF. The remaining $517 million was capital spending on ‘green programs’ to repair and improve the energy efficiency of subsidized housing units.
The ‘green programs’ funding included $200 million in one-time federal funding under the SIF for repairs and retrofits to subsidized housing units in 2016-17. The remaining $317 million in spending was connected to the Province’s Climate Change Action Plan. This included $92 million through Green Investment Fund (GIF) programs in 2016-17. In 2017-18, the GIF programs were replaced by the Social Housing Apartment Improvement Program (SHAIP) using proceeds from the Province’s cap and trade program. The Province spent $225 million on retrofits to subsidized housing units through SHAIP in 2017-18, before the cancellation of the cap and trade program in 2018.
Federal Contribution to Provincial Housing Programs Spending
From 2013-14 to 2018-19, the federal government contributed two-thirds of the funding for the Province’s housing programs. Over this period, the Province spent $5.0 billion on housing programs, of which the federal government provided $3.3 billion, or 67 per cent. The Province contributed the remaining $1.7 billion, or 33 per cent.
Figure 3-2 Figure 3-2: The federal government funded two-thirds of the cost of the Province’s housing programs from 2013-14 to 2018-19 ($ millions)
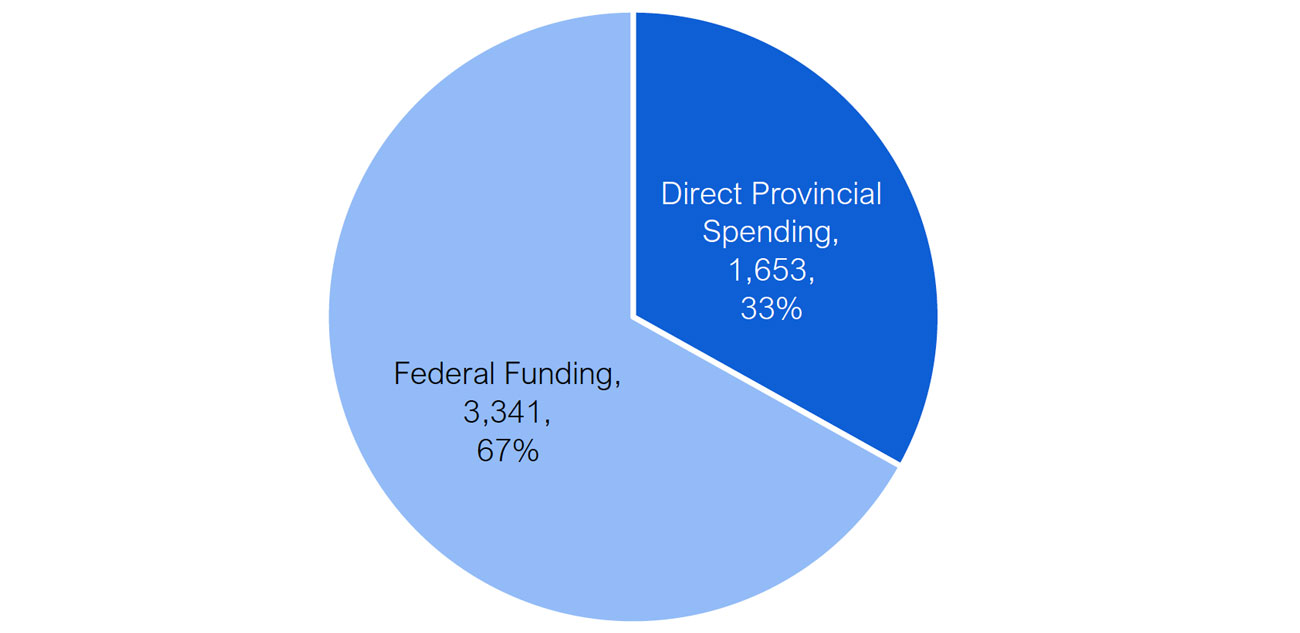
Source: FAO analysis of information provided by MMAH.
Municipal Contribution to Housing Programs
In addition to contributions from the federal government, each year municipalities spend approximately $1 billion in connection with the Province’s housing programs. [28] Spending by municipalities is in addition to federal and provincial contributions and, unlike the federal government’s contribution, is not recorded as spending by the Province. Overall, municipalities contributed $6.2 billion towards the Province’s housing programs from 2013-14 to 2018-19, bringing total housing programs spending to $11.2 billion over the six-year period.
Overview of the Province’s Housing Programs
The Province’s housing programs provide subsidized housing to eligible low- and moderate-income households in Ontario. These programs fall under two main categories: social housing and affordable housing.
Social housing refers to government-subsidized housing that was created between the 1940s and 1990s. Social housing units are operated by municipal organizations, housing co-operatives and non-profit organizations. These organizations primarily offer housing units where tenants pay rent-geared-to-income (RGI), meaning that rent is limited to 30 per cent of the household’s gross income. [29] Housing providers receive a subsidy equal to the difference between the cost to operate the unit and the rent paid by the tenants. Approximately 70 per cent of the cost of social housing is funded by municipal spending while the remaining 30 per cent is funded by the Province, mostly through federal transfers.
Affordable housing refers to federal-provincial cost shared housing programs created since 2002. Affordable housing programs provide construction grants to developers who, in return, create affordable (i.e., below-market rent) housing units in their buildings. The units are required to remain affordable for a minimum of 20 years, after which they can convert to market-rate rental units. The weighted average rent for units financed through affordable housing programs cannot exceed 80 per cent of market rent. Affordable housing programs also provide rent supplements [30] that are direct rent subsidies paid to either housing providers or households. A key distinction between social and affordable housing is that affordable housing programs do not offer RGI assistance, which sets rent based on a household’s income. [31] Another distinction is that affordable housing programs offer homeownership assistance that provides households with forgivable down payment loans.
Household eligibility criteria for social and affordable housing programs are set by the municipal service managers that operate the programs, and the Housing Services Act, 2011 and associated regulations. Eligibility is determined primarily by household income, which cannot exceed limits that vary by municipality, household size and type of support. [32]
| Social Housing | Affordable Housing | |
| Creation of Programs | 1940s to 1990s | 2002 to present |
| Eligibility | Determined by municipal service managers and legislation | Determined by municipal service managers and legislation |
| Type of Support | Primarily RGI housing units* | Below-market rent housing units Rent supplements Homeownership assistance |
| Level of Support | Most tenants pay RGI* | Average rent cannot exceed 80% of market rent** |
| Largest Funding Source | Municipalities | Cost-matched by Province and federal government |
Households Supported under the Province’s Housing Programs
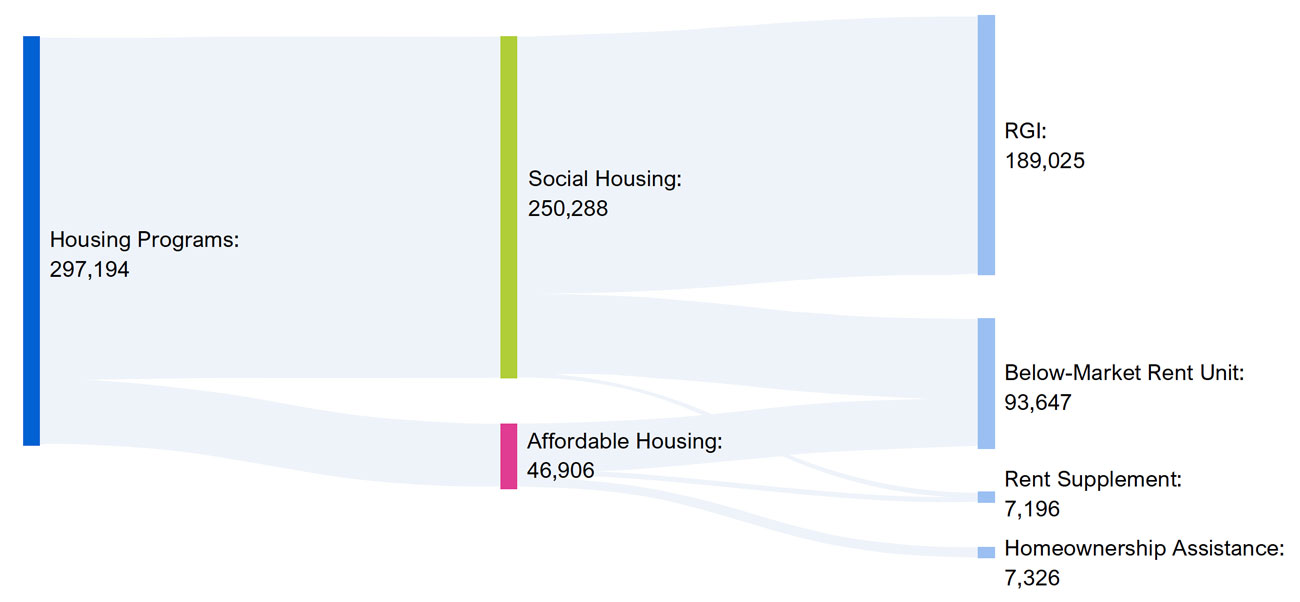
In 2018-19, approximately 297,200 households received support under the Province’s housing programs, [33] including 250,300 recipients of social housing support and 46,900 recipients of support through affordable housing programs. Housing programs support can also be broken down by the type of support provided. In 2018-19, 189,000 households lived in RGI housing, 93,600 households lived in below-market rent housing units, 7,200 households received rent supplements and 7,300 households benefited from homeownership assistance. The figure below demonstrates the relationship between the Province’s housing programs and the types of housing support.
Figure 3-3 Households supported by program and type of support, 2018-19
Source: FAO analysis of information provided by MMAH.
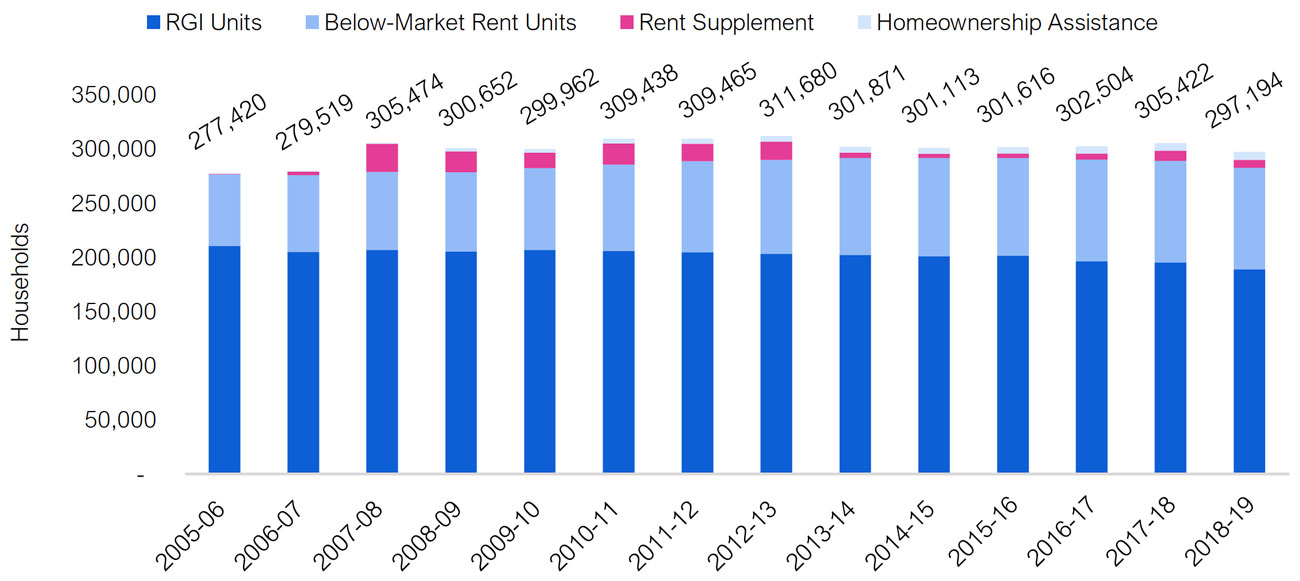
The FAO estimates the number of households served by the Province’s housing programs increased from 277,400 in 2005-06 to a peak of 311,700 in 2012-13 before declining to 297,200 in 2018-19.
Figure 3-4 Households supported under the Province’s housing programs, 2005-06 to 2018-19
Source: FAO analysis of information provided by MMAH.
From 2005-06 to 2018-19, there was an overall increase of 19,800 households that received support under the Province’s housing programs. This increase was due to growth in the number of below-market rent units (increase of 27,900 units) and the introduction of rent supplements and homeownership assistance, which supported 14,500 households in 2018-19. This was partially offset by a reduction of 21,600 households that no longer lived in RGI units in 2018-19 compared to 2005-06.
Despite this overall increase in households that received support from 2005-06 to 2018-19, the number of households supported peaked at approximately 310,000 per year from 2010-11 to 2012-13 before declining to 297,200 by 2018-19. The higher level of support provided between 2010-11 and 2012-13 was in part due to rent supplements under the Rental Opportunities for Ontario Families (ROOF) program and the Short-term Rent Supplement Program, which both ended in 2012-13.
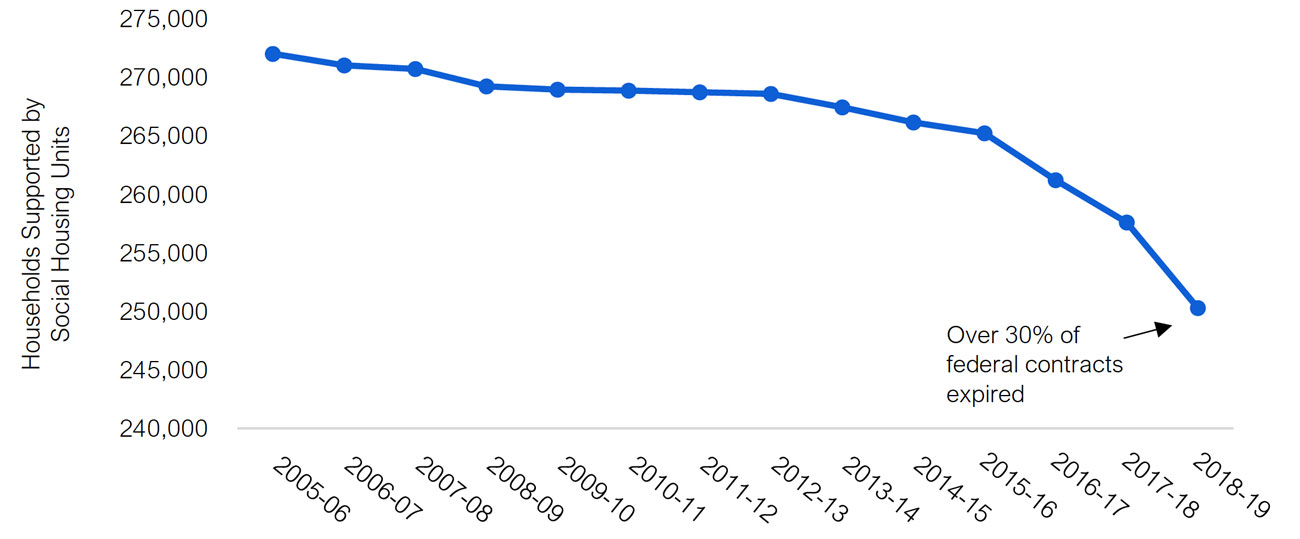
The reduction in RGI units from 2005-06 to 2018-19 largely reflects the expiration of social housing funding contracts with the federal government. Although Ontario’s Housing Services Act, 2011 mandates that municipalities must maintain most of the social housing units previously funded by the federal government, [34] approximately 83,000 predominantly RGI housing units are at risk of being converted to market-rate rent units as funding contracts with the federal government expire. [35] As of 2018-19, over 30 per cent of federal social housing funding contracts had expired, resulting in the loss of 21,600 social housing units.
Figure 3-5 21,600 reduction in social housing units by 2018-19 as federal-provincial social housing funding contracts expire
Source: FAO analysis of information provided by MMAH and Auditor General of Ontario, “Social and Affordable Housing,” 2017.
Level of Support
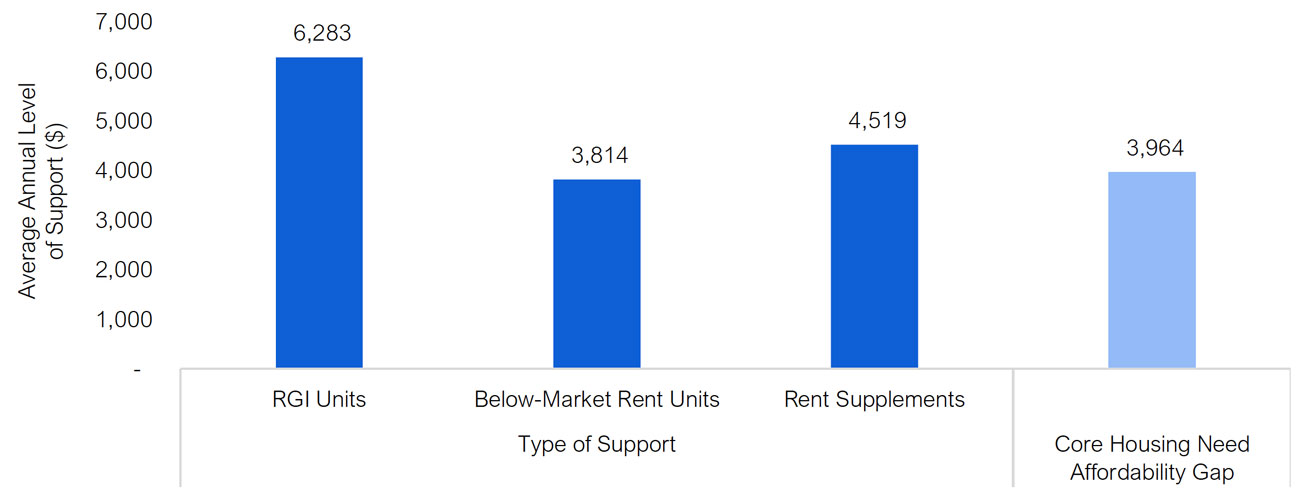
The level of support offered to households under the Province’s housing programs varies depending on the type of housing support provided and reflects differences in program design. This is important when considering the ability of housing supports to remove households from core housing need. In 2018, households in RGI housing units received an average annual subsidy of $6,300, while households in below-market rent housing units received an average annual subsidy of $3,800 and rent supplements provided households with an average subsidy of $4,500. [36]
In comparison, the FAO estimates that the average core housing need affordability gap was approximately $4,000 in 2018. This represents the average amount of before-tax income needed to raise a household out of core housing need.
Figure 3-6 Comparison of housing support levels and the core housing need affordability gap in 2018
Source: FAO analysis of information provided by MMAH.
Overall, RGI units provided a higher level of support, on average, than either below-market rent units or rent supplements. However, both RGI units and rent supplements were sufficient, on average, to eliminate the affordability gap and remove a household from core housing need. On the other hand, the average subsidy provided by below-market rent units was below the average core housing need affordability gap, implying that the average household under this type of support was not removed from core housing need. As a result, the FAO estimates that in 2018, 31 per cent of renters who received support from the Province’s housing programs were still in core housing need. [37]
Implications for Core Housing Need, 2011 to 2018
Since 2011, the number of households in core housing need has increased while the number of households receiving housing support from provincial programs has decreased. Between 2011 and 2018, the number of households in core housing need grew from 616,900 to 735,000, an increase of 118,100 households, or 19.1 per cent. Over the same period, the number of households receiving housing support declined by 12,300 or 4.0 per cent, from 309,500 to 297,200 households.
Figure 3-7 Change in households in core housing need and households receiving housing support, 2011 to 2018 (%)
Source: FAO analysis of information provided by MMAH and Statistics Canada’s 2011 Census of Canada and 2018 Canadian Housing Survey.
The increase in households in core housing need between 2011 and 2018 was driven by an increase in housing costs that outpaced income growth, and by demographic changes. [38] It was further exacerbated by the reduction in housing support under the Province’s housing programs. Importantly, the number of RGI housing units, which is the only type of housing support that guarantees a household is removed from core housing need, declined by 7.6 per cent over this period.
The 19.1 per cent increase in the number of households in core housing need from 2011 to 2018, combined with a 4.0 per cent drop in the number of households supported by provincial housing programs, drove an increase in unmet demand for housing support. Over the same time period, the wait list for social housing [39] experienced a 27 per cent increase, from 169,700 households in 2011 to 215,000 households in 2018, with many households waiting over 10 years for a placement in social housing. [40]
Figure 3-8 Ontario’s social housing wait list, 2011 to 2018
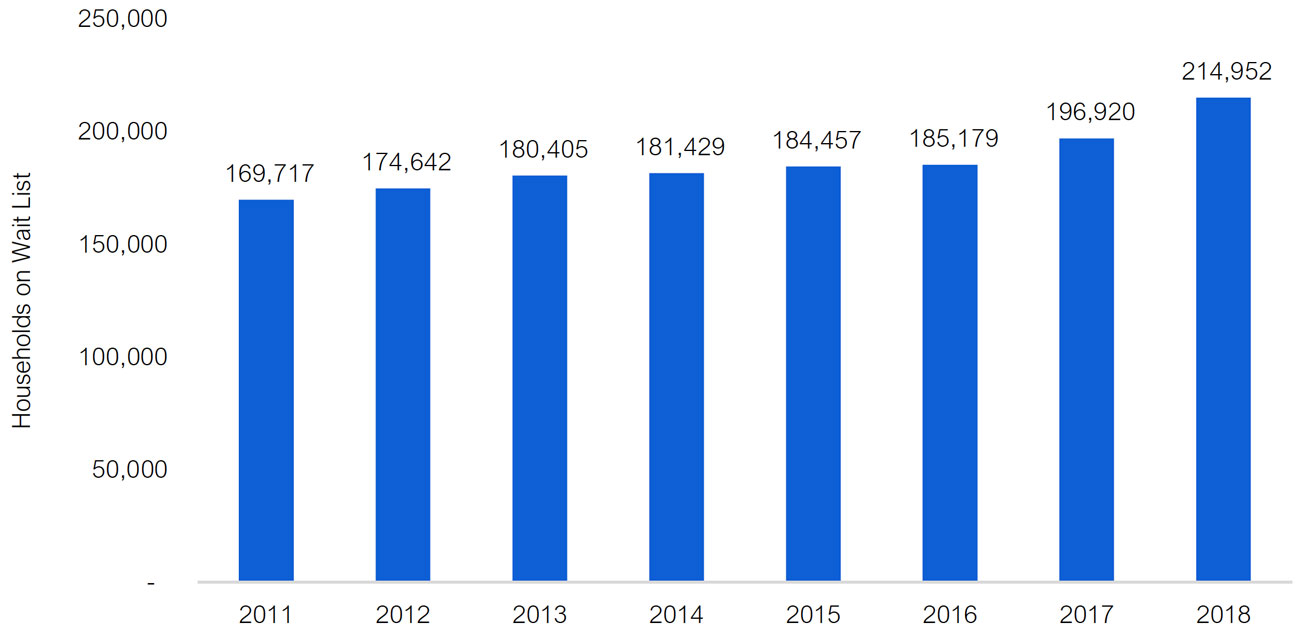
Note: The Province’s social housing wait list represents a compilation of data received from municipal service managers. It may include double counting of individuals on multiple local wait lists.
Source: FAO analysis of information provided by MMAH.
4 | Expiring Programs and the National Housing Strategy
The Province’s housing programs are jointly funded with the federal government through a number of agreements that commit both federal and provincial funding. Between 2018-19 and 2027-28, most of the federal-provincial spending on existing housing programs will expire and be replaced by three new programs created under the National Housing Strategy (NHS). This transition from legacy housing programs to the new NHS programs will have a significant effect on the Province’s housing program spending. This chapter outlines what programs and funding will expire and how that funding will be replaced by the new NHS programs. In Chapter 5, the FAO projects total housing programs spending through 2027-28 and forecasts how the Province’s housing programs under the NHS will affect housing supply and core housing need in Ontario.
Expiring Funding Commitments
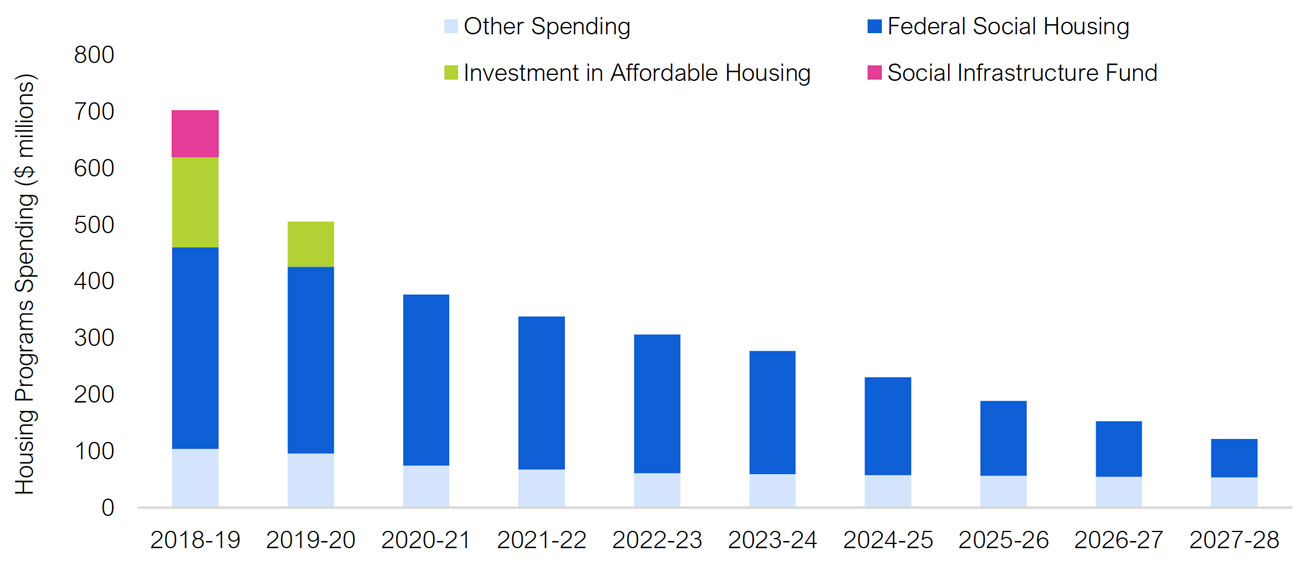
The FAO estimates that between 2018-19 to 2027-28, the Province’s spending on housing programs was set to decline by over 80 per cent. This was largely due to the expiration of the two major federal-provincial affordable housing agreements, the Social Infrastructure Fund, which expired in 2018-19, and the Investment in Affordable Housing program, which expired in 2019-20. In addition, spending funded by expiring federal social housing transfers will decline from $356 million in 2018-19 to $68 million in 2027-28.
Figure 4-1 Expiring housing programs spending, 2018-19 to 2027-28 ($ millions)
Source: FAO estimate based on information provided by MMAH.
The National Housing Strategy
In November 2017, the Government of Canada announced its National Housing Strategy (NHS). A significant part of the NHS involved renewing the expiring federal-provincial support for housing programs. On April 30, 2018, the Province of Ontario and the Canada Mortgage and Housing Corporation (CMHC) signed a 10-year bilateral agreement that created three new federal-provincial housing programs. The purpose of the new programs is to preserve the expiring federal-provincial housing funding and expand the supply of social and affordable housing in Ontario. As a result, beginning in 2019-20, the Province’s housing programs spending began to shift from legacy programs to the three new programs under the NHS. [41]
- Canada-Ontario Community Housing Initiative (COCHI) – A program that replaces expiring federal funding for social housing in Ontario. As noted in Chapter 3, Ontario has been losing social housing units due to expiring federal social housing operating agreement contracts. COCHI will provide federal support to preserve the existing stock of rent-assisted social housing in Ontario through operating subsidies and capital repairs, and to fund the creation of new social housing units.
- Ontario Priorities Housing Initiative (OPHI) – This program replaces the Investment in Affordable Housing program that ended in 2019-20. OPHI provides capital funding to repair existing affordable housing units and create new below-market rent housing units. It also provides eligible households with homeownership assistance in the form of forgivable loans, rental assistance through rent supplements and housing support services (such as counselling, job placements and household set-up assistance).
- Canada-Ontario Housing Benefit (COHB) – A new portable rent supplement that will provide a subsidy equal to the difference between 80 per cent of the CMHC average market rent in the household’s area and 30 per cent of a household’s adjusted net income. COHB represents a significant expansion of provincial housing support as it does not replace an expiring funding commitment.
Under the NHS agreement, the Province and federal government have committed to spend $4.0 billion through the Province’s housing programs from 2019-20 to 2027-28. [42] The $4.0 billion NHS spending commitment consists of $2.9 billion of federal support and $1.1 billion of direct provincial spending through the three new housing programs.
| Program | Federal Spending | Provincial Spending | Total |
| Canada-Ontario Community Housing Initiative (COCHI) | 1.8 | 0.0 | 1.8 |
| Ontario Priorities Housing Initiative (OPHI) | 0.4 | 0.4 | 0.8 |
| Canada-Ontario Housing Benefit (COHB) | 0.7 | 0.7 | 1.5 |
| Total | 2.9 | 1.1 | 4.0 |
Spending will increase annually, with 50 per cent of the NHS’s $4.0 billion in funding occurring after 2024-25.
Figure 4-2 Projected spending by NHS program, 2019-20 to 2027-28 ($ millions)
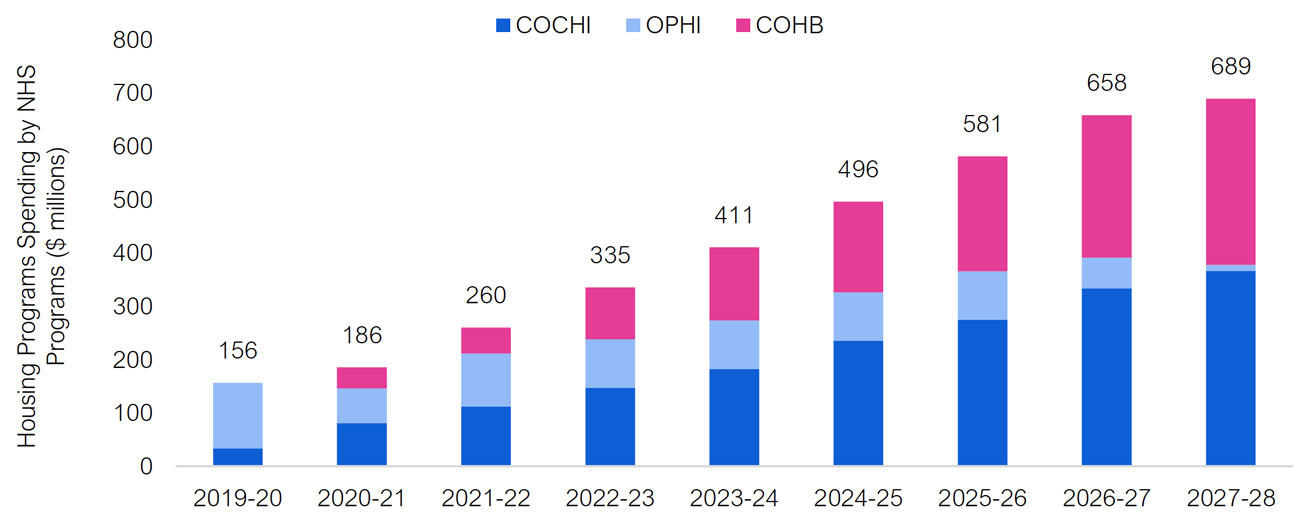
Note: Excludes $45 million of provincial spending from existing provincial programs in 2018-19 and 2019-20 that has been allocated towards the NHS spending commitment and $168 million of provincial spending for COHB in 2028-29.
Source: FAO analysis of Government of Ontario, “Community Housing Renewal: Ontario’s Action Plan Under the National Housing Strategy” and the CMHC-Ontario Bilateral Agreement under the 2017 National Housing Strategy.
National Housing Strategy Targets
The Province’s objectives under the three new NHS programs are to increase the supply of social and affordable housing in Ontario to help households in core housing need. To that end, the Province has set targets for the number of households that will receive support under the NHS programs. However, the Province has not set targets for removing households from core housing need or the expected number of households in core housing need by 2027-28.
Overall, the Province projects that 209,048 households will receive support from NHS programs in 2027-28. This includes 150,727 households supported by COCHI funding, 7,698 supported by OPHI funding and 50,623 supported by the COHB program. [43]
| Program | Households Supported in 2027-28 |
| COCHI | |
| Preserved Social Housing | 131,067 |
| New Social Housing Rent-Assisted Units | 19,660 |
| Total COCHI Support | 150,727 |
| OPHI | |
| Below-Market Rent Units | 7,081 |
| Homeownership Assistance | 617 |
| Total OPHI Support | 7,698 |
| COHB | |
| Rent Supplements | 50,623 |
| Total COHB Support | 50,623 |
| Total Households Supported | 209,048 |
Of the Province’s projected 209,048 households that will be supported by NHS programs in 2027-28, 150,727 will be supported by social housing funding under the COCHI program. The NHS agreement will preserve federal funding for 131,067 social housing units in Ontario that was set to expire. In addition, the Province must add 19,660 new rent-assisted units in social housing by 2027-28.
The Province projects that 7,698 households will be supported by the OPHI program in 2027-28. This includes 7,081 new below-market rent units and 617 homeownership assistance subsidies. OPHI provides support that is similar to initiatives that were funded under the Investment in Affordable Housing program that ended in 2019-20.
Finally, the Province projects 50,623 households will be supported by the COHB program in 2027-28. The COHB is a portable benefit, meaning that it is not tied to a specific housing unit. Eligible households will receive a rent supplement that can be applied to the cost of shelter in any location.
5 | Housing Programs Outlook
Housing Programs Spending Forecast
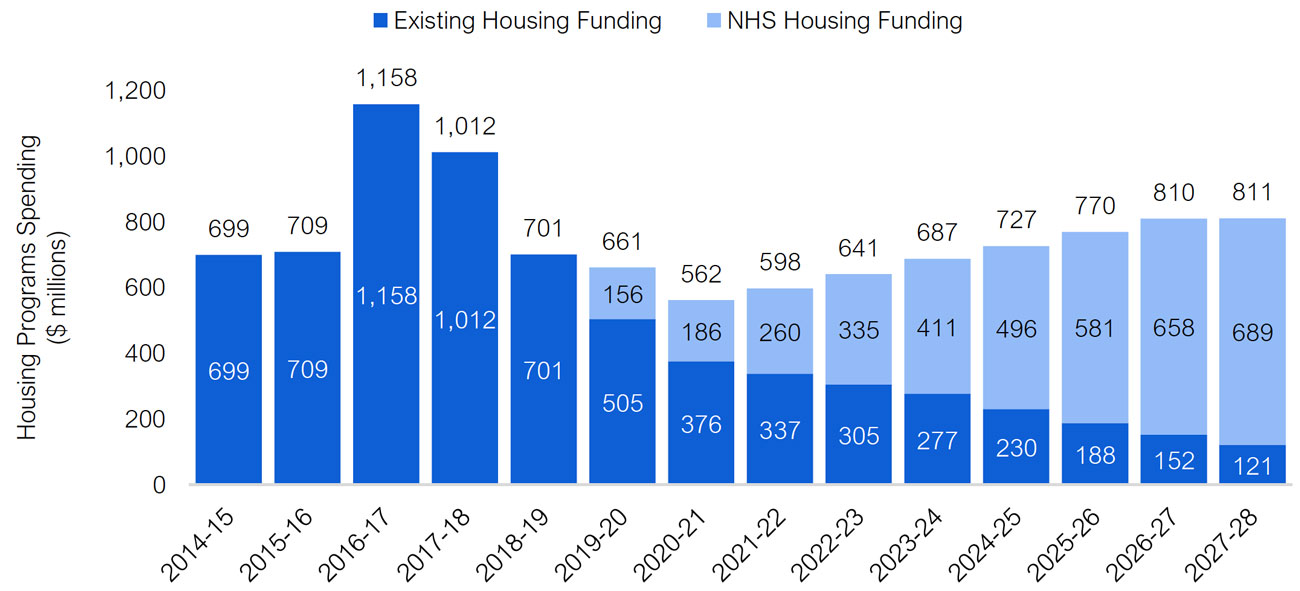
Based on a review of expiring funding agreements and the new funding commitments under the NHS, the FAO projects that the Province’s annual spending on housing programs will increase from $701 million in 2018-19 to $811 million in 2027-28. Annual spending is projected to be lower than 2018-19 levels until 2024-25, as new funding from NHS programs will not make up for lost funding under expiring agreements. Starting in 2024-25, annual spending on housing programs will be higher than 2018-19 levels as increasing funding under the NHS programs begins to exceed lost funding under expired agreements. [44]
Figure 5-1 Ontario housing programs spending, historical and projected, 2014-15 to 2027-28 ($ millions)
Note: Actual spending from 2014-15 to 2019-20. Planned spending from 2020-21 to 2027-28.
Source: FAO analysis of information provided by MMAH; Government of Ontario, “Community Housing Renewal: Ontario’s Action Plan Under the National Housing Strategy”; and the CMHC-Ontario Bilateral Agreement under the 2017 National Housing Strategy.
Overall, from 2019-20 to 2027-28, annual spending on the Province’s housing programs will average $696 million. This is significantly lower than average annual spending by the Province from 2014-15 to 2018-19, at $856 million per year.
Impact on Households Supported
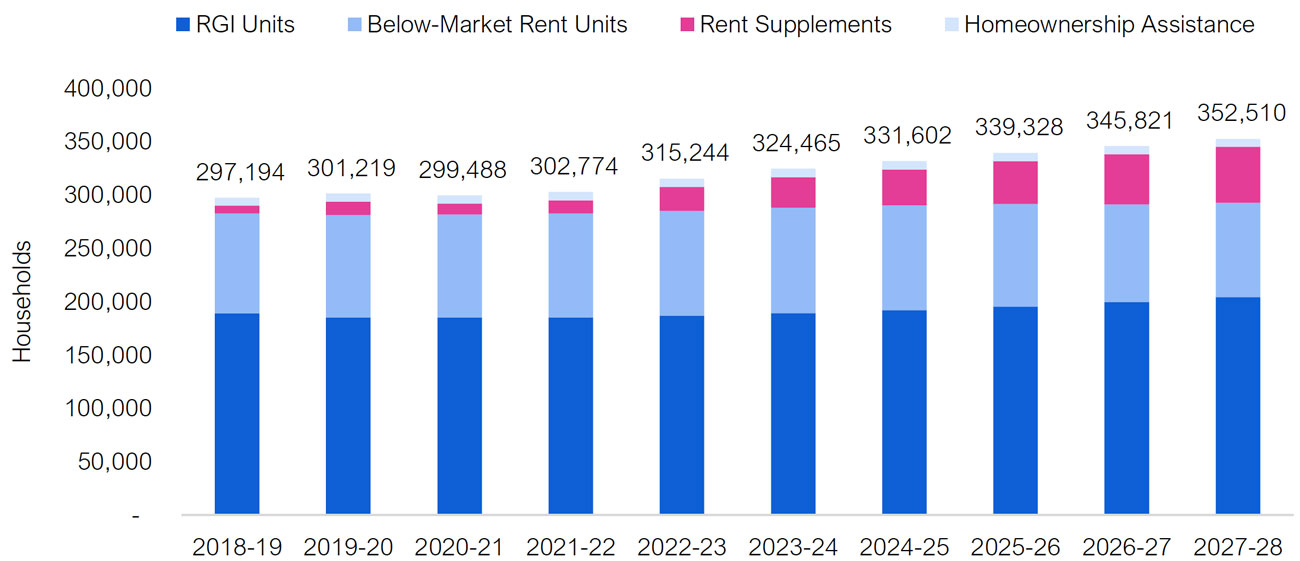
The FAO projects that the number of households supported by the Province’s housing programs will increase by 55,300, from 297,200 in 2018-19 to 352,500 in 2027-28. This consists of an increase of 45,200 households supported by rent supplements and 15,100 additional RGI units. These increases are partially offset by a loss of 5,000 below-market rent units.
Figure 5-2 Projected number of households supported under the Province’s housing programs from 2018-19 to 2027-28
Source: FAO analysis of information provided by MMAH; Government of Ontario, “Community Housing Renewal: Ontario’s Action Plan Under the National Housing Strategy”; and the CMHC-Ontario Bilateral Agreement under the 2017 National Housing Strategy.
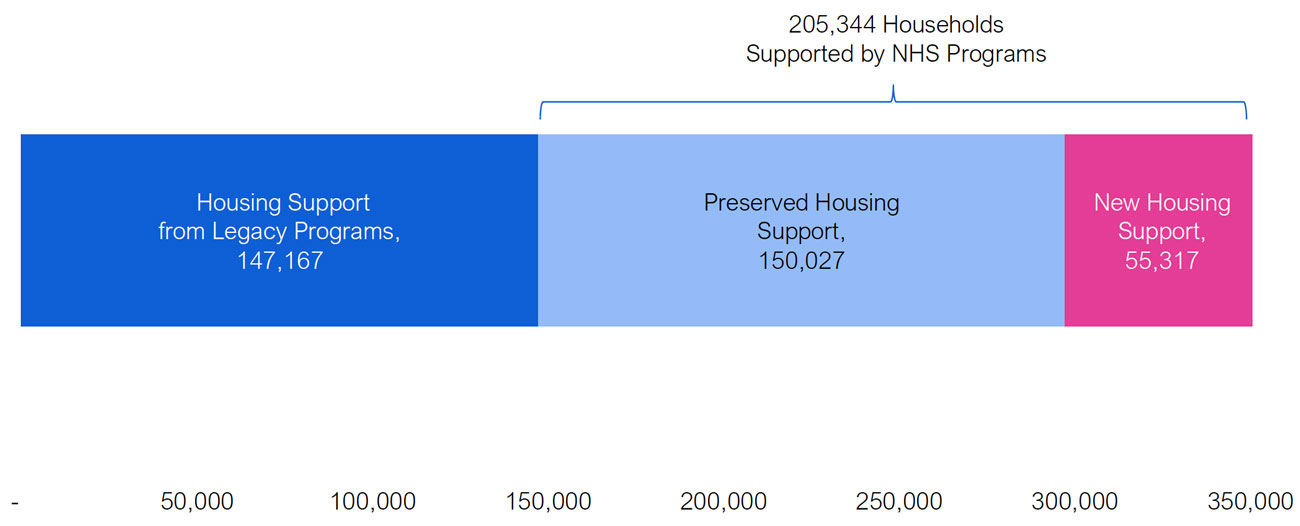
In 2027-28, of the projected 352,500 households that will receive housing support, the FAO estimates that 205,300 households will be supported through the three new NHS housing programs, while the remaining 147,200 households will be supported by legacy housing programs.
As outlined in Chapter 4, the Province’s target under the NHS is to support 209,048 households in 2027-28. Based on the FAO’s review, the three new NHS housing programs will support approximately 205,300 households in 2027-28, which is 3,700 less than the Province’s target. The difference occurs in the FAO’s projection for the COHB program, which will only have funding that is sufficient to support 46,919 recipients, rather than the 50,623 recipients targeted by the Province.
Importantly, the 205,300 households that will receive support in 2027-28 under the three new NHS housing programs does not represent a net increase in housing support compared to 2018-19 levels. As the NHS programs are largely replacing expiring funding commitments, only 55,300, or 27 per cent, of the households supported under the three NHS programs will represent a net increase in housing support. The remaining 150,000, or 73 per cent, of households that will receive support through NHS programs in 2027-28 were previously supported under legacy housing program funding that will have expired by 2027-28.
Figure 5-3 Breakdown of the projected 352,500 households that will receive housing program support in 2027-28
Source: FAO analysis of information provided by MMAH; Government of Ontario, “Community Housing Renewal: Ontario’s Action Plan Under the National Housing Strategy”; and the CMHC-Ontario Bilateral Agreement under the 2017 National Housing Strategy.
Impact on Core Housing Need
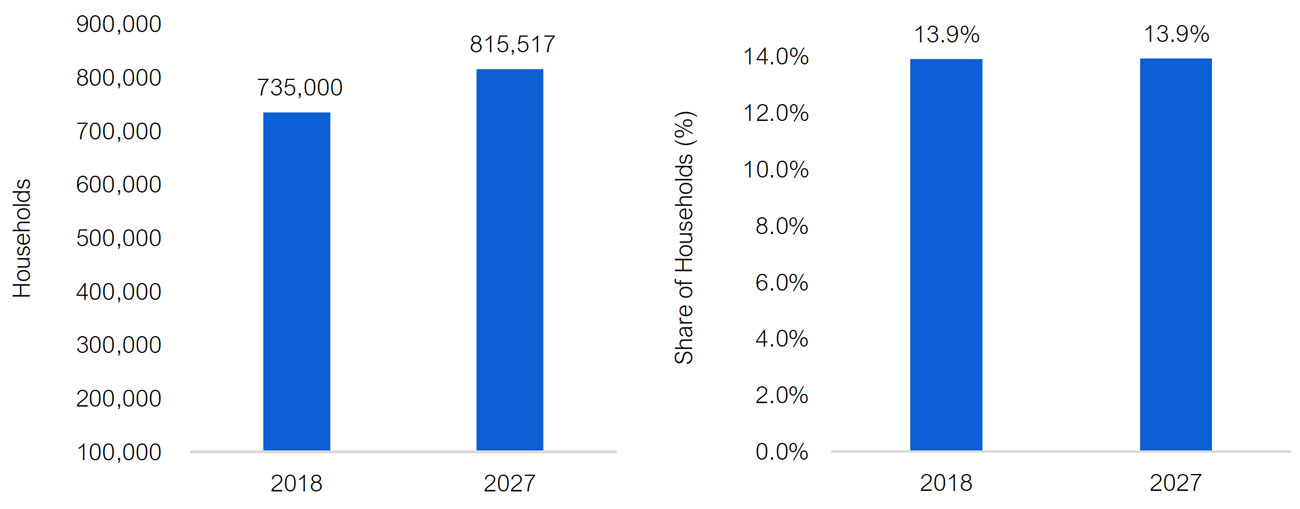
The FAO estimates that the total number of households in core housing need will increase from 735,000 in 2018 to 815,500 households in 2027, an increase of 80,500 households. After accounting for population growth, the FAO projects that the share of the Province’s households in core housing need will remain unchanged in 2027, compared to 2018, at 13.9 per cent.
Figure 5-4 Total households in core housing need and as share of households, 2018 vs. 2027
Source: FAO analysis of information provided by MMAH, Statistics Canada and CMHC.
Although annual provincial spending on housing programs will increase to $811 million by 2027-28, and the number of households receiving support will increase by a net 55,300, the FAO still projects that the number of households in core housing need will increase through 2027 at an average annual rate of 1.2 per cent. This is due to the FAO’s expectation that population growth and higher housing costs will more than offset household income growth and the incremental support provided by provincial housing programs through the NHS. [45] While the additional support for 55,300 households will not be sufficient to lower core housing need below 2018 levels, it will keep the share of Ontario households in core housing need stable.
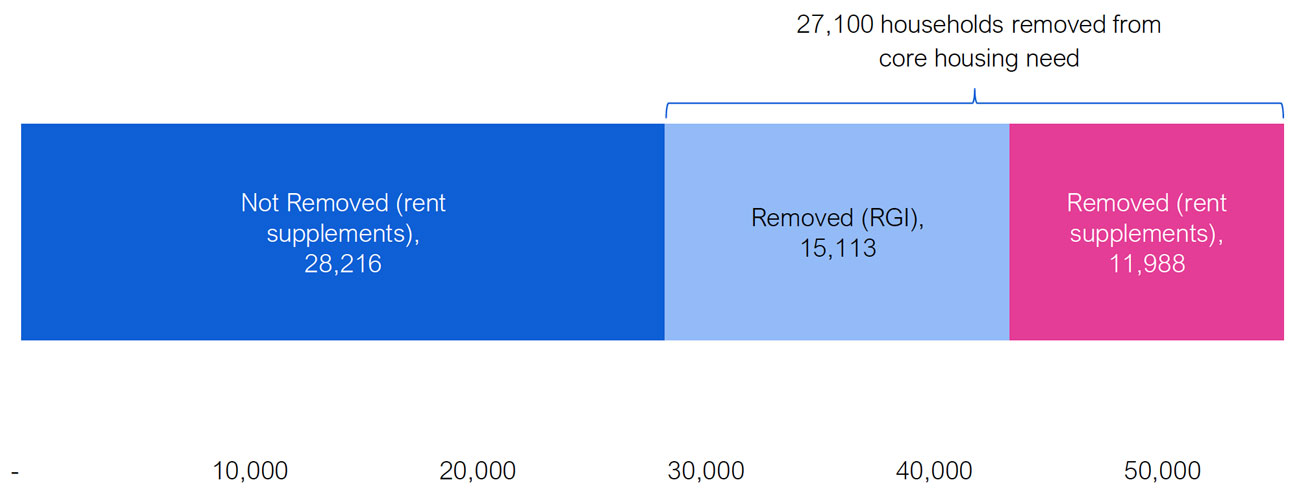
The number of households in core housing need is projected to grow in part because half of the new households receiving support through the NHS will not be removed from core housing need. In total, the FAO estimates that of the 55,300 additional households that will receive support under the Province’s housing programs in 2027-28, only 27,100 (49 per cent) will be removed from core housing need.
Figure 5-5 Share of 55,300 new households receiving support in 2027-28 that will be removed from core housing need
Source: FAO analysis of information provided by MMAH, Statistics Canada and CMHC.
The 55,300 additional households consist of 15,100 new households that will receive RGI support and 40,200 households that will be supported primarily by rent supplements under the COHB component of the NHS. As noted previously, due to program design, RGI support guarantees that a household is removed from core housing need. However, although the rent supplement under the COHB program is tied to a household’s income, it does not ensure that the household’s shelter costs are below the core housing need affordability standard.
Importantly, the COHB program is designed to target vulnerable populations [46] and the FAO estimates that by 2027-28, vulnerable populations in Ontario will need an average of $7,600 (or $630 per month) to be removed from core housing need. By comparison, the FAO estimates that the average annual level of support for these households under the COHB program will reach $6,600 (or $550 per month) by 2027-28. Consequently, because the COHB program targets particularly high-need households, the FAO estimates that only 30 per cent of households that receive the COHB program rent supplement will be removed from core housing need. As a result, of the 40,200 households that will receive new rent supplements in 2027-28, only 12,000 will be removed from core housing need.
6 | Homelessness Programs Overview and Outlook
The Commitment to End Chronic Homelessness
The Province’s homelessness programs centre on the commitment to end chronic homelessness by the end of 2025. [47] Chronic homelessness refers to people who are currently homeless and have been homeless for six months or more in the past year. People experiencing chronic homelessness have urgent need to access permanent housing and related supports and require a disproportionate amount of provincial resources compared to recipients of housing programs. For example, a single shelter bed costs over $25,000 per year to operate [48] while a rent-geared-to-income subsidy costs only $6,300 per year.
Housing and homelessness programs are interrelated in that a key component to ending chronic homelessness is ensuring households experiencing or at risk of homelessness have access to affordable housing. The Province’s strategy to end chronic homelessness focuses on moving individuals along a “housing continuum” whereby people experiencing homelessness have access to emergency shelters, then transitional housing. Households then exit homelessness and receive subsidies (such as rent supplements or RGI assistance) from housing programs with the end goal of being able to acquire market housing. [49]
Figure 6-1 The Province’s strategy to end chronic homelessness moves households along the “housing continuum
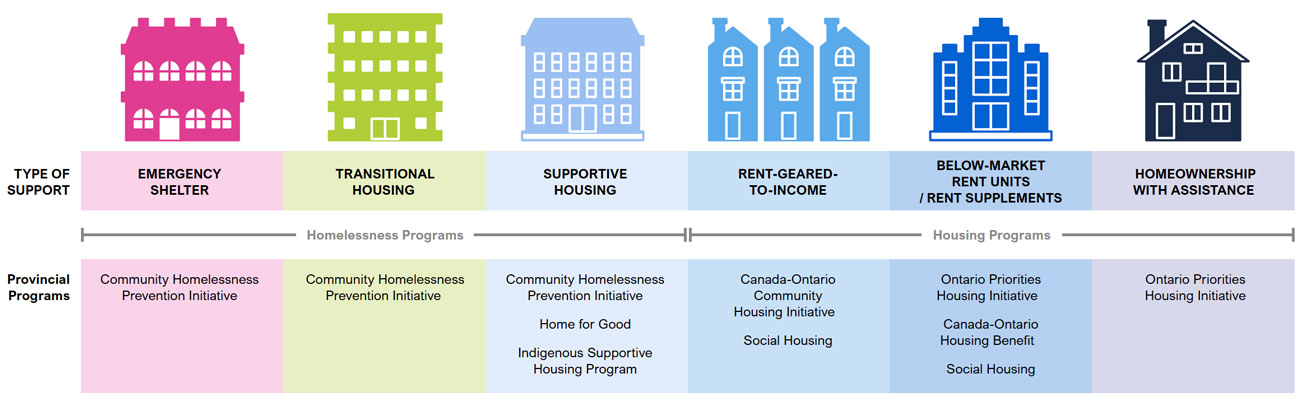
Note: For illustrative purposes only. Excludes some government programs.
Source: FAO.
The Province’s homelessness programs focus on two primary objectives. The first objective is that people experiencing homelessness can obtain and retain housing. The second objective is that people at risk of homelessness are able to remain in their housing. The Province measures the performance of its homelessness programs in achieving these objectives through a series of indicators that track movement along the housing continuum.
| Objective | Indicator | |||||
| People experiencing homelessness obtain and retain housing |
|
|||||
| People at risk of homelessness retain housing |
|
The Province’s Homelessness Programs
The Province administers three homelessness programs: the Community Homelessness Prevention Initiative (CHPI), Home for Good (HFG) and the Indigenous Supportive Housing Program (ISHP). [50]
CHPI funds programs under two categories: people experiencing homelessness and people at risk of homelessness. For people experiencing homelessness, CHPI primarily funds temporary housing in the form of emergency shelters and transitional housing as well as related supports such as meals, cleaning services and personal care assistance. For people at risk of homelessness, CHPI provides emergency financial assistance in the form of rental and/or utility arrears to prevent people from losing their housing.
The HFG and ISHP programs both provide affordable housing and related supports targeted to households at risk of or experiencing homelessness. This includes funding for affordable rental units and rent supplements. These housing subsidies are included in the housing support discussed in Chapters 3 and 5.
Homelessness Programs Spending
In 2020-21, the Province plans to spend $990 million through its homelessness programs, which consists of $424 million in base homelessness programs spending and $566 million of spending related to the COVID-19 pandemic. [51]
Excluding the $566 million of spending related to the COVID-19 pandemic in 2020-21, provincial spending on homelessness programs has grown at an annual average rate of 8.0 per cent since 2013-14. The growth in spending is due primarily to new CHPI program spending and the creation of the HFG program. This funding was introduced in the 2016 Long-Term Affordable Housing Strategy as part of the Province’s commitment to end chronic homelessness by the end of 2025.
Figure 6-2 Homelessness programs spending, 2013-14 to 2020-21 ($ millions)
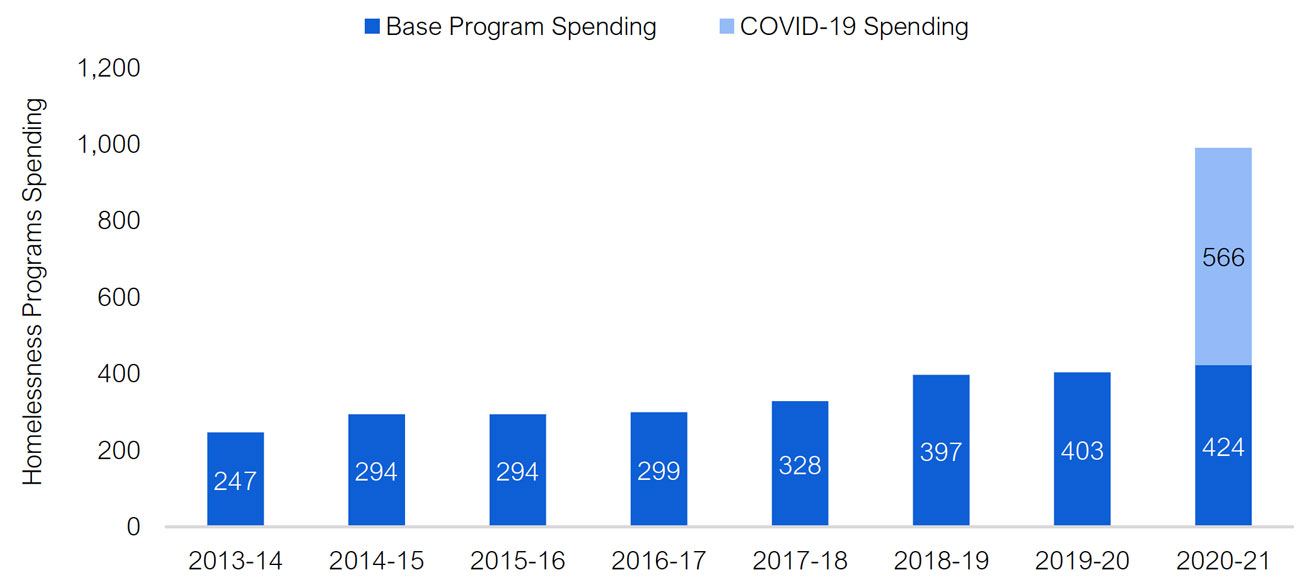
Note: Actual spending from 2013-14 to 2019-20. Planned spending in 2020-21.
Source: FAO analysis of information provided by MMAH.
Approximately 80 per cent of the Province’s homelessness programs spending flows through CHPI. The remaining 20 per cent flows through the HFG and ISHP programs.
| Homelessness Program | 2015-16 | 2016-17 | 2017-18 | 2018-19 | 2019-20 | 2020-21 |
| Community Homelessness Prevention Initiative (CHPI) | 294 | 294 | 309 | 324 | 324 | 339 |
| Home for Good (HFG) | 0 | 0 | 15 | 49 | 57 | 56 |
| Indigenous Supportive Housing Program (ISHP) | 0 | 0 | 2 | 16 | 13 | 29 |
| Portable Housing Benefit – Special Priority Policy (PHB-SPP) | 0 | 5 | 1 | 9 | 10 | 0 |
| Total | 294 | 299 | 328 | 397 | 403 | 424 |
The Province’s homelessness programs spending consists of transfers to municipal service managers and Indigenous Program Administrators, who deliver the programs outlined above. In addition to the provincial transfers, municipalities spend their own funds on homelessness programs and some also receive direct transfers from the federal government under the Reaching Home program that is part of the National Housing Strategy. Unlike the Province’s housing programs, the federal government does not transfer funds to the Province to support homelessness programs. Instead, the federal government transfers funds directly to designated communities, most of which are municipal service managers.
Households Supported
Between 2014-15 and 2018-19, the FAO estimates that the number of households supported by homelessness programs grew by approximately five per cent per year. In 2018-19, approximately 29,300 households experiencing homelessness were moved from shelters or other provisional accommodation to either transitional or long-term housing, down from 30,600 in 2014-15. A further 156,400 households in 2018-19 that were at risk of homelessness received support to retain their housing, mostly through loss prevention measures such as rent and energy arrears (an increase from 104,500 households in 2014-15). An additional 6,300 households received housing support in 2018-19 under the HFG program.
Figure 6-3 Households supported by homelessness programs
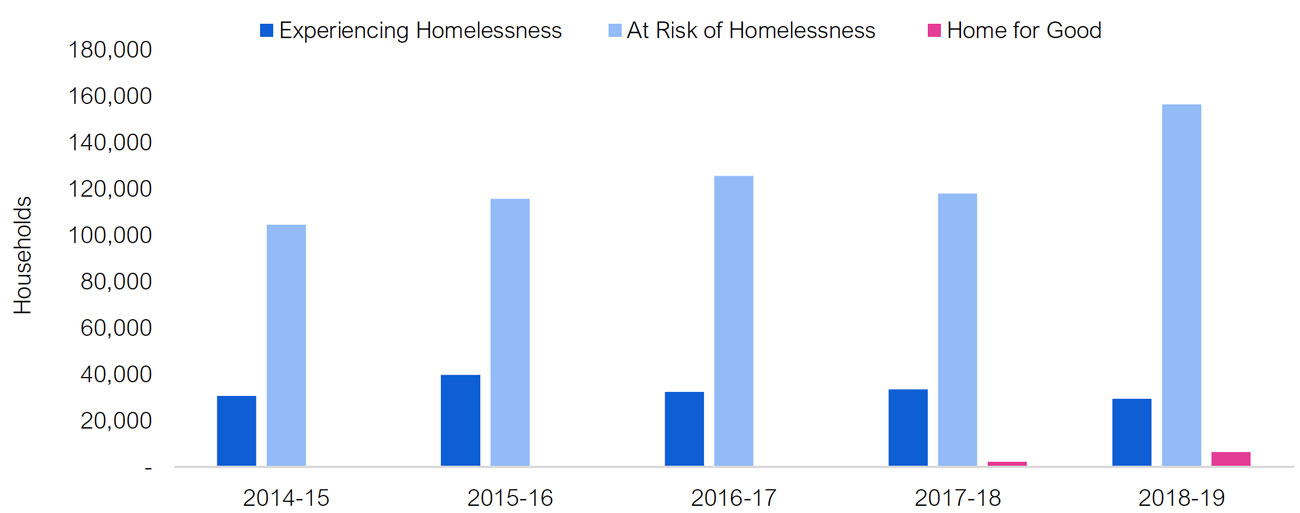
Note: Support cannot be expressed cumulatively as households can receive support from multiple programs.
Source: Published plans and annual reports 2014-15 to 2019-20: Ministry of Municipal Affairs and Housing.
Will the Province End Chronic Homelessness by 2025?
Chronic homelessness is a complex social issue and assessing the Province’s ability to achieve its commitment to end chronic homelessness by 2025 is challenging because the Province does not currently have a detailed plan. [52] Looking forward, the FAO has identified key considerations relating to the Province’s goal of ending chronic homelessness by 2025.
The Province does not Measure Chronic Homelessness
Tracking the impact of the Province’s housing and homelessness programs on chronic homelessness is difficult because the Province does not measure or report on the number of homeless individuals or chronic homelessness. In 2018, the Province launched a homelessness enumeration initiative to establish a baseline and help track progress towards ending chronic homelessness. However, due to limitations on how data was collected, the enumeration initiative was paused in 2020 and a province-wide baseline has not yet been developed. [53] Despite the data limitations, all municipal service managers did conduct homelessness enumerations in 2018 under the Province’s directive and some municipalities in Ontario do report on homelessness indicators.
Shelter Use is Increasing
Based on data from a number of communities in Ontario that conducted homelessness enumerations in 2018, the FAO estimates that over 16,000 Ontarians are homeless on any given night, of which between 40 and 60 per cent are experiencing chronic homelessness. [54] Most of the homeless population stay in 401 municipally run shelters that have a total of 11,819 beds. [55] Therefore, shelter use data is perhaps the best available indicator of how the homeless population is changing over time.
Although the Province does not publish information on emergency shelter use, some municipalities do publicly report shelter statistics. The municipalities of Ottawa and Toronto account for over half of the shelter beds in Ontario. Both cities report increased shelter usage since 2014, which has been driven primarily by growth in the number of families using shelters and increases in the length of time individuals are staying in shelters. For reference, the number of families using Ottawa shelters increased from 695 families in 2014 to 1,182 in 2019 and the average length of stay for all shelter users grew from 78 days in 2014 to 101 days in 2019. In Toronto, shelter use increased by 80 per cent from 2013 to 2018 and, prior to the COVID-19 pandemic, Toronto shelters operated above 92 per cent capacity in every month since the city began publishing occupancy data in 2017. [56]
Figure 6-4 City of Ottawa shelter statistics, 2014 to 2019
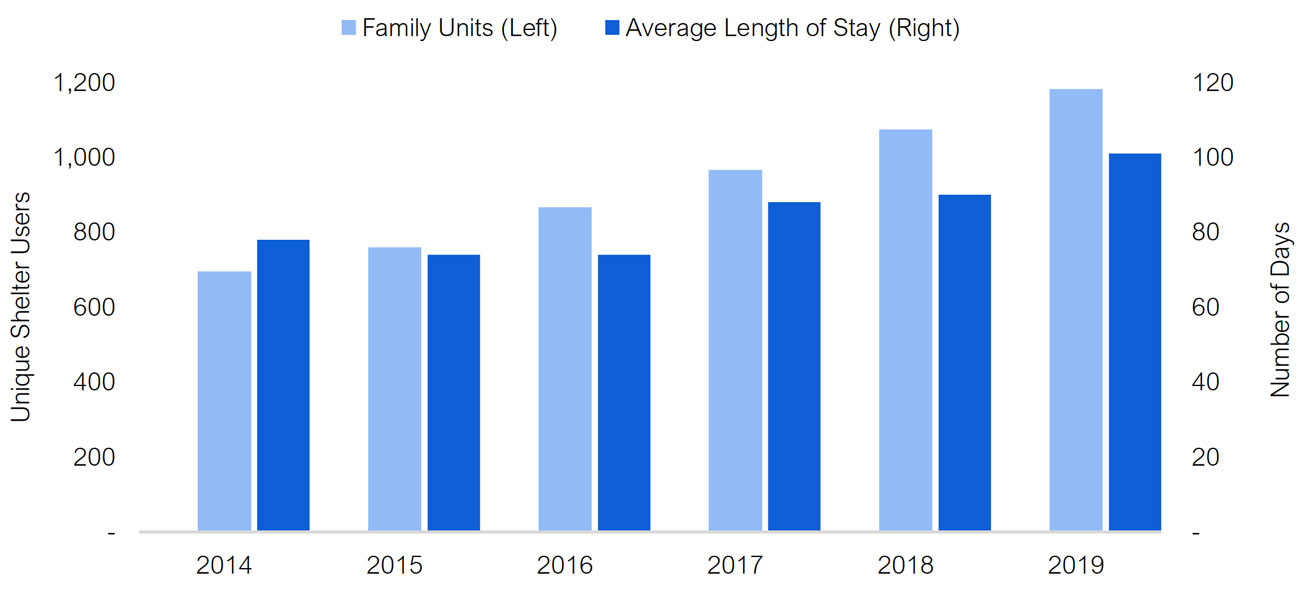
Source: Ottawa Community and Family Shelter Data 2014-2019.
Increases in the length of stay in shelters reflects households’ difficulty in acquiring housing. A lack of affordable housing is not the primary reason individuals become homeless in Ontario, [57] but it is the key barrier to exiting homelessness. Nearly all homeless individuals in Ontario report that they want housing and that the lack of affordable options and long social housing wait lists are the main reasons they cannot obtain and retain housing. [58]
Planned Provincial Homelessness Program Spending Growth is Slowing
Over the next three years, the FAO projects that the Province’s base homelessness programs spending will grow at an annual average rate of 3.4 per cent, increasing from $403 million in 2019-20 to $446 million in 2022-23. [59] This spending growth is significantly slower than the 8.0 per cent growth from 2013-14 to 2020-21 due to the expiry of the CHPI funding growth commitments made in the 2016 Long-Term Affordable Housing Strategy and Ontario’s 2014-2019 Poverty Reduction Strategy.
Figure 6-5 Projected base homelessness program spending, 2019-20 to 2022-23 ($ millions)
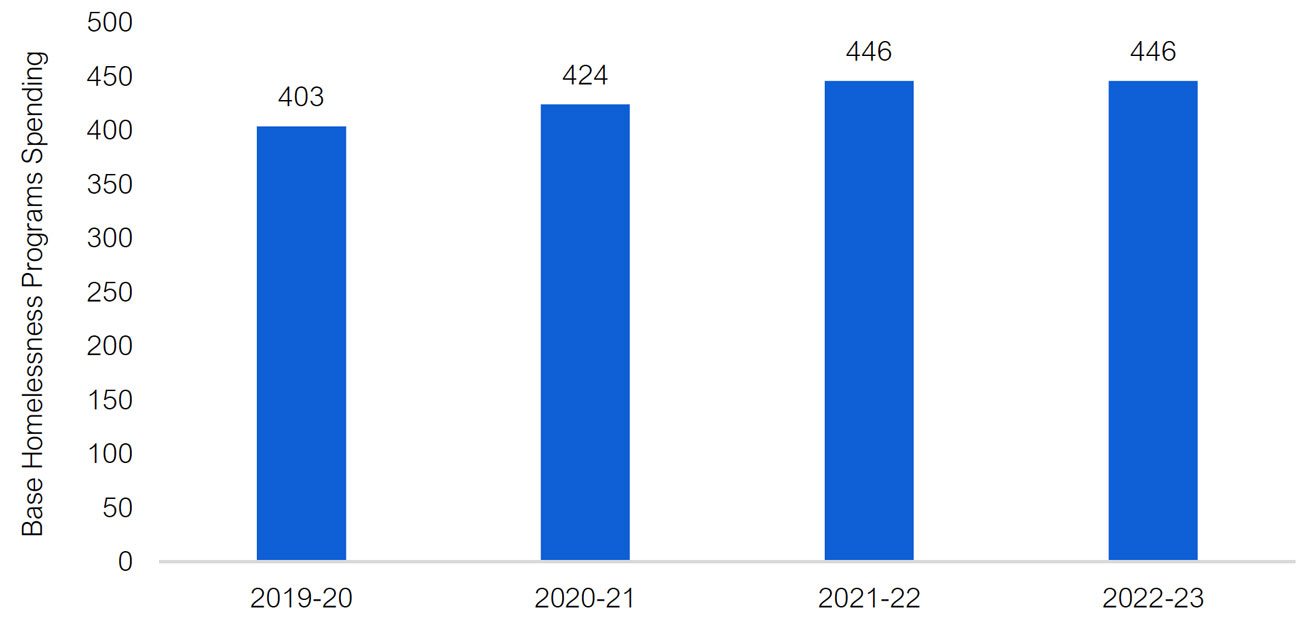
Note: Actual spending in 2019-20. Projected spending from 2020-21 to 2022-23.
Source: FAO analysis of information provided by MMAH and the 2020 Ontario Budget.
In December 2020, the Province released a new five-year poverty reduction strategy for 2020 to 2025. The 2020-2025 Poverty Reduction Strategy does not commit any additional homelessness program spending (beyond the 3.4 per cent average annual growth rate from 2019-20 to 2022-23 [60] ) or address the Province’s commitment to end chronic homelessness. However, the new poverty reduction strategy does note that increasing the supply of affordable housing under the NHS is a key measure to support people at risk of or experiencing homelessness. [61] The FAO reviews the potential impact of the NHS on chronic homelessness in the following sections.
Estimating the Impact of the National Housing Strategy
New Federal Support for Homelessness Programs
The NHS included a federal commitment to cut chronic homelessness in Canada in half by 2028 by increasing the supply of affordable housing and introducing a new federal homelessness program called Reaching Home. The Reaching Home program will fund transitional and supportive housing; homelessness prevention, which includes support for people at imminent risk of losing housing; and client support services, such as emergency shelters and employment assistance. [62]
The FAO estimates that the Reaching Home program will provide over $650 million of direct transfers to designated communities [63] in Ontario from 2019-20 to 2027-28. [64] Funding under the Reaching Home program will replace the Federal Homelessness Partnership Strategy and will increase federal homelessness support by approximately 62 per cent per year. [65] This funding does not affect provincial homelessness programs but will supplement provincial and municipal spending on homelessness programs in Ontario.
Importantly, the Reaching Home program also requires designated communities to develop coordinated access systems to help communities ensure that clients are getting the services they need and that communities will gather more comprehensive data on the homeless population. Communities that do not have an acceptable homelessness information management system in place will need to adopt the Homelessness Individuals and Families Information System (HIFIS) data collection tool developed by the federal government.
Impact of Housing Programs Spending
A key component in ending chronic homelessness is ensuring households experiencing or at risk of homelessness have access to affordable housing. Therefore, affordable housing, and support from the Province’s housing programs, are critical to the success of ending chronic homelessness in Ontario.
The FAO has identified two key indicators to measure the impact of the Province’s housing programs on homelessness in Ontario. The first indicator relates to the ability of individuals experiencing homelessness to exit homelessness through access to housing programs support. The Province’s homelessness programs for the most part provide temporary shelter. Therefore, households experiencing homelessness need to be able to access adequate housing, largely through the Province’s housing programs, to exit homelessness.
As noted in Chapter 3, from 2011 to 2018, the number of households that received provincial housing programs support decreased by 4.0 per cent. This contributed to an increase in the number of households in core housing need of 19 per cent and a 27 per cent increase in the wait list for social housing. Consequently, over the eight-year period to 2018, it became increasingly difficult for households experiencing homelessness to access housing programs support, limiting the ability of Ontario households to exit homelessness.
Looking forward, as outlined in Chapter 5, the FAO projects that the number of households in core housing need will increase from 735,000 households in 2018 to 815,500 households in 2027. This is due to the FAO’s expectation that population growth and higher housing costs will more than offset household income growth and the incremental support provided by provincial housing programs through the NHS. The projected growth in core housing need will lead to increased demand for housing programs support, leading to an even longer wait list by 2027. Therefore, the Province’s ability to reduce chronic homelessness by providing individuals experiencing homelessness with access to affordable housing through housing programs support will continue to be limited.
The FAO’s second indicator relates to housing need among households at risk of homelessness. This is measured by the number of households living in poverty that spend 50 per cent or more of their income on shelter costs. These ‘high housing need’ households are at an elevated risk of losing their housing and experiencing homelessness. [66] Changes in this population over time provide information on whether the Province’s housing programs are helping to lower the risk of households becoming homeless.
Overall, the FAO estimates the number of ‘high housing need’ households at risk of homelessness will decrease from 179,400 households in 2018 to 159,800 in 2025. The reduction in ‘high housing need’ households is primarily due to the new Canada-Ontario Housing Benefit (COHB) program under the NHS, which prioritizes higher need households. [67] Although support under the COHB program does not guarantee that a household will be removed from core housing need, it is sufficient to remove ‘high housing need’ households from risk of homelessness. In other words, ‘high housing need’ households that receive COHB program support will no longer spend over 50 per cent of their income on shelter costs and will no longer be at risk of homelessness due to unaffordable housing.
Figure 6-6 FAO estimate of ‘high housing need’ households at risk of homelessness, 2018 to 2025
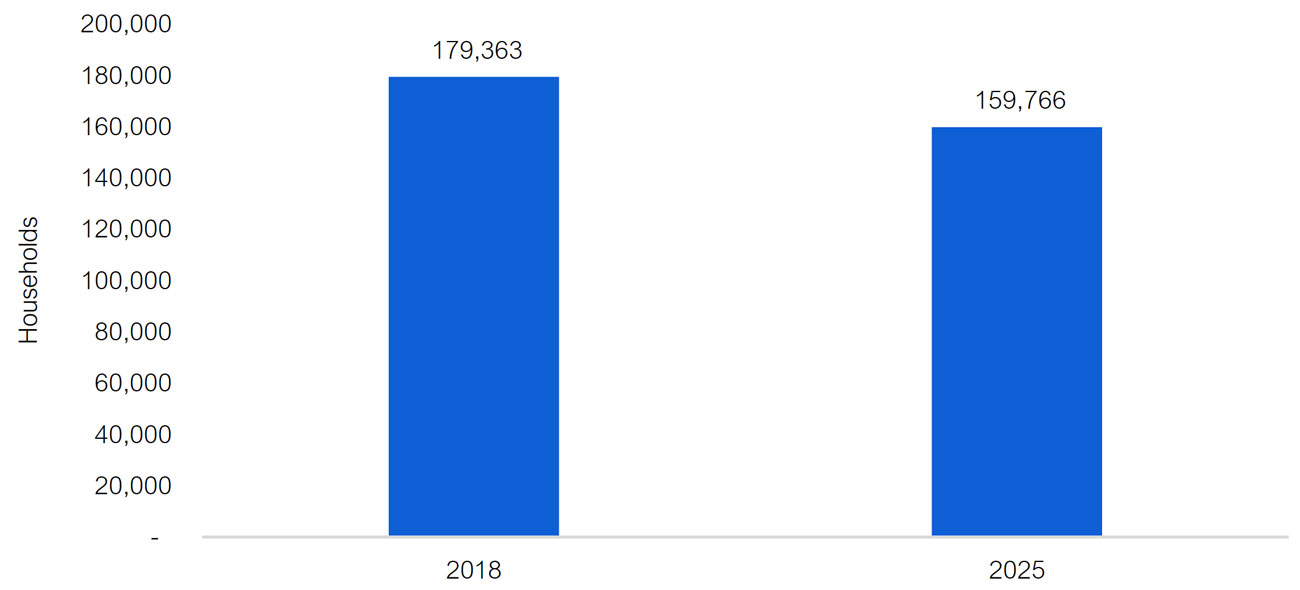
Note: ‘High housing need’ households have an after-tax income below the Low-Income Measure threshold, as defined by Statistics Canada, and spend 50 per cent or more of their gross income on shelter costs.
Source: FAO.
Conclusion
Based on available information and FAO analysis presented in this chapter, it is unlikely that the Province will achieve its goal of ending chronic homelessness in Ontario by 2025 without new policy measures.
As noted above, the goal of the Province’s homelessness and housing programs, as they relate to chronic homelessness, is to assist households that are homeless to find adequate and affordable housing, and to help households that are at risk of homelessness keep their housing. Importantly, although the Province has not yet established a province-wide baseline to measure changes in homelessness, reported increases in the use and average length of stay in shelters by households reflects the growing difficulty that homeless individuals and families face in acquiring adequate housing. Looking forward, the FAO projects slowing growth in provincial homelessness programs spending, an increase in demand for support from the Province’s housing programs and a longer social housing wait list by 2027. This indicates that households experiencing homelessness will face increased difficulty in accessing the necessary supports to exit homelessness through the Province’s housing and homelessness programs.
For households at risk of homelessness, the FAO projects that the number of households in ‘high housing need’ will decrease by approximately 19,600 households from 2018 to 2025, primarily due to the COHB program under the NHS, which prioritizes higher need households. However, by 2025, an estimated 159,800 households will still be at an elevated risk of losing their housing and experiencing homelessness.
7 | Appendices
A. Additional National Housing Strategy Analysis
This appendix provides additional information on each of the three new NHS programs.
Canada-Ontario Community Housing Initiative (COCHI)
The Canada-Ontario Community Housing Initiative (COCHI) is a new social housing program that will provide $1.8 billion of federal support to preserve the existing stock of social housing in Ontario, through operating subsidies and capital repairs, and fund the creation of new social housing units. The Province is required to cost-match the federal COCHI funding; however, existing municipal spending is considered sufficient to match the federal contributions. Therefore, the FAO projects that the COCHI component of the NHS will not result in new incremental provincial or municipal spending.
The cost of social housing is funded primarily by municipalities, [68] with the remainder largely funded by the federal government through payments under the Social Housing Agreement . Between 2004-05 and 2018-19, spending funded by federal social housing transfers decreased from $456 million to $356 million. Beginning in 2019-20, spending was scheduled to decline more rapidly, decreasing to $68 million by 2027-28.
COCHI effectively provides a top-up of federal funding to make up for the scheduled decline in federal support for social housing beginning in 2019-20. In total, COCHI will provide Ontario with $1.8 billion of federal funding from 2019-20 to 2027-28. The funding will increase over time in line with the decline in legacy funding under the Social Housing Agreement . Overall, the FAO estimates that social housing spending funded by federal transfers will increase from $363 million in 2019-20 to $434 million in 2027-28.
Figure 7-1 Estimated federal support for social housing in Ontario through expiring agreements and the new Canada-Ontario Community Housing Initiative (COCHI), 2019-20 to 2027-28 ($ millions)
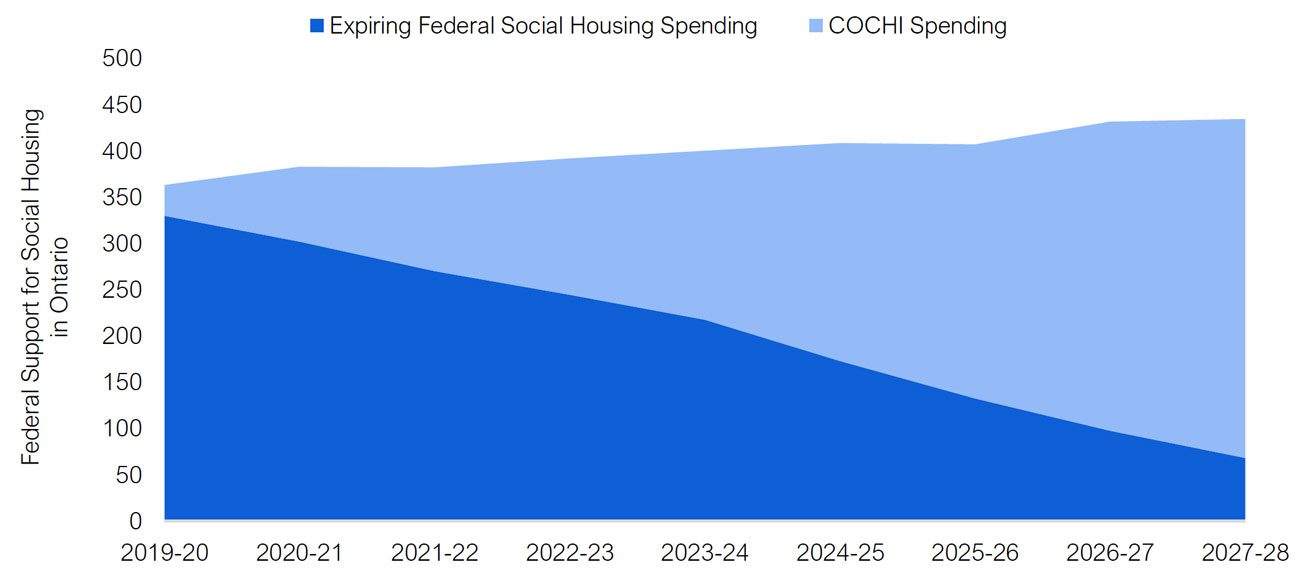
Source: FAO analysis of information provided by MMAH.
Ontario Priorities Housing Initiative (OPHI)
The Ontario Priorities Housing Initiative (OPHI) will provide funding for initiatives similar to the housing supports funded under the Investment in Affordable Housing program, which ended in 2019-20. OPHI will result in a total of $378 million of federal spending that must be matched by $378 million of provincial spending for a total of $756 million of combined spending.
OPHI will be used to fund four types of housing supports: capital funding for new rentals, homeownership assistance, rental and home repairs, and rent supplements. As well, OPHI will fund housing support services such as counselling and job placements.
Approximately 43 per cent of the OPHI spending commitment, or $323 million, will be spent by 2021-22. This includes $34.6 million of spending in 2018-19 that the Province was allowed to allocate to OPHI cost-matching under the NHS agreement. The annual allocation after 2021-22 of the remaining $433 million spending commitment will be determined through subsequent negotiations between the Province and federal government. For the purposes of this report, the FAO assumed federal OPHI spending would remain at 2021-22 levels with the Province cost-matching one year after until the remaining $433 million is spent.
Figure 7-2 Ontario Priorities Housing Initiative (OPHI) spending from 2018-19 to 2021-22 ($ millions)
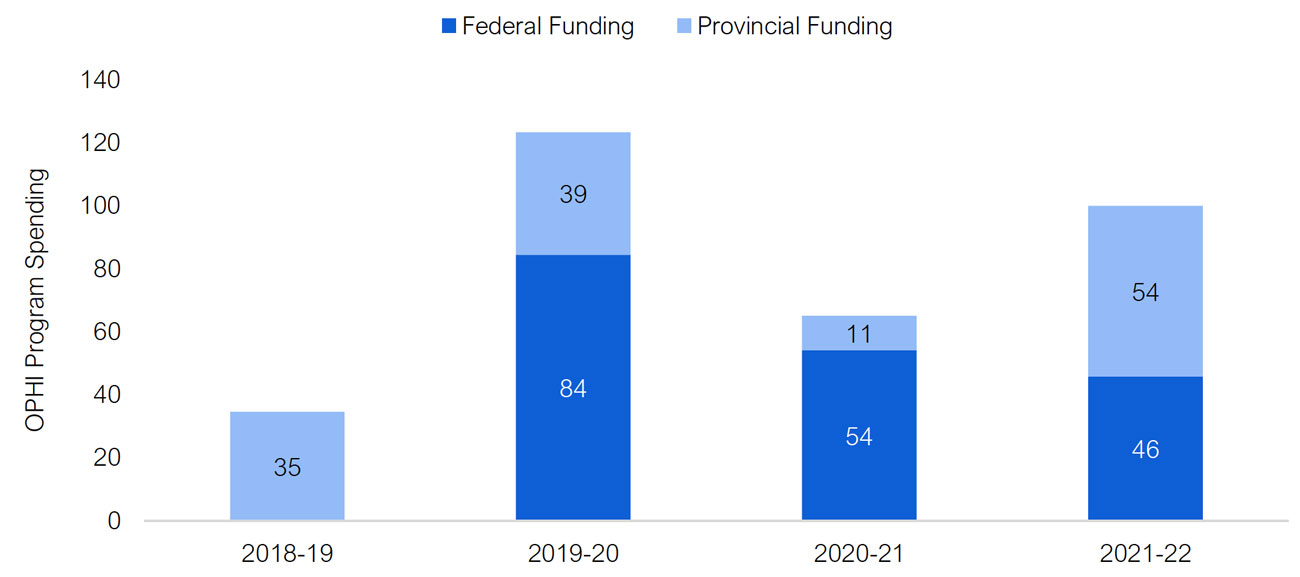
Note: Only accounts for $323 million of the $756 million OPHI spending commitment. The remaining $433 million will be allocated through subsequent federal-provincial negotiations. Under the NHS agreement, the Province was allowed to allocate $35 million of spending in 2018-19 to OPHI cost-matching.
Source: FAO analysis of information provided by MMAH.
Canada-Ontario Housing Benefit (COHB)
The Canada-Ontario Housing Benefit (COHB) is a new housing program that began in 2020-21. Under the COHB program, the Province and federal government must each cost-match $732 million for a total spending commitment of $1.5 billion by 2028-29. Note that the Province projects that it will spend $168 million of its COHB commitment in 2028-29, which is one year after the end of the NHS agreement.
Figure 7-3 Canada-Ontario Housing Benefit (COHB) spending from 2020-21 to 2028-29 ($ millions)
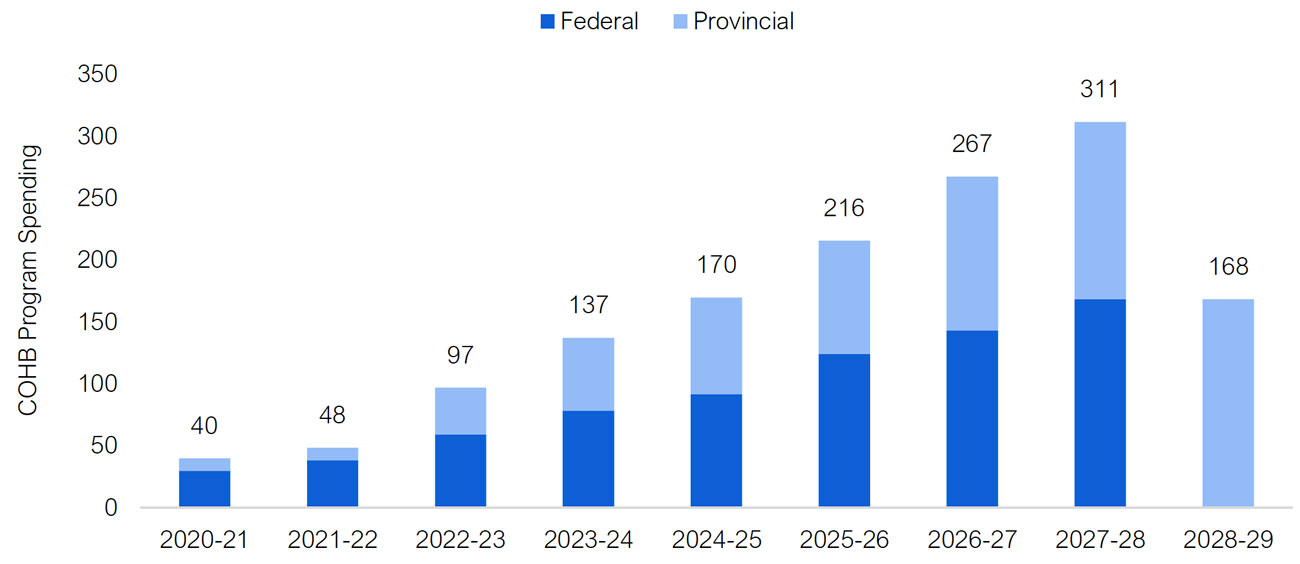
Note: The Province recorded $10 million of spending in 2019-20 for the Portable Housing Benefit-Special Priority Policy (PHB-SPP) program towards its COHB cost-matching commitment. Households receiving PHB-SPP benefits were transitioned to the COHB program beginning in 2020-21.
Source: FAO analysis of the CMHC-Ontario Bilateral Agreement under the 2017 National Housing Strategy.
B. Development of this Report
Authority
The Financial Accountability Officer accepted a request from a member of the Legislative Assembly to undertake the analysis presented in this report under paragraph 10(1)(b) of the Financial Accountability Officer Act, 2013 .
Key Questions
The following key questions were used as a guide while undertaking research for this report:
-
How has the Province’s housing program expense forecast changed from the 2018 Ontario Budget to the 2019 Ontario Budget?
- What program changes have been made to achieve the 2019 budget housing program expense forecast?
- Have the 2019 budget program changes affected funding from the federal government and municipalities?
- How will the investments under the National Housing Strategy be allocated in Ontario? How will the Province satisfy its requirement to match the Government of Canada’s contributions to 2028?
-
What are the Province’s relevant benchmarks and targets for ending homelessness, the supply of affordable housing, and wait times for affordable housing?
- How have the benchmarks and targets changed from the 2018 budget to the 2019 budget?
- Will the 2019 budget housing program expense forecast allow the Province to achieve its affordable housing benchmarks and targets?
- What is the status of the commitment in the Long-Term Affordable Housing Strategy to end chronic homelessness within 10 years?
Methodology
This report has been prepared with the benefit of information provided by, and meetings with staff from, the Ministry of Municipal Affairs and Housing and a review of relevant literature and other publicly available information. Specific sources are referenced throughout and additional information on sources and methodology is available on request.
To estimate core housing need, the FAO developed a model using household-level data. The FAO’s model is based on the CMHC’s core housing need model, which uses software and data from Statistics Canada’s Social Policy Simulation Database/Model (SPSD/M).
To forecast core housing need, the FAO’s model applies forecasts of household income, population growth by age and shelter costs to households and then determines if each household is in core housing need, based on the CMHC’s definition.
The projection for household income is based on the FAO’s 2021 Winter Economic and Budget Outlook, population growth is from Statistics Canada and the Ministry of Finance, and shelter costs is based on actual data for 2020 and the FAO’s analysis of housing market indicators. [69]
After projecting household characteristics to 2027, the FAO identifies households that meet the CMHC’s definition of core housing need. Specifically, households that:
- are living in unsuitable shelter; or
- are living in shelter in need of major repair; or
- spend more than 30 per cent of their income on the lesser of actual shelter costs or average market rent in their region.
Households in core housing need must also have household income below the Core Need Income Threshold (CNIT), to ensure that households with sufficiently high incomes are not considered to be in core housing need. [70] Households must also be private, non-farm, non-reserve, non-student households with income that is greater than zero and that exceeds shelter costs.
All dollar amounts are in Canadian, current dollars (i.e., not adjusted for inflation) unless otherwise noted.
Graphic Descriptions
Figure 2-1
Back to image
Region
% of households in core housing need
New Brunswick
7.3
Quebec
7.5
Newfoundland
8.4
Prince Edward Island
8.6
Alberta
10.8
Nova Scotia
11.4
Canada
11.6
Manitoba
11.7
Saskatchewan
11.7
Ontario
13.9
British Columbia
14.6
Figure 2-2
Back to image
Program Category
Spending ($ millions)
Housing Programs
661
Homelessness Programs
403
Figure 3-1
Year
Base Program Spending
Time-limited/Cancelled Program Spending
Total Spending
2013-14
714
0
714
2014-15
699
0
699
2015-16
709
0
709
2016-17
687
471
1,158
2017-18
651
361
1,012
2018-19
620
81
701
Figure 3-2
Back to image
Source of Funding
Spending ($ millions)
Share of Spending
Federal Funding
3,341
67%
Direct Provincial Spending
1,653
33%
Figure 3-3
Support Type
Households Supported
RGI
189,025
Below-Market Rent Unit
93,647
Rent Supplement
7,196
Homeownership Assistance
7,326
Housing Programs Total
297,124
Figure 3-4
Back to image
Year
RGI Units
Below-Market Rent Units
Rent Supplement
Homeownership Assistance
Total
2005-06
210,596
65,801
641
382
277,420
2006-07
205,043
70,762
3,203
511
279,519
2007-08
206,795
72,068
25,807
804
305,474
2008-09
205,383
73,066
19,472
2,730
300,652
2009-10
206,837
75,529
14,140
3,456
299,962
2010-11
205,887
79,555
19,566
4,430
309,438
2011-12
204,676
83,975
16,271
4,544
309,465
2012-13
203,102
86,850
16,824
4,904
311,680
2013-14
202,016
89,747
4,846
5,263
301,871
2014-15
200,843
90,830
3,806
5,634
301,113
2015-16
201,526
90,266
3,812
6,012
301,616
2016-17
196,295
94,000
5,578
6,631
302,504
2017-18
195,359
93,625
9,448
6,989
305,422
2018-19
189,025
93,647
7,196
7,326
297,194
Figure 3-5
Back to image
Year
Households Supported by Social Housing Units
2005-06
272,033
2006-07
271,046
2007-08
270,733
2008-09
269,239
2009-10
268,954
2010-11
268,886
2011-12
268,740
2012-13
268,611
2013-14
267,440
2014-15
266,151
2015-16
265,235
2016-17
261,225
2017-18
257,624
2018-19
250,288
Figure 3-6
Back to image
Average Annual Level of Support ($)
Type of Support
RGI Units
6,283
Below-Market Rent Units
3,814
Rent Supplements
4,519
Core Housing Needs Affordability Gap
3,964
Figure 3-7
Back to image
Household Type
% Change
Households in Core Housing Need
19.1%
Households Receiving Support
-4.0%
Figure 3-8
Back to image
Year
Number of Households on Waitlist
2011
169,717
2012
174,642
2013
180,405
2014
181,429
2015
184,457
2016
185,179
2017
196,920
2018
214,952
Figure 4-1
Back to image
Year
Federal Social Housing
Investment in Affordable Housing
Social Infrastructure Fund
Other Spending
2018-19
356
160
81
104
2019-20
330
79
–
96
2020-21
302
–
–
74
2021-22
270
–
–
67
2021-22
270
–
–
67
2022-23
245
–
–
61
2023-24
218
–
–
59
2024-25
173
–
–
57
2025-26
132
–
–
56
2026-27
98
–
–
54
2027-28
68
–
–
53
Figure 4-2
Back to image
Year
COCHI
OPHI
COHB
Total
2019-20
33
123
0
156
2020-21
81
65
40
186
2021-22
112
100
48
260
2022-23
147
91
97
335
2023-24
182
91
137
411
2024-25
235
91
170
496
2025-26
275
91
216
581
2026-27
334
57
267
658
2027-28
366
12
311
689
Figure 5-1
Back to image
Year
Existing Housing Funding
NHS Housing Funding
Total
2014-15
699
–
699
2015-16
709
–
709
2016-17
1,158
–
1,158
2017-18
1,012
–
1,012
2018-19
701
–
701
2019-20
505
156
661
2020-21
376
186
562
2021-22
337
260
598
2022-23
305
335
641
2023-24
277
411
687
2024-25
230
496
727
2025-26
188
581
770
2026-27
152
658
810
2027-28
121
689
811
Figure 5-2
Back to image
Year
RGI Units
Below-Market Rent Units
Rent Supplement
Homeownership Assistance
Total
2018-19
189,025
93,647
7,196
7,326
297,194
2019-20
185,329
95,825
12,410
7,655
301,219
2020-21
185,215
96,474
10,089
7,711
299,488
2021-22
185,103
97,470
12,405
7,796
302,774
2022-23
186,874
98,346
22,150
7,874
315,244
2023-24
189,095
98,964
28,454
7,952
324,465
2023-24
189,095
98,964
28,454
7,952
324,465
2024-25
191,995
98,371
33,206
8,030
331,602
2025-26
195,399
96,121
40,081
7,726
339,328
2026-27
199,561
91,522
47,093
7,646
345,821
2027-28
204,138
88,636
52,374
7,363
352,510
Figure 5-3
Back to image
Category of Housing Support
Number of Household Projected to Receive Support
Housing Support from Legacy Programs
147,167
Preserved Housing Support under NHS
150,027
New Housing Support under NHS
55,317
Figure 5-4
Back to image
Year
Number of Households in Core Housing Need
Share of Households in Core Housing Need
2018
735,000
13.9%
2027
815,517
13.9%
Figure 5-5
Back to image
Category
Number of Households
Not Removed (rent supplements)
28,216
Removed (RGI)
15,113
Removed (rent supplements)
11,988
Figure 6-1
Back to image
Type of Support
Provincial Programs
Emergency Shelter
Community Homelessness Prevention Initiative
Transitional Housing
Community Homelessness Prevention Initiative
Supportive Housing
Community Homelessness Prevention Initiative
Home for Good
Indigenous Supportive Housing Program
Rent-Geared-To-Income
Canada-Ontario Community Housing Initiative
Social Housing
Below-Market Rent Units/ Rent Supplements
Ontario Priorities Housing Initiative
Canada-Ontario Housing Benefit
Social Housing
Homeownership with Assistance
Ontario Priorities Housing Initiative
Figure 6-2
Back to image
Year
Base Program Spending
COVID-19 Spending
2013-14
247
–
2014-15
294
–
2015-16
294
–
2016-17
299
–
2017-18
328
–
2018-19
397
–
2019-20
403
–
2020-21
424
566
Figure 6-3
Back to image
Year
Experiencing Homelessness
At Risk of Homelessness
Home for Good
2014-15
30,555
104,474
0
2015-16
39,613
115,598
0
2016-17
32,300
125,500
327
2017-18
33,425
117,875
2,098
2018-19
29,333
156,414
6,309
Figure 6-4
Back to image
Year
Average Length of Stay (Days)
Family Units
2014
78
695
2015
74
760
2016
74
867
2017
88
966
2018
90
1,074
2019
101
1,182
Figure 6-5
Back to image
Year
Base Homelessness Programs Spending
2019-20
403
2020-21
424
2021-22
446
2022-23
446
Figure 6-6
Back to image
Year
Number of Households at Risk
2018
179,363
2025
159,766
Figure 7-1
Back to image
Year
COCHI Spending
Expiring Federal Social Housing Spending
2019-20
33
330
2020-21
81
302
2021-22
112
270
2022-23
147
245
2023-24
182
218
2024-25
235
173
2025-26
275
132
2026-27
334
98
2027-28
366
68
Figure 7-2
Back to image
Year
Federal Funding
Provincial Funding
2018-19
0
35
2019-20
84
39
2020-21
54
11
2021-22
46
54
Year
Federal
Provincial
Total
2020-21
30
10
40
2021-22
38
10
48
2022-23
59
38
97
2023-24
78
59
137
2024-25
92
78
170
2025-26
124
92
216
2026-27
143
124
267
2027-28
168
143
311
2028-29
0
168
168
Footnotes
[1]
Core housing need is an indicator developed by the Canada Mortgage and Housing Corporation (CMHC) to identify households that need housing-related financial assistance. A household is in core housing need if it does not live in acceptable housing and its before-tax income is not sufficient to access acceptable housing. Housing is considered acceptable when the total cost of housing is equal to or less than 30 per cent of a household’s before-tax income, there are enough bedrooms to accommodate the size of the household and the housing is not in need of major repairs. In 2018, 13.9 per cent of households in Ontario were in core housing need, which was higher than the Canadian average of 11.6 per cent and was the second highest rate among all provinces.
[2]
Chronic homelessness refers to people who are currently homeless and have been homeless for six months or more in the past year. In 2018, Ontario municipalities reported that there were over 16,000 Ontarians experiencing homelessness on any given night.
[3]
Municipalities also spend approximately $1 billion each year in connection with the Province’s housing programs. Unlike the federal government’s contribution, municipal spending is not recorded as spending by the Province.
[4]
The Province’s social housing wait list represents a compilation of data received from municipal service managers. It may include double counting of individuals on multiple local wait lists.
[5]
The three new programs are the Canada-Ontario Community Housing Initiative (COCHI), the Ontario Priorities Housing Initiative (OPHI) and the Canada-Ontario Housing Benefit (COHB).
[6]
The estimate of $4.0 billion includes $35 million of provincial spending in 2018-19 that has been allocated towards the NHS spending commitment and $168 million for the COHB program that the Province will spend in 2028-29.
[7]
This consists of an increase of 45,200 households supported by rent supplements and 15,100 additional RGI units, as well as a loss of 5,000 below-market rent housing units.
[8]
After accounting for population growth, the share of the Province’s households in core housing need will remain unchanged in 2027, compared to 2018, at 13.9 per cent.
[9]
Vulnerable populations include survivors of domestic violence and human trafficking, people experiencing or at risk of experiencing homelessness, Indigenous people, and people with disabilities.
[10]
Based on data from a number of communities in Ontario that conducted homelessness enumerations in 2018.
[11]
Although the commitment to end chronic homelessness by 2025 was made by the previous government, the Ministry of Municipal Affairs and Housing confirmed with the FAO that the commitment to end chronic homelessness by the end of 2025 remains government policy.
[12]
Nearly all homeless individuals in Ontario report that the lack of affordable housing options and long social housing wait lists are the main reasons they cannot obtain and retain housing.
[13]
Excludes temporary COVID-19-related spending in 2020-21.
[14]
Excludes temporary COVID-19 relief funding in 2020-21.
[15]
Although support under the COHB program does not guarantee that a household will be removed from core housing need, it is sufficient to remove ‘high housing need’ households from risk of homelessness.
[16]
National Housing Strategy Act,
S.C. 2019, c. 29, s. 313.
[17]
Statistics Canada, “Census of Canada,” 2011.
[18]
Statistics Canada, “Canada Housing Survey,” 2018.
[19]
Between 2011 and 2018, the average residential home resale price in Ontario increased by 68 per cent and the average market rent increased by 29 per cent, while median personal income increased by 24 per cent.
[20]
Statistics Canada, “Canada Housing Survey,” 2018. In 2011, the rate of core housing need in Ontario was 13.4 per cent and the Canadian average was 12.5 per cent. Statistics Canada, “Census of Canada,” 2011.
[21]
https://www.ontario.ca/document/community-housing-renewal-ontarios-action-plan-under-national-housing-strategy/housing-needs-ontario
.
[22]
In this report, high need households have after-tax income that is below the Low-Income Measure threshold, as defined by Statistics Canada, and spend 50 per cent or more of their gross income on the cost of shelter.
[23]
2018 point in time homelessness count from the municipalities of York, Toronto, Peel, Durham, Ottawa, Niagara, Thunder Bay, Waterloo, Peterborough, Sudbury, Nipissing, Kingston, Halton, Guelph, Brantford and Belleville.
[24]
See Chapter 6 for analysis.
[25]
Ibid
.
[26]
Municipalities in this report refers to municipal service managers and Indigenous Program Administrators.
[28]
The estimated municipal contribution reflects reported municipal spending on provincial housing programs. See FAO, “Ontario Municipal Finances: An Overview of Municipal Budgets and an Estimate of the Financial Impact of the COVID-19 Pandemic,” 2020 for more information on municipal spending on housing and other programs.
[29]
Social housing providers also offer some below-market rent units and rent supplements.
[30]
For the purposes of this report, the term “rent supplements” refers to both rent supplements, which are rent subsidies paid to landlords, and housing allowances, which are rent subsidies paid to households.
[31]
Under affordable housing programs, rent supplements may be tied to a household’s income. However, rent supplements do not limit a household’s rent or guarantee a household is spending less than 30 per cent of its gross income on shelter costs.
[32]
The
Housing Services Act, 2011
sets income limits that apply to most social housing programs and some affordable housing programs. However, municipal service managers have the authority to set higher income limits than prescribed in the Act and regulations. See O. Reg. 370/11 for household size and income limits by municipality,
https://www.ontario.ca/laws/regulation/110370
.
[33]
Excludes home repair programs that provided repair assistance to an additional 8,500 homeowner households in 2018-19.
[34]
Municipal service managers are required under the
Housing Services Act, 2011
to provide 186,717 households with RGI assistance.
[35]
Auditor General of Ontario, “
Social and Affordable Housing
,” 2017.
[36]
The below-market rent unit and rent supplement subsidies represent the average difference between market rent and rent paid by a recipient household. The RGI unit subsidy represents the average difference between costs associated with operating and maintaining a social housing building and rent paid by a recipient household.
[37]
Based on the FAO’s review of Statistics Canada, “Canada Housing Survey,” 2018.
[38]
Between 2011 and 2018, the average residential home resale price in Ontario increased by 68 per cent and the average market rent increased by 29 per cent, while median personal income increased by 24 per cent. Ontario’s population also increased by 8 per cent.
[39]
The
Housing Services Act, 2011
requires municipal service managers to have a centralized wait list that is used to select eligible households for rent-geared-to-income assistance. The Province’s social housing wait list represents a compilation of data received from municipal service managers. It may include double counting of individuals on multiple local wait lists.
[40]
According to the City of Toronto, the current
wait time for a one-bedroom unit in Toronto is 12 years
.
[41]
See Appendix A for more information on the three new programs. In addition to the three federal-provincial funded components of the NHS, there are other federal initiatives that will affect the supply of affordable housing in Ontario. These programs are administered by the CMHC and do not affect the Province’s housing programs; therefore, detailed analysis of these components is outside the scope of this report. These programs include the National Housing Co-investment Fund, the Rapid Housing Initiative, the Rental Construction Financing Initiative and the Federal Lands Initiative.
[42]
The estimate of $4.0 billion includes $35 million of provincial spending in 2018-19 that has been allocated towards the NHS spending commitment and $168 million for the COHB program that the Province will spend in 2028-29.
[43]
See Government of Ontario, “
Community Housing Renewal: Ontario’s Action Plan Under the National Housing Strategy
.” Note that the Province projects that 215,632 households will receive support from NHS programs by 2027-28. However, the FAO excludes 6,584 households that will not receive direct housing support in 2027-28, including 3,248 households receiving housing support services (e.g., counselling and job placements) and 3,336 households that received one-year affordability assistance in 2019-20.
[44]
See Appendix A for more information on the timing of funding under the three NHS programs.
[45]
The FAO projects that the cost of housing will grow by 1.9 per cent annually on average from 2018 to 2027, which is higher than expected average annual per capita household income growth of 1.7 per cent. The FAO projects the number of households in Ontario to increase at an average annual rate of 1.1 per cent.
[46]
Vulnerable populations include survivors of domestic violence and human trafficking, people experiencing or at risk of experiencing homelessness, Indigenous people, and people with disabilities.
[47]
Ministry of Municipal Affairs and Housing, “Ontario’s Long-Term Affordable Housing Strategy,” 2016. The ministry confirmed with the FAO that the commitment to end chronic homelessness by the end of 2025 remains government policy.
[48]
Auditor General of Ontario, “
Social and Affordable Housing
,” 2017.
[49]
Ministry of Municipal Affairs and Housing, “Ontario’s Long-Term Affordable Housing Strategy,” 2016.
[50]
The Province also offers social assistance programs including Ontario Works, the Ontario Disability Support Program and the Low-Income Energy Assistance Program that provide financial support including shelter allowances and energy arrears. Those programs are not administered by MMAH and are outside the scope of this report.
[51]
The $566 million of COVID-19-related spending includes $234 million in federal funds. Of the $566 million in COVID-19-related spending, $498 million is part of the government’s Social Services Relief Fund, $26 million is for temporary pandemic pay and $42 million is for COVID-19 isolation centres.
[52]
The commitment to end chronic homelessness formed a central piece of the Province’s five-year poverty reduction strategy that was in place from 2014 to 2019, as well as the 2016 Long-Term Affordable Housing Strategy. This included a commitment to increase CHPI funding to $339 million by 2019-20 and create the HFG program. In December 2020, the Province released a new five-year (2020 to 2025) poverty reduction strategy; however, the new strategy does not address the commitment to end chronic homelessness.
[53]
See indicator 11 of the Ontario Poverty Reduction Strategy 2019 Annual Report,
https://www.ontario.ca/page/poverty-reduction-strategy-2019-annual-report#section-3
. The Province has committed to introduce a “by name list” approach to homelessness enumeration beginning in 2021.
[54]
2018 point in time homelessness count from the municipalities of York, Toronto, Peel, Durham, Ottawa, Niagara, Thunder Bay, Waterloo, Peterborough, Sudbury, Nipissing, Kingston, Halton, Guelph, Brantford and Belleville.
[55]
This includes emergency shelters, transitional housing and violence against women shelters,
https://www150.statcan.gc.ca/t1/tbl1/en/cv.action?pid=1410035301
.
[56]
City of Toronto
daily and overnight shelter usage
and 2018 Street Needs Assessment.
[57]
According to data from municipal point in time homelessness counts, the most common causes of homelessness in Ontario are family conflict and addiction.
[58]
From 2018 point in time homelessness counts from the municipalities of York, Toronto, Peel, Durham, Ottawa, Niagara, Thunder Bay, Waterloo, Peterborough, Sudbury, Nipissing, Kingston, Halton, Guelph, Brantford and Belleville.
[59]
The spending projections exclude spending related to the COVID-19 pandemic in 2020-21.
[60]
Excludes temporary COVID-19 relief funding in 2020-21.
[61]
See Appendix 1 and 2 of
Building a Strong Foundation for Success: Reducing Poverty in Ontario (2020-2025)
.
[62]
Reaching Home: Canada’s Homelessness Strategy Directives.
[63]
A list of the 26 designated communities in Ontario can be found on the Employment and Social Development Canada website at
https://www.canada.ca/en/employment-social-development/programs/homelessness/find-community/on.html
.
[64]
To date, communities in Ontario have been allocated a total of $382 million, which includes $331 million of funding to support the program objectives from April 1, 2019 to March 31, 2024 and $51 million of additional funding to provide support during the COVID-19 pandemic. The FAO expects that the remaining funding will be allocated in future years.
[65]
Parliamentary Budget Office, “
Federal Spending on Housing Affordability
,” 2019.
[66]
‘High housing need’ households spend 50 per cent or more of their gross income on shelter costs and have an after-tax income below the Low-Income Measure threshold, as defined by Statistics Canada. ‘High housing need’ households are a subset of core housing need households.
[67]
See Chapter 5 for more information.
[68]
In 2018-19, municipalities funded approximately 73 per cent of the cost of social housing.
[69]
The FAO projects shelter costs for 2020 using data for the rent component of the Consumer Price Index as well as CMHC mortgage obligation data. The FAO forecasts shelter costs to 2027 using projections from its 2021 Winter Economic and Budget Outlook for personal disposable income, population growth, mortgage rates and housing market indicators.
[70]
The Core Need Income Threshold is a measure developed by the CMHC, which reflects the maximum income level at which a household would have difficulty finding suitable affordable housing in its community.
| Region | % of households in core housing need |
| New Brunswick | 7.3 |
| Quebec | 7.5 |
| Newfoundland | 8.4 |
| Prince Edward Island | 8.6 |
| Alberta | 10.8 |
| Nova Scotia | 11.4 |
| Canada | 11.6 |
| Manitoba | 11.7 |
| Saskatchewan | 11.7 |
| Ontario | 13.9 |
| British Columbia | 14.6 |
| Program Category | Spending ($ millions) |
| Housing Programs | 661 |
| Homelessness Programs | 403 |
| Year | Base Program Spending | Time-limited/Cancelled Program Spending | Total Spending |
| 2013-14 | 714 | 0 | 714 |
| 2014-15 | 699 | 0 | 699 |
| 2015-16 | 709 | 0 | 709 |
| 2016-17 | 687 | 471 | 1,158 |
| 2017-18 | 651 | 361 | 1,012 |
| 2018-19 | 620 | 81 | 701 |
| Source of Funding | Spending ($ millions) | Share of Spending |
| Federal Funding | 3,341 | 67% |
| Direct Provincial Spending | 1,653 | 33% |
| Support Type | Households Supported |
| RGI | 189,025 |
| Below-Market Rent Unit | 93,647 |
| Rent Supplement | 7,196 |
| Homeownership Assistance | 7,326 |
| Housing Programs Total | 297,124 |
|---|
| Year | RGI Units | Below-Market Rent Units | Rent Supplement | Homeownership Assistance | Total |
| 2005-06 | 210,596 | 65,801 | 641 | 382 | 277,420 |
| 2006-07 | 205,043 | 70,762 | 3,203 | 511 | 279,519 |
| 2007-08 | 206,795 | 72,068 | 25,807 | 804 | 305,474 |
| 2008-09 | 205,383 | 73,066 | 19,472 | 2,730 | 300,652 |
| 2009-10 | 206,837 | 75,529 | 14,140 | 3,456 | 299,962 |
| 2010-11 | 205,887 | 79,555 | 19,566 | 4,430 | 309,438 |
| 2011-12 | 204,676 | 83,975 | 16,271 | 4,544 | 309,465 |
| 2012-13 | 203,102 | 86,850 | 16,824 | 4,904 | 311,680 |
| 2013-14 | 202,016 | 89,747 | 4,846 | 5,263 | 301,871 |
| 2014-15 | 200,843 | 90,830 | 3,806 | 5,634 | 301,113 |
| 2015-16 | 201,526 | 90,266 | 3,812 | 6,012 | 301,616 |
| 2016-17 | 196,295 | 94,000 | 5,578 | 6,631 | 302,504 |
| 2017-18 | 195,359 | 93,625 | 9,448 | 6,989 | 305,422 |
| 2018-19 | 189,025 | 93,647 | 7,196 | 7,326 | 297,194 |
| Year | Households Supported by Social Housing Units |
| 2005-06 | 272,033 |
| 2006-07 | 271,046 |
| 2007-08 | 270,733 |
| 2008-09 | 269,239 |
| 2009-10 | 268,954 |
| 2010-11 | 268,886 |
| 2011-12 | 268,740 |
| 2012-13 | 268,611 |
| 2013-14 | 267,440 |
| 2014-15 | 266,151 |
| 2015-16 | 265,235 |
| 2016-17 | 261,225 |
| 2017-18 | 257,624 |
| 2018-19 | 250,288 |
| Average Annual Level of Support ($) | ||
| Type of Support | ||
| RGI Units | 6,283 | |
| Below-Market Rent Units | 3,814 | |
| Rent Supplements | 4,519 | |
| Core Housing Needs Affordability Gap | 3,964 | |
| Household Type | % Change |
| Households in Core Housing Need | 19.1% |
| Households Receiving Support | -4.0% |
| Year | Number of Households on Waitlist |
| 2011 | 169,717 |
| 2012 | 174,642 |
| 2013 | 180,405 |
| 2014 | 181,429 |
| 2015 | 184,457 |
| 2016 | 185,179 |
| 2017 | 196,920 |
| 2018 | 214,952 |
| Year | Federal Social Housing | Investment in Affordable Housing | Social Infrastructure Fund | Other Spending |
| 2018-19 | 356 | 160 | 81 | 104 |
| 2019-20 | 330 | 79 | – | 96 |
| 2020-21 | 302 | – | – | 74 |
| 2021-22 | 270 | – | – | 67 |
| 2021-22 | 270 | – | – | 67 |
| 2022-23 | 245 | – | – | 61 |
| 2023-24 | 218 | – | – | 59 |
| 2024-25 | 173 | – | – | 57 |
| 2025-26 | 132 | – | – | 56 |
| 2026-27 | 98 | – | – | 54 |
| 2027-28 | 68 | – | – | 53 |
| Year | COCHI | OPHI | COHB | Total |
| 2019-20 | 33 | 123 | 0 | 156 |
| 2020-21 | 81 | 65 | 40 | 186 |
| 2021-22 | 112 | 100 | 48 | 260 |
| 2022-23 | 147 | 91 | 97 | 335 |
| 2023-24 | 182 | 91 | 137 | 411 |
| 2024-25 | 235 | 91 | 170 | 496 |
| 2025-26 | 275 | 91 | 216 | 581 |
| 2026-27 | 334 | 57 | 267 | 658 |
| 2027-28 | 366 | 12 | 311 | 689 |
| Year | Existing Housing Funding | NHS Housing Funding | Total |
| 2014-15 | 699 | – | 699 |
| 2015-16 | 709 | – | 709 |
| 2016-17 | 1,158 | – | 1,158 |
| 2017-18 | 1,012 | – | 1,012 |
| 2018-19 | 701 | – | 701 |
| 2019-20 | 505 | 156 | 661 |
| 2020-21 | 376 | 186 | 562 |
| 2021-22 | 337 | 260 | 598 |
| 2022-23 | 305 | 335 | 641 |
| 2023-24 | 277 | 411 | 687 |
| 2024-25 | 230 | 496 | 727 |
| 2025-26 | 188 | 581 | 770 |
| 2026-27 | 152 | 658 | 810 |
| 2027-28 | 121 | 689 | 811 |
| Year | RGI Units | Below-Market Rent Units | Rent Supplement | Homeownership Assistance | Total |
| 2018-19 | 189,025 | 93,647 | 7,196 | 7,326 | 297,194 |
| 2019-20 | 185,329 | 95,825 | 12,410 | 7,655 | 301,219 |
| 2020-21 | 185,215 | 96,474 | 10,089 | 7,711 | 299,488 |
| 2021-22 | 185,103 | 97,470 | 12,405 | 7,796 | 302,774 |
| 2022-23 | 186,874 | 98,346 | 22,150 | 7,874 | 315,244 |
| 2023-24 | 189,095 | 98,964 | 28,454 | 7,952 | 324,465 |
| 2023-24 | 189,095 | 98,964 | 28,454 | 7,952 | 324,465 |
| 2024-25 | 191,995 | 98,371 | 33,206 | 8,030 | 331,602 |
| 2025-26 | 195,399 | 96,121 | 40,081 | 7,726 | 339,328 |
| 2026-27 | 199,561 | 91,522 | 47,093 | 7,646 | 345,821 |
| 2027-28 | 204,138 | 88,636 | 52,374 | 7,363 | 352,510 |
| Category of Housing Support | Number of Household Projected to Receive Support |
| Housing Support from Legacy Programs | 147,167 |
| Preserved Housing Support under NHS | 150,027 |
| New Housing Support under NHS | 55,317 |
| Year | Number of Households in Core Housing Need | Share of Households in Core Housing Need |
| 2018 | 735,000 | 13.9% |
| 2027 | 815,517 | 13.9% |
| Category | Number of Households |
| Not Removed (rent supplements) | 28,216 |
| Removed (RGI) | 15,113 |
| Removed (rent supplements) | 11,988 |
| Type of Support | Provincial Programs |
| Emergency Shelter | Community Homelessness Prevention Initiative |
| Transitional Housing | Community Homelessness Prevention Initiative |
| Supportive Housing | Community Homelessness Prevention Initiative
Home for Good Indigenous Supportive Housing Program |
| Rent-Geared-To-Income | Canada-Ontario Community Housing Initiative
Social Housing |
| Below-Market Rent Units/ Rent Supplements | Ontario Priorities Housing Initiative
Canada-Ontario Housing Benefit Social Housing |
| Homeownership with Assistance | Ontario Priorities Housing Initiative |
| Year | Base Program Spending | COVID-19 Spending |
| 2013-14 | 247 | – |
| 2014-15 | 294 | – |
| 2015-16 | 294 | – |
| 2016-17 | 299 | – |
| 2017-18 | 328 | – |
| 2018-19 | 397 | – |
| 2019-20 | 403 | – |
| 2020-21 | 424 | 566 |
| Year | Experiencing Homelessness | At Risk of Homelessness | Home for Good |
| 2014-15 | 30,555 | 104,474 | 0 |
| 2015-16 | 39,613 | 115,598 | 0 |
| 2016-17 | 32,300 | 125,500 | 327 |
| 2017-18 | 33,425 | 117,875 | 2,098 |
| 2018-19 | 29,333 | 156,414 | 6,309 |
| Year | Average Length of Stay (Days) | Family Units |
| 2014 | 78 | 695 |
| 2015 | 74 | 760 |
| 2016 | 74 | 867 |
| 2017 | 88 | 966 |
| 2018 | 90 | 1,074 |
| 2019 | 101 | 1,182 |
| Year | Base Homelessness Programs Spending |
| 2019-20 | 403 |
| 2020-21 | 424 |
| 2021-22 | 446 |
| 2022-23 | 446 |
| Year | Number of Households at Risk |
| 2018 | 179,363 |
| 2025 | 159,766 |
| Year | COCHI Spending | Expiring Federal Social Housing Spending |
| 2019-20 | 33 | 330 |
| 2020-21 | 81 | 302 |
| 2021-22 | 112 | 270 |
| 2022-23 | 147 | 245 |
| 2023-24 | 182 | 218 |
| 2024-25 | 235 | 173 |
| 2025-26 | 275 | 132 |
| 2026-27 | 334 | 98 |
| 2027-28 | 366 | 68 |
| Year | Federal Funding | Provincial Funding |
| 2018-19 | 0 | 35 |
| 2019-20 | 84 | 39 |
| 2020-21 | 54 | 11 |
| 2021-22 | 46 | 54 |
| Year | Federal | Provincial | Total |
| 2020-21 | 30 | 10 | 40 |
| 2021-22 | 38 | 10 | 48 |
| 2022-23 | 59 | 38 | 97 |
| 2023-24 | 78 | 59 | 137 |
| 2024-25 | 92 | 78 | 170 |
| 2025-26 | 124 | 92 | 216 |
| 2026-27 | 143 | 124 | 267 |
| 2027-28 | 168 | 143 | 311 |
| 2028-29 | 0 | 168 | 168 |
[1] Core housing need is an indicator developed by the Canada Mortgage and Housing Corporation (CMHC) to identify households that need housing-related financial assistance. A household is in core housing need if it does not live in acceptable housing and its before-tax income is not sufficient to access acceptable housing. Housing is considered acceptable when the total cost of housing is equal to or less than 30 per cent of a household’s before-tax income, there are enough bedrooms to accommodate the size of the household and the housing is not in need of major repairs. In 2018, 13.9 per cent of households in Ontario were in core housing need, which was higher than the Canadian average of 11.6 per cent and was the second highest rate among all provinces.
[2] Chronic homelessness refers to people who are currently homeless and have been homeless for six months or more in the past year. In 2018, Ontario municipalities reported that there were over 16,000 Ontarians experiencing homelessness on any given night.
[3] Municipalities also spend approximately $1 billion each year in connection with the Province’s housing programs. Unlike the federal government’s contribution, municipal spending is not recorded as spending by the Province.
[4] The Province’s social housing wait list represents a compilation of data received from municipal service managers. It may include double counting of individuals on multiple local wait lists.
[5] The three new programs are the Canada-Ontario Community Housing Initiative (COCHI), the Ontario Priorities Housing Initiative (OPHI) and the Canada-Ontario Housing Benefit (COHB).
[6] The estimate of $4.0 billion includes $35 million of provincial spending in 2018-19 that has been allocated towards the NHS spending commitment and $168 million for the COHB program that the Province will spend in 2028-29.
[7] This consists of an increase of 45,200 households supported by rent supplements and 15,100 additional RGI units, as well as a loss of 5,000 below-market rent housing units.
[8] After accounting for population growth, the share of the Province’s households in core housing need will remain unchanged in 2027, compared to 2018, at 13.9 per cent.
[9] Vulnerable populations include survivors of domestic violence and human trafficking, people experiencing or at risk of experiencing homelessness, Indigenous people, and people with disabilities.
[10] Based on data from a number of communities in Ontario that conducted homelessness enumerations in 2018.
[11] Although the commitment to end chronic homelessness by 2025 was made by the previous government, the Ministry of Municipal Affairs and Housing confirmed with the FAO that the commitment to end chronic homelessness by the end of 2025 remains government policy.
[12] Nearly all homeless individuals in Ontario report that the lack of affordable housing options and long social housing wait lists are the main reasons they cannot obtain and retain housing.
[13] Excludes temporary COVID-19-related spending in 2020-21.
[14] Excludes temporary COVID-19 relief funding in 2020-21.
[15] Although support under the COHB program does not guarantee that a household will be removed from core housing need, it is sufficient to remove ‘high housing need’ households from risk of homelessness.
[16] National Housing Strategy Act, S.C. 2019, c. 29, s. 313.
[17] Statistics Canada, “Census of Canada,” 2011.
[18] Statistics Canada, “Canada Housing Survey,” 2018.
[19] Between 2011 and 2018, the average residential home resale price in Ontario increased by 68 per cent and the average market rent increased by 29 per cent, while median personal income increased by 24 per cent.
[20] Statistics Canada, “Canada Housing Survey,” 2018. In 2011, the rate of core housing need in Ontario was 13.4 per cent and the Canadian average was 12.5 per cent. Statistics Canada, “Census of Canada,” 2011.
[21] https://www.ontario.ca/document/community-housing-renewal-ontarios-action-plan-under-national-housing-strategy/housing-needs-ontario .
[22] In this report, high need households have after-tax income that is below the Low-Income Measure threshold, as defined by Statistics Canada, and spend 50 per cent or more of their gross income on the cost of shelter.
[23] 2018 point in time homelessness count from the municipalities of York, Toronto, Peel, Durham, Ottawa, Niagara, Thunder Bay, Waterloo, Peterborough, Sudbury, Nipissing, Kingston, Halton, Guelph, Brantford and Belleville.
[24] See Chapter 6 for analysis.
[25] Ibid .
[26] Municipalities in this report refers to municipal service managers and Indigenous Program Administrators.
[28] The estimated municipal contribution reflects reported municipal spending on provincial housing programs. See FAO, “Ontario Municipal Finances: An Overview of Municipal Budgets and an Estimate of the Financial Impact of the COVID-19 Pandemic,” 2020 for more information on municipal spending on housing and other programs.
[29] Social housing providers also offer some below-market rent units and rent supplements.
[30] For the purposes of this report, the term “rent supplements” refers to both rent supplements, which are rent subsidies paid to landlords, and housing allowances, which are rent subsidies paid to households.
[31] Under affordable housing programs, rent supplements may be tied to a household’s income. However, rent supplements do not limit a household’s rent or guarantee a household is spending less than 30 per cent of its gross income on shelter costs.
[32] The Housing Services Act, 2011 sets income limits that apply to most social housing programs and some affordable housing programs. However, municipal service managers have the authority to set higher income limits than prescribed in the Act and regulations. See O. Reg. 370/11 for household size and income limits by municipality, https://www.ontario.ca/laws/regulation/110370 .
[33] Excludes home repair programs that provided repair assistance to an additional 8,500 homeowner households in 2018-19.
[34] Municipal service managers are required under the Housing Services Act, 2011 to provide 186,717 households with RGI assistance.
[35] Auditor General of Ontario, “ Social and Affordable Housing ,” 2017.
[36] The below-market rent unit and rent supplement subsidies represent the average difference between market rent and rent paid by a recipient household. The RGI unit subsidy represents the average difference between costs associated with operating and maintaining a social housing building and rent paid by a recipient household.
[37] Based on the FAO’s review of Statistics Canada, “Canada Housing Survey,” 2018.
[38] Between 2011 and 2018, the average residential home resale price in Ontario increased by 68 per cent and the average market rent increased by 29 per cent, while median personal income increased by 24 per cent. Ontario’s population also increased by 8 per cent.
[39] The Housing Services Act, 2011 requires municipal service managers to have a centralized wait list that is used to select eligible households for rent-geared-to-income assistance. The Province’s social housing wait list represents a compilation of data received from municipal service managers. It may include double counting of individuals on multiple local wait lists.
[40] According to the City of Toronto, the current wait time for a one-bedroom unit in Toronto is 12 years .
[41] See Appendix A for more information on the three new programs. In addition to the three federal-provincial funded components of the NHS, there are other federal initiatives that will affect the supply of affordable housing in Ontario. These programs are administered by the CMHC and do not affect the Province’s housing programs; therefore, detailed analysis of these components is outside the scope of this report. These programs include the National Housing Co-investment Fund, the Rapid Housing Initiative, the Rental Construction Financing Initiative and the Federal Lands Initiative.
[42] The estimate of $4.0 billion includes $35 million of provincial spending in 2018-19 that has been allocated towards the NHS spending commitment and $168 million for the COHB program that the Province will spend in 2028-29.
[43] See Government of Ontario, “ Community Housing Renewal: Ontario’s Action Plan Under the National Housing Strategy .” Note that the Province projects that 215,632 households will receive support from NHS programs by 2027-28. However, the FAO excludes 6,584 households that will not receive direct housing support in 2027-28, including 3,248 households receiving housing support services (e.g., counselling and job placements) and 3,336 households that received one-year affordability assistance in 2019-20.
[44] See Appendix A for more information on the timing of funding under the three NHS programs.
[45] The FAO projects that the cost of housing will grow by 1.9 per cent annually on average from 2018 to 2027, which is higher than expected average annual per capita household income growth of 1.7 per cent. The FAO projects the number of households in Ontario to increase at an average annual rate of 1.1 per cent.
[46] Vulnerable populations include survivors of domestic violence and human trafficking, people experiencing or at risk of experiencing homelessness, Indigenous people, and people with disabilities.
[47] Ministry of Municipal Affairs and Housing, “Ontario’s Long-Term Affordable Housing Strategy,” 2016. The ministry confirmed with the FAO that the commitment to end chronic homelessness by the end of 2025 remains government policy.
[48] Auditor General of Ontario, “ Social and Affordable Housing ,” 2017.
[49] Ministry of Municipal Affairs and Housing, “Ontario’s Long-Term Affordable Housing Strategy,” 2016.
[50] The Province also offers social assistance programs including Ontario Works, the Ontario Disability Support Program and the Low-Income Energy Assistance Program that provide financial support including shelter allowances and energy arrears. Those programs are not administered by MMAH and are outside the scope of this report.
[51] The $566 million of COVID-19-related spending includes $234 million in federal funds. Of the $566 million in COVID-19-related spending, $498 million is part of the government’s Social Services Relief Fund, $26 million is for temporary pandemic pay and $42 million is for COVID-19 isolation centres.
[52] The commitment to end chronic homelessness formed a central piece of the Province’s five-year poverty reduction strategy that was in place from 2014 to 2019, as well as the 2016 Long-Term Affordable Housing Strategy. This included a commitment to increase CHPI funding to $339 million by 2019-20 and create the HFG program. In December 2020, the Province released a new five-year (2020 to 2025) poverty reduction strategy; however, the new strategy does not address the commitment to end chronic homelessness.
[53] See indicator 11 of the Ontario Poverty Reduction Strategy 2019 Annual Report, https://www.ontario.ca/page/poverty-reduction-strategy-2019-annual-report#section-3 . The Province has committed to introduce a “by name list” approach to homelessness enumeration beginning in 2021.
[54] 2018 point in time homelessness count from the municipalities of York, Toronto, Peel, Durham, Ottawa, Niagara, Thunder Bay, Waterloo, Peterborough, Sudbury, Nipissing, Kingston, Halton, Guelph, Brantford and Belleville.
[55] This includes emergency shelters, transitional housing and violence against women shelters, https://www150.statcan.gc.ca/t1/tbl1/en/cv.action?pid=1410035301 .
[56] City of Toronto daily and overnight shelter usage and 2018 Street Needs Assessment.
[57] According to data from municipal point in time homelessness counts, the most common causes of homelessness in Ontario are family conflict and addiction.
[58] From 2018 point in time homelessness counts from the municipalities of York, Toronto, Peel, Durham, Ottawa, Niagara, Thunder Bay, Waterloo, Peterborough, Sudbury, Nipissing, Kingston, Halton, Guelph, Brantford and Belleville.
[59] The spending projections exclude spending related to the COVID-19 pandemic in 2020-21.
[60] Excludes temporary COVID-19 relief funding in 2020-21.
[61] See Appendix 1 and 2 of Building a Strong Foundation for Success: Reducing Poverty in Ontario (2020-2025) .
[62] Reaching Home: Canada’s Homelessness Strategy Directives.
[63] A list of the 26 designated communities in Ontario can be found on the Employment and Social Development Canada website at https://www.canada.ca/en/employment-social-development/programs/homelessness/find-community/on.html .
[64] To date, communities in Ontario have been allocated a total of $382 million, which includes $331 million of funding to support the program objectives from April 1, 2019 to March 31, 2024 and $51 million of additional funding to provide support during the COVID-19 pandemic. The FAO expects that the remaining funding will be allocated in future years.
[65] Parliamentary Budget Office, “ Federal Spending on Housing Affordability ,” 2019.
[66] ‘High housing need’ households spend 50 per cent or more of their gross income on shelter costs and have an after-tax income below the Low-Income Measure threshold, as defined by Statistics Canada. ‘High housing need’ households are a subset of core housing need households.
[67] See Chapter 5 for more information.
[68] In 2018-19, municipalities funded approximately 73 per cent of the cost of social housing.
[69] The FAO projects shelter costs for 2020 using data for the rent component of the Consumer Price Index as well as CMHC mortgage obligation data. The FAO forecasts shelter costs to 2027 using projections from its 2021 Winter Economic and Budget Outlook for personal disposable income, population growth, mortgage rates and housing market indicators.
[70] The Core Need Income Threshold is a measure developed by the CMHC, which reflects the maximum income level at which a household would have difficulty finding suitable affordable housing in its community.