

Table of Abbreviations
Abbreviation Long Form
- BRT
- Bus Rapid Transit
- FAO
- Financial Accountability Office
- GGH
- Greater Golden Horseshoe
- GGRA
- Greenhouse Gas Reduction Account
- GTHA
- Greater Toronto and Hamilton Area
- LRT
- Light Rail Transit
- MPP
- Member of Provincial Parliament
- MTO
- Ministry of Transportation
- SCE
- Standing Committee on Estimates
1 | Introduction
On May 9, 2019, the Government of Ontario (the Province) tabled in the Legislative Assembly volume 1 of the 2019-20 Expenditure Estimates.[1] The 2019-20 Expenditure Estimates (or Estimates) sets out the fiscal year’s spending requirements for ministries and constitutes the government’s formal request to the legislature for approval to spend the amounts as detailed in the Estimates.
After tabling in the legislature, the Estimates were referred to the Standing Committee on Estimates (SCE). The SCE is mandated to consider the Estimates of between six and 12 ministries. For 2019-20, the SCE has selected the Estimates of the following ministries for review:
- Health and Long-Term Care
- Education
- Transportation
- Infrastructure
- Children, Community and Social Services
- Environment, Conservation and Parks
- Agriculture, Food and Rural Affairs
After the SCE completes its review of a ministry, the committee votes on the ministry’s Estimates. Once the review and voting process is completed for all selected ministries, the SCE must deliver a report to the legislature by the third Thursday in November.[2] The Supply Bill is then formally introduced in the legislature for approval by all Members of Provincial Parliament (MPPs). Passage of the Supply Bill provides the legislature’s approval to spend the amounts as detailed in the Estimates.
The purpose of this report is to support the SCE’s review of the Ministry of Transportation’s (MTO) 2019-20 Expenditure Estimates.[3] The report begins with a financial overview of the ministry. Next, the report discusses the ministry’s five-year transit and highway capital plans. Lastly, the report reviews proposed 2019-20 spending by program and identifies spending trends and program changes.
Appendix C provides more information on the development of this report.
2 | Ministry Overview
In the 2019 Ontario Budget, the Ministry of Transportation (MTO) is projected to spend $5.2 billion in 2019-20.[4] This is a decrease of $0.4 billion (6.8 per cent) from the 2018 budget plan.
Projected Ministry of Transportation spending in 2018-19 and 2019-20, $ billions
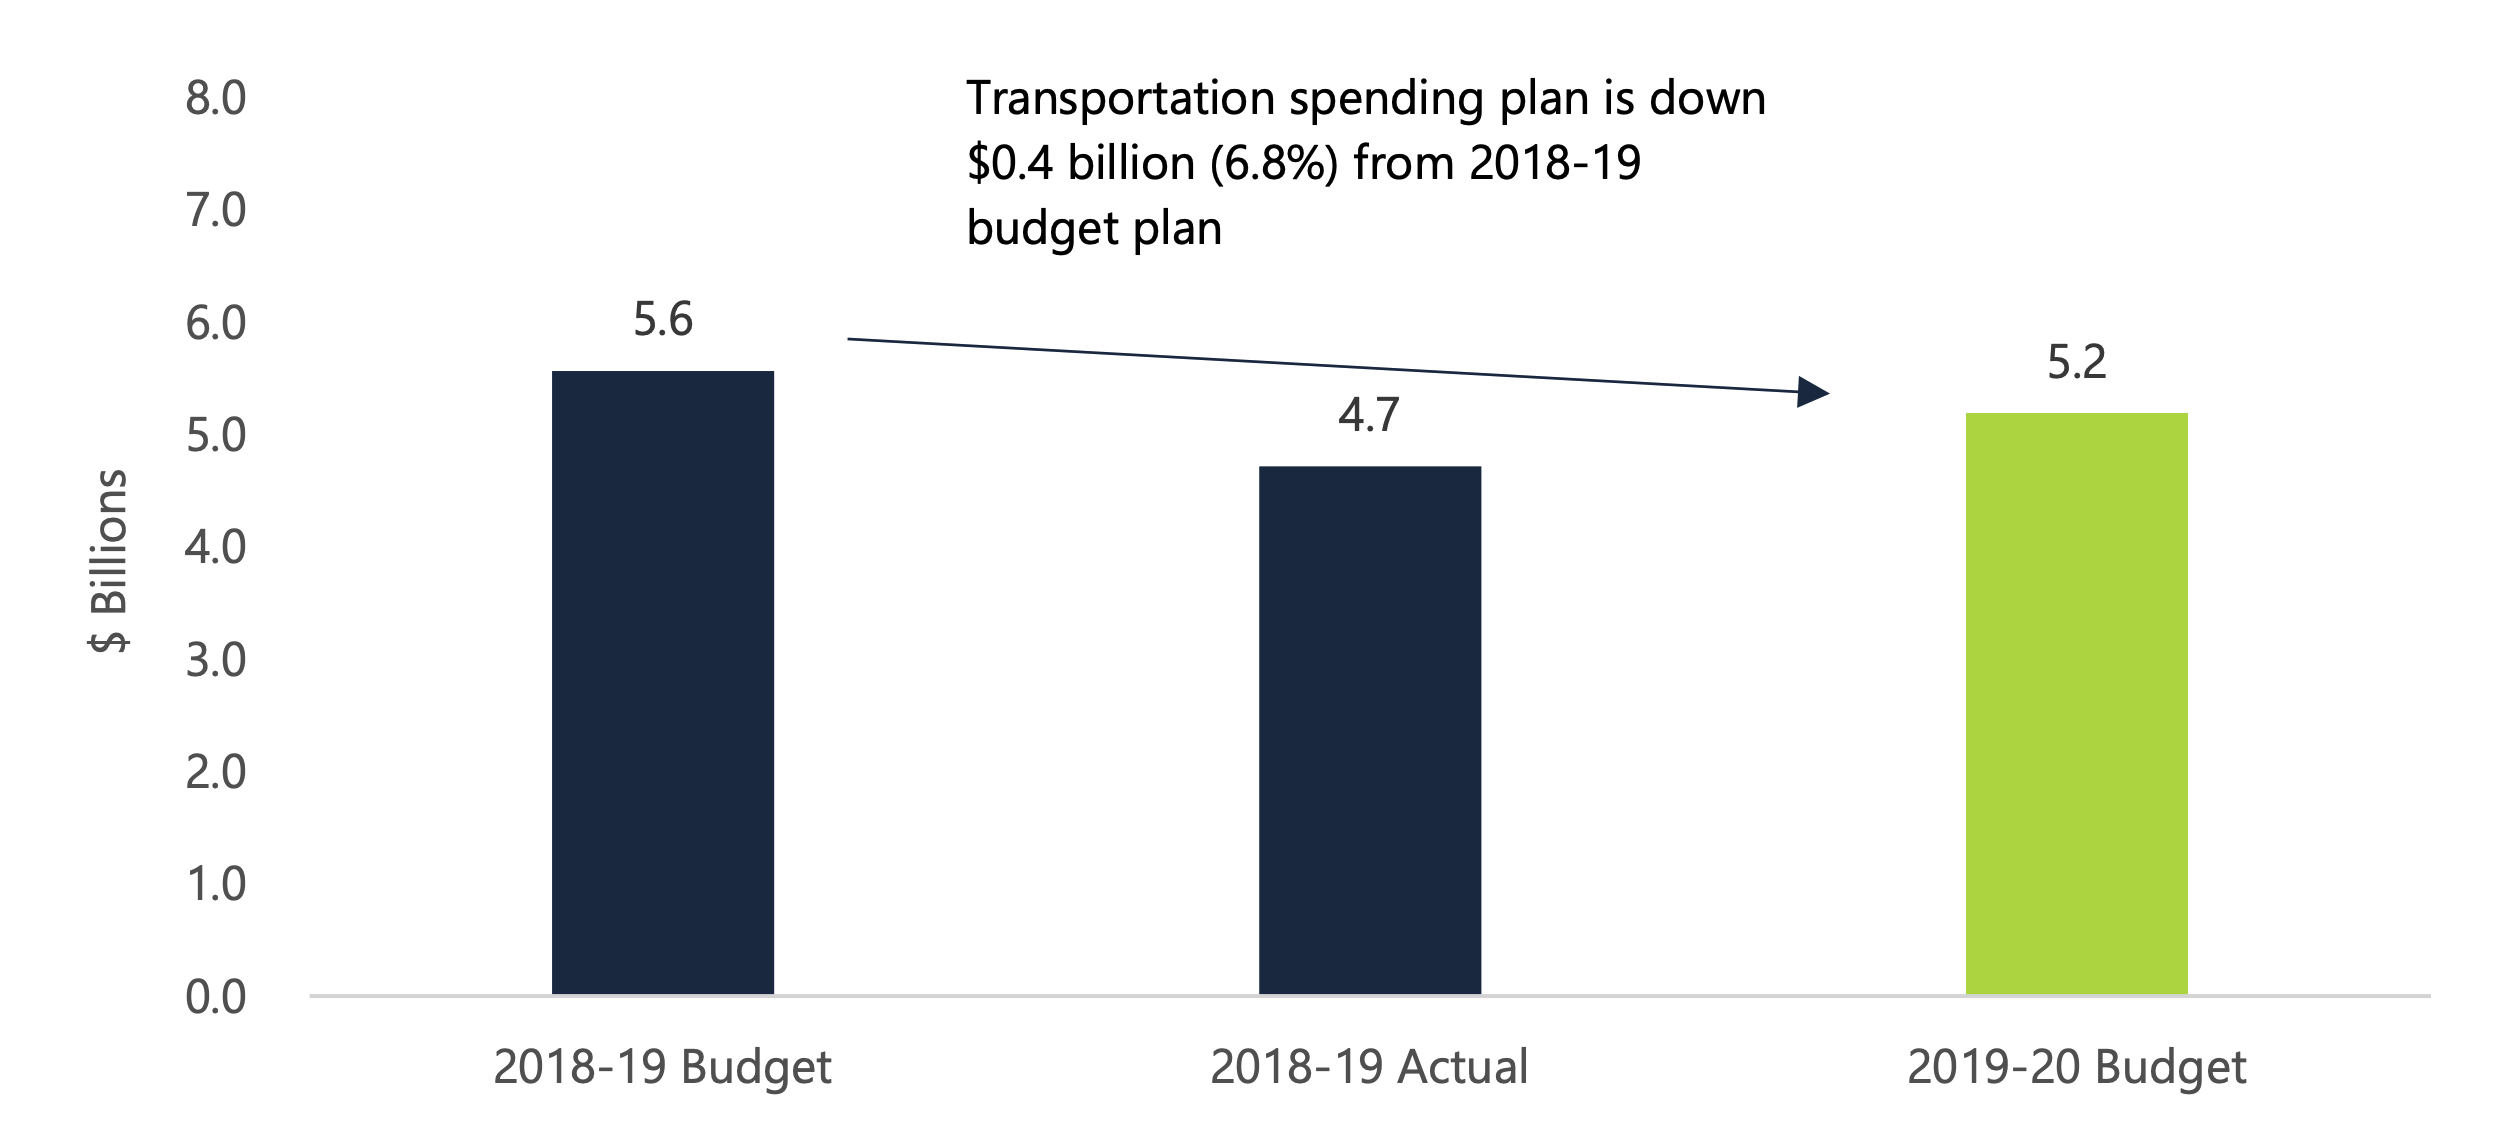
Source: FAO analysis of the 2018 and 2019 Ontario Budgets and the 2018-19 Public Accounts of Ontario.
Accessible version
The figure shows the projected spending by the Ministry of Transportation (MTO) in 2018-19 and 2019-20 in billions of dollars. The chart shows that MTO spending as of the 2018-19 budget was $5.6 billion, actual spending as of 2018-19 was $4.7 billion, and planned spending for the 2019-20 Budget is $5.2 billion. This figure highlights the fact that MTO spending is down $0.4 billion, or 6.8 per cent, from the 2018-19 budget plan.
Understanding Transportation Spending
Transportation Spending by Expenditure Estimates Categories
In the Expenditure Estimates, the government’s spending plan is grouped into expense (which affects the budget balance) and investment in assets (most of which are amortized and impact the budget balance over the life of the asset). This section reviews MTO expense and investment in assets by Estimates categories.
Ministry Expense
The Ministry of Transportation’s 2019-20 projected expense of $5.2 billion is divided into three broad spending categories in the Expenditure Estimates:
- $6.0 billion in Supply Bill spending that is authorized annually by the legislature (known as spending “to be voted”);
- $1.1 billion in spending that is authorized by standalone legislation (known as statutory spending); and
- a negative $1.9 billion adjustment in other spending, which mainly consists of negative non-cash adjustments to account for spending on capital assets by the provincial agency Metrolinx.
| Vote | Program Name | 2019-20 Estimates ($ millions) |
Share of Total Supply Expense (%) |
|---|---|---|---|
| 2702 | Policy and Planning | 5,103 | 85 |
| 2704 | Provincial Highways Management Program | 670 | 11 |
| 2703 | Road User Safety Program | 117 | 2 |
| 2705 | Labour Transportation Cluster | 59 | 1 |
| 2701 | Ministry Administration Program | 53 | 1 |
| Total Supply Bill (Voted) Expense | 6,003 | 100 | |
| Standalone legislation (statutory) expense – highway amortization | 1,035 | ||
| Standalone legislation (statutory) expense – other | 23 | ||
| Total Standalone Legislation (Statutory) Expense | 1,058 | ||
| Other expense – Ontario Gas Tax Program | 338 | ||
| Other expense – Metrolinx | -2,211 | ||
| Total Other Expense | -1,873 | ||
| Total Ministry of Transportation Expense | 5,187 |
Supply Bill spending is divided into programs called votes, sub-programs called items, and accounts. MTO has five votes. The Policy and Planning program is the largest, accounting for $5.1 billion (85 per cent) of Supply Bill expense spending, followed by the Provincial Highways Management Program at $0.7 billion (11 per cent). The remaining three votes account for $0.2 billion (four per cent).[5]
Standalone legislation spending mainly consists of non-cash expense related to the amortization of highway assets, which reflects the consumption or degradation of the asset over time. This amounts to about $1.0 billion in 2019-20. A small portion of statutory spending is related to the amortization of other capital assets, such as software and fleet vehicles.
Other expense largely consists of net adjustments for spending by Metrolinx.[6] A large negative adjustment is required because MTO provides Supply Bill funding to Metrolinx, which is recorded as an expense. However, Metrolinx will spend most of this funding on capital asset projects, which are amortized and expensed over the useful life of the asset. As a result, the other spending adjustment for Metrolinx reverses any spending on capital assets and replaces that spending with amortization expense.[7] In addition, any spending by Metrolinx from independently raised revenue (such as GO Transit fares) is recorded as a positive expense in the other expense category. Finally, other expense also includes $0.3 billion in spending for the Ontario Gas Tax Program, which provides payments to municipalities to fund public transit.
Ministry Investment in Capital Assets
In the 2019-20 Expenditure Estimates, MTO is requesting an additional $2.2 billion in Supply Bill spending for investment in capital assets. This includes nearly $2.2 billion (98 per cent of the total) for highway rehabilitation and expansion. The remainder, less than $0.1 billion (or two per cent), is divided between the Road User Safety Program and Ministry Administration Program, mainly for investments in other assets, such as software and fleet vehicles.
| Vote | Program Name | 2019-20 Estimates ($ millions) |
Share of Total Supply Assets (%) |
|---|---|---|---|
| 2704 | Provincial Highways Management Program | 2,153 | 98 |
| 2703 | Road User Safety Program | 34 | 2 |
| 2701 | Ministry Administration Program | 17 | 0 |
| Total Supply Bill (Voted) Assets | 2,203 | 100 | |
| Total Investment in Capital Assets (Supply Bill) | 2,203 |
In total, the ministry plans to invest $6.1 billion in capital assets in 2019-20. However, only $2.2 billion is explicitly identified in the Estimates as a capital asset investment. The remaining $3.9 billion is included in the Policy and Planning program (Vote 2702) as an expense transfer payment to Metrolinx.
Transportation Spending by Program Function
An alternative way to examine transportation spending is by major program function, which aggregates different Estimates categories by spending purpose. Under this approach, it is possible to identify the ministry’s total investment in capital assets, which is not possible from a review of the Expenditure Estimates.
Overall, there are three main programs provided by the Ministry of Transportation: transit, highways, and other transportation. The charts below present planned MTO expense and investment in capital assets by the three major programs. Of MTO’s $5.2 billion in projected expense, $3.2 billion (62 per cent) is for transit, $1.7 billion (33 per cent) is for highways, and $0.3 billion (five per cent) is for other transportation.
Similarly, of the $6.1 billion in projected investment in capital assets, $3.9 billion (64 per cent) is for transit, $2.2 billion (35 per cent) is for highways, and less than $0.1 billion (one per cent) is for other transportation.
2019-20 Ministry of Transportation expense and investment in capital assets by function, $ millions
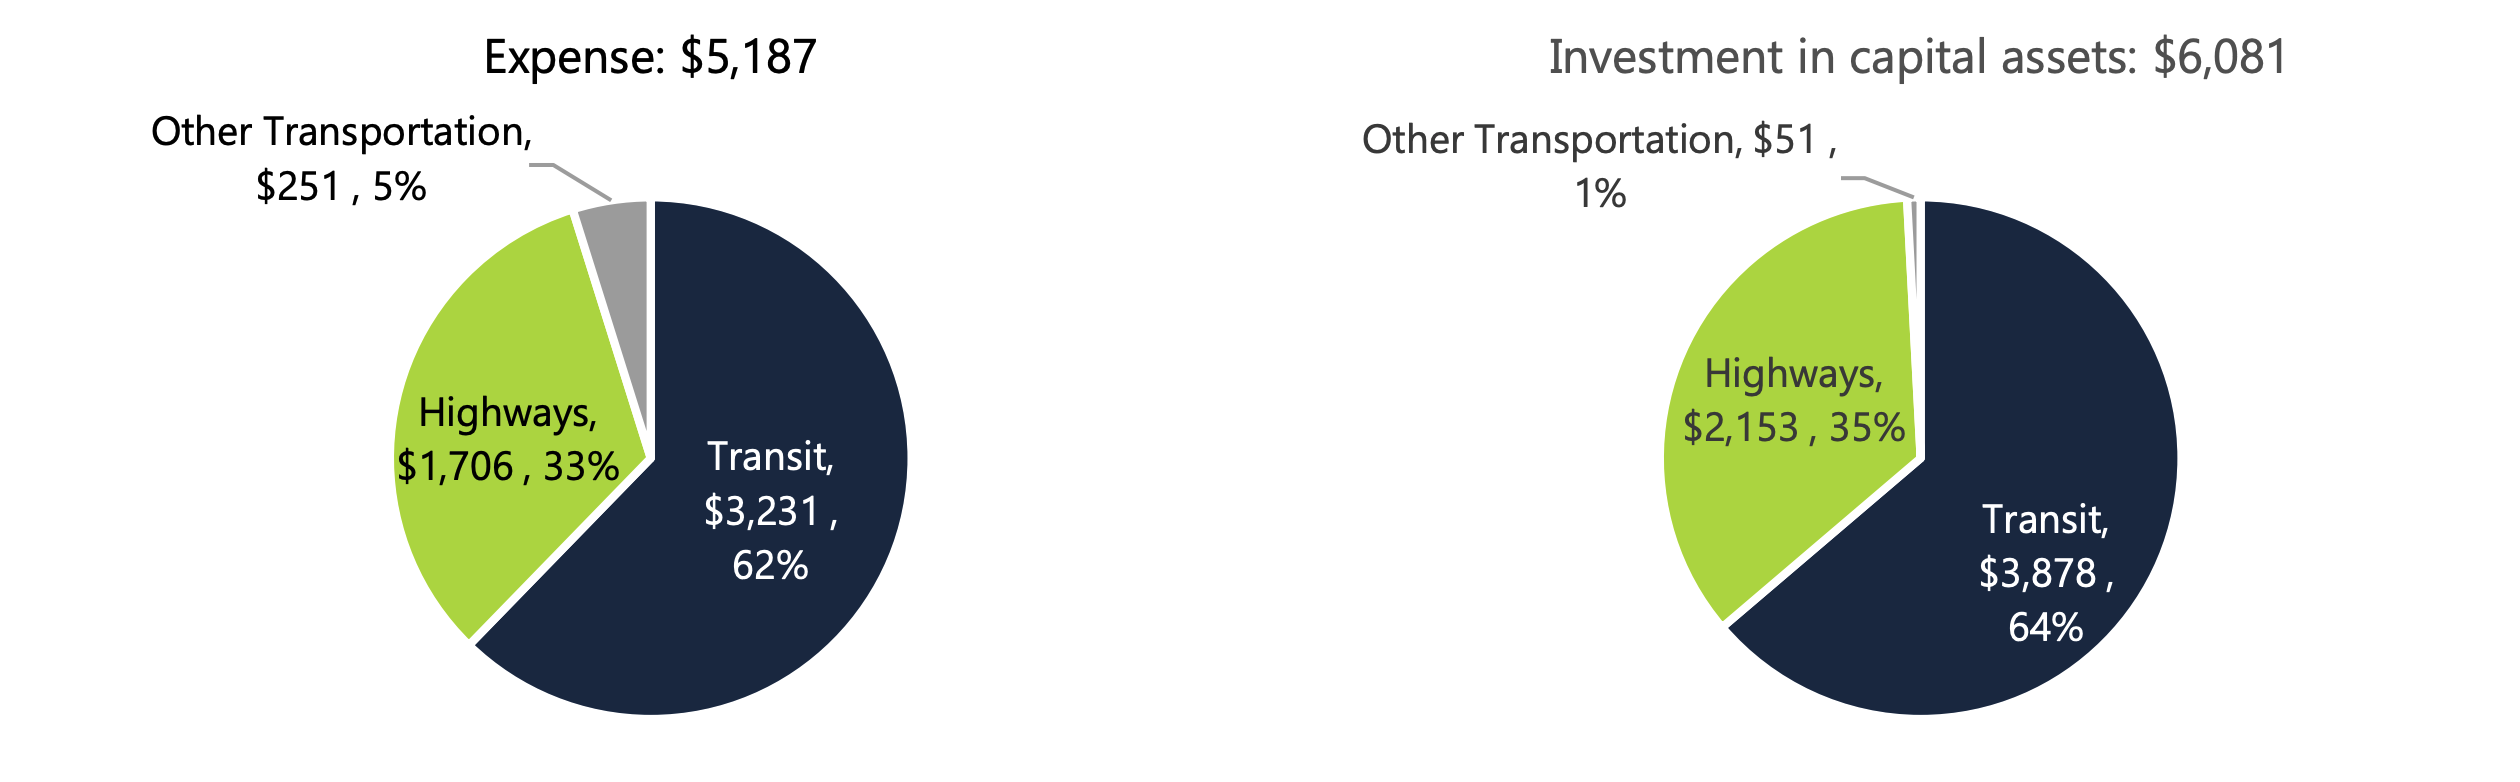
Source: FAO analysis of the 2019-20 Expenditure Estimates and Metrolinx’s 2019-20 business plan.
Accessible version
These two pie charts show Ministry of Transportation expenses and investment in capital assets by function for the 2019-20 fiscal year in millions of dollars. The first chart shows that total expenses are $5.19 billion which include $3.23 billion, or 62 per cent, in transit spending, $1.71 billion, or 33 per cent, in highway spending, and $251 million, or 5 per cent, in other transportation spending. The second chart shows a total investment in capital assets of $6.1 billion which consists of $3.88 billion or 64 per cent for transit, $2.15 billion or 35 per cent for highways and $51 million or 1 per cent for other transportation.
The following sections provide more information about ministry expense and investment in capital assets for each of the three major program functions in 2019-20.
Transit
MTO is projecting to incur $3.2 billion in expense and invest $3.9 billion in capital assets through the transit program in 2019-20.
MTO’s transit program expense of $3.2 billion consists mainly of $2.0 billion to be spent by Metrolinx to operate and maintain (including amortization costs) transit services in the Greater Golden Horseshoe (GGH), $0.9 billion to be transferred to municipalities to invest in projects such as Toronto streetcars and London Bus Rapid Transit,[8] and another $0.3 billion to be transferred to municipalities from the Ontario Gas Tax Program.
MTO, through Metrolinx, will invest $3.9 billion in capital assets through the transit program in 2019-20. The major planned investments for 2019-20 are shown in the table below.
| Project | Amount ($ millions) |
|---|---|
| Eglinton Crosstown Light Rail Transit | 1,317 |
| GO Transit Expansion (e.g., electrification, new stations and higher frequency of service) | 755 |
| Rehabilitation of GO Transit and UP Express assets | 701 |
| PRESTO implementation and state of good repair | 100 |
| Planning for GTHA subway projects | 65 |
| Kitchener GO Transit Expansion | 27 |
| Niagara GO Transit Expansion | 22 |
| Bowmanville GO Transit Expansion | 7 |
| Other (e.g., Finch West, Hamilton, and Hurontario LRTs, vivaNext BRT) | 884 |
| Total Investment in Capital Assets | 3,878 |
Transit Program Spending Compared to Estimates Spending Categories
In the following table, the FAO describes how spending for the transit program function is allocated by Estimates spending categories.
| Spending Type | Total Program Spending | Spending by Estimates Category | Additional Details |
|---|---|---|---|
| Expense | $3,231 million | $5,103 million Supply Bill (Vote 2702) -$1,873 million Other spending |
Supply Bill transit expense is contained within three sub-programs (items) in Vote 2702:
|
| Investment in capital assets | $3,878 million | $3,878 million Supply Bill (Vote 2702) |
MTO plans to provide $3,878 million in funding to Metrolinx through the Urban and Regional Transportation (capital) sub-program (item 3) in Vote 2702. This funding is projected to be invested in transit capital assets by Metrolinx. |
Highways
MTO is projecting to incur $1.7 billion in expense and invest $2.2 billion in capital assets through its highways program in 2019-20. Highways program expense represents the annual depreciation (amortization) of the Province’s southern Ontario highways and the maintenance costs for all provincial highways. Investment in capital assets captures the net book value gained by rehabilitating existing southern Ontario highway assets and creating new assets through the expansion of the southern Ontario highways network.[12]
The ministry’s $1.7 billion highways program expense includes $1.0 billion in amortization expense, which is related mainly to southern highway assets. MTO will also spend about $0.6 billion on contracted services to operate and maintain the Province’s highways and $0.1 billion on transportation infrastructure in First Nations communities, roadways and bridges connecting provincial highways in various municipalities, and municipal ferries.
MTO will invest $2.2 billion in capital assets through its highways program in 2019-20. The majority of this spending is for the rehabilitation and expansion of existing southern Ontario highway assets. The remainder is used mainly to support ferries and provide remote air services across Ontario.
Provincial highways capital asset inventory
The total net book value of the Province’s highway assets (in southern and northern Ontario) was $26.7 billion as of March 31, 2019 and is projected to grow to $28.0 billion by March 31, 2020. The Province’s highway assets consist of transportation infrastructure (about 40,000 lane kilometres of highways, 3,100 bridges, and 2,100 structural culverts)[13] worth $18.1 billion (68 per cent of the total net book value), followed by $8.2 billion (31 per cent of the total net book value) worth of land and $0.3 billion (about one per cent of the total net book value) of other assets, which includes buildings, ferries, machinery and equipment.
Net book value of the Province’s highways assets, 2018-19, $ billions
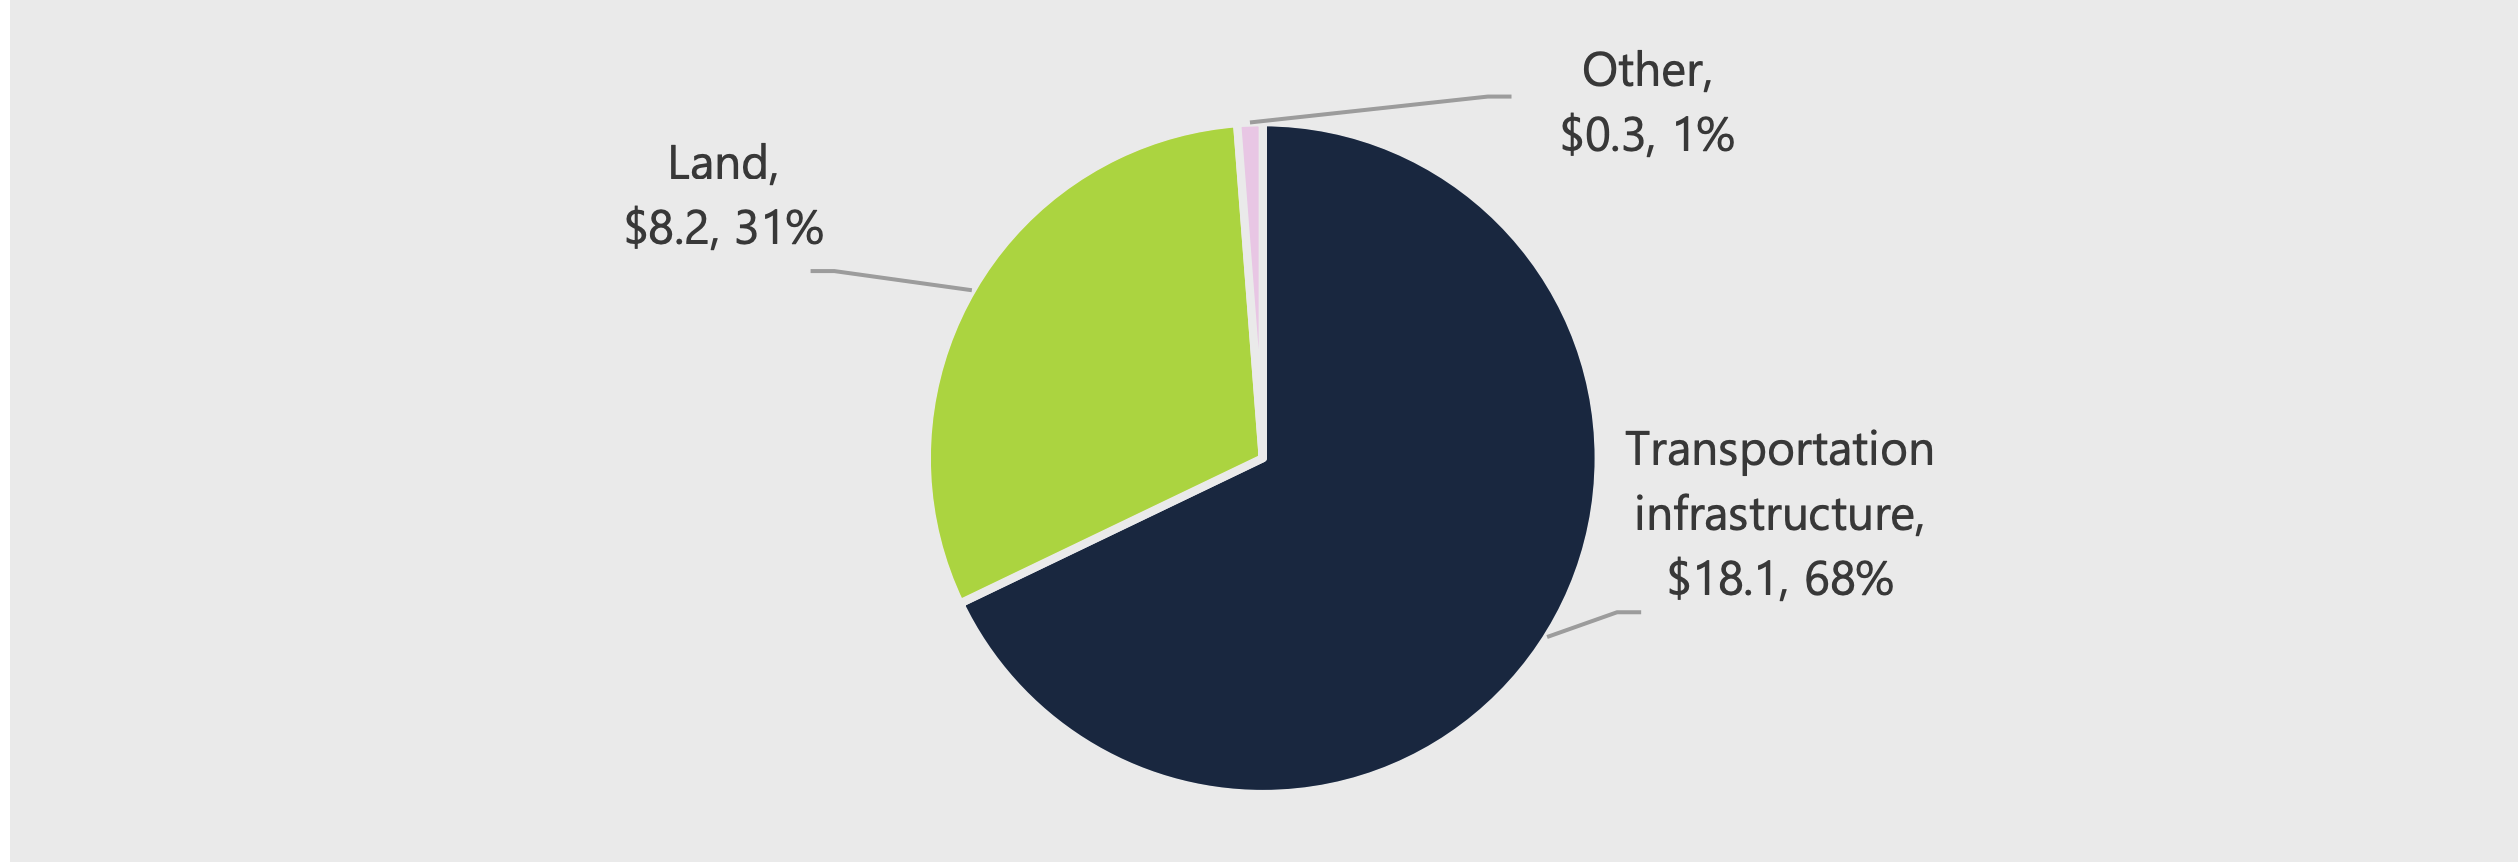
Source: FAO analysis based on information provided by the Ministry of Transportation.
Accessible version
This pie chart shows the net book value of the highway assets of the Province in 2018-19 in billions of dollars. This chart shows that the net book value of transportation infrastructure is $18.1 billion, or 68 per cent, $8.2 billion or 31 per cent for land and $0.3 billion or 1 per cent for other assets.
Highways Program Spending Compared to Estimates Spending Categories
In the following table, the FAO describes how spending for the highways program function is allocated by Estimates spending categories.
| Spending Type | Total Program Spending | Spending by Estimates Category | Additional Details |
|---|---|---|---|
| Expense | $1,706 million | $670 million Supply Bill (Vote 2704) $1,035 million Standalone legislation |
Supply Bill highways expense is through two sub-programs (items) in Vote 2704:
|
| Investment in capital assets | $2,153 million | $2,153 million Supply Bill (Vote 2704) |
All investments in southern Ontario highway capital assets are authorized through one sub-program in Vote 2704:
|
Other Transportation
MTO is projecting to incur $0.3 billion in expense and invest less than $0.1 billion in capital assets through the other transportation program.
The other transportation program expense includes:
- $117 million for the Road User Safety Program, which oversees the delivery of vehicle licensing in Ontario and sets and promotes safety standards for vehicles;
- $59 million for information and information technology services to both the Ministry of Transportation and the Ministry of Labour; and
- $53 million for ministry administration, which supports the delivery of all programs and services offered by the Ministry of Transportation.
The other transportation program investment in capital assets includes:
- $34 million for business application software; and
- $17 million for land and marine fleet.
In the following table, the FAO describes how spending for the other transportation program function is allocated by Estimates spending categories.
| Spending Type | Total Program Spending | Spending by Estimates Category | Additional Details |
|---|---|---|---|
| Expense | $251 million | $229 million Supply Bill (multiple votes) $22 million Standalone legislation |
Supply Bill expense for MTO other transportation is authorized through three votes:
|
| Investment in capital assets | $51 million | $51 million Supply Bill (multiple votes) |
All investments in capital assets for the other transportation program is authorized through two votes in the Supply Bill:
|
3 | Key Issues for 2019-20
For this year’s report, the FAO reviewed the Province’s five-year transit and highways capital plans as reflected in the 2019 Ontario Budget[14] and the 2019-20 Expenditure Estimates. The two capital plans represent total planned spending on transit and highways infrastructure in Ontario over the next five years.[15]
Spending for the transit and highways capital plans flow through the Ministry of Transportation, except for:
- the capitalization of interest expense connected to capital projects that are owned by the Province, which is largely recorded as a spending adjustment with the Ministry of Finance; and
- spending on northern Ontario highways, which is recorded with the Ministry of Energy, Northern Development and Mines.
Transit Capital Plan
2019 Budget Five-Year Transit Capital Spending Plan
Transit capital spending is projected to be $5.5 billion in 2019-20, rising to $7.2 billion in 2023-24. Over this period, transit capital spending is projected to grow at seven per cent per year on average, largely due to a significant planned year-over-year increase in spending in 2023-24 of $1.5 billion. Although the projected annual growth rate in transit capital spending, at seven per cent, is about half the rate experienced from 2010-11 to 2018-19, annual transit capital spending is projected to be higher in every year from 2019-20 to 2023-24 compared to the prior nine-year period.
Transit capital spending, $ billions
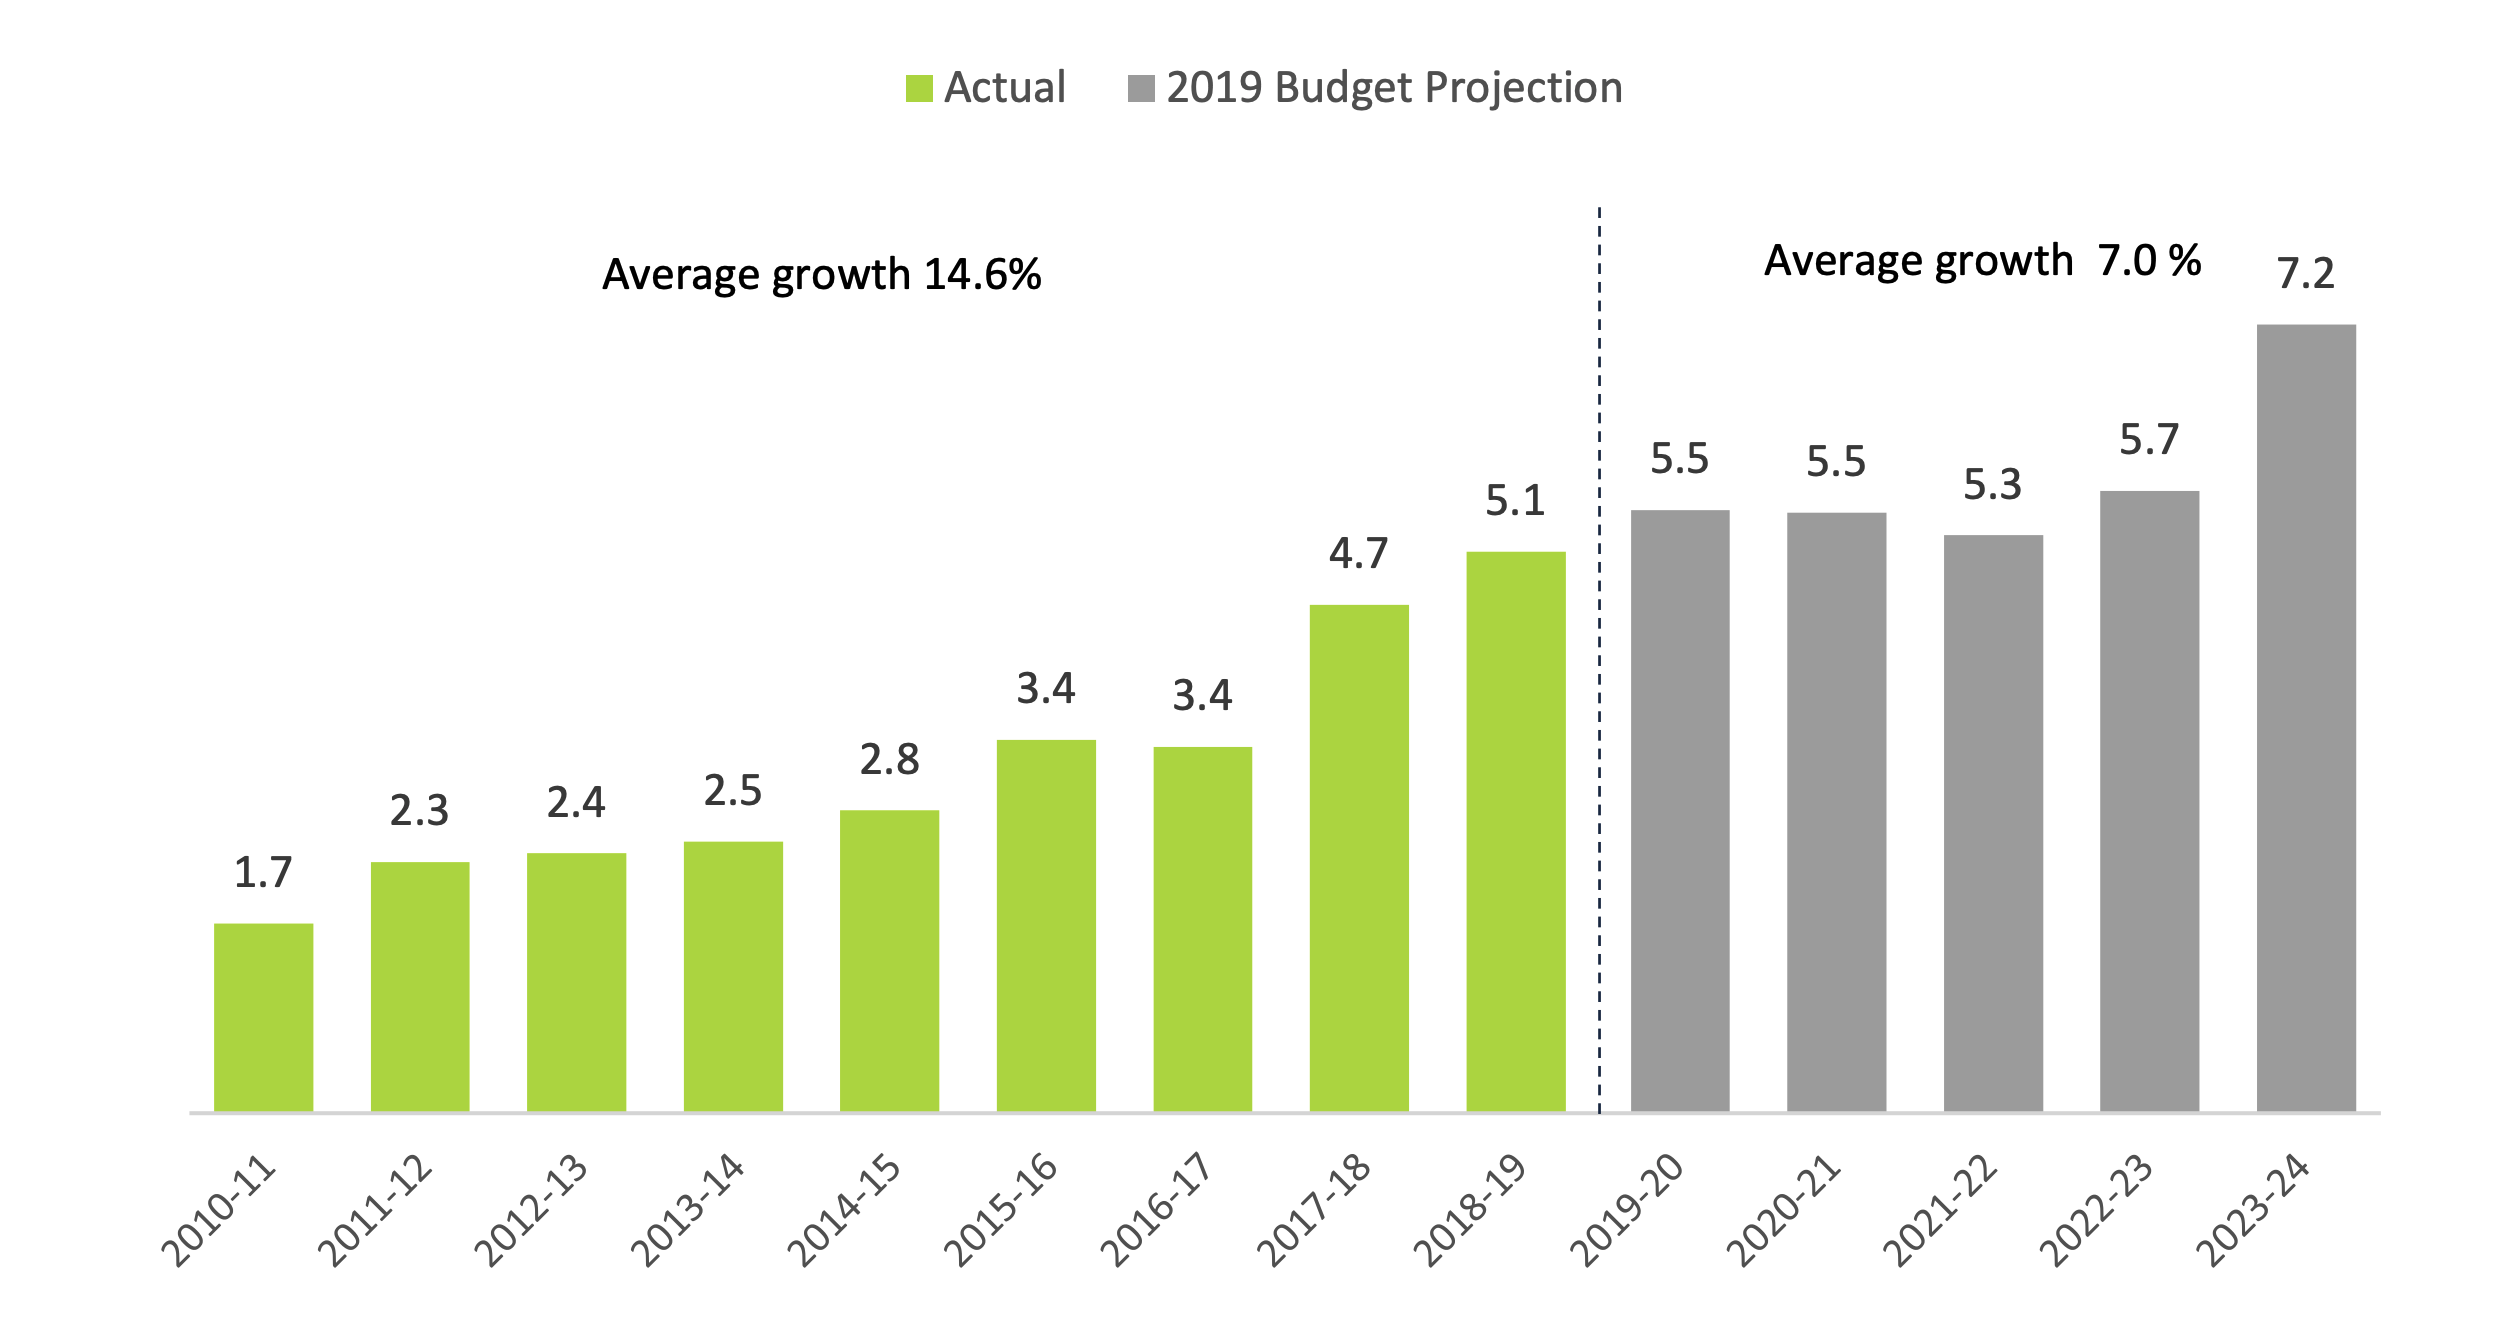
Source: FAO analysis of the Public Accounts of Ontario and the 2019 Ontario Budget.
Accessible version
This figure shows the actual transit capital spending from 2010-11 to 2018-19 and the projected transit capital spending from 2019-20 to 2023-24 in billions of dollars. The figure shows that the actual transit capital spending was $1.7 billion in 2010-2011, $2.3 billion in 2011-12, $2.4 billion in 2012-13, $2.5 billion in 2013-14, $2.8 billion in 2014-15, $3.4 billion in 2015-16, $3.4 billion in 2016-17, $4.7 billion in 2017-18 and $5.1 billion in 2018-19. The figure shows that the projected transit capital spending according to the 2019 Budget Projection is $5.5 billion in 2019-20, $5.5 billion in 2020-21, $5.3 billion in 2021-22, $5.7 billion in 2022-23 and $7.2 billion in 2023-24. This chart highlights that the average growth in transit capital spending was 14.6 per cent from 2010-11 to 2018-19, and the average growth in transit capital spending from 2019-20 to 2023-24 is projected to be 7.0 per cent.
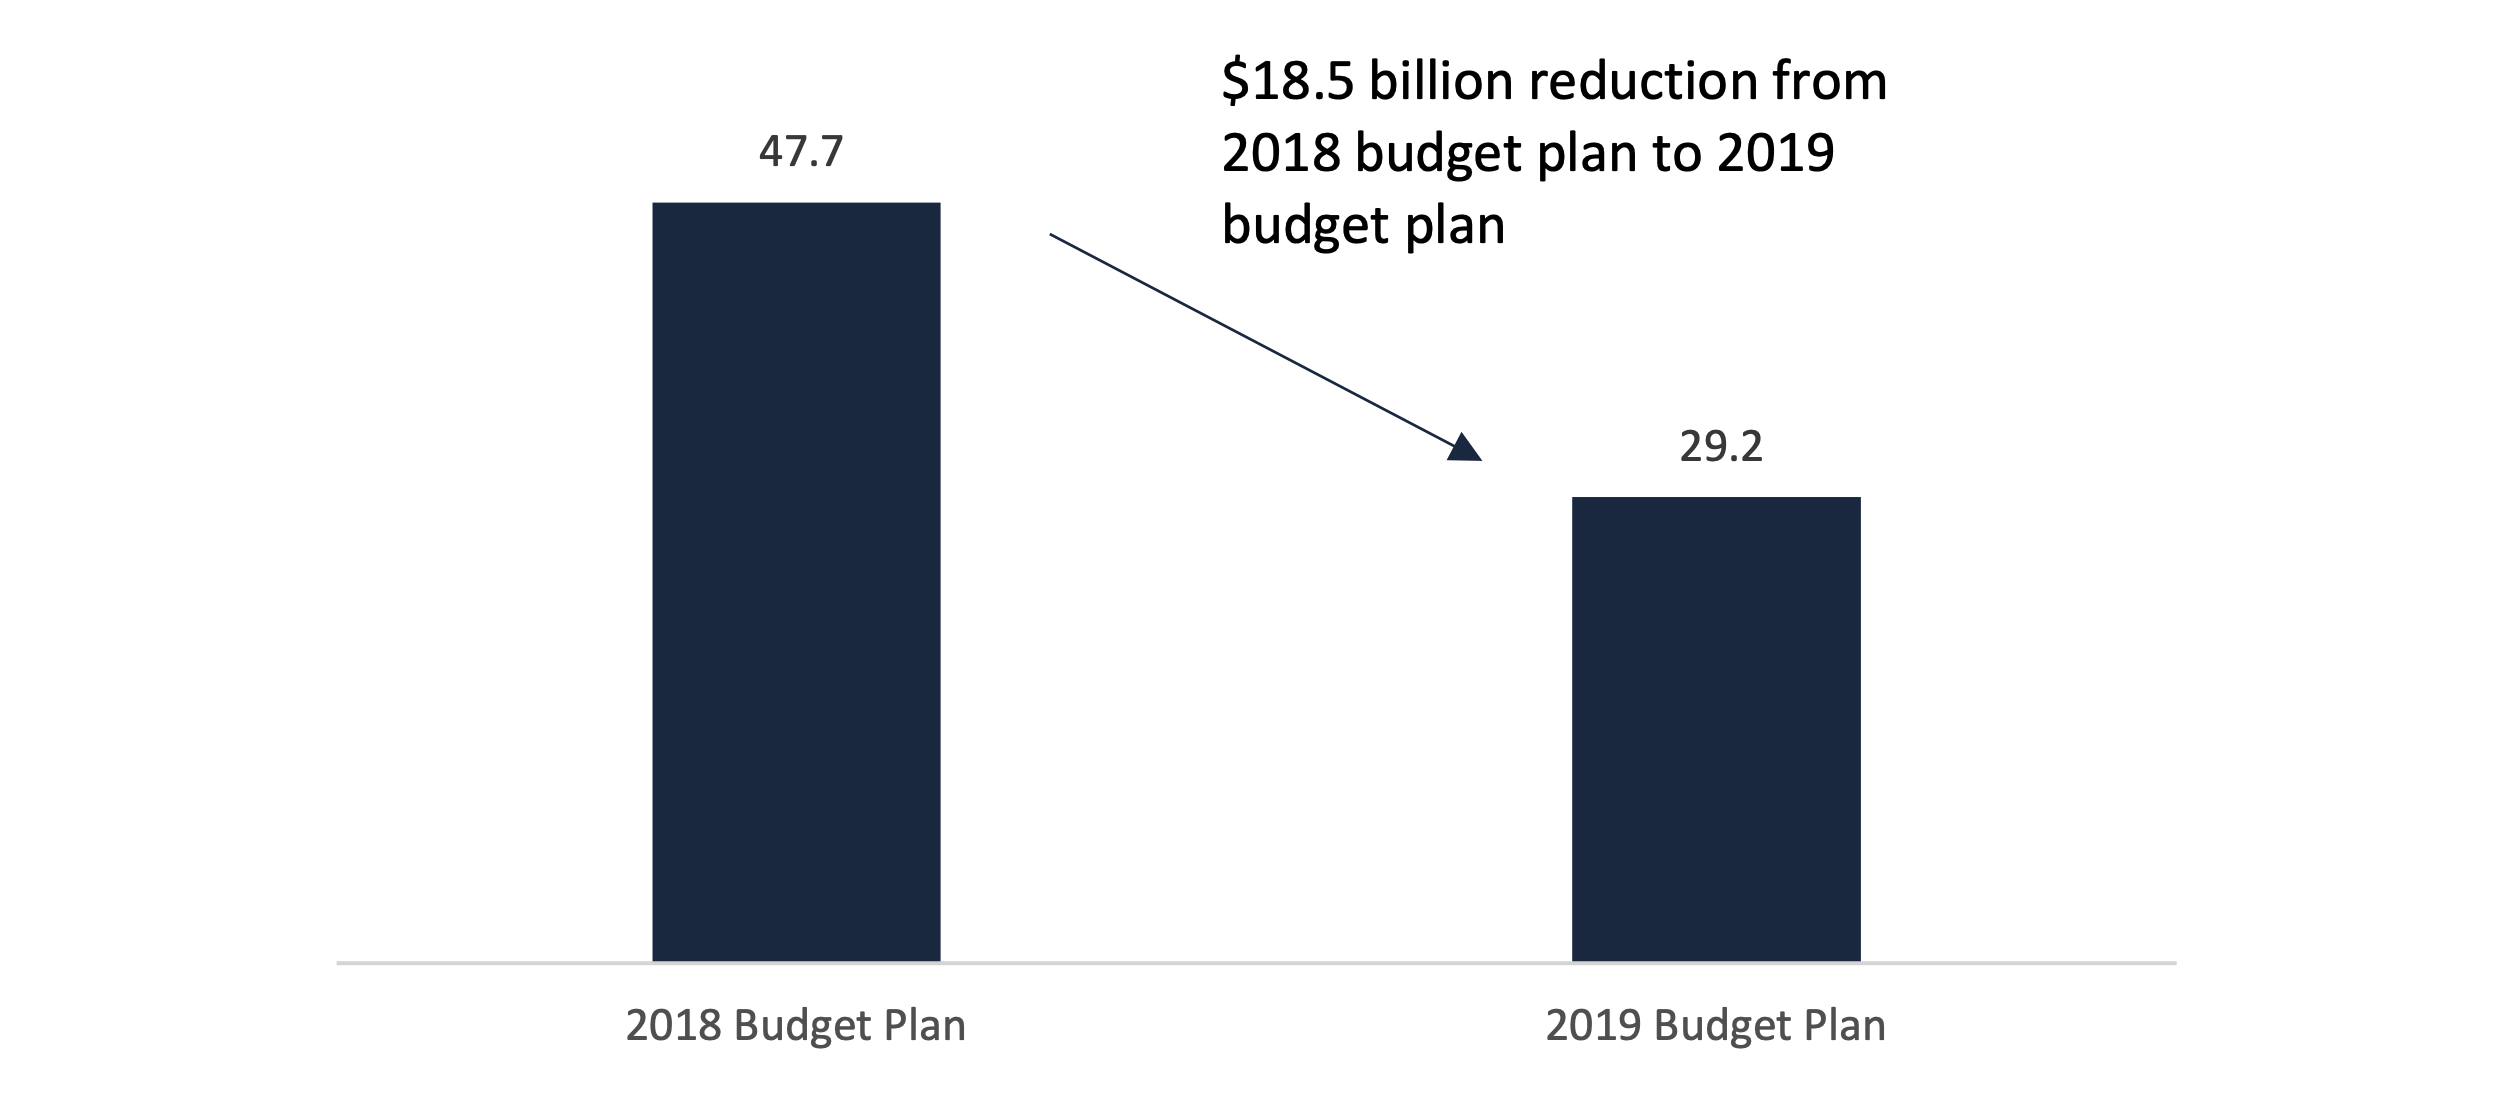
Spending in 2019 Budget Plan Significantly Below 2018 Budget Plan
Based on the 2019 budget’s transit capital plan, the Province plans to spend $29.2 billion on transit infrastructure over the next five years. This is approximately $18.5 billion or nearly 40 per cent lower than the 2018 budget’s planned spending of $47.7 billion over the same time period.
Transit capital spending in 2019 budget compared to 2018 budget, 2019-20 to 2023-24, $ billions
Source: FAO analysis of the 2019 Ontario Budget and information provided by the Province.
Accessible version
This figure shows the projected transit capital spending from 2019-20 to 2023-24 as stated in the 2018 budget plan and the 2019 budget plan in billions of dollars. The figure shows that the 2018 budget plan transit capital spending projection was $47.7 billion and the transit capital spending projection from the 2019 budget plan is $29.2 billion. This chart highlights that there is an $18.5 billion reduction from the 2018 budget plan to the 2019 budget plan.
The FAO estimates that the $18.5 billion reduction in transit capital spending consists of:
- The cancellation of the project to build high-speed rail along the Toronto-Windsor corridor, which the FAO estimates was allocated approximately $7.7 billion in funding over the next five years.[16]
- The cancellation of the transfer of an additional two cents per litre in gas tax funding to municipalities under the Ontario Gas Tax Program, which is estimated to save the Province $1.1 billion over five years.
- A reduction of about $9.4 billion to reflect the Province’s observation that historically infrastructure project spending is approximately 17 per cent below the amounts planned.[17] In other words, the Province has budgeted for projects totalling approximately $38.7 billion over the next five years but has only included $29.2 billion in spending in the budget plan due to the assumption that about $9.4 billion in spending will not occur.[18]
- The deferral of about $3.6 billion beyond the first five years in the 2019 budget plan.
- Offset by a planned net spending increase of $3.3 billion over the next five years due to the revised Toronto subway expansion plan.
Key Components of the Transit Capital Plan
The five-year transit capital plan in the 2019 budget consists of five main components: the expansion of GO Transit, light rail and bus rapid transit projects, the Province’s new Toronto subway expansion plan, the Ontario Gas Tax Program, and other transit infrastructure spending. Overall, the projects in the transit capital plan call for spending of approximately $38.7 billion over the next five years. However, as noted above, the 2019 budget plan includes an assumption that about $9.4 billion in spending will not occur due to delays in construction timelines.[19] Importantly, the $9.4 billion in assumed underspending has not been allocated by the ministry against specific projects and is not reflected in the discussion below. Members of the Standing Committee on Estimates may wish to ask the ministry for further information on which transit capital projects are expected to be delayed.
GO Transit Expansion
The transit capital plan includes $14.0 billion over the next five years to expand the GO Transit network and increase the speed and frequency of service. This includes improving rail signalling and control systems, the electrification of parts of the rail network, the extension of the Niagara, Bowmanville and Kitchener lines, and the construction of new GO stations and facilities.
Light Rail Transit and Bus Rapid Transit Expansion
The Province plans to spend $8.3 billion over the next five years on light rail transit (LRT) and bus rapid transit (BRT) projects. This includes provincially owned rapid transit projects (Eglinton Crosstown, Hurontario LRT, Finch West LRT and Hamilton LRT), as well as municipal-owned projects (London BRT and Phase II of the Ottawa LRT).
The New Subway Expansion Plan
The 2019 budget’s transit capital plan reflects the Province’s new plan to expand subway transit in Toronto, Mississauga and York Region. The plan includes one new subway line and three extensions.[20] These four projects are expected to cost a total of $28.5 billion and be completed by 2030-31. Based on estimated completion dates, the FAO projects that the Province will spend $6.1 billion over the next five years.[21]
| Project | Location | Estimated Completion | Total Cost ($ billions) |
|---|---|---|---|
| Ontario Line | Ontario Science Centre to Ontario Place | 2027 | 10.9 |
| Yonge North Subway Extension | Finch Station to Richmond Hill Centre | 2029-30 | 5.6 |
| Scarborough Subway Extension | Kennedy Station to Scarborough Town Centre | 2029-30 | 5.5 |
| Eglinton Crosstown West Extension | Mount Dennis to Pearson Airport | 2030-31 | 4.7 |
Ontario Gas Tax Program
Under the Ontario Gas Tax Program, the Province transfers a portion of the revenue raised from the provincial Gasoline Tax to municipalities. The objective of the program is to provide municipalities with “stable and predictable transit funding.”[22] Currently, the Province transfers the equivalent of two cents per litre of Gasoline Tax revenue to municipalities, which the FAO estimates will cost the Province $1.7 billion over the next five years.
Other Transit Infrastructure
The transit capital plan includes $8.6 billion over the next five years for rehabilitation of the GO Transit network, PRESTO, the capitalization of interest expense connected to capital projects, transfer payments to municipalities connected to the Public Transit Infrastructure Fund,[23] and other projects.
Objectives, Performance Measures and Outcomes
The Province plans to spend $29.2 billion in transit infrastructure over the next five years with the objectives to reduce congestion on roads and highways, contribute to a cleaner environment, improve “opportunities for families that live in underserved communities,” and to “allow people to get to and from work quickly and efficiently.”[24]
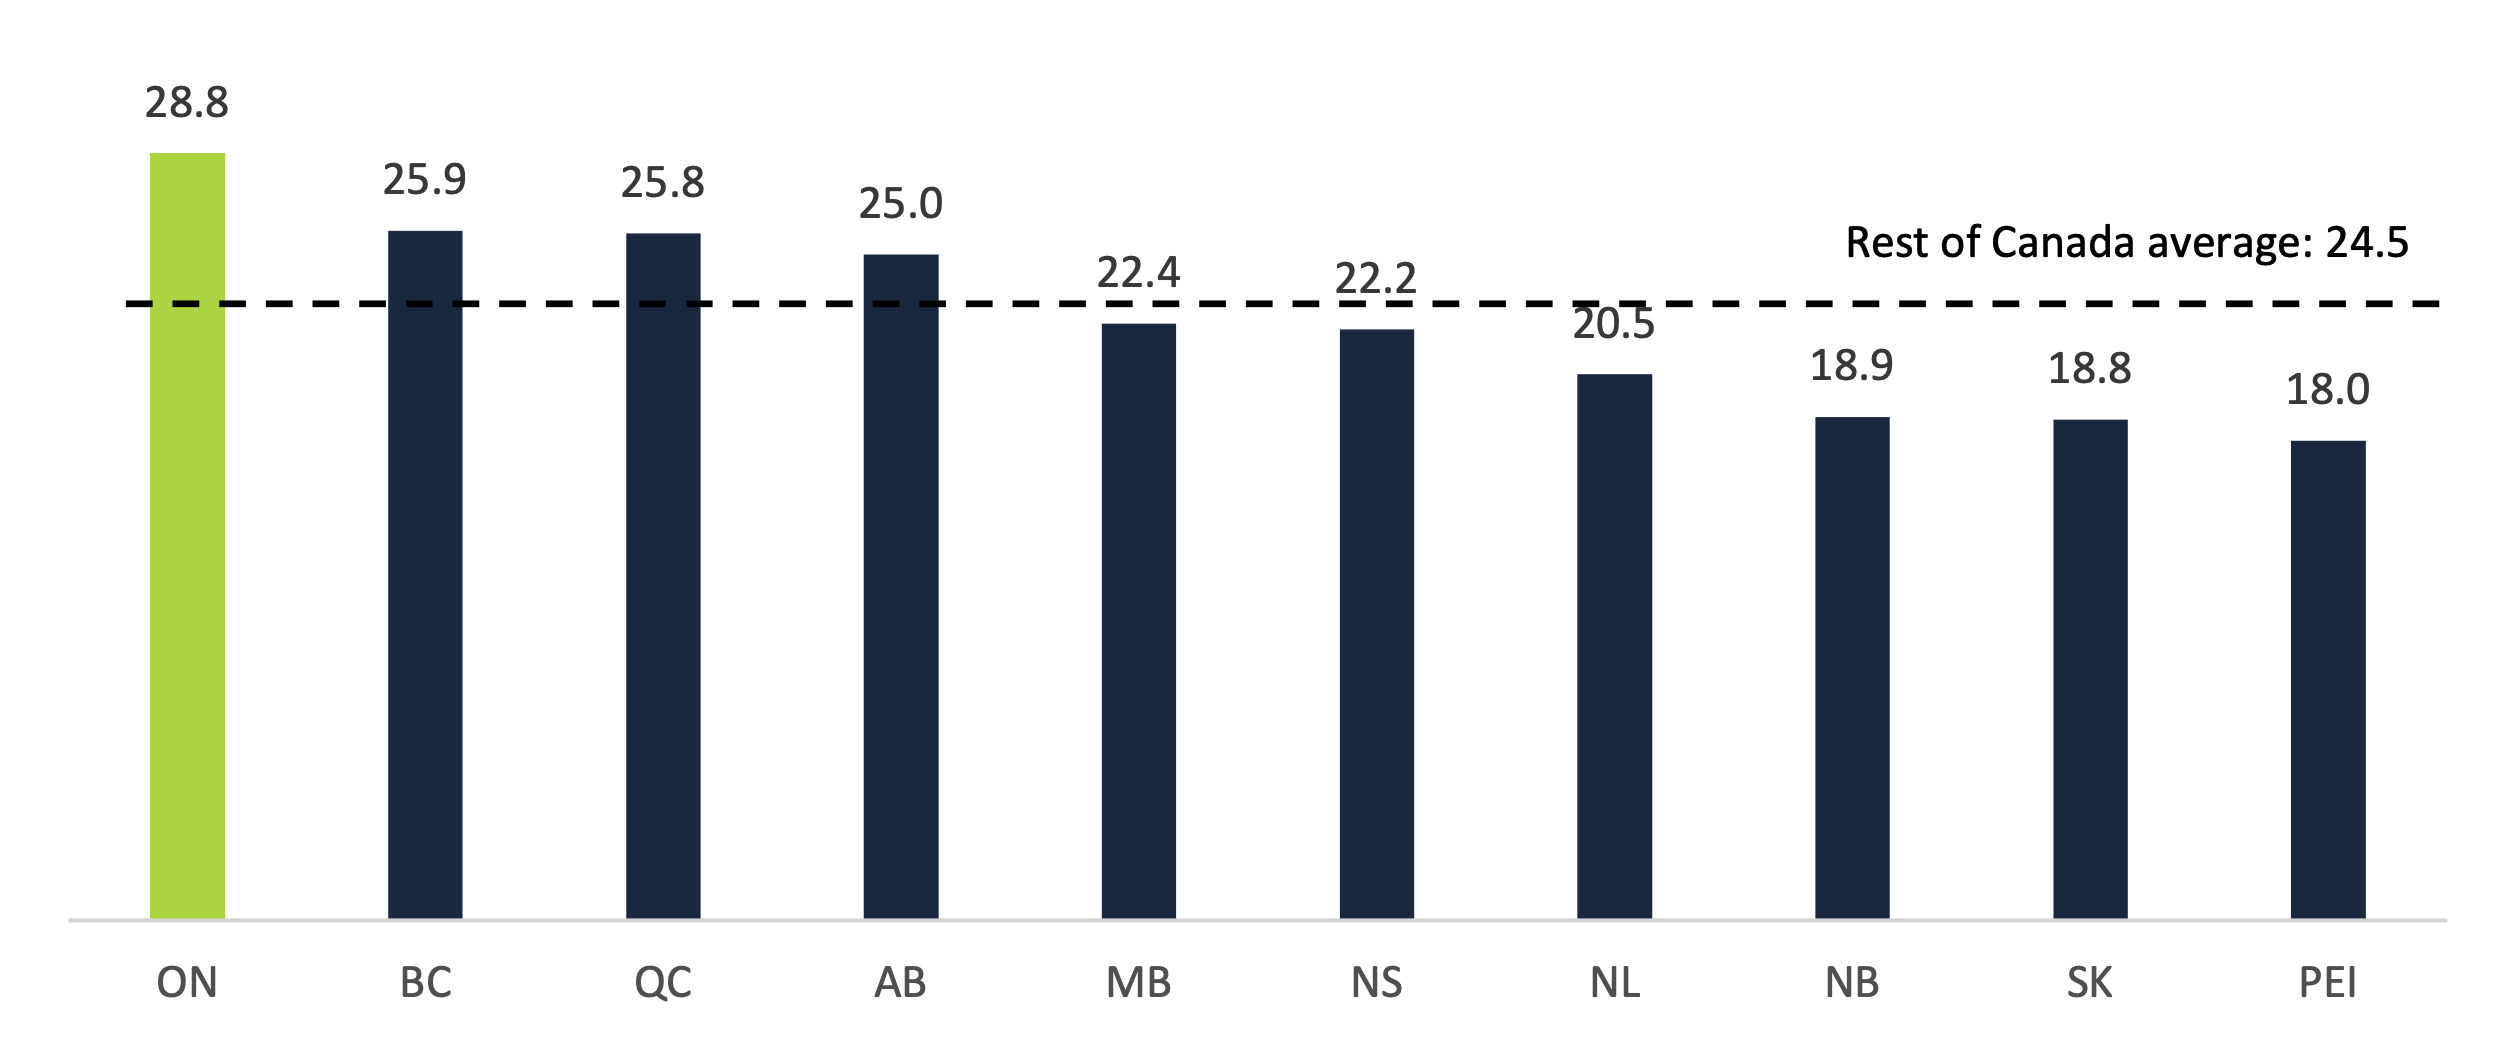
Ontarians have the longest average commute times[25] to work in Canada, spending an average of 28.8 minutes travelling to work, which is 18 per cent longer than the rest of Canada average.[26] In the GTHA, commuting to work by public transit takes an average of 50 minutes.
Long commute times result from traffic congestion and lead to lost productivity. A study by the C.D. Howe Institute estimates that traffic congestion in the GTHA costs $11 billion each year in lost productivity.[27] This was cited by the Province as a concern in the 2019 budget.[28]
The FAO requested information from the Ministry of Transportation on the performance measures and targets used by the ministry to evaluate the performance of the transit system. In response, the ministry identified three performance measures and targets. The three transit system performance targets for 2019 are:
- increasing the total number of public transit trips taken (i.e., total transit ridership) in Ontario from 931 million in 2017 to 973 million by 2019;
- increasing the total number of public transit trips taken per person from 80.5 in 2017 to 82.4 in 2019; and
- maintaining the average speed of commercial vehicles on the Province’s highways at 90 per cent of the speed limit or above.
| Performance Measure | 2014 | 2015 | 2016 | 2017 | 2019 |
|---|---|---|---|---|---|
| Results | Target | ||||
| Total Ontario transit ridership (millions) | 922 | 922 | 928 | 931 | 973 |
| Number of transit trips taken per person per year | 84.0 | 83.0 | 81.9 | 80.5 | 82.4 |
| Average travel speed of commercial vehicles (% of speed limit) | 94.3 | 94.3 | 94.1 | 93.2 | 90.0 |
Analysis
In the 2019 budget, the Province’s stated objectives for transit infrastructure spending were to reduce congestion on roads and highways, contribute to a cleaner environment, improve “opportunities for families that live in underserved communities,” and to “allow people to get to and from work quickly and efficiently.”[29] Despite these objectives, there are only three performance metrics used by the ministry to measure the effectiveness of the Province’s transit system.
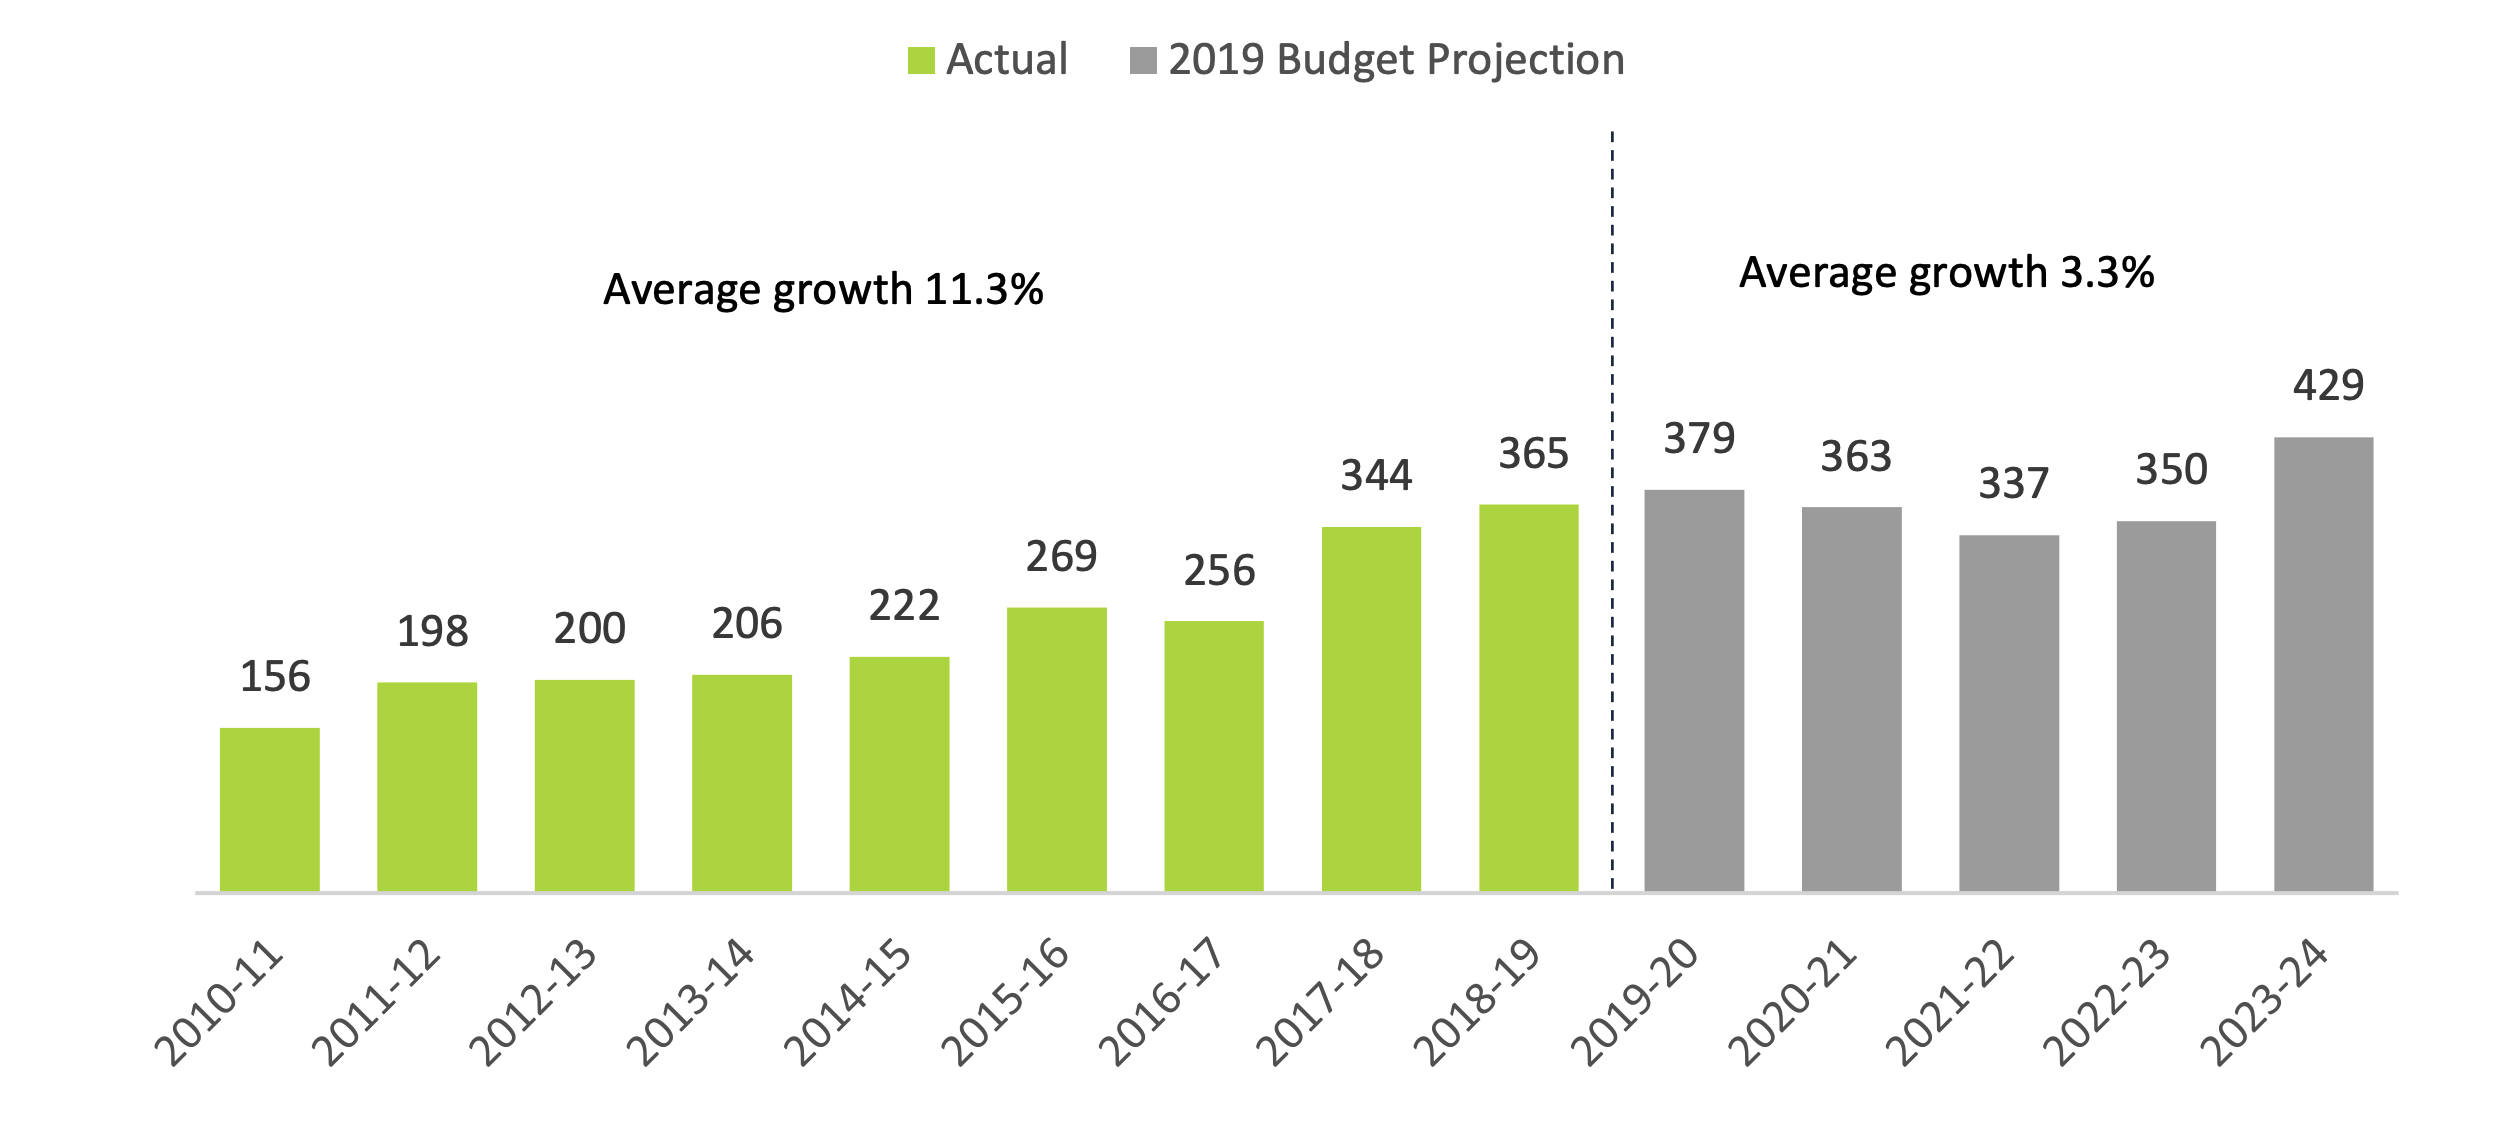
Since 2010-11, transit capital spending by the Province has increased significantly. Real per capita transit infrastructure spending (which adjusts for inflation and population growth) increased from $156 per person in 2010-11 to $365 per person in 2018-19, an average growth rate of 11.3 per cent per year. Going forward, over the next five years, annual real per capita transit infrastructure spending is expected to average about $370, which is higher than any year from 2010-11 to 2018-19. This five-year transit spending plan represents a material increase in transit infrastructure investment compared to the 2010-11 to 2018-19 period.
Transit capital spending per person, adjusted for inflation ($)
Source: FAO analysis of the Public Accounts of Ontario and the 2019 Ontario Budget.
Accessible version
This chart shows the actual transit capital spending per person from 2010-11 to 2018-19 and the projected transit capital spending per person from 2019-20 to 2023-24 in dollars, adjusted for inflation. The chart shows that the actual transit capital spending per person was $156 in 2010-11, $198 in 2011-12, $200 in 2012-13, $206 in 2013-14, $222 in 2014-15, $269 in 2015-16, $256 in 2016-17, $344 in 2017-18 and $365 in 2018-19. The chart shows that the projected transit capital spending per person is $379 in 2019-20, $363 in 2020-21, $337 in 2021-22, $350 in 2022-23 and $429 in 2023-24. This chart highlights that the average growth in actual transit capital spending was 11.3 per cent between 2010-11 and 2018-19, and the average growth in projected transit capital spending is 3.3 per cent between 2019-20 and 2023-24.
Overall, members of the Standing Committee on Estimates may wish to ask how the ministry plans to evaluate the effectiveness of its transit infrastructure spending over the next five years, given the Province’s objectives as stated in the 2019 budget.
Highways Capital Plan
2019 Budget Five-Year Highways Capital Plan
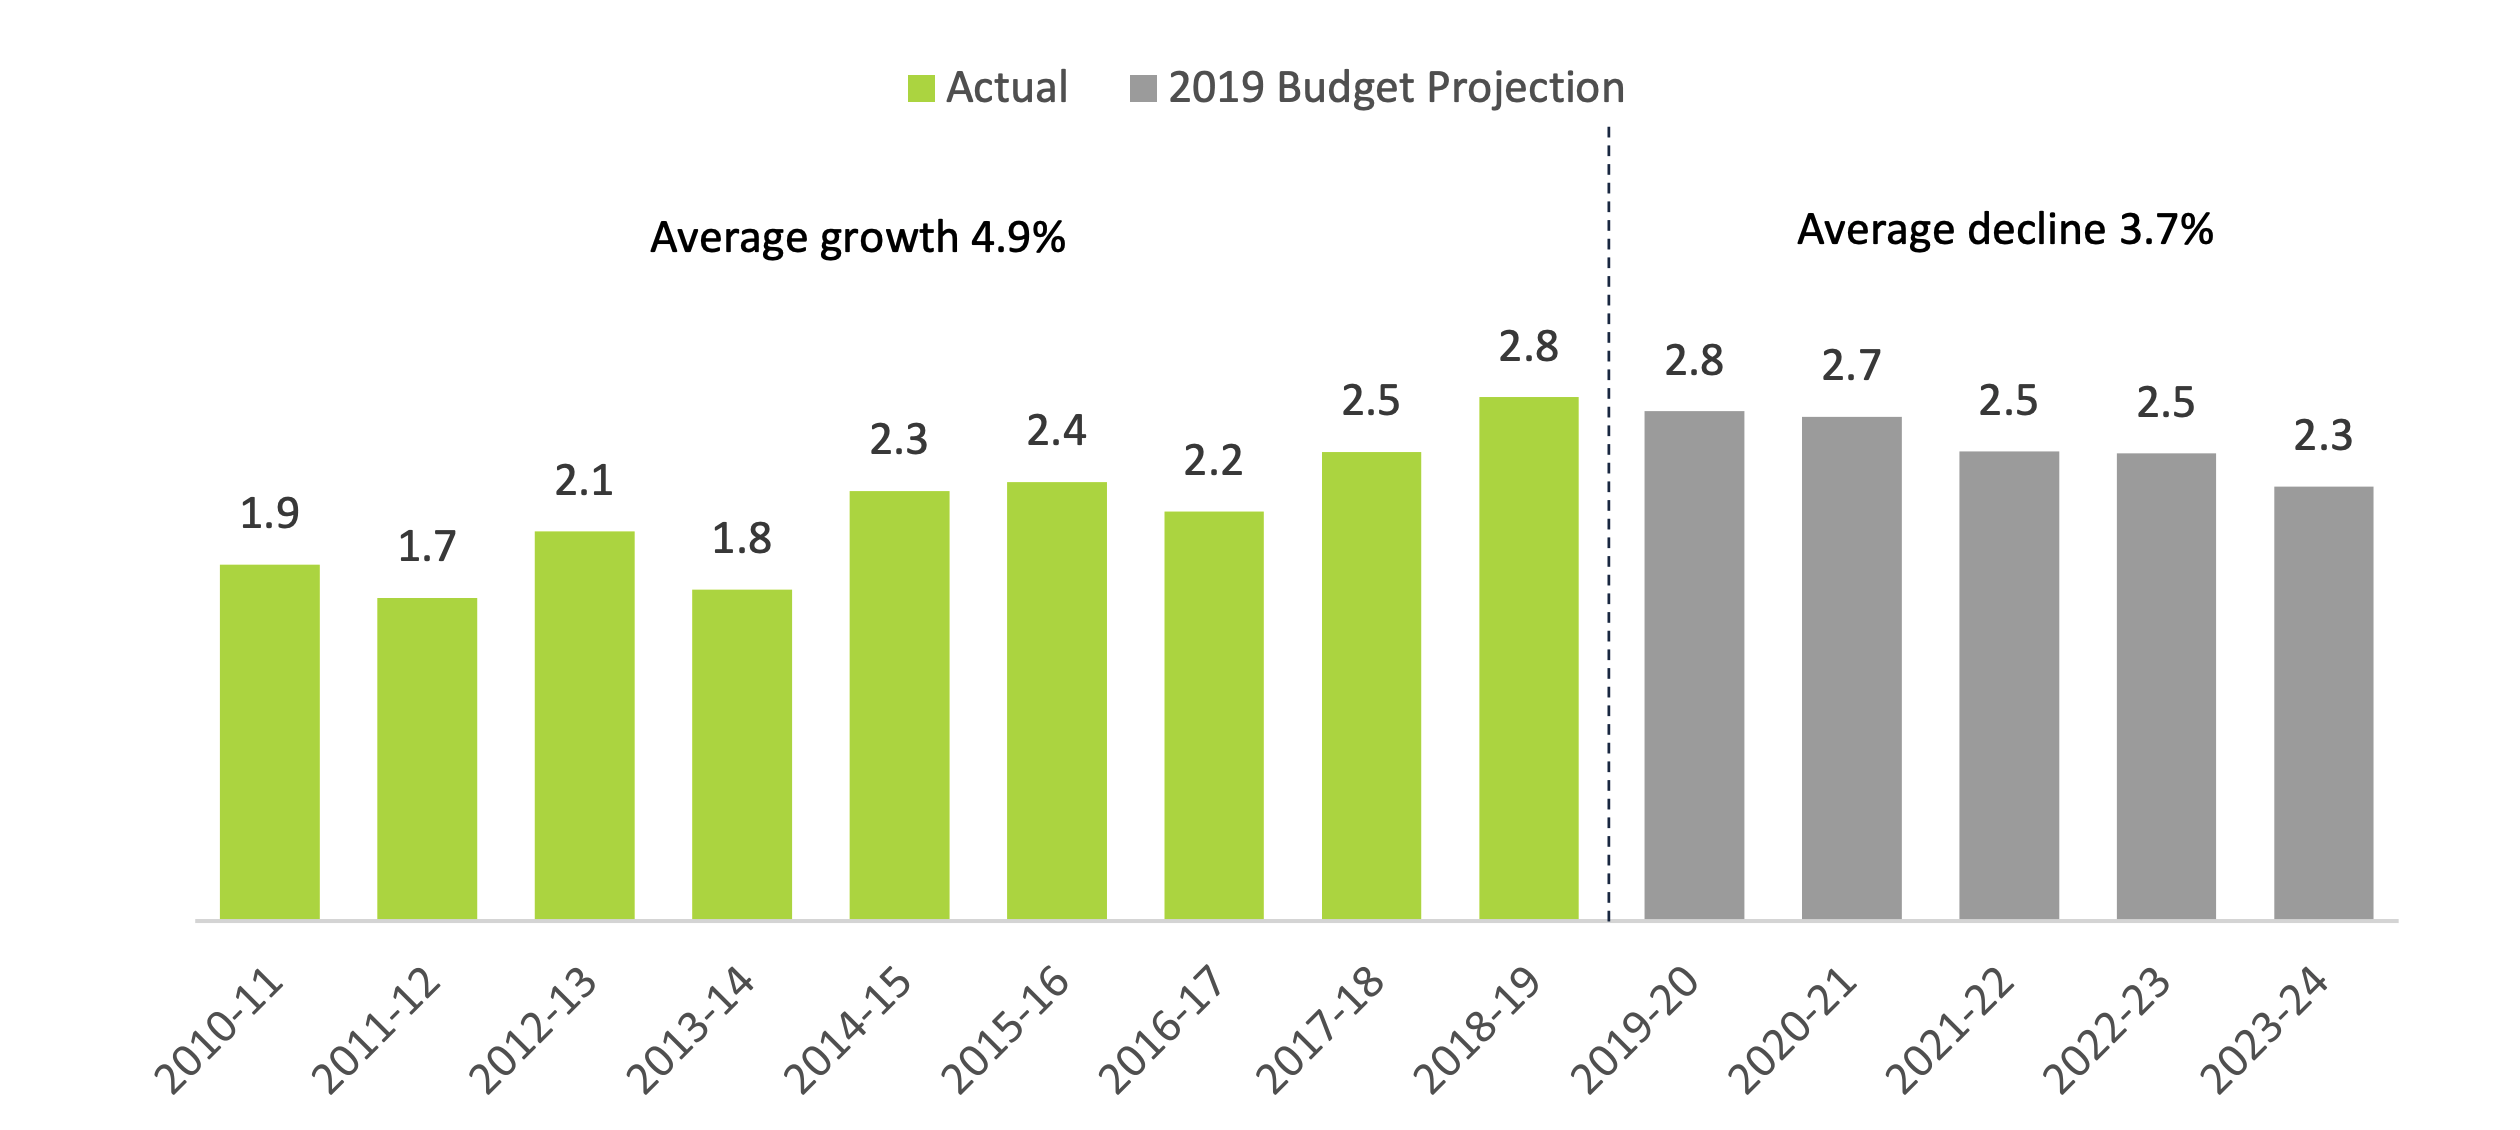
Over the next five years, the Province plans to reduce annual spending on highways infrastructure from $2.8 billion in 2019-20 to $2.3 billion in 2023-24, which is an annual average reduction of 3.7 per cent. In comparison, over the period from 2010-11 to 2018-19, highway infrastructure spending grew by an annual average of 4.9 per cent.
Highways capital spending, $ billions
Source: FAO analysis of the Public Accounts of Ontario and the 2019 Ontario Budget.
Accessible version
This chart shows the actual highways capital spending from 2010-11 to 2018-19 and the projected highways capital spending from 2019-20 to 2023-24 in billions of dollars. The chart shows that the highways capital spending was $1.9 billion in 2010-11, $1.7 billion in 2011-12, $2.1 billion in 2012-13, $1.8 billion in 2013-14, $2.3 billion in 2014-15, $2.4 billion in 2015-16, $2.2 billion in 2016-17, $2.5 billion in 2017-18 and $2.8 billion in 2018-19. The chart shows that the projected highways capital spending is $2.8 billion in 2019-20, $2.7 billion in 2020-21, $2.5 billion in 2021-22, $2.5 billion in 2022-23 and $2.3 billion in 2023-24. The chart highlights that the average growth in actual highways capital spending was 4.9 per cent between 2010-11 and 2018-19, and the average growth in projected highways capital spending is 3.7 per cent between 2019-20 and 2023-24.
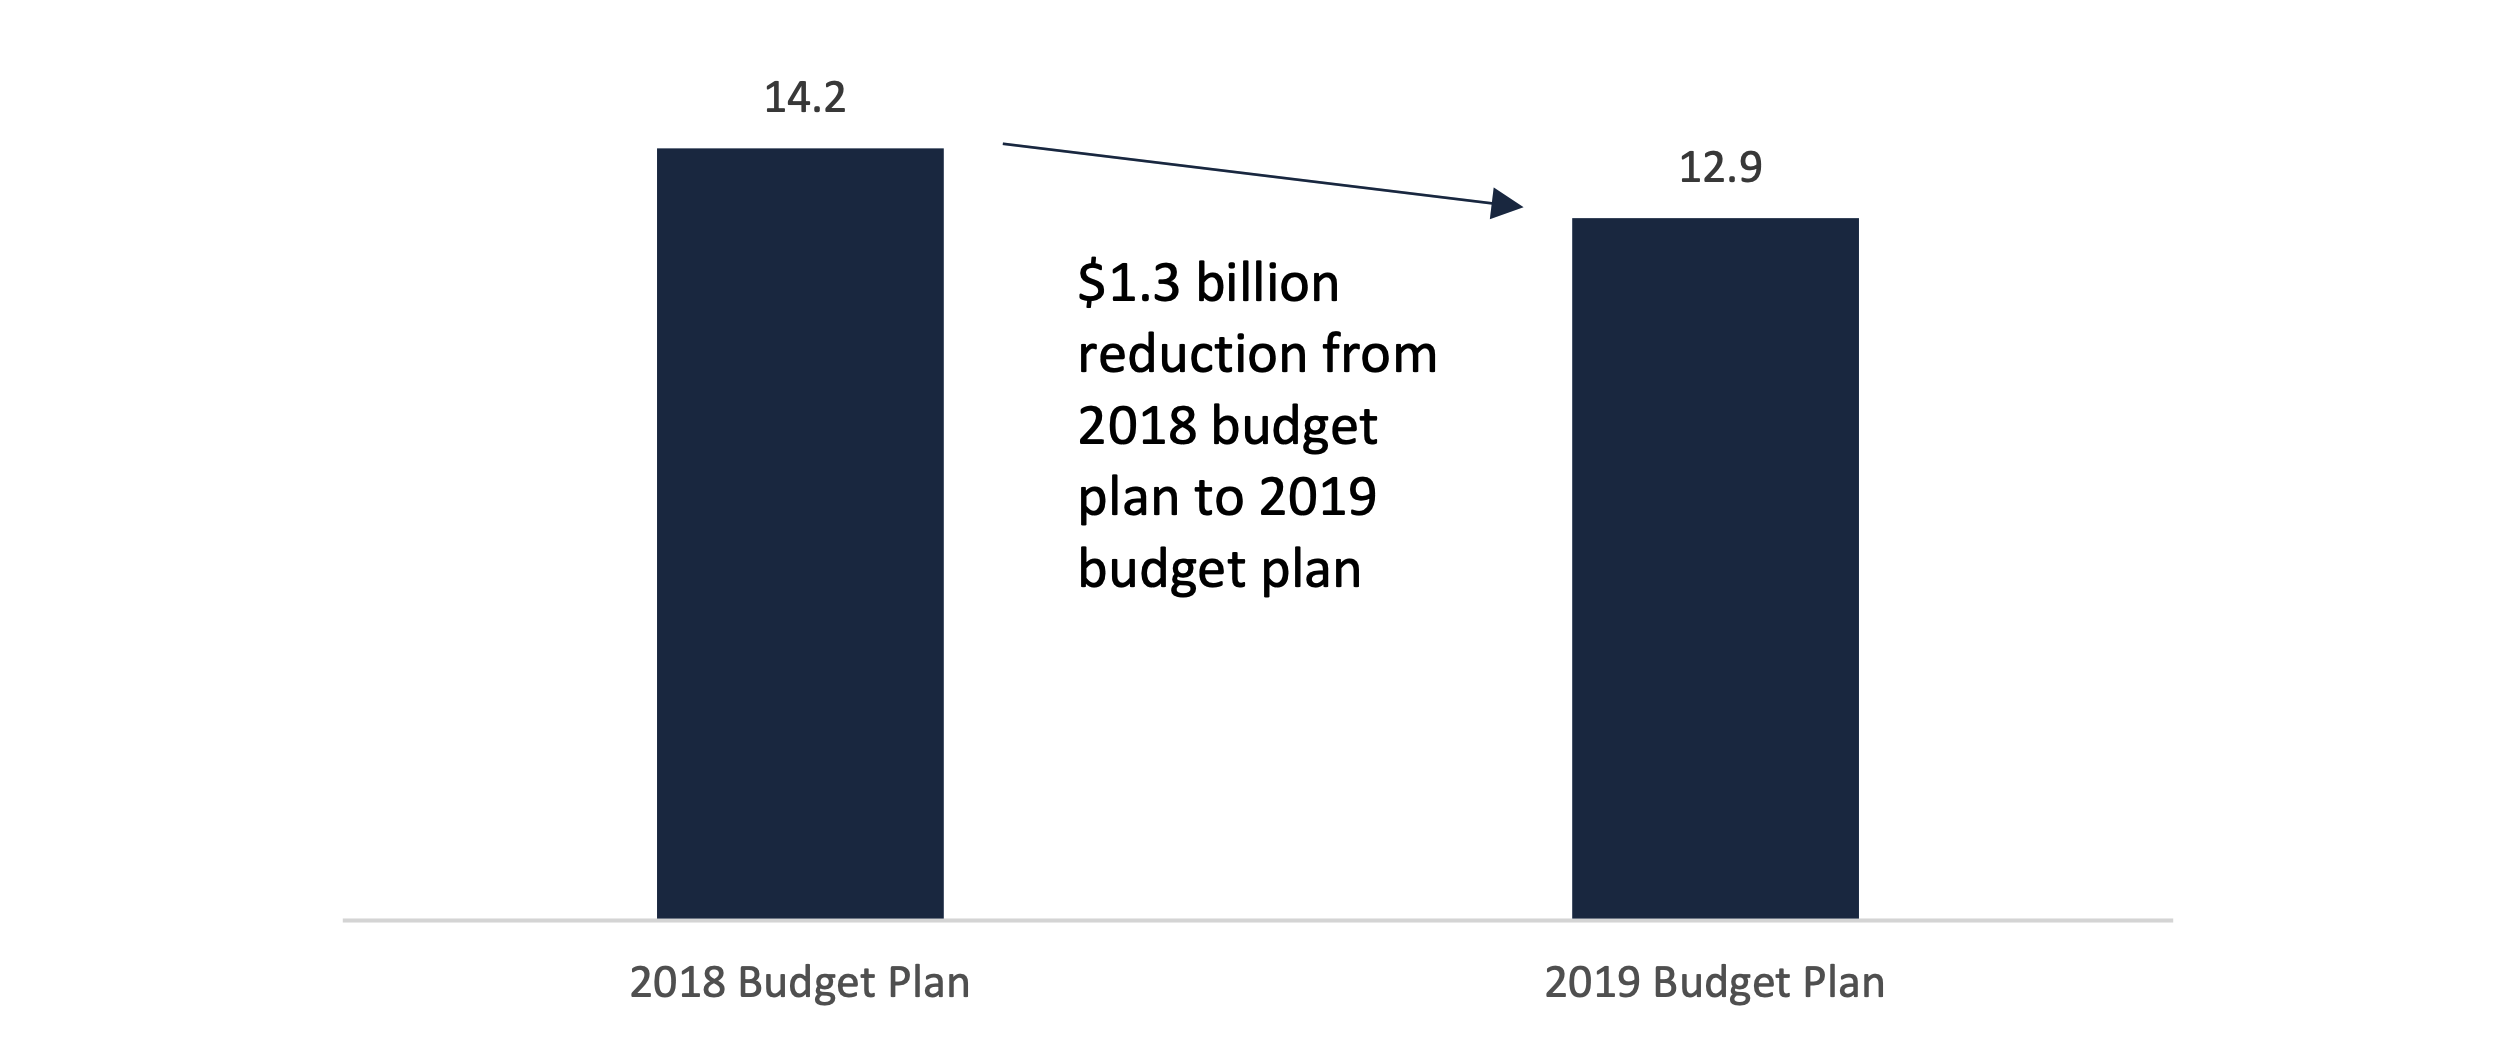
Spending in 2019 Budget Plan Lower than in 2018 Budget Plan
In the 2019 Ontario Budget, the Province projects $12.9 billion in highways capital spending from 2019-20 to 2023-24. This is approximately $1.3 billion, or nine per cent, lower than the 2018 budget’s planned spending of $14.2 billion over the same time period. The FAO estimates that the $1.3 billion reduction in planned highways infrastructure spending will not be reprofiled beyond the five-year period and will result in a permanent reduction in funding for highway rehabilitation and expansion projects.
Highways capital spending in 2019 budget compared to 2018 budget, 2019-20 to 2023-24, $ billions
Source: FAO analysis of the 2019 Ontario Budget and information provided by the Province.
Accessible version
This figure shows the projected highways capital spending from 2019-20 to 2023-24 as stated in the 2018 budget plan and the 2019 budget plan in billions of dollars. The figure shows that the 2018 budget plan highways capital spending projection was $14.2 billion and the highways capital spending projection from the 2019 budget plan is $12.9 billion. This chart highlights that there is a $1.3 billion reduction from the 2018 budget plan to the 2019 budget plan.
Key Components of the Highways Capital Plan
The highways capital spending plan over the next five years includes:
- $2.7 billion for highway expansion projects in southern Ontario, including:
- an 18 km Highway 401 expansion from Credit River in Mississauga to Milton;
- a 4.0 km expansion of Highway 427 between Finch Avenue and Highway 7, and a 6.6 km expansion from Finch Avenue to Major Mackenzie Drive;
- the Highway 407 East project, which includes a 22 km expansion and 10 km extension; and
- the Rt. Hon. Herb Gray Parkway in Windsor, connecting Highway 401 to the Interstate Highway System in Michigan.
- $4.8 billion for highway rehabilitation projects in southern Ontario. Rehabilitation can include resurfacing; intersection improvements; bridge, tunnel and culvert rehabilitation or replacement; the addition of carpool lots; and interchange improvements.
- $2.6 billion for highway rehabilitation and expansion projects in northern Ontario.
- $2.2 billion for remote air transportation and ferries, and highway project design and management.
- $0.5 billion in other transfers to municipalities and First Nations.
Objectives, Performance Measures and Outcomes
The Province plans to spend $12.9 billion on highway infrastructure over the next five years. Program objectives include making the province’s highways and roads “among the safest in the world,” ensuring that highways are reliable for users, and creating a highways network to “support the social and economic well-being of residents” and to “contribute to a higher quality of life.”[30]
As noted above, Ontarians have the longest average commute times[31] to work in Canada, spending an average of 28.8 minutes travelling to work, which is 18 per cent longer than the rest of Canada average.[32] In the GTHA, 71 per cent of residents commute to work by car, with an average commute time of 30 minutes.
The FAO requested information from the Ministry of Transportation on the performance measures and targets used by the ministry to evaluate the performance of the highways system. In response, the ministry identified five performance measures and targets. The five highways system performance targets for 2019 are:
- maintaining the rate of fatalities on the Province’s highways below 8.0 per 100,000 drivers;[33]
- after snow or ice storms, clearing pavements within the maximum time limit[34] at least 90 per cent of the time;
- keeping at least 67 per cent of highway pavements and 85 per cent of bridges in good condition; and
- maintaining the average speed of commercial vehicles on highways to at least 90 per cent of the speed limit.
| Performance Measures | 2014 | 2015 | 2016 | 2017 | 2019 |
|---|---|---|---|---|---|
| Results | Target | ||||
| Highway Safety: | |||||
| Fatalities per 100,000 licensed drivers | 5.3 | 5.4 | 5.8 | 5.8 | 8.0 |
| Pavements cleared after storms within a maximum time limit* (% cleared within time) | 92 | 97 | 97 | 97 | 90 |
| Highway Quality: | |||||
| Share of highway pavements in good condition (% of total) | 81 | 81 | 69** | 83 | 67 |
| Share of bridges in good condition (% of total) | 86 | 87 | 86 | 85 | 85 |
| Highway Mobility & Congestion: | |||||
| Average travel speed of commercial vehicles (% of speed limit) | 94.3 | 94.3 | 94.1 | 93.2 | 90.0 |
Analysis
The performance of Ontario’s highways system currently exceeds the Province’s targets, in some cases by a wide margin. For example, the ministry’s performance target of eight fatalities per 100,000 licensed drivers in 2019 is higher than the number of fatalities per 100,000 licensed drivers in every year since 2002.
On the other hand, as noted above, Ontario drivers face the longest commute times to work in Canada, which is not a metric used by the ministry to assess highway program performance.
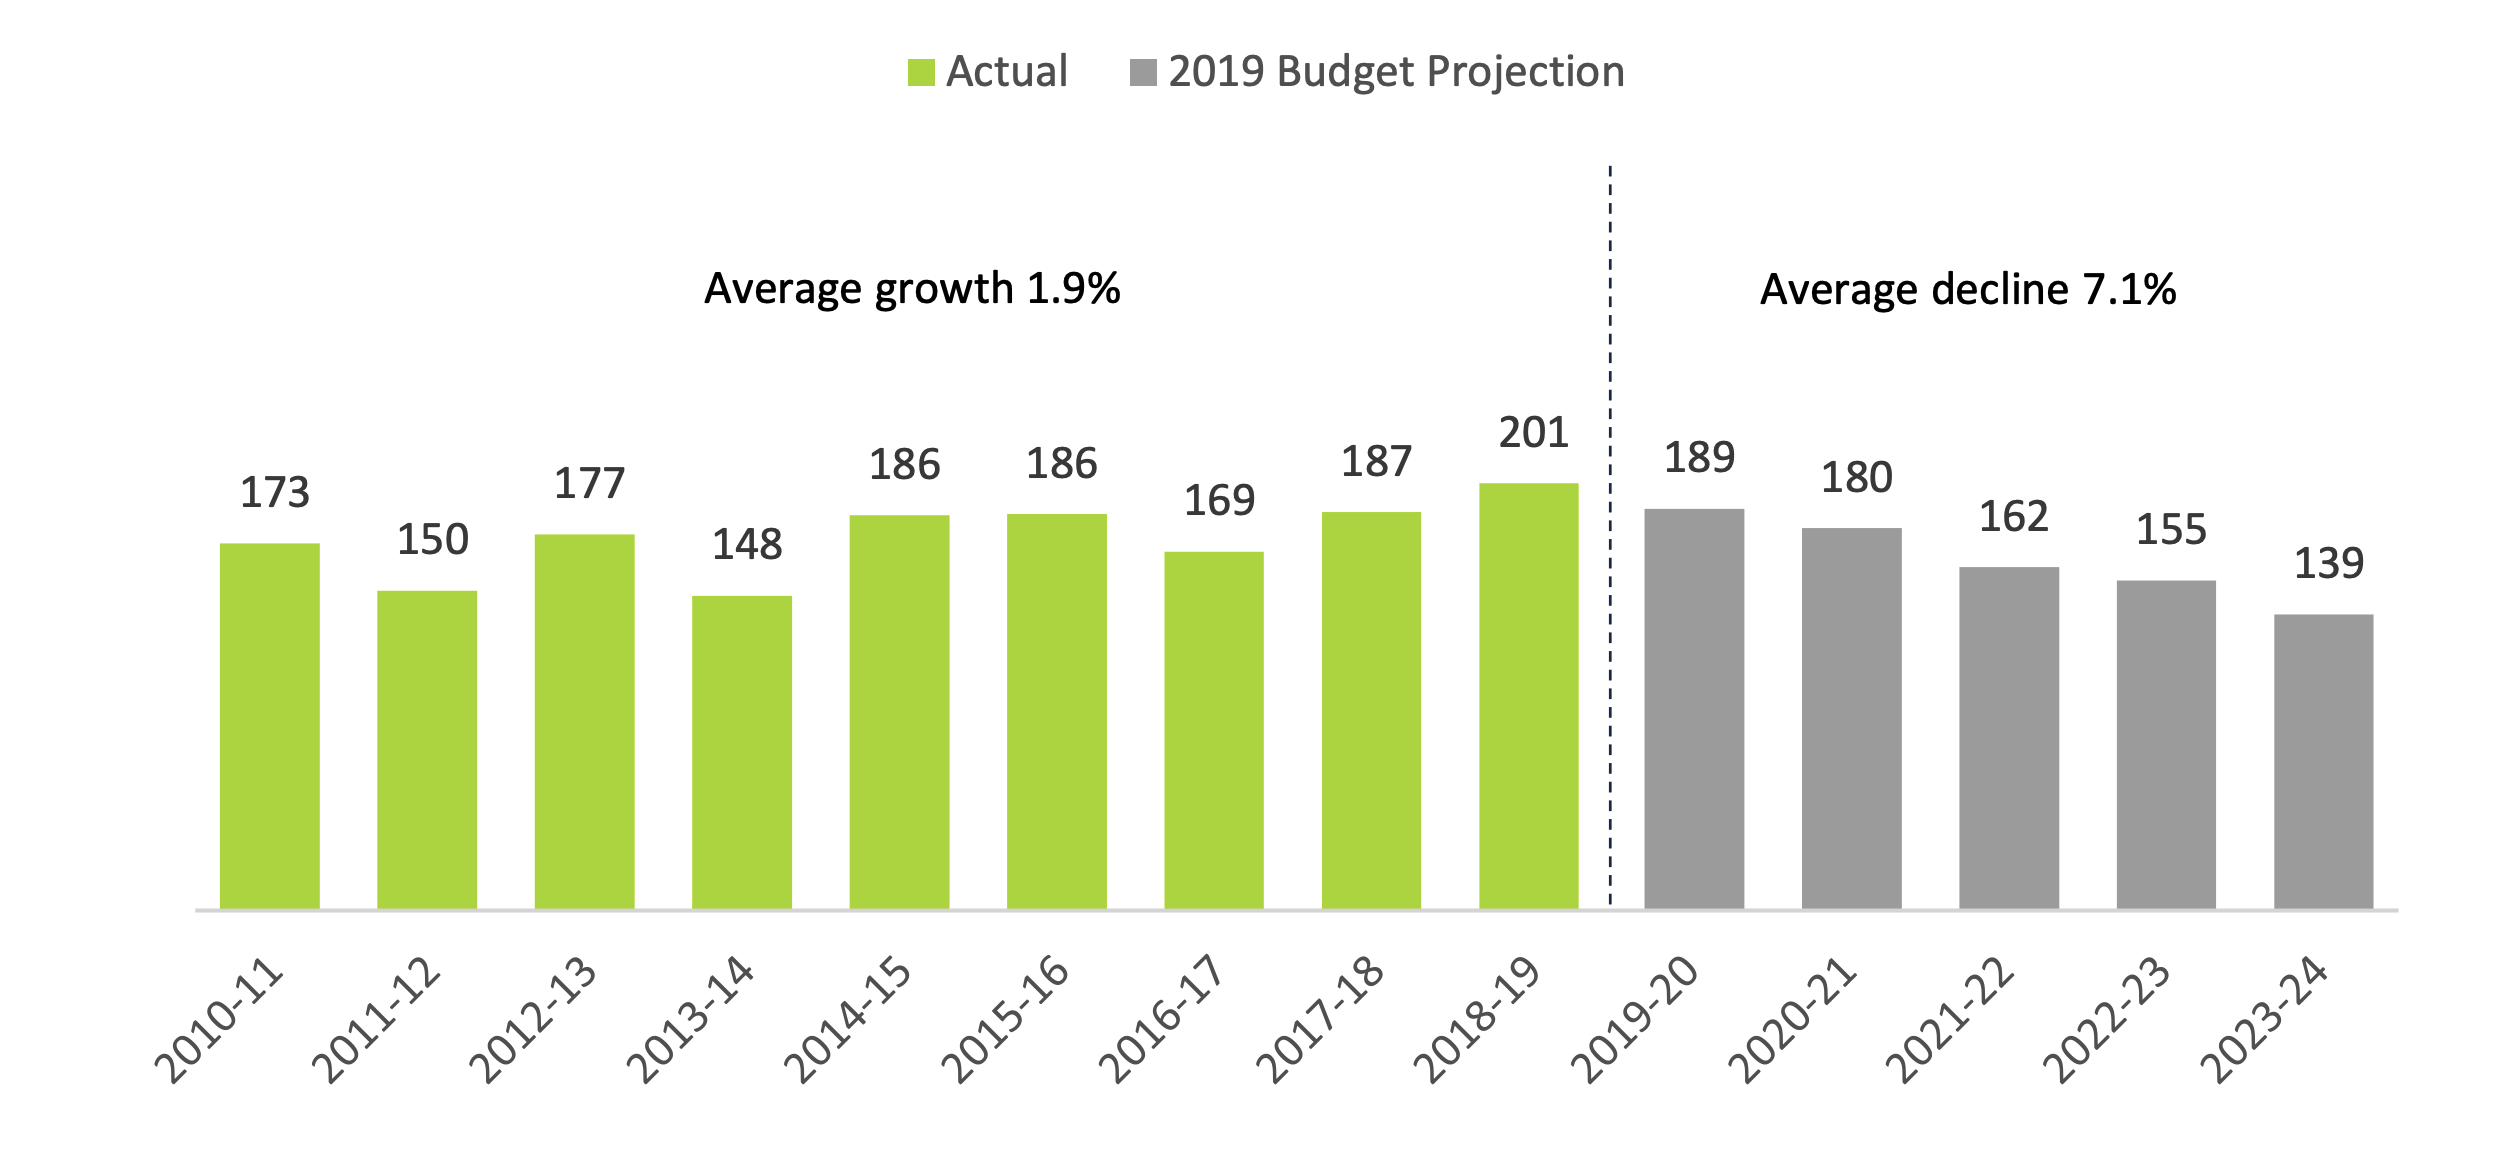
On a real per capita basis, which adjusts for inflation and population growth, highways capital spending increased from $173 per person in 2010-11 to $201 per person in 2018-19, representing average annual growth of 1.9 per cent. Going forward, over the five-year budget plan, real per capita spending on highways infrastructure is projected to decline every year. By 2023-24, the Province plans to spend $139 per person (adjusted for inflation) on highways infrastructure, the lowest level in over 13 years. Overall, the five-year highways spending plan represents a material decrease in highways infrastructure investment compared to the previous five-year period.
Highways capital spending per person, adjusted for inflation ($)
Source: FAO analysis of the Public Accounts of Ontario and the 2019 Ontario Budget.
Accessible version
This chart shows the actual highways capital spending per person from 2010-11 to 2018-19 and the projected highways capital spending per person from 2019-20 to 2023-24 in dollars, adjusted for inflation. The chart shows that the actual highways capital spending per person was $173 in 2010-11, $150 in 2011-12, $177 in 2012-13, $148 in 2013-14, $186 in 2014-15, $186 in 2015-16, $169 in 2016-17, $187 in 2017-18 and $201 in 2018-19. The chart shows that the projected highways capital spending per person is $189 in 2019-20, $180 in 2020-21, $162 in 2021-22, $155 in 2022-23 and $139 in 2023-24. This chart highlights that the average growth in actual highways capital spending was 1.9 per cent between 2010-11 and 2018-19, and the average growth in projected highways capital spending is 7.1 per cent between 2019-20 and 2023-24.
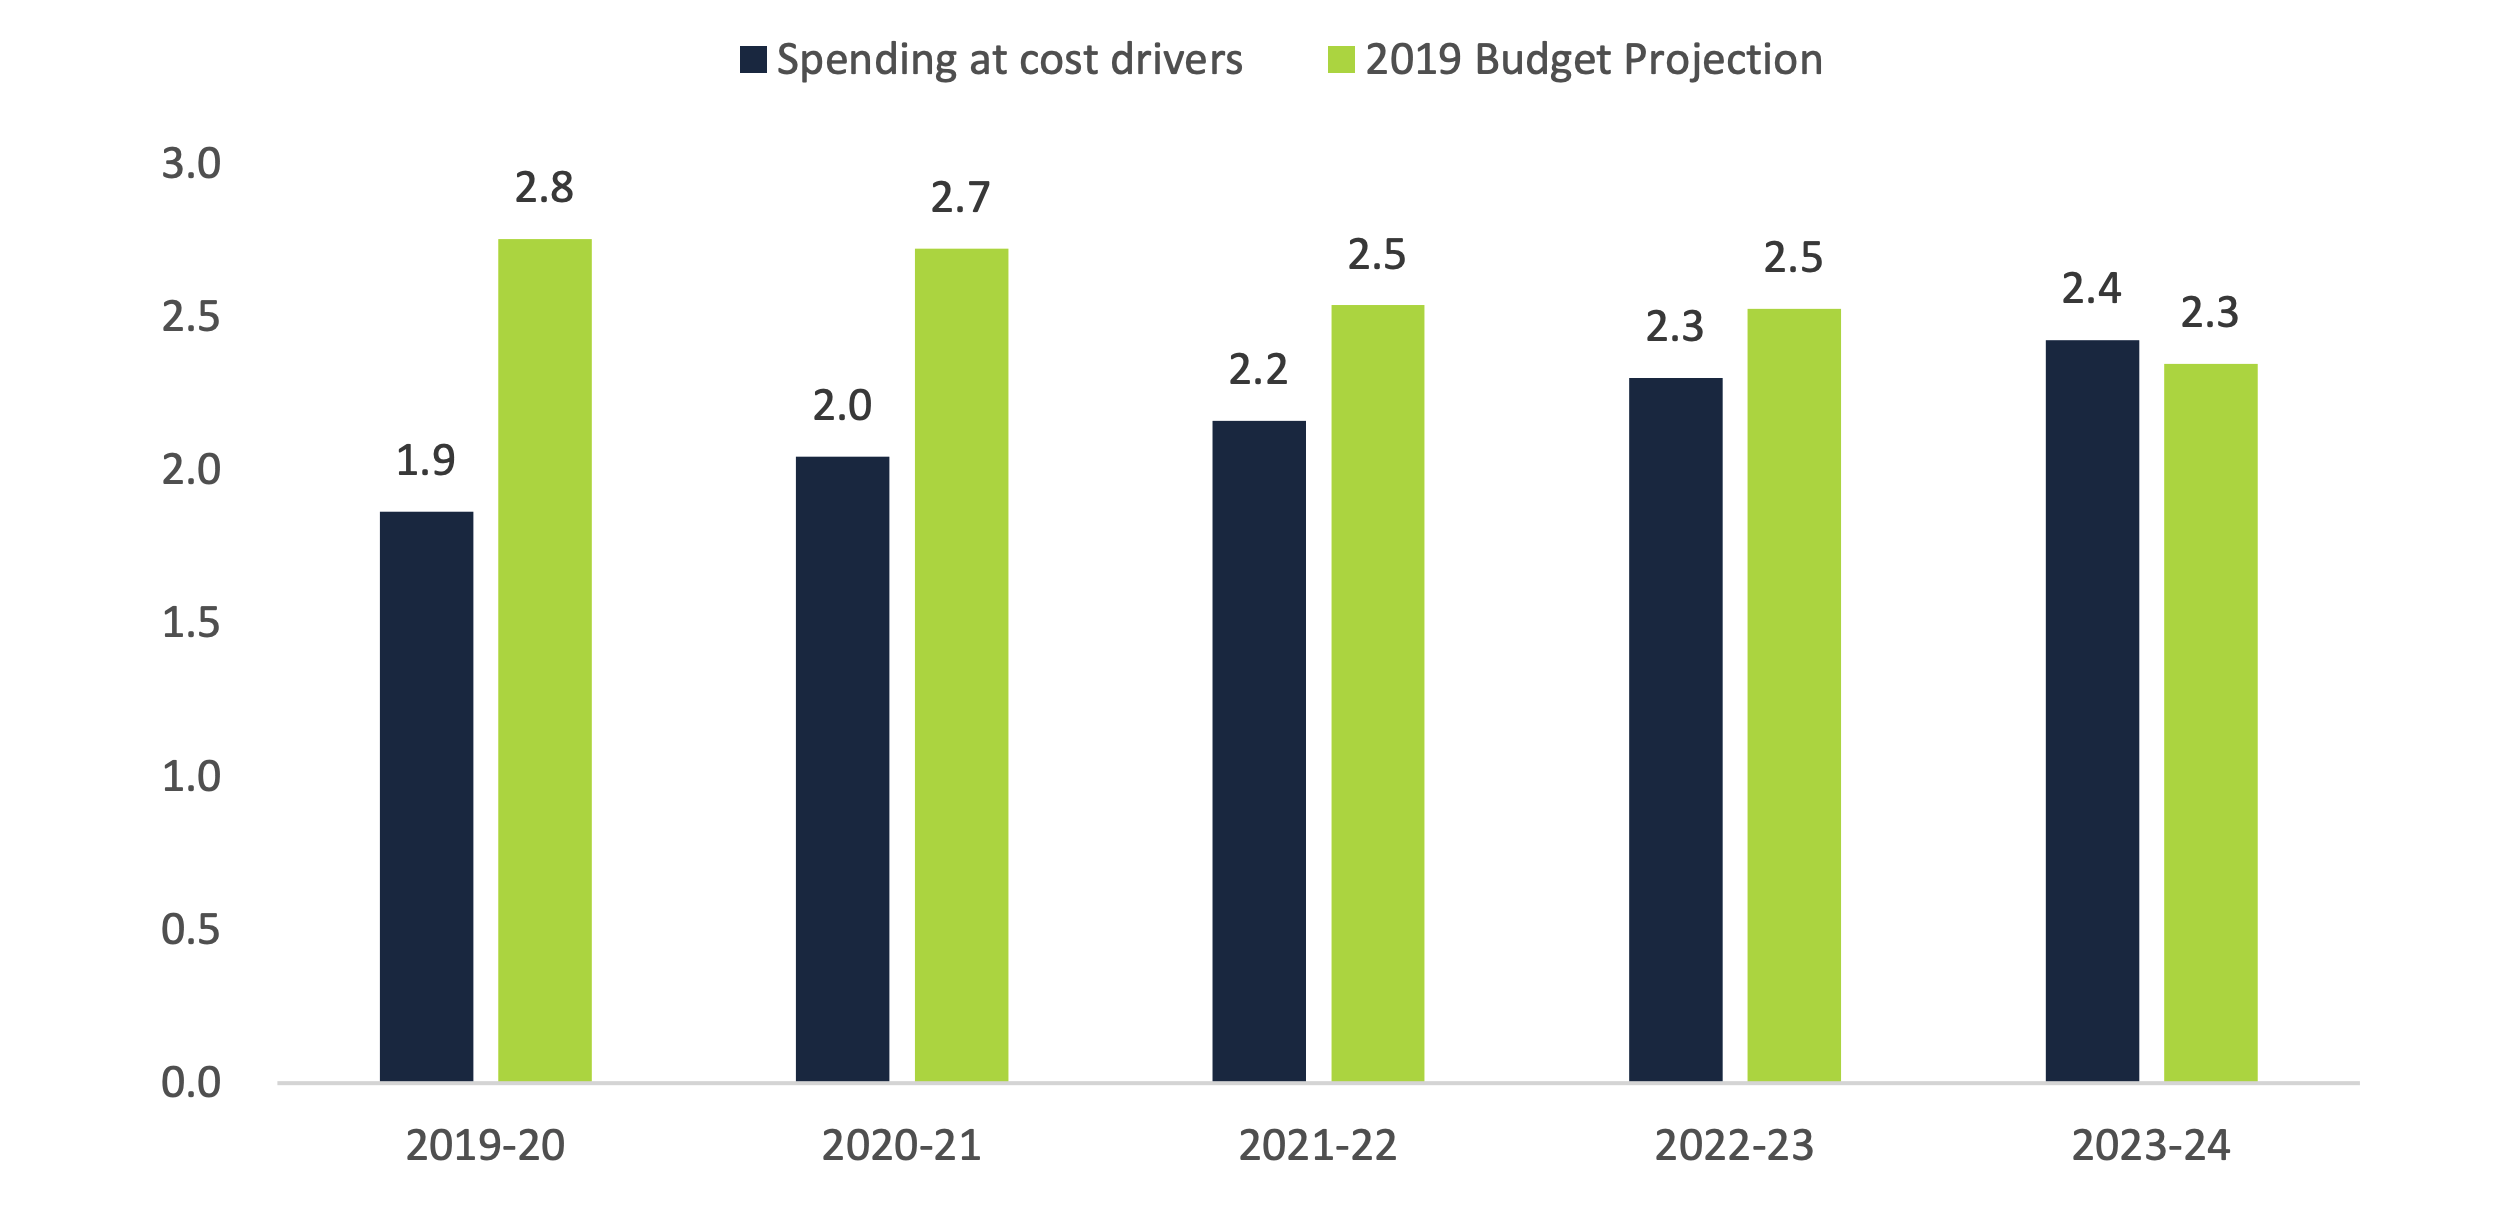
Another way to review the Province’s highways infrastructure plan is by comparing spending to cost drivers. The FAO considers the core cost drivers of highways infrastructure spending to be the driving-age population and price inflation.[35] As Ontario’s driving-age population grows, the number of vehicles on the road rises, increasing the demand for highway capacity. Similarly, the cost of expanding and rehabilitating highways increases with price inflation.
From 2019-20 to 2023-24, the FAO projects the number of vehicles in Ontario to grow by an average of 1.9 per cent a year,[36] mainly reflecting growth in the driving age population from about 11.9 million in 2018 to 13.0 million in 2023 (1.7 per cent average annual growth). In addition, over this time period, price inflation is projected to average 1.9 per cent per year.
Based on the core cost drivers of the driving-age population and price inflation, the FAO developed a model to estimate the annual investment in highways infrastructure (both rehabilitation and expansion) required to maintain the current service level of the Province’s highways system. In other words, the annual infrastructure investment projected by the FAO’s core cost drivers model is an approximation of the investment required to maintain the status quo.[37]
Based on the FAO’s core cost driver model, the ministry’s planned spending on highways infrastructure over the first four years of the 2019 budget plan exceeds the spending required to maintain the highways system status quo by a total of about $2.2 billion. In 2023-24, planned spending by the ministry falls short of the spending required to meet the core cost drivers by about $0.1 billion. Overall, this implies that the investment in highways infrastructure over the next five years should be enough to maintain current service levels.
Highways capital spending compared to core cost drivers, $ billions
Source: FAO analysis based on information from Statistics Canada, the Ministry of Finance and the Ministry of Transportation.
Accessible version
This figure shows the projected highways capital spending according to the 2019 budget plan compared to projected core cost drivers from 2019-20 to 2023-24, in billions of dollars. The chart shows that core cost drivers are projected to be $1.9 billion in 2019-20, $2.0 billion in 2020-21, $2.2 billion in 2021-22, $2.3 billion in 2022-23 and $2.4 billion in 2023-24. The chart shows that highways capital spending is projected to be $2.8 billion in 2019-20, $2.7 billion in 2020-21, $2.5 billion in 2021-22, $2.5 billion in 2022-23 and $2.3 billion in 2023-24.
4 | Program Review
This chapter reviews requested and projected spending for the Ministry of Transportation’s 2019-20 Expenditure Estimates by program vote (Supply Bill spending), standalone legislation (statutory) spending, and other spending (consolidation and other adjustments).
Vote 2701 – Ministry Administration Program
The Ministry Administration Program supports the delivery of all programs and services offered by the Ministry of Transportation. The total spending request for Vote 2701 (expense and asset) is down $1 million, or 2.1 per cent versus last year’s request. Salaries and wages expense is estimated to increase by $2 million. However, this spending increase is more than offset by fewer asset investments in the land and marine fleet, which is down $4 million versus last year’s request.
| Vote Item | Ministry Administration Program (vote 2701) |
2018-19 Estimates $ millions |
2019-20 Estimates $ millions |
1 YR Change $ millions |
1 YR Growth (%) |
5 YR Average Historical Growth (%) |
|---|---|---|---|---|---|---|
| 1 | Business Support | |||||
| Salaries and wages | 18 | 20 | 2 | 11.4 | 3.3 | |
| Services | 38 | 38 | 0 | 0.5 | 12.8 | |
| Recoveries | -24 | -24 | -0 | -1.5 | NA | |
| Other net spending | 19 | 19 | 0 | 1.3 | 34.2 | |
| Total Supply Expense Vote | 51 | 53 | 2 | 4.2 | 4.6 |
| Vote Item | Ministry Administration Program (vote 2701) |
2018-19 Estimates $ millions |
2019-20 Estimates $ millions |
1 YR Change $ millions |
1 YR Growth (%) |
5 YR Average Historical Growth (%) |
|---|---|---|---|---|---|---|
| 3 | Ministry Administration | |||||
| Land and marine fleet | 20 | 17 | -4 | -18.0 | 4.0 | |
| Total Supply Asset Vote | 20 | 17 | -4 | -18.0 | 4.0 |
Vote 2702 – Policy and Planning
The Policy and Planning program mainly provides funding to Metrolinx and municipalities for investments in transit capital projects. At $5.1 billion, Vote 2702 accounts for 85 per cent of Supply Bill expense for the Ministry of Transportation in 2019-20. The overall spending request for Vote 2702 is down by $1.3 billion, or 20.1 per cent versus last year. There are three main sub-programs (items) in Vote 2702:
- Policy and Planning (<$0.1 billion)
- Urban and Regional Transportation – operating ($0.3 billion)
- Urban and Regional Transportation – capital ($4.7 billion)
Policy and Planning
Requested spending for the Policy and Planning sub-program (item 1) is $37 million, which is down $2 million, or 6.0 per cent versus last year. This sub-program largely includes spending for salaries and wages and services. The lower requested spending for 2019-20 is mostly due to lower services expense,[38] which is down $2 million, or almost 14 per cent versus last year.
Urban and Regional Transportation – operating
Requested spending for the Urban and Regional Transportation – operating sub-program (item 2) is $326 million, which is down $181 million, or almost 36 per cent versus last year. The lower requested spending for 2019-20 results from a number of changes, including:
- A $184 million (or 36 per cent) decrease in Metrolinx Operating Subsidies.
- Savings of $142 million from the cancellation of five programs that were funded through the Greenhouse Gas Reduction Account (GGRA).[39]
| Cancelled Programs | 2018-19 Requested Spending ($ millions) |
|---|---|
| Electric Vehicle Education and Awareness | 5 |
| Transportation Demand Management Funding Program | 1 |
| Green Commercial Vehicle Program | 25 |
| GGRA – Other | 8 |
| Electric Vehicle Incentive and Infrastructure Program | 103 |
| Total Savings | 142 |
- Requested spending for salaries and wages and services is down about $19 million in 2019-20 compared to 2018-19.
- Requested spending for the Ontario Seniors Public Transit Tax Credit is down about $6 million compared to 2018-19. This lower spending request is due to a revised estimate for the cost of the program and does not reflect a change to the program.
- Lower requested spending is partly offset by $174 million in cost increases due to lower recoveries. The lower recoveries in 2019-20 largely reflect the cancellation of the cap and trade program. Under the cap and trade program, revenue raised through the sale of greenhouse gas emission allowances was used to offset the cost of programs intended to reduce greenhouse gas emissions through the GGRA.[40]
Urban and Regional Transportation – capital
Requested spending for the Urban and Regional Transportation – capital sub-program (item 3) is $4.7 billion, which is down $1.1 billion, or 18.8 per cent versus last year.
For 2019-20, this sub-program consists of only one $4.7 billion transfer payment program called Public Transit. It is expected that of the $4.7 billion, $3.9 billion will be allocated to Metrolinx to fund provincial transit projects and $0.9 billion will be allocated to municipalities for municipal transit projects.[41]
Requested funding for the Public Transit transfer payment program is down a net $1.6 billion compared to 2018-19. This change consists of $1.7 billion in lower funding to Metrolinx for capital projects,[42] partially offset by an estimated increase of $0.1 billion for payments to municipalities, which is mostly due to the Public Transit Infrastructure Fund.[43]
There was also savings of $524 million in 2019-20 from the cancellation of four programs that were funded through the GGRA.[44]
| Cancelled Programs | 2018-19 Requested Spending ($ millions) |
|---|---|
| Cycling Infrastructure | 41 |
| Regional Express Rail | 435 |
| Electric Vehicle and Public Charging Infrastructure | 45 |
| GGRA – Other | 2 |
| Total | 524 |
Finally, the savings achieved from the lower spending in the Public Transit transfer payment program and the four cancelled programs is partially offset by a $1.0 billion cost increase due to lower recoveries. The lower recoveries in 2019-20 reflect the cancellation of the cap and trade program[45] and the repeal of the Trillium Trust Act, 2014.[46] For more information, see the “Other Spending” section below.
| Vote Item | Policy and Planning (vote 2702) |
2018-19 Estimates $ millions |
2019-20 Estimates $ millions |
1 YR Change $ millions |
1 YR Growth (%) |
5 YR Average Historical Growth (%) |
|---|---|---|---|---|---|---|
| 1 | Policy and Planning | |||||
| Salaries and wages | 20 | 20 | -0 | -0.6 | 2.9 | |
| Services | 16 | 14 | -2 | -13.9 | 0.5 | |
| Other spending | 3 | 3 | 0 | 1.2 | -1.3 | |
| Total Item | 39 | 37 | -2 | -6.0 | 1.6 | |
| 2 | Urban and Regional Transportation – operating | |||||
| Electric Vehicle Education and Awareness | 5 | 0 | -5 | -100.0 | NA | |
| Transportation Demand Management Funding Program | 1 | 0 | -1 | -100.0 | NA | |
| Green Commercial Vehicle Program | 25 | 0 | -25 | -100.0 | NA | |
| GGRA – Other | 8 | 0 | -8 | -100.0 | NA | |
| Community Transportation Grant Program | 3 | 0 | -3 | -100.0 | NA | |
| Electric Vehicle Incentive and Infrastructure Program | 103 | 0 | -103 | -100.0 | -100.0 | |
| Metrolinx Operating Subsidies | 505 | 321 | -184 | -36.4 | 11.0 | |
| Ontario Seniors Public Transit Tax Credit | 10 | 4 | -6 | -63.1 | NA | |
| Participation and Awareness Grants | 0 | 0 | 0 | 0.0 | -0.4 | |
| Salaries and wages | 7 | 1 | -6 | -88.4 | NA | |
| Services | 14 | 0 | -13 | -98.6 | NA | |
| Recoveries | -174 | 0 | 174 | 100.0 | NA | |
| Other spending | 1 | 0 | -1 | -91.5 | NA | |
| Total Item | 507 | 326 | -181 | -35.7 | 9.7 | |
| 3 | Urban and Regional Transportation – capital | |||||
| Public Transit | 6,335 | 4,740 | -1,594 | -25.2 | 15.1 | |
| Cycling Infrastructure | 41 | 0 | -41 | -100.0 | NA | |
| Regional Express Rail | 435 | 0 | -435 | -100.0 | NA | |
| Electric Vehicle and Public Charging Infrastructure | 45 | 0 | -45 | -100.0 | NA | |
| GGRA – Other | 2 | 0 | -2 | -100.0 | NA | |
| Recoveries | -1,021 | 0 | 1,021 | 100.0 | NA | |
| Total Item | 5,837 | 4,740 | -1,097 | -18.8 | 15.1 | |
| Total Supply Expense Vote | 6,384 | 5,103 | -1,281 | -20.1 | 14.6 |
Vote 2703 – Road User Safety Program
The Road User Safety Program is responsible for road safety and oversees the delivery of vehicle licensing in Ontario. Overall, the $151 million spending request for Vote 2703 (expense and asset) is down $13 million, or 8.1 per cent versus last year. The spending decrease is mostly due to lower services expense, which is down $10 million, or nearly 20 per cent versus last year. Also, investment in business application software is expected to be down $5 million, or nearly 14 per cent. These spending decreases are partially offset by increased salaries and wages expense, which is up $3 million, or 4.3 per cent.
| Vote Item | Road User Safety Program (vote 2703) |
2018-19 Estimates $ millions |
2019-20 Estimates $ millions |
1 YR Change $ millions |
1 YR Growth (%) |
5 YR Average Historical Growth (%) |
|---|---|---|---|---|---|---|
| 1 | Road User Safety | |||||
| Community Safety Grants | 0 | 0 | 0 | 0.0 | -28.5 | |
| Research Grants | 0 | 0 | 0 | 0.0 | NA | |
| Salaries and wages | 65 | 67 | 3 | 4.3 | 1.7 | |
| Services | 52 | 41 | -10 | -19.9 | 4.6 | |
| Recoveries | -7 | -8 | -1 | -18.6 | NA | |
| Other spending | 15 | 16 | 1 | 6.4 | 0.5 | |
| Total Supply Expense Vote | 125 | 117 | -8 | -6.3 | 0.9 |
| Vote Item | Road User Safety Program (vote 2703) |
2018-19 Estimates $ millions |
2019-20 Estimates $ millions |
1 YR Change $ millions |
1 YR Growth (%) |
5 YR Average Historical Growth (%) |
|---|---|---|---|---|---|---|
| 3 | Road User Safety | |||||
| Business application software | 40 | 34 | -5 | -13.8 | -3.3 | |
| Total Supply Asset Vote | 40 | 34 | -5 | -13.8 | -3.3 |
Vote 2704 – Provincial Highways Management Program
The Provincial Highways Management Program oversees the provincial highway network, which includes maintenance, rehabilitation and expansion.[47] The program is also responsible for remote airports in northern Ontario, ferry services, First Nations roads funding and other transportation initiatives. Total program spending (expense and assets) for Vote 2704 is up $88 million, or 3.2 per cent versus last year.
There are three main sub-programs (items) in Vote 2704:
- Operations and Maintenance ($0.6 billion)
- Engineering and Construction ($0.1 billion)
- Transportation Infrastructure Assets ($2.2 billion)
Operations and Maintenance
Requested spending for the Operations and Maintenance sub-program (item 1) is $563 million, which is up $60 million or nearly 12 per cent versus last year.
Most of this requested spending increase is due to services expense, which is up $74 million, or 18 per cent versus last year. Services expense includes maintenance costs on the provincial highway network, such as for snow removal and filling potholes. The spending increase due to higher services costs is partially offset by lower expenses for supplies and equipment (included in other spending), which is down $19 million, or nearly 60 per cent versus last year.
Engineering and Construction
Requested spending for the Engineering and Construction sub-program (item 2) is $107 million, which is up $6 million, or 6.0 per cent versus last year.
This sub-program includes multiple programs that fund various transportation infrastructure projects. Combined, these programs are expected to total $73 million in 2019-20, which is down $23 million, or 24 per cent versus last year. Most of this funding decrease is due to lower funding for Highway 407 Municipal, which is down $22 million, or 47 per cent. Also, there was $10 million in funding for Prescott Russell Road 17 last year, but no funding requested for this year.
The $23 million in reduced funding for the programs noted above is expected to be more than offset by $25 million in additional expense due to fewer recoveries and $4 million in additional services expense.
Transportation Infrastructure Assets
Requested spending for the Transportation Infrastructure Assets sub-program (item 3) is $2.2 billion, which is up $22 million, or 1.0 per cent versus last year.
This sub-program includes capital asset investments related to the rehabilitation and expansion of the Province’s southern highway network and other transportation infrastructure assets. Spending on transportation infrastructure in this sub-program is expected to be down $60 million, or 2.4 per cent versus last year, while spending on land is expected to be down $58 million, or 31 per cent.
While total spending on capital assets is projected to be down by $137 million in this sub-program, overall spending is expected to increase by $22 million. The difference is due to lower recoveries, which are projected to increase spending by $160 million. The lower recoveries in 2019-20 reflect lower transfers from other ministries, the cancellation of the cap and trade program, and the repeal of the Trillium Trust Act, 2014. (For more information, see the “Other Spending” section below.)
| Vote Item | Provincial Highways Management Program (vote 2704) |
2018-19 Estimates $ millions |
2019-20 Estimates $ millions |
1 YR Change $ millions |
1 YR Growth (%) |
5 YR Average Historical Growth (%) |
|---|---|---|---|---|---|---|
| 1 | Operations and Maintenance | |||||
| Municipal Ferries | 4 | 6 | 2 | 63.0 | 12.4 | |
| Payments in lieu of municipal taxation | 6 | 6 | 0 | 0.0 | -4.1 | |
| Salaries and wages | 72 | 75 | 3 | 4.0 | 3.9 | |
| Services | 413 | 487 | 74 | 18.0 | 11.8 | |
| Recoveries | -44 | -44 | -0 | -0.2 | NA | |
| Other spending | 52 | 33 | -19 | -37.1 | -3.8 | |
| Total Item | 503 | 563 | 60 | 11.9 | 7.6 | |
| 2 | Engineering and Construction | |||||
| Municipal Ferries | 0 | 11 | 11 | NA | NA | |
| Highway 407 Municipal | 47 | 25 | -22 | -47.2 | 67.9 | |
| Connecting Links | 30 | 30 | 0 | 0.0 | NA | |
| Prescott Russell Road 17 | 10 | 0 | -10 | -100.0 | -100.0 | |
| First Nations | 6 | 6 | 0 | 0.0 | 12.9 | |
| Community and Environmental Improvements | 2 | 1 | -1 | -72.2 | 17.1 | |
| Highway 401 Municipal | 1 | 0 | -1 | -100.0 | NA | |
| Town of Essex | 1 | 1 | 0 | 0.0 | NA | |
| Services | 9 | 12 | 4 | 40.5 | 3.5 | |
| Recoveries | -25 | 0 | 25 | 100.0 | NA | |
| Other spending | 22 | 22 | 1 | 3.5 | 92.4 | |
| Total Item | 101 | 107 | 6 | 6.0 | 19.9 | |
| Total Supply Expense Vote | 604 | 670 | 66 | 10.9 | 9.1 |
| Vote Item | Provincial Highways Management Program (vote 2704) |
2018-19 Estimates $ millions |
2019-20 Estimates $ millions |
1 YR Change $ millions |
1 YR Growth (%) |
5 YR Average Historical Growth (%) |
|---|---|---|---|---|---|---|
| 3 | Transportation Infrastructure Assets | |||||
| Land | 187 | 129 | -58 | -31.0 | -22.4 | |
| Buildings | 27 | 18 | -9 | -32.4 | -2.7 | |
| Transportation infrastructure | 2,510 | 2,450 | -60 | -2.4 | -0.3 | |
| Machinery and equipment | 3 | 2 | -1 | -40.6 | 4.6 | |
| Business application software | 15 | 10 | -5 | -33.3 | 8.6 | |
| Land and marine fleet | 67 | 62 | -5 | -7.2 | 121.9 | |
| Recoveries | -678 | -518 | 160 | 23.5 | -1.0 | |
| Total Supply Asset Vote | 2,130 | 2,153 | 22 | 1.0 | -2.8 |
Vote 2705 – Labour and Transportation Cluster
The Labour and Transportation Cluster program is responsible for information and technology (IT) services for the Ministries of Labour and Transportation. Overall, the $59 million spending request for Vote 2705 is up $2 million, or 4.2 per cent versus last year. Most of this spending increase is due to higher salaries and wages expense, which is up $2 million, or 6.7 per cent versus last year.
| Vote Item | Labour and Transportation Cluster (vote 2705) |
2018-19 Estimates $ millions |
2019-20 Estimates $ millions |
1 YR Change $ millions |
1 YR Growth (%) |
5 YR Average Historical Growth (%) |
|---|---|---|---|---|---|---|
| 1 | Information and Information Technology Services | |||||
| Salaries and wages | 29 | 31 | 2 | 6.7 | 2.6 | |
| Services | 62 | 62 | -1 | -1.2 | 19.6 | |
| Recoveries | -39 | -39 | 1 | 1.8 | NA | |
| Other spending | 5 | 5 | 0 | 10.1 | 4.1 | |
| Total Supply Expense Vote | 57 | 59 | 2 | 4.2 | 0.9 |
Standalone Legislation
Ministry of Transportation spending authorized by standalone legislation is projected to increase by $71 million, or 7.2 per cent versus last year. The spending increase is due to higher amortization expense on the provincial highway network and other transportation infrastructure assets.
| Standalone Legislation (Statutory) Spending |
2018-19 Estimates $ millions |
2019-20 Estimates $ millions |
1 YR Change $ millions |
1 YR Growth (%) |
5 YR Average Historical Growth (%) |
|---|---|---|---|---|---|
| Amortization | 1,002 | 1,074 | 72 | 7.2 | 7.6 |
| Recoveries | -16 | -16 | -0 | -2.5 | -6.4 |
| Total standalone legislation spending | 986 | 1,058 | 71 | 7.2 | 7.6 |
Other Spending
Overall, other spending is projected to increase by $768 million in 2019-20 compared to 2018-19, an increase of nearly 30 per cent.
In 2019-20, other spending includes a net negative $2.2 billion adjustment for Metrolinx, the net result of a positive operating adjustment of $0.8 billion and negative capital adjustment of $3.0 billion.[48]
The operating adjustment of $0.8 billion reflects Metrolinx funding a portion of its operating expenses from its own revenues, such as GO Transit fares. This adjustment is expected to increase by $0.1 billion, or 21 per cent versus last year, which implies that Metrolinx will have to self-fund more of its operating spending.
The negative capital adjustment of $3.0 billion is to account for investments in capital assets made by Metrolinx, offset by amortization expense. This adjustment is expected to increase other spending by $1.8 billion, or nearly 38 per cent versus last year, mostly because the ministry estimates that it will provide $1.7 billion less in funding to Metrolinx in 2019-20 for its investments in capital assets.
Other spending also includes $338 million for the Ontario Gas Tax Program, which is projected to increase by $17 million, or 5.3 per cent versus last year.
Finally, other spending is down a combined $1.2 billion as a result of the cancellation of the cap and trade program and the repeal of the Trillium Trust Act, 2014.
Under the cap and trade program, revenue raised through the sale of greenhouse gas emission allowances was used to fund programs intended to reduce greenhouse gas emissions through what was called the Greenhouse Gas Reduction Account (GGRA).[49] In 2018-19, funding of $697 million was allocated to over nine programs in three sub-programs (vote-items): Urban and Regional Transportation – Operating (2702-2), Urban and Regional Transportation – Capital (2702-3), and Transportation Infrastructure Assets (2704-3). With the cancellation of the cap and trade program, most of the programs funded by cap and trade revenues through the GGRA have been cancelled, resulting in savings in 2019-20 for the Ministry of Transportation of approximately $697 million.[50]
Under the Trillium Trust program, revenue raised from the sale of provincial assets was to be used to fund infrastructure investments.[51] In total, the Province allocated a net $6.5 billion from asset sales to the Trillium Trust, as a result of the following transactions:
- the sale of General Motors shares;
- the partial sale of Hydro One;
- the sale of LCBO property;
- the sale of Hydro One Brampton; and
- the sale of OPG head office properties.
As of the end of 2018-19 (March 31, 2019), the Province had spent $0.8 billion of the $6.5 billion allocated to the Trillium Trust on infrastructure investments, leaving $5.7 billion remaining to be spent on infrastructure projects. However, on April 1, 2019, the Trillium Trust Act, 2014 was repealed and the Trillium Trust account was closed. Therefore, of the $6.5 billion in funding raised by the Province, $0.8 billion was invested in infrastructure projects and the remaining $5.7 billion was applied to improve the Province’s budget balance in the years 2014-15 through 2018-19. For MTO, the cancellation of the Trillium Trust program results in $522 million in lower spending in 2019-20, compared to 2018-19. This lower spending is mostly reflected in the $1.6 billion reduction in 2019-20 to the Public Transit transfer payment program in the Urban and Regional Transportation – Capital sub-program (vote-item 2702-3).
| Other Spending | 2018-19 Estimates $ millions |
2019-20 Estimates $ millions |
1 YR Change $ millions |
1 YR Growth (%) |
5 YR Average Historical Growth (%) |
|---|---|---|---|---|---|
| Metrolinx – operating | 659 | 800 | 141 | 21.3 | 9.8 |
| Metrolinx – capital | -4,841 | -3,011 | 1,830 | 37.8 | -10.4 |
| Ontario Gas Tax Program | 321 | 338 | 17 | 5.3 | 1.2 |
| Greenhouse Gas Reduction Account Spending (also called the Cap and Trade Wind Down Account) | 697 | 0 | -697 | -100.0 | NA |
| Trillium Trust Spending | 522 | 0 | -522 | -100.0 | NA |
| Total other spending | -2,641 | -1,873 | 768 | 29.1 | -13.0 |
5 | Appendices
Appendix A: Understanding Consolidation Adjustments
What are consolidation adjustments?
Accounting consolidation is the process of combining financial data from several subsidiaries or business entities within an organization and rolling it up to a parent organization for reporting purposes. The Province has a number of subsidiaries, agencies or entities, such as school boards, hospitals and Metrolinx, which are consolidated into the Province’s financial statements.
These consolidated entities are at arms-length from the Province. In other words, they can raise their own funds and spend money without legislative approval, and they report their own set of financial statements. However, they still receive provincial funding and are under provincial control, so the financial results of these entities are consolidated and reported in the Ontario Budget and the Public Accounts.[52]
Why have consolidation adjustments?
The Expenditure Estimates present financial information on both a consolidated and non-consolidated basis. This is because a constitutional and legal distinction is required between spending “public money” raised through taxation and other sources, and spending money raised by a consolidated entity.[53] For example, any transfer of funds from a ministry to a consolidated entity is a use of public money, so this expense needs to be separately reported in the Estimates and approved through the Supply Act.
However, the Estimates are prepared to reconcile with total spending as reported in the Ontario Budget and the Public Accounts, which reports expenses from the final use perspective (i.e., from the perspective of the consolidated entity). Therefore, if the consolidated entity (such as Metrolinx or school boards) reports total spending that is different than the amount of funds received from the Province through transfer payments, then a “consolidation adjustment” is required.[54]
How are financial results consolidated?
In the case of Metrolinx, the Ministry of Transportation transferred $3.7 billion to the agency in transfer payments in 2017-18. However, Metrolinx only incurred $1.6 billion in expenses. Therefore, a negative consolidation adjustment of $2.1 billion was required to report total consolidated Metrolinx expenses of $1.6 billion. This consolidation adjustment consists of both capital and operating components.
Appendix B: Ontarians’ Commute to Work
Based on data from Statistics Canada,[55] Ontarians have the longest average commute time to work out of all Canadian provinces, with an average commute time of 28.8 minutes.[56] This is 4.3 minutes or 18 per cent higher than the rest of Canada average of 24.5 minutes. British Columbia has the second longest average commute time in the country at 25.9 minutes. By contrast, Prince Edward Island has the shortest average commute time of 18 minutes.
Average commute time to work by province in 2016, minutes
Source: Statistics Canada, 2016 Census, Catalogue no. 98-400-X2016322.
Accessible version
This chart shows the average commute time to work by province in 2016 in minutes. The chart shows that the average commute time to work was 28.8 minutes in Ontario, 25.9 minutes in British Columbia, 25.8 minutes in Quebec, 25.0 minutes in Alberta, 22.4 minutes in Manitoba, 22.2 minutes in Nova Scotia, 20.5 minutes in Newfoundland and Labrador, 18.9 minutes in New Brunswick, 18.8 minutes in Saskatchewan and 18.0 minutes in Prince Edward Island. This chart highlights that the average commute time to work across Canada excluding Ontario was 24.5 minutes.
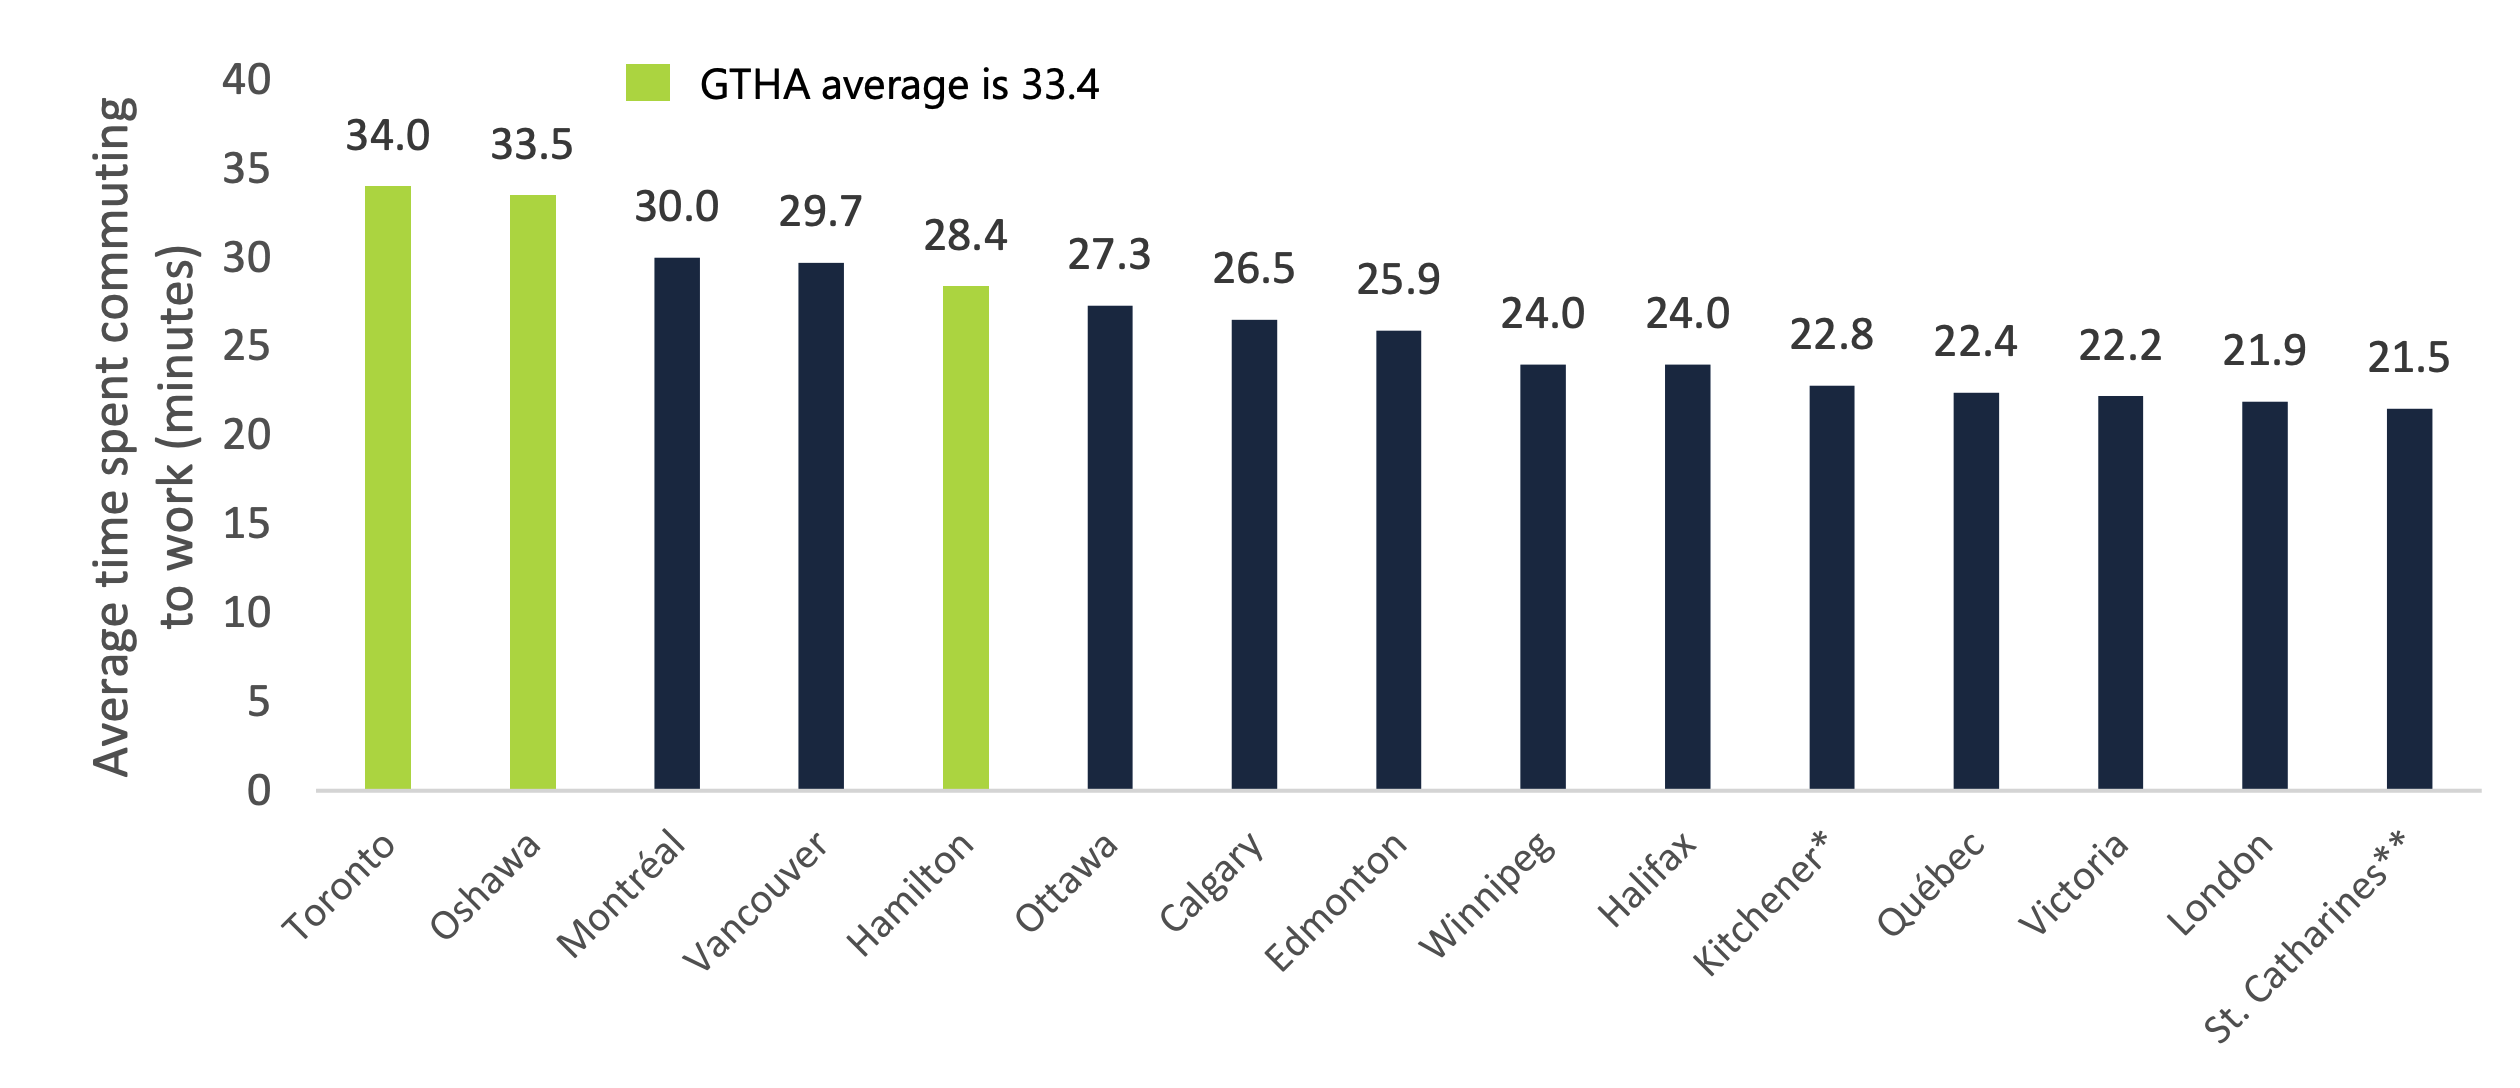
Long commute times in the Greater Toronto and Hamilton Area (GTHA) contribute to the long overall average commute for the province. GTHA cities such as Toronto, Hamilton and Oshawa have average commute times to work of 34.0, 28.4 and 33.5 minutes, respectively. These commute times are among the longest in Canada.
On average, the commute time for GTHA cities is 33.4 minutes.[57] By comparison, after GTHA cities, Montreal has the second longest average commute time to work of 30.0 minutes, which is 3.4 minutes below the GTHA average. Conversely, the GTHA average is 1.3 minutes below the average commute time to work in New York City of 34.7 minutes.[58]
Average commute time to work by selected cities in 2016, minutes
Note: The FAO uses a weighted average for the cities of Toronto, Oshawa and Hamilton to approximate an average commute time for all GTHA cities.
* Includes Kitchener, Cambridge and Waterloo.
** Includes St. Catharines and Niagara.
Source: Statistics Canada, 2016 Census, Catalogue no. 98-400-X2016322.
Accessible version
This figure shows the average commute time to work by selected cites across Canada in 2016 in minutes. The chart shows that the average time spent commuting to work was 34.0 minutes in Toronto, 33.5 minutes in Oshawa, 30.0 minutes in Montreal, 29.7 minutes in Vancouver, 28.4 minutes in Hamilton, 27.3 minutes in Ottawa, 26.5 minutes in Calgary, 25.9 minutes in Edmonton, 24.0 minutes in Winnipeg, 24.0 minutes in Halifax, 22.8 minutes in the Kitchener-Cambridge-Waterloo area, 22.4 minutes in Quebec City, 22.2 minutes in Victoria, 21.9 minutes in London and 21.5 minutes in the St. Catharines-Niagara area. This chart highlights that the average commute time to work across the three GTHA cities used in this analysis – Toronto, Hamilton and Oshawa – is 33.4 minutes.
In the GTHA, motorized vehicles are the most common mode of transportation to work, used by approximately 70.8 per cent of GTHA residents. Public transit is used by about 22.0 per cent of GTHA residents to commute to work, followed by 5.0 per cent who walk, 1.3 per cent who ride bicycles, and 0.9 per cent who use other modes of transportation.
Mode of transportation used by GTHA residents to commute to work in 2016
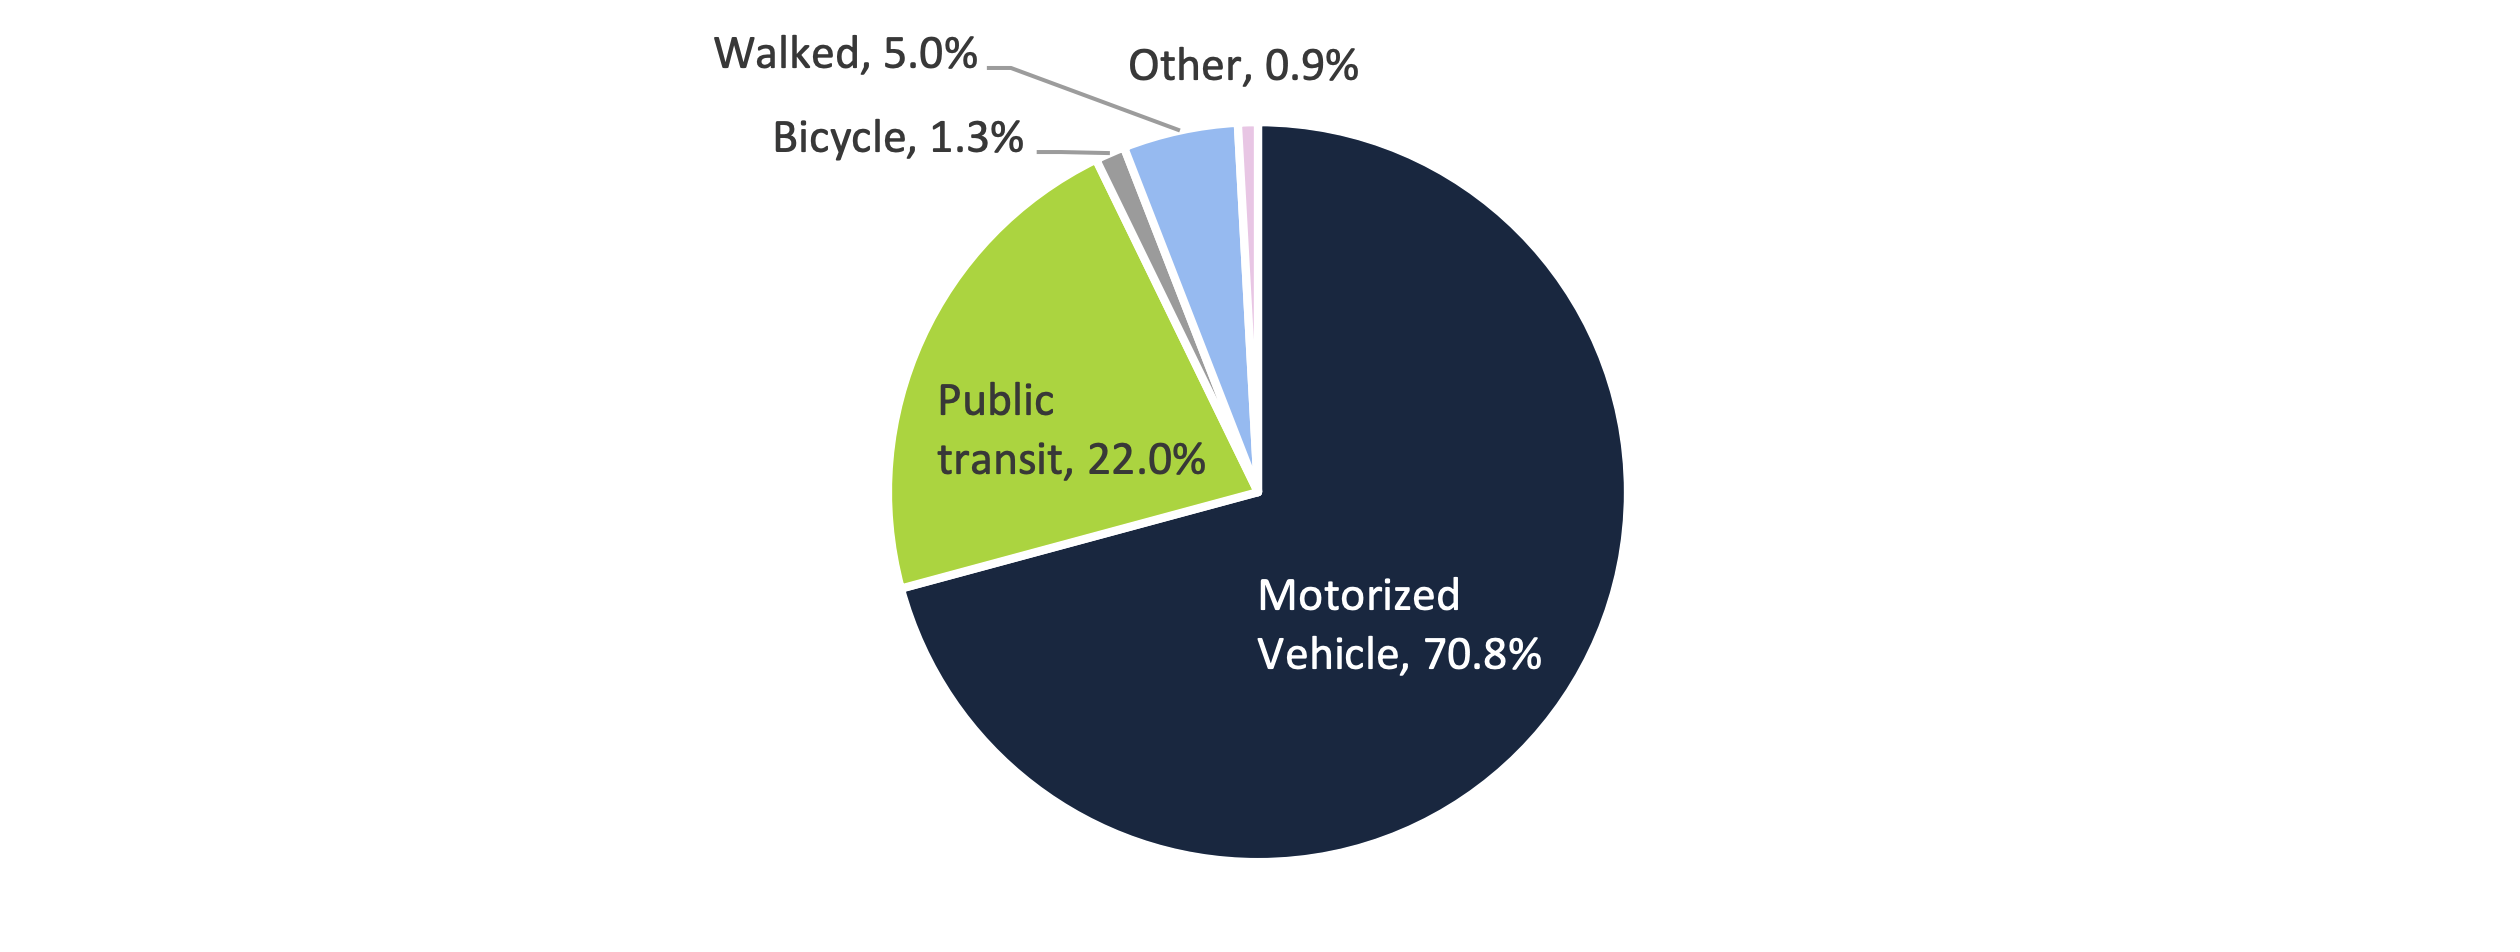
Note: Motorized vehicle includes cars, trucks, vans, motorcycles, scooters and mopeds.
Source: Statistics Canada, 2016 Census, Catalogue no. 98-400-X2016322.
Accessible version
This pie chart shows the mode of transportation used by residents in the GTHA cities – Toronto, Hamilton and Oshawa – to commute to work in 2016. The chart shows that 70.8 per cent of these residents used a motorized vehicle, 22.0 per cent of residents took public transit, 5.0 per cent of residents walked, 1.3 per cent of residents rode a bicycle and 0.9 per cent of residents took other modes of transportation.
For residents of the GTHA, the average overall time spent commuting to work increased from 32.1 minutes in 2011 to 33.4 minutes in 2016. The average time spent commuting to work via motorized vehicles increased from 28.9 minutes in 2011 to 29.9 minutes in 2016, while the average time spent commuting via public transit increased from 47.8 minutes in 2011 to 49.9 minutes in 2016. The average commute time via bicycle remained relatively flat from 2011 to 2016, decreasing by 0.2 minutes on average. The average time GTHA residents spent walking to work or using alternative types of transportation increased by 0.9 minutes and 1.1 minutes, respectively, from 2011 to 2016.
Average commute times by mode of transportation in the GTHA in 2011 and 2016, minutes
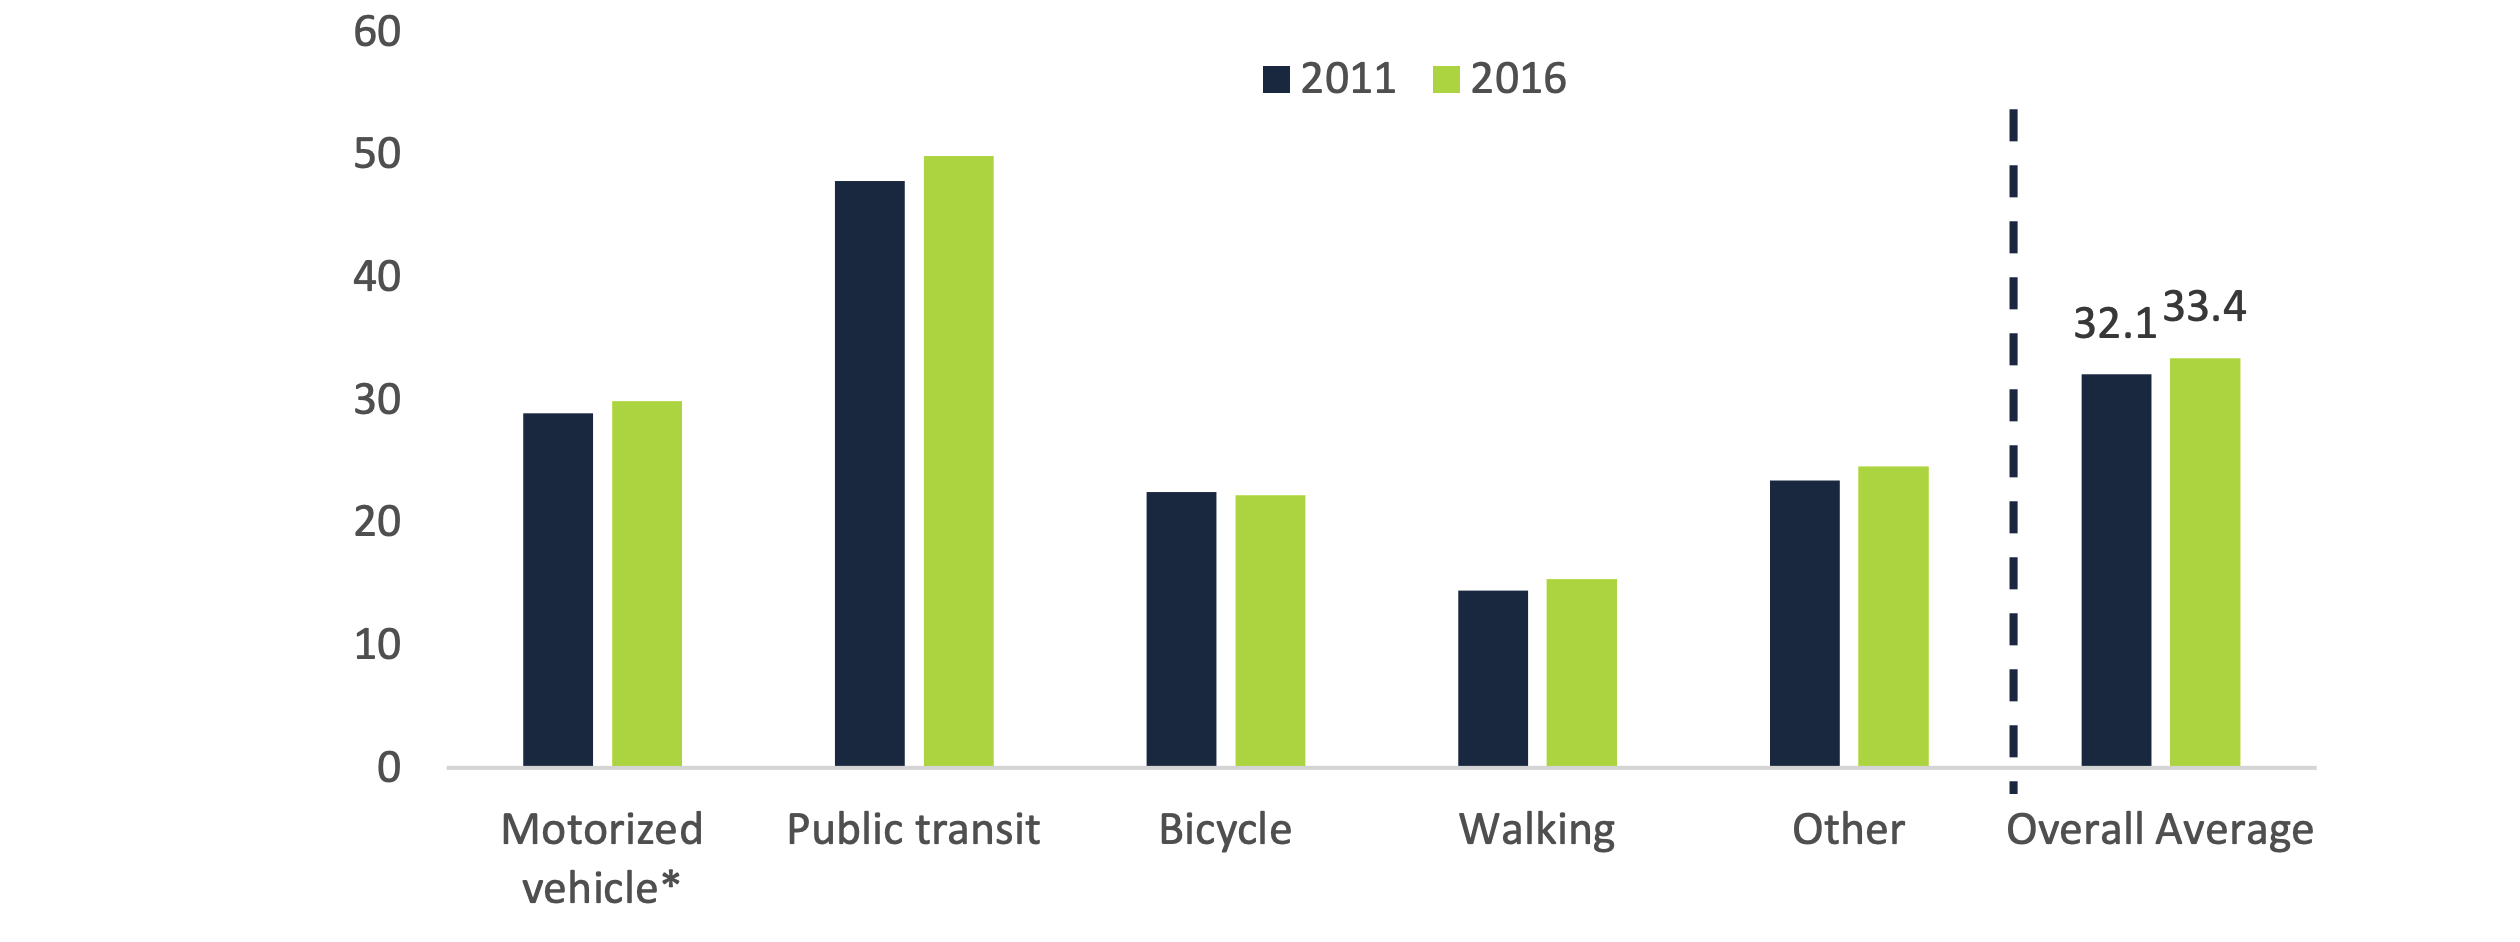
* Motorized vehicle includes cars, trucks, vans, motorcycles, scooters and mopeds.
Source: Statistics Canada, 2016 Census, Catalogue no. 98-400-X2016322.
Accessible version
This chart shows the average commute times to work by mode of transportation in the GTHA cites in 2011 and 2016 in minutes. The chart shows that, in 2011, the average commute time to work via motorized vehicle was 28.9 minutes, 47.8 minutes for public transit, 22.5 minutes for bicycles, 14.5 for walking and 23.4 minutes for other modes of transportation. The chart shows that, in 2016, the average commute time to work via motorized vehicle was 29.9 minutes, 49.9 minutes for public transit, 22.2 minutes for bicycles, 15.4 minutes for walking and 24.5 minutes for other modes of transportation. The chart highlights that the average commute time to work across all modes of transportation in the GTHA cites was 32.1 minutes in 2011 and 33.4 minutes in 2016.
Lastly, the average time spent by drivers of cars, trucks and vans to commute to work in Ontario was 26.3 minutes in 2016, which was 3.4 minutes or 15 per cent above the rest of Canada average of 22.9 minutes.
Average commute times for drivers by province (minutes)
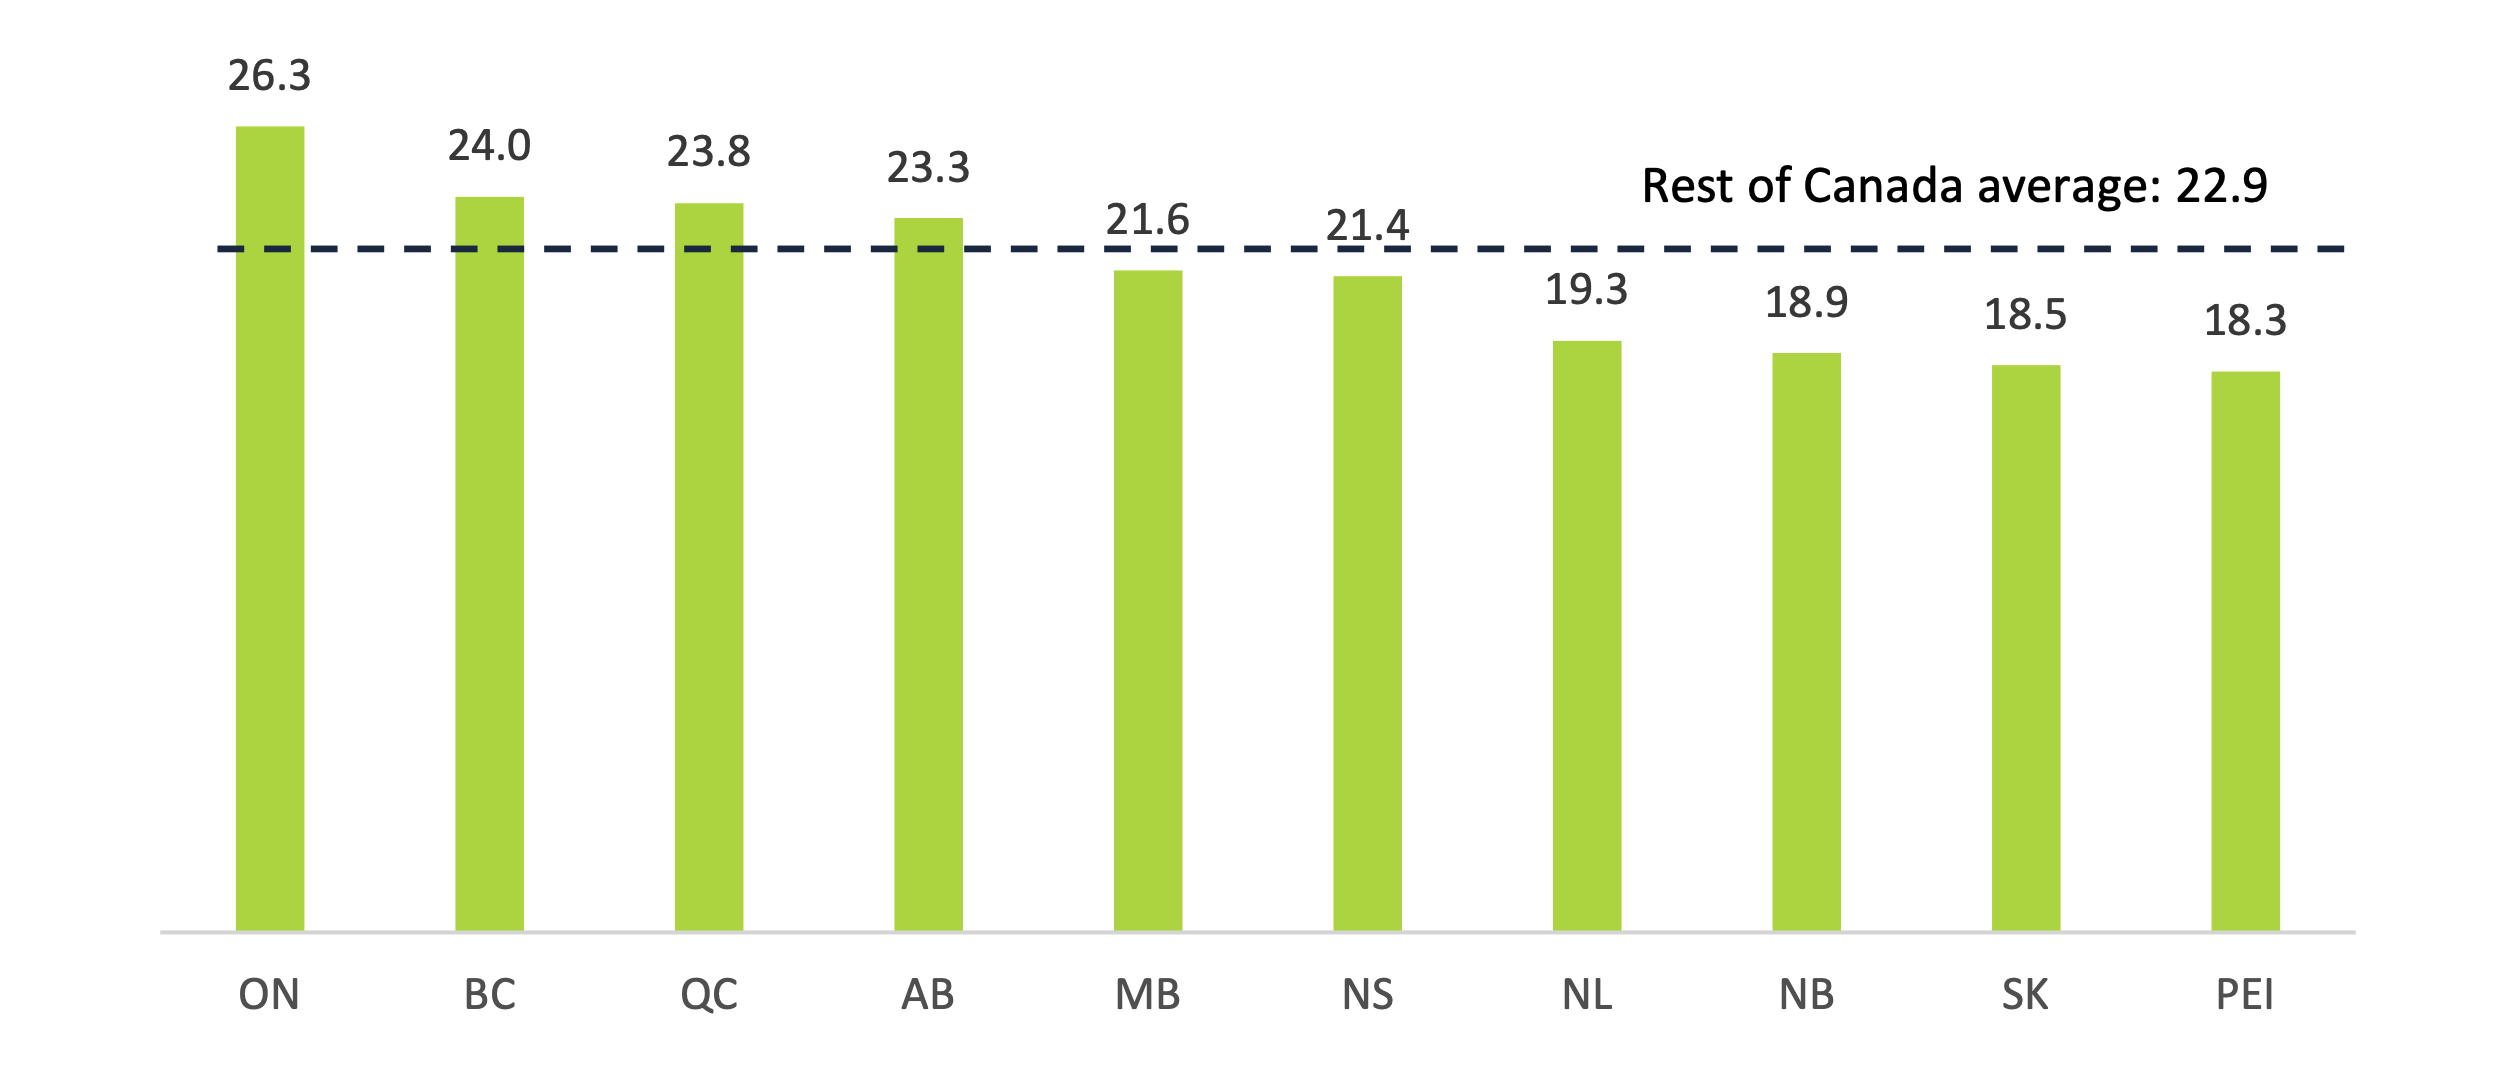
Source: Statistics Canada, 2016 Census, Catalogue no. 98-400-X2016322.
Accessible version
This chart shows the average commute times for drivers by province in 2016 in minutes. The chart shows that the average commute time to work for drivers in Ontario was 26.3 minutes, 24.0 minutes in British Columbia, 23.8 minutes in Quebec, 23.3 minutes in Alberta, 21.6 minutes in Manitoba, 21.4 minutes in Nova Scotia, 19.3 minutes in Newfoundland and Labrador, 18.9 minutes in New Brunswick, 18.5 minutes in Saskatchewan and 18.3 minutes in Prince Edward Island. This chart highlights that the average commute time to work for drivers across Canada excluding Ontario was 22.9 minutes.
Appendix C: Development of this Report
Authority
The Financial Accountability Officer decided to undertake the analysis presented in this report under paragraph 10(1)(a) of the Financial Accountability Officer Act, 2013.
Methodology
This report has been prepared with the benefit of publicly available information and information provided by the Ministries of Transportation and Finance.
All dollar amounts are in Canadian, current dollars (i.e., not adjusted for inflation) unless otherwise noted.
Footnotes
[1] Volume 1 of the 2019-20 Expenditure Estimates is available here: https://www.ontario.ca/page/expenditure-estimates-volume-1-table-contents-2019-20.
[2] If the SCE does not deliver a report to the legislature by the third Thursday in November, then the Estimates are deemed to be passed by the SCE. Standing Orders of the Legislative Assembly of Ontario (SO 63(b)).
[3] The FAO’s review of the Ministry of Health and Long-Term Care and the Ministry of Education’s 2019-20 Expenditure Estimates are available here: https://www.fao-on.org/en/Blog/Publications/estimates-health-2019 and here: https://www.fao-on.org/en/Blog/Publications/expenditure-estimates-education-2019.
[4] 2019 Ontario Budget, p. 300.
[5] See chapter 4 for more program analysis by Estimates categories.
[6] See appendix A for more information on consolidation adjustments.
[7] Investments in capital assets, such as building a new highway or transit, are not immediately expensed and they do not immediately impact the Province’s budget balance. However, these investments are still considered spending and are typically recorded in the Province’s consolidated statement of cash flow. As the capital asset ages, a non-cash amortization expense is recorded, which impacts the budget balance. Since capital assets last several years, the Province amortizes (i.e., spreads) the cost of tangible capital assets over their useful life. By amortizing the expense, costs are better aligned with the years in which capital assets are consumed. The Province estimates the life of transportation infrastructure from 10 to 75 years.
[8] Since the Province does not own these assets, the Province’s spending on municipal transit projects is accounted for as an expense, not an investment in capital assets. In contrast, Metrolinx’s assets are owned by the Province, so provincial spending on public transit projects delivered through Metrolinx are considered capital asset investments.
[9] These projects are in various stages of planning, construction and completion. As spending is incurred during each of these stages, the value of the asset accumulates as “work-in-progress.” As of 2018-19, Metrolinx reported a total net book value of $10.1 billion related to work-in-progress.
[10] 2019 Ontario Budget, p. 64.
[11] Government of Ontario, “Minister Caroline Mulroney’s Speech at the Toronto Region Board of Trade,” [online] available at: https://news.ontario.ca/mto/en/2019/10/minister-caroline-mulroneys-speech-at-the-toronto-region-board-of-trade.html [accessed 4 Nov. 2019].
[12] The annual amortization expense and investment in capital assets for the Province’s northern highways is recorded with the Ministry of Energy, Northern Development and Mines.
[13] This includes Local Road Board (LRB) Bridge and Structural Culvert inventory. MTO is responsible for asset management on both bridges and structural culverts but does not have title (ownership) of those assets. The Province matches collected levies for LRBs based on a 2:1 ratio and funding is treated as a capital expense.
[14] The transit and highways capital plans are also referred to as “infrastructure expenditures” in the budget. 2019 Ontario Budget, p. 14.
[15] Includes spending on infrastructure assets owned by the Province and also spending by the Province for infrastructure assets owned by municipalities.
[16] Total savings from the cancellation of the high-speed rail project is $11 billion through to 2025-26. For more details on the initiative, see Ontario Commits Over $11 Billion to Build First Phase of High Speed Rail, Government of Ontario, 2018.
[17] 2019 Ontario Budget, p. 14.
[18] Approximately $0.4 billion of this amount is expected to be spent from 2024-25 to 2028-29.
[19] 2019 Ontario Budget, p. 14.
[20] There is also a fifth project, the Sheppard Subway Extension. However, the timing and cost of this project will be determined after the completion of the Scarborough Subway Extension.
[21] As the Province will own the four subway projects, the full projected cost of $28.5 billion will be spent by the Province. Any funding contributions by the federal government will be recorded by the Province as revenue from the Government of Canada. As announced on October 16, 2019, the City of Toronto will not contribute funding to the four projects. https://news.ontario.ca/mto/en/2019/10/remarks-for-caroline-mulroney-minister-of-transportation.html.
[22] http://www.mto.gov.on.ca/english/service-commitment/gas-tax-program.shtml.
[23] The Public Transit Infrastructure Fund is a federal program that is intended to provide $25.3 billion nationally over 10 years to support various public transit projects: https://www.infrastructure.gc.ca/plan/pti-itc-eng.html.
[24] 2019 Ontario Budget, p. 60.
[25] Includes cars and public transit. See appendix B for more information.
[26] See appendix B for more information.
[27] C.D. Howe Institute, “Cars, Congestion and Costs: A New Approach to Evaluating Government Infrastructure Investment,” 2019.
[28] 2019 Ontario Budget, p. 60.
[29] 2019 Ontario Budget, p. 60.
[30] Ministry of Transportation, “Estimates Briefing Book 2019-20,” p. 1.
[31] Includes cars and public transit. See appendix B for more information.
[32] See appendix B for more information.
[33] For context, the current target of 8.0 fatalities per 100,000 licensed drivers in 2019 is higher than the number of fatalities in 2017, at 5.8 per 100,000 licensed drivers, and higher than the Canadian average of 7.1 (Department of Transportation, Canadian Motor Vehicle Traffic Collision Statistics: 2017). The number of fatalities per 100,000 licensed drivers has been significantly below the government’s target every year since 2002.
[34] The ministry sets different maximum time limits for regaining bare pavements for its five classes of highways after the end of a winter storm: 8 hours for class 1 highways, 16 hours for class 2 highways, and 24 hours for classes 3 to 5 highways.
[35] Other cost drivers include disposable income, as people with more income tend to drive more, and the level of economic activity in the province that is related to the number of commercial vehicles on highways.
[36] The FAO forecasts the number of vehicles based on a methodology used by the US Department of Transportation (more information is available upon request). Based on this methodology, the FAO projects that the number of personal and commercial vehicles in Ontario, which stood at 12.5 million in 2018 (Statistics Canada Table 23-10-0067-01), will increase by approximately 1.3 million by 2023.
[37] In the FAO’s analysis, cost drivers are used to provide a broad estimate of the level of spending required to maintain the current quality of a public service or program, given changes to the population and economy. However, this estimate does not consider changes in the quality of the public service or program due to improvements in technology or other efficiencies. Cost drivers also do not provide insight on the amount of spending required to obtain an optimal quality level for the public service or program.
[38] “Services” include advertising, communication, machine repairs and other items.
[39] Under the cancelled cap and trade program, revenue raised through the sale of greenhouse gas emission allowances was used to fund programs intended to reduce greenhouse gas emissions through what was called the Greenhouse Gas Reduction Account (GGRA). For more information, see the “Other Spending” section below and FAO, “Cap and Trade: A Financial Review of the Decision to Cancel the Cap and Trade Program,” 2018.
[40] For more information, see the “Other Spending” section below and FAO, “Cap and Trade: A Financial Review of the Decision to Cancel the Cap and Trade Program,” 2018.
[41] See chapter 2 for more information.
[42] See chapters 2 and 3 for more details on the capital projects included in Metrolinx’s spending plan for 2019-20 and changes from the 2018 budget plan to the 2019 budget plan.
[43] The Public Transit Infrastructure Fund is a federal program that is intended to provide $25.3 billion nationally over ten years to support various public transit projects: https://www.infrastructure.gc.ca/plan/pti-itc-eng.html.
[44] For more information on the GGRA, see above and the “Other Spending” section below.
[45] Under the cap and trade program, revenue raised through the sale of greenhouse gas emission allowances was used to offset the cost of programs intended to reduce greenhouse gas emissions (through the GGRA). For more information, see the “Other Spending” section below and FAO, “Cap and Trade: A Financial Review of the Decision to Cancel the Cap and Trade Program,” 2018.
[46] Under the Trillium Trust, revenue raised from the sale of designated assets, such as the partial sale of Hydro One and the Province’s equity investment in General Motors, was to be used to fund infrastructure investments. For more information on the Trillium Trust and the partial sale of Hydro One, see the “Other Spending” section below and FAO, “Hydro One: Updated Financial Analysis of the Partial Sale of Hydro One,” 2018.
[47] The investment in rehabilitation and expansion infrastructure, and the amortization expense, for the Province’s northern Ontario highways is recorded with the Ministry of Energy, Northern Development and Mines.
[48] See appendix A for more information on Metrolinx consolidation adjustments.
[49] For more information, see FAO, “Cap and Trade: A Financial Review of the Decision to Cancel the Cap and Trade Program,” 2018. Note also that the GGRA was renamed the Cap and Trade Wind Down Account.
[50] As of March 31, 2019, $12.1 million remained in the Greenhouse Gas Reduction Account, which represents the difference between the total amount of revenue raised through the sale of greenhouse gas emission allowances and total spending on authorized programs. 2018-19 Public Accounts of Ontario, volume 1, p. 2-483.
[51] For more information on the Trillium Trust and the partial sale of Hydro One, see FAO, “Hydro One: Updated Financial Analysis of the Partial Sale of Hydro One,” 2018.
[52] Financial results of entities are only consolidated if they pass a series of Public Sector Accounting Board (PSAB) tests. Metrolinx is consolidated into the Province’s statements on a line by line basis, in that Metrolinx expenses are reported as expenses in the Province’s consolidated financial statements, and Metrolinx revenues are reported as revenues.
[53] As per the Financial Administration Act, 1990, s. 11.1(1), all spending of public money by the Province must be authorized by an Act of the Legislature.
[54] There are a number of reasons why a consolidated entity could spend more or less than the amount of funds transferred by the Province. For example, some of the funding received from the Province could be spent by the consolidated entity on assets, which is not recorded as an expense. Alternatively, the consolidated entity could spend additional funds from independently generated revenues or debt financing.
[55] Statistics Canada, 2016 Census, Catalogue no. 98-400-X2016322.
[56] Includes all types of transportation.
[57] Statistics Canada, 2016 Census, Catalogue no. 98-400-X2016322. The catalogue only includes commutes times for three cities in the GTHA: Toronto, Oshawa and Hamilton. The FAO uses a weighted average for these three cities to approximate an average commute time for all GTHA cities.
[58] Ministry of Finance, 2016 Census Highlights, Fact Sheet 14: Commuting to Work.