


1. Summary
This report reviews the Province’s health sector spending plan. The report discusses the FAO’s health sector spending projection from 2022-23 to 2027-28 and identifies key assumptions, issues and uncertainties. The report then reviews five health sector priority areas as detailed in the Province’s recent health sector plans: hospital capacity, long-term care and home care, surgical waitlists and wait times, emergency departments, and the health sector workforce.
Key Points
- The Province has committed to make significant investments to expand capacity in hospitals, home care and long-term care. However, these increases in capacity will be more than offset by increases in demand for these services from Ontario’s growing and aging population. Relative to projected growth in demand, by 2027-28, Ontario will have less hospital capacity, similar home-care capacity and less long-term care capacity compared to what it had in 2019-20.
- From 2022-23 to 2027-28, the Province has allocated $21.3 billion less than will be needed to fund current health sector programs and deliver on its program expansion commitments in hospitals, home care and long-term care. Consequently, the Province will need to add new funding to its health sector spending plan, such as from the contingency fund or new federal health transfers. Alternatively, the Province could make program cuts or changes to its expansion commitments to achieve its health sector spending plan targets.
- Ontario is currently experiencing shortages of nurses and personal support workers (PSWs), which is projected to persist through the FAO’s six-year forecast period. Even with government measures to increase the supply of nurses and PSWs, by 2027-28, the FAO projects a shortfall of 33,000 nurses and PSWs. These nurse and PSW shortages will jeopardize Ontario’s ability to sustain current programs and meet program expansion commitments.
- Ontario’s health care system is interdependent. Staffing shortages throughout the health care system and lack of capacity in home care and long-term care affects hospitals’ ability to discharge patients who need care in alternate settings, which, in combination with a lack of hospital capacity and staffing, affects the ability of hospitals to admit patients from emergency departments and to reduce the surgery waitlist and wait times to pre-pandemic levels.
- Given that the Province’s capacity expansion commitments in hospitals, home care and long-term care will not meet growth in demand for these services from Ontario’s growing and aging population, the Province has not allocated sufficient funding to the health sector to support its programs and commitments, and the Province has not taken sufficient measures to supply the nurses and PSWs needed to deliver on its expansion commitments, challenges are expected to persist across Ontario’s health care system.
Health Sector Spending Outlook
- Based on current program design and announced commitments, the FAO projects that health sector spending will grow at an average annual rate of 3.6 per cent between 2021-22 and 2027-28, reaching $93.8 billion in 2027-28. In contrast, the funding allocated by the Province in the 2022 Ontario Budget and the 2022 Fall Economic Statement (FES) grows at an average annual rate of 2.5 per cent, reaching $87.8 billion by 2027-28.
- In total, the FAO projects that the Province’s health sector spending plan has a net funding shortfall over the six-year period from 2022-23 to 2027-28 of $21.3 billion. The shortfall means that the Province has not allocated sufficient funds to the health sector to support existing programs and announced commitments.
- There are two possible actions that the government could take regarding the health sector funding shortfall identified by the FAO.
- Firstly, the Province could incrementally add new funding to the health sector spending plan in upcoming budgets and fall economic statements. New funding could be added from the contingency fund, new federal health transfers[1] or new incremental program spending.
- Alternatively, the Province could attempt to achieve the lower health sector spending targets outlined in the 2022 budget and FES by making changes to existing programs or announced commitments.
- There are also key risks to the FAO’s health sector spending projection.
- The FAO’s spending forecast assumes wage growth is consistent with existing collective agreements and, for new collective agreements, historical long-term average growth in wages. However, given recent elevated inflation, there is the potential for above-average wage settlements, which would lead to higher than projected spending.
- On November 29, 2022, the Ontario Superior Court of Justice ruled that Bill 124, which limits base salary increases for most provincial employees to one per cent per year for a period of three years, was in violation of the Canadian Charter of Rights and Freedoms and was declared to be void and of no effect. The government has appealed this decision. If the government is unsuccessful in its appeal, then provincial spending on wages would be higher than projected in the FAO’s forecast.
- For information on the FAO’s health sector spending projection by program area, see Chapter 4.
Hospital Capacity
- The Province plans to address capacity issues in Ontario hospitals by adding new hospital beds, continuing to fund beds that were added during the COVID-19 pandemic and introducing measures to free up existing hospital capacity occupied by alternate level of care (ALC) patients.[2]
- If successful, the Province’s measures would add 4,500 new hospital beds from 2019-20 to 2027-28 and free up 2,500 existing beds occupied by ALC patients, for a total increase in available capacity of 7,000 hospital beds. However, the FAO expects that it is unlikely that the Province will achieve the 7,000 hospital beds target under current policies.
- First, given that there is a $21.3 billion health sector funding shortfall, the Province has not allocated sufficient funding to ensure that the 4,500 additional hospital beds can be operated.
- Second, to achieve its target, the Province must permanently free up all 2,000 beds occupied by ALC patients waiting for a long-term care placement as of September 2022. This will be challenging given that there are over 39,000 Ontarians on the waitlist for long-term care and the Province must effectively reduce time to placement from hospitals from a median of 39 days to zero. The More Beds, Better Care Act, 2022 (known as Bill 7) does give patients in hospitals waiting for a long-term care bed priority over patients waiting in the community, however, there still must be a space available for the patient and the long-term care home must have the necessary supports to meet the patient’s care needs.[3]
- Finally, even if the Province achieves its plan to increase available hospital capacity by 7,000 beds by 2027-28, the FAO projects that Ontario will still be 500 beds short of the estimated 7,500 beds needed just to serve the growth in demand for hospital services from Ontario’s growing and aging population. This suggests that without additional measures, Ontario will have less available hospital capacity relative to need in 2027-28 than in 2019-20.
Home and Long-Term Care
- The Province plans to significantly expand home care and long-term care capacity. This includes adding 30,000 net new long-term care beds by 2028 and spending an additional $1.0 billion over three years to increase the supply of home care services.
- Combined, spending on these programs is projected to increase at an average annual rate of 10.0 per cent from $7.3 billion in 2019-20 to $15.6 billion in 2027-28. This spending growth is significantly higher than the projected 5.0 per cent average annual growth in the health sector as a whole.
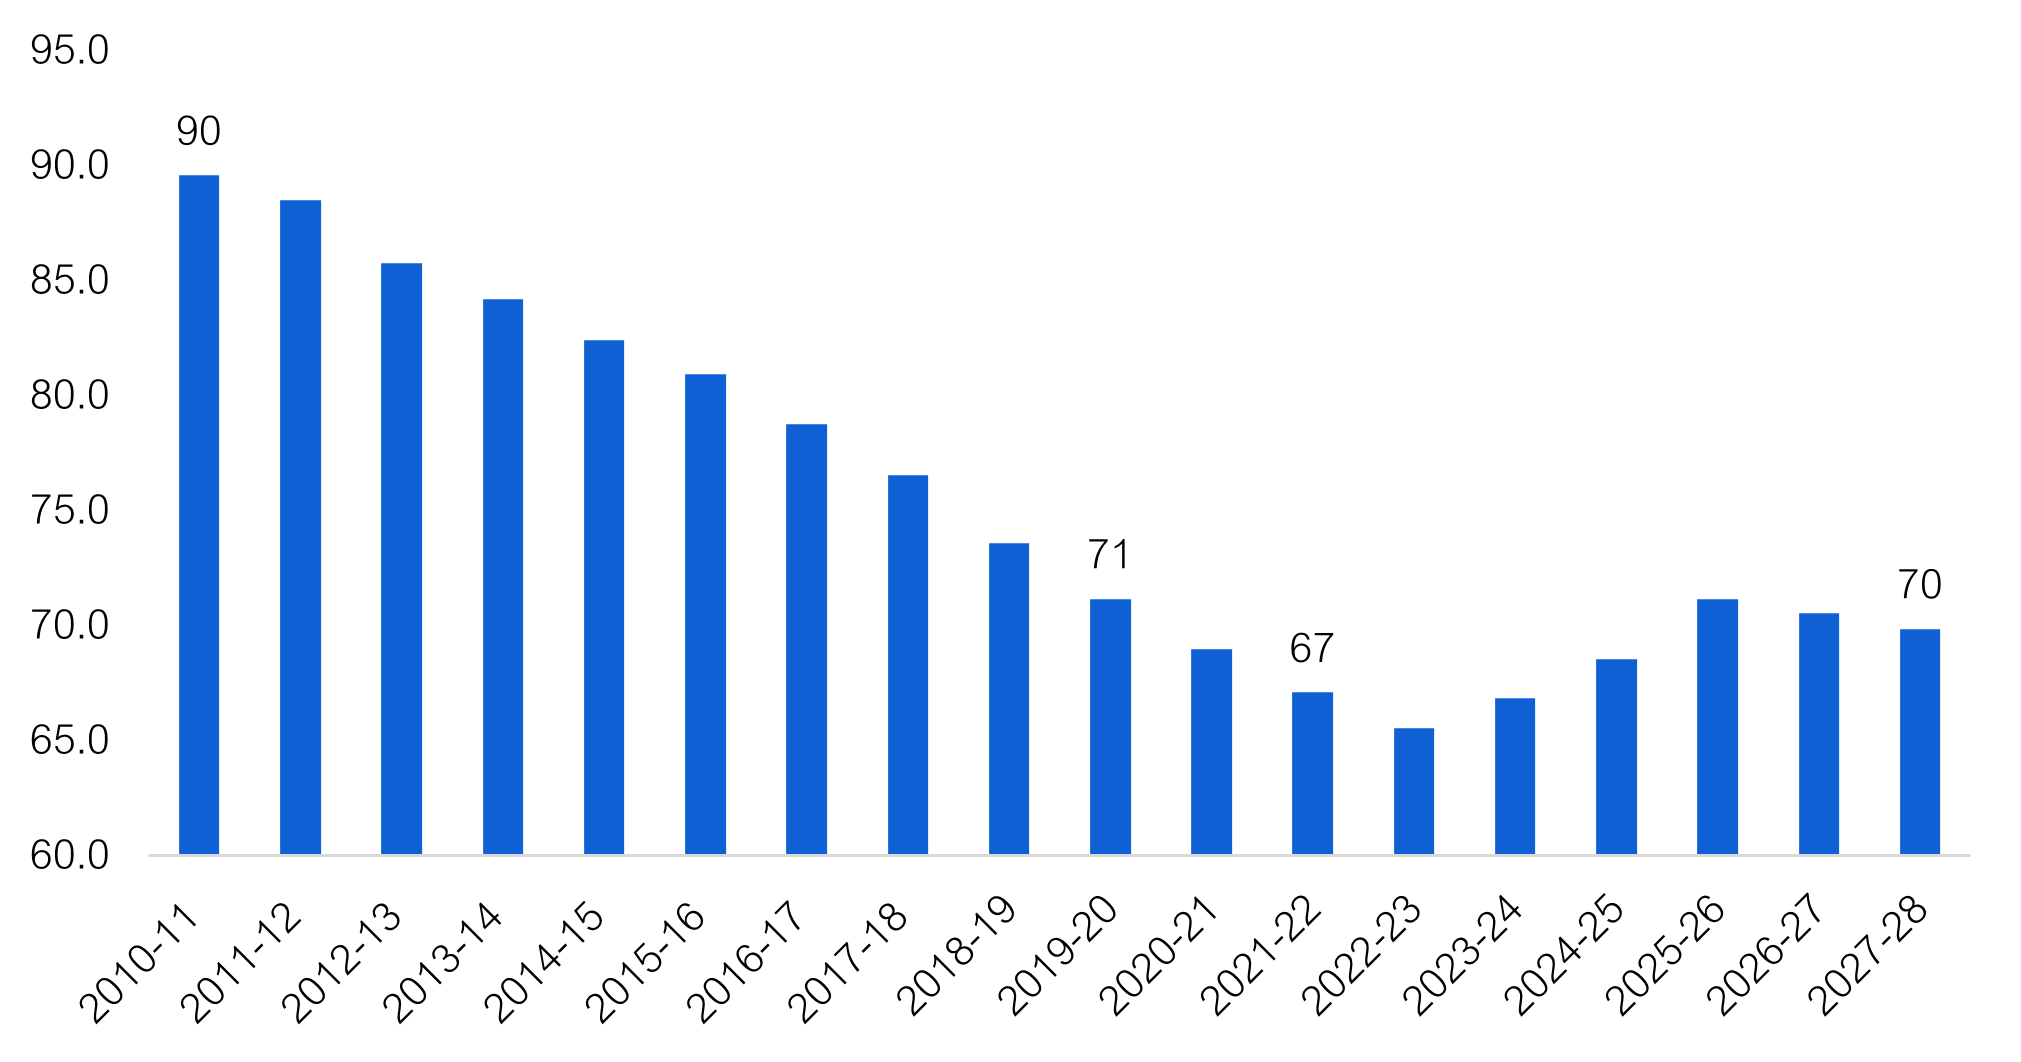
- Despite these significant investments, the FAO estimates that there will still be a slight decline in home care and long-term care capacity relative to need compared to 2019-20. This is due to high growth in the number of Ontario seniors over the forecast period, which will significantly increase demand for home care and long-term care services. For home care, the number of nursing and personal care hours per Ontarian aged 65 and over will be about the same in 2024-25 as it was in 2019-20. For long-term care, the number of beds per 1,000 Ontarians aged 75 and over will decline slightly from 71 in 2019-20 to 70 in 2027-28.
Surgical Waitlists and Wait Times
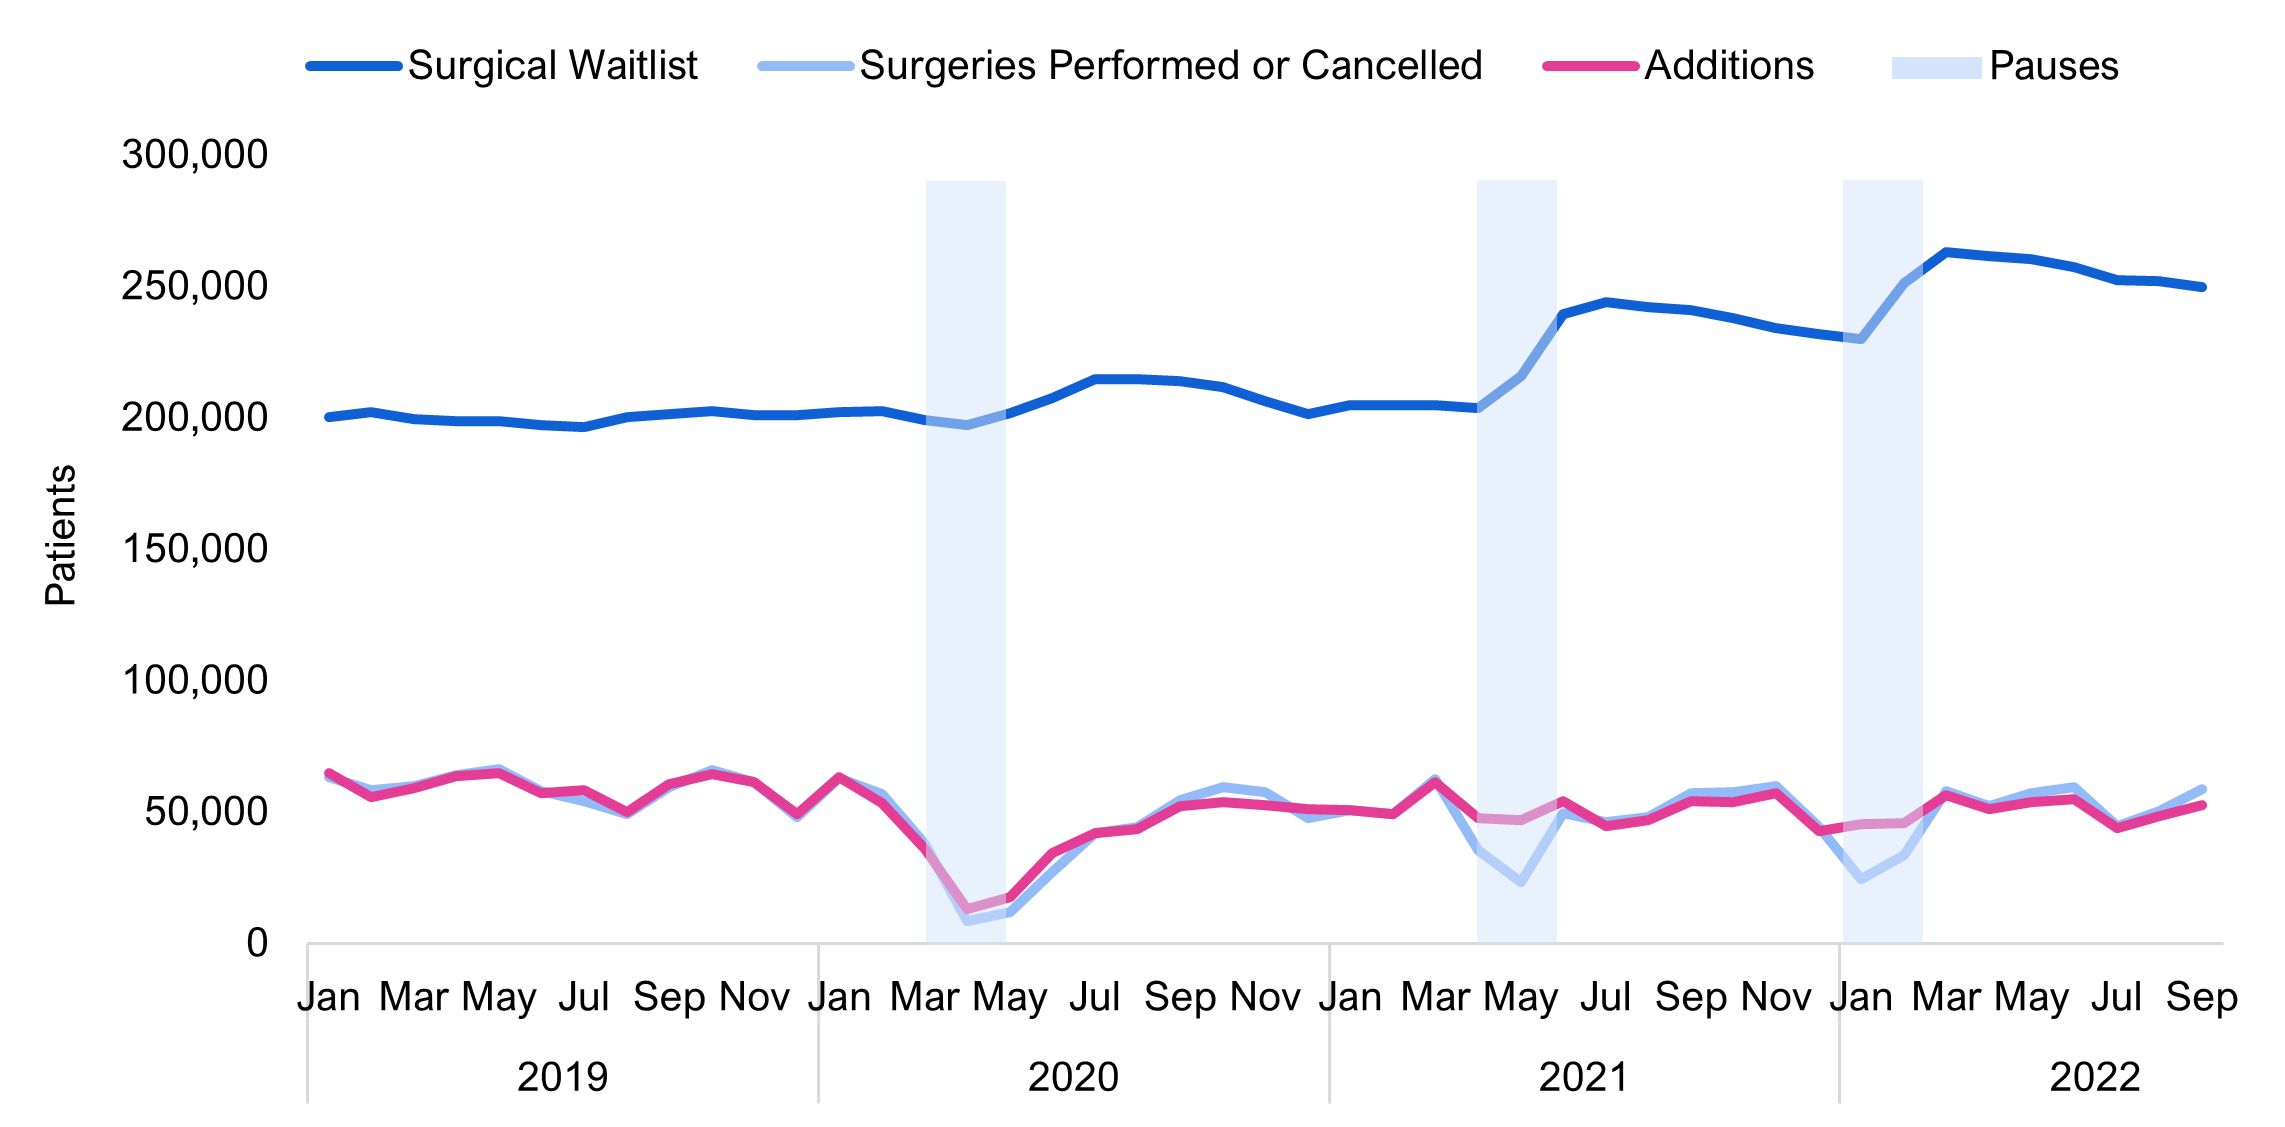
- In response to the COVID-19 pandemic, the Province issued directives to pause elective surgical procedures three times to preserve hospital capacity. Largely as a result of these directives, and also due to the impact of the COVID-19 pandemic on hospital operations, 398,000 fewer surgeries were performed in 2020, 2021 and 2022 than would have occurred if 2019 surgical volumes had been maintained.
- However, as of September 2022, there were approximately 250,000 patients on waitlists for surgical procedures, which is only 50,000 more patients than the pre-pandemic level of 200,000. The reason the surgery waitlist increased by only 50,000 when 398,000 fewer procedures were performed from 2020 to 2022 is that fewer Ontarians were added to the surgical waitlist compared to pre-pandemic levels.
- Of the 250,000 patients on the surgery waitlist, 107,000 (43 per cent) were waiting longer than the maximum clinical guidelines for their surgery (referred to by the ministry as “long-waiters”), up from an average of 38,000 (20 per cent) before the COVID-19 pandemic.
- Despite the Province’s $858 million investment over three years from 2020-21 to 2022-23, the number of surgeries performed has not returned to pre-pandemic levels. Looking only at months not affected by elective surgery pauses, the average number of surgeries performed in each month from 2020 to 2022 was significantly lower than in 2019. Average monthly surgeries performed were 14 per cent lower in 2020, 12 per cent lower in 2021 and eight per cent lower in 2022 (as of September 2022).
- As of the writing of this report, the Province’s target is to reduce the surgery waitlist to the pre-pandemic level of 200,000 and the number of long-waiters to the pre-pandemic level of 38,000 by March 2023.
- To achieve its surgery waitlist target, the rate of decline in the waitlist would need to be significantly faster than what the Province has achieved up to September 2022. After pauses in elective surgeries in 2021 and 2022, the waitlist has been reduced by an average of 2,280 patients per month. Assuming no further interruptions, similar volumes of surgeries being performed and similar volumes of patients being added to the waitlist, the Province is on track to reduce the surgical waitlist back to 200,000 patients by July 2024.
- With respect to patients on the surgery waitlist who are classified as long-waiters, the Province has yet to record any sustained reduction in the number of these patients waiting for surgery. As of September 2022, the surgery waitlist had 107,000 long-waiters, which was the highest number recorded since the start of the pandemic. Consequently, without additional measures, the Province will not achieve its goal of reducing the number of patients on the surgery waitlist classified as long-waiters to the pre-pandemic level of 38,000.
Emergency Departments
- As patient volumes in emergency departments have returned to near pre-pandemic levels, emergency department wait times have increased significantly. In 2022-23, the average length of stay in an emergency department for patients admitted to hospitals was 20.9 hours. This is 34 per cent higher than wait times over the five-year period prior to the COVID-19 pandemic and the longest average wait time recorded in over 15 years.
- Additionally, as of the writing of this report, there have been at least 145 unplanned emergency department closures in Ontario in 2022. Prior to the emergency department closures in 2022, the FAO is aware of only one unplanned emergency department closure since 2006 due to a lack of doctors.
- Emergency department closures are primarily an issue in smaller population centres, while the longest emergency department wait times are more commonly found in hospitals in urban areas. Ontario hospitals have identified a lack of available staff, including nurses and physicians, as the key issue causing longer emergency department wait times and closures.
- The Province’s plan to address emergency department closures primarily focuses on measures targeted to increase physician coverage in northern and rural emergency departments. The plan also addresses emergency departments more broadly with measures to reduce the number of emergency department visits and by providing flexibility to hospitals to deal with surges in demand.
- Overall, while the Province’s measures do address physician shortages in rural emergency departments, which contributes to emergency department closures, the measures do not provide for a sustained increase in emergency department staffing across the Province. From 2017-18 to 2019-20, emergency department wait times were significantly lower despite higher patient volumes. As a result, Ontario’s success in addressing emergency department strain depends on the success of the Province’s measures for the fifth area of focus, which is expanding the health sector workforce.
Ontario’s Health Sector Workforce
- The FAO projects that in order to return to pre-pandemic vacancy rates and meet government program expansion commitments in hospitals, home care and long-term care, Ontario needs 86,700 additional nurses and personal support workers by 2027-28. This represents an approximately 26 per cent increase in nurses and a 45 per cent increase in personal support workers employed in these sectors.
- The Province is implementing a number of measures to increase the supply of nurses and personal support workers, including measures targeting pay, training and regulatory barriers. These measures have been announced across several policy documents.[4]
- Based on the FAO’s analysis, the health workforce policy measures announced by the Province, along with natural growth, are expected to add 53,700 nurses and PSWs over the six-year period to 2027-28. Nevertheless, this increase in nurses and PSWs will not be sufficient to address current staffing shortages and meet Ontario’s commitments to expand care in hospitals, long-term care and home care, with an expected shortfall of 33,000 nurses and PSWs in 2027-28.
- Failure to address the projected shortfall in nurses and PSWs will result in the Province being unable to meet its expansion commitments in hospitals, home care and long-term care. The shortfall will also have additional impacts on health sector service levels, including in hospital emergency departments, the waitlist and wait times for surgeries, and average hours of direct care provided to long-term care residents.
2. Introduction
This report reviews the Province’s health sector spending plan in the 2022 Ontario Budget, the 2022-23 Expenditure Estimates, and the 2022 Ontario Economic Outlook and Fiscal Review (known as the Fall Economic Statement or FES). Health sector spending includes the combined spending by the Ministries of Health and Long-Term Care. The report is organized as follows:
- Chapter 3 discusses the FAO’s projection for health sector spending from 2022-23 to 2027-28, based on current program design and announced commitments, and compares this spending projection against the health sector spending plan in the 2022 Ontario Budget and 2022 Fall Economic Statement.
- Chapter 4 reviews the FAO’s projection for health sector spending by major program area and identifies key assumptions, issues and uncertainties behind the FAO’s spending forecast.
- Chapter 5 reviews five health sector priority areas as detailed in the Province’s recent health sector plans: hospital capacity, long-term care and home care, surgical waitlists and wait times, emergency departments, and the health sector workforce.
3. Health Sector Spending Outlook
Based on current program design and announced commitments, the FAO projects that health sector spending will grow at an average annual rate of 3.6 per cent between 2021-22 and 2027-28, reaching $93.8 billion in 2027-28. In contrast, the funding allocated by the Province in the 2022 Ontario Budget and the 2022 Fall Economic Statement grows at an average annual rate of 2.5 per cent, reaching $87.8 billion by 2027-28.
For the current fiscal year, 2022-23, the FAO estimates that the Province has allocated $1.3 billion in excess funds that are not required to support existing programs and announced commitments. However, beginning in 2023-24, the FAO projects health sector funding shortfalls, starting at $1.6 billion in 2023-24 and growing to $6.0 billion in 2027-28. These shortfalls mean that the Province has not allocated sufficient funds to the health sector to support existing programs and announced commitments. In total, the FAO projects a net funding shortfall over the six-year period from 2022-23 to 2027-28 of $21.3 billion.
Figure 1 Health sector spending projections, FAO vs. Ontario government, $ billions
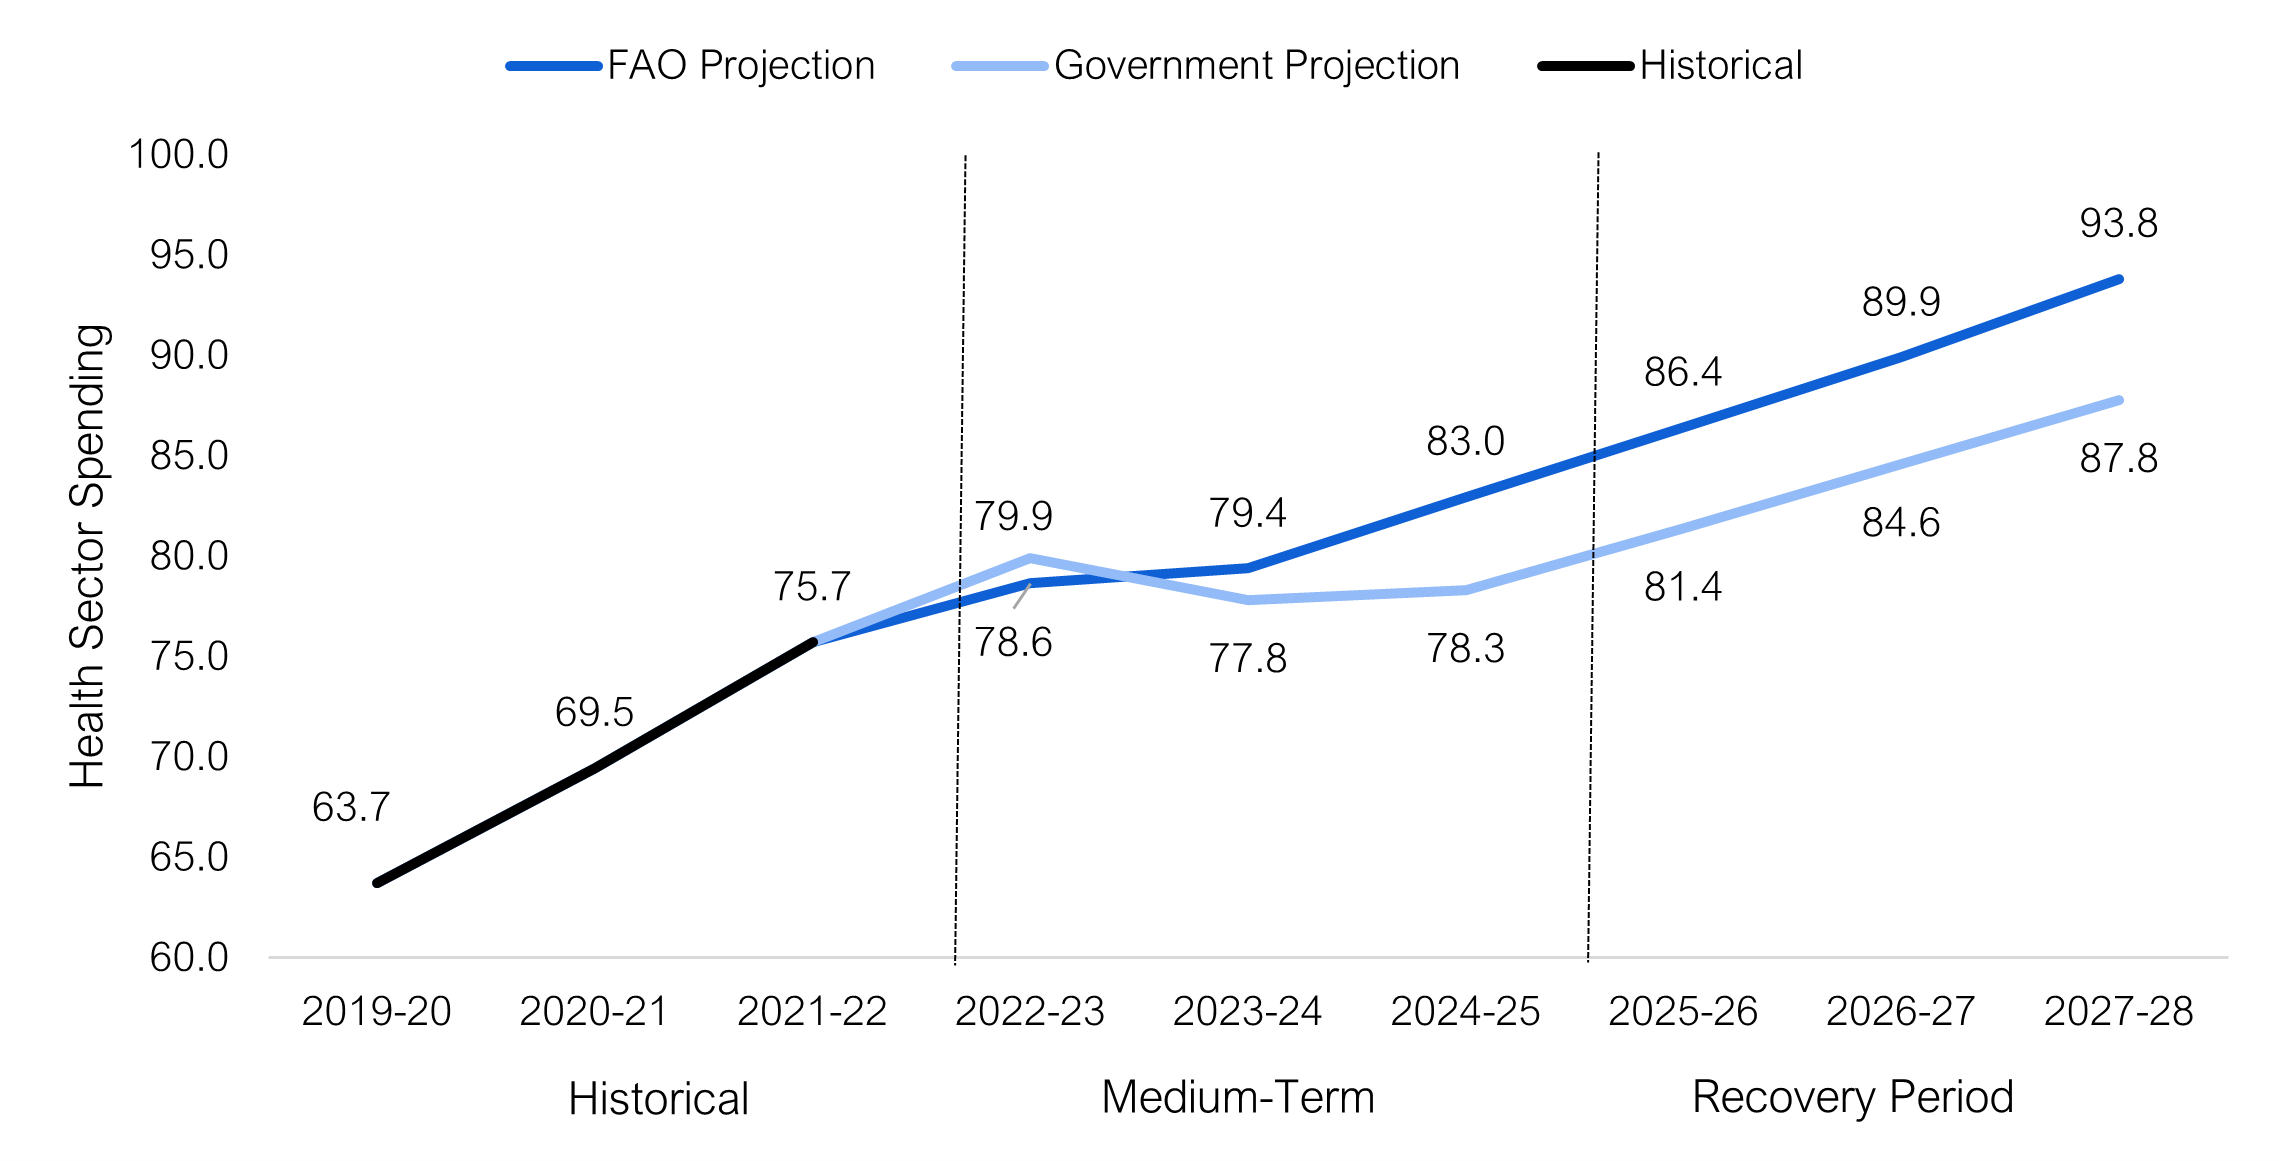
Note: From 2022-23 to 2024-25, the Ontario government projection is from the 2022 Ontario Economic Outlook and Fiscal Review. From 2025-26 to 2027-28, the Ontario government projection is from the 2022 Ontario Budget.
Source: Public Accounts of Ontario, 2022 Ontario Budget, 2022 Ontario Economic Outlook and Fiscal Review, and FAO analysis of information provided by the Province
There are two possible actions that the government could take regarding the health sector funding shortfall projected by the FAO. Firstly, the Province could incrementally add new funding to the health sector spending plan in upcoming budgets and fall economic statements. For example, between the 2016 Ontario Budget and the 2017 Ontario Budget, funding allocated to the health sector in 2018-19 increased by $2.6 billion (4.8 per cent). New funding could be added to the health sector from a combination of the contingency fund,[5] new federal health transfers or new incremental program spending. On February 7, 2023, the federal government announced changes to health funding arrangements which, as of the writing of this report, the FAO estimates will result in new incremental federal health transfers to the Province totalling $10.9 billion from 2023-24 to 2027-28. If the Province uses all of the $10.9 billion in incremental federal health transfers to increase funding for the health sector spending plan, then the FAO estimates that this new funding would cover approximately half of the health sector funding shortfall identified by the FAO.
Alternatively, the Province could attempt to achieve the health sector spending targets outlined in the 2022 FES and budget. In this case, changes to existing programs or announced commitments would be required.
Medium Term: In 2022-23, the FAO’s projection for health sector spending is $1.3 billion lower than the Province’s spending plan. This is primarily due to the FAO’s lower projected COVID-19-related spending. However, by 2024-25, the FAO’s spending projection is $4.6 billion higher than the Province’s. Most of the spending gap is in the hospitals and OHIP (physicians and practitioners) program areas, which are the two largest health sector spending categories.[6] Overall, the FAO projects 3.1 per cent average annual spending growth between 2021-22 and 2024-25. In contrast, the Province projects slower growth, averaging 1.1 per cent from 2021-22 to 2024-25.
Recovery Period: The Province plans to increase annual health sector spending by an average of 3.9 per cent per year over the recovery period from 2024-25 to 2027-28. In comparison, based on the FAO’s review of health sector programs and announced commitments, the FAO projects spending will grow at an average annual rate of 4.2 per cent over the same period. As a result, the FAO projects that health sector spending will be $6.0 billion higher in 2027-28 compared to the government’s forecast in the 2022 budget.
4. Spending Outlook by Program Area
For the period between 2021-22 and 2027-28, the FAO projects health sector spending will grow at an average annual rate of 3.6 per cent. The FAO projects that spending on the two largest program areas, hospitals and OHIP (physicians and practitioners), will grow by average annual rates of 3.0 and 4.1 per cent, respectively. Ontario public drug programs spending is projected to grow by an average of 5.7 per cent per year, followed by mental health and addictions programs (5.4 per cent) and community programs (5.0 per cent). The FAO projects that the long-term care program area will have the highest average annual growth rate over the six-year period, at 8.3 per cent, while other programs will decline by an average of -1.2 per cent per year due to the expiry of time-limited COVID-19-related spending. Lastly, spending on health capital is projected to grow at 3.1 per cent per year.
Given that there were significant time-limited investments related to the COVID-19 pandemic in 2021-22, and that the COVID-19 pandemic impacted service levels in many areas of the health sector, the FAO has also provided growth rates from 2019-20 to 2027-28 to provide a better indication of base health sector program spending growth. From 2019-20 to 2027-28, the FAO estimates base health sector spending will grow at an average annual rate of 5.0 per cent.
| Program Area | 2021-22 Actual Spending ($ billions) |
2027-28 Projected Spending ($ billions) |
Average Annual Growth Rate (%) 2021-22 to 2027-28 |
Average Annual Growth Rate (%) 2019-20 to 2027-28 |
|---|---|---|---|---|
| Hospitals | 26.4 | 31.5 | 3.0 | 4.0 |
| OHIP (physicians and practitioners) | 16.6 | 21.1 | 4.1 | 3.7 |
| Ontario public drug programs | 5.3 | 7.4 | 5.7 | 5.6 |
| Community programs | 5.2 | 7.0 | 5.0 | 5.6 |
| Mental health and addictions programs | 2.0 | 2.7 | 5.4 | 5.1 |
| Long-term care | 6.8 | 11.0 | 8.3 | 12.2 |
| Other programs | 11.2 | 10.4 | -1.2 | 4.1 |
| Health capital | 2.2 | 2.6 | 3.1 | 4.2 |
| Total Health Sector | 75.7 | 93.8 | 3.6 | 5.0 |
The following sections describe each program area and identify the key assumptions behind the FAO’s spending projections.
Hospitals
The hospitals program area includes provincial funding to support the operation of 140 public hospital corporations, funding for specialty psychiatric hospital services, and an adjustment to account for hospitals’ total operating spending from provincial and all other sources. The hospitals program is the largest health sector program area and comprises approximately 35 per cent of total health sector spending. The FAO projects hospitals program area spending will grow at an average annual rate of 3.0 per cent from 2021-22 to 2027-28. The two most significant factors behind the FAO’s spending projection are assumptions for hospital employee wage growth and hospital capacity.
The largest component of hospitals spending is compensation, which comprises approximately 60 per cent of total hospital operating expenses. Growth in compensation is primarily driven by wage increases, which are largely negotiated through collective bargaining agreements. From 2022-23 to 2024-25, the FAO estimates hospital employee wages will grow at an average annual rate of 1.5 per cent. This growth rate is below the historical average due to the impact of Bill 124,[7] which limits base salary increases to one per cent per year for a period of three years.[8] In 2022-23, over 90 per cent of unionized hospital employees are subject to wage restraint under Bill 124. In 2023-24, the share of employees subject to wage restraint under Bill 124 will drop to 56 per cent and, by the end 2024-25, nearly all hospital employees will have completed the three-year period of wage restraint under Bill 124. As collective agreements subject to Bill 124 expire, the FAO forecast assumes that wage growth will revert to the historical average of 2.4 per cent.
The FAO’s spending forecast for hospitals also reflects growth in hospital capacity, which is measured through the number of hospital beds. The FAO uses growth in hospital beds as a proxy for growth in the number of services provided by Ontario hospitals, which determines the required operating funding and staffing. Based on the FAO’s analysis of the Province’s hospital capacity expansion and infrastructure plans from the 2022 Ontario Budget, the FAO estimates that the number of hospital beds in Ontario will increase by 1,400 beds (4.0 per cent) from 2021-22 to 2027-28,[9] which will require approximately 10,000 additional hospital workers (includes nurses and personal support workers (see Chapter 5 for analysis) plus other hospital workers).
There are significant risks to the FAO’s hospitals program area spending forecast, including:
- Wage settlements above the historical average. The FAO’s hospitals program area spending forecast assumes wage growth is consistent with existing collective agreements and, for new collective agreements, historical long-term average growth in wages. However, given recent elevated inflation, there is the potential for above-average wage settlements,[10] which would lead to higher than projected spending.
- The legal challenge to Bill 124. On November 29, 2022, the Ontario Superior Court of Justice ruled that Bill 124, which limits base salary increases for most provincial employees to one per cent per year for a period of three years, was in violation of the Canadian Charter of Rights and Freedoms and was declared to be void and of no effect. The government has appealed this decision. If the government is unsuccessful in its appeal, then the FAO estimates that provincial spending on wages for hospital employees could increase by an additional $3.6 billion over the six-year period to 2027-28.[11]
Ontario Health Insurance Program (OHIP)
OHIP provides funding for more than 6,000 insured services to eligible Ontario residents from various providers, including physicians, hospitals, community laboratories, independent health facilities and other clinics. OHIP program area spending represents approximately 23 per cent of health sector spending. The FAO projects OHIP program area spending will grow at an average annual rate of 4.1 per cent from $16.6 billion in 2021-22 to $21.1 billion in 2027-28.
Physician Services
The largest component of the OHIP program area is physician services, which comprises over 80 per cent of program area spending. Physicians bill the Province for services they provide, and those fees are set under the terms of the physician services agreement. Therefore, the most significant drivers of OHIP program area spending are growth in physician fees and the number of services provided by physicians.
The current physician services agreement between the Ministry of Health and the Ontario Medical Association expires on March 31, 2024. This agreement provides for 1.0 per cent increases in physician fees in 2021-22 and 2022-23, with the fee increase in 2023-24 to be determined based on actual expenditures in that year.[12] Beyond 2023-24, the FAO estimates that physician fee growth will revert to historical averages.[13] Overall, the FAO forecast assumes that physician fees will increase at an average annual rate of 1.7 per cent from 2021-22 to 2027-28.
The FAO estimate assumes that normal volumes of physician services will resume after decreased volumes in 2020-21 and 2021-22 due to the COVID-19 pandemic, and that future physician service volumes will grow in line with the needs of Ontario’s growing and aging population. Overall, the FAO projection assumes the number of services provided by Ontario physicians will increase at an average annual rate of 1.9 per cent from 121 million services in 2022-23 to 133 million in 2027-28.[14]
Combined, the FAO estimates increases in physician fees and physician service volumes will result in the physician services portion of OHIP spending growing at an average annual rate of 3.9 per cent starting in 2021-22, reaching $18.6 billion in 2027-28.
Other OHIP Care Services
The remaining OHIP program area spending is for services provided by other practitioners, including physiotherapy, optometry, dentistry, podiatry and nurse practitioners, as well as community laboratories and out of province/country programs. The FAO estimates that other OHIP care services spending will increase at an average annual rate of 5.6 per cent starting in 2021-22, reaching $2.5 billion in 2027-28. This reflects the FAO’s projection for fee growth for non-physician OHIP insured services and increased demand for those services by Ontario’s growing and aging population.
Ontario Public Drug Programs
Ontario public drug programs provide funding for the cost of about 5,000 drug products through six different programs, the largest of which is the Ontario Drug Benefit program for seniors. The FAO projects Ontario public drug programs spending will grow at an average annual rate of 5.7 per cent from 2021-22 to 2027-28. The FAO’s forecast incorporates projected reductions in certain drug prices as well as trends in the substitution of brand name drugs with generic versions, which will place downward pressure on spending growth. However, these factors will be more than offset by projected increased use of higher cost drugs and demographic changes. The FAO estimates that the growth rate of Ontarians aged 65 and over, which drives demand for the Ontario Drug Benefit program, will average 3.4 per cent per year, from 2021-22 to 2027-28.
Community Programs
Community programs provide community and home-based supports through five programs: home care, community support services, community health centres, assisted living in supportive housing and acquired brain injury. Community programs spending comprises approximately 7.5 per cent of total health sector spending. The FAO projects community programs spending will grow at an average annual rate of 5.0 per cent from 2021-22 to 2027-28.
The FAO’s forecast is driven by projected spending in home care and community support services, reflecting the Province’s commitment to increase home care service levels and the Province’s decision to provide permanent wage increases for personal support workers (see Chapter 5, section B for more details).
On April 14, 2022, the Province passed the Supporting Retention in Public Services Act, which established a permanent wage enhancement program[15] for eligible personal support workers in home care, long-term care and hospitals. This makes the wage increases for personal support workers that were first established in October 2020 permanent. The program provides home care personal support workers with a permanent wage increase of $3 per hour for every hour of direct care provided through a publicly funded home and community care program. The FAO estimates this will increase community programs spending by a total of $1.3 billion from 2022-23 to 2027-28.
Mental Health and Addictions Programs
Mental health and addictions programs include community mental health, child and youth mental health, and the addiction program. Mental health and addictions programs spending comprises approximately three per cent of total health sector spending. The FAO estimates that mental health and addictions programs spending will grow at an average annual rate of 5.4 per cent from $2.0 billion in 2021-22 to $2.7 billion in 2027-28.
The FAO’s mental health and addictions spending forecast is based primarily on planned investments under the Province’s Roadmap to Wellness.[16] Under this plan, the Province has committed to invest $3.8 billion over 10 years in mental health. Half of this funding is being provided by the federal government under the Canada-Ontario Home and Community Care and Mental Health and Addictions Services Funding Agreement.[17] The first of two bilateral agreements, which allocated $770 million of federal funding, expired on March 31, 2022, and the Province and the federal government must now agree on a second five-year action plan to allocate the remaining $1.16 billion of federal funds. The FAO assumes this funding will be allocated evenly with $232 million in each year from 2022-23 to 2026-27.
In addition, in the 2022 Ontario Budget, the Province committed $204 million to expand mental health capacity in 2022-23, which the FAO assumes will be a permanent capacity expansion.
Long-Term Care
The long-term care (LTC) program area provides funding to support residents in LTC homes in Ontario. There are 626 LTC homes in Ontario, which are run by for-profit operators, not-for-profit operators, municipalities and First Nations. LTC homes receive funding from the long-term care program based on the number of beds in operation and the services they provide. The majority of long-term care program area spending is provided through a daily subsidy called the Level of Care per diem payment. The Level of Care per diem is paid to LTC home operators for each bed in operation to cover the cost of nursing and personal care, basic accommodation, programs and support services, and raw food.
The long-term care program area is funded through the Ministry of Long-Term Care and comprises approximately 10 per cent of total health sector spending. Overall, the FAO estimates that the long-term care program area will have the highest spending growth in the health sector, at an average annual rate of 8.3 per cent from $6.8 billion in 2021-22 to $11.0 billion in 2027-28. This growth is primarily driven by the Province’s commitments to add 30,000 net new long-term care beds by the end of 2028, redevelop approximately 30,000 existing beds, and increase average hours of direct care provided to long-term care residents from a nurse or personal support worker from 2.75 hours in 2018-19 to four hours in 2024-25 (see Chapter 5, section B for more analysis).
The FAO’s long-term care forecast also includes spending of $2.1 billion over six years to support wage enhancements for personal support workers. As noted above, the Province established a permanent wage enhancement program for eligible personal support workers in home care, long-term care and hospitals. This makes the wage increases for personal support workers that were first established in October 2020 permanent and provides eligible personal support workers in long-term care with a $3 per hour wage increase.
Other Programs
Other programs include public health programs, such as Official Local Health Agencies and the Outbreaks of Diseases program; emergency health services, such as payments to support ambulance services; payments to provincial agencies, such as Ontario Health; as well as ministry administration, information technology and other expenses. The FAO projects other programs spending will decrease at an average annual rate of 1.2 per cent from 2021-22 to 2027-28. This decline in spending is the result of time-limited COVID-19-related spending in 2021-22. Removing the effect of time-limited spending, the FAO estimates other programs spending will grow by an average annual rate of 4.1 per cent from 2019-20 to 2027-28.
Key contributors to other programs spending growth in the FAO’s forecast are cancer treatment services and cancer screening programs, which comprise one-quarter of other programs spending. The FAO projects combined spending under these programs will grow by an average of 4.0 per cent annually from 2019-20 to 2027-28.
Other key areas of spending growth are public health, emergency services, health policy and research, and the assistive devices program. Combined, these programs make up one-third of other programs spending. The FAO estimates these programs will grow at an average annual rate of 3.9 per cent from 2019-20 to 2027-28, reflecting FAO projections for wage growth, health sector inflation, and population growth and aging.
Health Capital
Health capital spending includes the net amortization expense for hospital infrastructure and information & information technology (I&IT) projects, as well as community health programs, public health laboratories and Ministry of Health agencies. Health sector capital assets include approximately 913 buildings, totalling about 90 million square feet, as well as machinery and equipment (such as medical imaging machines and ventilators). The FAO projects 3.1 per cent average annual growth in health capital spending from 2021-22 to 2027-28. This projection is based on the amortization profile of hospital infrastructure assets and the Province’s 10-year infrastructure plan in the 2022 Ontario Budget.
Investments in Health Sector Infrastructure
The Province provides funding to invest in health sector infrastructure through 11 programs of which the largest are Major Hospital Projects, Small Hospital Projects, the Health Infrastructure Renewal Fund, the Long-Term Care Program and Community Health Programs. In the 2022 Ontario Budget, the Province plans to invest $44.9 billion in health sector infrastructure over 10 years, including $40.2 billion for hospitals and $4.7 billion for other health sector infrastructure programs. The total 10-year health sector infrastructure investment plan represents an $11.2 billion increase from the 10-year plan in the 2021 Ontario Budget. Most of the 10-year infrastructure spending plan increase is for hospitals ($9.9 billion), with the remaining $1.3 billion increase for other health sector infrastructure programs.
If the $44.9 billion planned investment in health sector infrastructure is achieved, it would be a $13.6 billion (43.3 per cent) increase from the $31.3 billion health sector infrastructure investment over the previous 10 years from 2012-13 to 2021-22. On a real basis, the Province’s 10-year health infrastructure plan in the 2022 budget represents a smaller increase in spending on infrastructure compared to the previous 10-year period. After adjusting for inflation, the Province spent $36.7 billion over the previous 10 years (in 2021 dollars) and plans to spend $40.7 billion (in 2021 dollars) over the next 10 years. Therefore, in real terms, the 10-year health sector infrastructure spending plan in the 2022 budget represents a $4.0 billion (10.8 per cent) increase in investments compared to the previous 10-year period.
Figure 2 Actual and planned investments in health sector infrastructure in nominal and real (2021) dollars, 2012-13 to 2031-32, $ millions
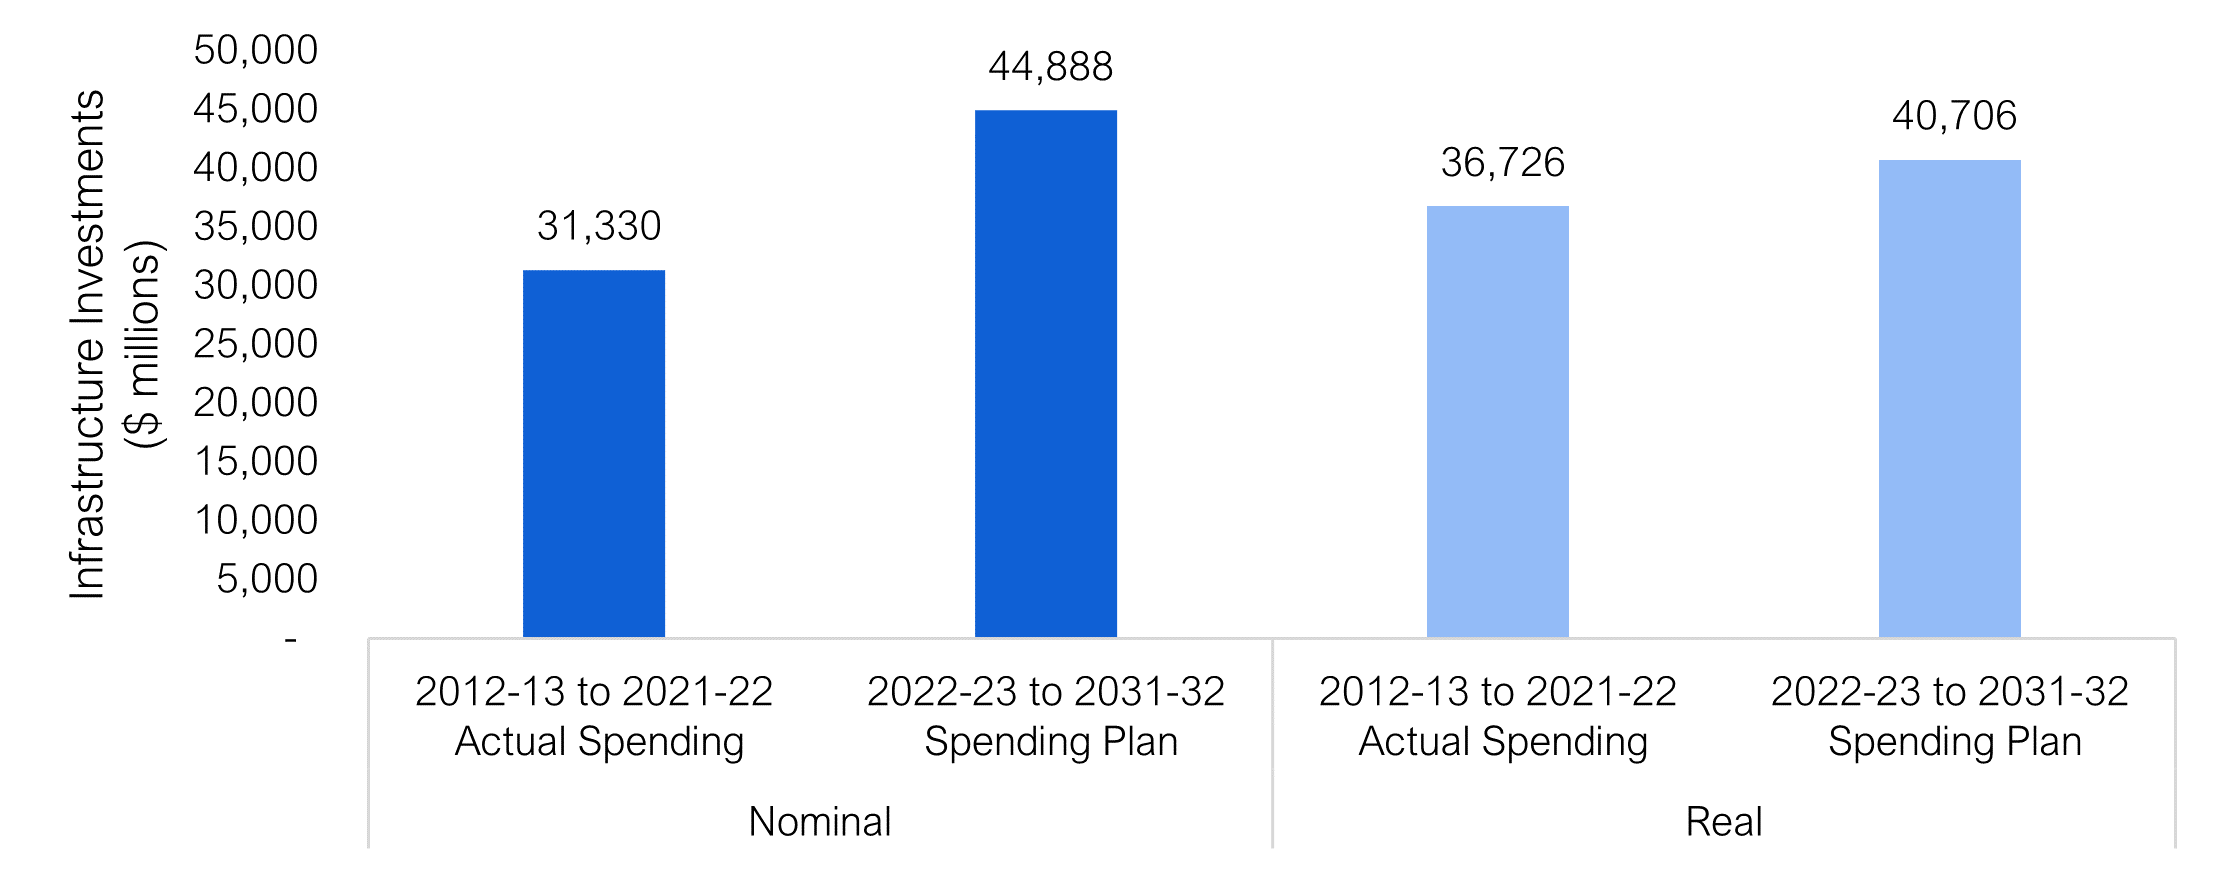
Source: 2022 Ontario Budget and FAO analysis of information provided by the Province
5. Review of Five Health Sector Priority Areas
On March 29, 2022, the Province introduced its “Plan to Stay Open,” in order to build a “stronger, more resilient health care system that is better able to respond to crisis.”[18] The government’s plan focused on expanding Ontario’s health workforce, “shoring-up” domestic production of health care supplies and building more hospital beds.
Subsequently, on August 18, 2022, the Province introduced the second phase of its Plan to Stay Open, which it called “Health System Stability and Recovery.”[19] This plan is intended to “address the immediate pressures facing the health system, and to stabilize the health and long-term care sectors for the future.”
On February 2, 2023, the Province introduced its latest plan “Your Health: A Plan for Connected and Convenient Care.”[20] This plan focuses on providing “convenient options closer to home while shortening wait times for key services across the province and growing the health care workforce for years to come.”
While the same issues are raised across all three plans, this chapter is structured around the five areas of focus identified in the August 18, 2022 plan. Specifically:
- Hospital Capacity;
- Home and Long-Term Care;
- Surgical Waitlists and Wait Times;
- Emergency Departments; and
- Ontario’s Health Sector Workforce.
This chapter will review each area of focus as it relates to the FAO’s health sector spending projection and program area discussion in Chapters 3 and 4. To the extent possible, the FAO will identify the Province’s objectives under each area of focus and the estimated outcomes.
A. Hospital Capacity
Background and Context
In 2005, the Province had approximately 31,865 hospital beds. Over the next 14 years, the Province added 830 hospital beds, an increase of 2.6 per cent, while Ontario’s population increased by 16.1 per cent and the population of Ontarians aged 65 and older, who occupy over 50 per cent of hospital bed days, grew by 56 per cent.
Figure 3 Growth in elderly Ontarians has exceeded growth in the number of hospital beds
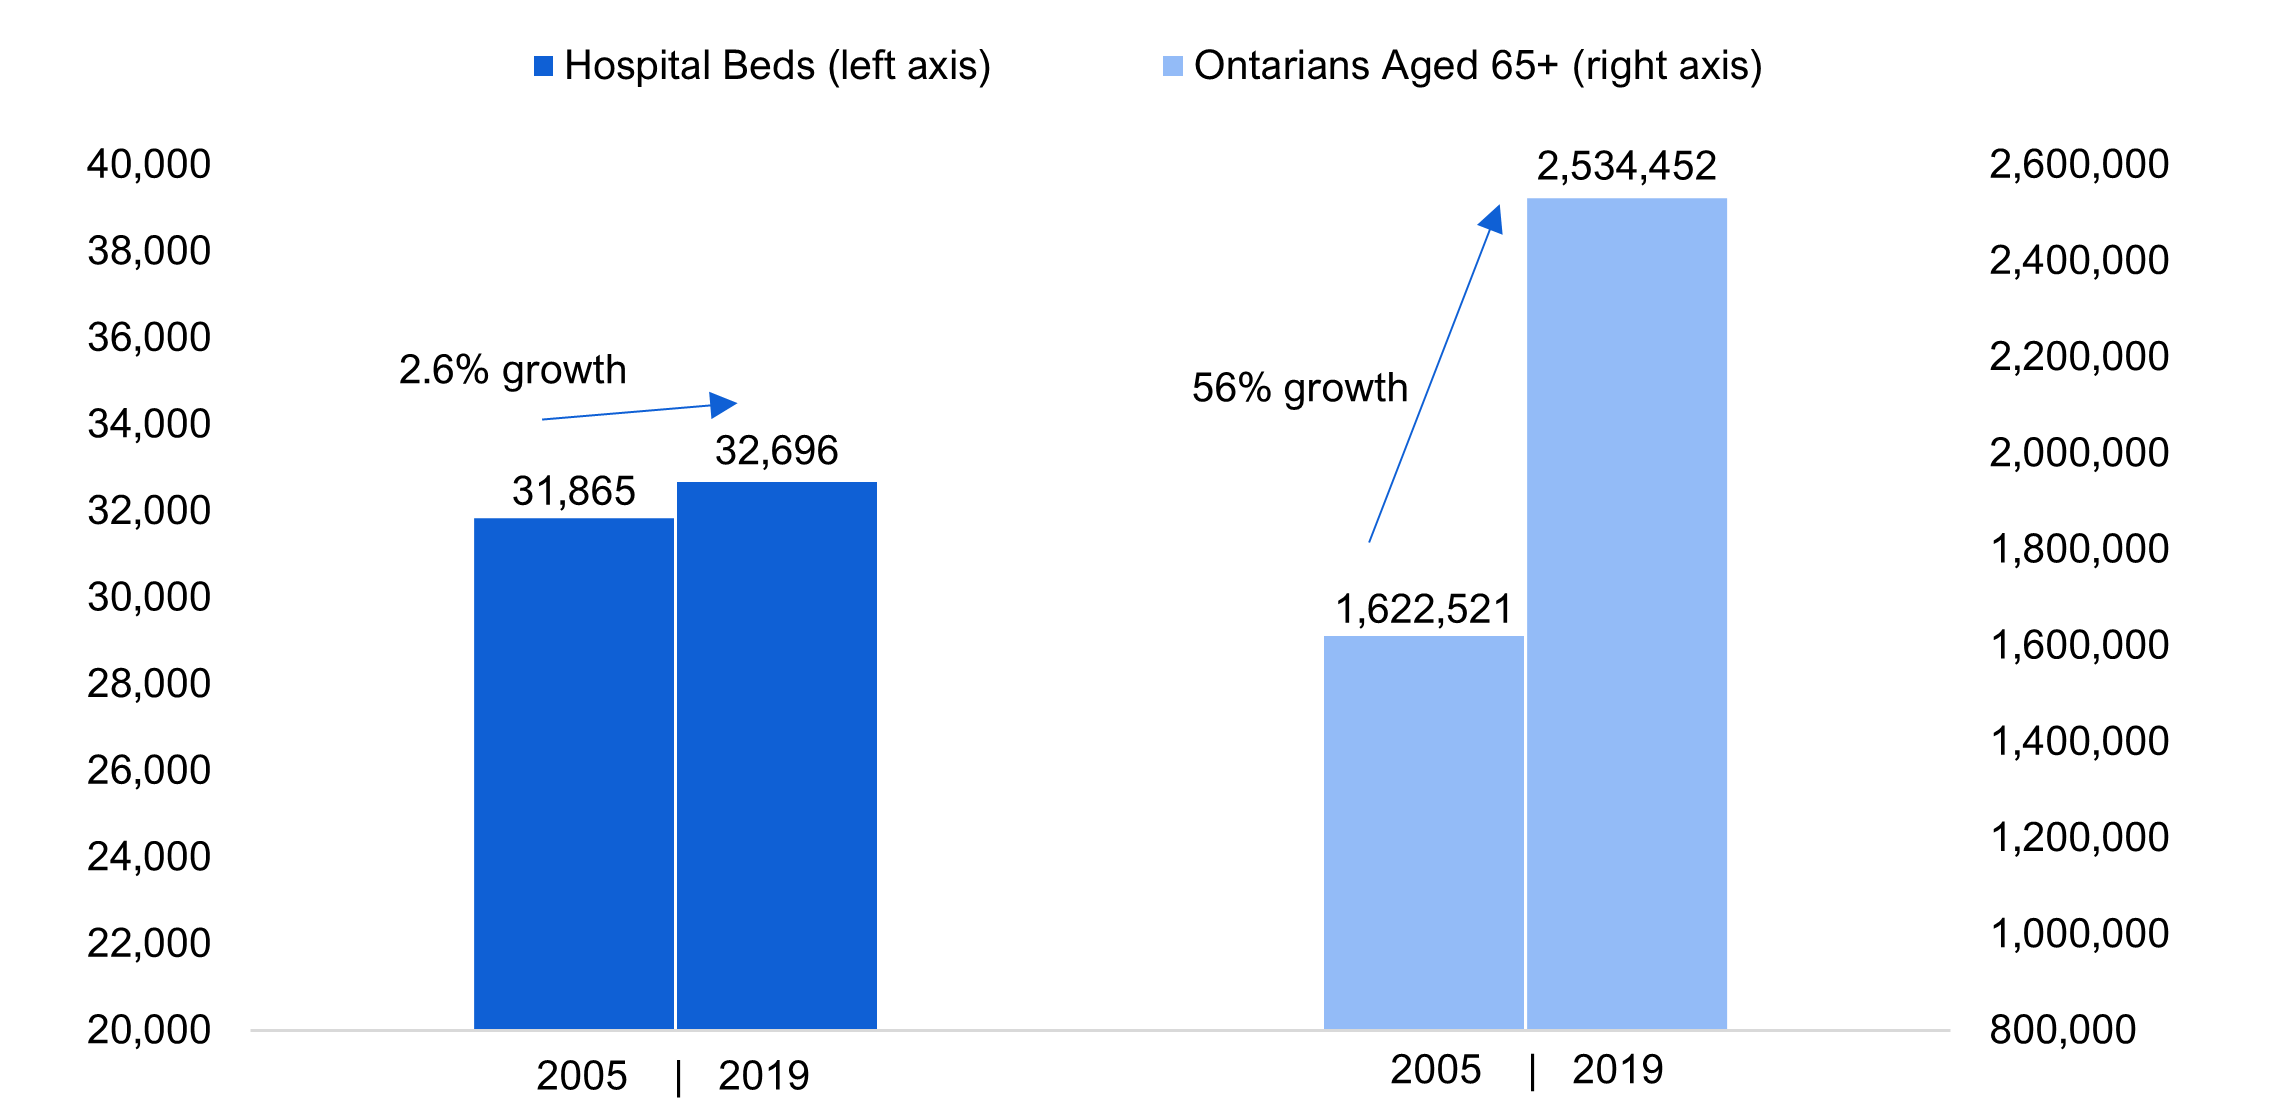
Note: Ontarians aged 65 and older occupy over 50 per cent of hospital bed days.
Source: FAO analysis of information provided by the Ministry of Health.
In addition, a growing proportion of existing hospital bed capacity is being occupied by patients waiting to go elsewhere. Limited growth in health sector capacity outside of hospitals, especially in long-term care homes, is contributing to alternate level of care (ALC) patients occupying more hospital beds. A patient is designated as ALC when they no longer need the level of care they are receiving in hospital but continue to occupy a hospital bed while waiting to go elsewhere such as a long-term care home or rehabilitation facility. Between 2012-13 and 2019-20, the share of hospital capacity occupied by ALC patients increased from 13.3 per cent to 17.0 per cent.
Figure 4 Share of hospital capacity occupied by ALC patients
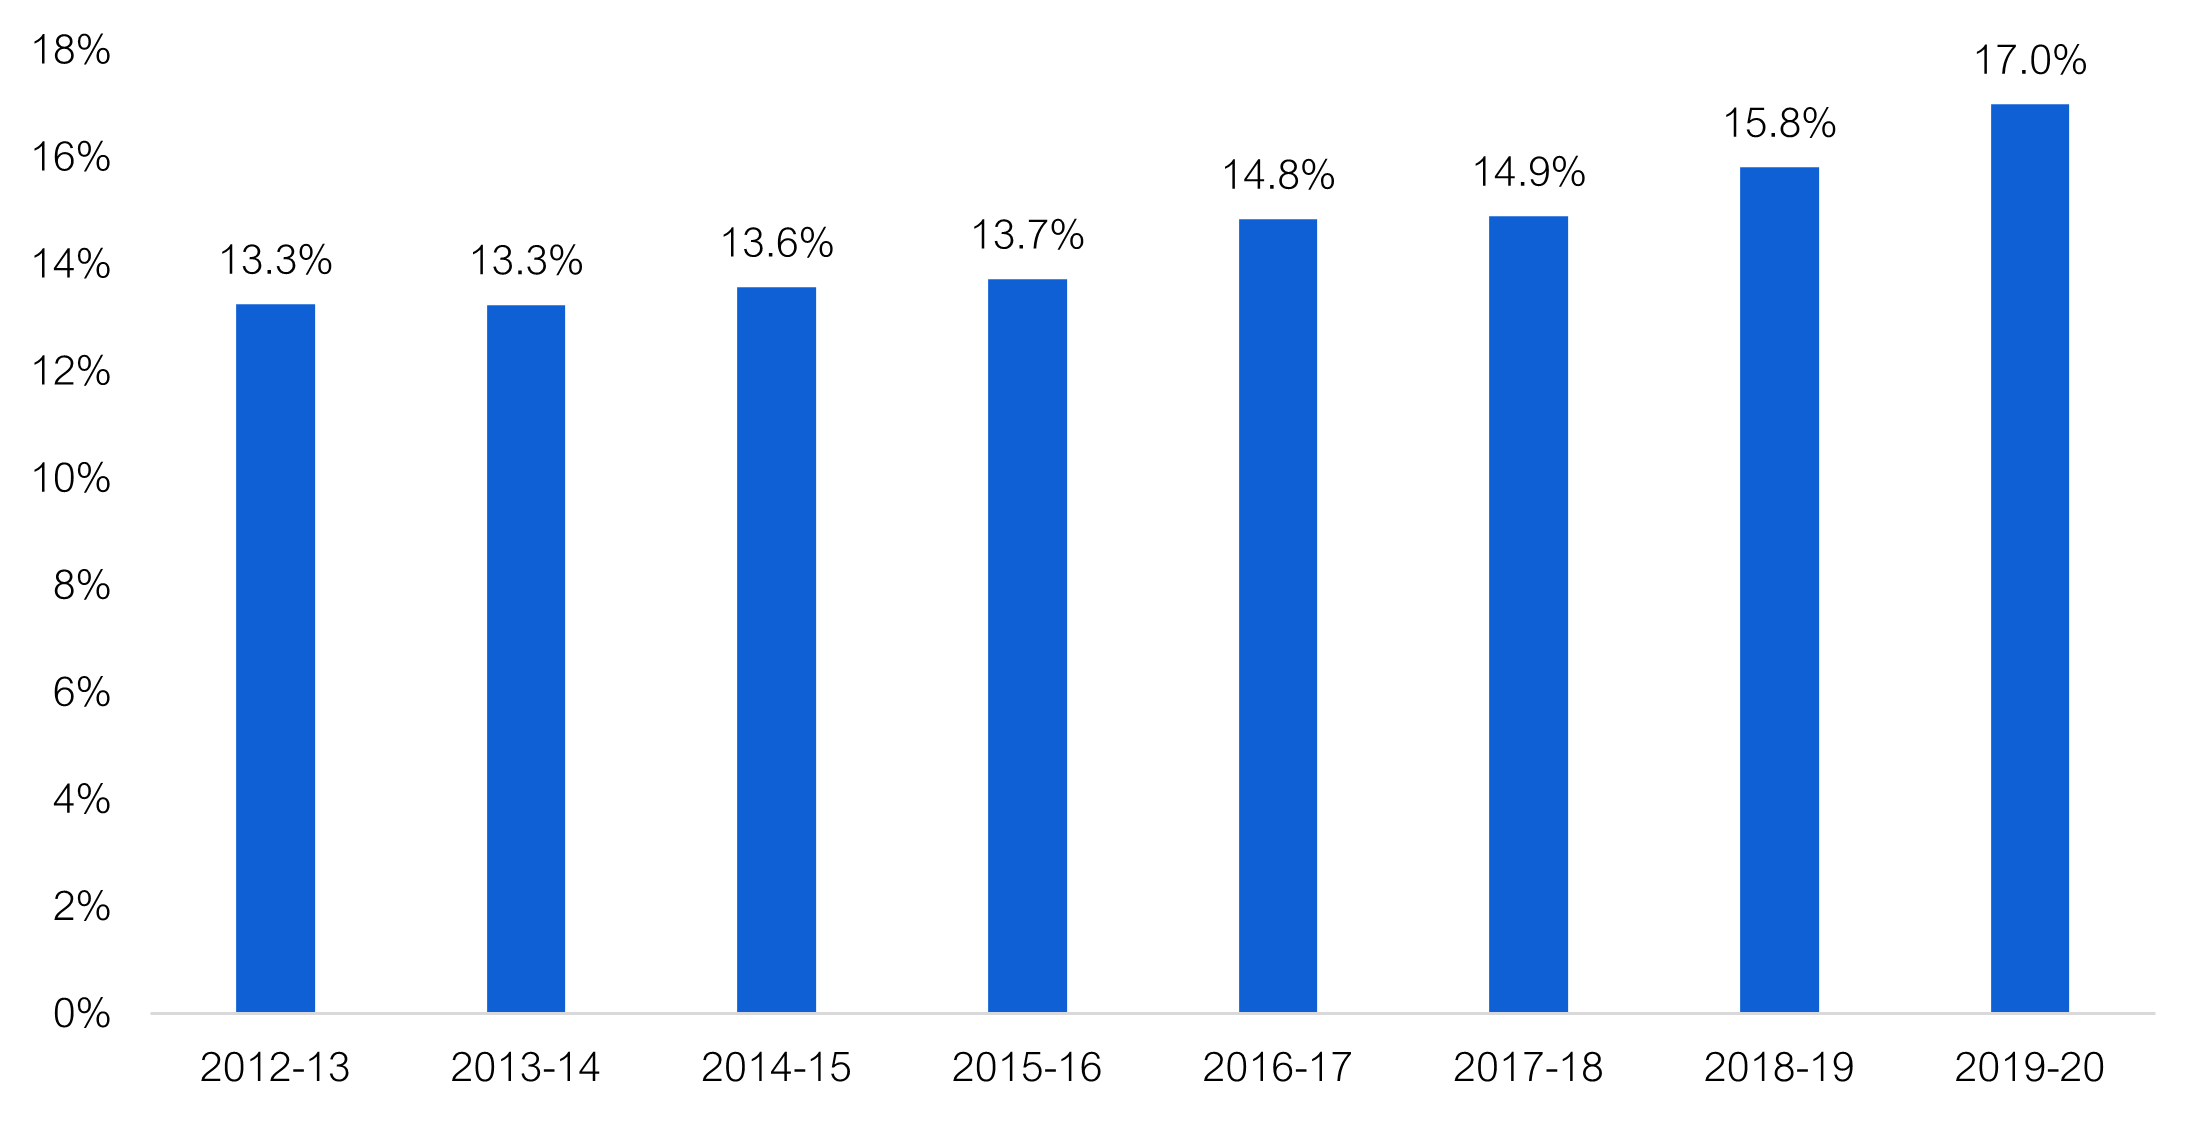
Note: A patient is designated as alternate level of care (ALC) when they no longer need care in a hospital but continue to occupy a hospital bed while waiting to go elsewhere such as a long-term care home or rehabilitation facility.
Source: FAO analysis of information provided by the Ministry of Health
This limited increase in health sector capacity, both inside and outside of hospitals, combined with Ontario’s growing and aging population, has contributed to capacity issues in hospitals. From 2017-18 to 2019-20, the average occupancy rate for Ontario’s hospitals was 96 per cent, while each year an average of 42 hospitals reported average occupancy rates for acute care beds of over 100 per cent. High hospital occupancy rates contribute to “hallway health care” with approximately 1,000 patients receiving care in hallways or other unconventional spaces on any given day from 2017-18 to 2019-20.
More recently, in 2020-21 and 2021-22, Ontario had fewer hospitalizations than in either of 2018-19 or 2019-20, due to the COVID-19 pandemic.[21] This resulted in lower overall occupancy and fewer patients receiving care in hallways or other unconventional spaces. However, in the first quarter of 2022-23, occupancy rose to 93 per cent, which is close to the pre-pandemic average, and nearly 1,300 patients received care in hallways or other unconventional spaces on any given day, which is the highest number since the Province started collecting this data in 2017.
Figure 5 Average annual hospital occupancy and average daily number of hallway patients, by fiscal year
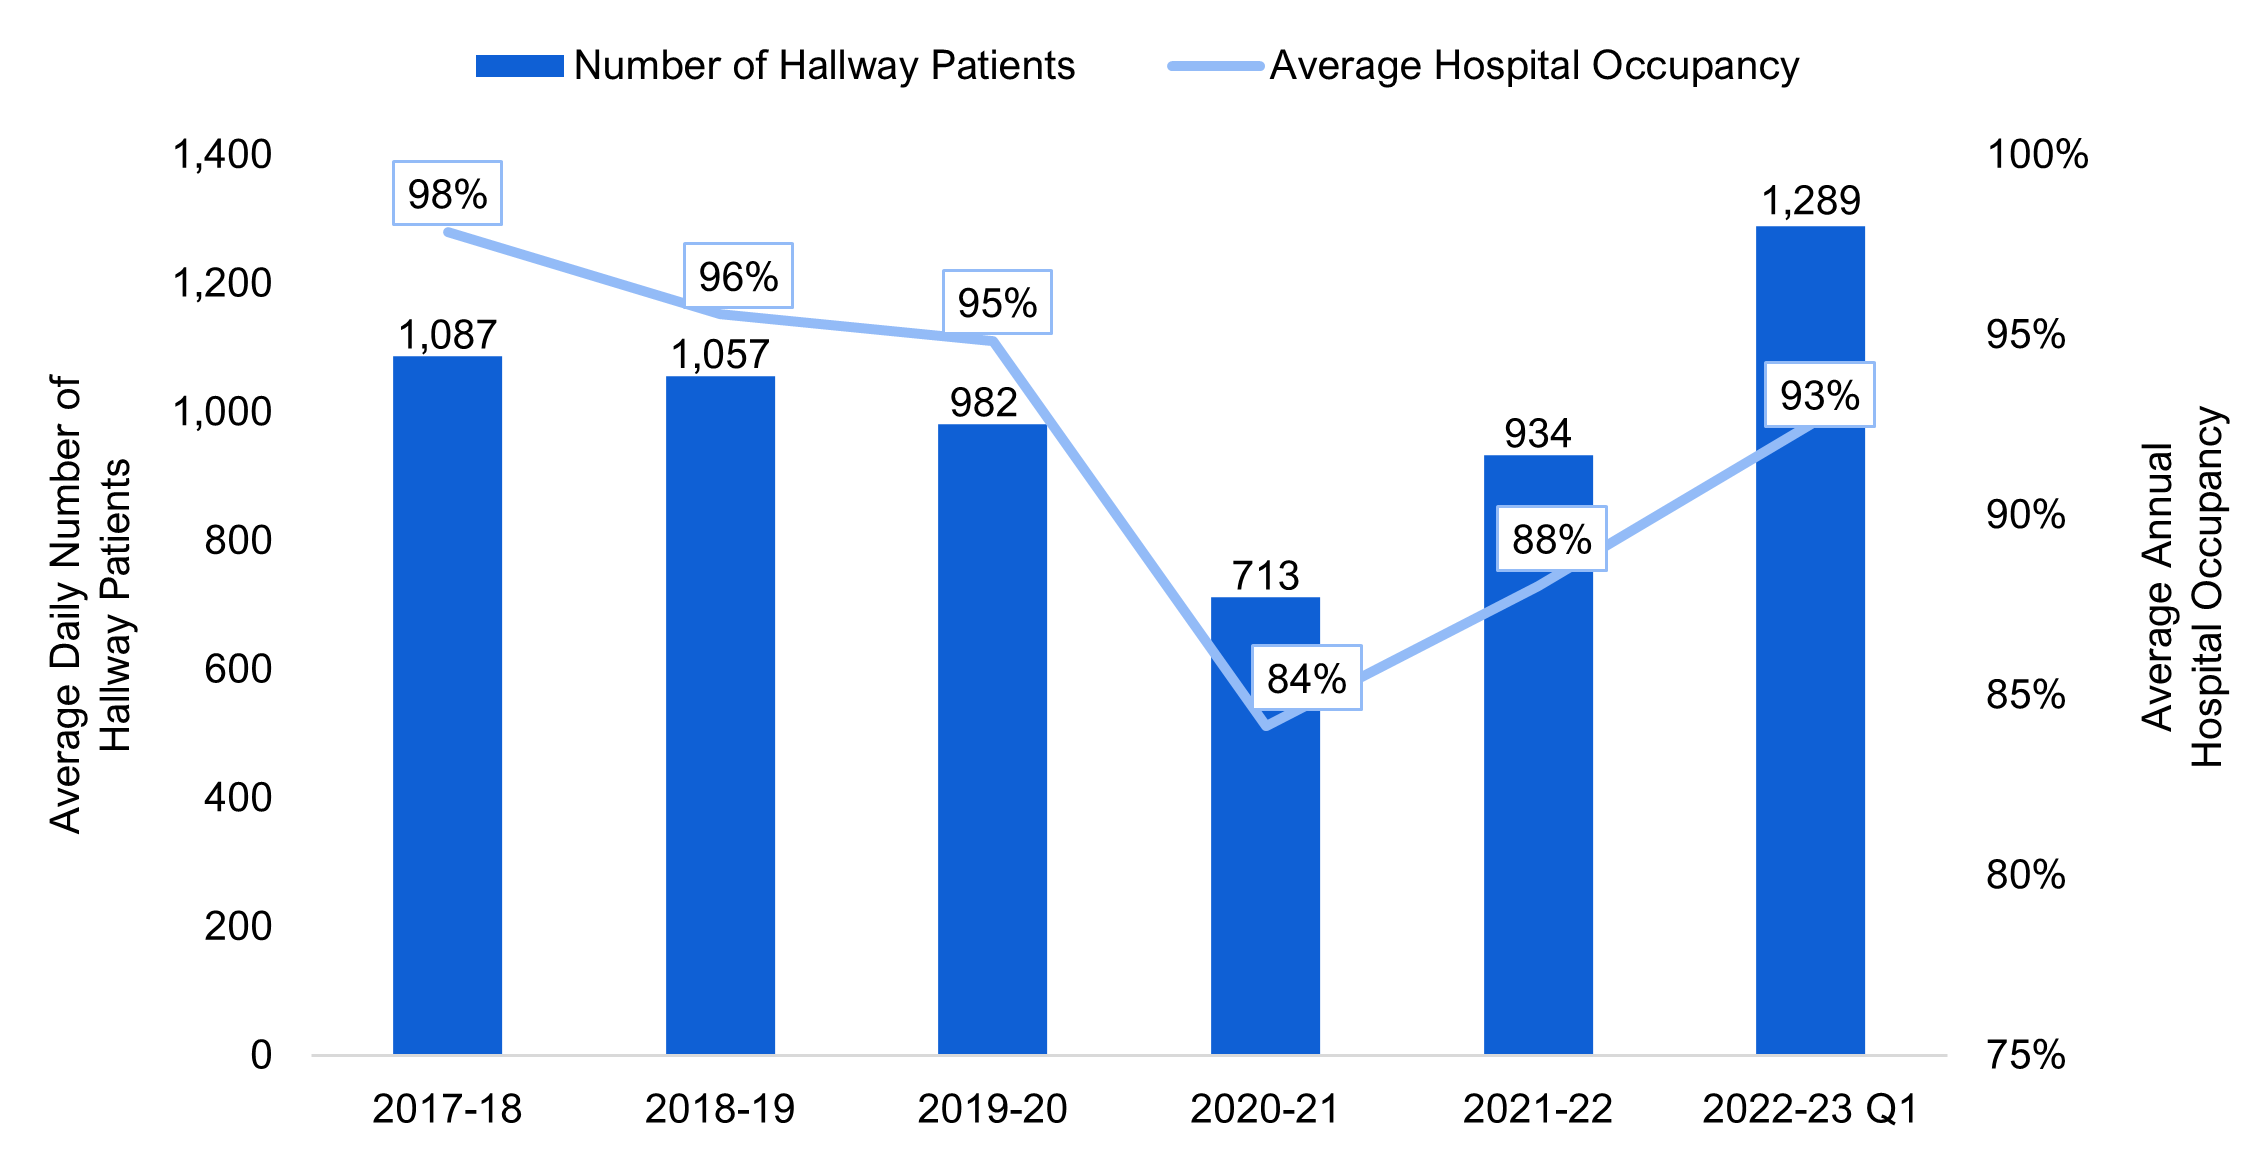
Note: 2022-23 Q1 is for April to July of 2022. “Hallway patients” refers to hospital patients who received care in hallways or other unconventional spaces.
Source: FAO analysis of information provided by the Ministry of Health.
In addition to growing numbers of patients receiving care in hallways or unconventional spaces, capacity pressures are manifesting in other hospital functions. For example, wait times for a hospital bed for patients admitted from the emergency department are currently the longest in over 15 years.[22] Finally, capacity pressures can result in hospitals being unable to respond to surges in demand. For example, in November 2022, the Province reported no available paediatric ICU beds for a 12-day period due to the unusual influenza (flu) and respiratory syncytial virus (RSV) seasons.[23]
Going forward, the Province’s plan to alleviate capacity pressures in hospitals involves two primary measures:
- Increasing the total number of hospital beds and continuing the operation of beds added in response to the COVID-19 pandemic; and
- Freeing up existing hospital capacity by ensuring that ALC patients in hospitals move to care settings outside of hospitals at a faster pace.
Plan to Create New Hospital Capacity
In the 2022 Ontario Budget, the Province plans to invest $40.2 billion in hospital infrastructure over the 10-year period from 2022-23 to 2031-32. This represents a $9.9 billion increase from the $30.2 billion 10-year hospital infrastructure investment plan from the 2021 Ontario Budget. Of the $40.2 billion hospital infrastructure investment plan, funding will be allocated to repair and replace existing hospitals, as well as to build new hospitals and expand the capacity of existing hospitals.
Overall, the Province plans to add 3,000 net new hospital beds from 2021-22 to 2031-32 through its 10-year hospital infrastructure plan, of which the FAO estimates that 1,400 new hospital beds will be in operation by 2027-28. In addition, the Province has announced that it will continue to fund the operation of beds in hospitals and alternate health facilities that were added in response to the COVID-19 pandemic. The FAO estimates the continuation of these beds will increase hospital capacity by approximately 3,100 beds. Combined, the FAO estimates that hospital bed capacity will increase by approximately 4,500 beds from pre-pandemic levels to the end of the forecast period, from 32,696 beds in 2019-20 to 37,224 beds in 2027-28. This represents a 13.8 per cent increase in hospital beds over the eight-year period, compared to the 2.6 per cent increase in hospital beds over the 14-year period from 2005 to 2019.
Figure 6 FAO hospital bed projection by year, 2019-20 to 2027-28
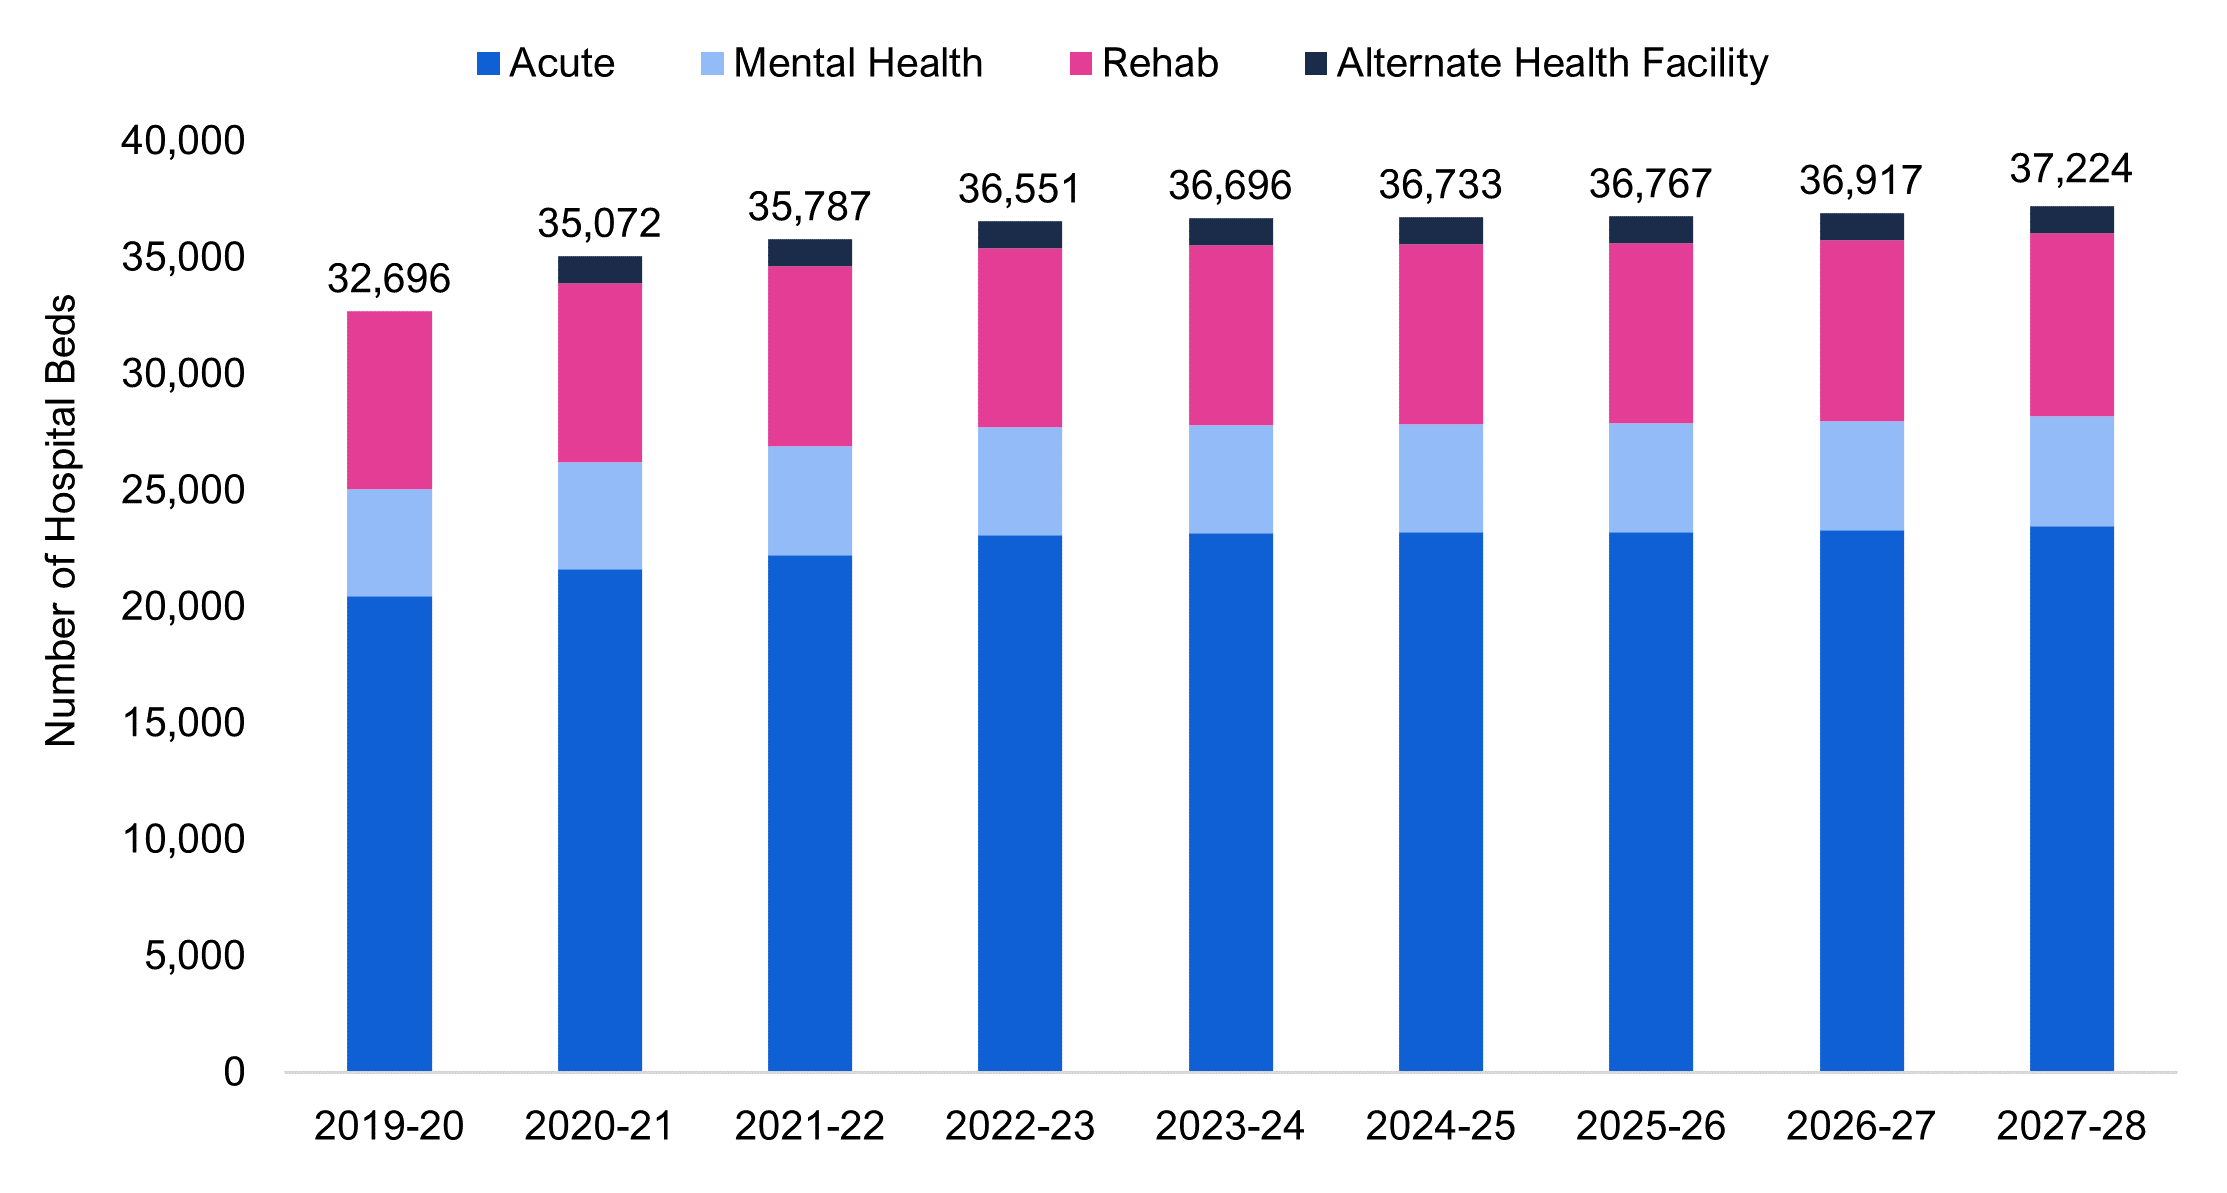
Note: Alternate Health Facility refers to beds in alternate health facilities such as retirement homes that are available to hospitals to meet surges in patient demand.
Source: FAO analysis of information provided by the Ministry of Health.
Plan to Free Up Existing Hospital Capacity
As of September 2022, approximately 5,000 ALC patients were waiting in Ontario hospitals for care elsewhere. Of those patients, about 2,000 were waiting for a long-term care bed and 540 were waiting for home care. The Province plans to free up 2,500 beds occupied by patients waiting for a long-term care bed or home care through two areas of focus.[24] The first, which the FAO assumes is intended to free up 2,000 beds,[25] is through the More Beds, Better Care Act, 2022 (known as Bill 7), which provides hospitals with greater flexibility to move ALC patients out of hospital beds and into long-term care homes.
Bill 7 allows hospital patients designated as ALC to be assessed for eligibility for long-term care, discharged from hospital, and admitted to a long-term care home that was not selected by the patient or their substitute decision maker. While patients cannot be physically transferred without consent, hospitals are required to charge discharged patients a fee of $400 every 24 hours that they remain in the hospital.[26] ALC patients can be sent to any appropriate long-term care home within 70 kilometres of their preferred location in southern Ontario and 150 kilometres in northern Ontario.
The second area of focus, which the FAO assumes is intended to free up 500 beds,[27] is through increased funding for community care so that ALC patients waiting for home care can leave the hospital faster.[28]
FAO Analysis
The Province plans to address capacity issues in Ontario hospitals by adding 4,500 new beds from 2019-20 to 2027-28 and freeing up 2,500 existing beds occupied by ALC patients, for a total increase in available capacity of 7,000 hospital beds. However, the FAO expects that it is unlikely that the Province will achieve its 7,000 hospital beds target under current policies.
First, with respect to the 4,500 beds that the Province plans to add by 2027-28, as outlined in Chapter 3, the FAO estimates that the Province has not allocated sufficient funding to the health sector. To ensure the 4,500 additional hospital beds can be operated, the Province must increase funding to the health sector beginning in 2023-24.
Second, to free up 2,500 existing beds occupied by ALC patients, the Province will need to place all 2,000 ALC patients waiting for a long-term care bed, as of September 2022, and permanently free up those hospital beds for other patients. There are over 39,000 Ontarians on the waitlist for long-term care and, in September of 2022, the median wait time for hospital ALC patients discharged to long-term care was 39 days. To free up all 2,000 beds occupied by ALC patients waiting for a long-term care placement, the Province must effectively reduce time to placement from hospitals from 39 days to 0 days. Bill 7 does give patients in hospitals waiting for a long-term care bed priority over patients waiting in the community,[29] however, a space must still be available for the patient and the long-term care home must have the necessary supports to meet the patient’s care needs. Compounding this issue is that patients that wait the longest in hospitals for long-term care tend to have specialized needs and support requirements that are not offered in all long-term care homes.[30] Overall, as of December 2022, the Province had reduced the number of beds occupied by ALC patients waiting for long-term care by 350.[31] However, this means that the Province must permanently free up an additional 1,650 beds occupied by ALC patients waiting for a long-term care bed to achieve its target. For the reasons stated above, the FAO expects that this will be unlikely.
Finally, even if the Province succeeds in increasing available hospital capacity by 7,000 beds, that will not be sufficient to serve the growth in demand for hospital services from Ontario’s growing and aging population. From 2019-20 to 2027-28, the FAO estimates that Ontario’s population will increase by 12 per cent, while the number of Ontarians aged 65 and over will increase by 30 per cent. In total, the FAO estimates that this population growth and aging will increase demand for hospital services by 21 per cent.[32] As a result, the Province would need to increase available hospital capacity by 7,500 beds just to meet the projected growth in demand for hospital services from 2019-20 to 2027-28.
Therefore, even if the Province achieves its plan to add 4,500 new hospital beds and free up 2,500 existing beds, it will still be 500 beds short of the estimated 7,500 beds needed just to serve the growth in demand for hospital services from 2019-20 to 2027-28. This suggests that without additional measures, Ontario will have less available hospital capacity relative to need in 2027-28 than in 2019-20.
B. Home and Long-Term Care
Background and Context
On average, older Ontarians use more health resources than younger Ontarians. Although the average Ontarian benefits from $4,900 of health care spending per year, Ontarians aged 65 to 69 benefit from $7,500 of health care spending per year on average, while Ontarians aged between 75 and 79 benefit from $11,900, and Ontarians over the age of 90 benefit from $29,600.
Figure 7 Government of Ontario health care spending per capita by age, $
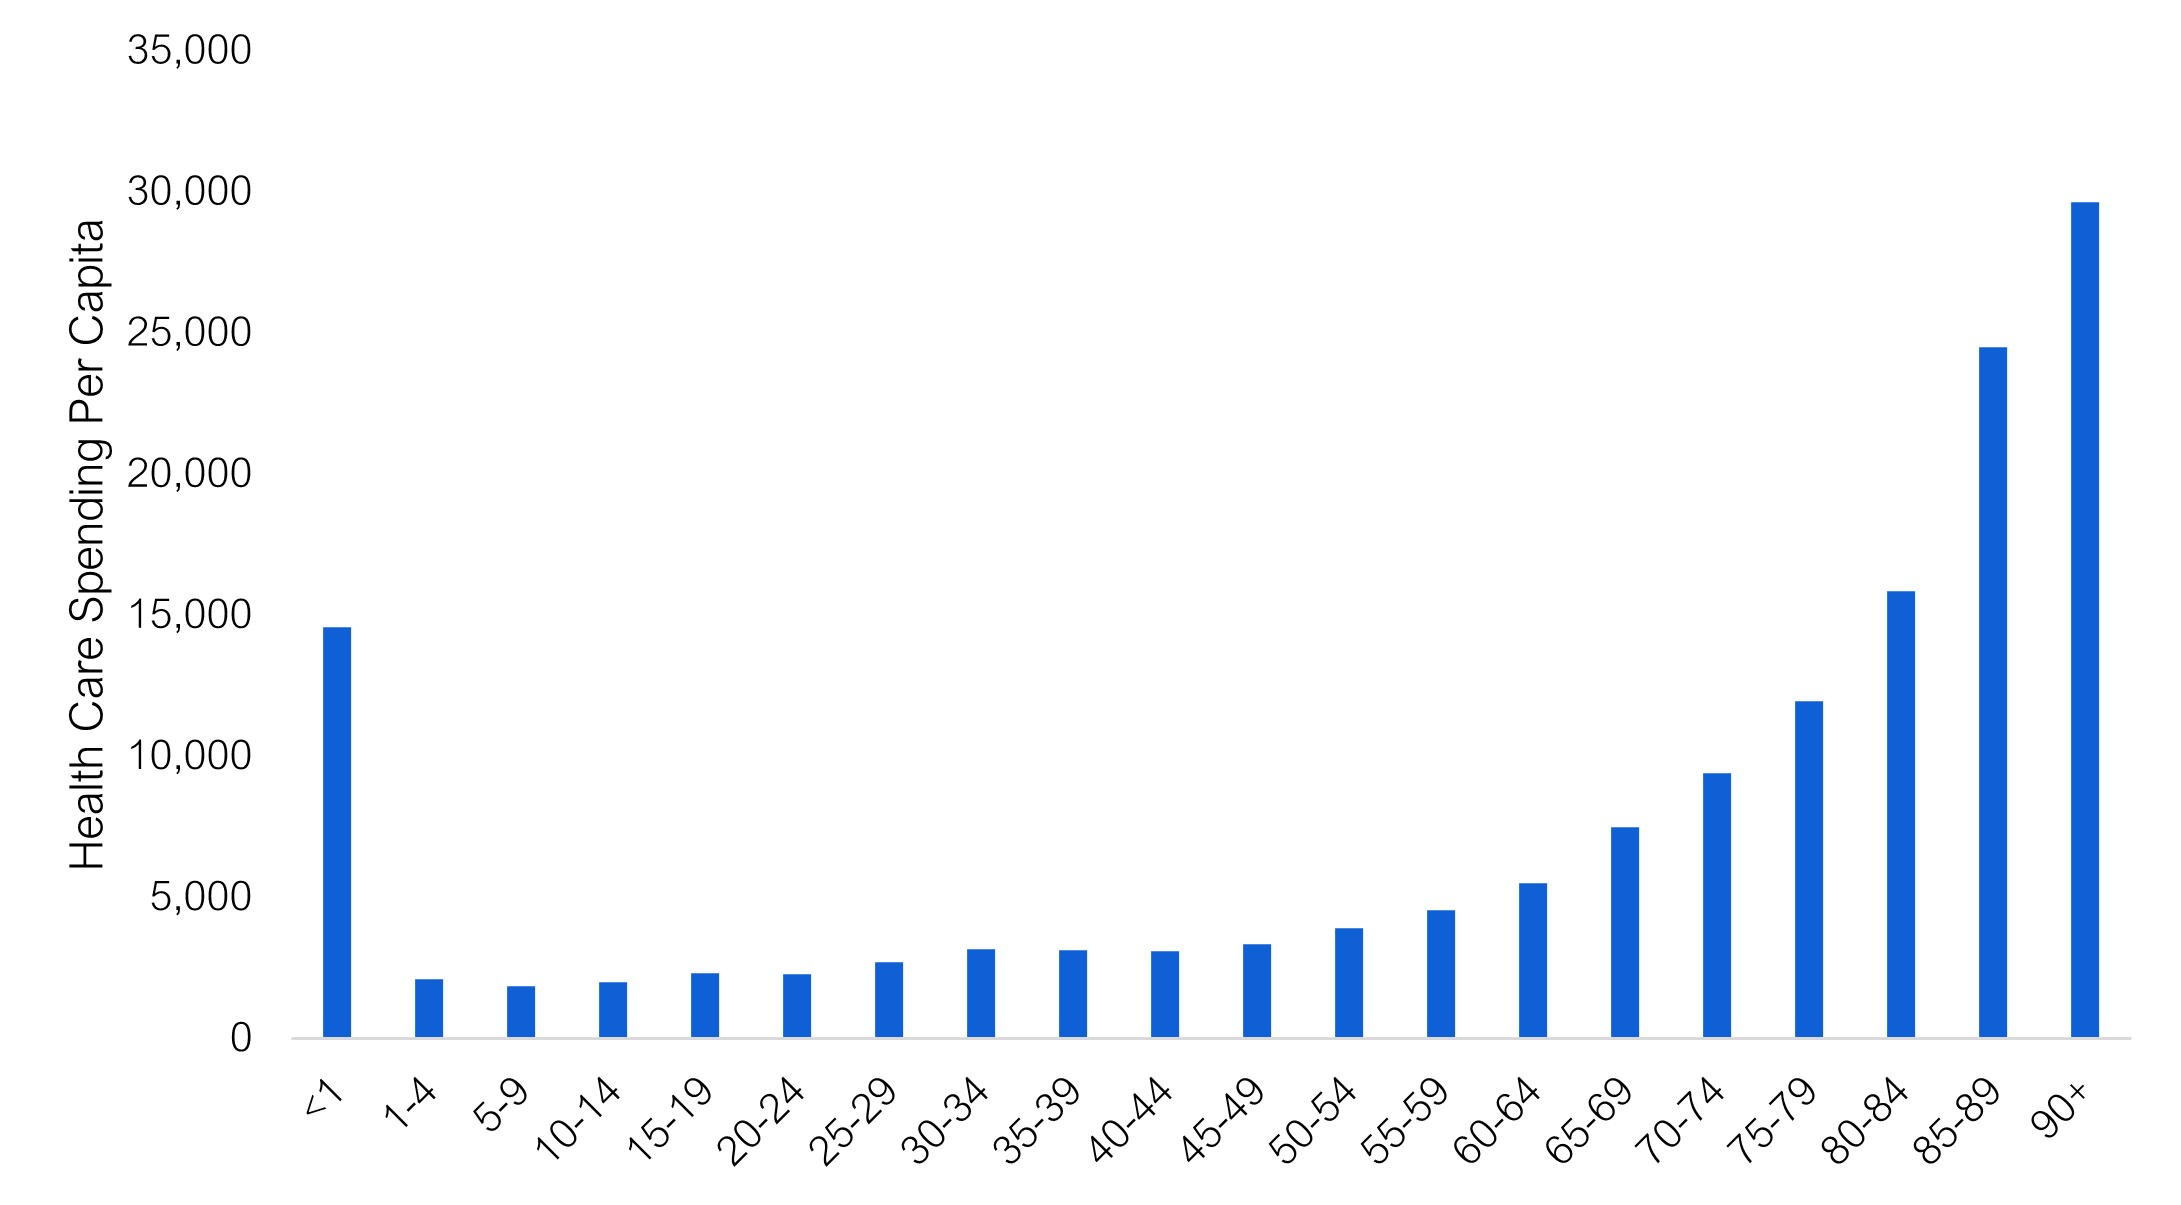
Source: CIHI National Health Expenditure Trends, 2022: Data Tables — Series E1
The primary forms of senior care outside of hospitals are long-term care and home care. Providing adequate access to these services can reduce the number of hospitalizations, preserve hospital capacity and avoid unnecessary hospital spending. Both home care and long-term care are more cost effective than care in hospitals. In 2021-22, the per diem cost of home care in Ontario was $36, which was significantly less than long-term care at $151 or a hospital bed at $722. Currently, over 400,000 Ontario seniors receive home care services in Ontario each year and approximately 80,000 Ontarians live in long-term care.
From 2012-13 to 2019-20, the number of nursing and personal support services provided by home care programs grew by 34 per cent, which is higher than the 27 per cent growth in Ontario seniors (aged 65 and over), who receive the majority of home care services.
Figure 8 Growth in home care hours has exceeded growth in Ontario seniors
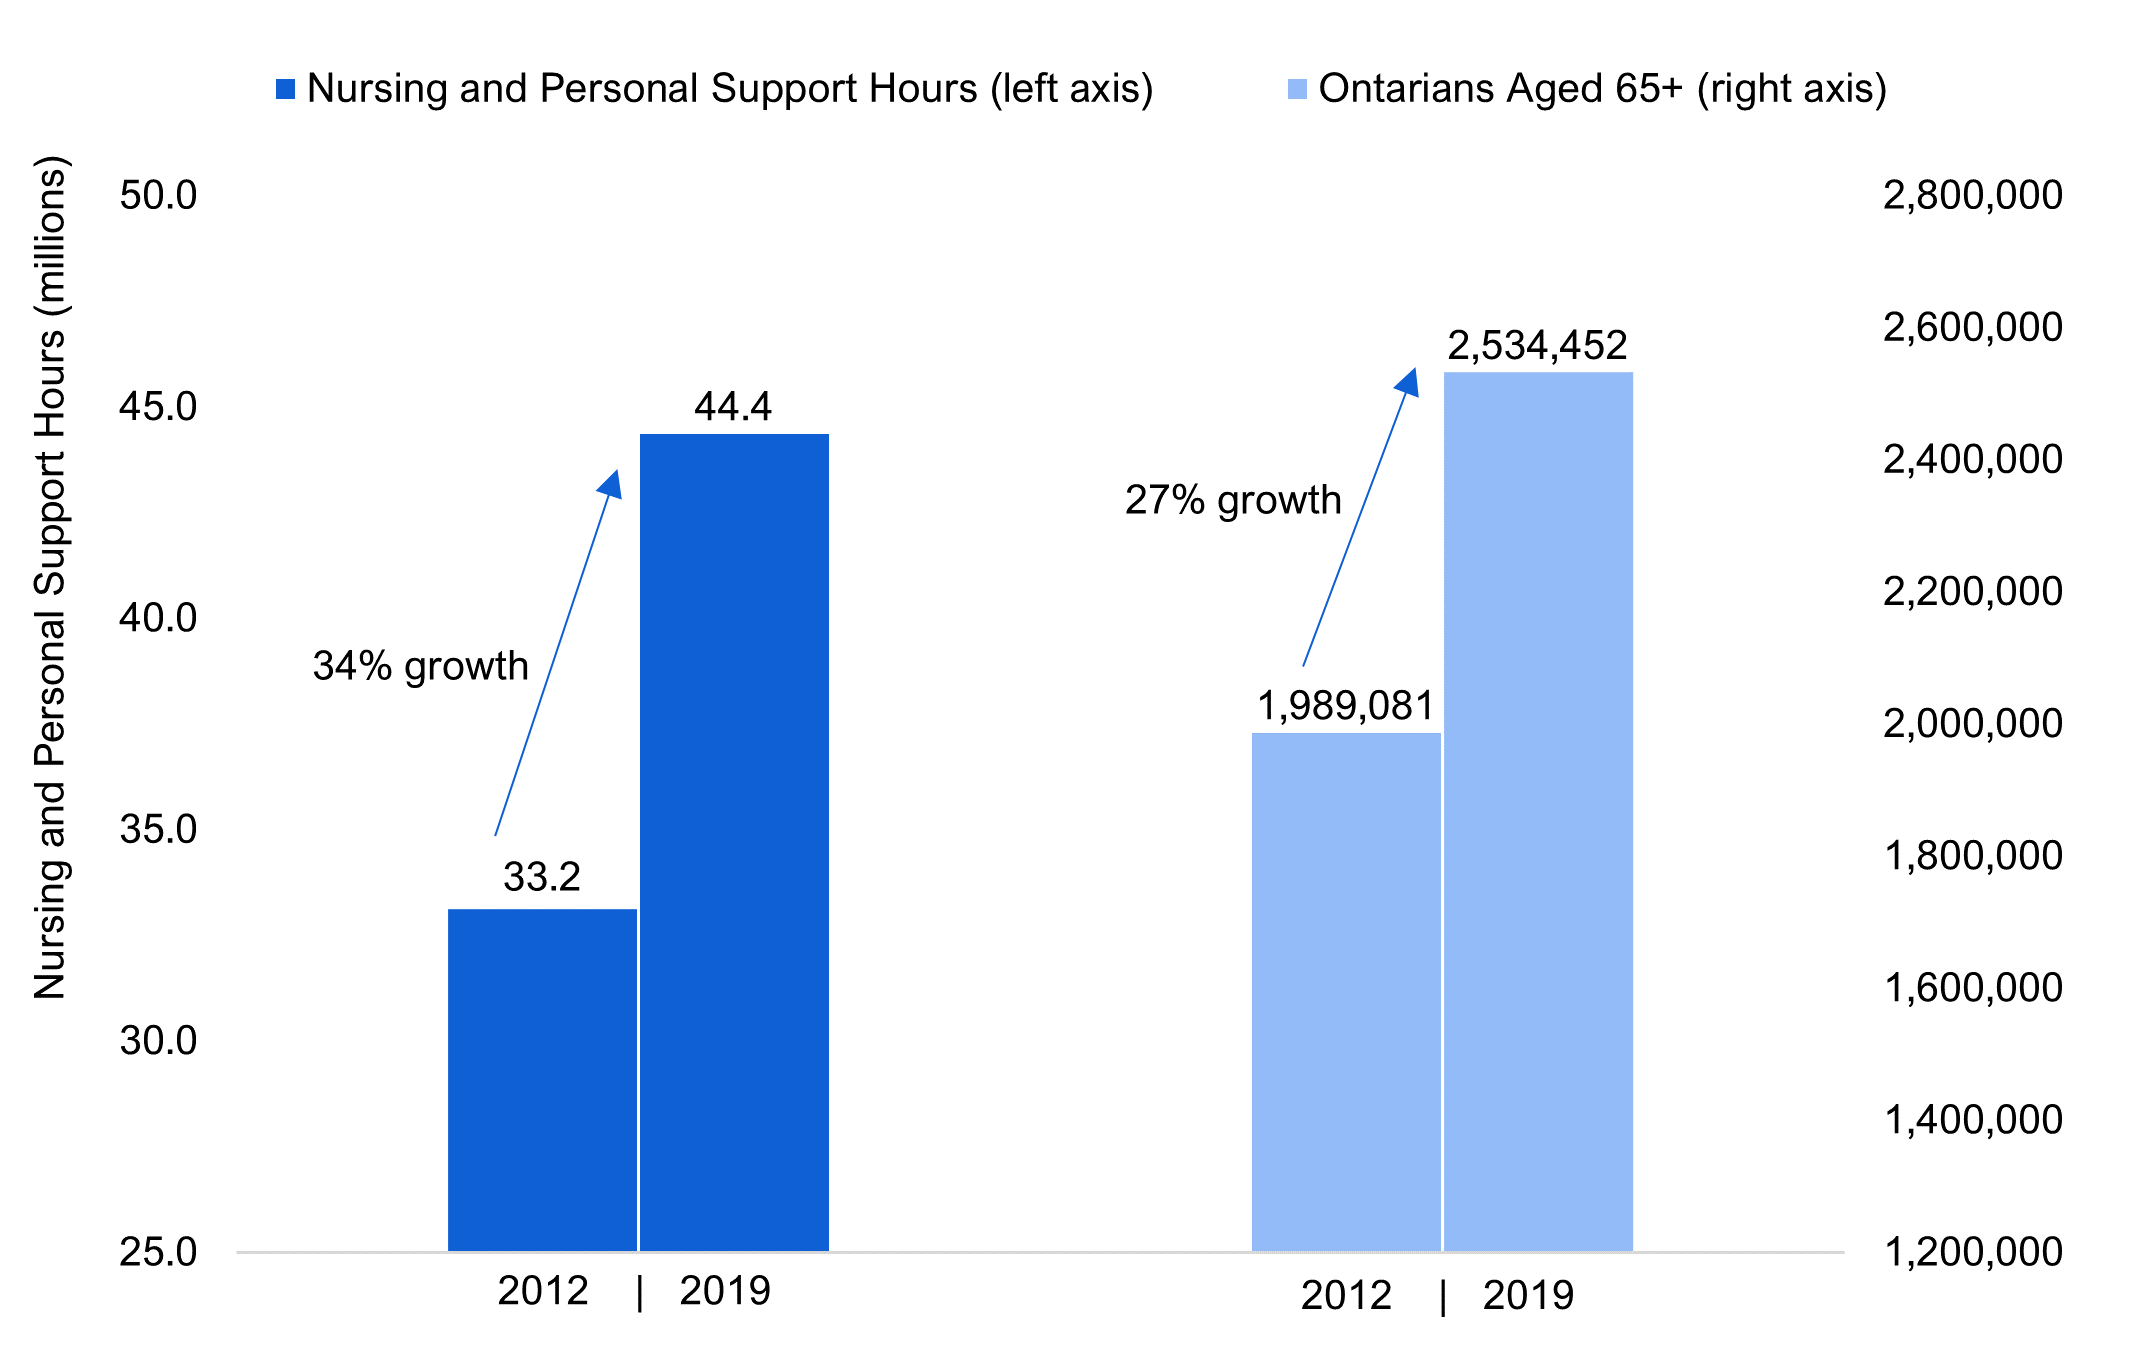
Source: FAO analysis of information provided by the Ministry of Health.
High growth in home care services has resulted in more Ontarians receiving home care compared to the rest of Canada. In 2021, 6.3 per cent of Ontarians received formal home care services, which is higher than the Canadian average of 6.1 per cent.[33] Also, in 2020-21, the median wait time for home care in Ontario was two days, which was either below or tied with all other reporting provinces and territories.[34]
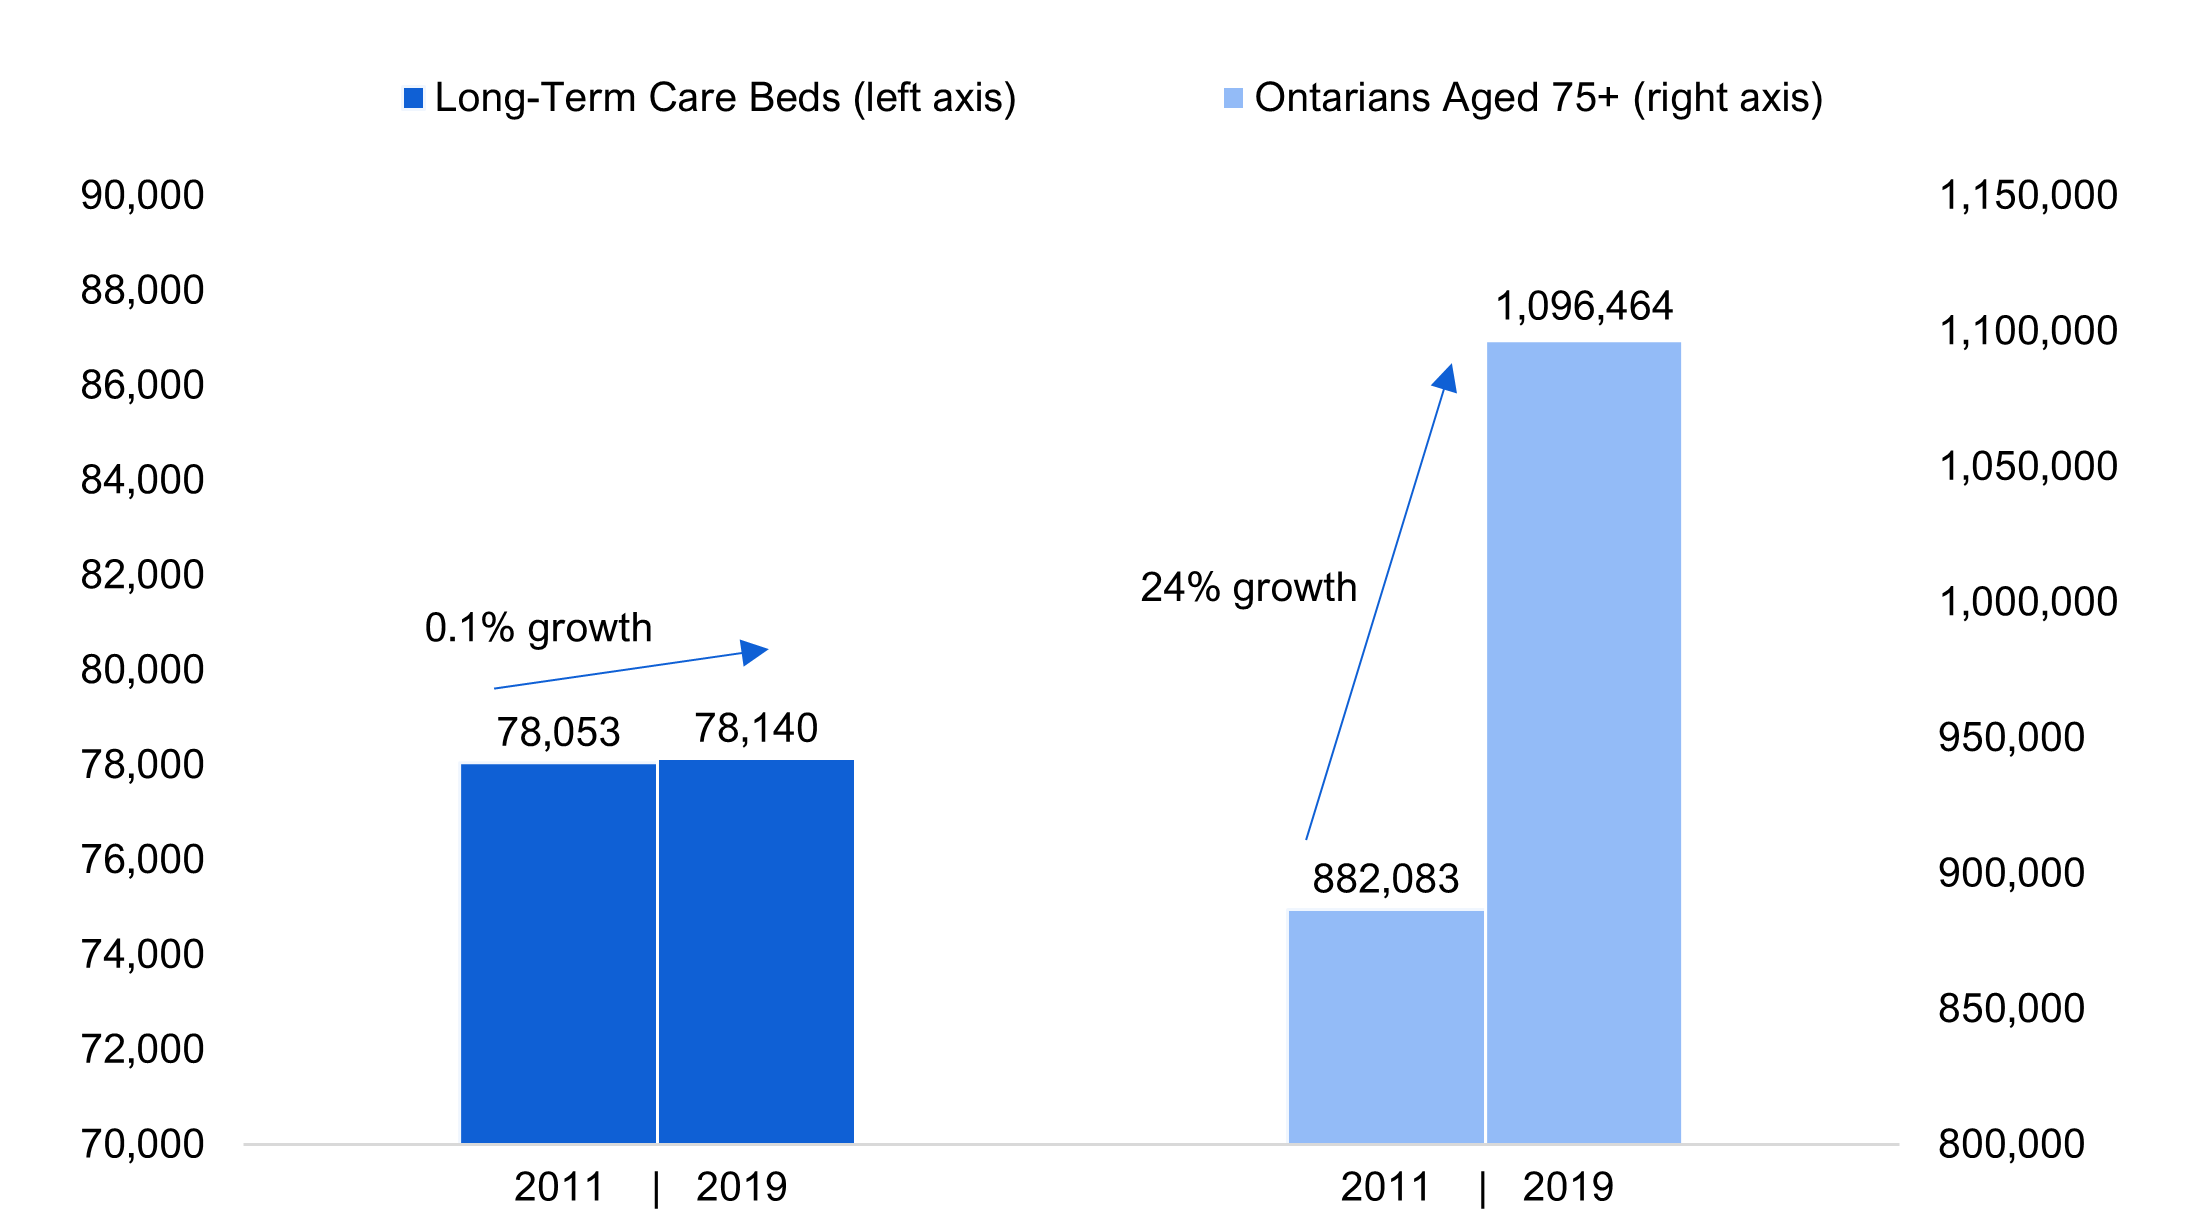
However, over the same time period, the Province did not make a similar investment in long-term care to match the expansion of home care. In 2011-12, the Province had 78,053 long-term care beds. Over the next eight years, the Province added 87 long-term care beds, an increase of 0.1 per cent, while the population of Ontarians aged 75 and older, who occupy over 80 per cent of long-term care beds, grew by 24 per cent.
Figure 9 Growth in elderly Ontarians has exceeded growth in the number of long-term care beds
Source: FAO analysis of information provided by the Ministry of Health
This limited growth in the number of long-term care beds has led to long wait times and waitlists for long-term care. As of November 2022, over 39,000 Ontarians were on the waitlist for a long-term care placement and the median wait time for a long-term care bed was 126 days.[35] Additionally, patients in hospitals waiting for a long-term care placement occupied six per cent of hospital bed capacity in 2021-22, and the share of hospital capacity occupied by patients waiting for an LTC placement has grown steadily since 2011 (see section A).
Looking ahead, the number of Ontario seniors (aged 65 and over) is projected to increase by 22 per cent from 2021-22 to 2027-28. This will significantly increase demand for home care and long-term care services. The Province’s plan to preserve hospital capacity and ensure Ontario seniors can access care in the appropriate setting involves significant investments to expand the capacity of both home care and long-term care.
Plan for Home Care
In the 2022 Fall Economic Statement, the Province announced that it would invest an additional $1.5 billion in home care from 2022-23 to 2024-25.[36] The FAO estimates that this investment includes approximately $1.0 billion to increase the supply of home care services and $500 million in wage increases for personal support workers. The FAO estimates that the new funding will result in home care spending growth averaging 6.7 per cent per year, from $2.9 billion in 2019-20 to $4.0 in 2024-25. This spending growth will increase the number of nursing and personal support hours by 18 per cent from 2019-20 to 2024-25.
Overall, the FAO estimates that the Province’s home care expansion will increase the number of Ontarians aged 65 and over who receive home care services from 410,000 in 2019-20 to 485,000 in 2024-25.
Figure 10 FAO projection for the number of Ontario seniors aged 65 and over that will receive home care services, 2019-20 to 2024-25
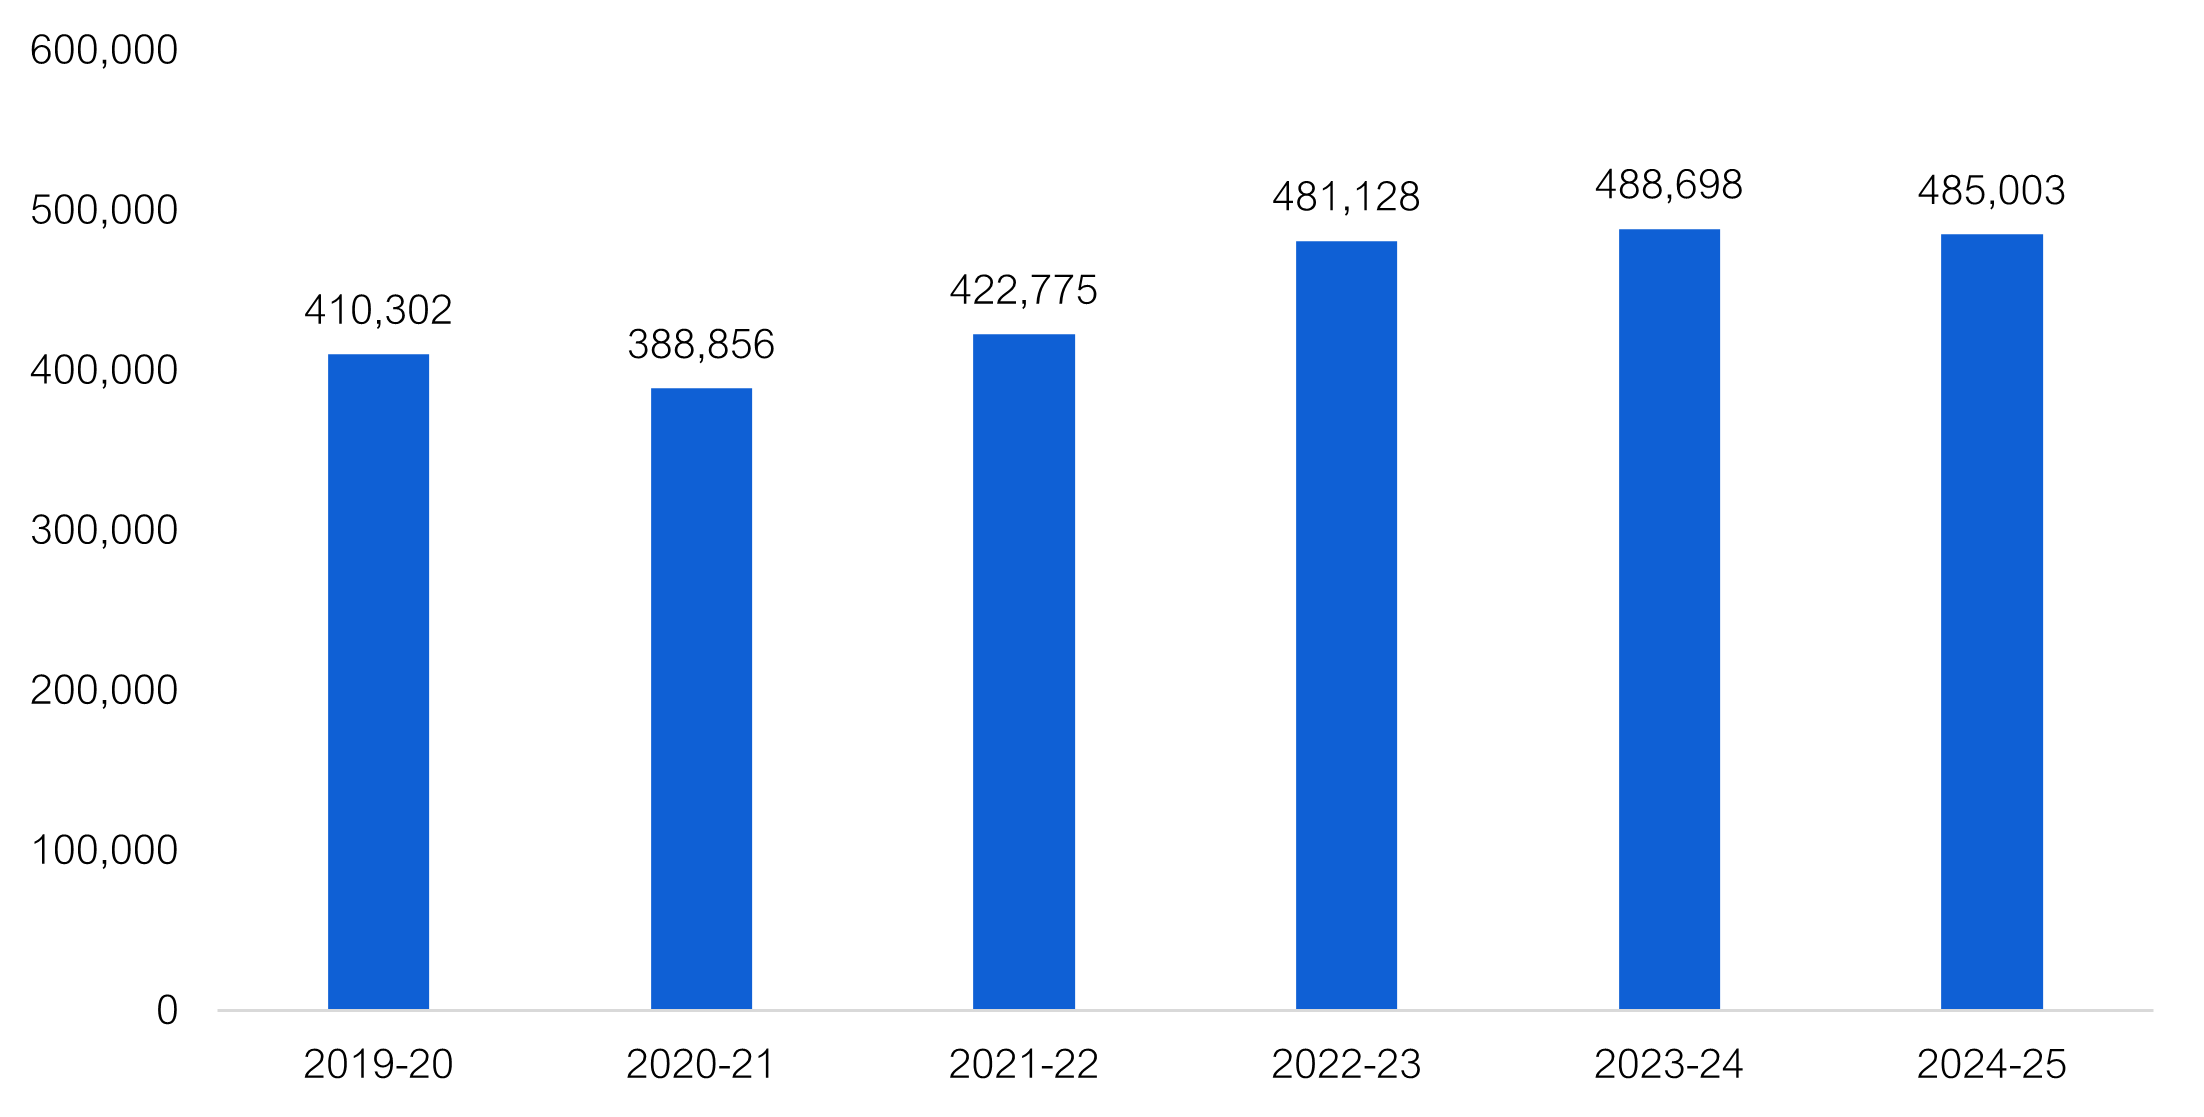
Note: Service levels in 2020-21 and 2021-22 were reduced due to the COVID-19 pandemic.
Source: FAO analysis of information provided by the Ministry of Health.
However, over the same time period, the FAO estimates that the number of Ontarians aged 65 and over will also increase by 18 per cent. This means that by 2024-25, the number of funded hours for nursing and personal support services per Ontarian aged 65 and over will be 17.5, the same level as in 2019-20.
Figure 11 Annual hours of nursing and personal care services per Ontarian aged 65 and over, 2019-20 to 2024-25
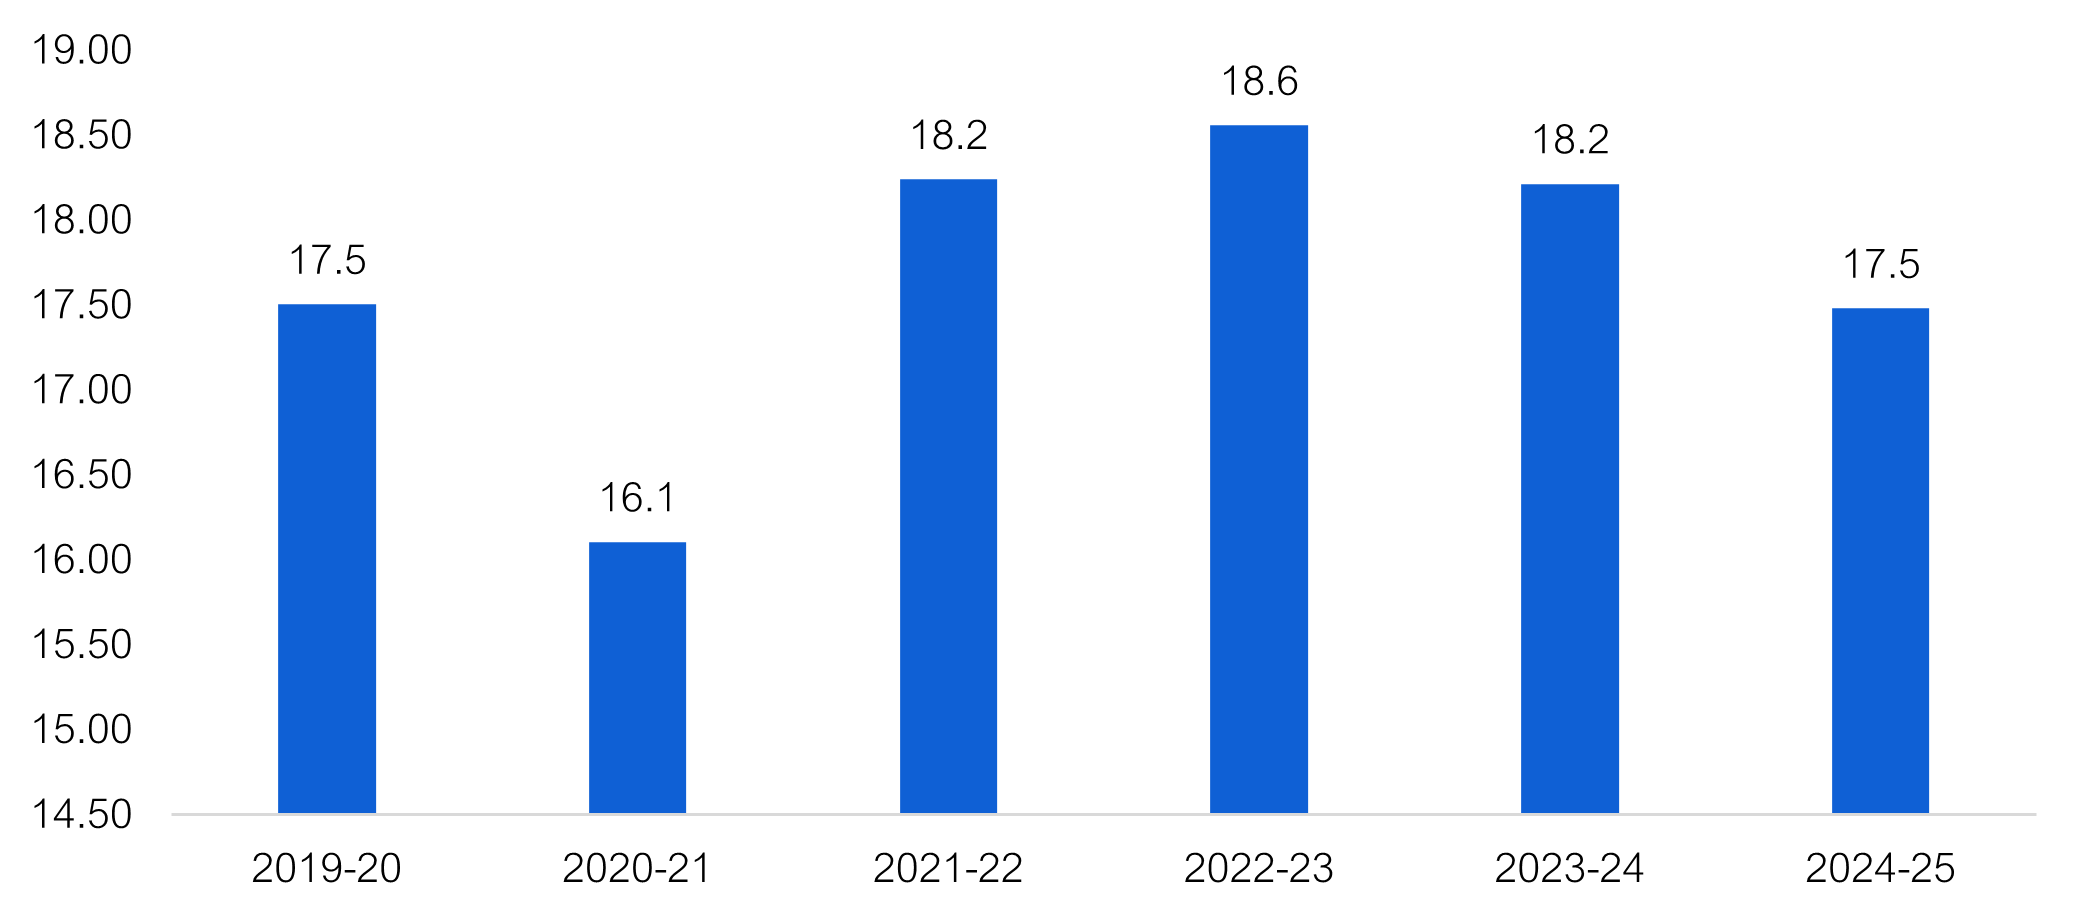
Source: FAO analysis of information provided by the Ministry of Health.
Plan for Long-Term Care
The Province’s plan to expand long-term care capacity involves two key commitments:
- To increase the average hours of direct care provided to long-term care residents from a nurse or personal support worker from 2.75 hours in 2018-19 to four hours in 2024-25; and
- To build 30,000 net new long-term care beds and redevelop approximately 30,000 existing long-term care beds by the end of 2028.
The FAO estimates that these two commitments will result in average annual long-term care program spending growth of 12.2 per cent from 2019-20 to 2027-28. This growth is significantly higher than the average annual growth of 2.4 per cent from 2011-12 to 2019-20.
In 2019-20, Ontario had approximately 78,200 long-term care beds. The FAO estimates that the number of beds will increase to approximately 105,000 by the end of 2027-28.[37] From 2019-20 to 2027-28, the number of long-term care beds will increase by 34 per cent. This growth in long-term care capacity is significantly higher than the 0.1 per cent growth from 2011-12 to 2019-20.
Figure 12 FAO projection for the number of long-term care beds, 2019-20 to 2027-28
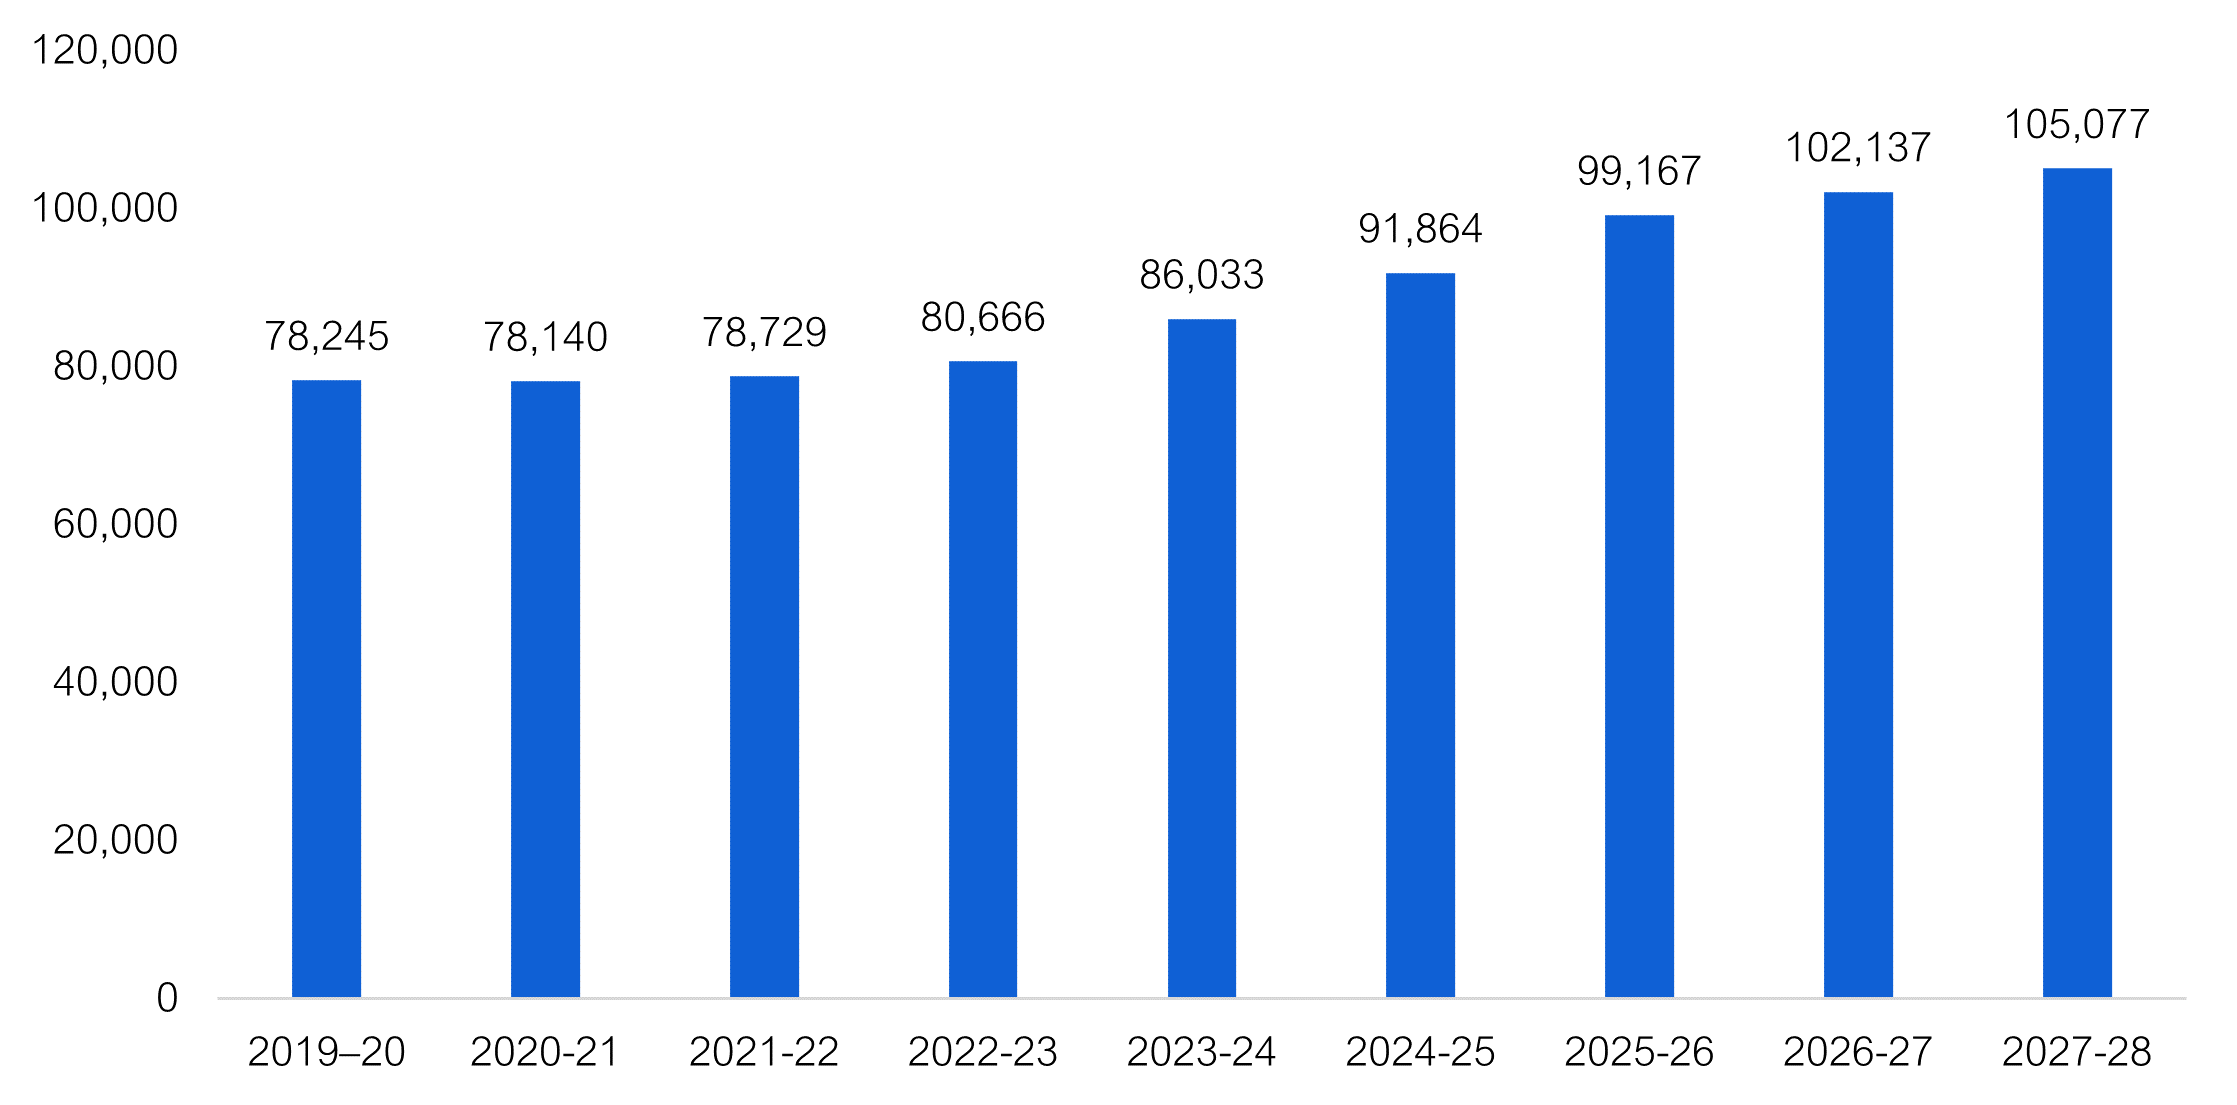
Source: FAO analysis of information provided by the Ministry of Long-Term Care
However, between 2019-20 and 2027-28, the FAO estimates that the number of Ontarians aged 75 and over will increase by 37 per cent compared to the projected 34 per cent increase in the number of beds. Therefore, despite the significant increase in the number of long-term care beds by 2027-28, the FAO estimates that Ontario will still have fewer beds per Ontarian aged 75 over in 2027-28 than it did in 2019-20.
Figure 13 FAO projection for the number of long-term care beds per 1,000 Ontarians aged 75 and over, 2010-11 to 2027-28
Source: FAO
FAO Analysis
The Province’s planned expansion of home care and long-term care results in those program areas having the highest average annual spending growth in the FAO’s forecast. Combined, spending on these programs is projected to increase at an average annual rate of 10.0 per cent from $7.3 billion in 2019-20 to $15.6 billion in 2027-28. This spending growth rate is double the projected 5.0 per cent average annual growth in the health sector as a whole.
Despite these significant investments, the FAO estimates that there will still be a slight decline in home care and long-term care capacity relative to demand over the forecast period when compared to 2019-20. This is due to high growth in the number of Ontario seniors over the forecast period, which will significantly increase demand for these services. For home care, the number of nursing and personal care hours per Ontarian aged 65 and over will be about the same in 2024-25 as it was in 2019-20. For long-term care, the number of beds per 1,000 Ontarians aged 75 and over will decline slightly from 71 in 2019-20 to 70 in 2027-28.
Consequently, even with significant planned investments in home care and long-term care through to 2027-28, high growth in demand for health care services from Ontario’s growing population of seniors aged 65 and over will only allow the Province to maintain 2019-20 access levels for home care and long-term care. This, in turn, will limit the ability of long-term care and home care to relieve capacity pressures in other areas of the health sector.[38]
C. Surgical Waitlists and Wait Times
Background and Context
Elective Surgeries Performed
In response to the COVID-19 pandemic, the Province issued directives to pause elective surgical procedures[39] three times to preserve hospital capacity. These directives were issued on March 15, 2020, April 9, 2021 and January 5, 2022, with each lasting between five and 10 weeks.
Largely as a result of the directives to pause elective surgical procedures, and also due to the impact of the COVID-19 pandemic on hospital operations, 398,000 fewer surgeries were performed in the 2020 to 2022 period than would have occurred if 2019 surgical volumes had been maintained. This represents an average 20 per cent reduction in surgery volumes each year, with reductions of 187,500 (29 per cent) in 2020, 117,100 (18 per cent) in 2021 and 93,800 (14 per cent) in 2022.[40]
| 2019 | 2020 | 2021 | 2022 | 2020 to 2022 Average | |
|---|---|---|---|---|---|
| Surgeries Performed | 649,299 | 461,785 | 532,241 | 555,487 | 516,504 |
| Change from 2019 (Number of Surgeries) | -187,514 | -117,058 | -93,812 | -132,795 | |
| Change from 2019 (%) | -29% | -18% | -14% | -20% |
Impact on Waitlists and Wait Times
Although 398,000 fewer surgeries were performed over three years, from 2020 to 2022, the surgery waitlist only increased by 50,000. As of September 2022, approximately 250,000 patients were on waitlists for surgical procedures, which is 50,000 more patients than the pre-pandemic level of 200,000.
There has also been an increase in the number of patients on the surgical waitlist who are waiting longer than the maximum clinical guidelines for their surgery (referred to by the ministry as “long-waiters”). As of September 2022, of the total surgery waitlist of 250,000, approximately 107,000 (43 per cent) were long-waiters, up from an average of 38,000 (20 per cent) long-waiters on the surgery waitlist before the COVID-19 pandemic.
Figure 14 Surgical waitlist, long-waiters and surgeries performed by month, 2019 to 2022
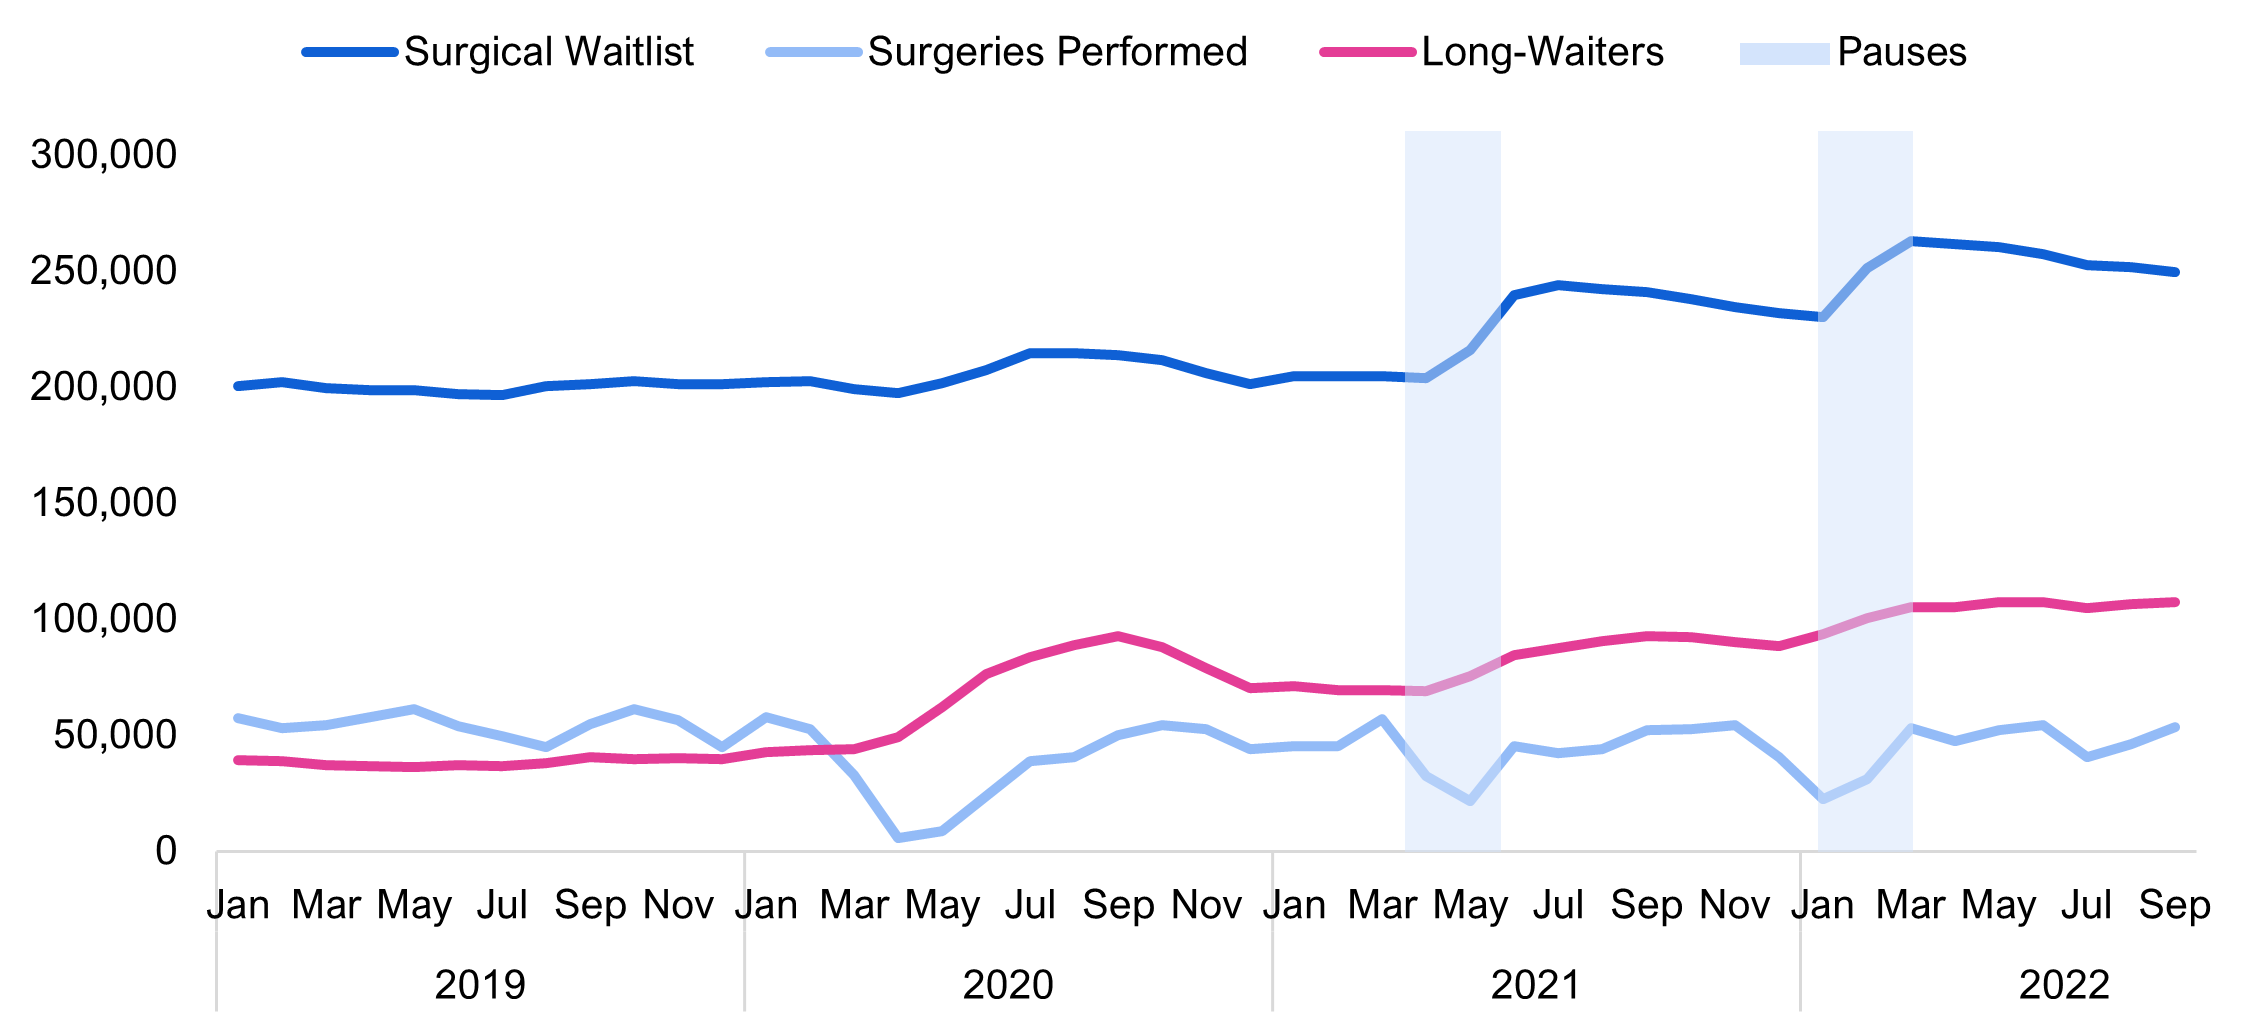
Note: Shaded areas represent periods where the Province issued directives to pause elective surgical procedures to preserve hospital capacity. Long-waiters are Ontarians on the waitlist who have waited longer than the maximum clinical guidelines for their surgical procedure.
Source: FAO based on data provided by Ontario Health
With a 50,000 patient increase in the surgery waitlist and fewer surgeries being performed, the implied average wait time for surgeries has increased. In 2019, the average wait time for surgery was 3.7 months. In 2022, the average wait time was 5.5 months, a 48 per cent increase from 2019.[41]
Figure 15 FAO estimated average surgical wait time in months by year
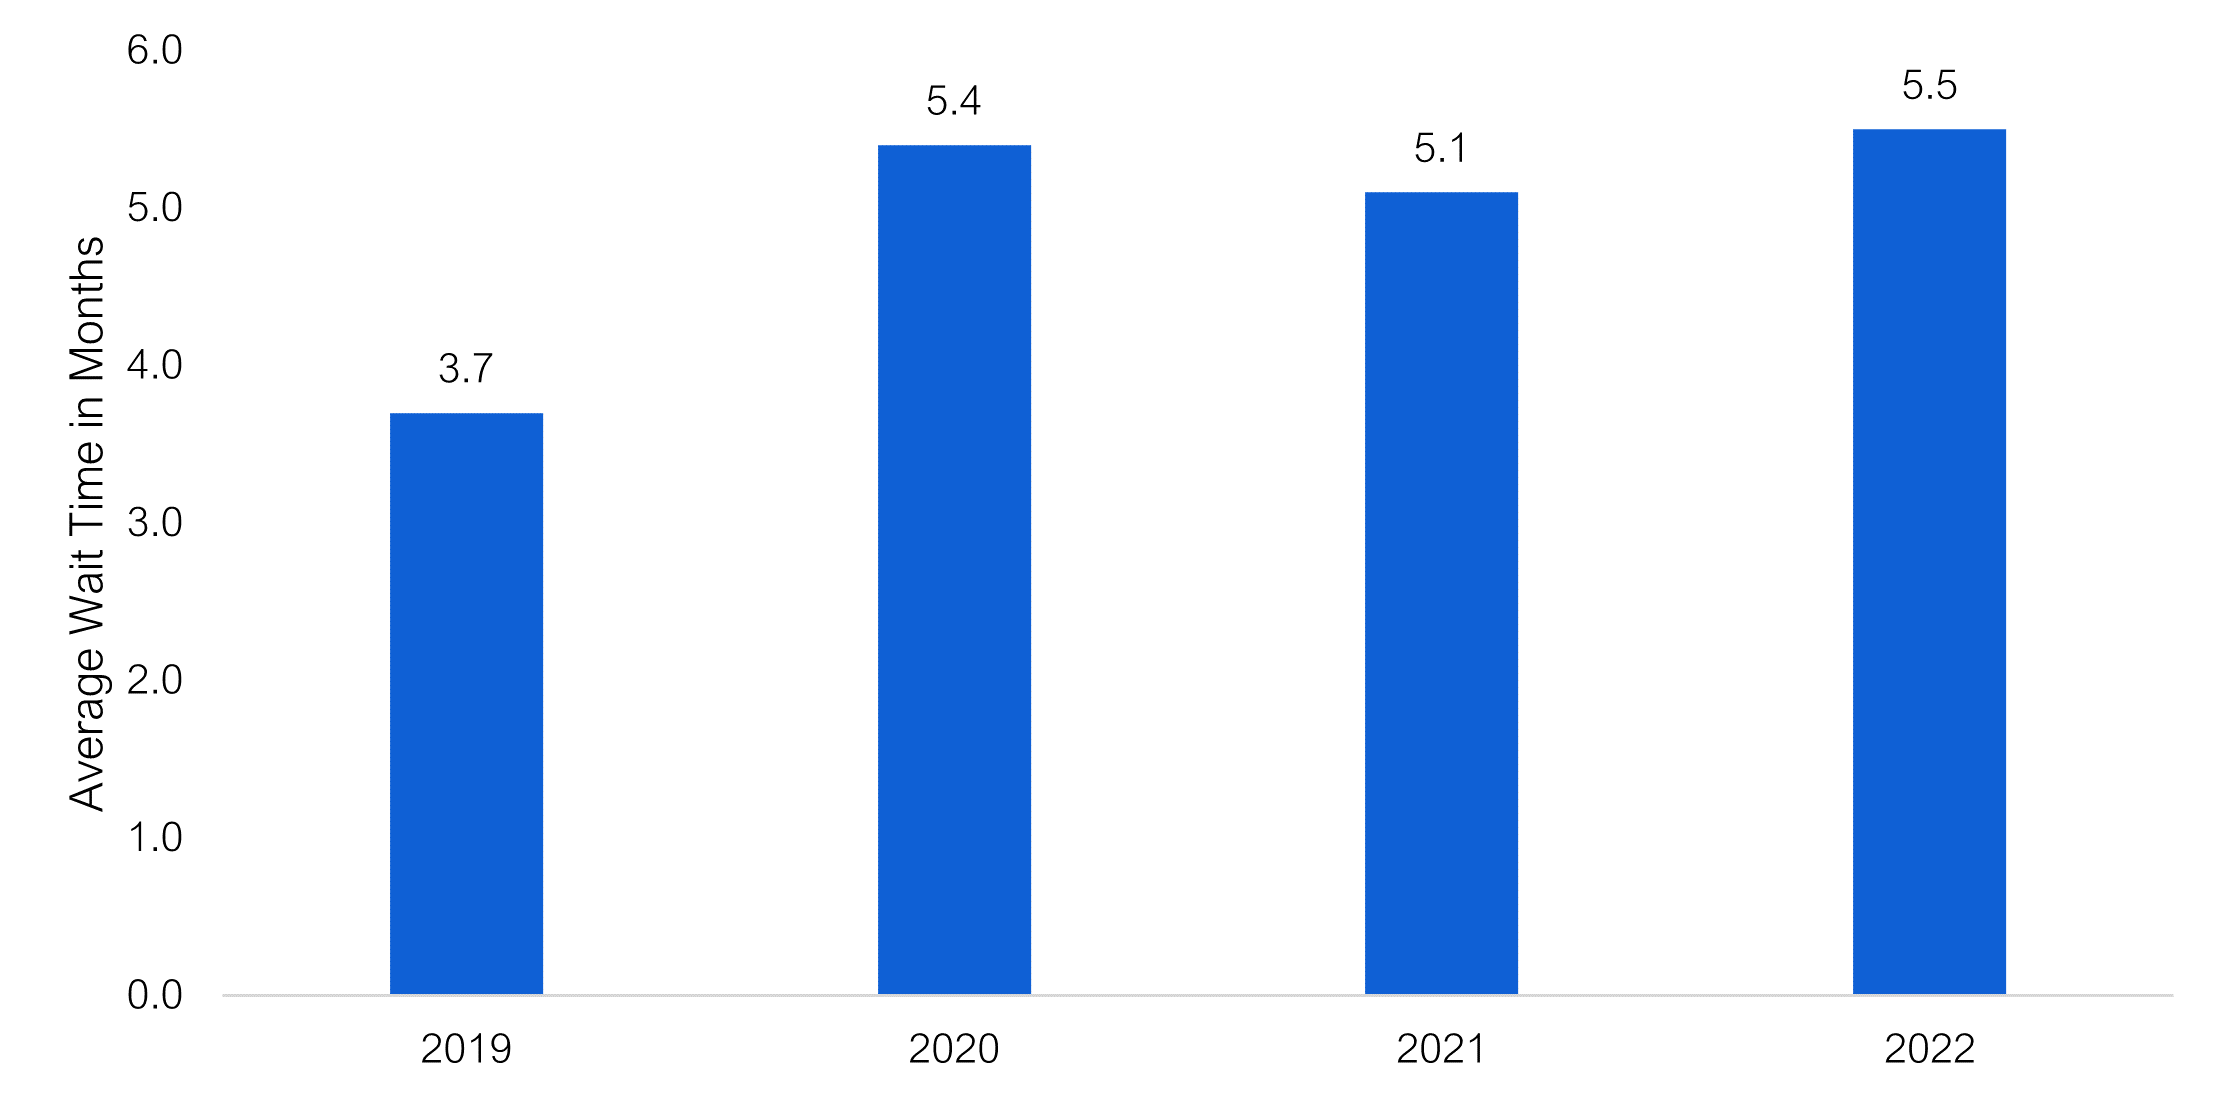
Note: Wait times are estimated based on the waitlist and surgeries performed. For example, in 2019 there was an average of 200,000 patients on the waitlist and 649,000 surgeries were performed, implying that patients waited an average of 3.7 months. For the methodological rationale, see Karl Sigman, Notes on Little’s Law.
Source: FAO based on data provided by Ontario Health.
Plan to Reduce Surgical Waitlists
The Province’s targets are to reduce the surgery waitlist and the number of long-waiters to pre-pandemic levels by March 2023. This implies a surgery waitlist of approximately 200,000 patients, with 38,000 patients on the waitlist classified as long-waiters. Based on information available to the FAO, as of September 2022, the surgery waitlist was 250,000, of which 107,000 were classified as long-waiters. Therefore, to achieve its targets, the Province must reduce the surgery waitlist by 50,000 patients and the number of long-waiters by 69,000 patients from September 2022 levels.
To help achieve these targets, the Province has provided premium pricing incentives to hospitals to increase surgical volumes. The Province has also provided funding to increase the number of procedures performed at paediatric and private hospitals, and independent health facilities. In total, the Province has allocated $858 million for surgical recovery from 2020-21 to 2022-23, $326 million of which is allocated in 2022-23.
Of this $858 million, approximately $603 million has been allocated to increase surgical volumes and increase the number of surgeries done after hours at hospitals, as well as for additional operating hours for MRI and CT machines. An additional $37 million has been allocated to paediatric and private hospitals, and to independent health facilities for OHIP-covered surgeries and MRI/CT hours. The remaining $218 million has been allocated to a variety of measures that include training, supplies and equipment.
FAO Analysis
Despite the Province’s $858 million investment over three years, the number of surgeries performed has not returned to pre-pandemic levels. Looking only at months not affected by elective surgery pauses, the average number of surgeries performed in each month from 2020 to 2022 was significantly lower than in 2019, with average monthly surgeries performed 14 per cent lower in 2020, 12 per cent lower in 2021 and eight per cent lower in 2022 (as of September 2022).
Figure 16 Average monthly surgeries performed, excluding months with elective surgery pauses, 2019 to 2022
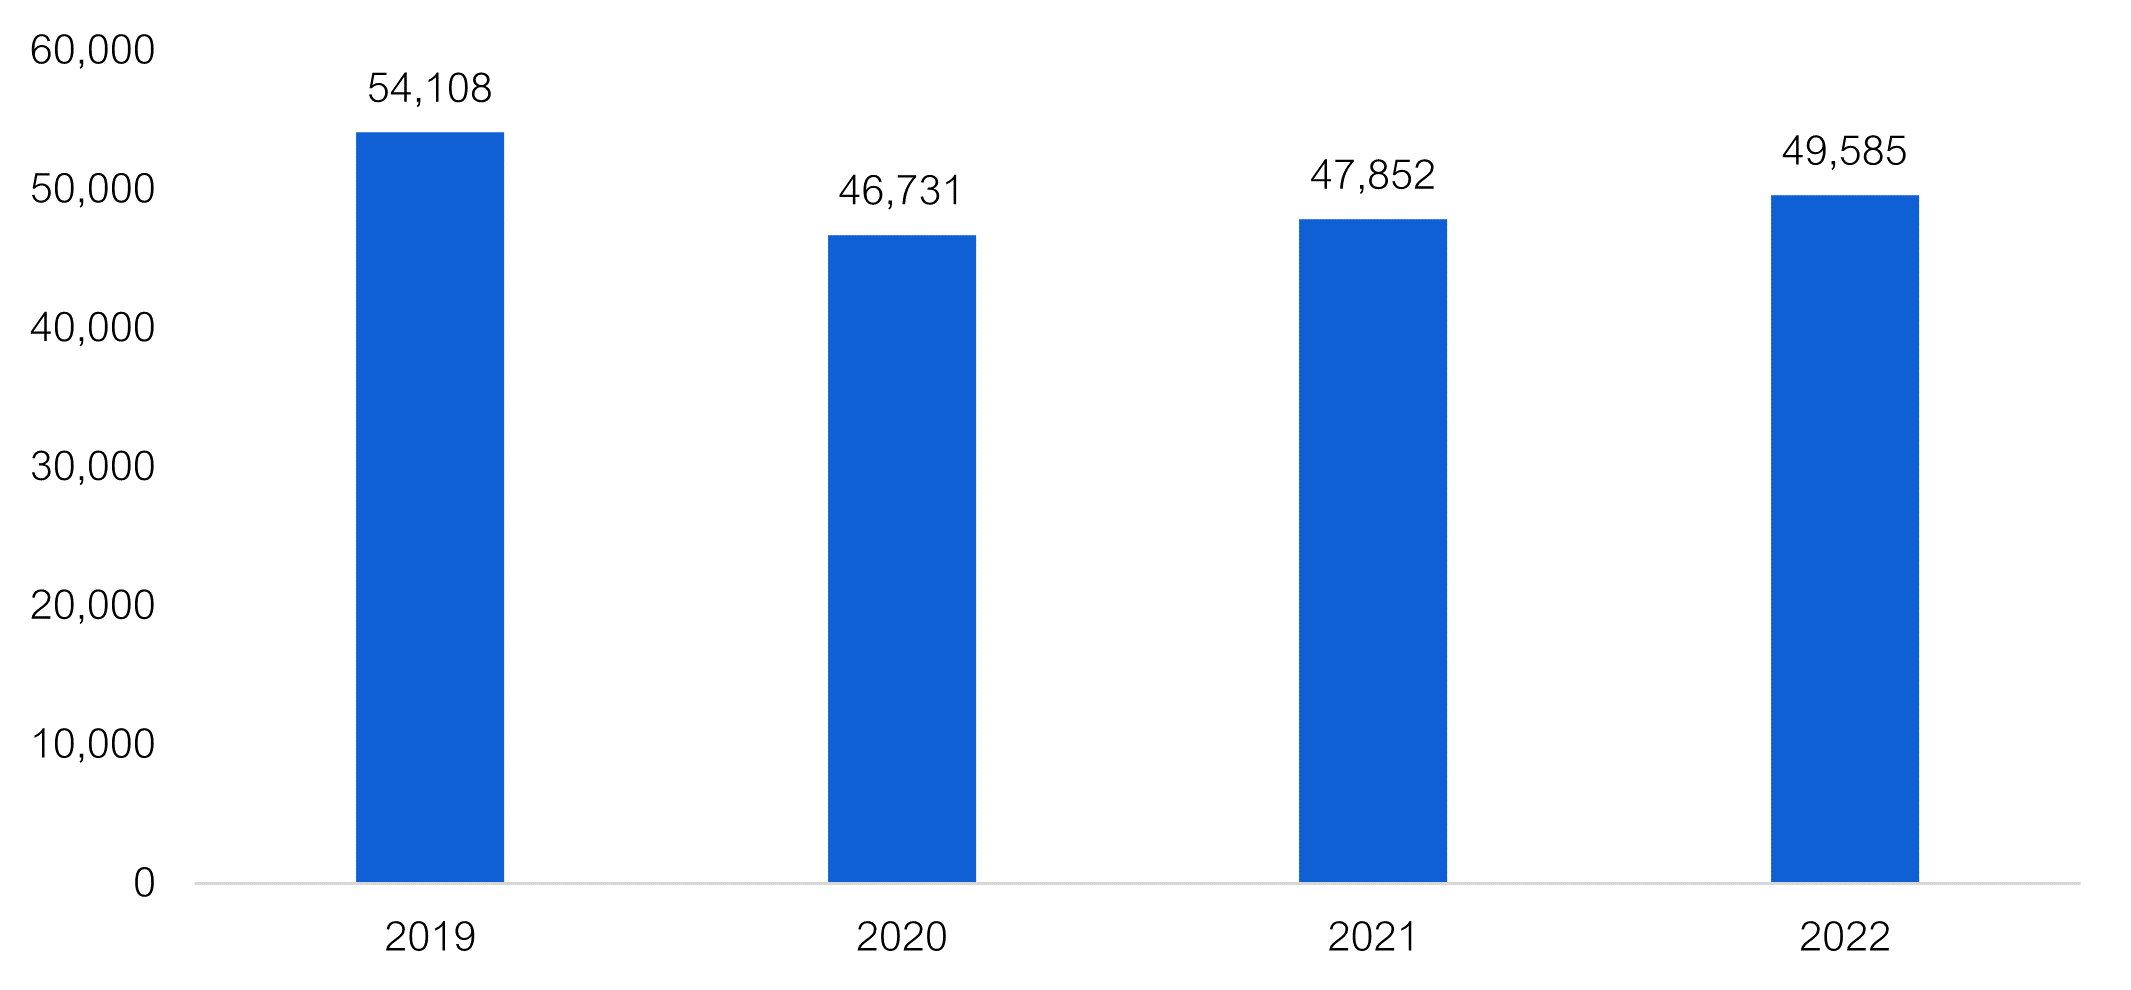
Note: 2020 monthly average excludes the pre-pandemic period. 2022 monthly average excludes incomplete data from October onwards.
Source: FAO based on data provided by Ontario Health
Monthly surgical volumes in 2022 remained below 2019 levels due to the on-going impact of COVID-19 and the impact on hospital operations from the unusual influenza (flu) and respiratory syncytial virus (RSV) seasons.[42] Staffing shortages have also caused hospitals to ramp down the number of surgical procedures (see section E).[43]
The reason the surgery waitlist has increased by only 50,000, when 398,000 fewer procedures were performed from 2020 to 2022 as compared to 2019 levels, is that fewer Ontarians were added to the surgical waitlist compared to pre-pandemic levels. For example, from March 2022[44] to September 2022, an average of 51,500 Ontarians were added to the surgical waitlist each month. This is 13 per cent lower than the average of 59,100 patients added to the surgery waitlist each month from March to September of 2019. This 13 per cent decline in monthly waitlist additions from March to September of 2022 is greater than the eight per cent decline in monthly surgeries performed over the same period.[45]
The growth in the waitlist occurred mostly during the second and third directives to pause elective procedures where the reduction in diagnostic imaging and primary care was not as significant. Outside the periods when elective surgeries were paused, the number of surgeries performed has outpaced waitlist additions and the Province has been able to gradually reduce the waitlist. For example, following the end of the last directive to pause surgeries in March 2022, the waitlist has been gradually reduced from 263,000 in March of 2022 to approximately 250,000 in September of 2022.
Figure 17 Surgeries performed, waitlist additions and total surgery waitlist by month
Note: Waitlist data is only shown up to the latest complete data for September 2022. Change in the waitlist reflects the difference between additions and individuals removed from the waitlist because their surgery was performed or cancelled. Shaded areas represents periods where the Province issued directives to pause elective surgical procedures to preserve hospital capacity.
Source: FAO based on data provided by Ontario Health
Will the Province Achieve its Waitlist and Long-Waiter Targets?
As of September 2022, the most recent complete data available to the FAO, the surgery waitlist was 250,000 patients.[46] The Province’s target is to reduce the waitlist to 200,000 by March 2023. To achieve this target, the rate of decline in the waitlist would need to be significantly faster than what the Province has achieved up to September 2022.
After pauses of elective surgeries in 2021 and 2022, the waitlist has been reduced by an average of 2,280 patients per month. Assuming no further interruptions, similar volumes of surgeries being performed and similar volumes of patients being added to the waitlist, the Province would reduce the surgical waitlist back to 200,000 patients by July 2024. This would be 16 months later than the Province’s target of March 2023. However, if either the volume of surgeries completed or additions to the waitlist changes, then the FAO’s projection for when the 200,000 patient surgery waitlist target is achieved would change.
Figure 18 FAO projects surgery waitlist to reach pre-pandemic levels by July 2024
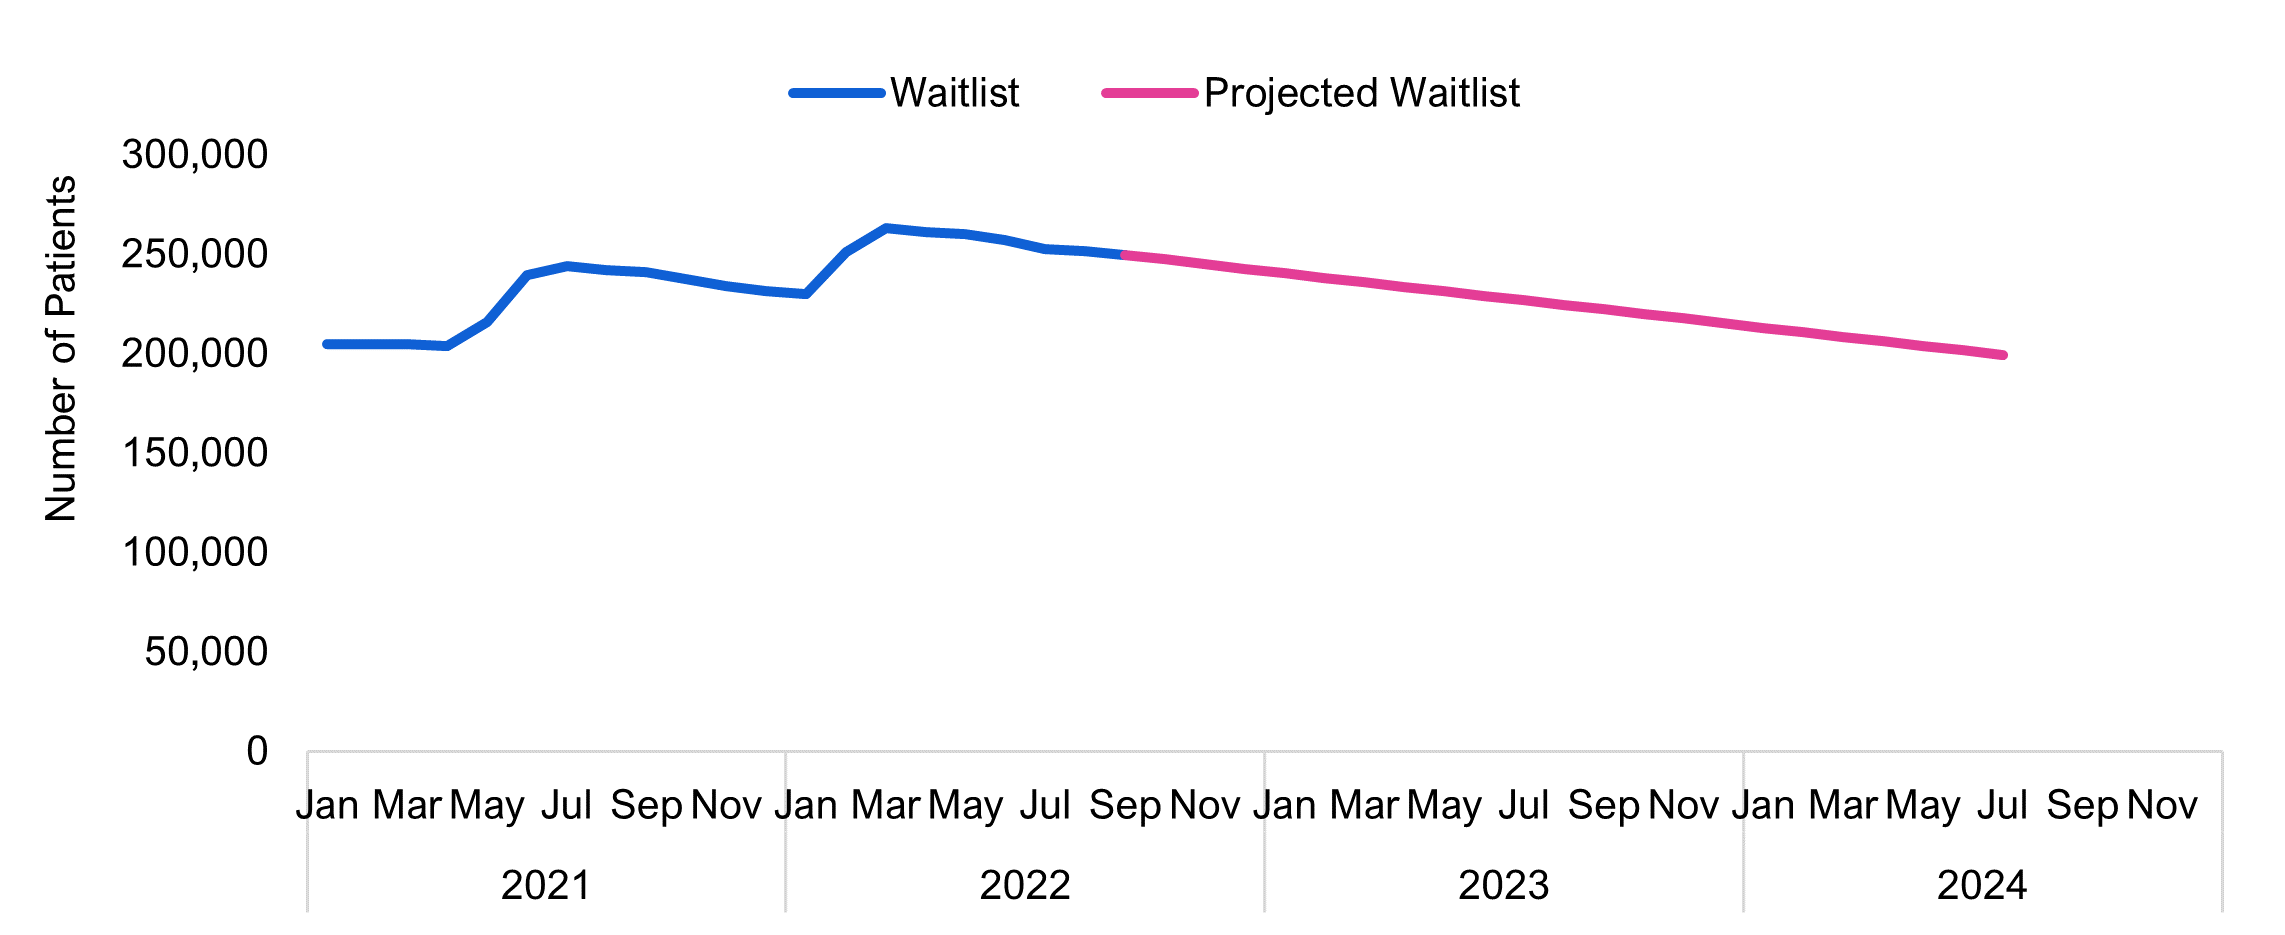
Note: FAO projection assumes surgeries performed and monthly additions to the surgery waitlist remain similar to levels observed in 2021 and 2022, excluding periods where the Province issued directives to pause non-urgent or elective surgical procedures.
Source: FAO based on data provided by Ontario Health
In order to achieve a 50,000 patient reduction in the surgery waitlist from September 2022 to March 2023, the FAO estimates that the Province would have needed to increase monthly surgical volumes by 12 per cent, compared to surgery volumes from March to September of 2022.[47] When compared to pre-pandemic surgery volumes, to achieve its March 2023 waitlist target, the Province would have needed to increase surgical volumes by two per cent over 2019 levels. As noted above, this volume of surgeries has not been achieved in either 2021 or up to September 2022.
With respect to patients on the surgery waitlist who are classified as long-waiters, the Province has yet to record any sustained reduction in the number of these patients waiting for surgery. As of September 2022, the number of patients on the surgery waitlist classified as long-waiters was 107,000, which was the highest number recorded since the start of the pandemic. Consequently, without additional measures, the Province will not achieve its goal of reducing the number of patients on the surgery waitlist classified as long-waiters to the pre-pandemic level of 38,000.
D. Emergency Departments
Background and Context
The COVID-19 pandemic impacted Ontarians’ visits to emergency departments. In 2020-21, there was an average of 377,000 monthly visits to Ontario emergency departments. This was a 23 per cent decrease from the average of 487,000 monthly visits over the five-year period prior to the COVID-19 pandemic. As COVID-19 prevention and containment measures were lifted, emergency department volumes increased. In 2021-22, Ontario emergency departments saw an average of 445,000 visits per month which is only nine per cent below typical volumes. From April to November in 2022-23, there was an average of 482,000 emergency department visits per month, which is about one per cent below typical volumes.[48]
Figure 19 Average monthly emergency department visits in Ontario, 2015-16 to 2022-23
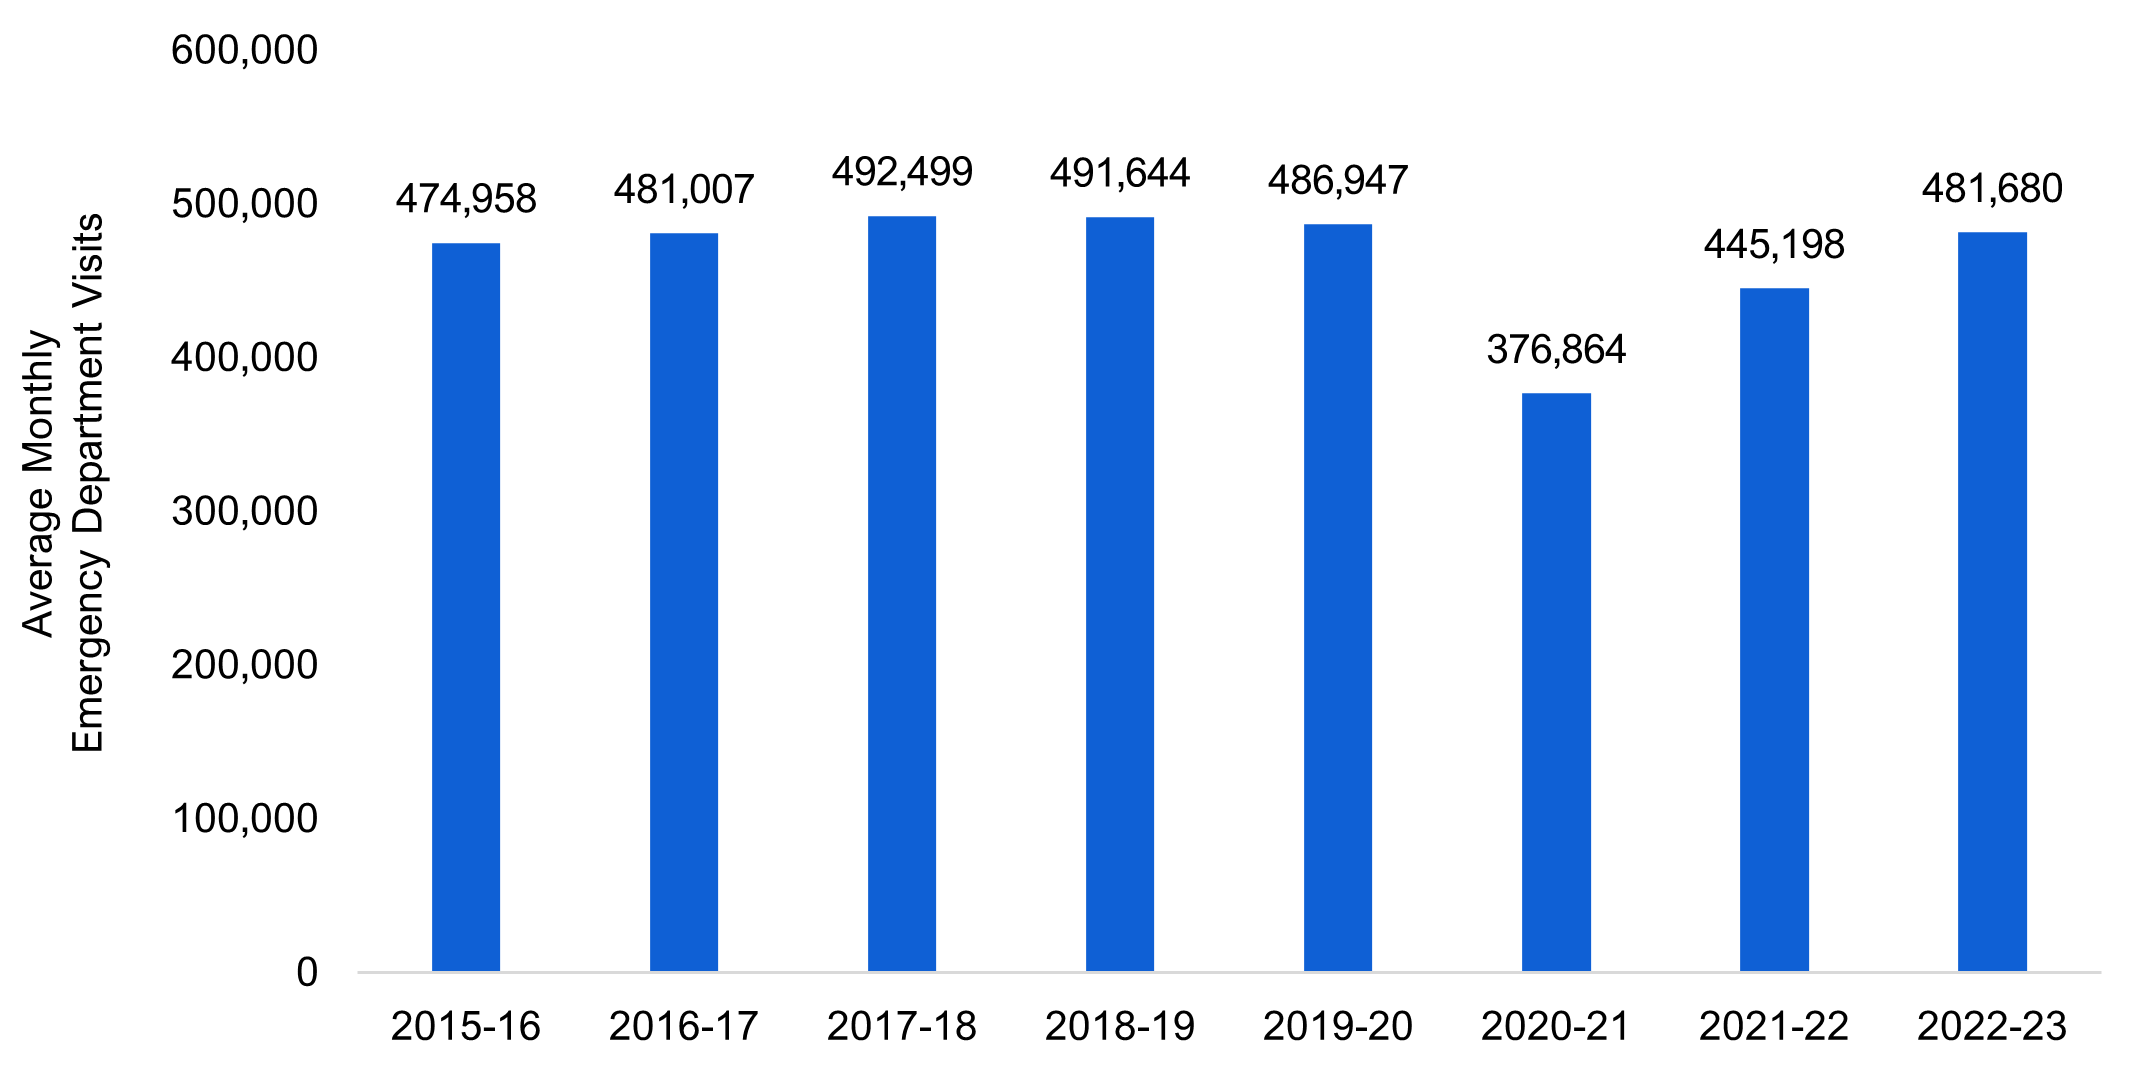
Note: 2022-23 monthly visits are from April to November of 2022.
Source: FAO analysis of information provided by the Ministry of Health.
As patient volumes have returned to normal, emergency department wait times have increased significantly. In 2022-23, the average length of stay in an emergency department for patients admitted to hospitals was 20.9 hours.[49] This is 34 per cent higher than wait times over the five-year period prior to the COVID-19 pandemic and the longest average wait time recorded in over 15 years.
Figure 20 Average emergency department length of stay for patients admitted to hospital, 2008-09 to 2022-23
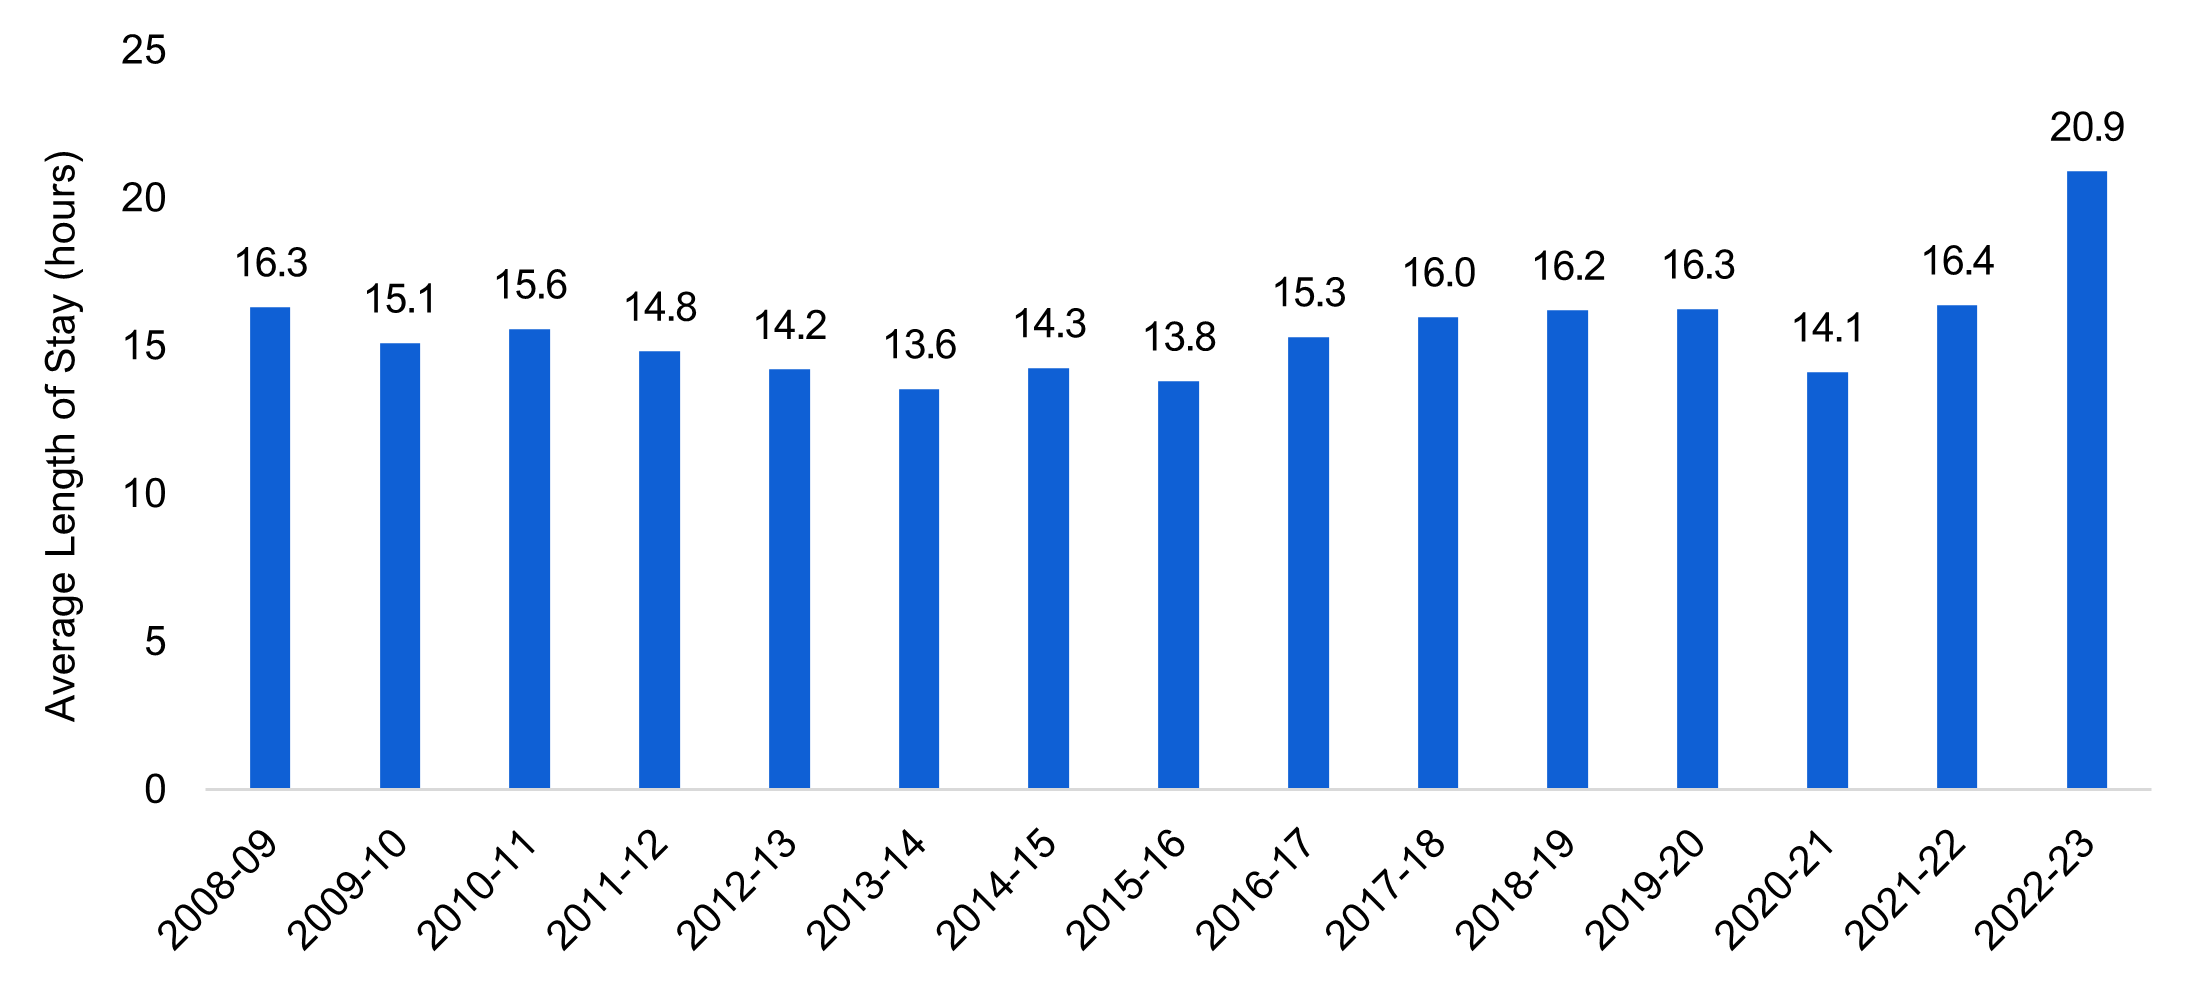
Note: 2022-23 average is from April to November of 2022.
Source: FAO analysis of information provided by the Ministry of Health.
In 2022-23, the average length of stay in an emergency department for all patients was approximately 6.1 hours.[50] This is 30 per cent higher than wait times over the five-year period prior to the COVID-19 pandemic and is also the longest average wait time recorded in over 15 years.
Figure 21 Average emergency department length of stay for all patients, 2008-09 to 2022-23
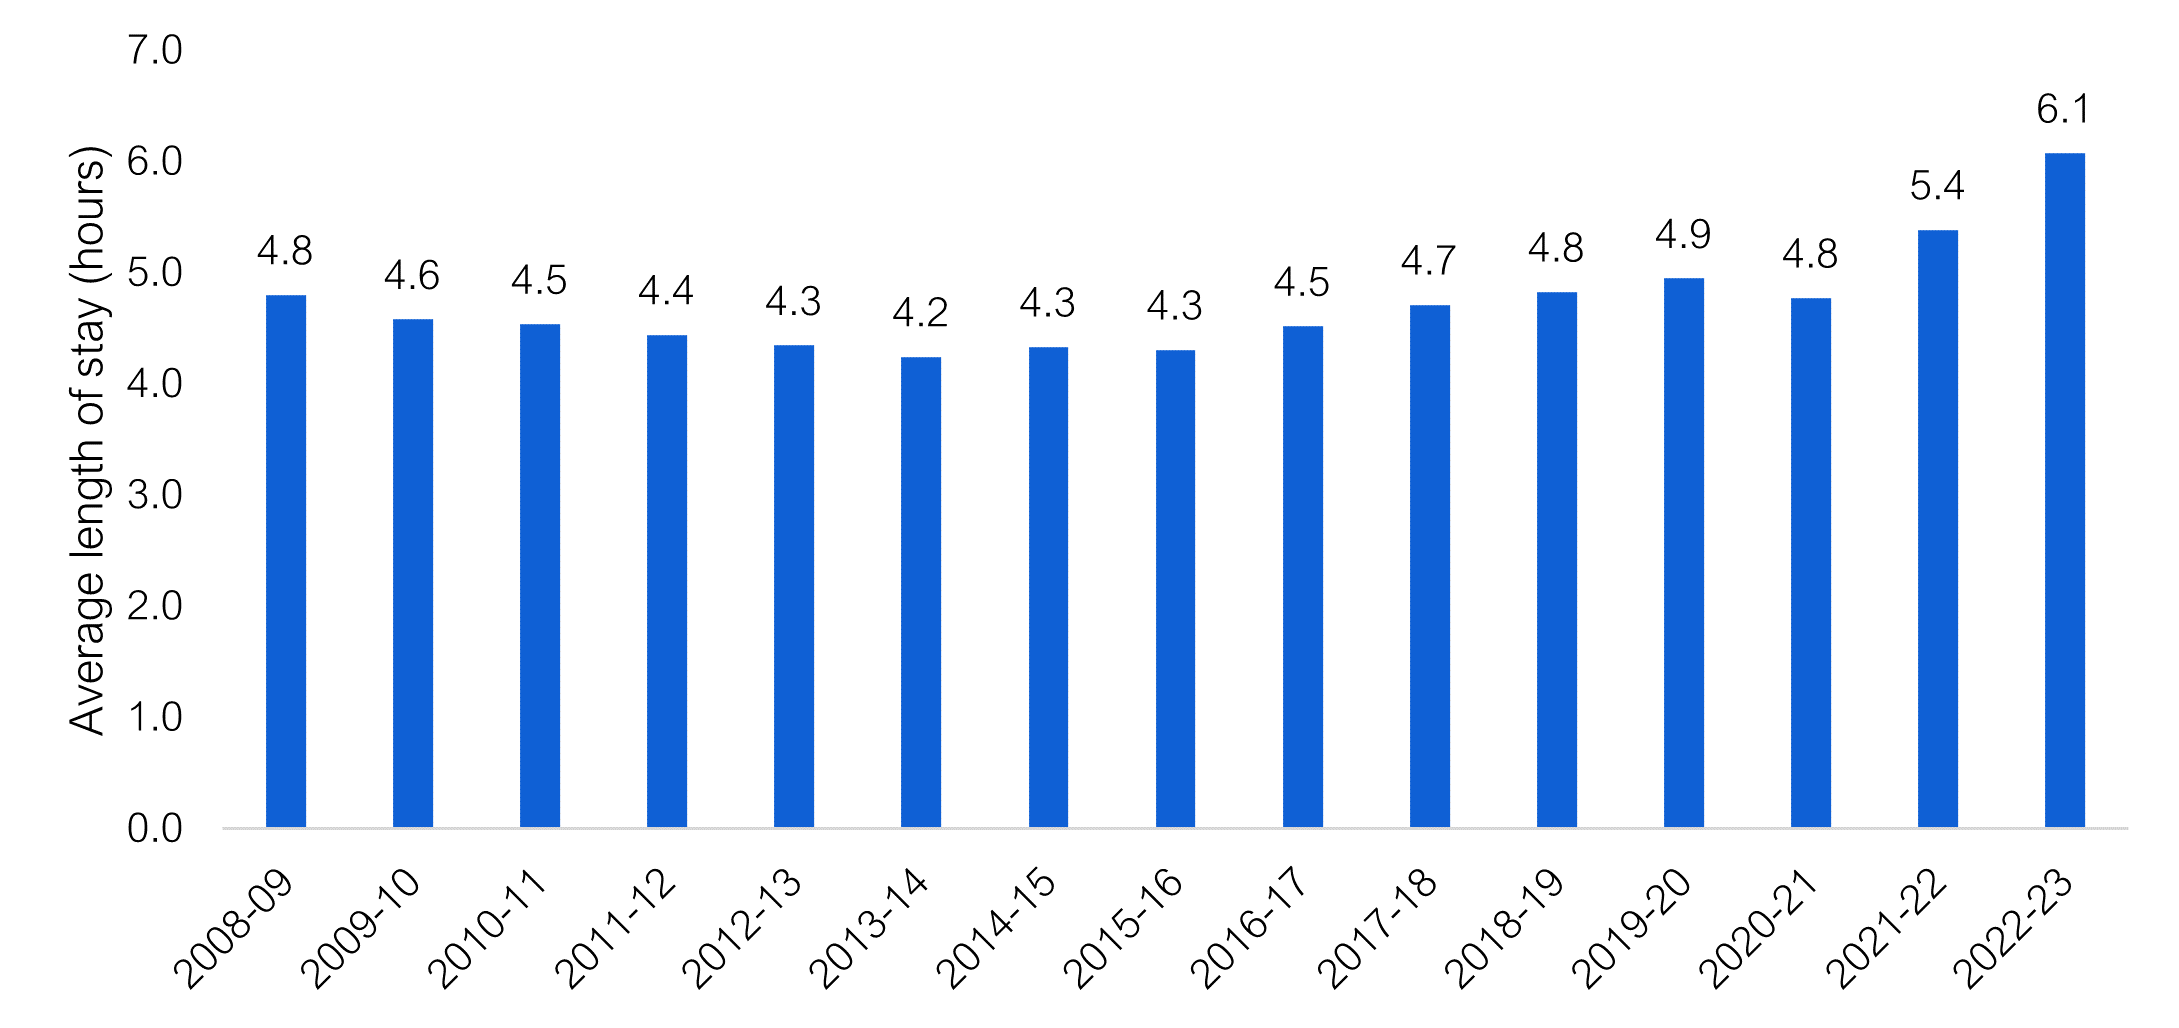
Note: 2022-23 average is from April to November of 2022.
Source: FAO analysis of information provided by the Ministry of Health.
Additionally, as of the writing of this report, there have been at least 145 unplanned emergency department closures in Ontario in 2022-23. Prior to the emergency department closures in 2022, the FAO is aware of only one unplanned emergency department closure since 2006 due to a lack of doctors.[51]
Overall, Ontario hospitals have identified a lack of available staff, including nurses and physicians, needed to respond to patient volumes that are returning to pre-Covid-19 pandemic levels as the key issue causing long emergency department wait times and closures.[52]
Plan for Emergency Departments
The Province’s plan primarily focuses on measures targeted to increase physician coverage in northern and rural emergency departments. These measures include:
- allocating $67.5 million for the COVID-19 temporary summer locum program, which will provide 655,000 hours of physician coverage in northern and rural emergency departments in 2022-23;[53]
- adding 400 physician residents linked with physicians in rural and northern emergency departments;
- expediting the registration of doctors who want to work in rural and northern emergency departments; and
- providing a real-time support and coaching program for physicians in rural emergency departments.
The Province’s plan also targets emergency departments more broadly with measures to reduce the number of emergency department visits and provide flexibility to hospitals to deal with surges in demand. These measures include:
- expanding 9-1-1 models of care to divert patients away from emergency departments;
- increasing access to primary care to reduce demand for emergency care;
- freeing up more hospital capacity to speed up emergency department admissions; and
- modifying the Community Commitment Program to allow nurses to be deployed across multiple hospitals to respond to staffing shortages.
FAO Analysis
The Province’s plan focuses primarily on increasing physician coverage in northern and rural emergency departments. Rural areas of the Province have been disproportionately affected by emergency department closures, and numerous rural hospitals have cited insufficient physician coverage as a reason for emergency department closures.[54] The FAO estimates 143 of the 145 emergency department closures have occurred in small population centres with populations of less than 30,000.[55] For perspective, about 40 per cent of emergency departments in Ontario are in small population centres and those emergency departments represent 99 per cent of all emergency department closures.
Ontario does have lower physician coverage relative to other Canadian provinces, particularly in rural areas. Ontario ranks seventh among Canadian provinces with 235 physicians per 100,000 residents. In rural areas, Ontario ranks eighth among Canadian provinces with 80 rural physicians per 100,000 rural residents, which is below the Canadian average of 107 rural physicians per 100,000 rural residents.[56]
Although emergency department closures are primarily an issue in smaller population centres, the longest emergency department wait times are more commonly found in hospitals in urban areas. On average, the FAO estimates admitted patients from emergency departments in small population centres waited 17.3 hours, patients in medium population centres waited 17.4 hours and patients in large urban centres waited 22.4 hours.
Figure 22 Average emergency department length of stay for patients admitted to hospital by population centre size, 2022-23
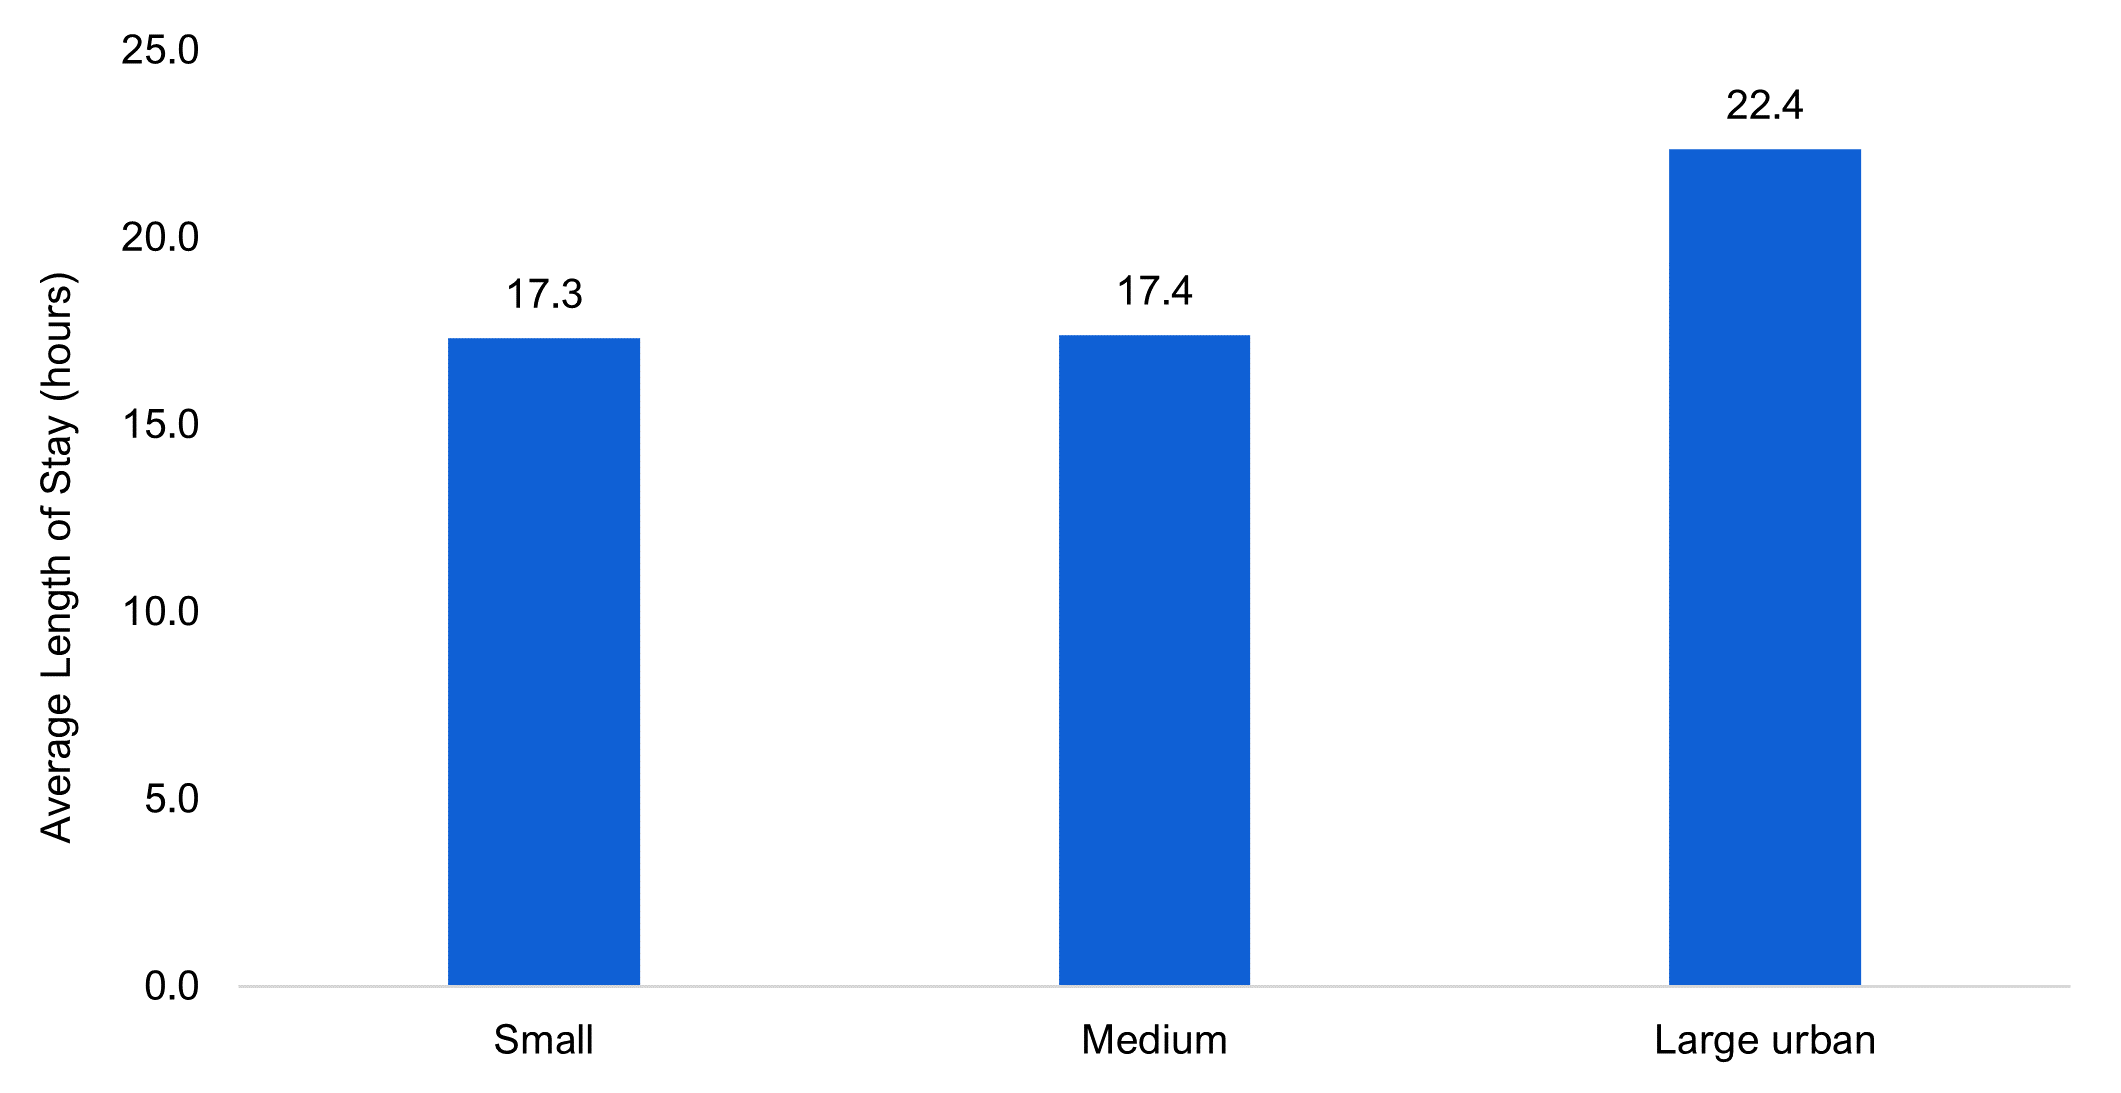
Note: Small population centres have a population of less than 30,000. Medium population centres have a population between 30,000 and 99,999. Large urban population centres have a population of 100,000 or more.
Source: FAO analysis of information provided by the Ministry of Health.
For hospitals across Ontario, not just in rural areas, the Province’s plan also aims to reduce emergency department strain through measures to reduce emergency department demand and to allow hospitals to better allocate resources to respond to staffing shortages.
While measures to reduce demand could help with emergency department strain, patient volumes in 2022-23 are still below pre-pandemic levels. From 2017-18 to 2019-20, emergency department wait times were significantly lower despite higher patient volumes and wait times for Ontario emergency departments were below the Canadian average in each year.[57] Even looking at hospitals with the longest wait times in 2022, for the most part, those hospitals have lower patient volumes than before the COVID-19 pandemic. Of the 20 hospitals with the longest emergency department wait times for admitted patients in 2022-23, 17 have lower patient volumes than the 2017 to 2019 average. This suggests that the more pressing immediate problem is emergency department staffing as opposed to patient volumes/demand. However, the Province’s emergency department staffing measures only provide hospitals with flexibility to deal with short-term issues. The measures do not provide a sustained increase in emergency department staff.
Overall, while the Province’s measures do address physician shortages in rural emergency departments, which contributes to emergency department closures, the measures do not provide for a sustained increase in emergency department staffing across the Province. As a result, Ontario’s success in addressing emergency department strain depends on the success of the Province’s measures for the fifth area of focus, which is Ontario’s health sector workforce. These measures are discussed in the following section.
E. Ontario’s Health Sector Workforce
Background and Context
Since the start of the COVID-19 pandemic, health sector job vacancies have more than doubled in Ontario from 14,800 in the fourth quarter of 2019 to 34,800 in the third quarter of 2022. These vacancies are a result of the number of positions in the health sector growing faster than the number of workers.
Figure 23 Health sector job vacancies, 2018 to 2022
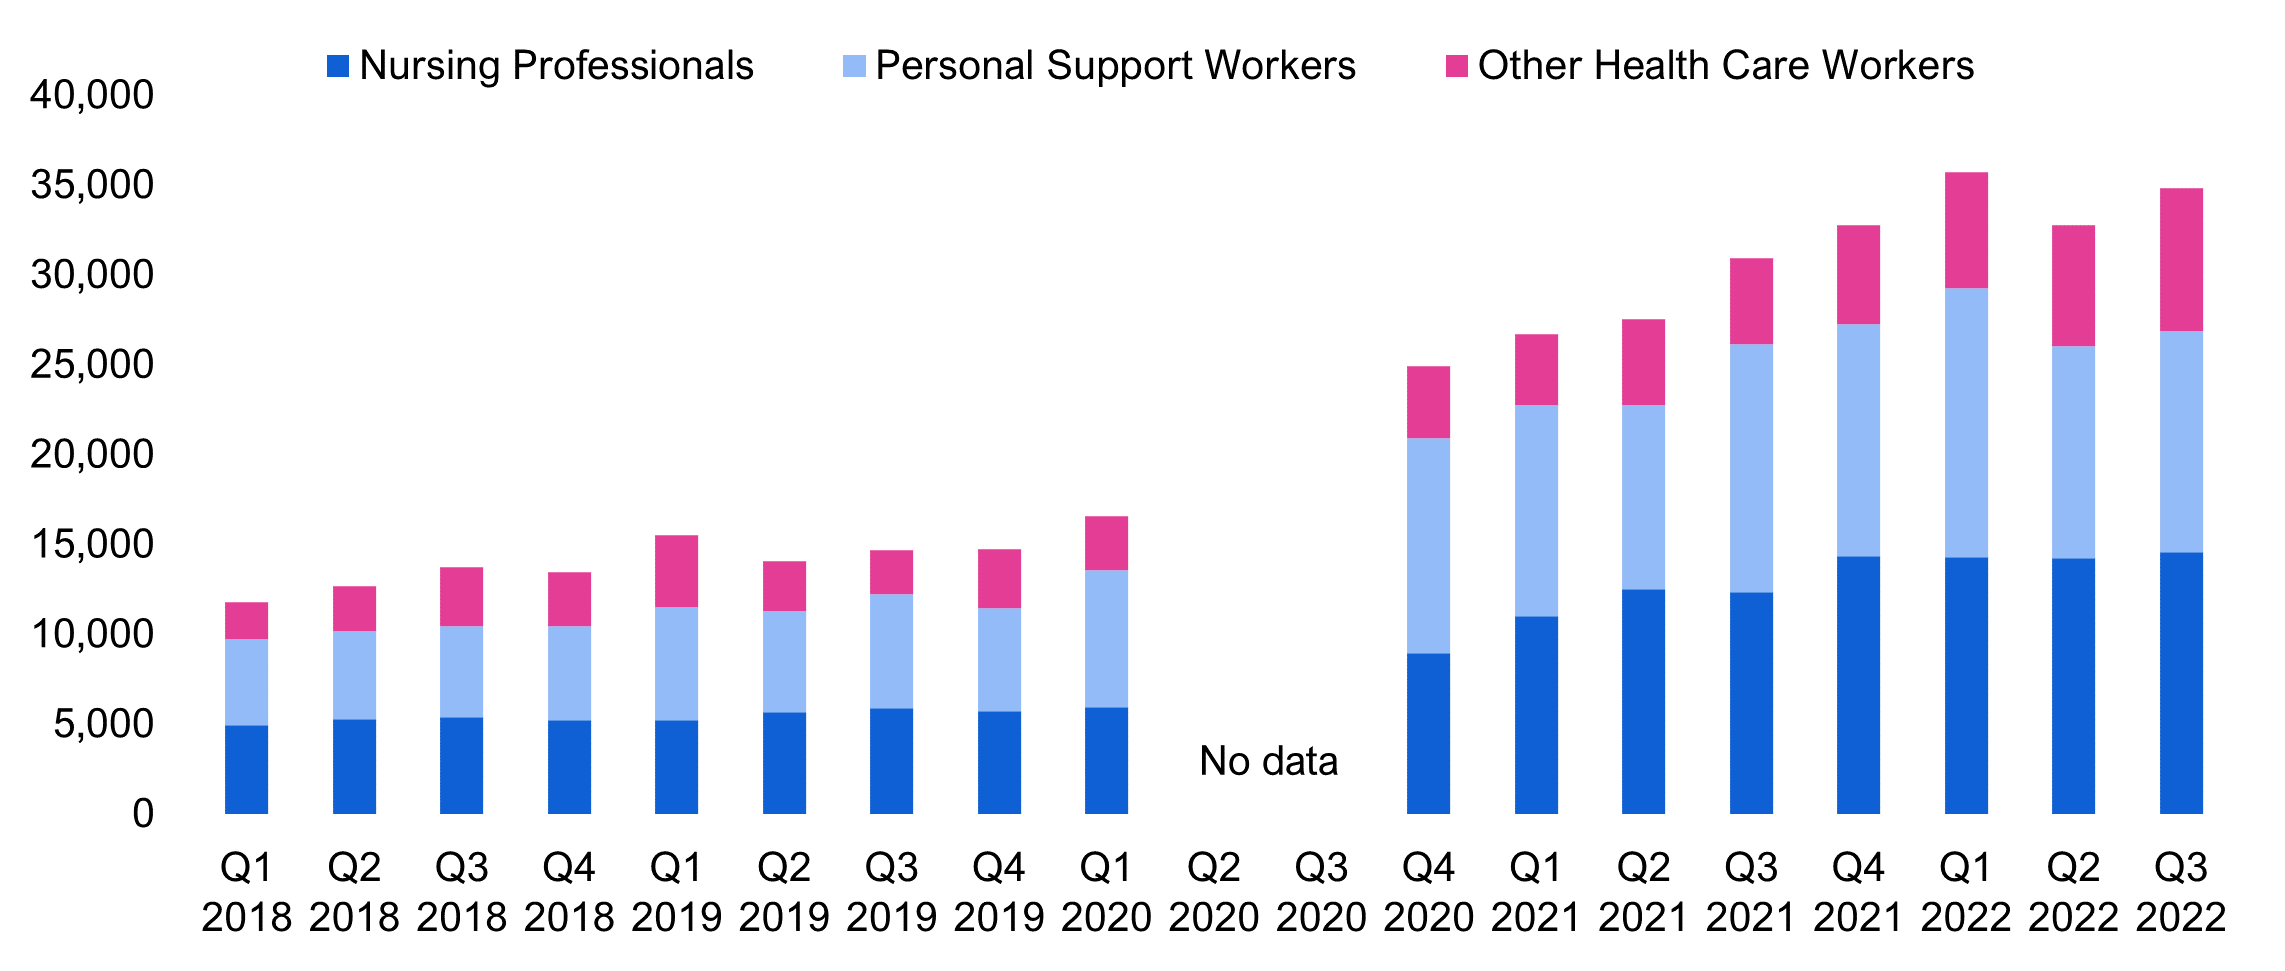
Source: FAO based on Statistics Canada, Table 14-10-0328-01
In the third quarter of 2022, there were 14,575 vacant nursing positions representing a vacancy rate of eight per cent, while there were 12,300 vacant personal support worker (PSW) positions representing eight percent of all PSW positions. To return to pre-pandemic vacancy rates,[58] the FAO estimates that 9,700 nurses and 7,700 PSWs are needed.
| Occupational Grouping | Vacancies as of Q3 2022 | Vacancy Rate as of Q3 2022 | Workers Needed to Return to Pre-Pandemic Vacancy Rate |
|---|---|---|---|
| Nurses | |||
| Registered Practical Nurses | 5,345 | 18% | 4,595 |
| Registered Nurses and Nurse Practitioners | 9,230 | 6% | 5,105 |
| Total Nurses | 14,575 | 8% | 9,700 |
| Personal Support Workers | 12,320 | 8% | 7,746 |
| Total Nurses and PSWs | 26,895 | 8% | 17,446 |
Furthermore, the FAO estimates that about 23,800 additional nurses and 44,100 additional personal support workers will be needed in hospitals, long-term care and home care by 2027-28 to meet government program expansion commitments. These commitments include adding approximately 1,000 new hospital beds from 2022-23 to 2027-28 (see section A for details), expanding home care (see section B for details), and creating 30,000 new long-term care beds and increasing direct care hours for residents in long-term care homes (see section B for details).
| Program | Commitment | Nurses Needed | PSWs Needed |
|---|---|---|---|
| Hospitals | Adding approximately 1,000 new hospital beds from 2022-23 to 2027-28* | 2,698 | 409 |
| Home Care | $1.0 billion over three years to increase the supply of home care services for Ontarians | 1,599 | 4,635 |
| Long-Term Care | Adding 30,000 new long-term care beds by the end of 2028 and increasing the average hours of direct care provided to long-term care residents from a nurse or personal support worker from 2.75 hours in 2018-19 to four hours in 2024-25 | 19,453 | 39,087 |
| Total | 23,751 | 44,131 |
Overall, to return to pre-pandemic vacancy rates and meet government program expansion commitments in hospitals, home care and long-term care, the FAO projects that Ontario needs 34,800 additional nurses[59] and 51,900 additional personal support workers by 2027.[60] This represents an approximately 26 per cent increase in nurses and a 45 per cent increase in personal support workers employed in these sectors.
Figure 24 Cumulative increase in employment of nurses and personal support workers in hospitals, home and community care, and long-term care needed to address excess vacancies and meet government program expansion commitments, 2022-23 to 2027-28
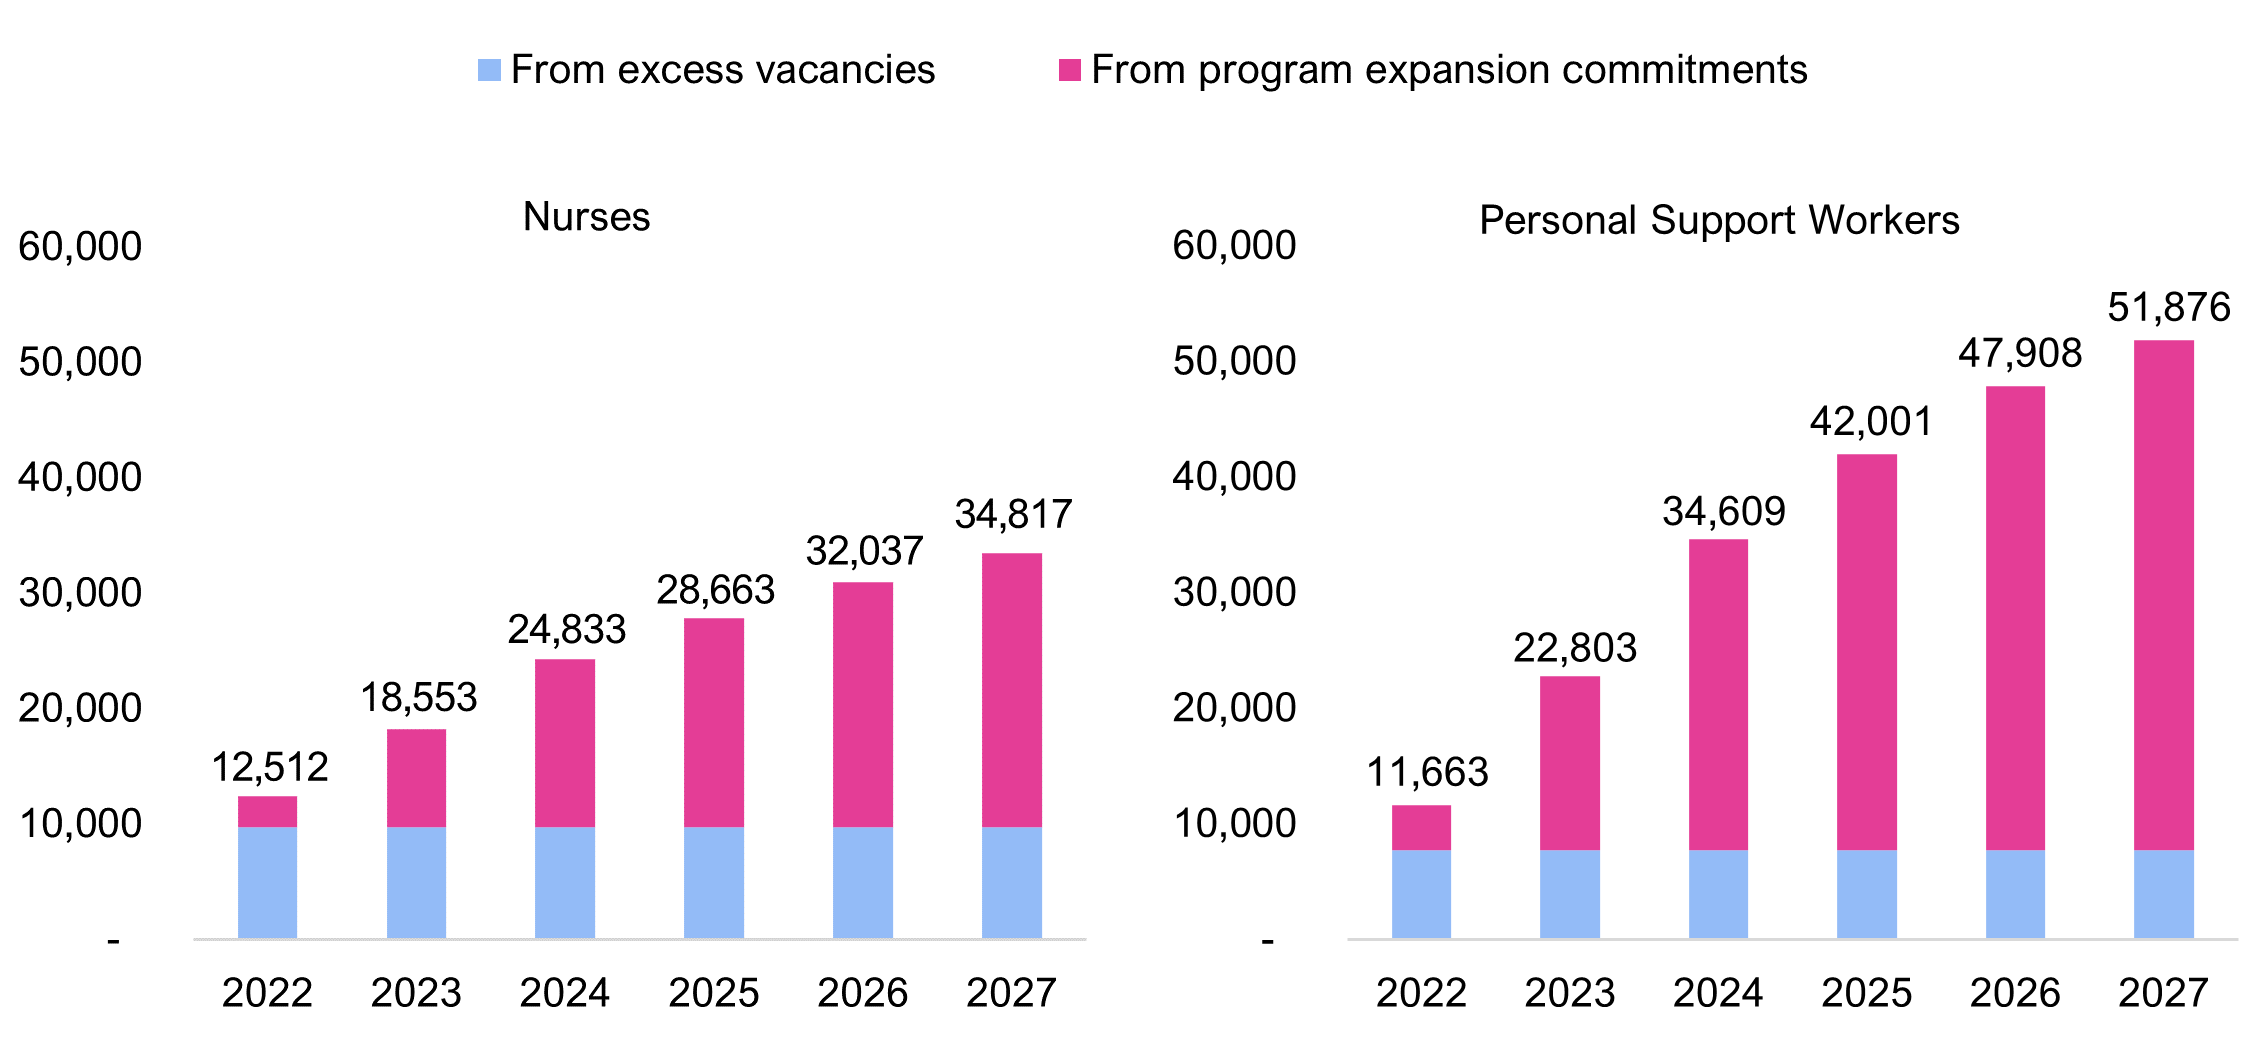
Source: FAO calculations
Adding to the challenge, Ontario currently has the lowest wages for nurses in Canada. In 2012, wages for nurses in Ontario were fifth highest after Saskatchewan, Alberta, British Columbia, and Newfoundland and Labrador. However, Government of Ontario wage restraint policies[61] over the last 10 years resulted in average wages for Ontario nurses in 2022 that were lower than any other province.
Figure 25 Average hourly wage for nurses by province, 2012 vs. 2022
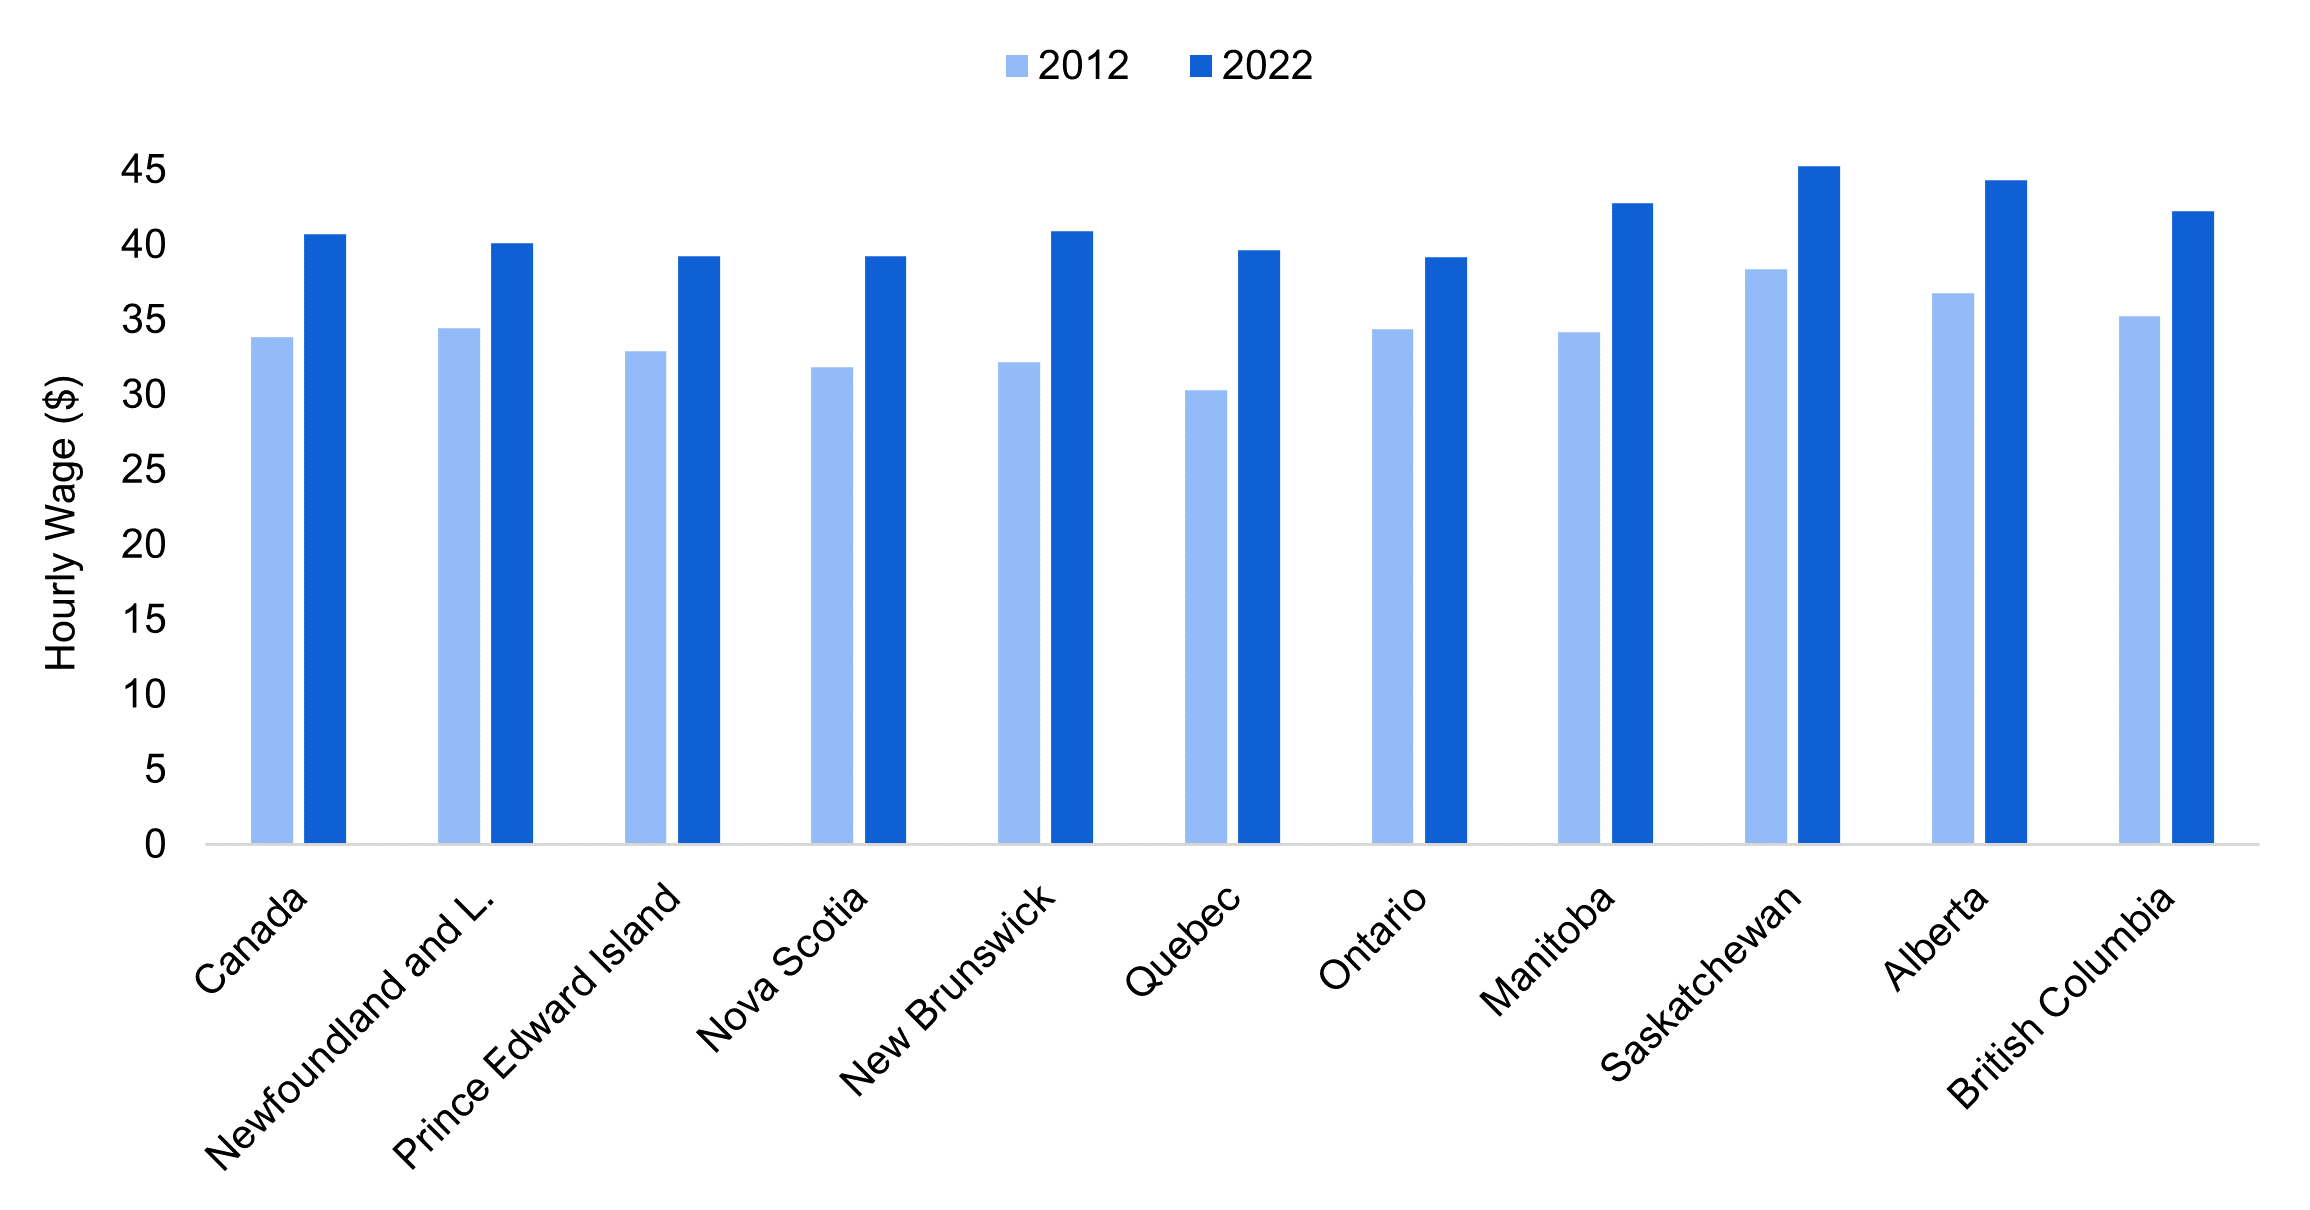
Source: FAO based on Statistics Canada. Table 14-10-0340-01 Employee wages by occupation, annual
While wage data is not available specifically for personal support workers, in 2022, weekly average earnings in Ontario long-term care facilities were 1.3 per cent below the national average, despite the Province’s $3 per hour wage increase for PSWs in long-term care, first introduced in October 2020 (see chapter 4), and Ontario’s higher cost of living.[62]
Plan to Expand Ontario’s Health Workforce
The Province is implementing a number of measures to meet the demand for additional nurses and personal support workers, including measures targeting pay, training and regulatory barriers. These measures have been announced across several policy documents.[63]
Based on the FAO’s analysis, the Province’s key measures to increase nursing employment are accelerating the registration of internationally educated nurses and increasing nursing student enrolment. The registration of internationally educated nurses (IENs) is being achieved primarily by relaxing regulatory barriers to registration, including Ontario work experience requirements and language testing requirements. The registration of IENs is also being supported by the establishment of the temporary registrant class, timeliness for processing of applications, expansions of the Supervised Practice Experience Partnership (SPEP) Program, and temporary coverage of professional fees. Lastly, the Province temporarily increased nursing enrolment by 2,000 spaces in 2021-22 and has committed to permanently increase nursing enrolment by 1,500 seats in 2023, consisting of spaces for 500 registered practical nurses and 1,000 registered nurses.
The Province’s key measures to increase personal support worker employment are grants to students and wage increases. In 2021-22, the Province committed to spend up to $200 million to train up to 16,200 personal support workers through publicly assisted colleges, private career colleges and school boards. From this overall funding, the Province committed $115 million to train up to 6,000 PSWs over six months at public colleges starting in April 2021[64] and $86 million to train up to 8,000 new PSWs at private career colleges and school boards in 2021-22.[65] Subsequently, the Province announced $54.7 million to train up to 4,000 new PSWs at private career colleges in summer 2022.[66] Regarding wage increases, in October 2020, in response to the COVID-19 pandemic, the Province temporarily increased wages for personal support workers by $3 per hour in home care and long-term care and $2 per hour in hospitals. In 2022, these wage increases were made permanent (see chapter 4).
FAO Analysis
Employment of Nurses
Based on the FAO’s analysis, the shortage of nurses will continue across the forecast period. The FAO estimates that 34,800 more nurses will be required by 2027 but only 31,900 will be added, resulting in a shortfall of 2,900 nurses. Over the next three years, the shortage will average approximately 10,000 nurses, and then gradually decline as growth in demand for nurses from long-term care and hospitals slows, and the incremental graduates from increased enrolment start to enter the labour market.
Figure 26 Projected shortage of nurses in hospitals, home and community care, and long-term care, 2022 to 2027
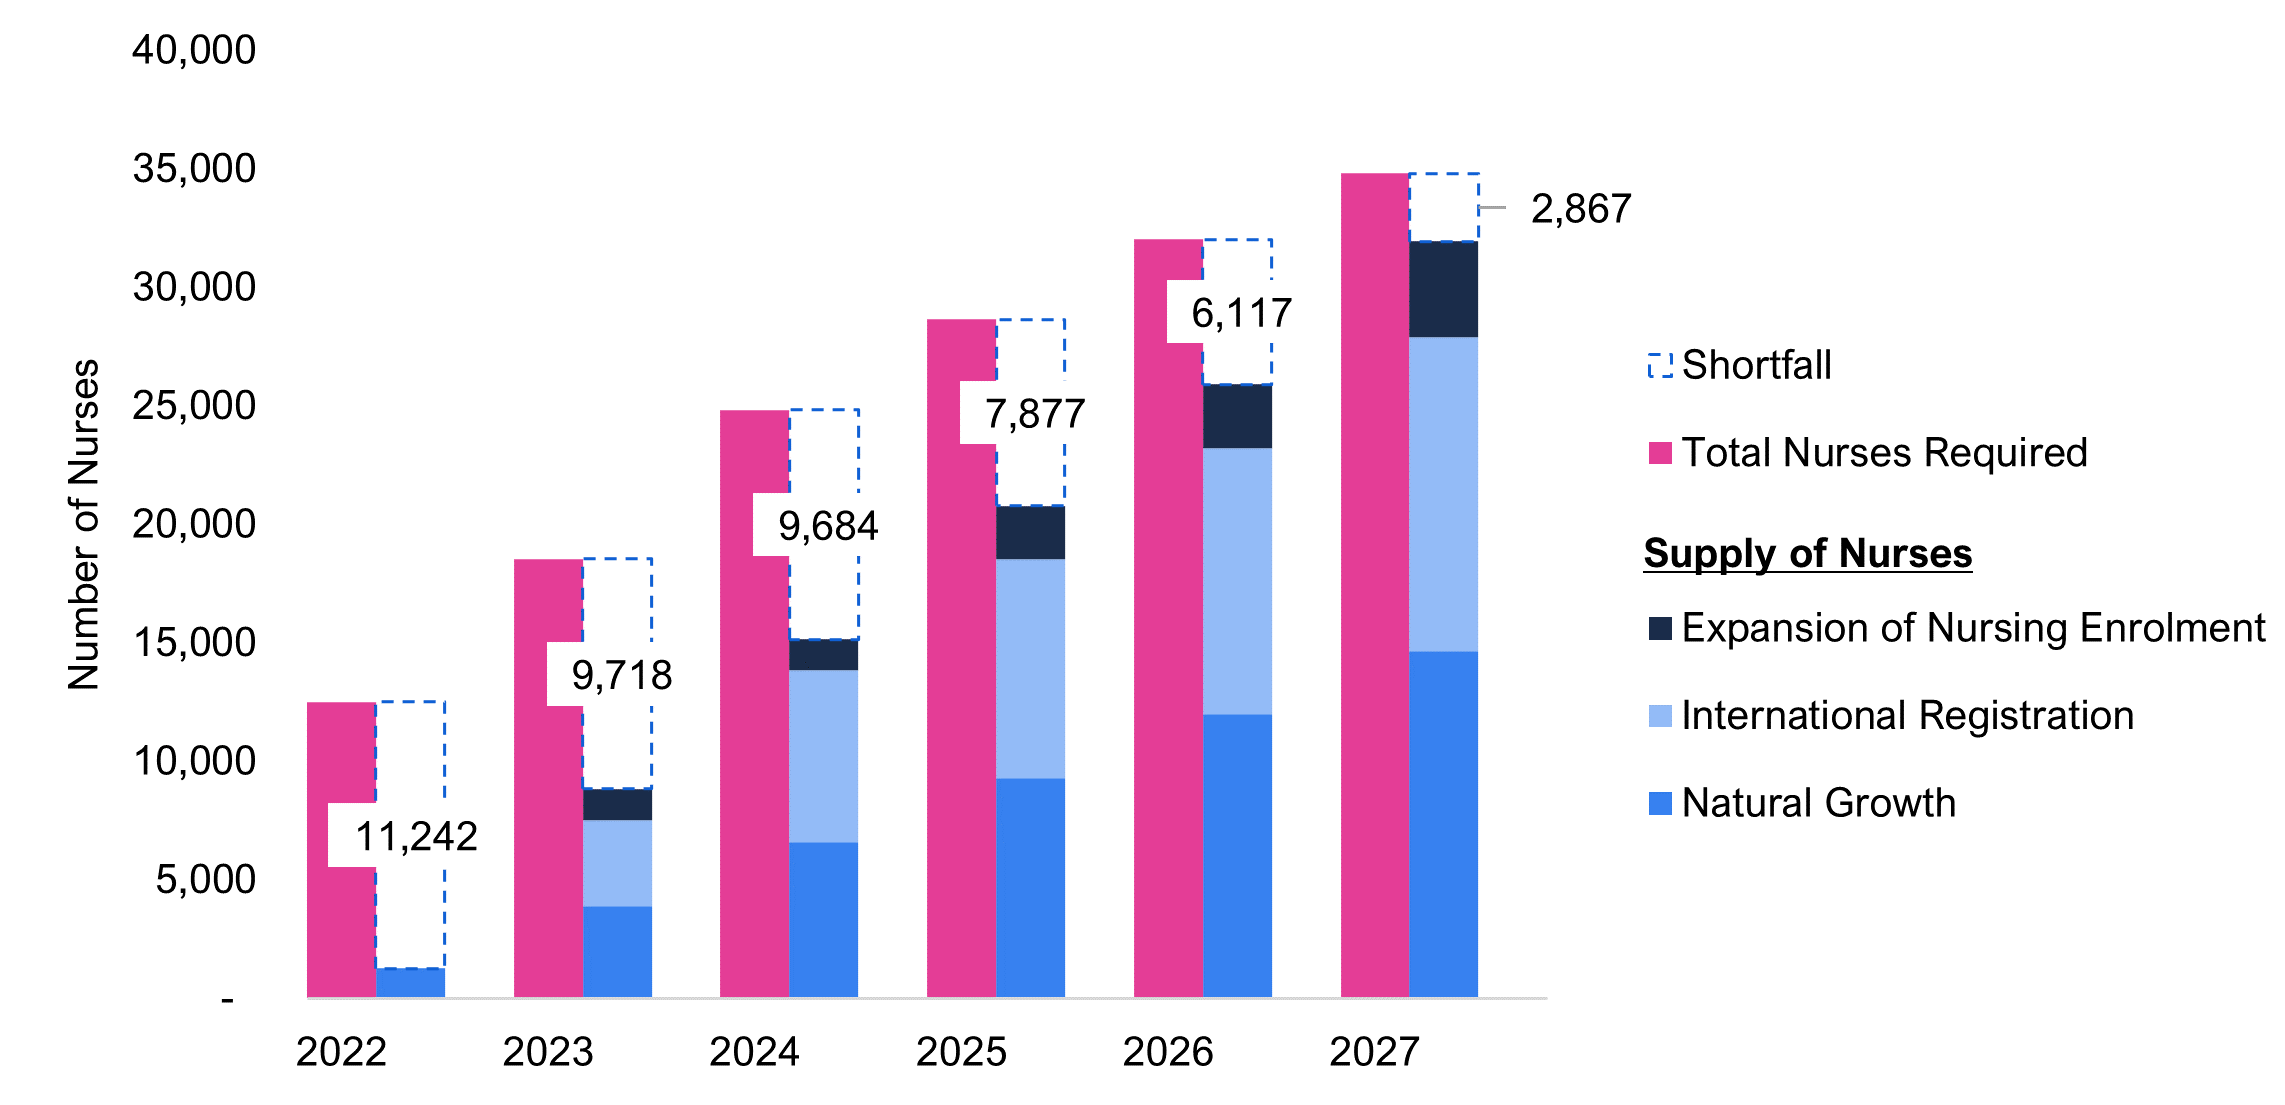
Note: “Total Nurses Required” represents increase in employment needed to address excess vacancies and meet government program expansion commitments. Bar heights reflect cumulative supply and demand for nurses from various factors, while the gap reflects the resulting shortage in each year.
Source: FAO model
Measures to accelerate the registration of internationally trained nurses have had success to date. In 2022, Ontario registered 5,125 new internationally educated nurses, up from an average of 1,411 per year from 2015 to 2019. However, some of this success was due to a backlog in active applications, which reached 14,880 in 2020. Without new measures to increase the immigration of nurses to Ontario, the FAO assesses that maintaining the 2022 increase in registrations will be challenging. Given this, the FAO assumes that Ontario will add 3,600 incremental internationally educated nurses until 2024 then, starting in 2025, the FAO assumes that Ontario will continue to register a more sustainable 2,000 incremental internationally educated nurses each year.
As noted above, the Province provided funding for a temporary 2,000 student increase in nursing enrolment in 2021-22, consisting of spaces for 1,453 registered practical nurses and 551 registered nurses. The Province has also committed to permanently increase nursing enrolment by 1,500 seats in 2023, consisting of 500 spaces for registered practical nurses and 1,000 spaces for registered nurses.[67] Increased enrolment is forecasted to add 4,100 nurses over our projection period.[68]
In addition to policy measures, nursing employment will experience natural growth. Natural growth reflects the ongoing net effect of factors that add to the supply of nurses (e.g., graduations and immigration) and factors that detract from the supply of nurses (e.g., emigration, exits to other careers and retirements). The FAO estimates that natural growth will add a net 2,400 nurses each year for hospitals, home care and long-term care, consistent with pre-pandemic trends.
Employment of Personal Support Workers
Based on the FAO’s analysis, the Province’s measures will not be sufficient to address the shortage of PSWs. The FAO estimates that 51,900 more PSWs will be required by 2027 but only 21,700 will be added, resulting in a shortfall of 30,100. The shortage of PSWs is projected to grow consistently over the projection period as measures to increase the supply of PSWs are more than offset by the need for more PSWs to meet the government’s expansion commitments in hospitals, home care and long-term care.
Figure 27 Projected shortage of personal support workers in hospitals, home and community care, and long-term care, 2022 to 2027
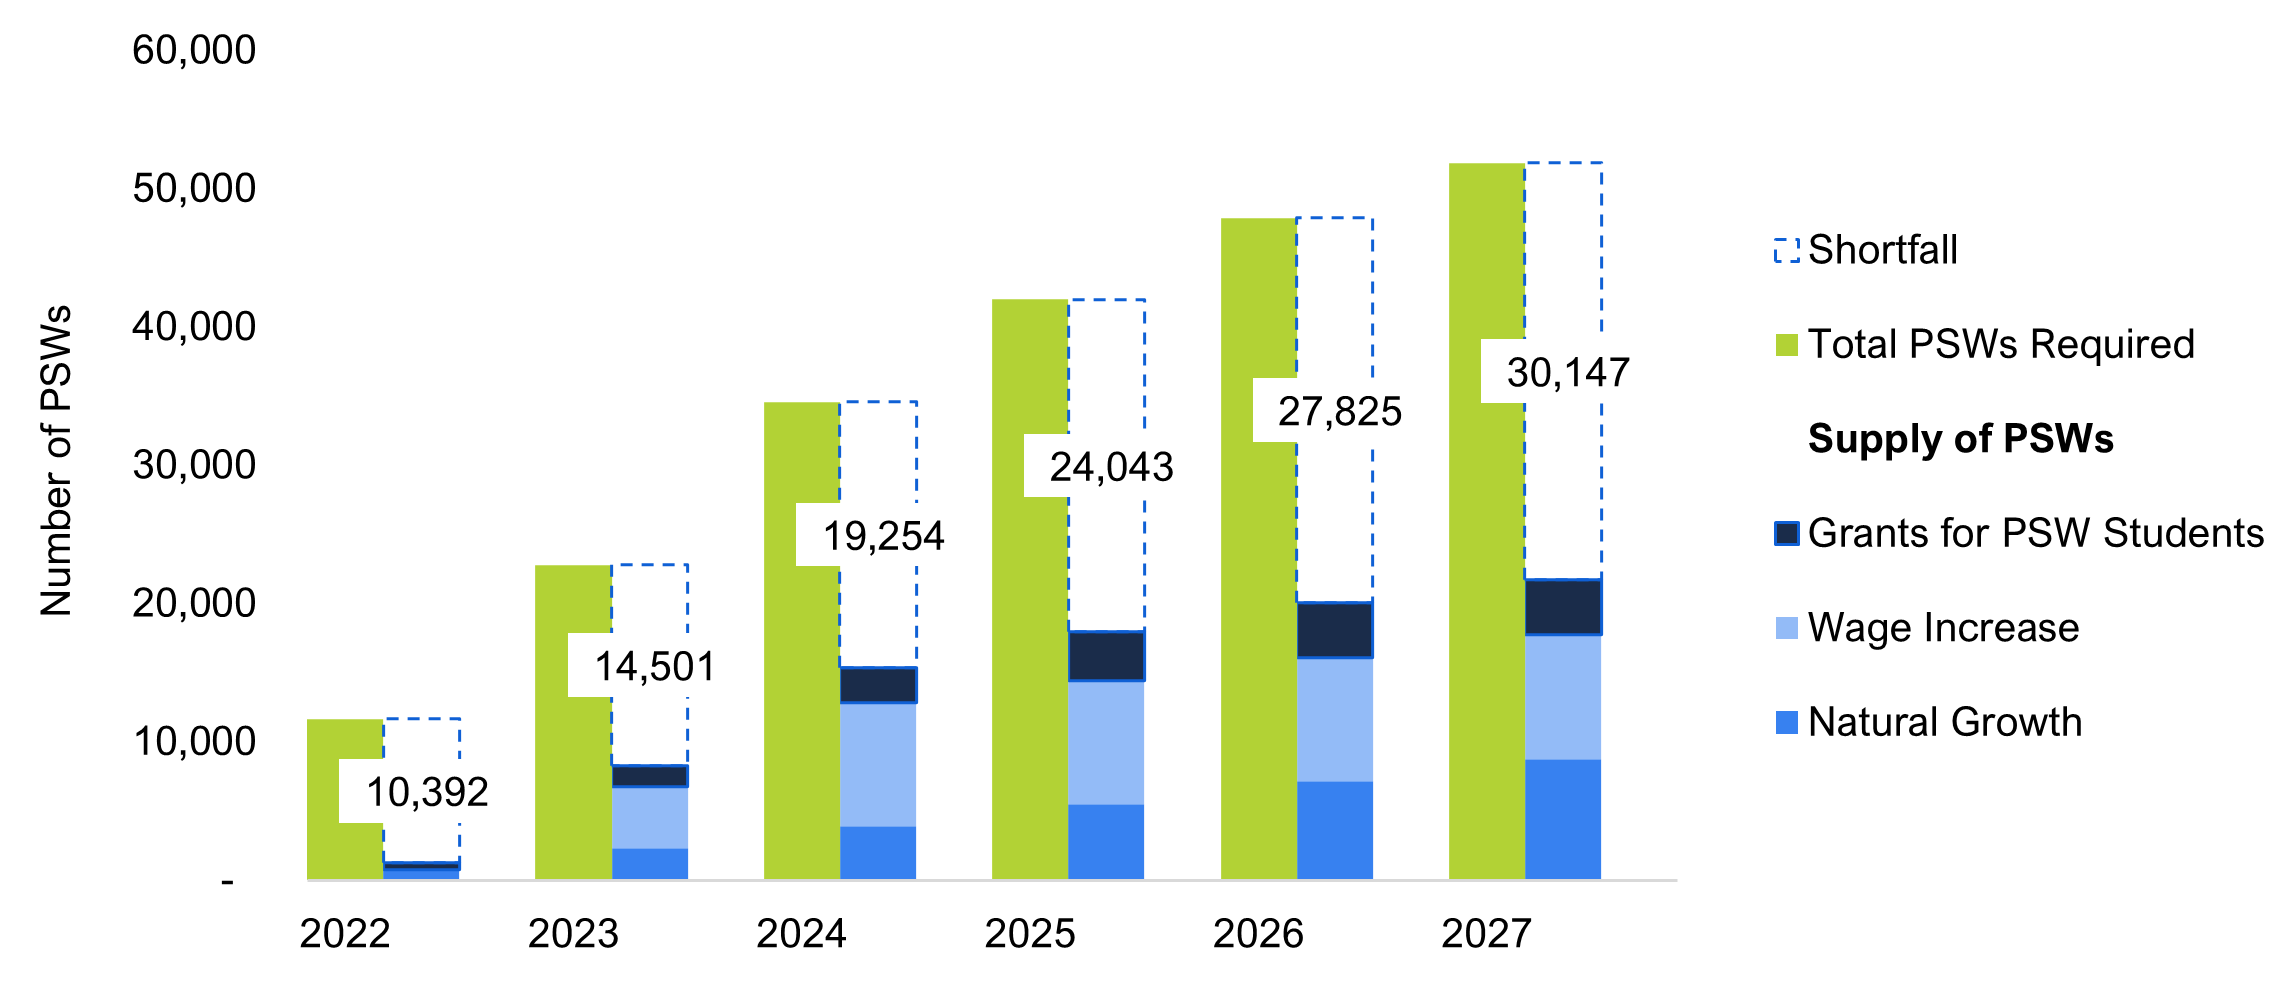
Note: “Total PSWs Required” represents increase in employment needed to address excess vacancies and meet government program expansion commitments. Bar heights reflect cumulative supply and demand for personal support workers from various factors, while the gap reflects the resulting shortage in each year.
Source: FAO model
As noted above, Ontario has provided grants to support PSW students at public colleges, private colleges and school boards. The FAO estimates that most students who received grants have already graduated and are currently in the workforce. The FAO assumes that the Province will continue to provide grants to support up to 4,000 students at private career colleges every year until 2025-26. However, since many of these spaces would have already been filled without the grants, the FAO estimates that this would increase enrolment by only 1,000 students per year to 2025-26, with the last graduates entering the workforce in 2026-27.
The $2 to $3 per hour wage increase implemented by the Province for PSWs in hospitals, home care and long-term care (chapter 4) has the potential to attract new personal support workers and improve worker retention; in fact, personal support workers identify increased pay as the single most important thing employers could do to improve their jobs.[69] The FAO estimates that the $2 to $3 per hour wage increase will boost PSW employment by a total of 8,900 by 2027.[70]
The FAO estimates that natural growth will add a net 1,600 personal support workers each year. While growth in the occupation as a whole is expected to be higher, there is also rising demand for personal support workers in other industries meeting the personal care needs of Ontario’s aging population, such as private retirement residences and privately funded home health care agencies.
Overall Implications and Challenges
In short, as of the writing of this report, the FAO projects that the health workforce policy measures announced by the Province, along with natural growth, will add 53,700 nurses and PSWs over the six-year period to 2027-28. Nevertheless, this increase in nurses and PSWs will not be sufficient to address current staffing shortages and meet Ontario’s commitments to expand care in hospitals, long-term care and home care, with an expected shortfall of 33,000 nurses and PSWs in 2027-28.
Failure to address the projected shortfall in nurses and PSWs will result in the Province being unable to meet its expansion commitments in hospitals, home care and long-term care, and will also have additional impacts on health sector service levels.
In hospitals, nurse and PSW shortages could impact the number of new hospital beds that are expected to be opened by 2027-28 (see section A). Shortages in hospital capacity in turn limit the resources available to hospitals to perform elective surgeries, which has manifested in fewer surgeries performed, longer waitlists and longer wait times, compared to pre-pandemic levels (see section C). Finally, staffing shortages in hospital emergency departments and a lack of hospital beds available to admit patients are contributing to record wait times in emergency departments and temporary emergency department closures (see section D).
In long-term care, nurse and PSW shortages may impact the Province’s commitment to open a net 30,000 new long-term care beds and to increase the average hours of direct care provided to long-term care residents from a nurse or personal support worker from 2.75 hours in 2018-19 to four hours in 2024-25 (see section B). Based on a recent survey of 100 not-for-profit LTC homes, 44 per cent report that they are unsure whether they will meet the government’s target of four hours of daily direct care by 2024-25 due to staffing shortages and higher fees charged by temporary staffing agencies.[71]
In home care, nurse and PSW shortages may impact the Province’s plan to increase the supply of home care services for Ontarians through an additional $1 billion in funding over three years (see section B).
Academic literature predicts that health care staffing shortages result in adverse outcomes for patients, including more infections, more pressure injuries, more patient falls and higher mortality.[72] For nurses, understaffing contributes to increased stress, increased dissatisfaction and ultimately increased turnover.[73]
Importantly, the FAO’s health sector spending projection (Chapters 3 and 4) assumes that the Province will be able to address current staffing shortages and meet Ontario’s commitments to expand care in hospitals, long-term care and home care, while adhering to applicable wage restraint under Bill 124 and then historical wage growth. However, the FAO also projects that without additional measures, there will be a shortfall of 33,000 nurses and PSWs in 2027-28. In order to address this shortfall, the Province may have to introduce new measures that would increase spending above the FAO’s health sector spending outlook. For example, such measures could include increasing wages, reducing workloads, structuring staffing to use more desirable full-time positions, increasing reliance on agency workers and private providers not subject to wage restraints, and/or adding new funding for education or training.
The FAO has also identified notable risks to its projected shortage of nurses and PSWs:
- The FAO’s analysis assumes that natural growth in the number of nurses and PSWs in hospitals, home and community care, and long-term care will follow historical trends, but certain factors could lead to a lower than historical increase. There are some indications that hospitals are facing challenges retaining nurses due to low job satisfaction from burnout and low wage growth. Consistent with this, the Ontario Hospitals Association reported 14.5 per cent turnover in 2021-22 compared with 8.4 per cent in 2019-20.[74] As noted above, in 2022, wages for Ontario nurses were the lowest in Canada, while wages for workers in Ontario long-term care facilities were below the Canadian average.
- The Province recently announced that independent health facilities would be eligible to provide additional medical services that would usually be provided in hospitals, such as cataract surgeries.[75] While shifting capacity outside of hospitals could reduce hospitals’ staffing requirements, and therefore understaffing, these facilities will compete for the same health care workers, so the net impact is uncertain.
- The outlook for the supply of personal support workers is highly uncertain. The impact of provincial grants is uncertain due to a lack of data available to the FAO on enrolment, employment and retention. The impact of the $2 to $3 hourly wage increase on PSW employment is uncertain because academic literature provided a wide range of estimates for how workers might respond to wage increases. The rate of natural growth in PSW employment in hospitals, home care and long-term care might be affected by the increasing number of positions being available in these settings. Finally, the cumulative impact of these measures is complicated by retention and the potential impact of worker shortages on wages. While the FAO’s projection weighs the available evidence to provide the best possible estimate, there remains a risk that the shortage could be significantly larger or smaller than projected.
6. Appendix
Surgeries Performed, Waitlist and Wait Times by Service and Year
| Service Area | 2019 | 2020 | 2021 | 2022 | Change (2019 to 2022) |
|---|---|---|---|---|---|
| General Surgery | 80,389 | 59,346 | 64,706 | 67,480 | -16% |
| Gynaecologic Surgery | 56,882 | 38,870 | 42,539 | 45,239 | -20% |
| Neurosurgery | 7,326 | 5,546 | 5,768 | 6,302 | -14% |
| Oncology Procedures | 57,155 | 49,069 | 53,783 | 56,845 | -1% |
| Ophthalmic Surgery | 163,340 | 112,740 | 145,878 | 153,059 | -6% |
| Oral and Maxillofacial | 9,285 | 5,076 | 5,632 | 5,409 | -42% |
| Orthopaedic Surgery | 111,995 | 80,862 | 93,210 | 96,148 | -14% |
| Otolaryngic Surgery | 27,041 | 18,226 | 20,141 | 21,142 | -22% |
| Paediatric Cardiovascular Surgery | 501 | 493 | 492 | 527 | 5% |
| Paediatric Dental/Oral/Maxillofacial | 10,557 | 6,081 | 7,703 | 6,474 | -39% |
| Paediatric General Surgery | 3,838 | 2,895 | 3,295 | 3,147 | -18% |
| Paediatric Gynaecologic Surgery | 397 | 307 | 418 | 372 | -6% |
| Paediatric Neurosurgery | 490 | 396 | 510 | 425 | -13% |
| Paediatric Ophthalmic Surgery | 3,687 | 2,644 | 3,427 | 2,986 | -19% |
| Paediatric Orthopaedic Surgery | 4,345 | 3,048 | 3,837 | 3,513 | -19% |
| Paediatric Otolaryngic Surgery | 22,117 | 11,820 | 8,590 | 10,966 | -50% |
| Paediatric Plastic and Reconstruct. | 2,963 | 2,113 | 3,093 | 3,023 | 2% |
| Paediatric Urologic Surgery | 4,201 | 2,727 | 3,415 | 3,185 | -24% |
| Plastic and Reconstructive Surgery | 26,404 | 16,968 | 18,024 | 19,082 | -28% |
| Thoracic Surgery | 1,896 | 1,351 | 1,351 | 1,732 | -9% |
| Urologic Surgery | 43,425 | 32,371 | 36,550 | 38,533 | -11% |
| Vascular Surgery | 11,065 | 8,836 | 9,879 | 9,898 | -11% |
| Total | 649,299 | 461,785 | 532,241 | 555,487 | -14% |
| Service Area | 2019 | 2020 | 2021 | 2022 | Change (2019 to 2022) |
|---|---|---|---|---|---|
| General Surgery | 18,139 | 20,430 | 23,076 | 27,438 | 51% |
| Gynaecologic Surgery | 14,705 | 16,077 | 18,314 | 21,402 | 46% |
| Neurosurgery | 2,140 | 2,397 | 2,271 | 2,452 | 15% |
| Oncology Procedures | 5,886 | 5,640 | 5,796 | 7,130 | 21% |
| Ophthalmic Surgery | 58,776 | 59,330 | 70,743 | 76,393 | 30% |
| Oral and Maxillofacial | 3,826 | 3,526 | 3,587 | 3,917 | 2% |
| Orthopaedic Surgery | 50,475 | 52,362 | 53,680 | 58,718 | 16% |
| Otolaryngic Surgery | 10,242 | 9,907 | 11,839 | 13,957 | 36% |
| Paediatric Cardiovascular Surgery | 83 | 130 | 105 | 101 | 22% |
| Paediatric Dental/Oral/Maxillofacial | 4,261 | 3,824 | 3,199 | 3,395 | -20% |
| Paediatric General Surgery | 872 | 966 | 850 | 1,190 | 36% |
| Paediatric Gynaecologic Surgery | 96 | 128 | 147 | 140 | 45% |
| Paediatric Neurosurgery | 67 | 96 | 81 | 88 | 32% |
| Paediatric Ophthalmic Surgery | 1,156 | 1,339 | 1,258 | 1,362 | 18% |
| Paediatric Orthopaedic Surgery | 1,788 | 2,028 | 1,841 | 2,059 | 15% |
| Paediatric Otolaryngic Surgery | 5,482 | 5,068 | 3,033 | 3,713 | -32% |
| Paediatric Plastic and Reconstruct. | 1,026 | 1,190 | 1,465 | 1,694 | 65% |
| Paediatric Urologic Surgery | 1,884 | 2,333 | 2,812 | 3,349 | 78% |
| Plastic and Reconstructive Surgery | 8,062 | 7,601 | 8,129 | 8,852 | 10% |
| Thoracic Surgery | 373 | 337 | 484 | 707 | 90% |
| Urologic Surgery | 8,661 | 9,343 | 10,392 | 12,427 | 43% |
| Vascular Surgery | 1,888 | 2,014 | 2,271 | 2,506 | 33% |
| Total | 199,890 | 206,066 | 225,372 | 252,986 | 27% |
| Service Area | 2019 | 2020 | 2021 | 2022 | Change (2019 to 2022) |
|---|---|---|---|---|---|
| General Surgery | 2.7 | 4.1 | 4.3 | 4.9 | 80% |
| Gynaecologic Surgery | 3.1 | 5.0 | 5.2 | 5.7 | 83% |
| Neurosurgery | 3.5 | 5.2 | 4.7 | 4.7 | 33% |
| Oncology Procedures | 1.2 | 1.4 | 1.3 | 1.5 | 22% |
| Ophthalmic Surgery | 4.3 | 6.3 | 5.8 | 6.0 | 39% |
| Oral and Maxillofacial | 4.9 | 8.3 | 7.6 | 8.7 | 76% |
| Orthopaedic Surgery | 5.4 | 7.8 | 6.9 | 7.3 | 36% |
| Otolaryngic Surgery | 4.5 | 6.5 | 7.1 | 7.9 | 74% |
| Paediatric Cardiovascular Surgery | 2.0 | 3.2 | 2.5 | 2.3 | 16% |
| Paediatric Dental/Oral/Maxillofacial | 4.8 | 7.5 | 5.0 | 6.3 | 30% |
| Paediatric General Surgery | 2.7 | 4.0 | 3.1 | 4.5 | 66% |
| Paediatric Gynaecologic Surgery | 2.9 | 5.0 | 4.2 | 4.5 | 55% |
| Paediatric Neurosurgery | 1.6 | 2.9 | 1.9 | 2.5 | 52% |
| Paediatric Ophthalmic Surgery | 3.8 | 6.1 | 4.4 | 5.5 | 45% |
| Paediatric Orthopaedic Surgery | 4.9 | 8.0 | 5.8 | 7.0 | 42% |
| Paediatric Otolaryngic Surgery | 3.0 | 5.1 | 4.2 | 4.1 | 37% |
| Paediatric Plastic and Reconstruct. | 4.2 | 6.8 | 5.7 | 6.7 | 62% |
| Paediatric Urologic Surgery | 5.4 | 10.3 | 9.9 | 12.6 | 134% |
| Plastic and Reconstructive Surgery | 3.7 | 5.4 | 5.4 | 5.6 | 52% |
| Thoracic Surgery | 2.4 | 3.0 | 4.3 | 4.9 | 108% |
| Urologic Surgery | 2.4 | 3.5 | 3.4 | 3.9 | 62% |
| Vascular Surgery | 2.0 | 2.7 | 2.8 | 3.0 | 48% |
| Total | 3.7 | 5.4 | 5.1 | 5.5 | 48% |
Graphical Descriptions
| 2019-20 | 2020-21 | 2021-22 | 2022-23 | 2023-24 | 2024-25 | 2025-26 | 2026-27 | 2027-28 | |
|---|---|---|---|---|---|---|---|---|---|
| FAO Projection | 78.6 | 79.4 | 83.0 | 86.4 | 89.9 | 93.8 | |||
| Government Projection | 79.9 | 77.8 | 78.3 | 81.4 | 84.6 | 87.8 | |||
| Historical | 63.7 | 69.5 | 75.7 |
| Nominal | Real ($2021) | ||
|---|---|---|---|
| 2012-13 to 2021-22 Actual Spending | 2022-23 to 2031-32 Spending Plan | 2012-13 to 2021-22 Actual Spending | 2022-23 to 2031-32 Spending Plan |
| 31,330 | 44,888 | 36,726 | 40,706 |
| 2005 | 2019 | % Change | |
|---|---|---|---|
| Hospital Beds | 31,865 | 32,696 | +3% |
| Ontarians Aged 65+ | 1,622,521 | 2,534,452 | +56% |
| Fiscal Year | Share of hospital capacity occupied by ALC patients |
|---|---|
| 2012-13 | 13.3% |
| 2013-14 | 13.3% |
| 2014-15 | 13.6% |
| 2015-16 | 13.7% |
| 2016-17 | 14.8% |
| 2017-18 | 14.9% |
| 2018-19 | 15.8% |
| 2019-20 | 17.0% |
| 2017-18 | 2018-19 | 2019-20 | 2020-21 | 2021-22 | 2022-23 Q1 | |
|---|---|---|---|---|---|---|
| Average Hospital Occupancy | 98% | 96% | 95% | 84% | 88% | 93% |
| Number of Hallway Patients | 1,087 | 1,057 | 982 | 713 | 934 | 1,289 |
| Type of Bed | 2019-20 | 2020-21 | 2021-22 | 2022-23 | 2023-24 | 2024-25 | 2025-26 | 2026-27 | 2027-28 |
|---|---|---|---|---|---|---|---|---|---|
| Acute | 20,445 | 21,600 | 22,222 | 23,093 | 23,185 | 23,199 | 23,226 | 23,302 | 23,475 |
| Mental Health | 4,614 | 4,629 | 4,689 | 4,617 | 4,628 | 4,638 | 4,644 | 4,672 | 4,713 |
| Rehab | 7,636 | 7,678 | 7,711 | 7,676 | 7,718 | 7,731 | 7,732 | 7,778 | 7,871 |
| Alternate Health Facility | - | 1,165 | 1,165 | 1,165 | 1,165 | 1,165 | 1,165 | 1,165 | 1,165 |
| Total | 32,696 | 35,072 | 35,787 | 36,551 | 36,696 | 36,733 | 36,767 | 36,917 | 37,224 |
| Age | Provincial health care spending per capita |
|---|---|
| <1 | $14,566 |
| 1-4 | $2,086 |
| 5-9 | $1,827 |
| 10-14 | $1,999 |
| 15-19 | $2,307 |
| 20-24 | $2,277 |
| 25-29 | $2,707 |
| 30-34 | $3,146 |
| 35-39 | $3,114 |
| 40-44 | $3,101 |
| 45-49 | $3,340 |
| 50-54 | $3,904 |
| 55-59 | $4,546 |
| 60-64 | $5,487 |
| 65-69 | $7,475 |
| 70-74 | $9,388 |
| 75-79 | $11,945 |
| 80-84 | $15,855 |
| 85-89 | $24,503 |
| 90+ | $29,639 |
| 2012 | 2019 | % Change | |
|---|---|---|---|
| Nursing and Personal Support Hours (millions) | 33.2 | 44.4 | +34% |
| Ontarians Aged 65+ | 1,989,081 | 2,534,452 | +27% |
| 2011 | 2019 | % Change | |
|---|---|---|---|
| Long-Term Care Beds | 78,053 | 78,140 | +0.1% |
| Ontarians Aged 75+ | 882,083 | 1,096,464 | +24% |
| 2019-20 | 2020-21 | 2021-22 | 2022-23 | 2023-24 | 2024-25 | |
|---|---|---|---|---|---|---|
| Number of Ontario seniors aged 65 and over that will receive home care services | 410,302 | 388,856 | 422,775 | 481,128 | 488,698 | 485,003 |
| 2019-20 | 2020-21 | 2021-22 | 2022-23 | 2023-24 | 2024-25 | |
|---|---|---|---|---|---|---|
| Hours of nursing and personal care services per Ontarian aged 65 and over | 17.51 | 16.11 | 18.24 | 18.56 | 18.22 | 17.48 |
| 2019-20 | 2020-21 | 2021-22 | 2022-23 | 2023-24 | 2024-25 | 2025-26 | 2026-27 | 2027-28 | |
|---|---|---|---|---|---|---|---|---|---|
| LTC beds | 78,245 | 78,140 | 78,729 | 80,666 | 86,033 | 91,864 | 99,167 | 102,137 | 105,077 |
| Fiscal Year | Number of long-term care beds per 1,000 Ontarians aged 75 and over |
|---|---|
| 2010-11 | 90 |
| 2011-12 | 88 |
| 2012-13 | 86 |
| 2013-14 | 84 |
| 2014-15 | 82 |
| 2015-16 | 81 |
| 2016-17 | 79 |
| 2017-18 | 77 |
| 2018-19 | 74 |
| 2019-20 | 71 |
| 2020-21 | 69 |
| 2021-22 | 67 |
| 2022-23 | 66 |
| 2023-24 | 67 |
| 2024-25 | 68 |
| 2025-26 | 71 |
| 2026-27 | 71 |
| 2027-28 | 70 |
| Year | Month | Surgical Waitlist | Additions | Surgeries Performed or Cancelled |
|---|---|---|---|---|
| 2019 | Jan | 200,291 | 39,056 | 63,164 |
| Feb | 202,093 | 38,735 | 58,294 | |
| Mar | 199,352 | 37,026 | 59,887 | |
| Apr | 198,688 | 36,786 | 63,829 | |
| May | 198,581 | 36,222 | 66,325 | |
| Jun | 197,007 | 37,081 | 57,997 | |
| Jul | 196,305 | 36,498 | 54,007 | |
| Aug | 200,411 | 38,084 | 49,056 | |
| Sep | 201,226 | 40,597 | 59,384 | |
| Oct | 202,390 | 39,639 | 65,809 | |
| Nov | 201,158 | 40,079 | 61,356 | |
| Dec | 201,178 | 39,888 | 48,091 | |
| 2020 | Jan | 202,092 | 42,732 | 62,834 |
| Feb | 202,580 | 43,419 | 56,649 | |
| Mar | 199,279 | 43,943 | 37,912 | |
| Apr | 197,249 | 49,108 | 8,444 | |
| May | 201,886 | 62,265 | 11,899 | |
| Jun | 207,450 | 76,335 | 27,128 | |
| Jul | 214,631 | 83,689 | 42,091 | |
| Aug | 214,605 | 88,895 | 44,290 | |
| Sep | 213,740 | 92,885 | 54,310 | |
| Oct | 211,805 | 88,126 | 59,472 | |
| Nov | 206,164 | 78,865 | 57,509 | |
| Dec | 201,305 | 70,266 | 47,611 | |
| 2021 | Jan | 204,712 | 70,965 | 50,649 |
| Feb | 204,807 | 69,274 | 49,024 | |
| Mar | 204,881 | 69,426 | 62,353 | |
| Apr | 203,767 | 69,169 | 35,368 | |
| May | 216,006 | 75,606 | 23,303 | |
| Jun | 239,486 | 84,652 | 49,704 | |
| Jul | 243,873 | 87,538 | 46,109 | |
| Aug | 242,266 | 90,377 | 48,070 | |
| Sep | 240,953 | 92,526 | 57,182 | |
| Oct | 237,766 | 92,075 | 57,431 | |
| Nov | 234,211 | 89,899 | 59,726 | |
| Dec | 231,731 | 88,346 | 44,407 | |
| 2022 | Jan | 229,907 | 93,570 | 24,268 |
| Feb | 251,100 | 100,218 | 33,721 | |
| Mar | 263,024 | 104,966 | 57,895 | |
| Apr | 261,391 | 105,317 | 52,124 | |
| May | 260,334 | 107,117 | 57,002 | |
| Jun | 257,206 | 107,477 | 59,454 | |
| Jul | 252,465 | 104,942 | 44,470 | |
| Aug | 251,817 | 106,383 | 50,468 | |
| Sep | 249,634 | 107,479 | 58,588 |
| 2019 | 2020 | 2021 | 2022 | |
|---|---|---|---|---|
| Average Wait Time in Months | 3.7 | 5.4 | 5.1 | 5.5 |
| 2019 | 2020 | 2021 | 2022 | |
|---|---|---|---|---|
| Average monthly surgeries performed, excluding months with elective surgery pauses | 54,108 | 46,731 | 47,852 | 49,585 |
| Year | Month | Surgical Waitlist | Long-Waiters | Surgeries Performed |
|---|---|---|---|---|
| 2019 | Jan | 200,291 | 64,966 | 63,164 |
| Feb | 202,093 | 55,553 | 58,294 | |
| Mar | 199,352 | 59,223 | 59,887 | |
| Apr | 198,688 | 63,722 | 63,829 | |
| May | 198,581 | 64,751 | 66,325 | |
| Jun | 197,007 | 57,295 | 57,997 | |
| Jul | 196,305 | 58,113 | 54,007 | |
| Aug | 200,411 | 49,871 | 49,056 | |
| Sep | 201,226 | 60,548 | 59,384 | |
| Oct | 202,390 | 64,577 | 65,809 | |
| Nov | 201,158 | 61,376 | 61,356 | |
| Dec | 201,178 | 49,005 | 48,091 | |
| 2020 | Jan | 202,092 | 63,322 | 62,834 |
| Feb | 202,580 | 53,348 | 56,649 | |
| Mar | 199,279 | 35,882 | 37,912 | |
| Apr | 197,249 | 13,081 | 8,444 | |
| May | 201,886 | 17,463 | 11,899 | |
| Jun | 207,450 | 34,309 | 27,128 | |
| Jul | 214,631 | 42,065 | 42,091 | |
| Aug | 214,605 | 43,425 | 44,290 | |
| Sep | 213,740 | 52,375 | 54,310 | |
| Oct | 211,805 | 53,831 | 59,472 | |
| Nov | 206,164 | 52,650 | 57,509 | |
| Dec | 201,305 | 51,018 | 47,611 | |
| 2021 | Jan | 204,712 | 50,744 | 50,649 |
| Feb | 204,807 | 49,098 | 49,024 | |
| Mar | 204,881 | 61,239 | 62,353 | |
| Apr | 203,767 | 47,607 | 35,368 | |
| May | 216,006 | 46,783 | 23,303 | |
| Jun | 239,486 | 54,091 | 49,704 | |
| Jul | 243,873 | 44,502 | 46,109 | |
| Aug | 242,266 | 46,757 | 48,070 | |
| Sep | 240,953 | 53,995 | 57,182 | |
| Oct | 237,766 | 53,876 | 57,431 | |
| Nov | 234,211 | 57,246 | 59,726 | |
| Dec | 231,731 | 42,583 | 44,407 | |
| 2022 | Jan | 229,907 | 45,461 | 24,268 |
| Feb | 251,100 | 45,645 | 33,721 | |
| Mar | 263,024 | 56,262 | 57,895 | |
| Apr | 261,391 | 51,067 | 52,124 | |
| May | 260,334 | 53,874 | 57,002 | |
| Jun | 257,206 | 54,713 | 59,454 | |
| Jul | 252,465 | 43,822 | 44,470 | |
| Aug | 251,817 | 48,285 | 50,468 | |
| Sep | 249,634 | 52,679 | 58,588 |
| Year | Month | Waitlist | Projected Waitlist |
|---|---|---|---|
| 2021 | Jan | 204,712 | |
| Feb | 204,807 | ||
| Mar | 204,881 | ||
| Apr | 203,767 | ||
| May | 216,006 | ||
| Jun | 239,486 | ||
| Jul | 243,873 | ||
| Aug | 242,266 | ||
| Sep | 240,953 | ||
| Oct | 237,766 | ||
| Nov | 234,211 | ||
| Dec | 231,731 | ||
| 2022 | Jan | 229,907 | |
| Feb | 251,100 | ||
| Mar | 263,024 | ||
| Apr | 261,391 | ||
| May | 260,334 | ||
| Jun | 257,206 | ||
| Jul | 252,465 | ||
| Aug | 251,817 | ||
| Sep | 249,634 | ||
| Oct | 247,354 | ||
| Nov | 245,075 | ||
| Dec | 242,795 | ||
| 2023 | Jan | 240,515 | |
| Feb | 238,236 | ||
| Mar | 235,956 | ||
| Apr | 233,676 | ||
| May | 231,397 | ||
| Jun | 229,117 | ||
| Jul | 226,837 | ||
| Aug | 224,558 | ||
| Sep | 222,278 | ||
| Oct | 219,998 | ||
| Nov | 217,719 | ||
| Dec | 215,439 | ||
| 2024 | Jan | 213,159 | |
| Feb | 210,880 | ||
| Mar | 208,600 | ||
| Apr | 206,320 | ||
| May | 204,041 | ||
| Jun | 201,761 | ||
| Jul | 199,481 |
| 2015-16 | 2016-17 | 2017-18 | 2018-19 | 2019-20 | 2020-21 | 2021-22 | 2022-23 | |
|---|---|---|---|---|---|---|---|---|
| Average Monthly Emergency Department Visits | 474,958 | 481,007 | 492,499 | 491,644 | 486,947 | 376,864 | 445,198 | 481,680 |
| Fiscal Year | Average length of stay (hours) |
|---|---|
| 2008-09 | 16.3 |
| 2009-10 | 15.1 |
| 2010-11 | 15.6 |
| 2011-12 | 14.8 |
| 2012-13 | 14.2 |
| 2013-14 | 13.6 |
| 2014-15 | 14.3 |
| 2015-16 | 13.8 |
| 2016-17 | 15.3 |
| 2017-18 | 16.0 |
| 2018-19 | 16.2 |
| 2019-20 | 16.3 |
| 2020-21 | 14.1 |
| 2021-22 | 16.4 |
| 2022-23 | 20.9 |
| Fiscal Year | Average length of stay (hours) |
|---|---|
| 2008-09 | 4.8 |
| 2009-10 | 4.6 |
| 2010-11 | 4.5 |
| 2011-12 | 4.4 |
| 2012-13 | 4.3 |
| 2013-14 | 4.2 |
| 2014-15 | 4.3 |
| 2015-16 | 4.3 |
| 2016-17 | 4.5 |
| 2017-18 | 4.7 |
| 2018-19 | 4.8 |
| 2019-20 | 4.9 |
| 2020-21 | 4.8 |
| 2021-22 | 5.4 |
| 2022-23 | 6.1 |
| Population centre size | Average wait time (hours) |
|---|---|
| Small | 17.3 |
| Medium | 17.4 |
| Large urban | 22.4 |
| Quarter and Year | Vacancies for Nursing Professionals | Vacancies for Personal Support Workers | Vacancies for Other Health Care Workers |
|---|---|---|---|
| Q1 2018 | 4,960 | 4,770 | 2,060 |
| Q2 2018 | 5,310 | 4,885 | 2,495 |
| Q3 2018 | 5,380 | 5,095 | 3,270 |
| Q4 2018 | 5,230 | 5,205 | 3,055 |
| Q1 2019 | 5,220 | 6,305 | 3,975 |
| Q2 2019 | 5,660 | 5,630 | 2,775 |
| Q3 2019 | 5,920 | 6,320 | 2,465 |
| Q4 2019 | 5,725 | 5,745 | 3,285 |
| Q1 2020 | 5,945 | 7,640 | 2,970 |
| Q2 2020 | No data | ||
| Q3 2020 | No data | ||
| Q4 2020 | 8,945 | 11,955 | 4,045 |
| Q1 2021 | 11,020 | 11,765 | 3,925 |
| Q2 2021 | 12,540 | 10,210 | 4,810 |
| Q3 2021 | 12,340 | 13,830 | 4,770 |
| Occupation | Source of Demand | 2022 | 2023 | 2024 | 2025 | 2026 | 2027 |
|---|---|---|---|---|---|---|---|
| Nurses | From excess vacancies | 9,700 | 9,700 | 9,700 | 9,700 | 9,700 | 9,700 |
| From program expansion commitments | 2,750 | 8,569 | 14,571 | 18,127 | 21,233 | 23,751 | |
| Total Nurses Needed | 12,512 | 18,553 | 24,833 | 28,663 | 32,037 | 34,817 | |
| PSWs | From excess vacancies | 7,746 | 7,746 | 7,746 | 7,746 | 7,746 | 7,746 |
| From program expansion commitments | 3,917 | 15,058 | 26,864 | 34,255 | 40,163 | 44,131 | |
| Total PSWs Needed | 11,663 | 22,803 | 34,609 | 42,001 | 47,908 | 51,876 |
| 2012 | 2021 | |
|---|---|---|
| Canada | $33.87 | $40.73 |
| Newfoundland and L. | $34.48 | $40.11 |
| Prince Edward Island | $32.93 | $39.24 |
| Nova Scotia | $31.83 | $39.24 |
| New Brunswick | $32.15 | $40.94 |
| Quebec | $30.33 | $39.67 |
| Ontario | $34.39 | $39.17 |
| Manitoba | $34.15 | $42.78 |
| Saskatchewan | $38.38 | $45.24 |
| Alberta | $36.78 | $44.31 |
| British Columbia | $35.25 | $42.24 |
| Year | Total Nurses Required | Supply of Nurses | Shortfall | |||
|---|---|---|---|---|---|---|
| Natural Growth | International Registration | Expansions of nursing enrolment | Total | |||
| 2022 | 12,512 | 1,270 | - | - | 1,270 | 11,242 |
| 2023 | 18,553 | 3,909 | 3,619 | 1,308 | 8,836 | 9,718 |
| 2024 | 24,833 | 6,604 | 7,238 | 1,308 | 15,150 | 9,684 |
| 2025 | 28,663 | 9,295 | 9,238 | 2,254 | 20,786 | 7,877 |
| 2026 | 32,037 | 11,978 | 11,238 | 2,704 | 25,920 | 6,117 |
| 2027 | 34,817 | 14,658 | 13,238 | 4,054 | 31,949 | 2,867 |
| Year | Total PSWs Required | Supply of PSWs | Shortfall | |||
|---|---|---|---|---|---|---|
| Natural Growth | Wage Increase | Grants for PSW Students | Total | |||
| 2022 | 11,663 | 771 | - | 500 | 1,271 | 10,392 |
| 2023 | 22,803 | 2,332 | 4,470 | 1,500 | 8,302 | 14,501 |
| 2024 | 34,609 | 3,914 | 8,941 | 2,500 | 15,355 | 19,254 |
| 2025 | 42,001 | 5,518 | 8,941 | 3,500 | 17,958 | 24,043 |
| 2026 | 47,908 | 7,143 | 8,941 | 4,000 | 20,083 | 27,825 |
| 2027 | 51,876 | 8,789 | 8,941 | 4,000 | 21,729 | 30,147 |
Footnotes
[1] On February 7, 2023, the federal government announced changes to health funding arrangements which, as of the writing of this report, the FAO estimates will result in new incremental federal health transfers to the Province totalling $10.9 billion from 2023-24 to 2027-28.
[2] A patient is designated as ALC when they no longer need the level of care they are receiving in hospital but continue to occupy a hospital bed while waiting to go elsewhere like a long-term care home or rehabilitation facility.
[3] As of December 2022, the Province had reduced the number of beds occupied by ALC patients waiting for long-term care by 350. However, this means that the Province must permanently free up an additional 1,650 beds occupied by ALC patients waiting for a long-term care bed to achieve its target.
[4] Significant ongoing measures derive from Ontario’s long-term care staffing plan, Plan to Stay Open, Plan to Stay Open: Health System Stability and Recovery, and Your Health: A Plan for Connected and Convenient Care. The FAO’s analysis also considers additional announced measures.
[5] See FAO, Economic and Budget Outlook, Winter 2023, for a discussion on the status of the contingency fund.
[6] For 2023-24 and 2024-25, the Ministries of Health and Long-Term Care have asserted that disclosure of the health sector spending plan by program area would reveal a Cabinet record. The FAO has agreed not to disclose Cabinet record information as per paragraph 2(f) of Order in Council 1086/2022.
[7] The Protecting a Sustainable Public Sector for Future Generations Act, 2019.
[8] See FAO, Ontario Public Sector Employment and Compensation, 2022.
[9] From 2019-20 to 2027-28, the number of hospital beds will increase by 4,500 (13.8 per cent).
[10] For example, the Province recently reached new tentative agreements with approximately 55,000 education workers who are members of the Canadian Union of Public Employees (CUPE) and approximately 7,000 education workers represented by the Ontario Council of Educational Workers (OCEW). The FAO estimates that CUPE workers received an average annual wage increase of approximately 3.6 per cent per year for four years, which is above the long-term historical average for education workers of 2.2 per cent.
[11] Assumes that unionized hospital employees are compensated for Bill 124 wage growth restrictions that have applied since 2019, estimated as the difference between historical average wage growth and the amount received under collective agreements subject to Bill 124 wage restraint. Going forward, this assumes that wage restraint under Bill 124 would no longer apply, and that wage growth would be consistent with the long-term historical average.
[12] Under the physician services agreement, the rate increase will be determined based on a formula that reflects the difference between actual OHIP expenditures and a pre-pandemic projection.
[13] The FAO utilizes the historical average growth in physician fees for all Canadian provinces excluding Ontario.
[14] Note that this projection does not include any increase in the volume of services required to clear the backlog of surgeries and diagnostic procedures. Funding to clear the surgery and diagnostics procedures backlog is part of time-limited COVID-19-related spending, which is included in other programs spending. See also Chapter 5, section C.
[15] Government of Ontario, Personal Support Workers and Direct Support Workers Permanent Compensation Enhancement Program.
[16] Government of Ontario, Roadmap to wellness: a plan to build Ontario’s mental health and addictions system.
[17] Government of Canada, 2018 to 2022 Canada-Ontario Home and Community Care and Mental Health and Addictions Services Funding Agreement.
[18] Government of Ontario, “Ontario Introduces a Plan to Stay Open,” March 29, 2022.
[19] Government of Ontario, “Ontario Introduces a Plan to Stay Open: Health System Stability and Recovery,” August 18, 2022.
[20] Government of Ontario, “Your Health: A Plan for Connected and Convenient Care,” February 2, 2023.
[21] The COVID-19 pandemic reduced elective surgery volumes and also led Ontario residents to avoid seeking health care, due to concerns about COVID-19 exposure or being a burden on hospitals’ strained resources. Statistics Canada, Survey on Access to Health Care and Pharmaceuticals During the Pandemic, March 2020 to May 2021.
[22] See the discussion in section D below for more information.
[23] Availability of adult and pediatric ICU beds and occupancy for COVID-related critical illness (CRCI) - Datasets - Ontario Data Catalogue.
[24] Government of Ontario, “Ontario Introduces a Plan to Stay Open: Health System Stability and Recovery,” August 18, 2022.
[25] Ontario, Legislative Assembly, Official Report of Debates (Hansard), 43rd Parl., 1st Sess., No. 11 (29 August 2022), at p. 488 (Honourable Ted Arnott).
[26] Previously, hospital patients could be charged up to $63.73 per day while designated as needing an alternate level of care but could also be charged an unregulated uninsured daily rate if they refused an offer of long-term care. See Government of Ontario, Hospital Chronic Care Co-Payment: Questions and Answers, September 2022 and Jane E. Meadus, First Available Bed Policies & Discharge to a Long-Term Care Home from Hospital, July 2010.
[27] As of September 2022, 540 hospital beds were occupied by ALC patients waiting for home care support, which the FAO assumes represents the remaining 500 ALC beds to be freed up. The Province noted that increased community care support would free up 400 beds. See: Government of Ontario, “Plan to Stay Open: Health System Stability and Recovery,” August 18, 2022.
[28] See section B for additional analysis of the Province’s home care expansion plan.
[29] Although patients in hospitals waiting for long-term care are given the highest priority (Category 1, Crisis), technically some people in the community may also be given this highest priority category.
[30] Among ALC patients in acute care waiting more than 30 days for a long-term care placement, 57 per cent have specialized needs and support requirements.
[31] FAO analysis of information provided by the Ministry of Health.
[32] In 2019-20, there were 1.1 million inpatient hospitalizations in Ontario and those patients stayed in hospital an average of 7.1 days for a total length of stay of 7.9 million bed days. The FAO estimates that the number of inpatient hospitalizations in Ontario will increase by 18 per cent from 1.1 million in 2019-20 to 1.3 million in 2027-28. However, the FAO estimates that total hospital occupancy will increase by 21 per cent, from 7.9 million bed days in 2019-20 to 9.6 million bed-days in 2027-28, reflecting high growth in Ontario’s senior population who on average have longer lengths of stay in hospitals.
[33] Statistics Canada, Formal home care received and unmet home care needs of Canadian households, by provinces, Canada, excluding the territories, 2021.
[34] Canadian Institute for Health Information, Wait Times for Home Care Services.
[35] Government of Ontario, Ontario Breaks Ground on New Long-Term Care Home in Simcoe County, January 19, 2023.
[36] 2022 Ontario Economic Outlook and Fiscal Review, p. 62. This includes funding that was announced prior to the 2022 FES.
[37] The remaining committed beds will be added in 2028-29.
[38] For example, ALC patients in hospitals waiting for home care or long-term care (see section A) prevents new patients from being admitted to hospitals from emergency departments, which in turn limits the capacity of emergency departments to provide care to people in the waiting room (see section D). See also, Canadian Association of Emergency Physicians, Canadian Emergency Care is Being Crushed - and Why that Matters for All of Us, January 2023.
[39] Elective surgeries refer to surgeries that do not involve a medical emergency and therefore do not need to be performed immediately. These include procedures such as cataract, hip replacement, knee replacement, gallbladder and select cancer surgeries.
[40] See Appendix for a breakdown of reductions by type of surgery.
[41] See Appendix for wait times by type of surgery.
[42] Information provided to the FAO by the Ministry of Health. See also Global News, “Ontario sees 100K-plus waiting longer than recommended for surgery during pandemic,” January 24, 2023.
[43] Information provided to the FAO by the Ministry of Health.
[44] After the end of the last directive to pause elective surgical procedures.
[45] The decline in waitlist additions occurred across all types of surgeries, including high volume surgeries like ophthalmic surgeries (8 per cent fewer additions), orthopaedic surgeries (11 per cent fewer additions) and gynaecologic surgeries (17 per cent fewer additions).
[46] Incomplete information for October to December 2022 is excluded from the FAO’s analysis as incomplete waitlist data is revised upwards over time.
[47] Also assumes that the rate of additions to the waitlist remains constant.
[48] There is seasonality to emergency department visits and the five-year historical average from April to November is 488,000 monthly visits.
[49] The 2022-23 average is from April to November of 2022.
[50] The 2022-23 average is from April to November of 2022.
[51] Toronto Star, Ontario Health CEO admits system is under ‘tremendous strain’ and talks about 5 challenges rocking hospitals, August 2, 2022.
[52] CBC News, Inside ERs at a breaking point, staff provide care while juggling shortages and closures, October 2, 2022.
[53] The COVID-19 temporary summer locum program pays physicians an hourly premium for working in eligible rural and northern emergency departments. Government of Ontario, Temporary Summer Expansion of Physician Locum Programs for Physicians Working in Rural and Northern Emergency Departments in response to COVID‐19.
[54] The Canadian Press, 'A nurse can't be everywhere': Health care staff shortages prompt Ontario ER closures, July 5, 2022.
[55] As defined by Statistics Canada, small population centres have populations between 1,000 and 30,000 residents.
[56] FAO analysis of Canadian Institute for Health Information. Supply, Distribution and Migration of Physicians in Canada, 2021 — Data Tables. Ottawa, ON: CIHI; 2022.
[57] In 2017-18, 2018-29 and 2019-20 the 90th percentile wait times for admitted patients in Ontario were 32.6, 32.5 and 37.4 hours, respectively, while the Canadian average was 33.1, 35.5 and 38.3. Source: Canadian Institute for Health Information. NACRS Emergency Department Visits and Lengths of Stay by Province/Territory.
[58] The pre-pandemic vacancy rate for health sector workers was 3.1 per cent (2017 to 2019 average).
[59] Includes an estimated 1,366 additional nurses from normal growth in other health sector program areas.
[60] For clarity, totals reflect the number of workers required to restore and maintain normal staffing levels in the hospitals, home and community care, and long-term care program areas, while meeting the government’s program expansion commitments in these areas. The FAO’s projection for the number of nurses and personal support workers required to be hired does not reflect an assessment about the quality of services that should be provided by these programs.
[61] See FAO, Ontario Public Sector Employment and Compensation, 2022.
[62] FAO analysis of Statistics Canada. Table 14-10-0203-01.
[63] Significant ongoing measures derive from Ontario’s long-term care staffing plan, Plan to Stay Open, Plan to Stay Open: Health System Stability and Recovery, and Your Health: A Plan for Connected and Convenient Care. The FAO’s analysis also considers additional announced measures.
[64] Government of Ontario, Ontario Invests in Historic Campaign to Accelerate Training for Personal Support Workers, February 24, 2021. Funding was also provided to 2,200 current PSW students, bringing the total to up to 8,200 students that received support. Although no further announcement was made and the Ministry of Health did not include any extension in a breakdown of its workforce measures provided to the FAO, at least one college offered the program again in July 2022. Algonquin College, Registration now open for Algonquin College Personal Support Worker Accelerated program (June 17, 2022).
[65] Government of Ontario, Ontario Helps Train More Personal Support Workers, April 28, 2021.
[66] Government of Ontario, Ontario Enhancing Personal Support Worker Training, March 10, 2022.
[67] Government of Ontario, 2022 Ontario Economic Outlook and Fiscal Review, p 38.
[68] The FAO assumes that 90 per cent of enrolled nursing students will graduate and find employment in the health sector. Practical nursing students are assumed to graduate and fill a nursing vacancy after two years, while registered nursing students are assumed to graduate and fill a nursing vacancy after four years. While nursing students will work during their studies, nursing student placements are typically unpaid, and this analysis looks only at paid employment and vacant paid positions.
[69] Peter Kemper et al., “What Do Direct Care Workers Say Would Improve Their Jobs? Differences Across Settings,” July 2008, The Gerontologist 48 Spec No 1(suppl 1):17-25.
[70] There is significant uncertainty over the estimation of the impact of wage increases on PSW employment. Existing estimates of the elasticity of employment to wages range from 0.05 to 1.9, which would give estimated impacts from 800 to 29,800 personal support workers added. The FAO selected an elasticity of 0.6, based on a review of all available literature and the FAO’s own review of the impact of recent wage increases for home care support workers. This gives a result similar to the estimate in Adrian Rohit Dass et al., “Forecasting Staffing Needs for Ontario’s Long-Term Care Sector”.
[71] AdvantAge Ontario, Non-Profit LTC Homes Are Being Gouged by Some Temporary Staffing Agencies.
[72] For a summary of the relevant literature see McGill Nursing Collaborative for Education and Innovation in Patient- and Family-Centered Care, Global Shortage of Nurses.
[74] Toronto Star, An inside look at Ontario’s nursing nightmare: Why turnover and vacancy rates are only getting worse, October 28, 2022.
[75] Government of Ontario, Ontario Reducing Wait Times for Surgeries and Procedures, January 16, 2023, and Government of Ontario, Ontario Reducing Wait Times for Publicly Funded Surgeries and Diagnostics, February 21, 2023Ontario Reducing Wait Times for Surgeries and Procedures.