


1. Summary
This report provides details on long-term trends of international immigrants in Ontario's labour market. The scope of this report is limited to international immigrants (also referred to in this report as immigrants), which include economic immigrants, immigrants sponsored by family, refugees, and other immigrants. The analysis in this report does not include interprovincial migrants and non-permanent residents such as temporary foreign workers and international students.
Ontario’s labour force growth increasingly driven by immigration
- Ontario welcomed a record-breaking 227,424 immigrants in 2022, many of whom will seek employment in the province’s labour market.
- Since the mid 2010s, immigrants have contributed 63 per cent of the increase in Ontario’s labour force, much larger than the 39 per cent share observed from the late 2000s to early 2010s.
An increasing share of recent immigrants[1] are core working age with university education and experience in Canada
- The share of immigrants in the core working age group (25-54 years) has increased from 43.7 per cent of those who landed in the 1980s to 62.3 per cent of immigrants who landed in 2016-2022.
- The age composition of immigrants is younger than that of the total Ontario population. In the 2016 to 2022 period, 92.0 per cent of immigrants were under 54 years compared to 69.0 per cent for the total population.
- Policy changes have contributed to a larger share of recent core working age immigrants having postsecondary education credentials (80.0 per cent) and Canadian work and/or study experience (38.5 per cent) compared to long-established immigrants (66.7 per cent and 5.4 per cent, respectively).
Recent immigrants are faring better in the labour market but challenges persist
- The labour participation rate of recent immigrants of core working age was about 13 percentage points lower than non-immigrants in 2006, but this gap has decreased rapidly in recent years to 3.5 percentage points in 2022. The improvement partly reflects policy changes that have emphasized work and education experience.
- The unemployment rate of immigrants historically was more than two percentage points higher than non-immigrants, but this difference narrowed in the 2010s.
- Despite these improvements, challenges remain for immigrants in the labour market. For example, 15.9 per cent of core working age immigrants with a university degree were employed in a position requiring no more than a high school education in 2021, higher than the 9.6 per cent of non-immigrants.
Immigrants’ wages have made gradual progress
- The difference in median wages[2] between new immigrants[3] and the total population narrowed from $10,700[4] in 1982 to a low of $6,200 in 2019, reflecting policy changes in the selection of immigrants that improved their employment outcomes.
- Among core working age immigrants, only established immigrants who arrived in the 1980s had higher wages in 2020 ($61,600) compared to non-immigrants ($56,000). Core working age immigrants who landed after 1990 had lower median wages compared to non-immigrants.
Ontario immigrants who have a university degree and have Canadian pre-admission work and study experience earn higher median wages
- Core working age immigrants with a bachelor’s degree or higher earned the highest median wage among all immigrants in 2020 ($61,200) and experienced the smallest percentage gap in median wage relative to non-immigrants with the same education credentials over the 1980 to 2015 period.
- Among all immigrants, those with both Canadian pre-admission work and study experience earned the highest median wage ($72,500, 10 years after admission) in 2020, much higher than those with only work experience ($45,100) and only study experience ($43,000).
The majority of Ontario’s immigrants settled in Toronto
- Toronto[5] attracted 67.0 per cent of recent immigrants coming to Ontario in 2021, disproportionately larger than the 32.1 per cent share of the province’s total non-immigrant population who reside in the area.
- Toronto retained on average 82.1 per cent of its immigrants 10 years after admission, far higher than other major Ontario cities.
Immigrants in all major cities in Ontario earned lower median wages than non-immigrants
- Out of the major Ontario cities, core working age immigrants in Ottawa-Gatineau earned the highest median wage in 2020 ($55,600 vs. $67,000 for non-immigrants), followed by Oshawa ($54,000 vs. $57,600 for non-immigrants) and Greater Sudbury ($51,600 vs. $57,600 for non-immigrants).
- Immigrants in St. Catharines-Niagara earned the lowest median wage ($36,800 vs. $44,800 for non-immigrants), followed by Windsor ($39,200 vs. $50,000 for non-immigrants) and London ($43,200 vs. $50,800 for non-immigrants).
2. Introduction
Ontario’s labour force is broadly comprised of individuals born in Canada, non-permanent residents such as temporary foreign workers, and international immigrants with permanent resident status, a group that includes economic immigrants, immigrants sponsored by family, refugees, and other immigrants.[6]
International immigration has become a significant source of Ontario’s labour force growth in recent years, contributing to nearly two-thirds of the increase in the province’s workforce since the mid 2010s. With international immigration to Ontario reaching a record 227,424 in 2022 and expected to remain high in the near term, the employment outcomes of new permanent residents will play a significant role in the province’s economic growth.
This report provides details on long-term trends of international immigrants with permanent resident status (also referred to in this report as immigrants) in Ontario's labour market. The analysis in this report does not include non-permanent residents such as temporary foreign workers and international students, or interprovincial migrants.
The report is organized as follows:
- Chapter 3 discusses the importance of immigration for Ontario’s labour force growth and provides details on the composition and labour force characteristics of those coming to the province from other countries over the 1980 to 2021 period.
- Chapter 4 reviews immigrants’ engagement in the labour market, compares their participation and unemployment rates with non-immigrants and identifies the industrial distribution of newcomers’ employment.
- Chapter 5 examines the labour market earnings of immigrants in Ontario, provides details on their median wages relative to non-immigrants and highlights the factors that help support higher earnings by immigrants.
- Chapter 6 provides information on which major Ontario cities immigrants tend to settle in and looks at the wages they earn in comparison to non-immigrants.
The figures in this report are based on data from Statistics Canada’s 2021 Census, Demographic Estimates, Labour Force Survey, and Longitudinal Immigration Database. All wage data in this report are presented in 2020 constant dollars.
3. Composition and labour force characteristics of immigrants in Ontario
Ontario’s labour force growth increasingly driven by immigration
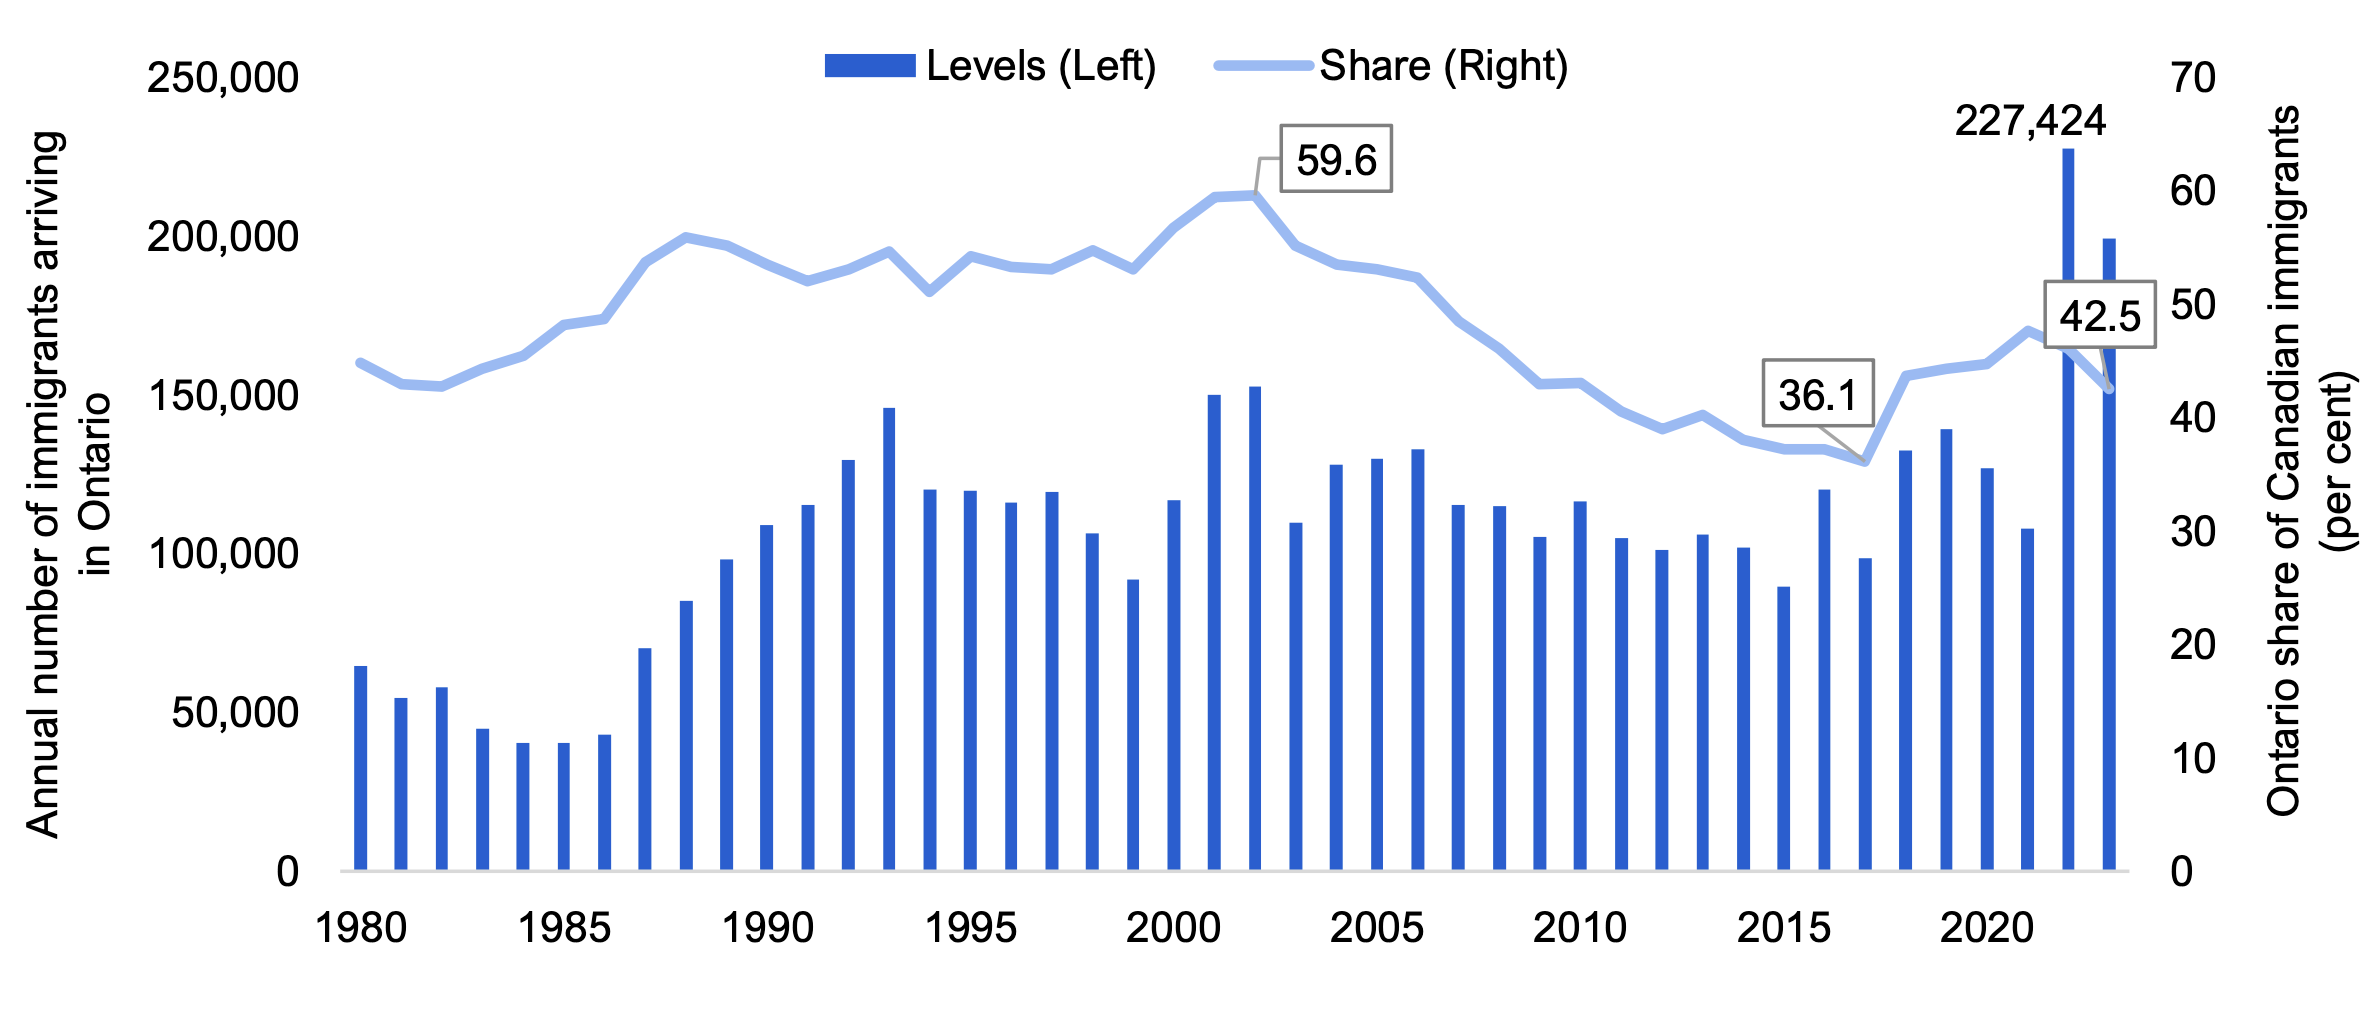
International immigration to Ontario is affected by the annual targets for immigration levels set by the federal government, policy changes in admission programs and the province’s economic performance relative to other regions of the country. Following a rapid increase in the late 1980s, the annual number of international immigrants arriving in Ontario generally ranged from 90,000 and 150,000 over the past three decades. After immigration declined in 2020 and 2021 due to the impacts of the COVID-19 pandemic, Ontario welcomed a record-breaking 227,424 immigrants in 2022, reflecting the easing of pandemic border restrictions, efforts to lessen the administrative backlog and higher immigration targets introduced by the federal government.[7]
Ontario’s share of immigrants to Canada has also shifted, declining from a peak of 59.6 per cent in 2002 to 36.1 per cent in 2017, but has since increased to 42.5 per cent in 2023.
Figure 3.1 The annual number of international immigrants settling in Ontario increased sharply in 2022
Note: Shows Statistics Canada’s July 1 Estimates for the period from July 1 to June 30.
Source: Statistics Canada: Annual Demographic Estimates: Table 17-10-0008-01
Figure 3.2 International immigrants account for an increasing share of Ontario’s labour force growth
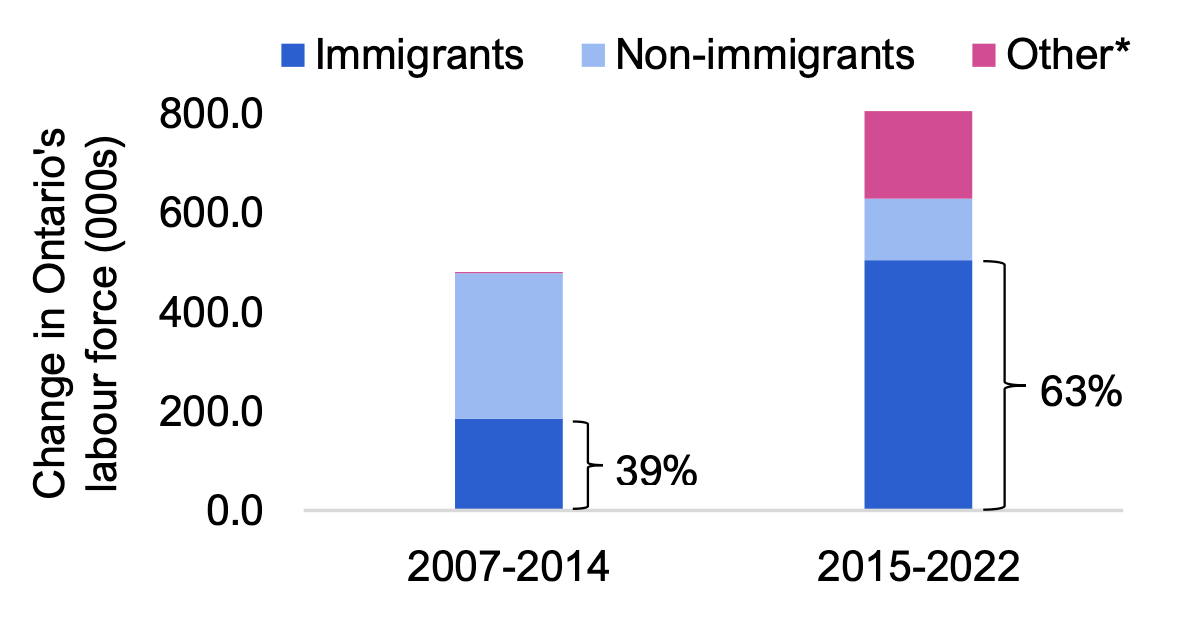
* Includes Canadian citizens born outside of Canada and non-permanent residents.
Note: Shows the change in Ontario’s labour force for population aged 15+ years.
Source: Statistics Canada: Labour Force Survey: Table 14-10-0083-01.
While the annual number of international immigrants settling in Ontario has fluctuated, immigration has become a larger source of the province’s labour force growth in recent years. Over the 2007 to 2014 period, immigrants accounted for 39 per cent of the increase in Ontario’s labour force. Immigrants accounted for a larger share of the province’s labour force growth over the 2015 to 2022 period, at 63 per cent.[8] The share of labour force growth accounted for by the “other” category, which includes non-permanent residents, increased noticeably in 2015-2022 due to the large inflow of temporary foreign workers and international students. As Ontario’s labour market becomes increasingly dependent on immigration, the employment outcomes of immigrants will have an important role in the province’s economic growth.
The composition of international immigration in Ontario has shifted towards core working age immigrants
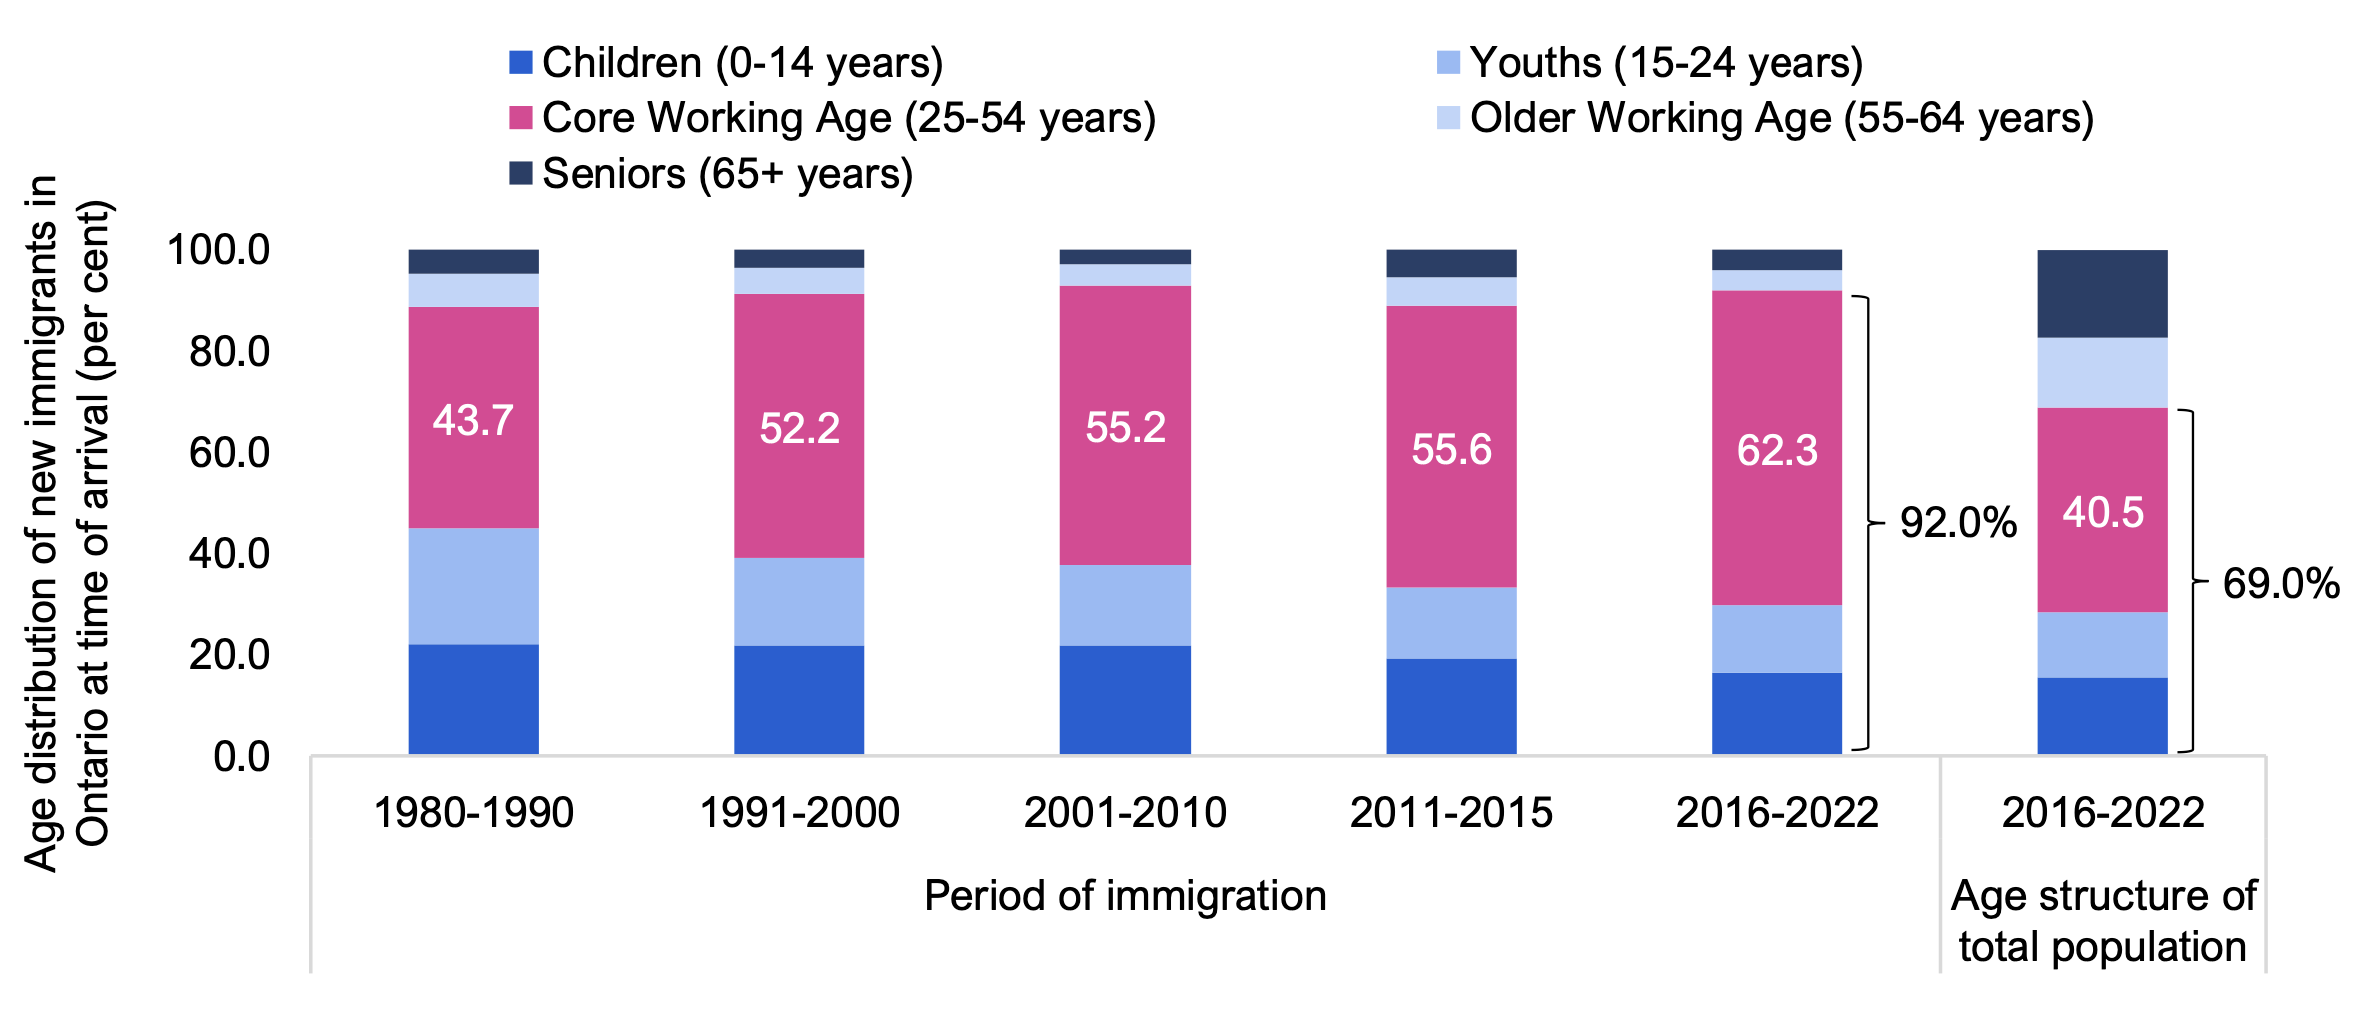
The age composition of international immigrants settling each year in Ontario has shifted significantly over the past four decades with the share of core working age immigrants increasing from 43.7 per cent of those who landed in the 1980s to 62.3 per cent of immigrants who landed in 2016-2022.[9] The share of older working age immigrants decreased from 6.6 per cent in the 1980s to 4.0 per cent in 2016-2022, while the share of immigrant youths eased from more than 20 per cent to 13.3 per cent over the same period.
Figure 3.3 Share of new immigrants to Ontario arriving in their core working years has increased
Source: Statistics Canada: Demographic Estimates: Tables 17-10-0014-01 and 17-10-0005-01
The age composition of recent immigrants[10] is much younger than the age composition of the total Ontario population. The share of immigrants 54 years and under was 92.0 per cent in 2016-2022, much larger than the 69.0 per cent share in the total population over the same period.[11] As Ontario’s population continues to age, immigration is expected to only partially offset the projected decline in the province’s working-age population.[12]
A rising share of recent immigrants are university-educated and have Canadian pre-admission work and/or study experience
Based on the 2021 Census, a rising share of recent immigrants have postsecondary education credentials. Of core working age immigrants who landed in 2016-2021, 64.2 per cent had a bachelor’s degree or higher in 2021, compared to 55.7 per cent of immigrants who landed in 2011-2015 and 33.8 per cent of all non-immigrants.[13]
Figure 3.4 Share of core working age immigrants in Ontario with a bachelor’s degree or higher has increased
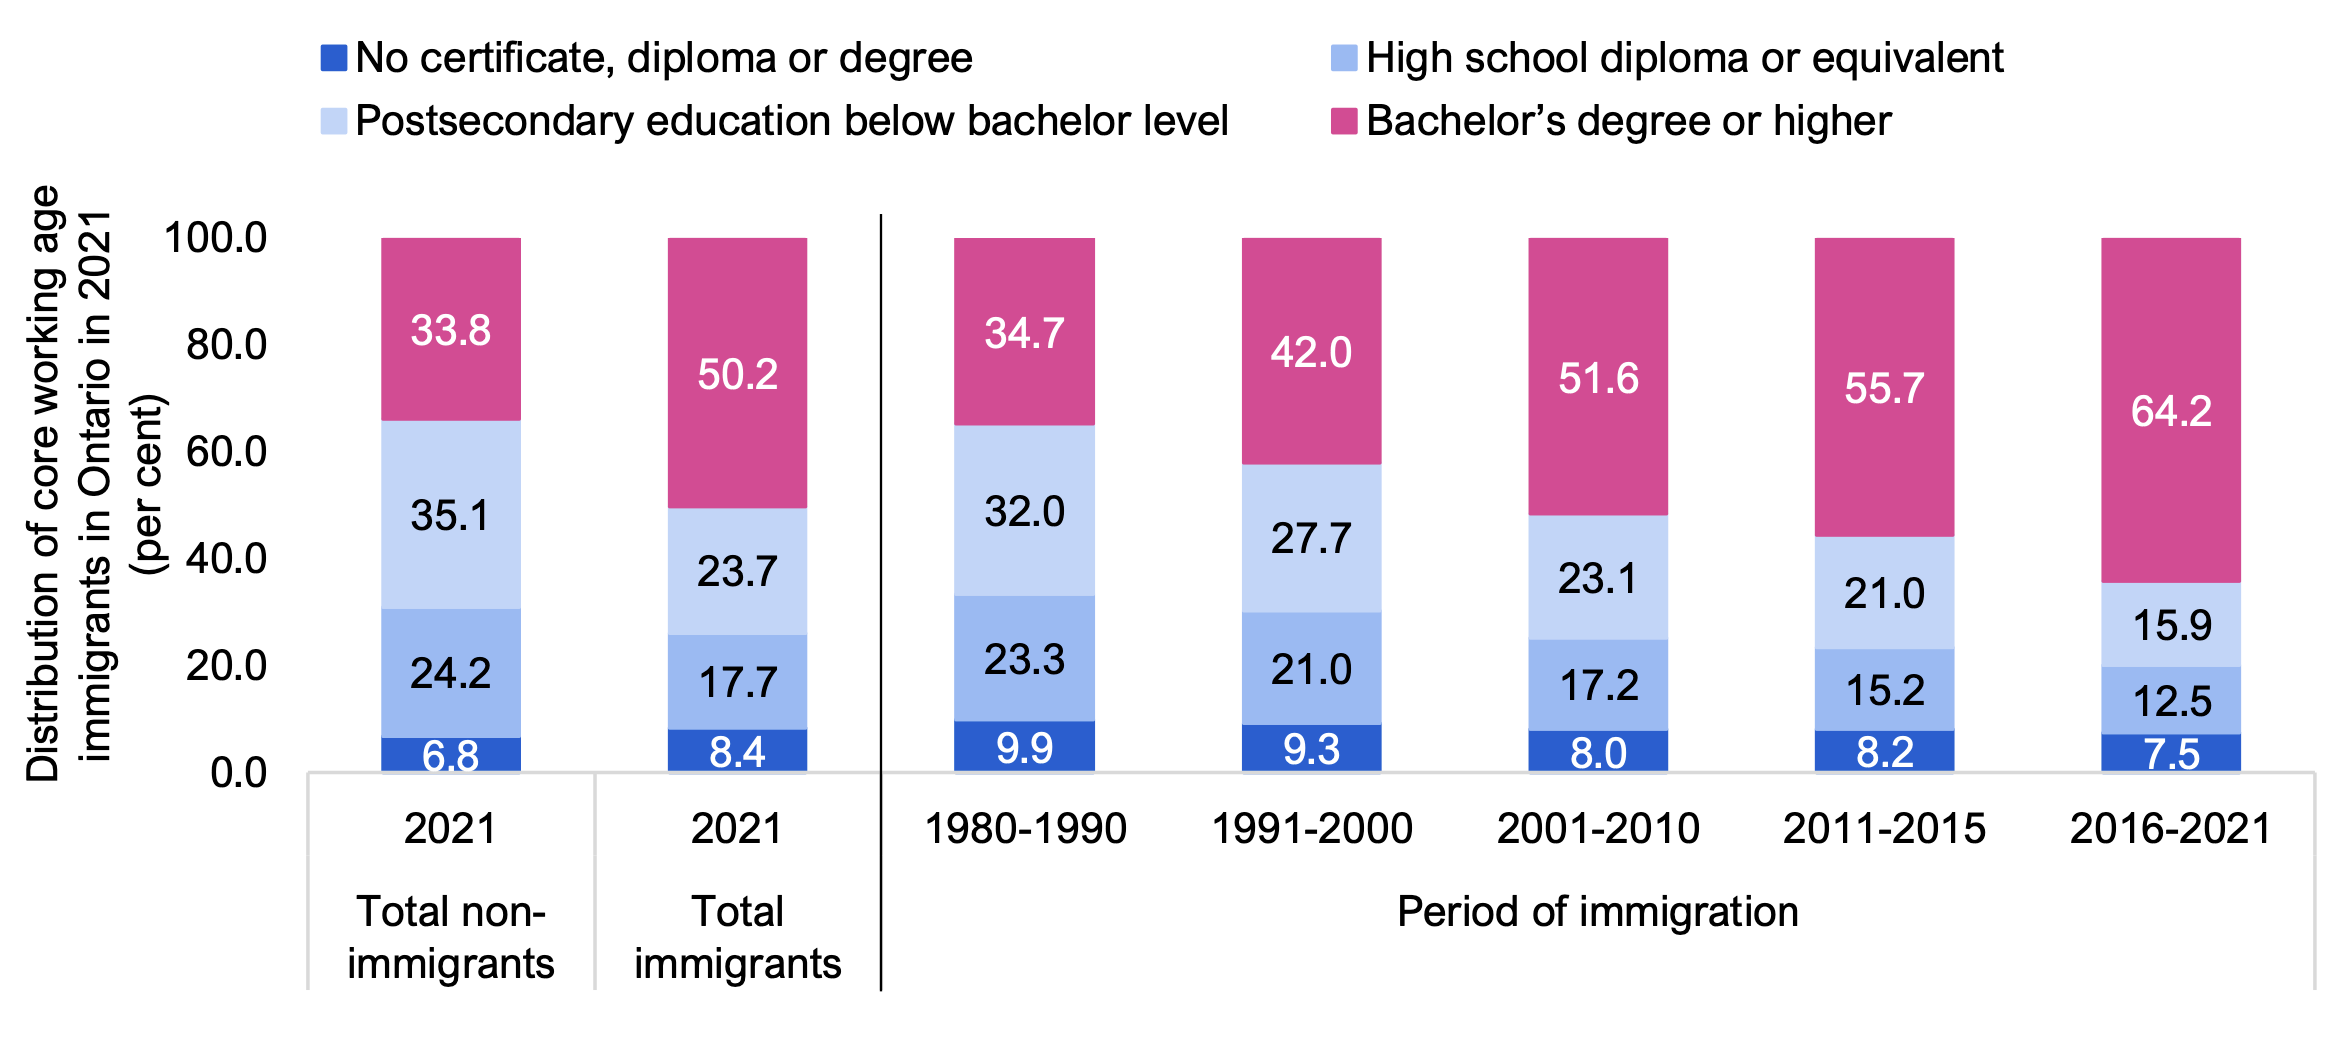
Note: All bars show the distribution of immigrants aged 25-54 years in 2021. Right five bars categorize all immigrants recorded in the 2021 Census by period of immigration.
Source: Statistics Canada: 2021 Census: Table 98-10-0309-01
Among those with postsecondary education, 30.2 per cent of all core working age immigrants held degrees, diplomas or certificates in science, technology, engineering and mathematics, almost double the 16.0 per cent of non-immigrants.[14] The most popular areas of study for immigrants were business and administration (25.6 per cent), engineering (14.0 per cent), and health care (12.2 per cent). For non-immigrants, the most popular areas of study were trades, services, natural resources and conservation (21.2 per cent), business and administration (17.3 per cent), and social and behavioural sciences (14.7 per cent).
In addition to advanced levels of education, more of these newcomers have higher rates of Canadian pre-admission work and/or study experience prior to becoming permanent residents. This trend reflects changes in admission criteria that favour skills and work experience acquired in Canada.[15] Of the core working age immigrants who landed in 2016-2021, 38.5 per cent had a work permit, a study permit or both prior to becoming permanent residents, higher than the 27.4 per cent of immigrants who landed in 2011-2015 and the 13.8 per cent who landed in the 2000s.[16] Despite these gains, recent immigrants to Ontario with Canadian pre-admission experience remain a minority. Among immigrants who landed in 2016-2021, 53.8 per cent had no Canadian pre-admission experience.
Figure 3.5 Share of core working age immigrants in Ontario with Canadian pre-admission work and/or study experience has increased but remains a minority
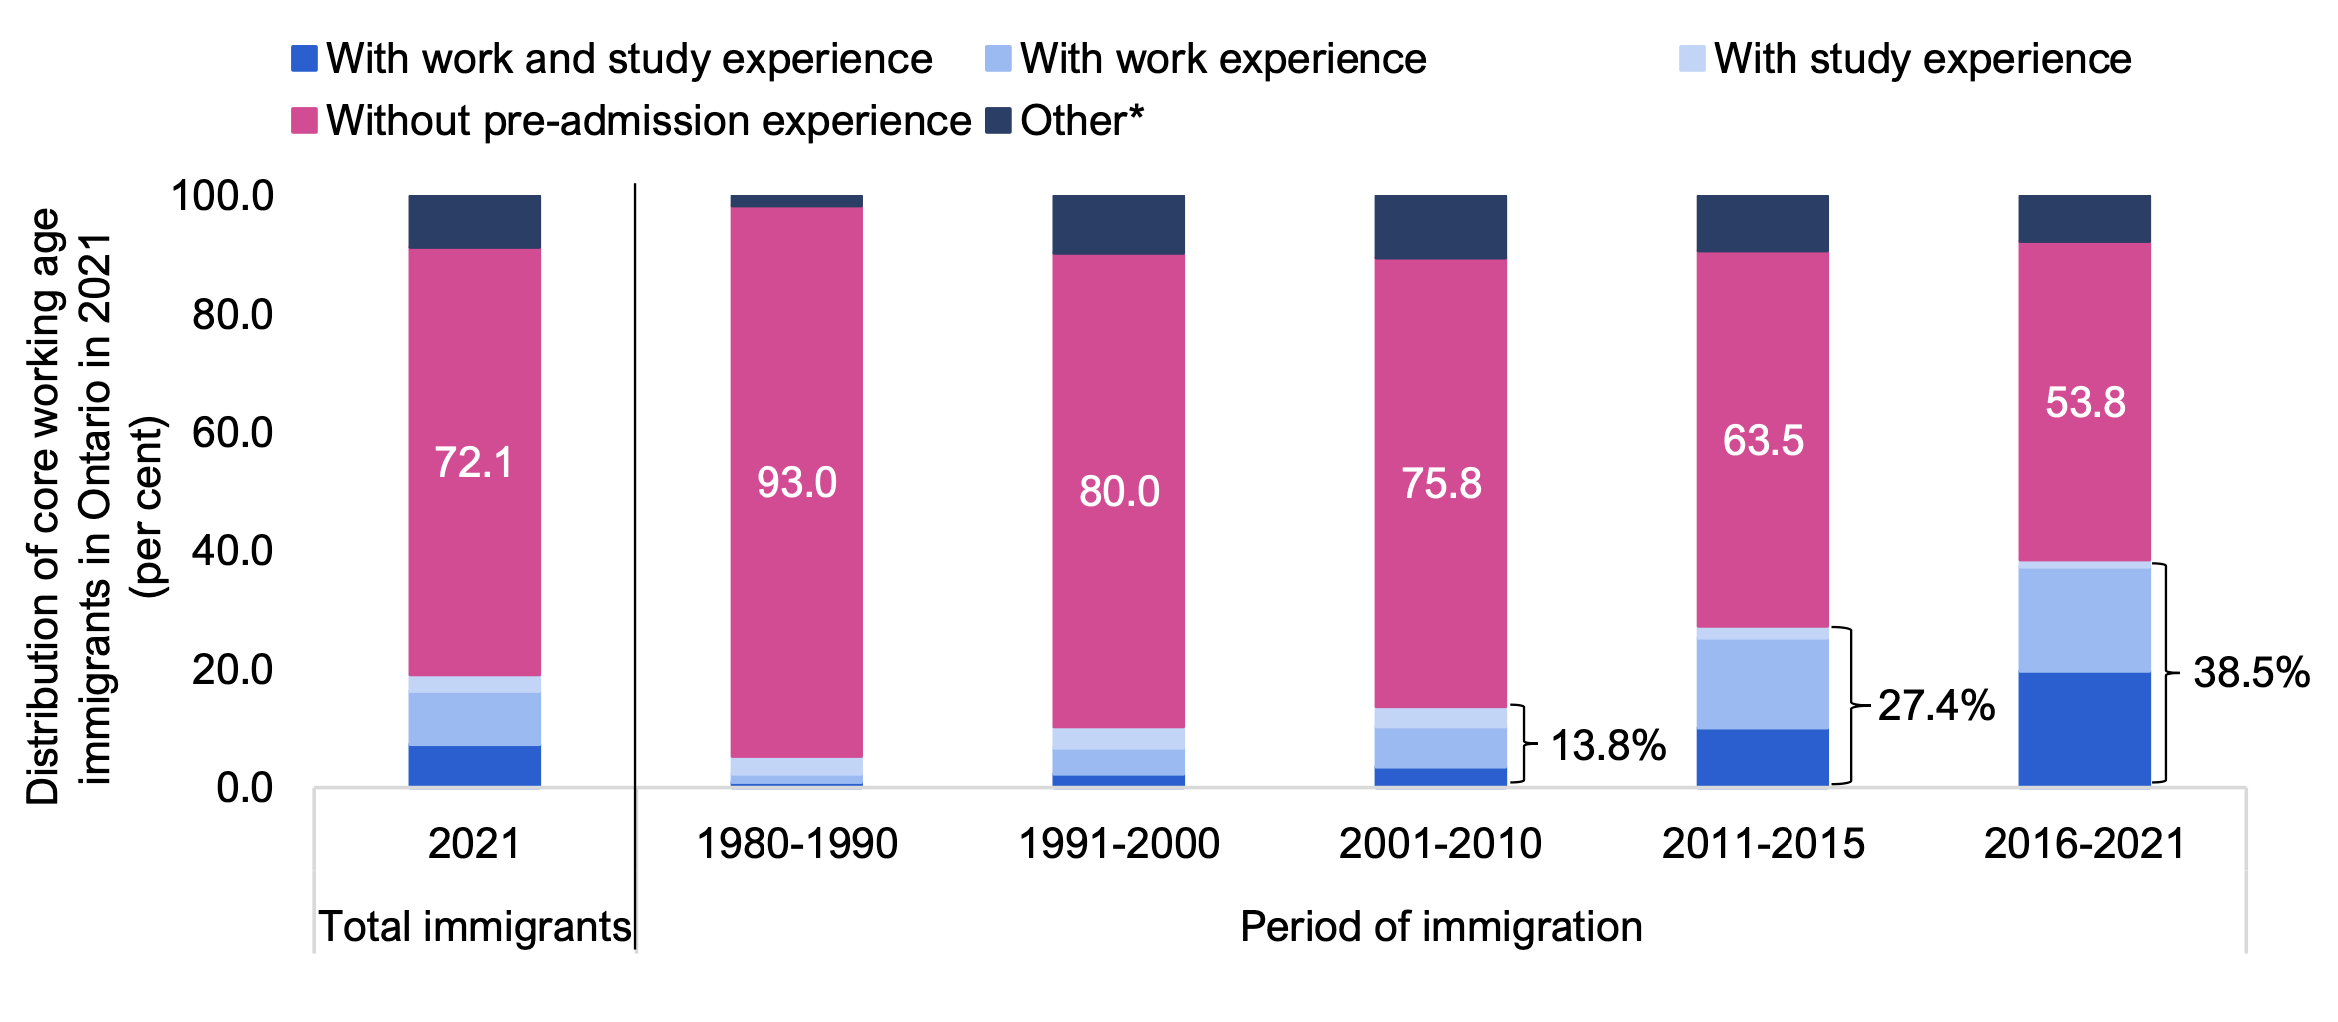
* Includes asylum claims and permits other than work and study.
Note: All bars show the distribution of immigrants aged 25-54 years in 2021. Right five bars categorize all immigrants recorded in the 2021 Census by period of immigration.
Source: Statistics Canada: 2021 Census: Table 98-10-0318-01
Economic immigrants make up over half of recent immigrants in Ontario
Immigration admission categories in Canada can be broadly categorized into economic immigrants and their dependents, immigrants sponsored by family, and refugees. Economic immigrants are admitted by selection based on their ability to meet labour market needs through employment, investment or entrepreneurship.[17] The proportion of immigrants accepted under the economic immigrant category increased from 43.4 per cent in the 1980s to 51.7 per cent in 2016-2021, while the share of immigrants sponsored by family declined from 34.3 per cent to 25.8 per cent over the same period.[18]
Figure 3.6 Economic immigrants make up over half of recent immigrants in Ontario
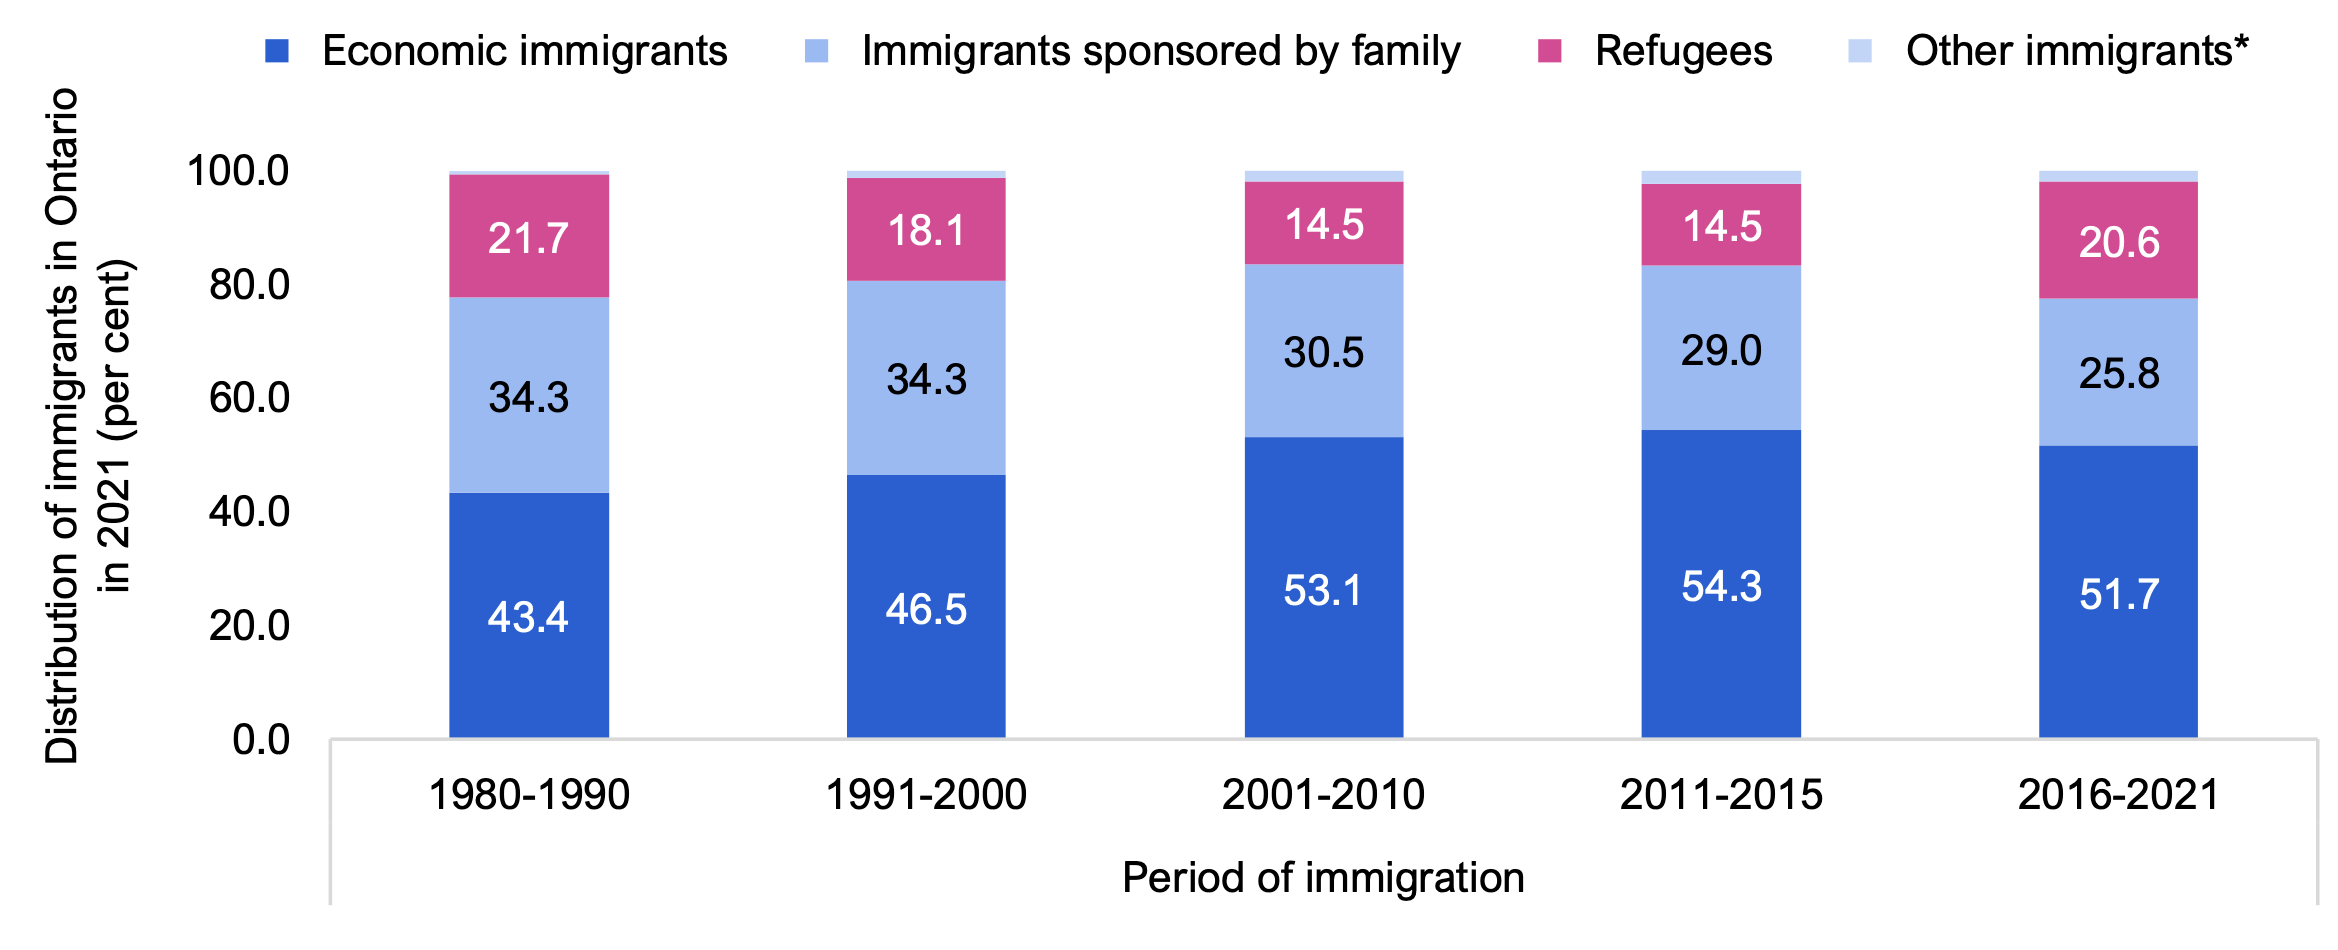
* Includes those who have been granted permanent resident status based on humanitarian and compassionate considerations or for public policy reasons, and those under a program not classified in any other category.
Note: All bars show the distribution of immigrants in 2021.
Source: Statistics Canada: 2021 Census: Table 98-10-0318-01
Economic immigrants can be further categorized into several programs. Worker programs, which focus on immigrants’ skills and work experience, include the Canadian experience class, skilled workers, skilled trades workers and caregivers. Business programs, which focus on immigrants’ ability to secure their own source of income or make substantial investments, include the entrepreneur, investor and self-employed categories. In addition to these federal programs, Ontario participates in the provincial nominee program which nominates immigrants for their ability to contribute to the local economy.
The introduction and growing use of the Canadian experience class and the provincial nominee program in the 2000s has caused a shift in the distribution of economic immigrants accounted for by each program. Since their inception, the Canadian experience class and provincial nominee program have generally accepted more immigrants each year, and the share of economic immigrants admitted to Ontario under these categories reached a combined 49.0 per cent in 2016-2021.[19] The share of economic immigrants admitted to Ontario as skilled workers and skilled trades workers declined from around 84 per cent over the 1980 to 2010 period to 37.7 per cent in 2016-2021.[20] Likewise, the share of economic immigrants admitted under business programs declined from 11.3 per cent in the 1980s to 2.5 per cent in 2016-2021.
Figure 3.7 The share of economic immigrants in Ontario admitted under the Canadian experience class and provincial nominee program has increased in the past decade
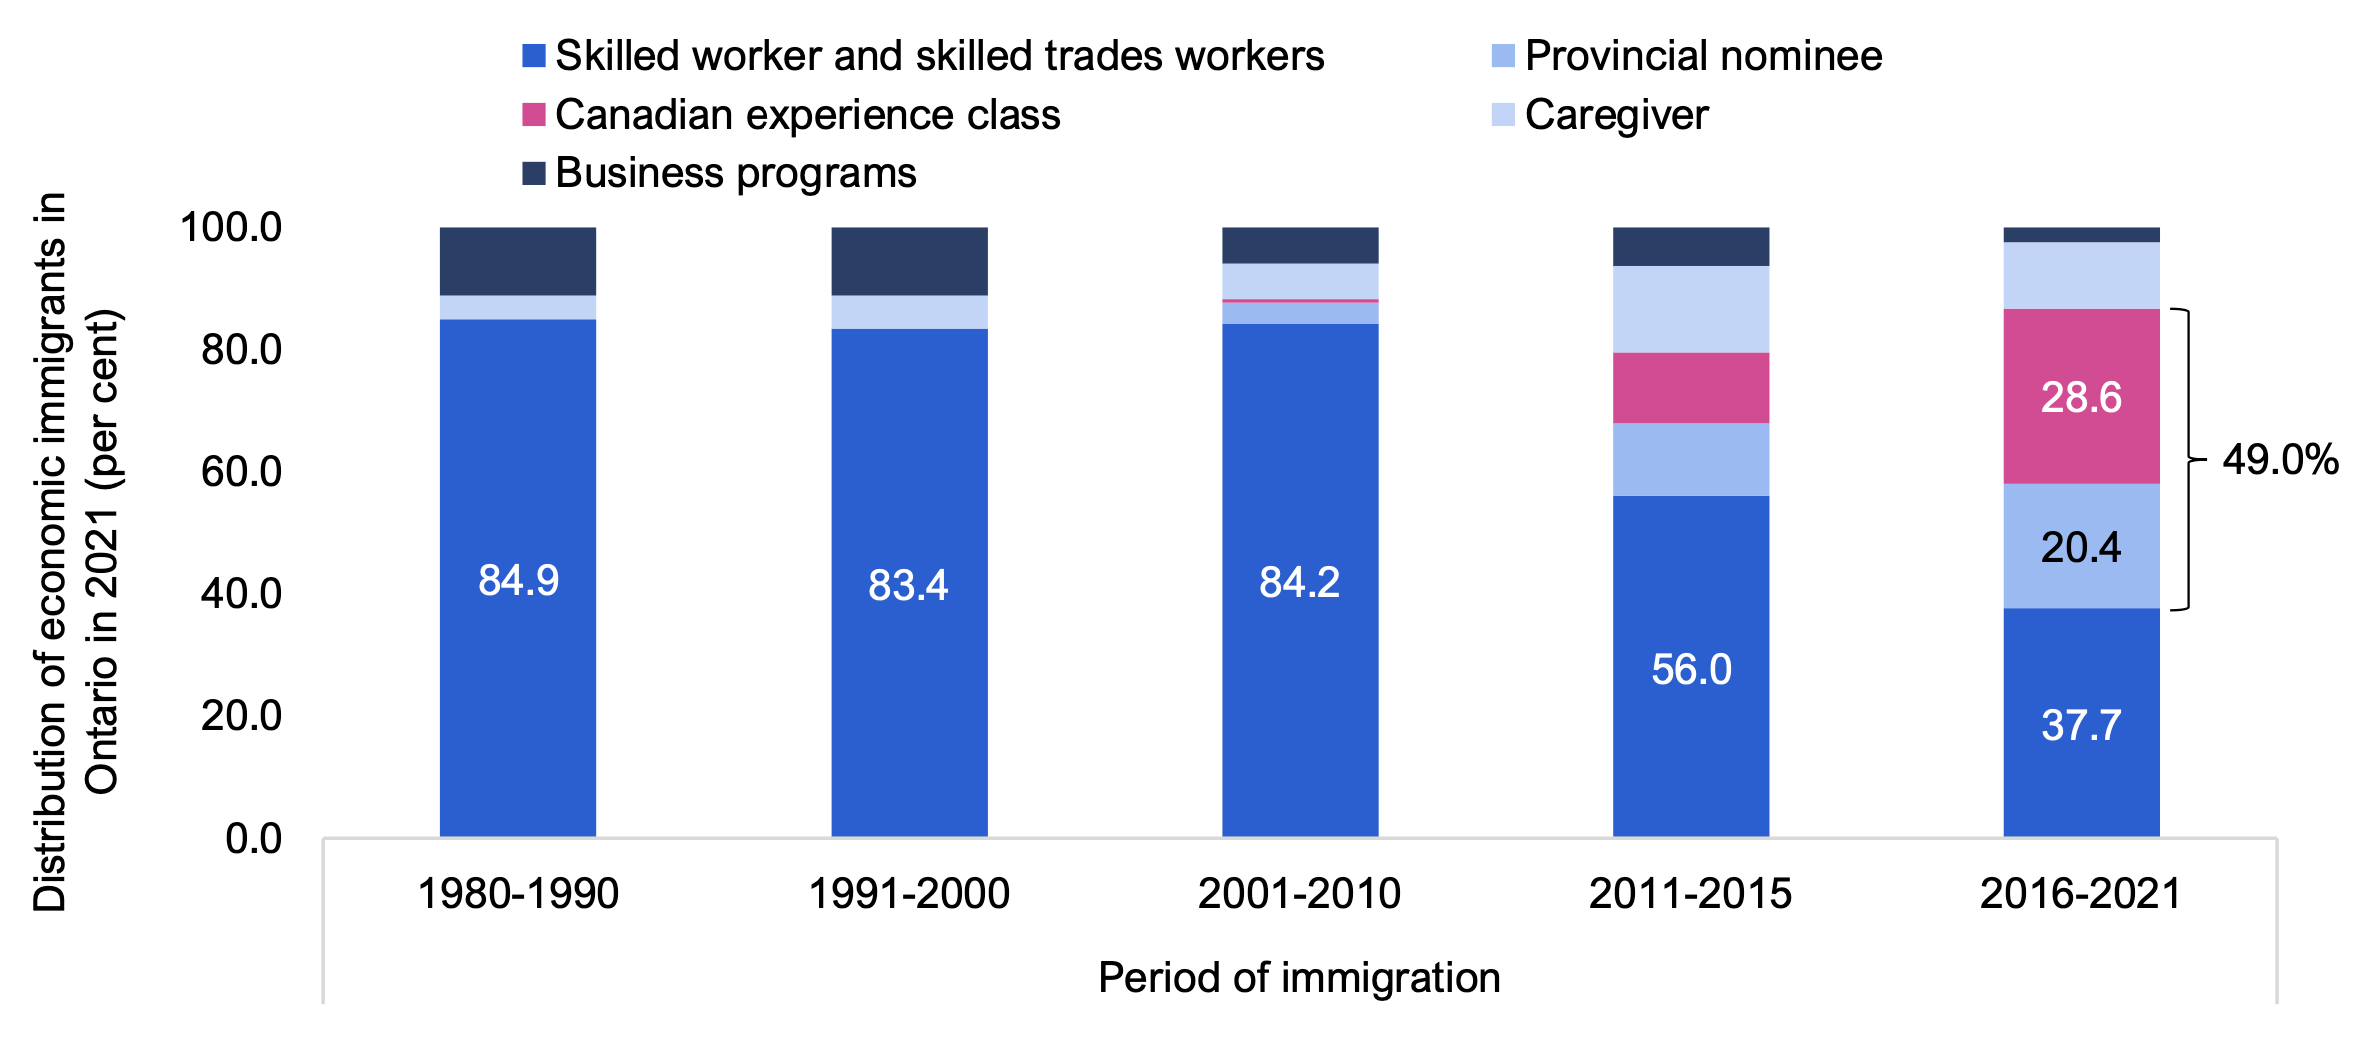
Note: All bars show the distribution of immigrants in 2021.
Source: Statistics Canada: 2021 Census: Table 98-10-0318-01
4. Immigrants’ participation in the labour market
Recent immigrants are faring better in the labour market, but challenges persist
Statistics Canada’s Labour Force Survey (LFS) shows that recent immigrants tend to experience less favourable labour market engagement than non-immigrants, with lower workforce participation and higher unemployment rates. However, the relative labour market performance of newcomers has generally improved in the past decade, reflecting in part policy changes that have resulted in a higher share of recent immigrants with higher education and Canadian pre-admission work experience that are associated with an earnings advantage.[21]
Labour force participation
The labour force participation rate[22] of immigrants in Ontario has been historically lower than that of non-immigrants.[23] Over the 2006 to 2022 period, the labour participation rate for all core working age (25-54 years) immigrants averaged 83.6 per cent, lower than the 88.0 per cent average for non-immigrants.[24] The gap in the participation rate between immigrants and non-immigrants has fluctuated over this period. Notably, during the pandemic, the participation rate of recent immigrants (landed five years or less) increased significantly, reaching a record 85.6 per cent[25] in 2022, compared to 89.1 per cent for non-immigrants.
Figure 4.1 Labour participation rate of recent immigrants in Ontario improved in the past decade

Note: Shows the labour participation rates of population aged 25-54 years.
Source: Statistics Canada: Labour Force Survey: Table 14-10-0083-01
The labour participation rate varies significantly depending on length of time in Canada, with recent immigrants experiencing lower participation rates. The average participation rate of recent immigrants over the 2006 to 2022 period was the lowest at 75.6 per cent, while for established immigrants (landed more than 10 years) it was much higher at 86.1 per cent, closer to that of non-immigrants.
Unemployment rate
At the same time, the unemployment rate of immigrants in Ontario remained consistently higher than that of non-immigrants. Over the 2006 to 2022 period, the unemployment rate for all core working age immigrants averaged 7.4 per cent, more than two percentage points higher than the 5.2 per cent average unemployment rate of those born in Canada. Similar to labour participation rates, the unemployment rate varies significantly depending on length of time in Canada, with established immigrants experiencing lower unemployment rates. The average unemployment rate of recent immigrants in 2006-2022 was the highest at 11.6 per cent, while for established immigrants it was much lower at 6.4 per cent, closer to that of non-immigrants.
The unemployment rate of immigrants trended downward in the 2010s until the COVID-19 pandemic, with the difference compared to non-immigrants narrowing. Over the 2006 to 2014 period, the unemployment rate of core working age immigrants averaged 8.2 per cent, or 2.7 percentage points higher than the average for non-immigrants (5.5 per cent). From 2015 to 2019, a period of relative strength in Ontario's labour market, the average unemployment rate of core working age immigrants was 5.9 per cent, closer to the 4.6 per cent average for those born in Canada.
Figure 4.2 Unemployment rate of recent immigrants in Ontario was consistently higher than that of non-immigrants, but the gap has narrowed
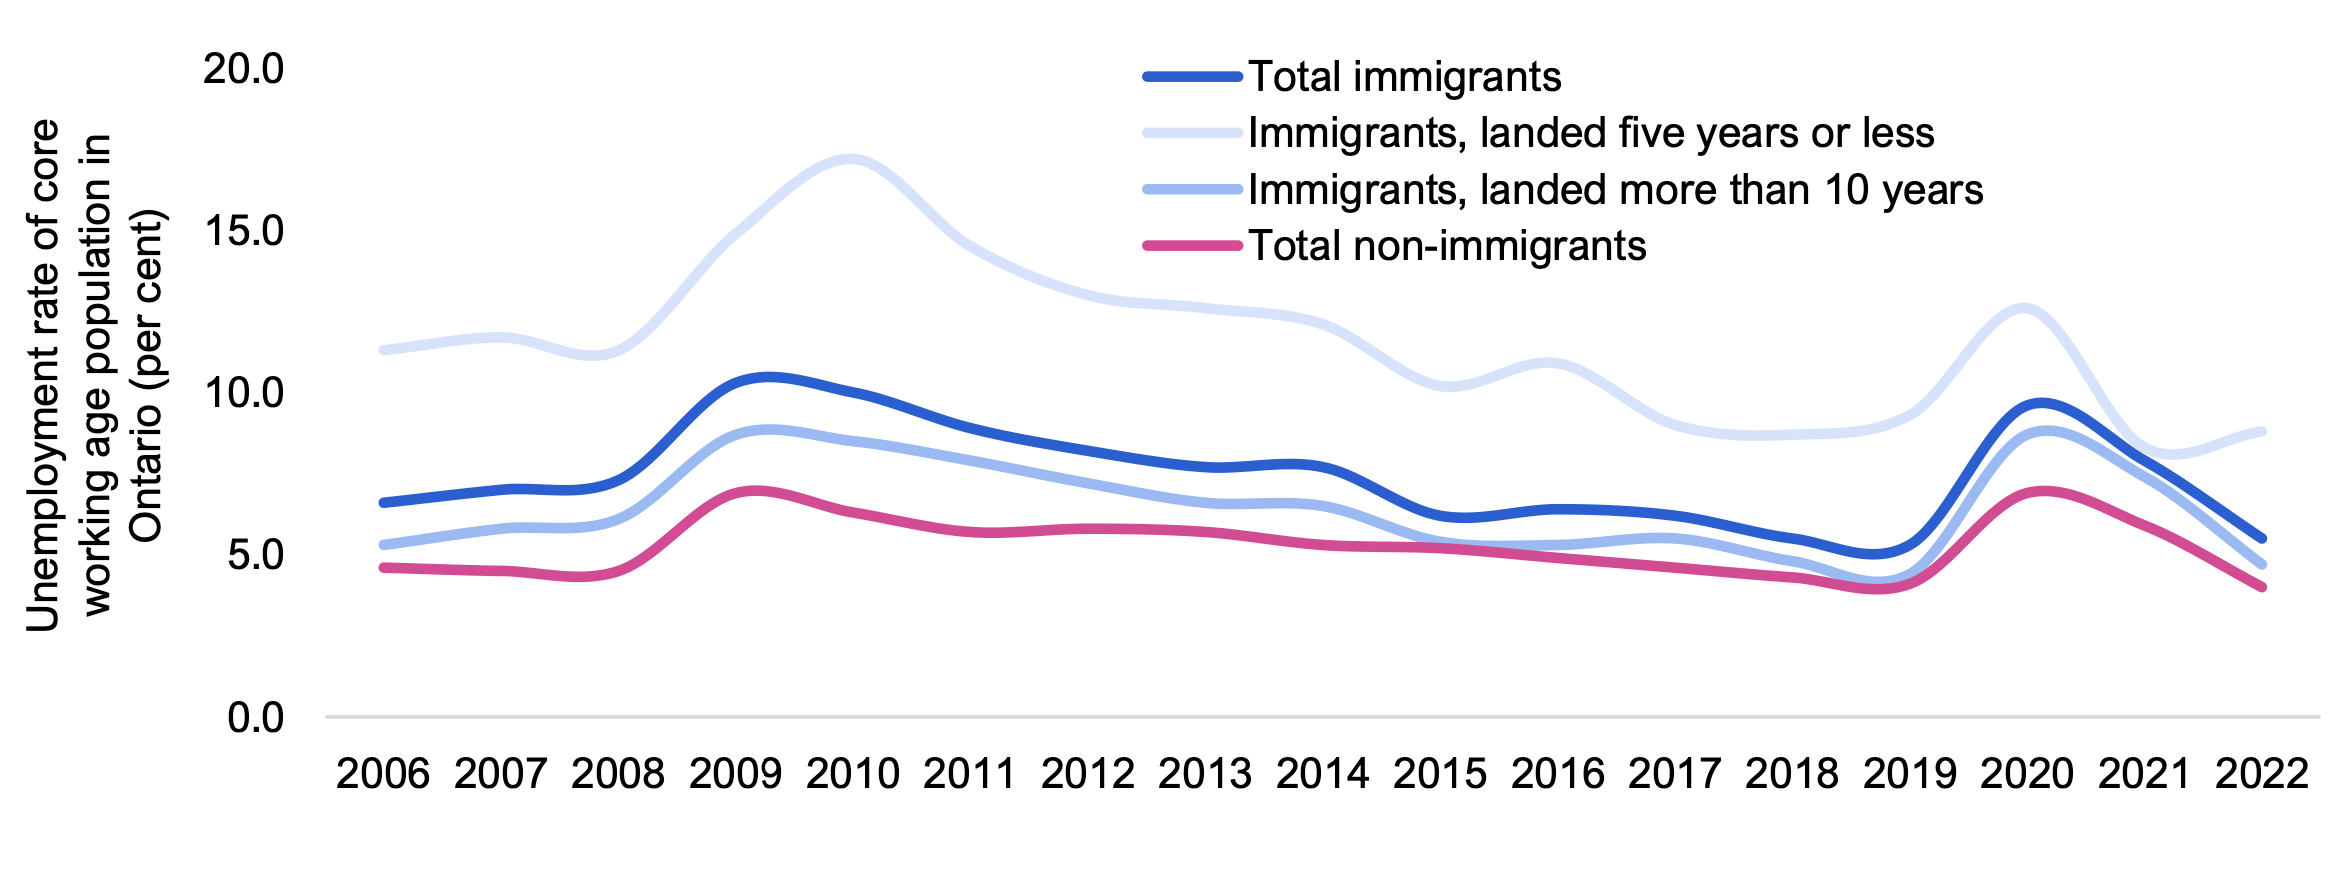
Note: Shows the unemployment rates of population aged 25-54 years.
Source: Statistics Canada: Labour Force Survey: Table 14-10-0083-01
With the onset of the pandemic, the unemployment rate of all core working age immigrants jumped from 5.3 per cent in 2019 to 9.6 per cent in 2020 and has since declined to 5.5 per cent in 2022. For recent immigrants, their unemployment rate declined from 12.6 per cent in 2020 to 8.3 per cent in 2021, but then increased to 8.8 per cent in 2022. This increase in 2022 was due to a sharp increase in new immigrant entrants into the labour force (21.2 per cent), which outpaced their employment gains (20.6 per cent).
Qualifications
Figure 4.3 Recent immigrants face high overqualification rates
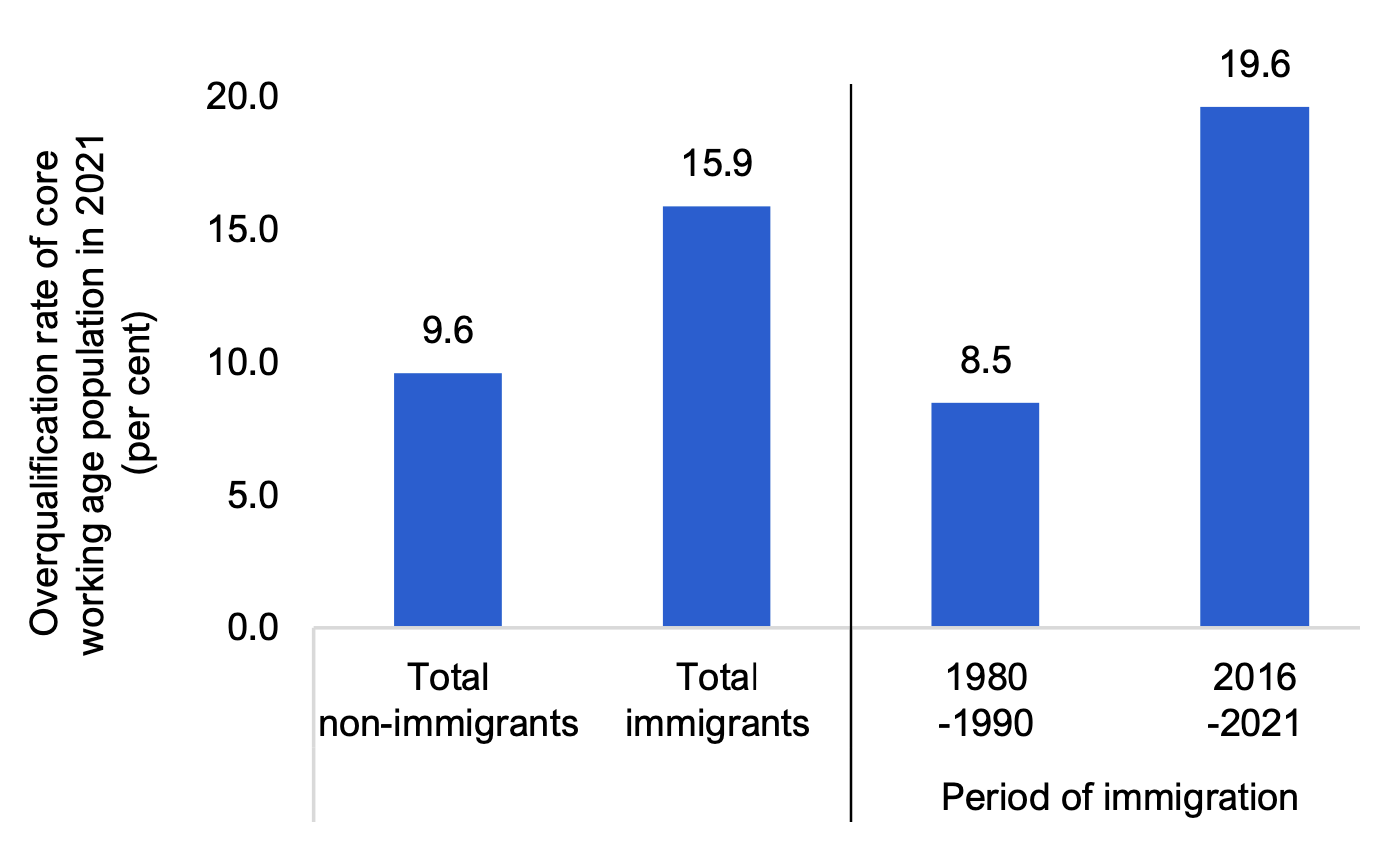
Note: Shows the share of the population aged 25-54 years in 2021 with a university degree holding a position requiring no more than a high school education.
Source: Statistics Canada: 2021 Census: Table 98-10-0443-01.
Even as headline labour market indicators for immigrants improved in recent years, a higher share of immigrants was overqualified for their jobs compared to non-immigrants. In the 2021 Census, 15.9 per cent of core working age immigrants in Ontario with a university degree held a position requiring no more than a high school education, compared to 9.6 per cent of non-immigrants.[26] The share was even higher among recent immigrants at 19.6 per cent of those who landed in 2016-2021, while established immigrants had an overqualification rate similar to non-immigrants.
A high overqualification rate could signal underutilization of immigrant talents in the labour market and reflect overrepresentation in certain sectors.[27] Overqualification can also adversely impact the long-term career paths, earnings, skills, and life satisfaction of immigrants.[28] In addition to this challenge, foreign credential recognition can be a major labour market barrier immigrants face, especially for occupations with long and complex certification processes such as health care and engineering.[29]
Distribution of recent immigrants across industries has shifted towards service sectors and professional occupations
The distribution of immigrant employment across Ontario’s various industries can reflect many factors, including the state of the province’s labour market, the skills of immigrants at the time of arrival, the impact of increasing job experience immigrants attain the longer they are employed, as well as policy changes. In the 2021 Census, around 83 per cent of core working age immigrants and 80 per cent of non-immigrants were employed in the services sector, while 17 per cent and 20 per cent worked in the goods sector, respectively, although there was variation by specific industry.[30] Industries with a higher distribution of immigrants than non-immigrants included professional, scientific and technical services (4.2 percentage points higher), transportation and warehousing (3.5 percentage points higher), and finance and insurance (3.0 percentage points higher). At the opposite end, industries with a lower distribution of immigrants than non-immigrants included public administration (4.5 percentage points lower), education (3.9 percentage points lower) and construction (2.3 percentage points lower).
Figure 4.4 Distribution of immigrant and non-immigrant employees by industry in Ontario
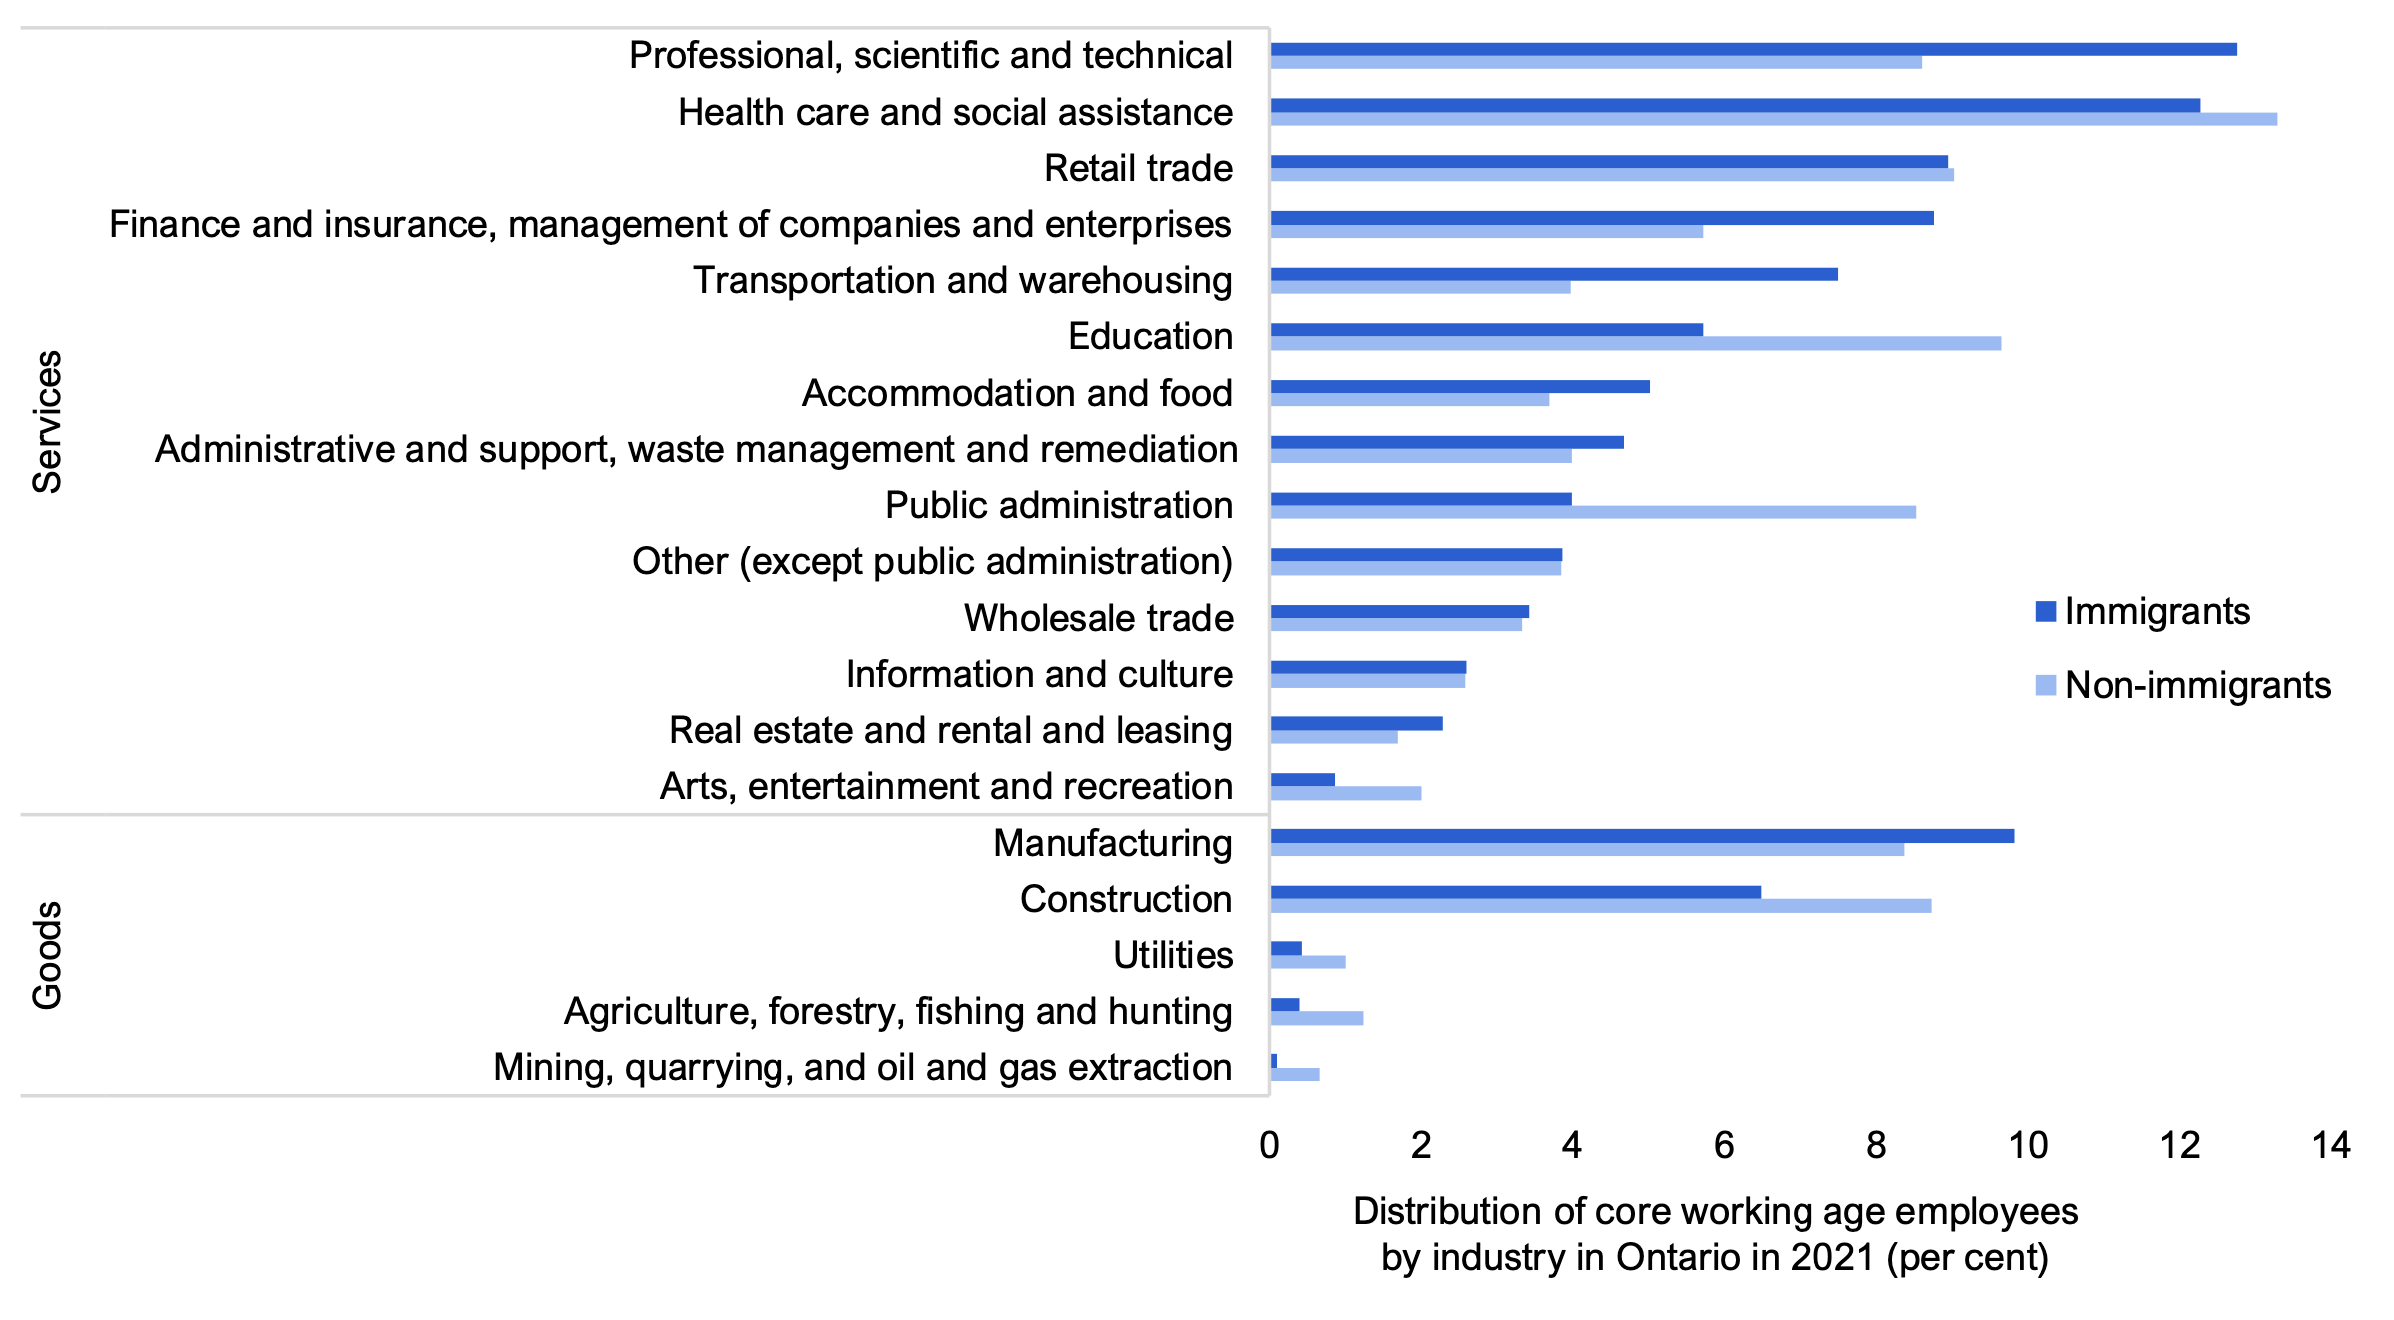
Note: Shows the distribution of employees aged 25-54 years by industry in 2021.
Source: Statistics Canada: 2021 Census: Public Use Microdata Files
The industrial distribution of immigrant employment has shifted over time. The distribution of core working age immigrants who landed in 2016-2021 employed in the professional, scientific and technical services sector was 7.7 percentage points higher than the share who landed in 1980-1989 working in the same industry, followed by transportation and warehousing (2.0 percentage points higher) and accommodation and food services (2.0 percentage points higher). Conversely, the distribution of immigrants who landed in 2016-2021 employed in public administration was 4.6 percentage points lower than the share of established immigrants working in the same industry, followed by health care and social assistance (2.9 percentage points lower) and manufacturing (2.3 percentage points lower). Overall, 83 per cent of immigrants who landed in 2016-2021 worked in the service sector, higher than the 79 per cent of immigrants who landed in the 1980s.
Figure 4.5 A larger share of recent immigrants in Ontario were employed in the service sector than established immigrants
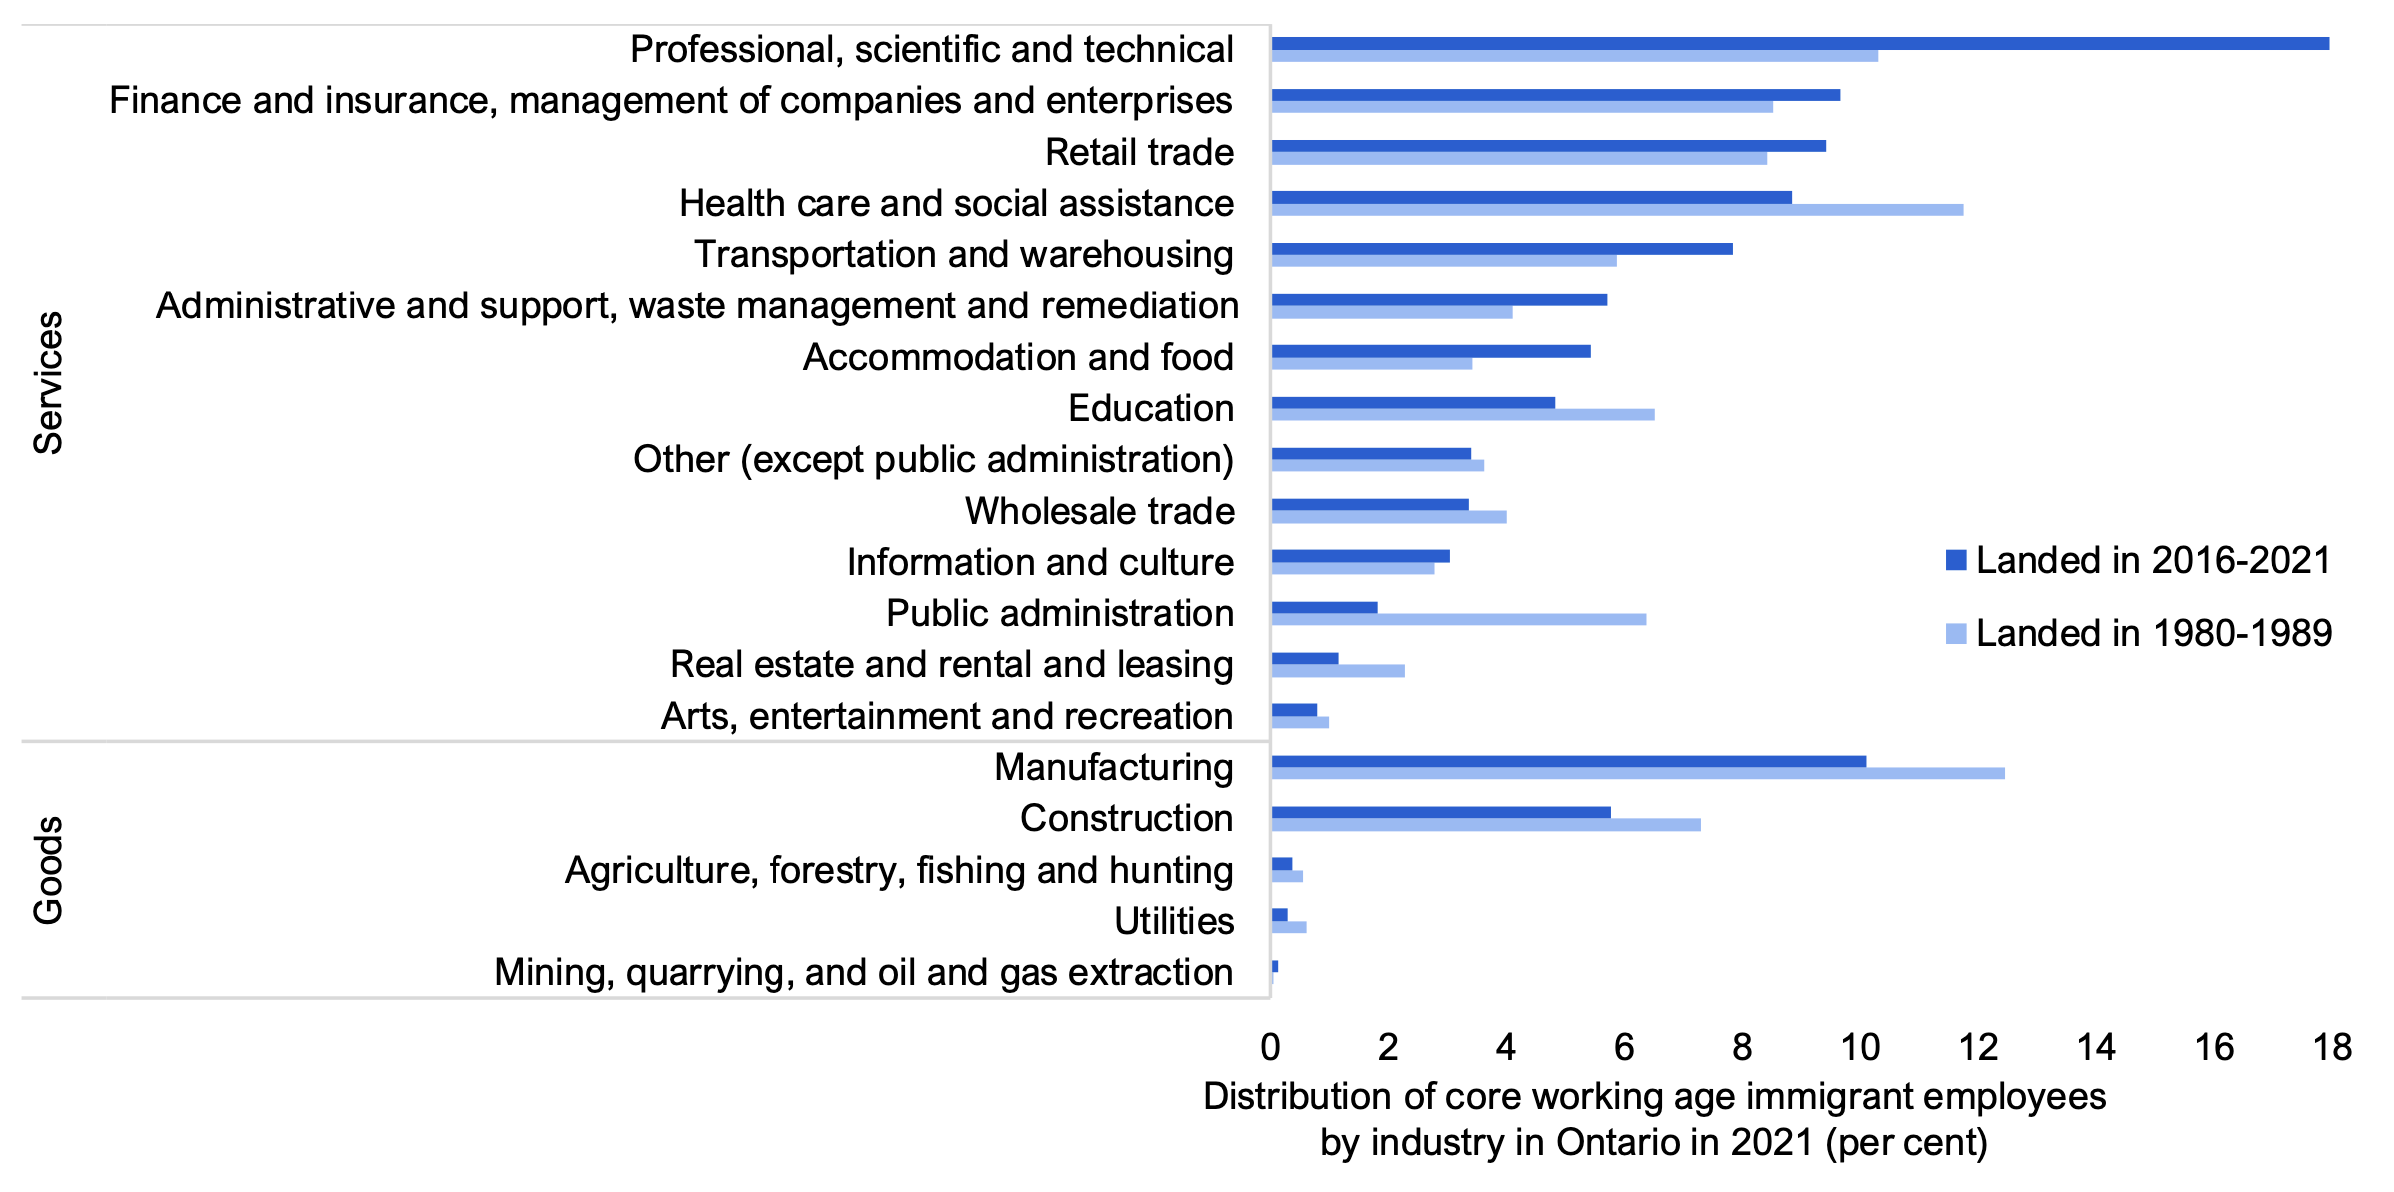
Note: Shows the distribution of immigrants aged 25-54 years by industry in 2021.
Source: Statistics Canada: 2021 Census: Public Use Microdata Files
In addition to the higher concentration of recent immigrants working in services-producing industries, the proportion of immigrants holding professional occupations is higher among recent immigrants.[31] Based on the 2021 Census, 31.2 per cent of core working age immigrants who landed in 2016-2021 held professional occupations, higher than the 25.5 per cent of immigrants who landed in 2011-2015 and the 23.5 per cent of non-immigrants. In contrast, since integration into the labour market can take time, the share of recent immigrants in management occupations (10.8 per cent) was lower than that of established immigrants (15.5 per cent) and non-immigrants (14.1 per cent). The share of recent immigrants in occupations usually requiring community college education or apprenticeship (29.5 per cent) was also lower than that of established immigrants (35.2 per cent) and non-immigrants (38.2 per cent), likely explained by changes in admission criteria in favour of higher educational attainment.[32]
Figure 4.6 A larger share of recent immigrants in Ontario held professional occupations
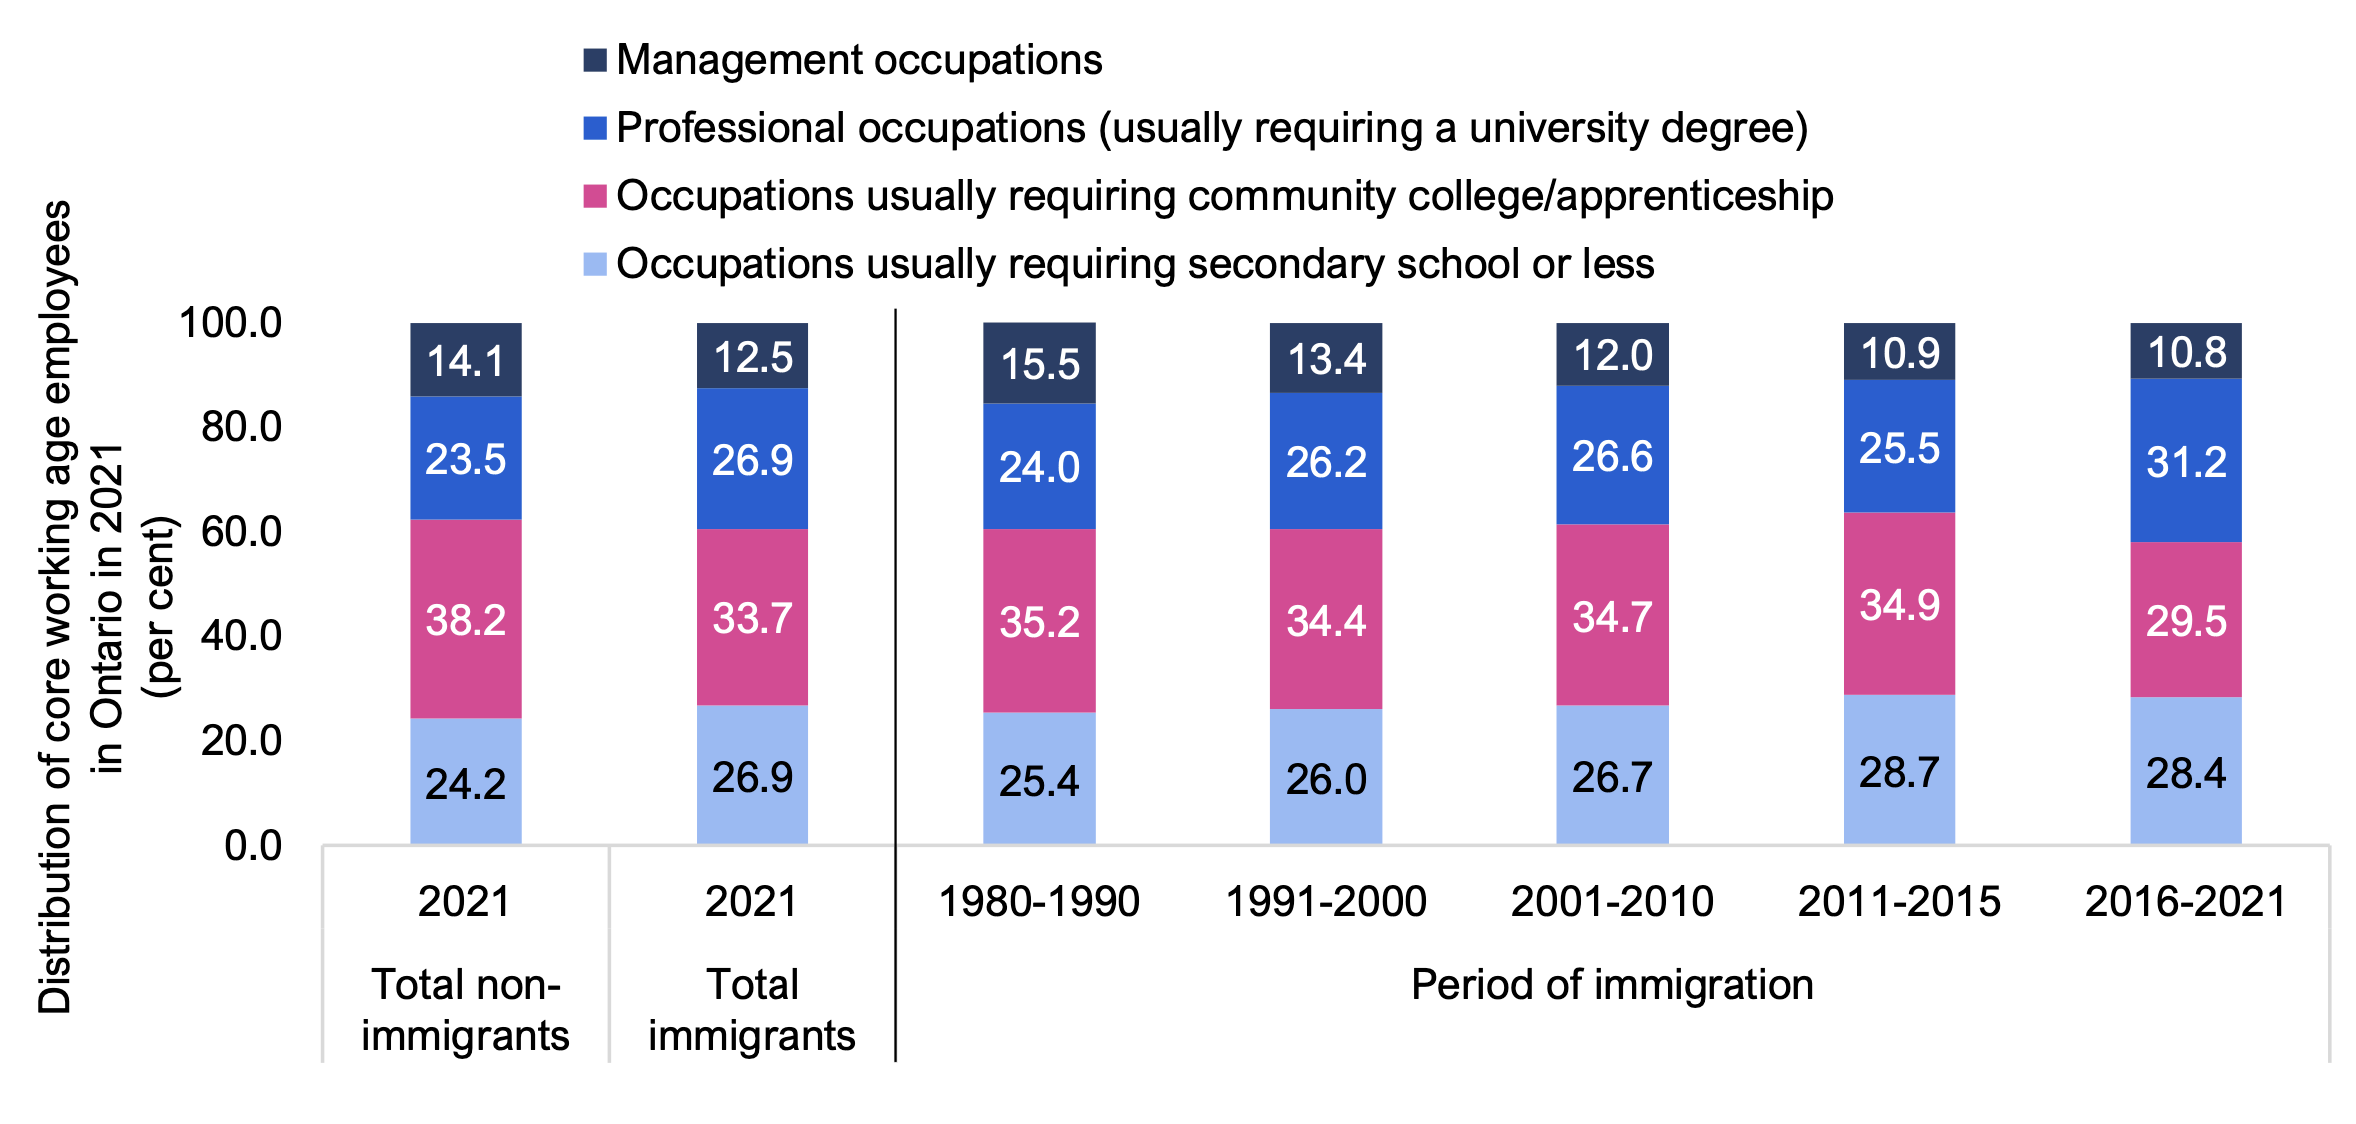
Note: All bars show the distribution of immigrants aged 25-54 years in 2021. Right five bars categorize all immigrants recorded in the 2021 Census by period of immigration. Does not include individuals who were last employed before 2020 and self-employed individuals. Management occupations are TEER 0 occupations in Statistics Canada’s National Occupation Classification 2021. Professional occupations are equivalent to TEER 1 occupations, which usually require a university degree. Occupations usually requiring community college / apprenticeship are equivalent to TEER 2 and 3 occupations. Occupations usually requiring secondary school or less are equivalent to TEER 4 and 5 occupations.
Source: Statistics Canada: 2021 Census: Table 98-10-0443-01
5. Wages of immigrants in Ontario
New immigrants’ wages have improved in recent years
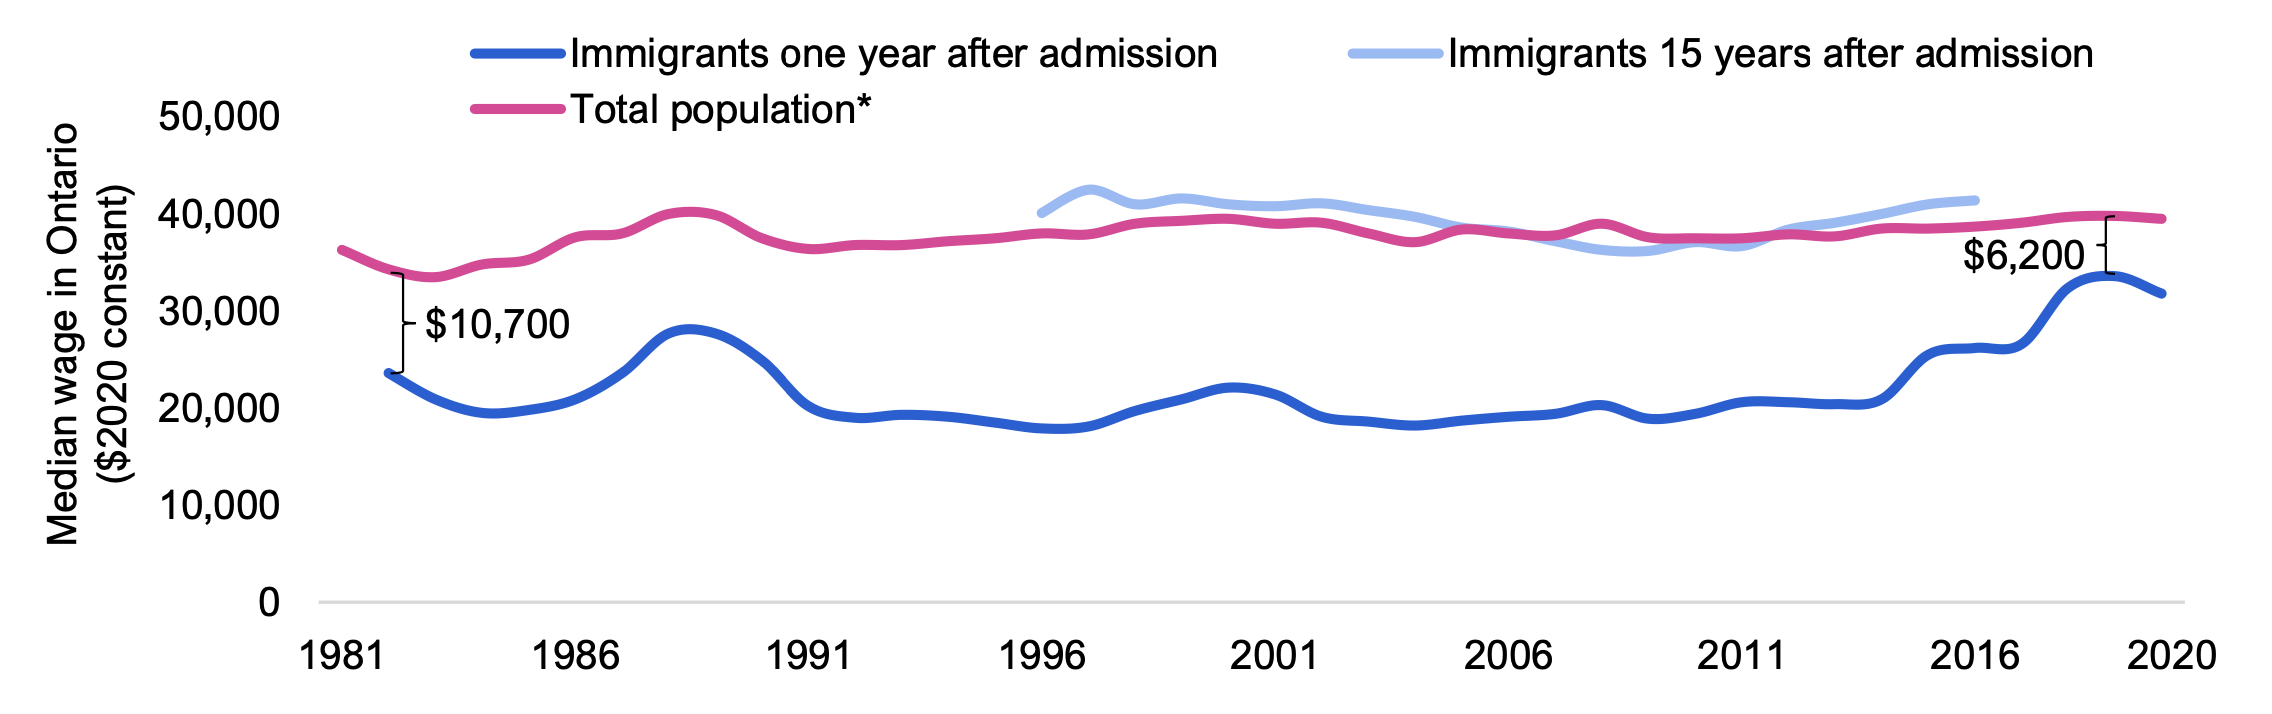
Over the 1982 to 2020 period, the real median wage[33] of new immigrants (who have been in Canada for one year, are employed and earn wages) increased at an average annual rate of 0.8 per cent, faster than the 0.4 per cent gain for the total population.[34] As a result, the difference in median wages between new immigrants and the total population narrowed from $10,700 (in 2020 constant dollars)[35] in 1982 to a low of $6,200 in 2019 before widening modestly afterwards. In comparison, the median wage of established immigrants (15 years after admission) was similar to the total population over the 1996 to 2016 period.
Figure 5.1 Gap in median wage of new immigrants in Ontario and the total population has narrowed since the mid 2010s
* Includes both immigrant and non-immigrant populations.
Note: Shows wages of population aged 15 and older.
Source: Statistics Canada: Longitudinal Immigration Database: Tables 43-10-0009-01 and 43-10-0026-01, and Statistics Canada: Canadian Income Survey: Table 11-10-0239-01
The wage gains of immigrants have not occurred evenly over this period, and the difference compared to the wages of the total population has fluctuated. The gap between the median wage of new immigrants and the total population widened in the 1990s and 2000s due to labour market challenges during recessions,[36] as well as lower returns to immigrants’ foreign work experience and the changing source country composition of the labour force.[37] However, the gap between the median wage of new immigrants and that of the total population narrowed rapidly in the late 2010s as labour market conditions recovered and policy changes in immigration selection improved the employment outcomes of immigrants.[38]
Established immigrants earned higher median wages than non-immigrants
As of the 2021 Census, which measures income earned in 2020, the median wages of total core working age immigrants in Ontario was $48,400, lower than that of non-immigrants ($56,000).[39] While the median wage of core working age immigrants who landed in 1980-1990 was higher than that of non-immigrants at $61,600, it was lower for immigrants who arrived after 1990.
Figure 5.2 Median wage of core working age immigrants in Ontario who landed after 1990 below median income of non-immigrants
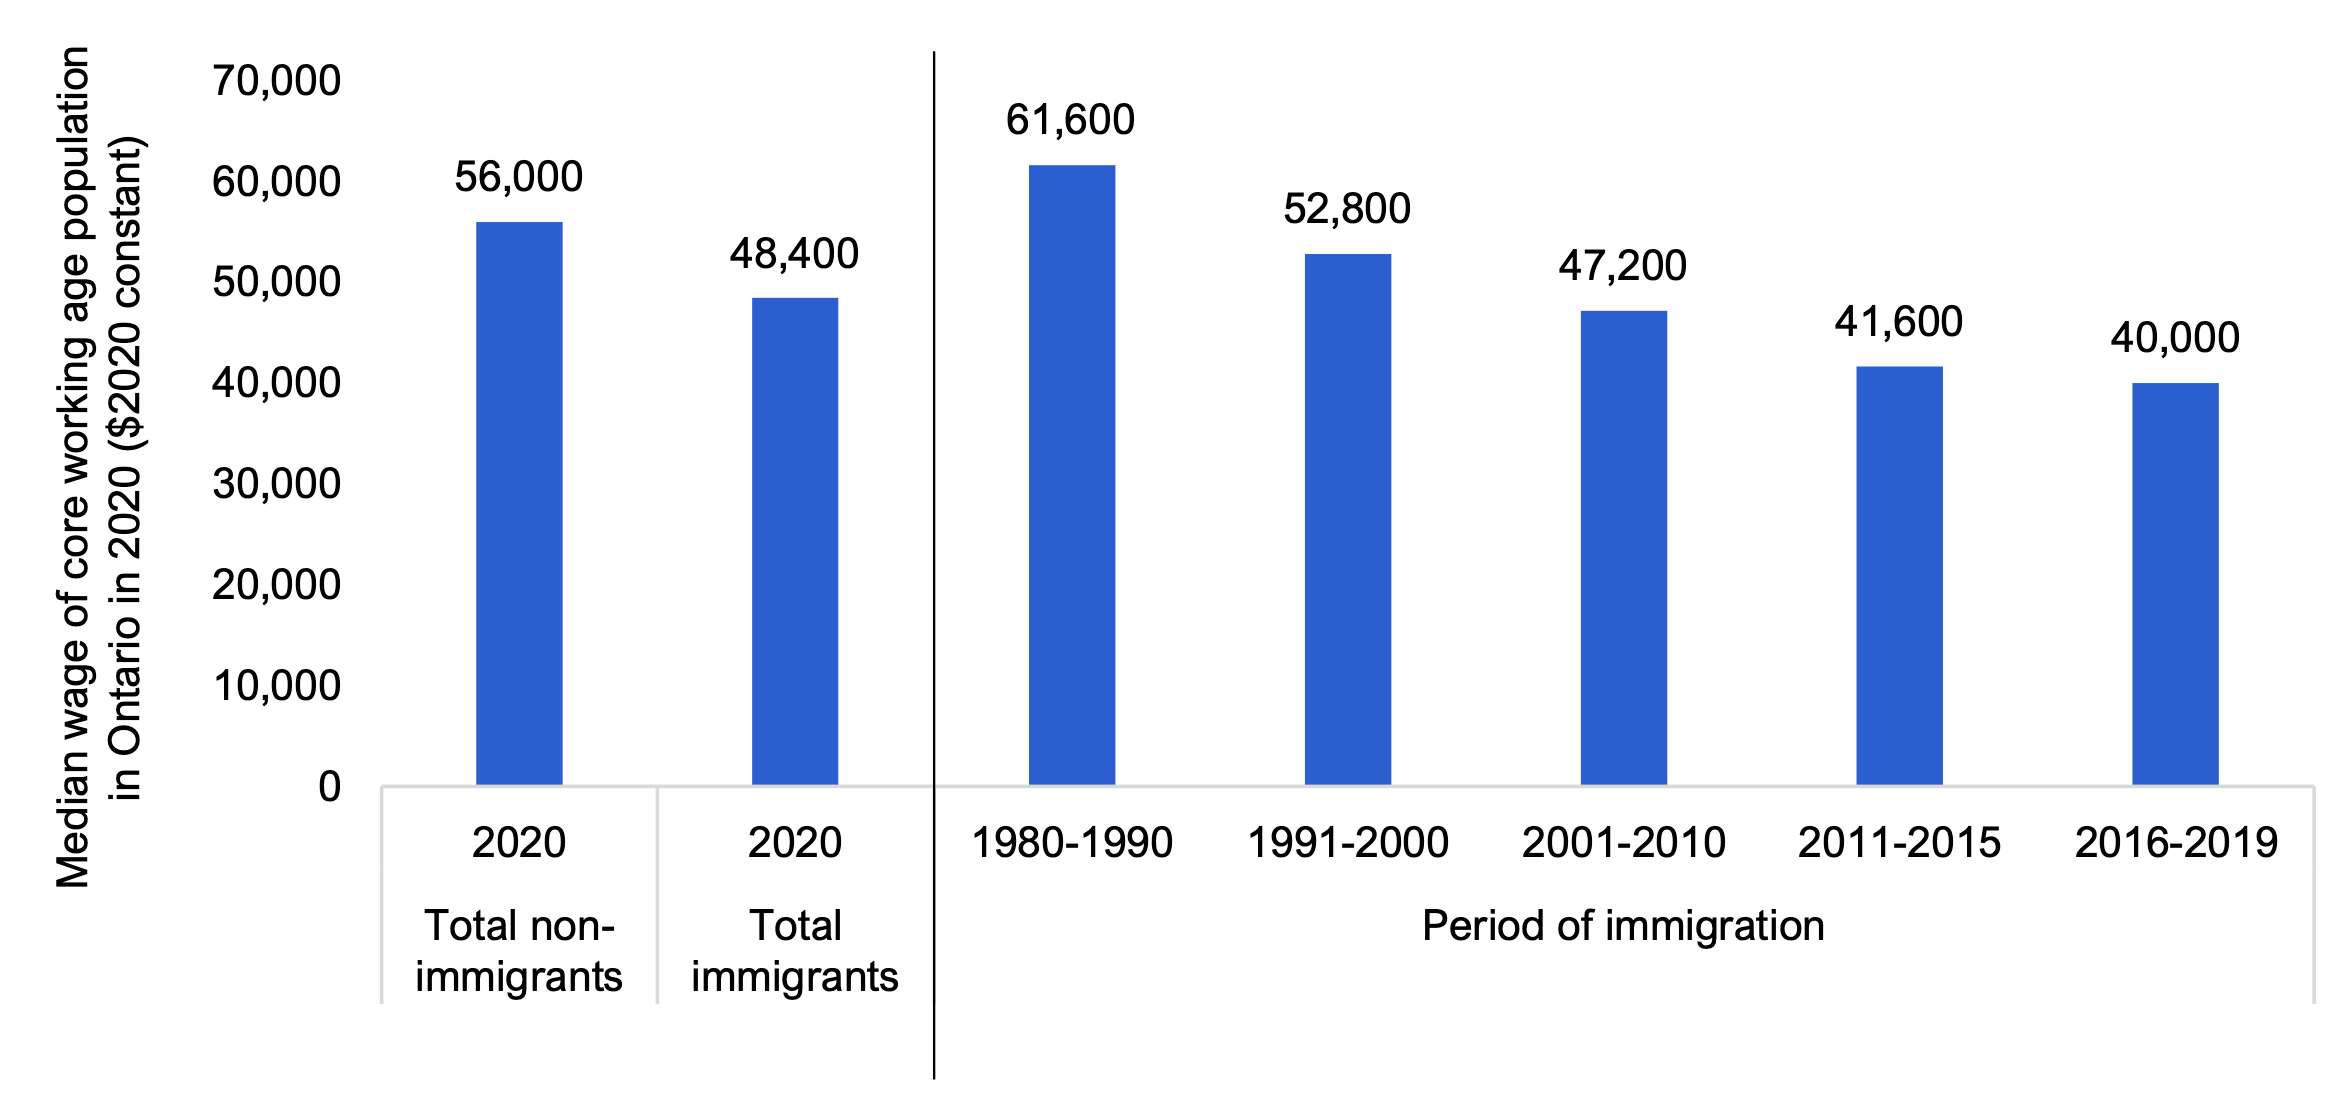
Note: All bars show median wage in 2020 of population aged 25-54 years. Right five bars categorize the median wage of immigrants recorded in the 2021 Census by period of immigration.
Source: Statistics Canada: 2021 Census: Table 98-10-0313-01
Comparing the median wages of immigrants with non-immigrants in the same age group shows noticeable gaps upon arrival, especially at older ages. Among those who arrived in 2016-2019, the median wage of immigrants aged 25-34 years was $40,800 in 2020, $2,800 lower than the median wage of non-immigrants in the same age group ($43,600).[40] At older age groups, this gap was much larger, reflecting the longer time in the Canadian labour market for non-immigrants, which tends to be associated with higher wages. For example, the median wage of recent immigrants aged 45-54 who arrived in 2016-2019 was $33,200 in 2020, less than half the earnings of non-immigrants in the same age group ($67,500).
However, over time, the median wage gaps between immigrants and non-immigrants narrowed or in some cases were. Established immigrants, who generally would have longer periods of employment in the Canadian labour market or obtained education in Canada, had smaller wage gaps or higher wages compared to their non-immigrant counterparts. For example, immigrants aged 25-34 years in 2021 and who landed in the 1980s, many of whom would have arrived as children and received education in Canada, earned noticeably higher median wages in 2020 ($59,200) than non-immigrants in the same age group ($43,600). Among all established immigrants, only those aged 45-54 in 2020 had lower median wages compared to non-immigrants of the same age.
The median wage of female immigrants was significantly lower than male immigrants in all core working age groups and periods of settlement. The largest difference[41] was observed for females in the 35-44 age group who landed in 2016-2019 and earned 41.9 per cent less than the median wage of immigrant male counterparts. Possible explanations for the gender wage gap among immigrants include the motherhood penalty experienced by women in their 30s,[42] a higher incidence of part-time employment and differences in occupation,[43] and poorer outcomes from recessions.[44]
| Median wage in 2020 ($2020 constant) | |||||||
|---|---|---|---|---|---|---|---|
| Total non-immigrants | Total immigrants | Period of immigration | |||||
| 2020 | 2020 | 1980-1990 | 1991-2000 | 2001-2010 | 2011-2015 | 2016-2019 | |
| 25-34 years | 43,600 | 42,000 | 59,200 | 50,800 | 40,800 | 34,400 | 40,800 |
| Males | 48,800 | 48,000 | 65,500 | 55,200 | 46,000 | 42,000 | 49,600 |
| Females | 38,400 | 35,600 | 51,600 | 46,800 | 36,400 | 27,800 | 32,000 |
| 35-44 years | 62,400 | 49,600 | 66,000 | 56,400 | 45,200 | 46,800 | 42,000 |
| Males | 71,000 | 60,400 | 74,500 | 65,000 | 58,400 | 59,600 | 51,600 |
| Females | 53,600 | 40,000 | 58,000 | 48,400 | 36,800 | 36,000 | 30,000 |
| 45-54 years | 67,500 | 52,000 | 58,400 | 52,000 | 52,400 | 40,400 | 33,200 |
| Males | 77,500 | 62,800 | 68,000 | 64,000 | 65,000 | 48,400 | 38,000 |
| Females | 58,000 | 44,800 | 51,200 | 44,400 | 43,200 | 34,000 | 28,000 |
| Total core working age population (25-54 years) | 56,000 | 48,400 | 61,600 | 52,800 | 47,200 | 41,600 | 40,000 |
| Males | 63,600 | 57,600 | 70,500 | 61,600 | 57,200 | 51,200 | 48,400 |
| Females | 48,800 | 40,800 | 54,000 | 46,000 | 39,600 | 32,800 | 30,800 |
Immigrants with higher education and who studied in Canada earn higher median wages
Past trends in earnings of immigrants by education level generally show that university degrees provide a significant earnings advantage over less education.[45] In the 2021 Census, immigrants with a bachelor’s degree or higher earned the highest median wage among immigrants for all periods of settlement. Among core working age immigrants who landed in 1980-1990, those with a bachelor’s degree or higher had a median wage of $90,000, more than double the earnings of those with no certificate, degree or diploma ($41,600).[46] Among recent immigrants who arrived in 2016-2019, the most highly educated had median wages of $49,200, also more than double the median wage of those with the lowest educational attainment ($23,000).
For immigrants with postsecondary education, the median wage of those with a bachelor’s degree or higher compared most favourably to non-immigrants for most periods of settlement. Among workers with a bachelor’s degree or higher, the median wages of core working age immigrants who landed in 1980-1990 were 20.0 per cent higher than for non-immigrants in 2020. As well, the median wage of established immigrants with college or other non-university certificate or diploma who landed in 1980-1990 was 9.3 per cent higher than for non-immigrants with equivalent credentials. Conversely, the median wage of immigrants with apprenticeship, trades certificate or equivalent did not catch up to non-immigrants for all periods of settlement.
| Highest Level of Education | Median wage of core working age population in 2020 ($2020 constant)* | ||||||
|---|---|---|---|---|---|---|---|
| Total non-immigrants | Total immigrants | Period of immigration | |||||
| 2020 | 2020 | 1980-1990 | 1991-2000 | 2001-2010 | 2011-2015 | 2016-2019 | |
| No certificate, diploma or degree | 34,800 | 29,000 (-16.7) |
41,600 (19.5) |
32,000 (-8.0) |
24,200 (-30.5) |
23,600 (-32.2) |
23,000 (-33.9) |
| High school diploma or equivalent | 43,200 | 34,400 (-20.4) |
47,600 (10.2) |
36,800 (-14.8) |
30,000 (-30.6) |
28,000 (-35.2) |
25,200 (-41.7) |
| Apprenticeship, trades certificate or equivalent | 59,200 | 40,800 (-31.1) |
53,600 (-9.5) |
44,400 (-25.0) |
37,600 (-36.5) |
36,800 (-37.8) |
31,200 (-47.3) |
| College or other non-university certificate or diploma | 51,600 | 43,600 (-15.5) |
56,400 (9.3) |
48,000 (-7.0) |
39,200 (-24.0) |
34,400 (-33.3) |
30,400 (-41.1) |
| Bachelor’s degree or higher | 75,000 | 61,200 (-18.4) |
90,000 (20.0) |
72,500 (-3.3) |
61,600 (-17.9) |
51,600 (-31.2) |
49,200 (-34.4) |
| Total core working age population | 56,000 | 48,400 (-13.6) |
61,600 (10.0) |
52,800 (-5.7) |
47,200 (-15.7) |
41,600 (-25.7) |
40,000 (-28.6) |
In addition to higher education, Canadian-acquired education also positively affects immigrants’ labour market earnings.[47] The 2021 Census showed significant differences in the median wage of immigrants in Ontario based on their location of study and educational background. For all core working age immigrants with postsecondary education, those who studied in Canada had median wages of $59,200 in 2020, higher than the $49,200 for immigrants who studied outside Canada.[48]
| Location of Study | Median wage of core working age population in 2020 ($2020 constant)* | ||||||
|---|---|---|---|---|---|---|---|
| Total non-immigrants | Total immigrants | Period of immigration | |||||
| 2020 | 2020 | 1980-1990 | 1991-2000 | 2001-2010 | 2011-2015 | 2016-2019 | |
| In Canada | 62,000 | 59,200 (-4.5) |
72,000 (16.1) |
61,200 (-1.3) |
53,200 (-14.2) |
46,400 (-25.2) |
49,600 (-20.0) |
| Outside of Canada | 78,500 | 49,200 (-37.3) |
64,500 (-17.8) |
61,600 (-21.5) |
54,000 (-31.2) |
46,400 (-40.9) |
42,800 (-45.5) |
| Total core working age population with postsecondary education | 62,400 | 54,400 (-12.8) |
71,500 (14.6) |
61,200 (-1.9) |
53,600 (-14.1) |
46,400 (-25.6) |
44,400 (-28.8) |
Immigrants admitted under the Canadian experience class earned the highest median wage among economic immigrants
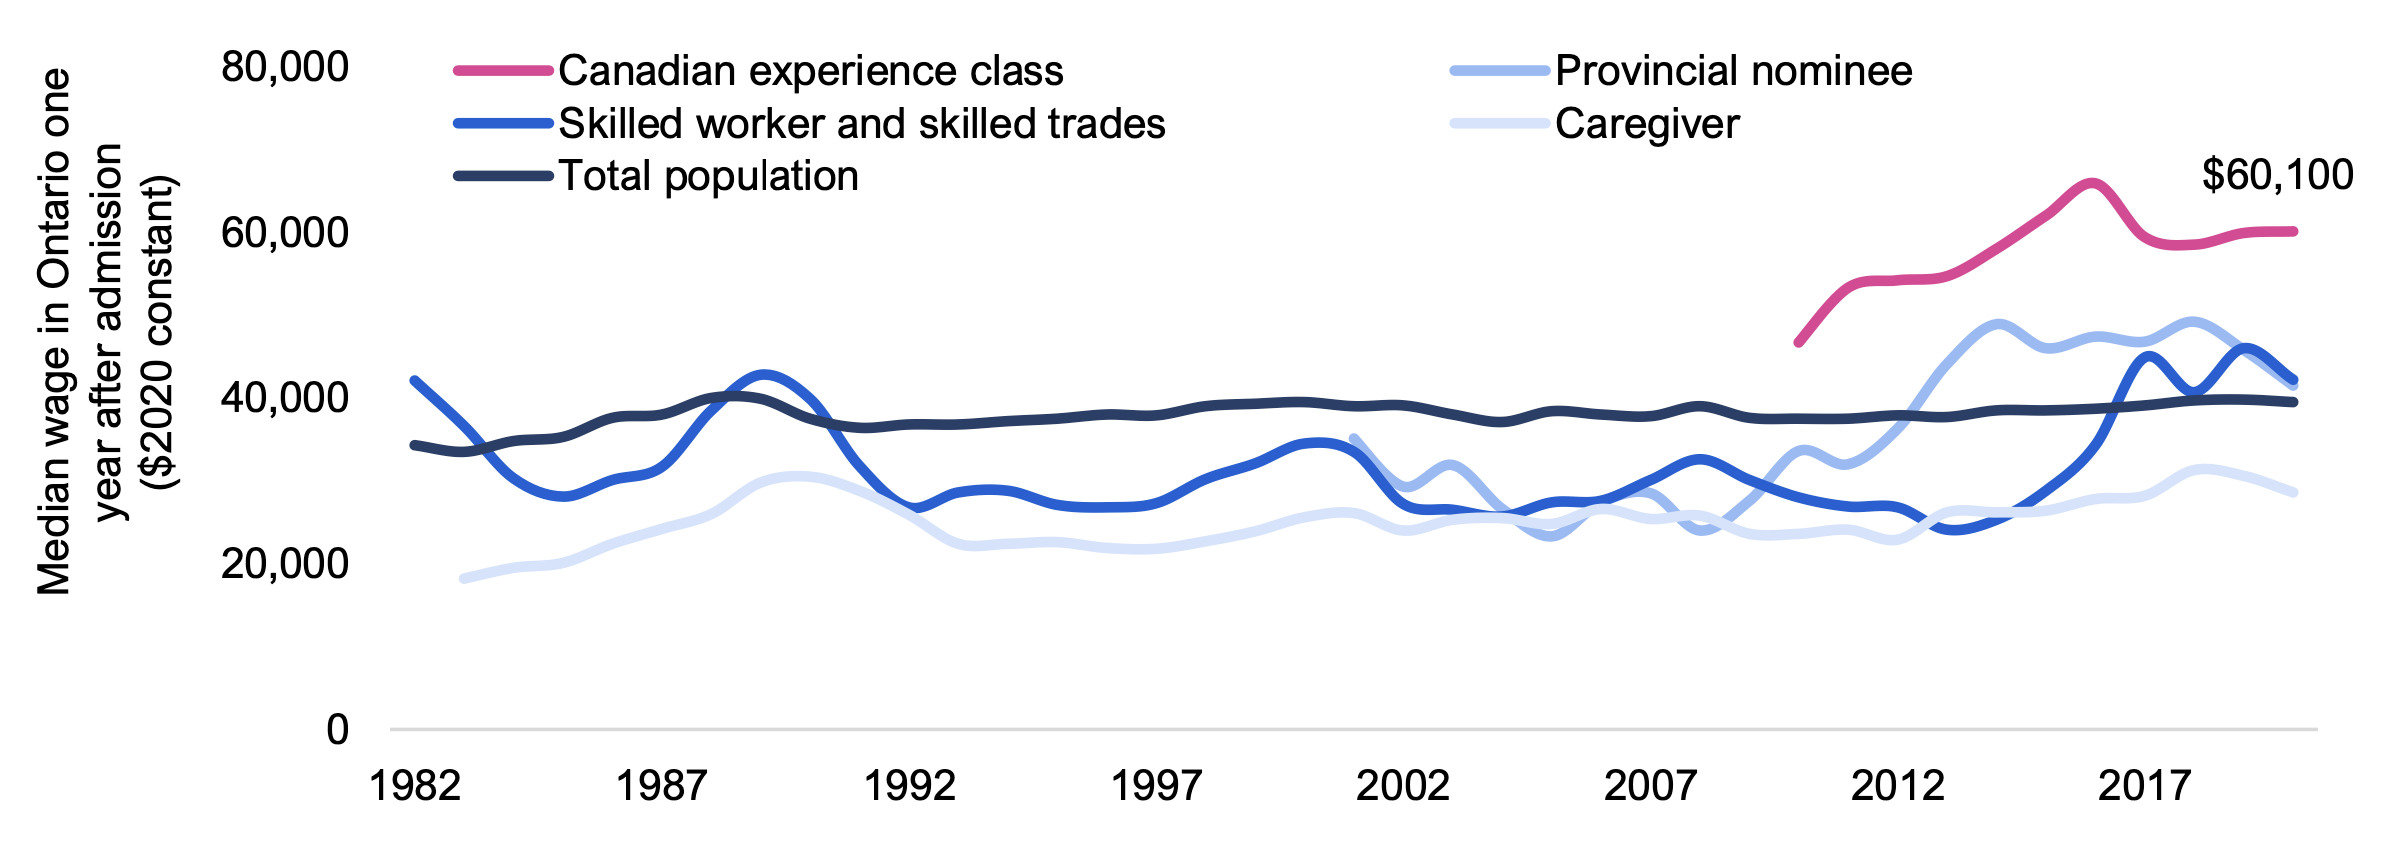
Among economic immigrants admitted under worker programs[49] and the provincial nominee program, recent immigrants of the Canadian experience class consistently earned the highest median wage since the data became available, at $60,100 one year after admission in 2020.[50] Immigrants admitted under the Canadian experience class have also had median wages one year after admission well above that of the total population over the past decade.
One year after admission, the median wages of economic immigrants admitted in the skilled worker and skilled trades category and the provincial nominee program were below the median wage of the total population over the 1990 to 2010 period. However, these groups have since experienced strong wage growth, and by 2020, skilled workers/trades workers earned a median wage of $42,200 and provincial nominees’ median wage reached $41,500, both modestly higher than that of the total population. Changes in the selection process to target highly skilled immigrants and increased emphasis on pre-admission experience likely helped improve the median wage of skilled workers/trade workers and provincial nominees in the 2010s.[51]
Figure 5.3 Median wage of recently admitted Canadian experience class immigrants in Ontario is above that of other admission categories
Note: Shows wages of population 15 years of age and older.
Source: Statistics Canada: Longitudinal Immigration Database: Tables 43-10-0010-01 and 43-10-0026-01
The gap in earnings across admission categories widened after a longer period of settlement. For example, the median wage of Canadian experience class immigrants five years after admission was $82,500 in 2020, higher than for skilled workers/trades workers ($66,700), provincial nominees ($60,000) and caregivers ($35,300).
The gaps in median wages across admission categories also reflect differences in the distribution of immigrants across occupations. In the 2021 Census, 62.2 per cent of Canadian experience class immigrants of core working age who landed in 2016-2021 held management or professional occupations,[52] higher than the 53.8 per cent of provincial nominees.[53] The differences in the distribution widened after a longer period of settlement, with 67.4 per cent of Canadian experience class immigrants who landed in 2011-2015 holding management or professional occupations in 2021 compared to 52.4 per cent of provincial nominees.
Another factor in the median wage gaps across admission categories is the role of Canadian pre-admission work experience in improving adaptation to the labour market[54] and as a predictor of better earnings for immigrants.[55] Specifically, immigrants who have both Canadian work and study experience before being admitted to Canada as permanent residents have higher labour market earnings. For example, immigrants with both work and study experience prior to obtaining permanent resident status earned the highest median wage in 2020 ($62,200, five years after admission), followed by those with only work experience ($44,500) and immigrants with only study experience ($30,100).[56] The wage advantage of having pre-admission Canadian experience widened with a longer period of settlement. Immigrants with pre-admission work and study experience had the highest median wage 10 years after admission ($72,500), more than twice the median wage of immigrants with no pre-admission experience ($33,000).
| Pre-admission experience | Median wage in 2020 ($2020 constant) | |
|---|---|---|
| 5 years after admission | 10 years after admission | |
| With work and study experience in Canada | 62,200 | 72,500 |
| With work experience in Canada, no study experience in Canada | 44,500 | 45,100 |
| With study experience in Canada, no work experience in Canada | 30,100 | 43,000 |
| Without pre-admission experience | 30,000 | 33,000 |
6. Settlement and wages of immigrants in Ontario’s major cities
A disproportionately large share of immigrants coming to Ontario settled in Toronto
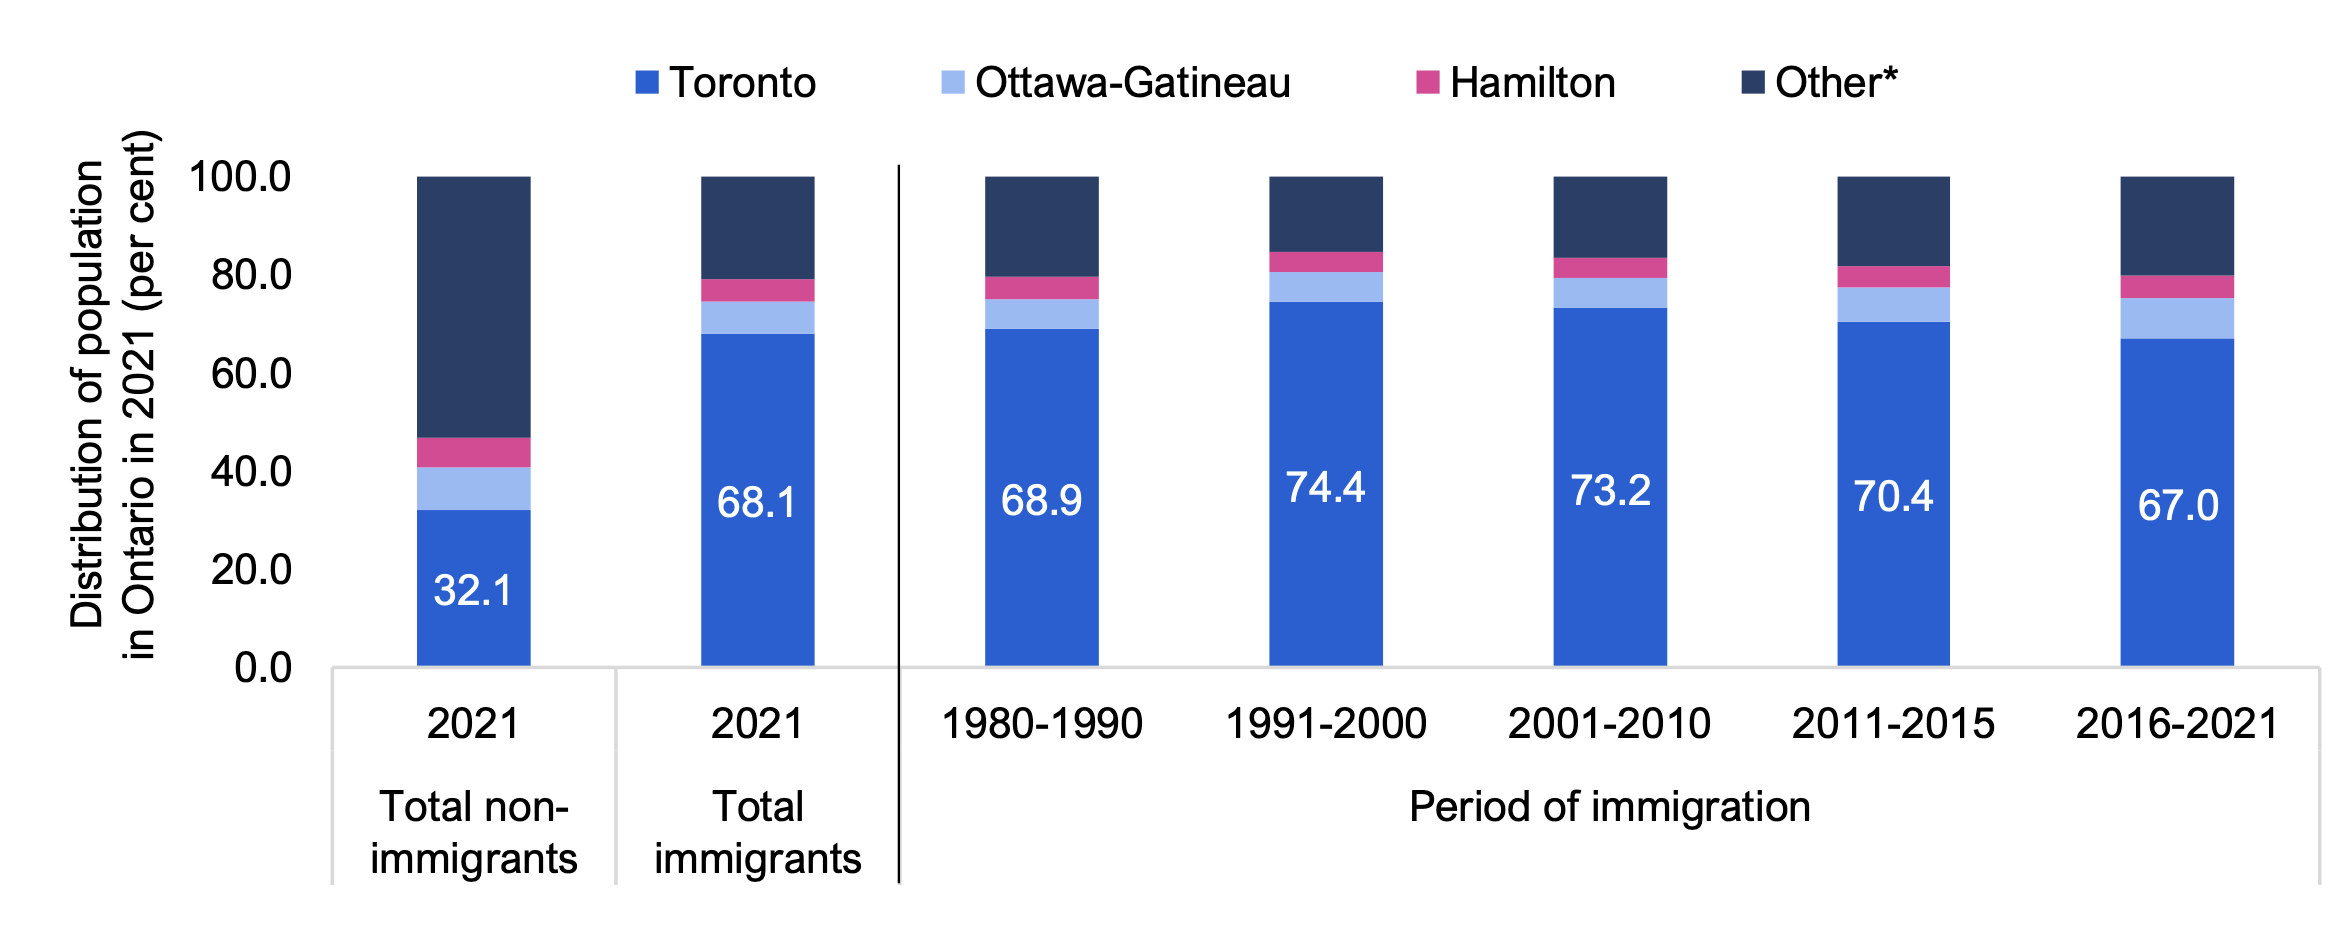
The share of immigrants settling in Toronto,[57] the most populous Ontario Census Metropolitan Area (CMA),[58] has been disproportionately larger than the distribution of the Canadian-born population residing there. For example, in 2021, 67.0 per cent of immigrants to Ontario who arrived in 2016-2021 lived in Toronto, far larger than the 32.1 per cent share of the province’s total non-immigrant population residing in the area.[59] In contrast, the share of immigrants who settled in other CMAs[60] and the area outside of CMAs has been less than the share of the province’s total non-immigrant population residing in those areas.
Figure 6.1 The Toronto Census Metropolitan Area attracts the largest share of immigrants in Ontario
* Other includes the Ontario CMAs of Barrie, Belleville, Brantford, Greater Sudbury, Guelph, Kingston, Kitchener-Cambridge-Waterloo, London, Oshawa, Peterborough, St. Catharines-Niagara, Thunder Bay and Windsor, and the area outside of CMAs.
Note: All bars show the distribution of population in 2021. Right five bars categorize all immigrants recorded in the 2021 Census by period of immigration. The Toronto CMA includes most of the Greater Toronto Area.
Source: Statistics Canada: 2021 Census: Tables 98-10-0318-01 and 98-10-0347-01
Notably, the share of immigrants residing in Toronto was lower among recent immigrants than established immigrants. Of the established immigrants who landed in the 1990s, 74.4 per cent resided in Toronto in 2021, 7.4 percentage points higher than the share of recent immigrants who landed in 2016-2021. Over the same periods, a higher share of recent immigrants compared to established immigrants resided in Ottawa-Gatineau (+2.1 percentage points), Kitchener-Cambridge-Waterloo (+1.8 percentage points), London (+1.5 percentage points) and Hamilton (+0.6 percentage points).
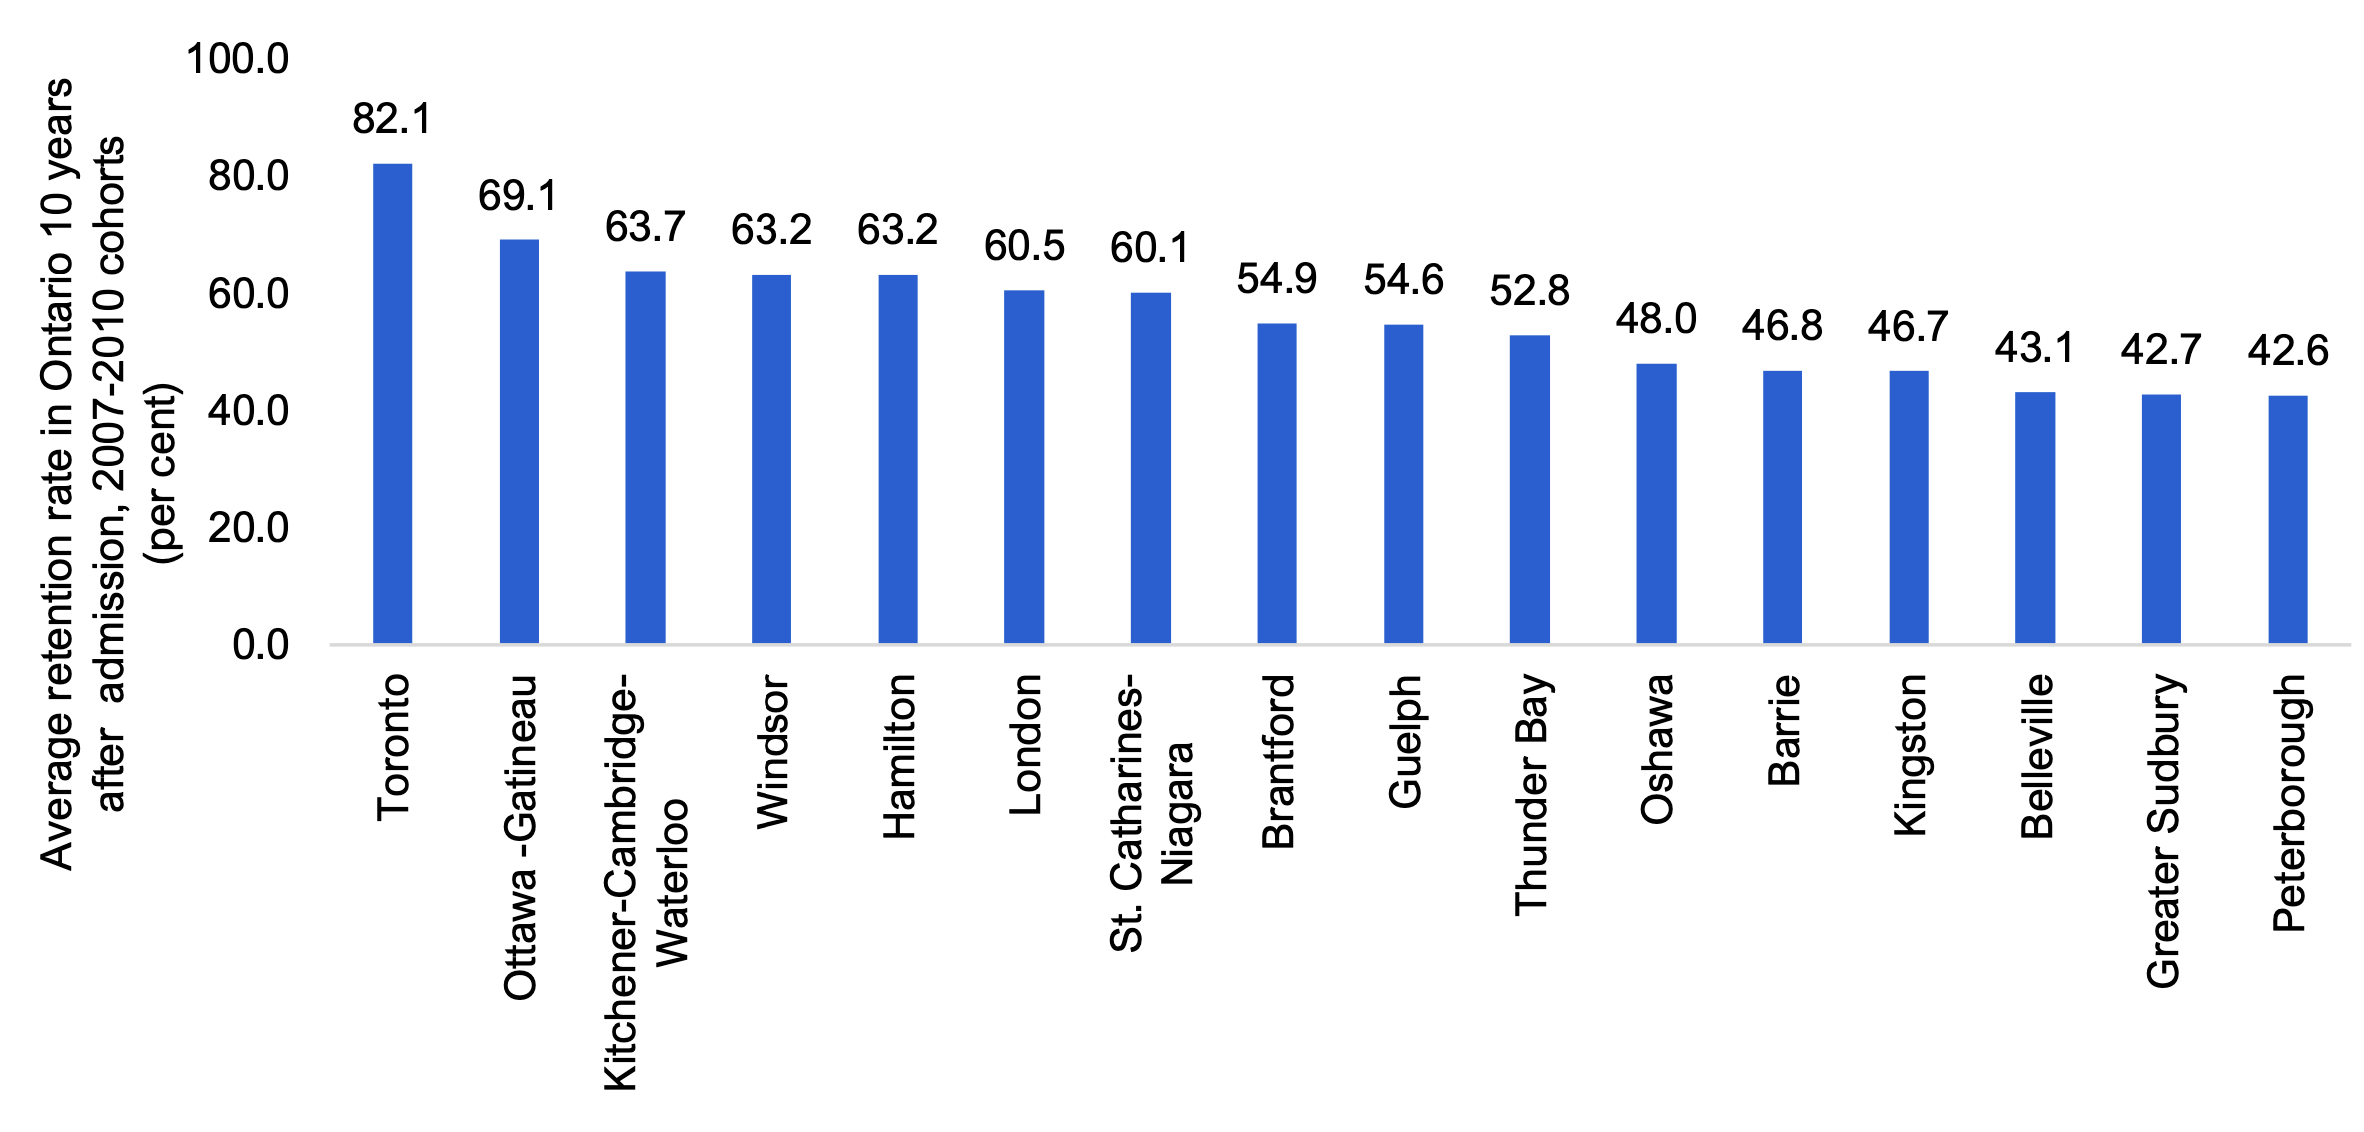
Several factors determine the initial destination of immigrants, including immigration category, country of birth and employment opportunities.[61] Economic immigrants strongly favour settling in the most populous cities, and after their initial decision, tend to remain in these urban centres.[62] However, immigrants will move within Canada after their initial settlement. On average, among the 2007-2020 group of immigrants, 94.1 per cent stayed in Ontario one year after admission, declining to around 91 per cent remaining after a decade in the province.[63] Within Ontario, after 10 years of settlement, Toronto had the highest average retention rate[64] with 82.1 per cent of immigrants remaining in the city, trailed by Ottawa-Gatineau (69.1 per cent) and Kitchener-Cambridge-Waterloo (63.7 per cent), while Peterborough experienced the lowest retention rate (42.6 per cent).
Figure 6.2 Toronto retained the largest share of its immigrants out of all Ontario Census Metropolitan Areas 10 years after settlement
Note: The Toronto CMA includes most of the Greater Toronto Area.
Source: Statistics Canada: Longitudinal Immigration Database: Table 43-10-0022-01
Core working age immigrants in all Ontario major cities earned lower median wages than non-immigrants
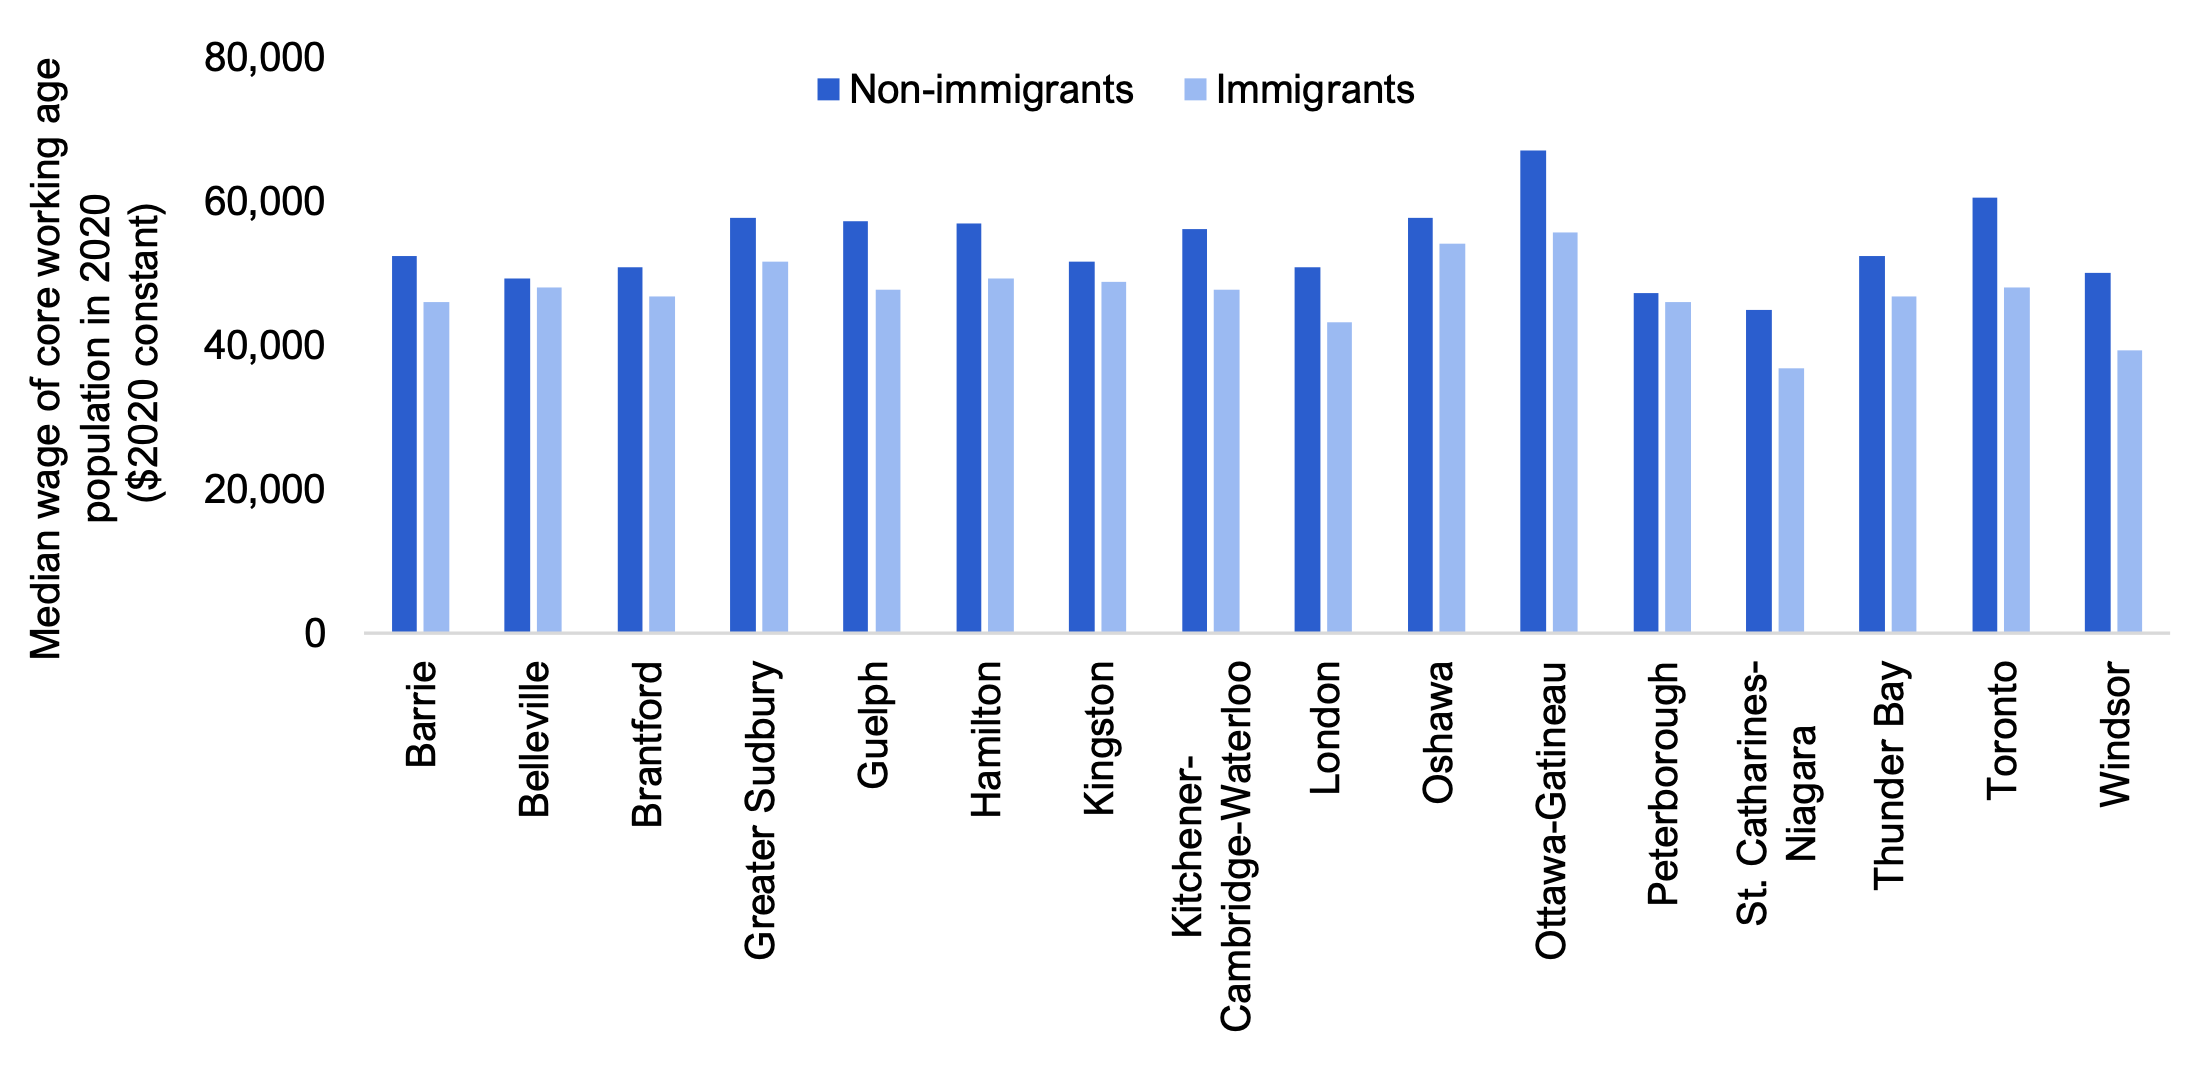
In the 2021 Census, immigrants in all Ontario CMAs earned a lower median wage than non-immigrants. Out of all Ontario CMAs, core working age immigrants in Ottawa-Gatineau earned the highest median wage in 2020 ($55,600 vs. $67,000 for non-immigrants), trailed by Oshawa ($54,000 vs. $57,600 for non-immigrants) and Greater Sudbury ($51,600 vs. $57,600 for non-immigrants). Immigrants in St. Catharines-Niagara earned the lowest median wage ($36,800 vs. $44,800 for non-immigrants), while immigrants in Toronto earned $48,000 (vs. $60,400 for non-immigrants).[65]
The gap in median wage between core working age immigrants and non-immigrants was the widest in Windsor (immigrants earned 21.6 per cent less than the non-immigrant median wage), followed by Toronto (20.5 per cent less) and St. Catharines-Niagara (17.9 per cent less). These outcomes could reflect differences in local labour market conditions, immigration categories and the industrial distribution of immigrant employment, among other factors.
Figure 6.3 Core working age immigrants earned a lower median income than non-immigrants in all Ontario Census Metropolitan Areas
Note: Shows wages of population aged 25-54 years. The Toronto CMA includes most of the Greater Toronto Area.
Source: Statistics Canada: 2021 Census: Table 98-10-0313-01
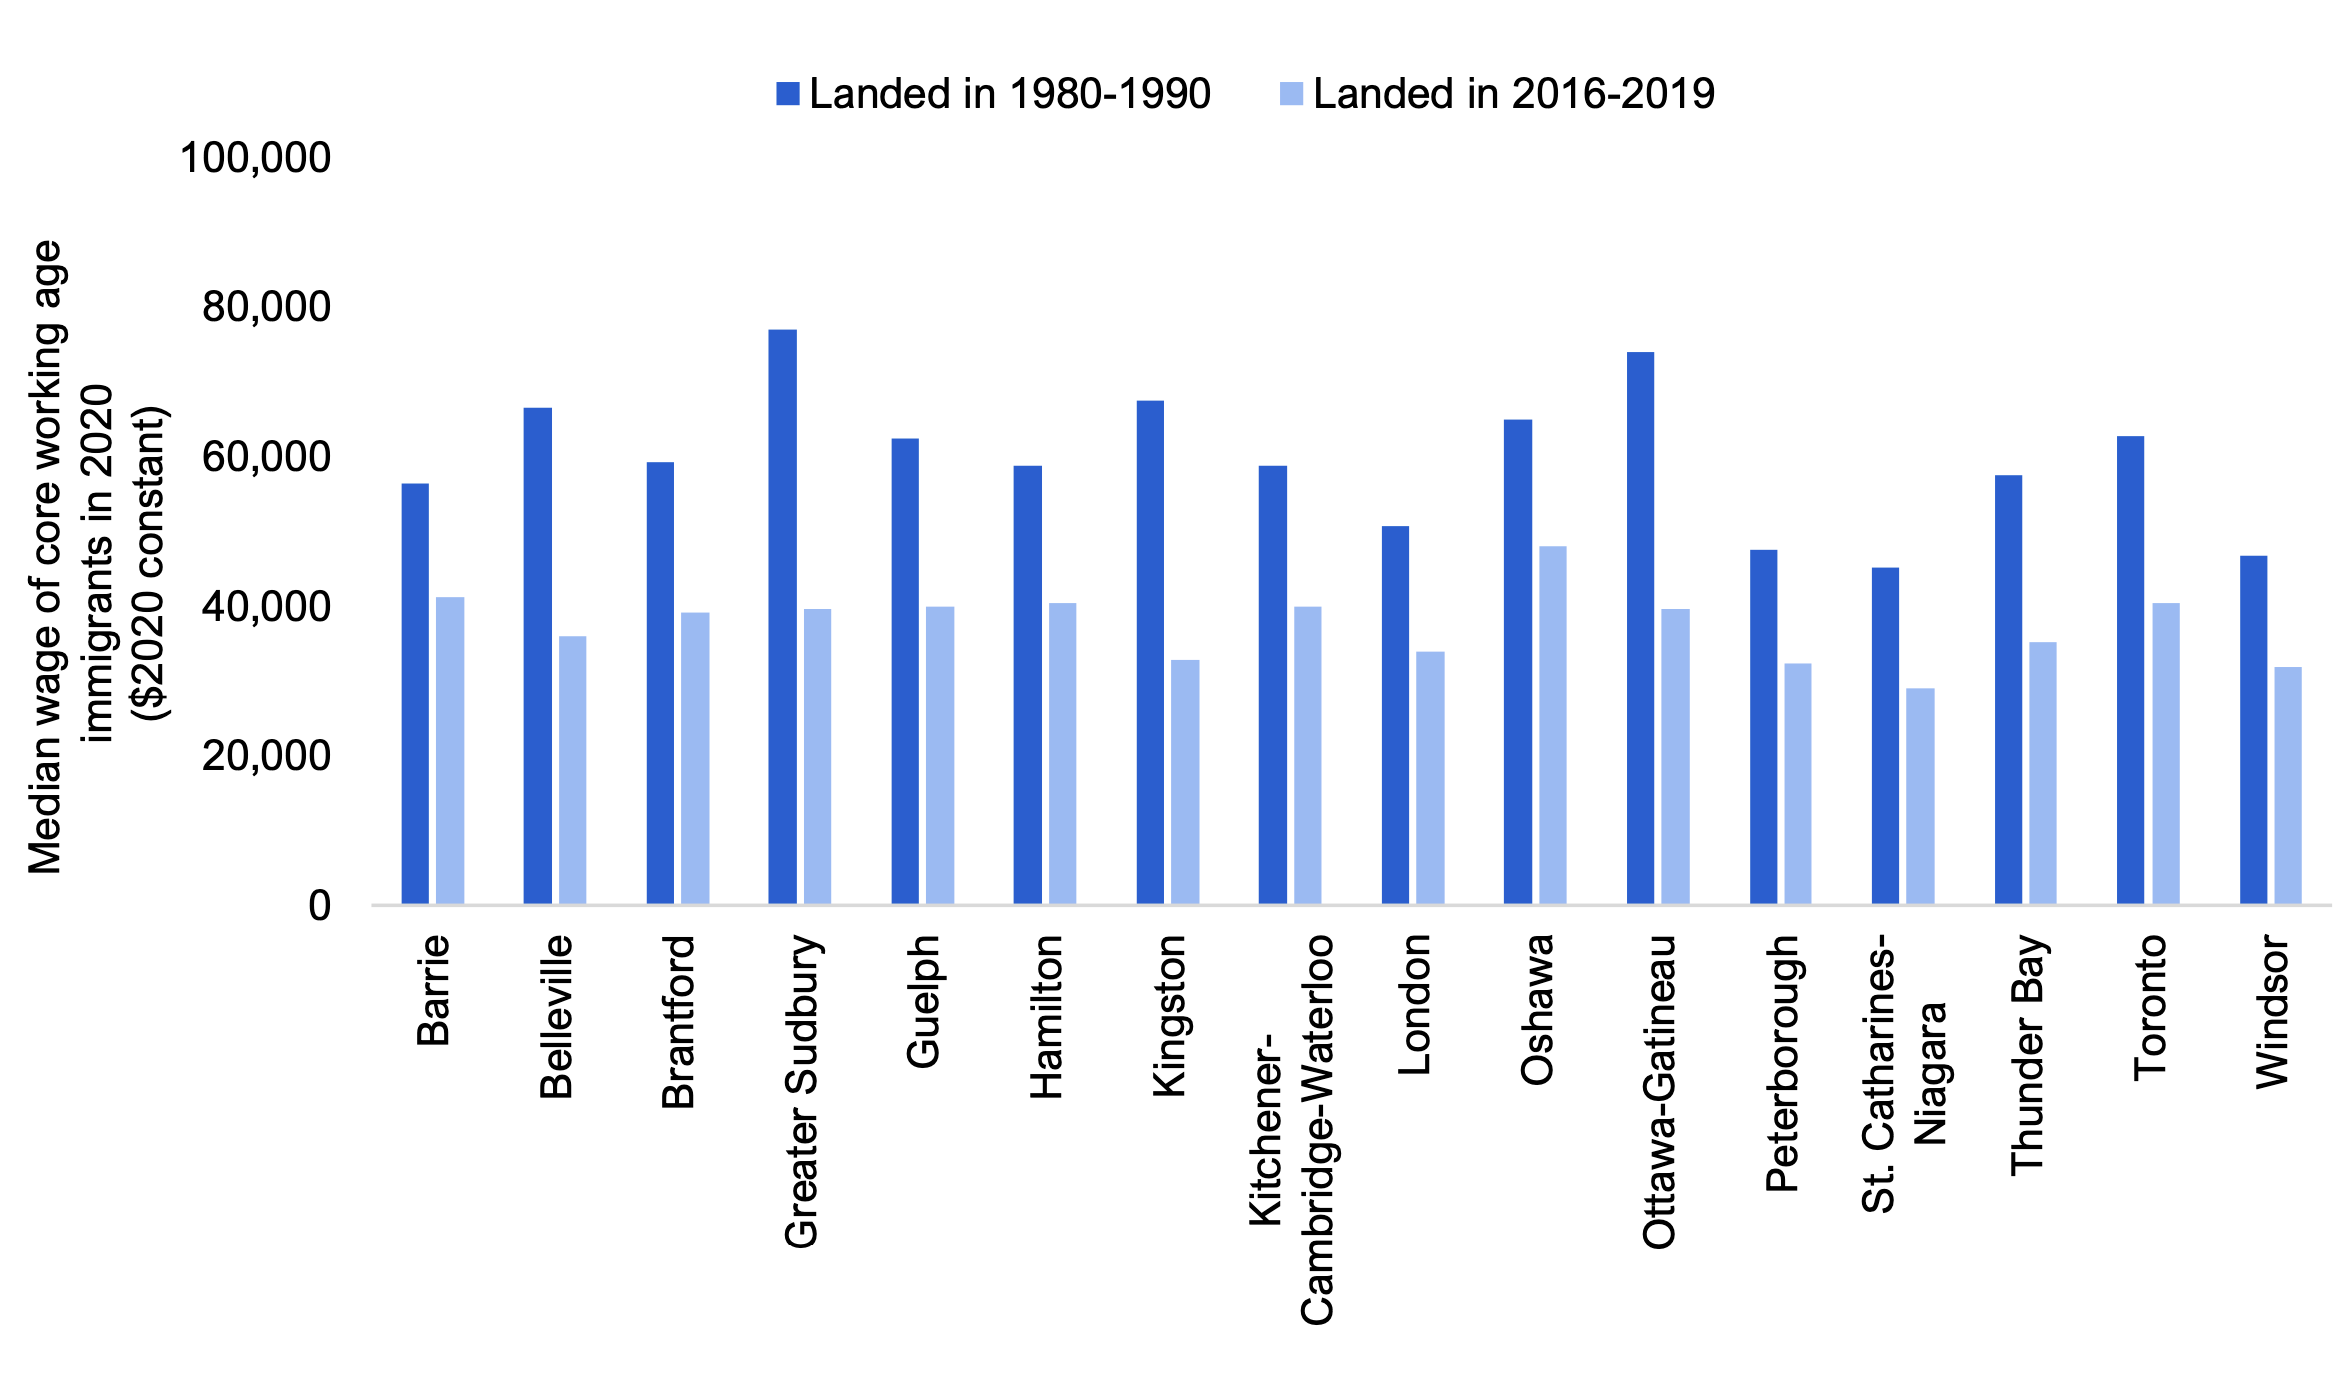
The median wage of immigrants in all CMAs increased with a longer history of settlement. The largest difference[66] in wages between recent immigrants of core working age who landed in 2016-2019 and established immigrants who landed in 1980-1990 was observed in Kingston (established immigrants earned 105.8 per cent more than the median wage of recent immigrants), followed by Greater Sudbury (94.4 per cent more) and Ottawa-Gatineau (86.9 per cent more). Conversely, the smallest difference was observed in Oshawa (35.4 per cent more), reflecting its relatively high median wage of recent immigrants.
Figure 6.4 Median wage of core working age immigrants increased with a longer period of settlement in all Census Metropolitan Areas
Note: Shows wages of population aged 25-54. The Toronto CMA includes most of the Greater Toronto Area.
Source: Statistics Canada: 2021 Census: Table 98-10-0313-01
7. Appendix
| Program | Category | Description | Selection criteria | Number admitted to Ontario in 2016-2021 |
|---|---|---|---|---|
| Worker programs | Skilled workers | Selected for their ability to meet specific labour needs as skilled workers. | Education, language abilities and work experience in management, professional or technical jobs. | 112,225 |
| Caregivers | Provide home child care or assistance for people with care needs. | Experience in Canada as a live-in employee in a private residence during their qualifying period of temporary work. | 32,635 | |
| Canadian experience class | Selected based on Canadian work experience. | Canadian education, language abilities and Canadian work experience in management, professional, or technical jobs. | 86,125 | |
| Skilled trades workers | Selected for their ability to meet labour needs in specific trades. | Education, language abilities and work experience in qualifying skilled trades jobs. Valid offer of employment in a skilled trades occupation by a Canadian employer or a certificate of qualification in a skilled trades occupation issued by a provincial or territorial authority. | 1,360 | |
| Business programs | Entrepreneurs | Selected for their skills and potential to own and manage or to build a qualifying business in Canada. | Minimum net worth and experience of owning and managing a qualifying business in Canada for a determinate period. | 705 |
| Self-employed | Selected on the condition that they can, and intend to, create their own employment in Canada or contribute significantly to the country’s cultural or athletic life. | Experience in cultural activities or athletics. | 955 | |
| Investors | Granted permanent resident status on the condition that they make a substantial investment in Canada. | Minimum net worth and their investment was used in Canada for economic development and job creation. | 5,925 | |
| Provincial nominee program | Nominated by a province or territory for their ability to contribute to the local economy and meet specific labour market and economic development needs. | Education, work experience, specific skills, and the ability to economically establish themselves. The federal government makes the final selection decision, but each participating province and territory determines its own criteria. | 61,570 | |
Graphical Descriptions
| Year | Annual number of immigrants arriving in Ontario | Ontario share of Canadian immigrants (per cent) |
|---|---|---|
| 1980 | 64,536 | 44.9 |
| 1981 | 54,648 | 42.9 |
| 1982 | 57,870 | 42.8 |
| 1983 | 44,951 | 44.3 |
| 1984 | 40,252 | 45.4 |
| 1985 | 40,442 | 48.2 |
| 1986 | 43,158 | 48.7 |
| 1987 | 70,252 | 53.7 |
| 1988 | 85,125 | 55.9 |
| 1989 | 98,070 | 55.2 |
| 1990 | 108,863 | 53.5 |
| 1991 | 115,213 | 52.0 |
| 1992 | 129,706 | 53.1 |
| 1993 | 145,962 | 54.7 |
| 1994 | 120,181 | 51.1 |
| 1995 | 119,730 | 54.2 |
| 1996 | 115,961 | 53.3 |
| 1997 | 119,401 | 53.1 |
| 1998 | 106,419 | 54.7 |
| 1999 | 91,899 | 53.1 |
| 2000 | 116,744 | 56.8 |
| 2001 | 149,998 | 59.4 |
| 2002 | 152,823 | 59.6 |
| 2003 | 109,814 | 55.1 |
| 2004 | 127,944 | 53.5 |
| 2005 | 129,795 | 53.1 |
| 2006 | 133,052 | 52.3 |
| 2007 | 115,439 | 48.5 |
| 2008 | 115,050 | 46.1 |
| 2009 | 105,425 | 43.0 |
| 2010 | 116,586 | 43.1 |
| 2011 | 105,019 | 40.5 |
| 2012 | 101,259 | 38.9 |
| 2013 | 105,878 | 40.2 |
| 2014 | 101,929 | 38.0 |
| 2015 | 89,674 | 37.2 |
| 2016 | 120,132 | 37.2 |
| 2017 | 98,520 | 36.1 |
| 2018 | 132,511 | 43.7 |
| 2019 | 139,108 | 44.4 |
| 2020 | 127,105 | 44.7 |
| 2021 | 107,908 | 47.7 |
| 2022 | 227,424 | 46.1 |
| 2023 | 199,297 | 42.5 |
| Change in Ontario’s labour force (000s) | 2007-2014 | 2015-2022 |
|---|---|---|
| Immigrants | 186.10 | 506.30 |
| Non-immigrants | 292.90 | 124.10 |
| Other* | 0.10 | 175.20 |
| Age distribution of new immigrants in Ontario at time of arrival (per cent) | Period of immigration | Age structure of total population | ||||
|---|---|---|---|---|---|---|
| 1980-1990 | 1991-2000 | 2001-2010 | 2011-2015 | 2016-2022 | 2016-2022 | |
| Children (0-14 years) |
22.0 | 21.8 | 21.9 | 19.2 | 16.4 | 15.6 |
| Youths (15-24 years) |
22.9 | 17.2 | 15.8 | 13.9 | 13.3 | 12.8 |
| Core Working Age (25-54 years) |
43.7 | 52.2 | 55.2 | 55.6 | 62.3 | 40.5 |
| Older Working Age (55-64 years) |
6.6 | 5.2 | 4.1 | 5.6 | 4.0 | 13.7 |
| Seniors (65+ years) |
4.8 | 3.6 | 3 | 5.5 | 4.0 | 17.3 |
| Distribution of core working age immigrants in Ontario in 2021 (per cent) | Total non- immigrants | Total immigrants | Period of immigration | ||||
|---|---|---|---|---|---|---|---|
| 2021 | 2021 | 1980-1990 | 1991-2000 | 2001-2010 | 2011-2015 | 2016-2021 | |
| No certificate, diploma or degree | 6.8 | 8.4 | 9.9 | 9.3 | 8.0 | 8.2 | 7.5 |
| High school diploma or equivalent | 24.2 | 17.7 | 23.3 | 21.0 | 17.2 | 15.2 | 12.5 |
| Postsecondary education below bachelor level | 35.1 | 23.7 | 32.0 | 27.7 | 23.1 | 21.0 | 15.9 |
| Bachelor’s degree or higher | 33.8 | 50.2 | 34.7 | 42.0 | 51.6 | 55.7 | 64.2 |
| Distribution of core working age immigrants in Ontario in 2021 (per cent) | Total immigrants | Period of immigration | ||||
|---|---|---|---|---|---|---|
| 2021 | 1980-1990 | 1991-2000 | 2001-2010 | 2011-2015 | 2016-2021 | |
| With work and study experience | 7.2 | 0.8 | 2.3 | 3.5 | 10.1 | 19.7 |
| With work experience | 9.1 | 1.4 | 4.4 | 6.7 | 15.1 | 17.7 |
| With study experience | 2.8 | 3.1 | 3.7 | 3.5 | 2.1 | 1.2 |
| Other* | 8.7 | 1.6 | 9.6 | 10.4 | 9.1 | 7.7 |
| Without pre-admission experience | 72.1 | 93.0 | 80.0 | 75.8 | 63.5 | 53.8 |
| Distribution of immigrants in Ontario in 2021 (per cent) | Period of immigration | ||||
|---|---|---|---|---|---|
| 1980-1990 | 1991-2000 | 2001-2010 | 2011-2015 | 2016-2021 | |
| Economic immigrants | 43.4 | 46.5 | 53.1 | 54.3 | 51.7 |
| Immigrants sponsored by family | 34.3 | 34.3 | 30.5 | 29.0 | 25.8 |
| Refugees | 21.7 | 18.1 | 14.5 | 14.5 | 20.6 |
| Other immigrants* | 0.6 | 1.2 | 1.9 | 2.2 | 1.9 |
| Distribution of economic immigrants in Ontario in 2021 (per cent) | Period of immigration | ||||
|---|---|---|---|---|---|
| 1980-1990 | 1991-2000 | 2001-2010 | 2011-2015 | 2016-2021 | |
| Skilled worker and skilled trades workers | 84.9 | 83.4 | 84.2 | 56.0 | 37.7 |
| Provincial nominee | 0.0 | 0.0 | 3.4 | 11.9 | 20.4 |
| Canadian experience class | 0.0 | 0.0 | 0.6 | 11.6 | 28.6 |
| Caregiver | 3.8 | 5.3 | 5.7 | 14.2 | 10.8 |
| Business programs | 11.3 | 11.2 | 6.0 | 6.2 | 2.5 |
| Year | Labour participation rate of core working age population in Ontario (per cent) | |||
|---|---|---|---|---|
| Total immigrants | Immigrants, landed five years or less | Immigrants, landed more than 10 years | Total non-immigrants | |
| 2006 | 84.2 | 75.0 | 87.2 | 88.0 |
| 2007 | 84.3 | 75.1 | 87.0 | 88.0 |
| 2008 | 83.6 | 75.7 | 86.8 | 88.4 |
| 2009 | 83.3 | 76.2 | 86.1 | 88.1 |
| 2010 | 83.6 | 76.2 | 86.2 | 87.8 |
| 2011 | 83.0 | 71.4 | 86.3 | 88.0 |
| 2012 | 83.4 | 74.4 | 86.0 | 88.0 |
| 2013 | 83.9 | 74.4 | 86.4 | 88.0 |
| 2014 | 82.6 | 73.2 | 85.0 | 87.5 |
| 2015 | 82.5 | 70.9 | 85.2 | 87.5 |
| 2016 | 82.7 | 72.7 | 85.4 | 87.6 |
| 2017 | 83.7 | 73.6 | 86.7 | 87.6 |
| 2018 | 83.6 | 76.1 | 86.0 | 87.7 |
| 2019 | 83.6 | 74.2 | 86.2 | 88.5 |
| 2020 | 82.4 | 78.4 | 84.3 | 87.3 |
| 2021 | 85.1 | 82.5 | 86.1 | 88.6 |
| 2022 | 86.5 | 85.6 | 87.3 | 89.1 |
| Year | Unemployment rate of core working age population in Ontario (per cent) | |||
|---|---|---|---|---|
| Total immigrants | Immigrants, landed five years or less | Immigrants, landed more than 10 years | Total non-immigrants | |
| 2006 | 6.6 | 11.3 | 5.3 | 4.6 |
| 2007 | 7.0 | 11.7 | 5.8 | 4.5 |
| 2008 | 7.3 | 11.3 | 6.1 | 4.5 |
| 2009 | 10.3 | 14.9 | 8.7 | 6.9 |
| 2010 | 10.0 | 17.2 | 8.5 | 6.3 |
| 2011 | 8.9 | 14.5 | 7.9 | 5.7 |
| 2012 | 8.2 | 13.0 | 7.2 | 5.8 |
| 2013 | 7.7 | 12.6 | 6.6 | 5.7 |
| 2014 | 7.7 | 12.1 | 6.5 | 5.3 |
| 2015 | 6.2 | 10.2 | 5.4 | 5.2 |
| 2016 | 6.4 | 10.9 | 5.3 | 4.9 |
| 2017 | 6.2 | 9.0 | 5.5 | 4.6 |
| 2018 | 5.5 | 8.7 | 4.8 | 4.3 |
| 2019 | 5.3 | 9.3 | 4.4 | 4.1 |
| 2020 | 9.6 | 12.6 | 8.7 | 6.9 |
| 2021 | 7.9 | 8.3 | 7.4 | 5.9 |
| 2022 | 5.5 | 8.8 | 4.7 | 4.0 |
| Total non-immigrants | Total immigrants | Period of immigration | ||
|---|---|---|---|---|
| 1980-1990 | 2016-2021 | |||
| Overqualification rate of core working age population in 2021 (per cent) | 9.6 | 15.9 | 8.5 | 19.6 |
| Distribution of core working age employees by industry in Ontario in 2021 (per cent) | Non-immigrants | Immigrants | |
|---|---|---|---|
| Services | Professional, scientific and technical | 8.6 | 12.8 |
| Health care and social assistance | 13.3 | 12.3 | |
| Retail trade | 9.0 | 9.0 | |
| Finance and insurance, management of companies and enterprises | 5.7 | 8.8 | |
| Transportation and warehousing | 4.0 | 7.5 | |
| Education | 9.7 | 5.7 | |
| Accommodation and food | 3.7 | 5.0 | |
| Administrative and support, waste management and remediation | 4.0 | 4.7 | |
| Public administration | 8.5 | 4.0 | |
| Other (except public administration) | 3.9 | 3.9 | |
| Wholesale trade | 3.3 | 3.4 | |
| Information and culture | 2.6 | 2.6 | |
| Real estate and rental and leasing | 1.7 | 2.3 | |
| Arts, entertainment and recreation | 2.0 | 0.9 | |
| Goods | Manufacturing | 8.4 | 9.8 |
| Construction | 8.7 | 6.5 | |
| Utilities | 1.0 | 0.4 | |
| Agriculture, forestry, fishing and hunting | 1.2 | 0.4 | |
| Mining, quarrying, and oil and gas extraction | 0.7 | 0.1 | |
| Distribution of core working age immigrant employees by industry in Ontario in 2021 (per cent) | Landed in 1980-1989 | Landed in 2016-2021 | |
|---|---|---|---|
| Services | Professional, scientific and technical | 10.3 | 18.0 |
| Finance and insurance, management of companies and enterprises | 8.5 | 9.7 | |
| Retail trade | 8.4 | 9.4 | |
| Health care and social assistance | 11.8 | 8.8 | |
| Transportation and warehousing | 5.9 | 7.8 | |
| Administrative and support, waste management and remediation | 4.1 | 5.7 | |
| Accommodation and food | 3.4 | 5.4 | |
| Education | 6.5 | 4.8 | |
| Other (except public administration) | 3.6 | 3.4 | |
| Wholesale trade | 4.0 | 3.4 | |
| Information and culture | 2.8 | 3.0 | |
| Public administration | 6.4 | 1.8 | |
| Real estate and rental and leasing | 2.3 | 1.2 | |
| Arts, entertainment and recreation | 1.0 | 0.8 | |
| Goods | Manufacturing | 12.5 | 10.1 |
| Construction | 7.3 | 5.8 | |
| Agriculture, forestry, fishing and hunting | 0.6 | 0.4 | |
| Utilities | 0.6 | 0.3 | |
| Mining, quarrying, and oil and gas extraction | 0.1 | 0.1 | |
| Distribution of core working age employees in Ontario in 2021 (per cent) | Total non-immigrants | Total immigrants | Period of immigration | ||||
|---|---|---|---|---|---|---|---|
| 2021 | 2021 | 1980-1990 | 1991-2000 | 2001-2010 | 2011-2015 | 2016-2021 | |
| Management occupations | 14.1 | 12.5 | 15.5 | 13.4 | 12.0 | 10.9 | 10.8 |
| Professional occupations (usually requiring a university degree) | 23.5 | 26.9 | 24.0 | 26.2 | 26.6 | 25.5 | 31.2 |
| Occupations usually requiring community college/apprenticeship | 38.2 | 33.7 | 35.2 | 34.4 | 34.7 | 34.9 | 29.5 |
| Occupations usually requiring secondary school or less | 24.2 | 26.9 | 25.4 | 26.0 | 26.7 | 28.7 | 28.4 |
| Year | Median wage in Ontario ($2020 constant) | ||
|---|---|---|---|
| Immigrants one year after admission | Immigrants 15 years after admission | Total population* | |
| 1981 | 36,300 | ||
| 1982 | 23,600 | 34,300 | |
| 1983 | 20,900 | 33,500 | |
| 1984 | 19,500 | 34,800 | |
| 1985 | 19,800 | 35,300 | |
| 1986 | 20,900 | 37,600 | |
| 1987 | 23,600 | 38,000 | |
| 1988 | 27,700 | 40,000 | |
| 1989 | 27,700 | 39,900 | |
| 1990 | 24,900 | 37,500 | |
| 1991 | 20,200 | 36,400 | |
| 1992 | 19,000 | 36,800 | |
| 1993 | 19,300 | 36,800 | |
| 1994 | 19,100 | 37,200 | |
| 1995 | 18,500 | 37,500 | |
| 1996 | 17,900 | 40,100 | 38,000 |
| 1997 | 18,100 | 42,500 | 37,900 |
| 1998 | 19,700 | 41,000 | 39,000 |
| 1999 | 20,900 | 41,600 | 39,300 |
| 2000 | 22,100 | 41,000 | 39,500 |
| 2001 | 21,400 | 40,800 | 39,000 |
| 2002 | 19,100 | 41,100 | 39,100 |
| 2003 | 18,600 | 40,400 | 38,000 |
| 2004 | 18,200 | 39,700 | 37,100 |
| 2005 | 18,700 | 38,600 | 38,400 |
| 2006 | 19,100 | 38,200 | 38,000 |
| 2007 | 19,400 | 37,200 | 37,800 |
| 2008 | 20,300 | 36,300 | 39,000 |
| 2009 | 18,900 | 36,200 | 37,600 |
| 2010 | 19,400 | 37,100 | 37,500 |
| 2011 | 20,600 | 36,700 | 37,500 |
| 2012 | 20,600 | 38,400 | 37,900 |
| 2013 | 20,400 | 39,100 | 37,700 |
| 2014 | 20,900 | 40,000 | 38,500 |
| 2015 | 25,500 | 41,000 | 38,500 |
| 2016 | 26,200 | 41,400 | 38,700 |
| 2017 | 26,600 | 39,100 | |
| 2018 | 32,400 | 39,700 | |
| 2019 | 33,600 | 39,800 | |
| 2020 | 31,800 | 39,500 | |
| Total non-immigrants | Total immigrants | Period of immigration | |||||
|---|---|---|---|---|---|---|---|
| 2020 | 2020 | 1980-1990 | 1991-2000 | 2001-2010 | 2011-2015 | 2016-2019 | |
| Median wage of core working age population in Ontario in 2020 ($2020 constant) | 56,000 | 48,400 | 61,600 | 52,800 | 47,200 | 41,600 | 40,000 |
| Year | Median wage in Ontario one year after admission ($2020 constant) | ||||
|---|---|---|---|---|---|
| Skilled worker and skilled trades | Canadian experience class | Provincial nominee | Caregiver | Total population | |
| 1982 | 42,100 | 34,300 | |||
| 1983 | 36,600 | 18,200 | 33,500 | ||
| 1984 | 30,300 | 19,500 | 34,800 | ||
| 1985 | 28,100 | 20,100 | 35,300 | ||
| 1986 | 30,100 | 22,400 | 37,600 | ||
| 1987 | 31,700 | 24,200 | 38,000 | ||
| 1988 | 38,500 | 26,000 | 40,000 | ||
| 1989 | 42,800 | 29,800 | 39,900 | ||
| 1990 | 39,900 | 30,500 | 37,500 | ||
| 1991 | 31,800 | 28,800 | 36,400 | ||
| 1992 | 26,800 | 25,900 | 36,800 | ||
| 1993 | 28,600 | 22,400 | 36,800 | ||
| 1994 | 28,800 | 22,400 | 37,200 | ||
| 1995 | 27,100 | 22,600 | 37,500 | ||
| 1996 | 26,800 | 21,900 | 38,000 | ||
| 1997 | 27,300 | 21,800 | 37,900 | ||
| 1998 | 30,200 | 22,700 | 39,000 | ||
| 1999 | 32,100 | 23,900 | 39,300 | ||
| 2000 | 34,500 | 25,600 | 39,500 | ||
| 2001 | 33,500 | 35,100 | 26,100 | 39,000 | |
| 2002 | 27,200 | 29,300 | 24,000 | 39,100 | |
| 2003 | 26,500 | 31,900 | 25,300 | 38,000 | |
| 2004 | 25,700 | 26,600 | 25,500 | 37,100 | |
| 2005 | 27,400 | 23,300 | 24,800 | 38,400 | |
| 2006 | 27,600 | 27,400 | 26,600 | 38,000 | |
| 2007 | 30,100 | 28,500 | 25,400 | 37,800 | |
| 2008 | 32,600 | 24,000 | 25,800 | 39,000 | |
| 2009 | 30,100 | 27,600 | 23,600 | 37,600 | |
| 2010 | 28,000 | 46,700 | 33,600 | 23,600 | 37,500 |
| 2011 | 26,900 | 53,300 | 32,000 | 24,100 | 37,500 |
| 2012 | 26,800 | 54,200 | 36,300 | 22,900 | 37,900 |
| 2013 | 24,100 | 54,700 | 44,100 | 26,200 | 37,700 |
| 2014 | 25,300 | 58,000 | 48,900 | 26,200 | 38,500 |
| 2015 | 28,800 | 62,000 | 46,000 | 26,400 | 38,500 |
| 2016 | 34,300 | 65,900 | 47,400 | 27,800 | 38,700 |
| 2017 | 44,900 | 59,400 | 46,800 | 28,200 | 39,100 |
| 2018 | 40,700 | 58,500 | 49,200 | 31,300 | 39,700 |
| 2019 | 46,000 | 59,900 | 45,800 | 30,600 | 39,800 |
| 2020 | 42,200 | 60,100 | 41,500 | 28,600 | 39,500 |
| Distribution of population in Ontario in 2021 (per cent) | Total non-immigrants | Total immigrants | Period of immigration | ||||
|---|---|---|---|---|---|---|---|
| 2021 | 2021 | 1980-1990 | 1991-2000 | 2001-2010 | 2011-2015 | 2016-2021 | |
| Toronto | 32.1 | 68.1 | 68.9 | 74.4 | 73.2 | 70.4 | 67.0 |
| Ottawa-Gatineau | 8.7 | 6.3 | 6.1 | 6.2 | 6.1 | 7.0 | 8.2 |
| Hamilton | 5.9 | 4.7 | 4.5 | 4.0 | 4.1 | 4.3 | 4.5 |
| Other* | 53.3 | 20.9 | 20.4 | 15.4 | 16.6 | 18.3 | 20.2 |
| Average retention rate in Ontario 10 years after admission, 2007-2010 cohorts (per cent) | |
|---|---|
| Toronto | 82.1 |
| Ottawa-Gatineau | 69.1 |
| Kitchener-Cambridge-Waterloo | 63.7 |
| Windsor | 63.2 |
| Hamilton | 63.2 |
| London | 60.5 |
| St. Catharines-Niagara | 60.1 |
| Brantford | 54.9 |
| Guelph | 54.6 |
| Thunder Bay | 52.8 |
| Oshawa | 48.0 |
| Barrie | 46.8 |
| Kingston | 46.7 |
| Belleville | 43.1 |
| Greater Sudbury | 42.7 |
| Peterborough | 42.6 |
| Median wage of core working age population in 2020 ($2020 constant) | Non-immigrants | Immigrants |
|---|---|---|
| Barrie | 52,400 | 46,000 |
| Belleville | 49,200 | 48,000 |
| Brantford | 50,800 | 46,800 |
| Greater Sudbury | 57,600 | 51,600 |
| Guelph | 57,200 | 47,600 |
| Hamilton | 56,800 | 49,200 |
| Kingston | 51,600 | 48,800 |
| Kitchener-Cambridge-Waterloo | 56,000 | 47,600 |
| London | 50,800 | 43,200 |
| Oshawa | 57,600 | 54,000 |
| Ottawa-Gatineau | 67,000 | 55,600 |
| Peterborough | 47,200 | 46,000 |
| St. Catharines-Niagara | 44,800 | 36,800 |
| Thunder Bay | 52,400 | 46,800 |
| Toronto | 60,400 | 48,000 |
| Windsor | 50,000 | 39,200 |
| Median wage of core working age immigrants in 2020 ($2020 constant) | Landed in 1980-1990 | Landed in 2016-2019 |
|---|---|---|
| Barrie | 56,400 | 41,200 |
| Belleville | 66,500 | 36,000 |
| Brantford | 59,200 | 39,200 |
| Greater Sudbury | 77,000 | 39,600 |
| Guelph | 62,400 | 40,000 |
| Hamilton | 58,800 | 40,400 |
| Kingston | 67,500 | 32,800 |
| Kitchener-Cambridge-Waterloo | 58,800 | 40,000 |
| London | 50,800 | 34,000 |
| Oshawa | 65,000 | 48,000 |
| Ottawa-Gatineau | 74,000 | 39,600 |
| Peterborough | 47,600 | 32,400 |
| St. Catharines-Niagara | 45,200 | 29,000 |
| Thunder Bay | 57,600 | 35,200 |
| Toronto | 62,800 | 40,400 |
| Windsor | 46,800 | 31,800 |
Footnotes
[1] In this report, recent immigrants refer to those who landed five years ago or less or in the most recent period of immigration in the 2021 Census (2016 and later), unless noted otherwise.
[2] Includes wages, salaries, and commissions. Does not include investment income, employment insurance benefits, and social welfare benefits. Median incomes of individuals are calculated for those with income. For more information on the data collection and processing methods in the 2021 Census, see Income Reference Guide, Census of Population, 2021, Statistics Canada.
[3] Immigrants who have been in Canada for one year, are employed and earn wages.
[4] In this report, all median wage figures are expressed in 2020 constant dollars to remove the effects of inflation.
[5] Toronto refers to the Toronto Census Metropolitan Area (CMA), which includes most of the Greater Toronto Area.
[6] As defined by Statistics Canada, other immigrants include those who have been granted permanent resident status based on humanitarian and compassionate considerations or for public policy reasons, and those under a program not classified in any other category.
[7] Figures for national planned permanent resident admissions for 2022 released by Immigration, Refugees and Citizenship Canada increased from 361,000 in the 2020-2022 Immigration Levels Plan to over 431,000 in the 2022-2024 Immigration Levels Plan.
[8] Statistics Canada: Labour Force Survey: Table 14-10-0083-01.
[9] Statistics Canada: Annual Demographic Estimates: Table 17-10-0014-01.
[10] In this report, recent immigrants refer to those who landed five years ago or less, or in the most recent period of immigration in the 2021 Census (in the period 2016 and later), unless noted otherwise.
[11] Statistics Canada: Annual Demographic Estimates: Table 17-10-0005-01.
[12] Immigrants make up the largest share of the population in over 150 years and continue to shape who we are as Canadians, Statistics Canada, 2022; and Population Projections for Canada, Provinces and Territories, 2021 to 2068, Statistics Canada, 2022. Immigration is expected to modestly slow but not stop the ongoing trend of population aging in Ontario as the immigrant population also ages and immigrants’ dependents include older relatives.
[13] Statistics Canada: 2021 Census: Table 98-10-0309-01.
[14] Statistics Canada: 2021 Census: Table 98-10-0435-01.
[15] Two-step Immigration Selection: An Analysis of its Expansion in Canada, Feng Hou, Eden Crossman and Garnett Picot, Statistics Canada, 2020.
[16] Statistics Canada: 2021 Census: Table 98-10-0318-01.
[17] For details on economic immigrant categories, see Appendix Table 7.1 and the Classification of admission category of immigrants, Statistics Canada.
[18] Statistics Canada: 2021 Census: Table 98-10-0318-01.
[19] The decline in the number of immigrants accepted as federal skilled workers and the increase in immigrants admitted under the provincial nominee program since its inception can be explained by provincial nominee program applicants receiving priority processing over federal skilled workers. The increase in the number of immigrants accepted under the Canadian experience class can be attributed to a policy shift in recent decades to recruit more immigrants who have Canadian education and work experience, based on research suggesting that immigrants who have spent time in their new country prior to settling have better labour market outcomes than newcomers without prior experience. For more information on the redistribution of new immigrants towards the Canadian experience class and provincial nominee program, see Two-step Immigration Selection: An Analysis of its Expansion in Canada, Feng Hou, Eden Crossman and Garnett Picot, Statistics Canada, 2020.
[20] Skilled trades workers are also admitted through the Canadian experience class and provincial nominee program. See The labour market outcomes of economic immigrants in the skilled trades, Feng Hou, Garnett Picot and Li Xu, Statistics Canada, 2021.
[21] The Human Capital Model of Selection and the Long-run Economic Outcomes of Immigrants, Garnett Picot, Feng Hou and Theresa Qiu, Statistics Canada, 2014; and Changing Immigrant Characteristics and Entry Earnings, Feng Hou and Garnett Picot, Statistics Canada, 2016.
[22] This rate is defined as the number of people in the labour force divided by the population.
[23] Statistics Canada’s Labour Force Survey data on immigrants’ labour force participation rate and unemployment rate is available starting in 2006.
[24] Statistics Canada: Labour Force Survey: Table 14-10-0083-01.
[25] Migration restrictions during the pandemic affected recent immigrants. Over the 2020-2022 period, the core working age recent immigrant labour force increased by 29.1 per cent, faster than the 11.9 per cent rise in its population. As a result, the labour force participation rate of recent immigrants increased over the period.
[26] Statistics Canada: 2021 Census: Table 98-10-0443-01.
[27] Persistent overqualification among immigrants and non-immigrants, Louis Cornelissen and Martin Turcotte, Statistics Canada, 2020; Adults with a health education but not working in health occupations, Feng Hou and Christoph Schimmele, Statistics Canada, 2020; and The contribution of immigrants and population groups designated as visible minorities to nurse aide, orderly and patient service associate occupations, Martin Turcotte and Katherine Savage, Statistics Canada, 2020.
[28] Over-education and Life Satisfaction among Immigrant and Non-immigrant Workers in Canada, Kristyn Frank and Feng Hou, Statistics Canada, 2017.
[29] Evaluation of the Foreign Credential Recognition Program, Employment and Social Development Canada, 2022.
[30] Statistics Canada: 2021 Census: Public Use Microdata Files. Numbers may differ from figures in Statistics Canada’s official tables when they are released.
[31] Introduction to the National Occupational Classification (NOC) 2021 Version 1.0, Statistics Canada, which includes the new Training, Education, Experience and Responsibility (TEER) categorization of occupations. TEER categories 1-4, which range from occupations that usually require a university degree to occupations that usually require a high school diploma or several weeks of on-the-job training, reflect typical or usual education requirements and/or several years experience in related occupations. Professional occupations are equivalent to TEER 1 occupations.
[32] The Human Capital Model of Selection and the Long-run Economic Outcomes of Immigrants, Garnett Picot, Feng Hou and Theresa Qiu, Statistics Canada, 2014.
[33] Includes wages, salaries and commissions. Does not include investment income, employment insurance benefits, and social welfare benefits. Median incomes of individuals are calculated for those with income. For more information on the data collection and processing methods in the 2021 Census, see Income Reference Guide, Census of Population, 2021, Statistics Canada.
[34] Statistics Canada: Longitudinal Immigration Database: Tables 43-10-0009-01 and 43-10-0026-01, and Statistics Canada: Canadian Income Survey: Table 11-10-0239-01.
[35] In this report, all median wage figures are expressed in 2020 constant dollars to remove the effects of inflation.
[36] Immigrant labour market outcomes during recessions: Comparing the early 1990s, late 2000s and COVID-19 recessions, Feng Hou and Garnett Picot, Statistics Canada, 2022.
[37] For an overview of factors that impacted immigrant earnings, see Are the gaps in labour market outcomes between immigrants and their Canadian-born counterparts starting to close?”, Eden Crossman, Feng Hou and Garnett Picot, Statistics Canada, 2021.
[38] Policy changes include the creation of the Canadian experience class and Federal Skilled Trades Program (FSTP), and revisions to the point allocation system for education, language requirements and work experience. For an overview of policy changes and labour market outcomes, see Are the gaps in labour market outcomes between immigrants and their Canadian-born counterparts starting to close?”, Eden Crossman, Feng Hou and Garnett Picot, Statistics Canada, 2021; Changing Immigrant Characteristics and Entry Earnings, Feng Hou and Garnett Picot, Statistics Canada, 2016; and Two-step Immigration Selection: Recent Trends in Immigrant Labour Market Outcomes, Feng Hou, Eden Crossman and Garnett Picot, Statistics Canada, 2020.
[39] Statistics Canada: 2021 Census: Table 98-10-0313-01.
[40] Statistics Canada: 2021 Census: Table 98-10-0313-01.
[41] Expressed in percentage terms.
[42] For an analysis of the earnings penalty experienced by Ontario mothers, see the FAO’s report, Women in Ontario’s Labour Market.
[43] Labour Market Outcomes of Immigrant Women who Arrive as Dependants of Economic Immigrant Principal Applicants, Aneta Bonikowska and Feng Hou, Statistics Canada, 2017.
[44] Immigrant labour market outcomes during recessions: Comparing the early 1990s, late 2000s and COVID-19 recessions, Feng Hou and Garnett Picot, Statistics Canada, 2022.
[45] The Human Capital Model of Selection and the Long-run Economic Outcomes of Immigrants, Garnett Picot, Feng Hou and Theresa Qiu, Statistics Canada, 2014.
[46] Statistics Canada: 2021 Census: Table 98-10-0313-01.
[47] Canadian postsecondary education and labour market outcomes of 2010 economic immigrants to Canada, George Marshall and Eric Fecteau, Statistics Canada, 2023; and Canadian Economics Research on Immigration Through the Lens of Theories of Justice: Section 4.3: Explanations for the Downturn in Immigrant Earnings, David A. Green and Christopher Worswick, 2017. The country of study for postsecondary education and skill transferability across country-specific education systems are important factors in the labour market outcomes of internationally educated and trained immigrants. For example, see Location of Study and the Labour Market Success of Immigrants to Canada, Jacques Ewoudou, Statistics Canada, 2015.
[48] Statistics Canada: 2021 Census: Table 98-10-0313-01.
[49] See page 8 and Appendix Table 7.1 for a description of worker programs.
[50] Statistics Canada: Longitudinal Immigration Database: Tables 43-10-0010-01 and 43-10-0026-01, and Statistics Canada Table 11-10-0239-01.
[51] Two-step Immigration Selection: Why Did Immigrant Labour Market Outcomes Vary by Admission Programs?, Feng Hou, Eden Crossman and Garnett Picot, Statistics Canada, 2020; The Improved Labour Market Performance Of New Immigrants to Canada, 2006-2019, Kimberly Wong, Centre for the Study of Living Standards, 2020; The Labour Market Outcomes of Economic Immigrants in the Skilled Trades, Feng Hou, Garnett Picot and Li Xu, Statistics Canada, 2021.
[52] TEER 0 and 1 occupations in the National Occupation Classification (NOC) 2021.
[53] Statistics Canada: 2021 Census: Table 98-10-0316-01.
[54] Longitudinal Immigration Database: Immigrants' income trajectories during the initial years since admission, Statistics Canada, 2021.
[55] Immigration selection factors and the earnings of economic principal applicants, Garnett Picot, Li Xu, Feng Hou and Aneta Bonikowska, Statistics Canada, 2022.
[56] Statistics Canada: Longitudinal Immigration Database: Table 43-10-0026-01.
[57] Toronto CMA includes most of the Greater Toronto Area.
[58] Ontario cities included in this report are based on Statistics Canada’s Census Metropolitan Areas (CMAs). Statistics Canada defines a CMA as a large population centre together with adjacent fringe and rural areas that have a high degree of social and economic integration with the centres. A CMA must have a population of at least 100,000.
[59] Statistics Canada: 2021 Census: Table 98-10-0318-01 and 98-10-0347-01.
[60] Except Kitchener-Cambridge-Waterloo.
[61] Economic Immigrants in Gateway Cities: Factors Involved in Their Initial Location and Onward Migration Decisions, Marc Frenette, Statistics Canada, 2018; Changes in the Regional Distribution of New Immigrants to Canada, Aneta Bonikowska, Feng Hou and Garnett Picot, Statistics Canada, 2015.
[62] Economic Immigrants in Gateway Cities: Factors Involved in Their Initial Location and Onward Migration Decisions, Marc Frenette, Statistics Canada, 2018.
[63] Statistics Canada: Longitudinal Immigration Database: Table 43-10-0022-01.
[64] The retention rate defined by Statistics Canada refers to the percentage of immigrant tax filers continuing their residence in the geographical area (province or census metropolitan area as designated) of intended destination geography each year. This does not include immigrants migrating in from another destination.
[65] Statistics Canada: 2021 Census: Table 98-10-0313-01.
[66] Expressed in percentage terms.