

List of Abbreviations
Abbreviation Long Form
- EI
- Employment Insurance
- FAO
- Financial Accountability Office
- GDP
- Gross Domestic Product
- IMF
- International Monetary Fund
- OECD
- Organisation for Economic Co-operation and Development
- SPSDM
- Social Policy Simulation Database and Model
- UCCB
- Universal Child Care Benefit
- US
- United States
i. Purpose and scope
This report provides a summary of recent trends in personal incomes in Ontario, consistent with the FAO’s mandate to examine trends in the provincial economy for members of provincial parliament and the public.
Assessing shifts in income is an important element in understanding the extent to which the material standard of living of all Ontarians is improving. How have the benefits of Ontario’s economic growth been shared across the population? Since incomes are determined by both market earnings and government taxes and transfers, assessing the role of the tax and transfer system is also important.
In addition to examining the existing data on income growth and distribution, this report presents new data on the evolution of income mobility in Ontario. To what extent do Ontarians switch places on the income ladder? Are inequalities in income becoming more permanent over time?
This report cannot explore every issue in detail; instead, it highlights some of the broader trends in personal incomes. In addition, there are a variety of factors that have influenced trends in personal incomes over time, and it is beyond the scope of this report to describe them all in detail. The FAO welcomes feedback on this report, as well as suggestions for related work in the future.
Note
This report draws on a variety of data sources that are available over different time periods. While the report focuses primarily on the post-2000 period, full datasets are displayed wherever possible.
All dollar figures presented in this report are in constant (inflation adjusted) 2016 dollars, unless otherwise noted.
ii. Summary
This report assesses trends in the personal income of Ontarians across three broad areas: growth, distribution and mobility.
Chapter 1 examines the growth in incomes for Ontario families. It shows that between 2000 and 2016, the after-tax income of the median [1] Ontario family grew only modestly.[2]
Ontario’s median income is still higher than the average for all other provinces.[3] However, during this period, Ontario recorded the slowest growth in median family income among all provinces by a wide margin. This was the case for both market income (that is, income before taxes and transfers), as well as after-tax income.
Ontario’s median income growth slowest among provinces between 2000 and 2016
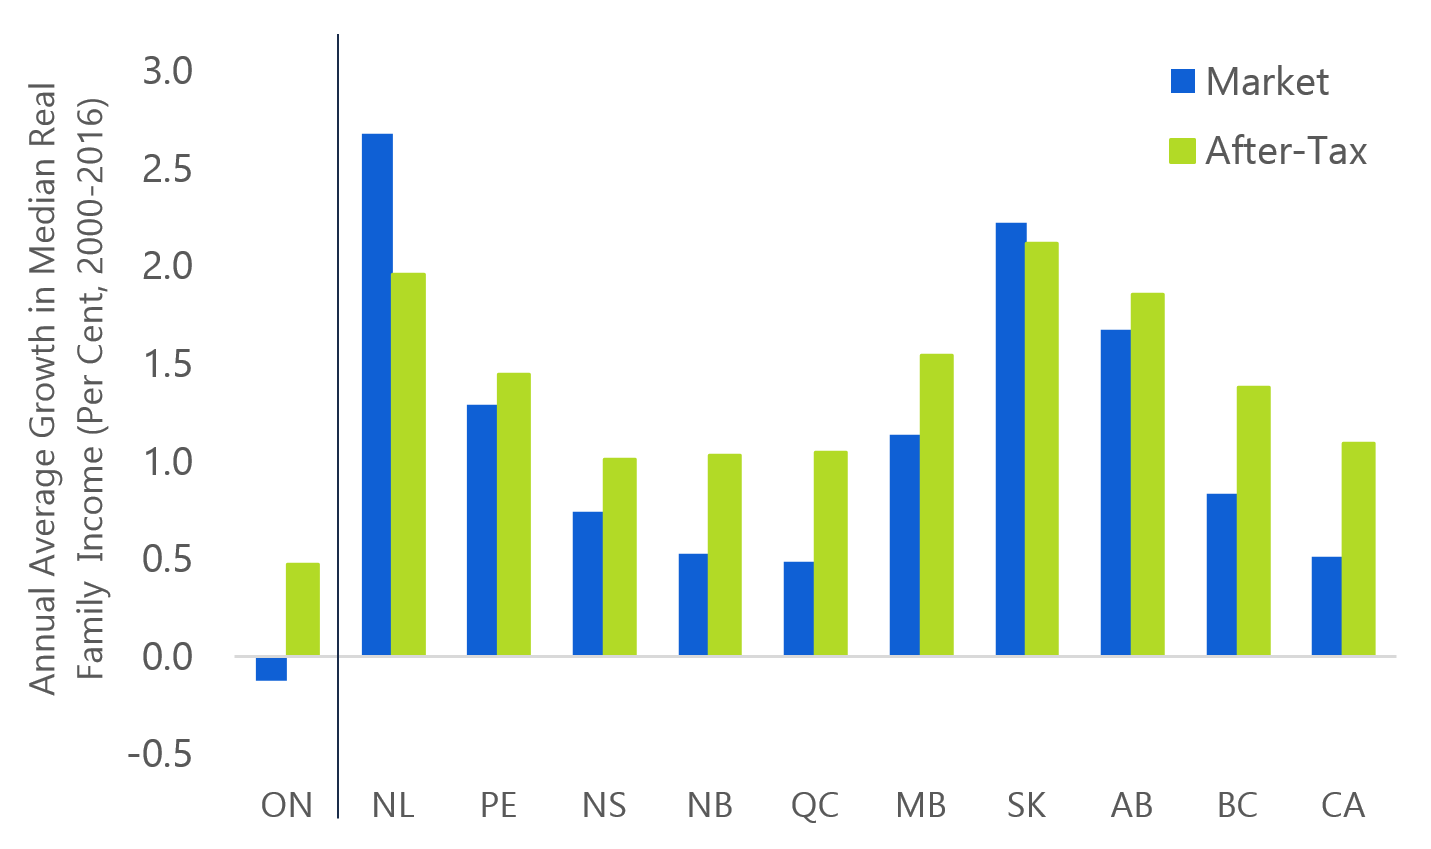
Source: Statistics Canada Canadian Income Survey and FAO.
Notably, lower-income Ontario families experienced slower income growth than higher-income families. At the same time, certain family types experienced outright declines in their after-tax income since 2000, particularly working-age people living alone and single-parent families.
After 2000, market income inequality grew while after-tax inequality remained constant
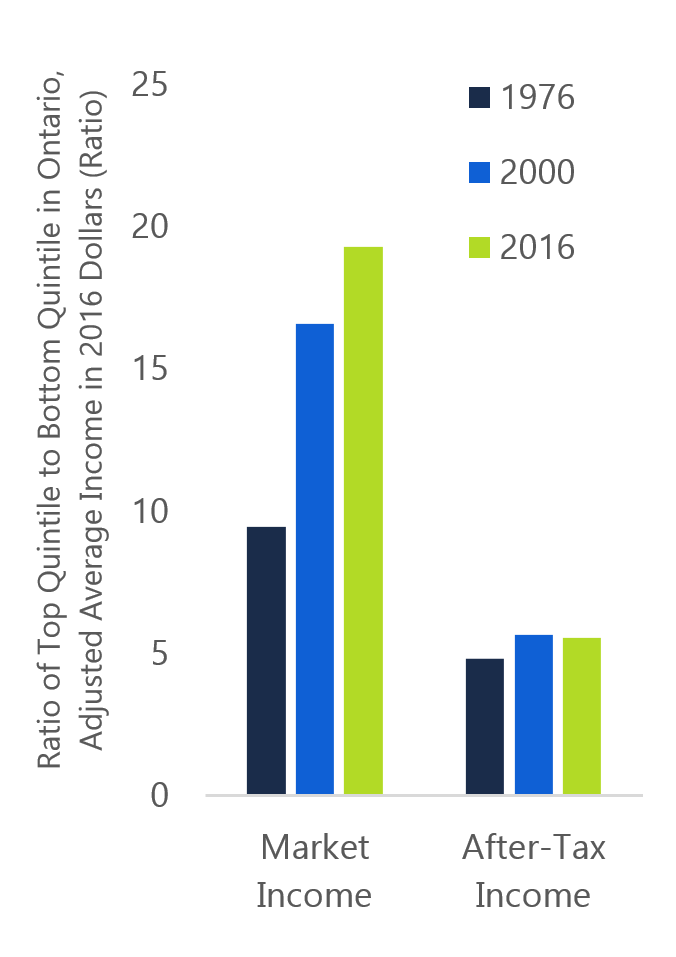
Source: Statistics Canada Canadian Income Survey and FAO.
Chapter 2 provides a discussion of recent trends in the distribution of income in Ontario. Since 2000, the inequality of market income has increased modestly. In 2016, the average market income of the top quintile[4] was roughly 19 times higher than that of the bottom quintile. This was up from 16 times higher in 2000.
However, the tax and transfer system[5] has played an important role in reducing income inequality in Ontario. On an after-tax basis, the average income of the top quintile was roughly five times higher than that of the bottom quintile in 2016, unchanged since 2000.
In 2016, the tax and transfer system in Ontario reduced income inequality by almost 30 per cent.[6] Ontario’s income taxes and social assistance programs contributed more than a third of this reduction in income inequality, while federal taxes and transfers accounted for the remaining two-thirds.
Ontario’s after-tax income inequality is similar to other provinces and in line with the average across Organisation for Economic Co-operation and Development (OECD) countries. However, the tax and transfer system in Ontario redistributes less income per capita compared to most other OECD countries.
Chapter 3 presents a discussion of trends in the income mobility of Ontarians and focuses on two measures: relative mobility and intergenerational mobility.
‘Relative income mobility’ measures the extent to which an individual’s position in the income distribution changes over time.[7] New data from Statistics Canada show that relative income mobility has steadily declined in Ontario.
Significantly, the data suggest that it is becoming harder for lower-income Ontarians to move up the income distribution. For middle-income Ontarians, the risk of downward mobility has increased. At the same time, fewer higher-income Ontarians are falling out of high income.
Achieving upward mobility has become more challenging in Ontario
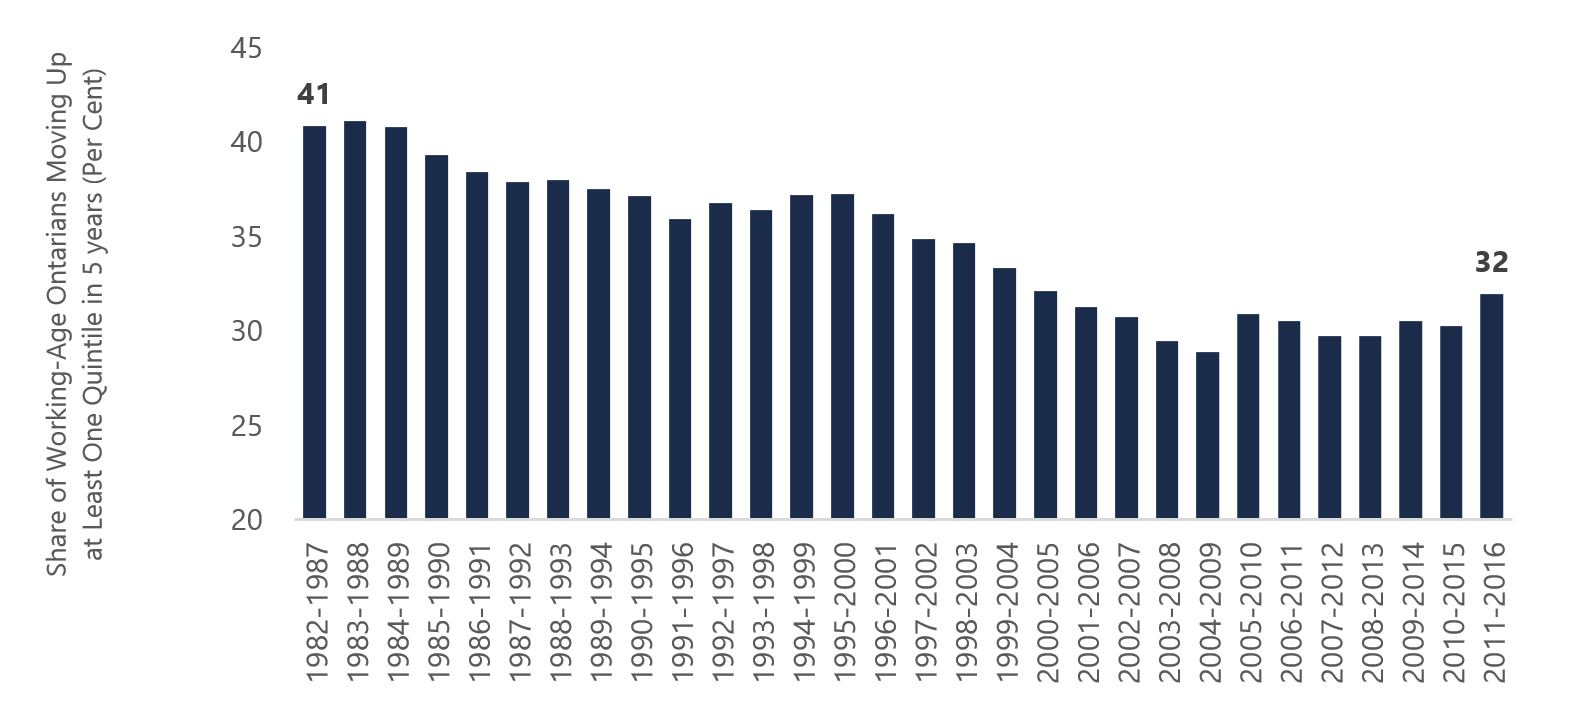
Source: Statistics Canada Longitudinal Administrative Databank custom tabulation and FAO.
The decline in relative income mobility indicates that the income distribution in Ontario has become more entrenched over the last 35 years. As the share of Ontarians trading places on the income ladder has declined, the differences in income have become more permanent, reinforcing existing income inequalities.
Chapter 3 also explores ‘intergenerational income mobility’; this measures the extent to which a family’s economic position in one generation influences the economic position of their children in adulthood.
In Ontario, as in the rest of Canada, children of higher-income parents are more likely to become high-income earners themselves when they reach adulthood. Similarly, children raised in lower-income families are more likely to become lower-income earners.[8]
Ontarians continue to enjoy relatively high intergenerational income mobility compared to other advanced economies. OECD research indicates that key contributors to intergenerational income mobility include high quality and universally accessible education and health care, as is the case in Ontario, coupled with a strong tax and transfer system.
Chapter 4 examines the apparent break in the link between economic growth and gains in the median incomes of working-age Ontarians.
Between 1981 and 2016, output per worker in Ontario has grown by 49 per cent.[9] Over this same period, the average market earnings of working-age Ontarians increased by 19 per cent. In sharp contrast, the market income of the median, working-age Ontarian increased by just 3 per cent.
Economic growth did not raise the median income of working-age Ontarians
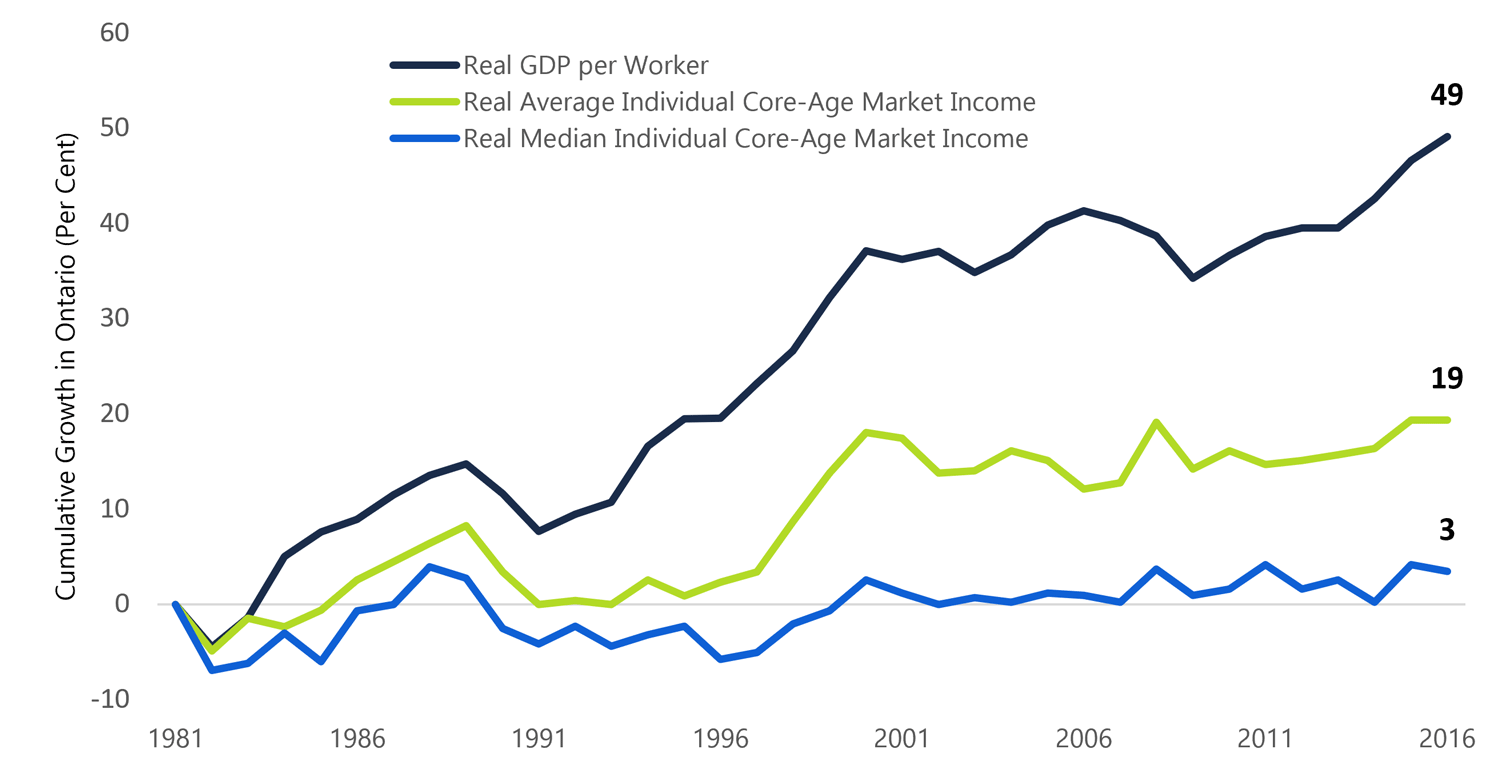
Real Gross Domestic Product (GDP) per worker is calculated as real GDP divided by the labour force.
Source: Statistics Canada Labor Force Survey, Income and Expenditure Accounts, Canadian Income Survey and FAO.
The stronger growth of average market income, compared with the median, implies that Ontarians in the upper half of the income distribution are benefiting from much stronger income growth than those in the lower half (as explored in Chapter 2). However, the even stronger gains in economy-wide income imply that the income being generated through economic growth is not being broadly shared with all Ontarians.
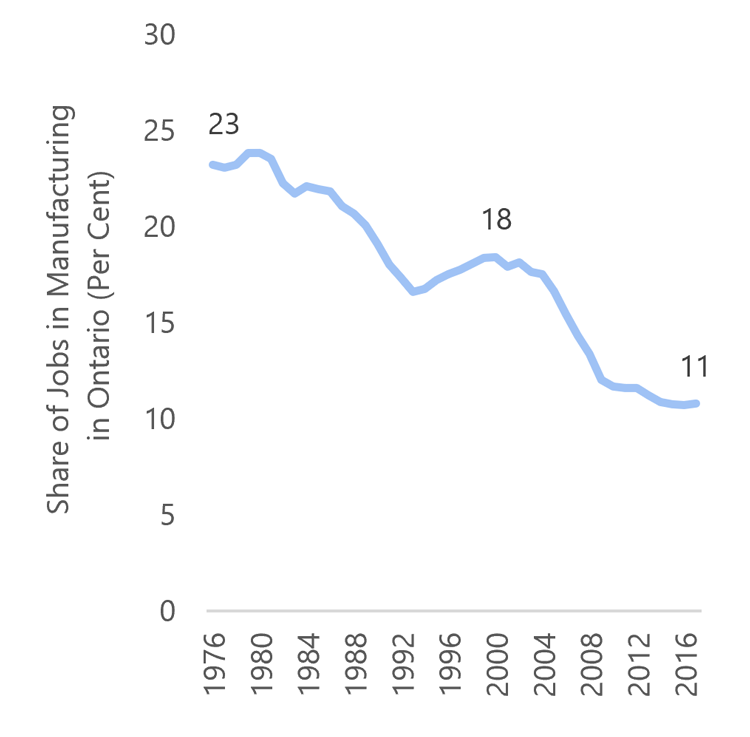
Dramatic decline in manufacturing jobs
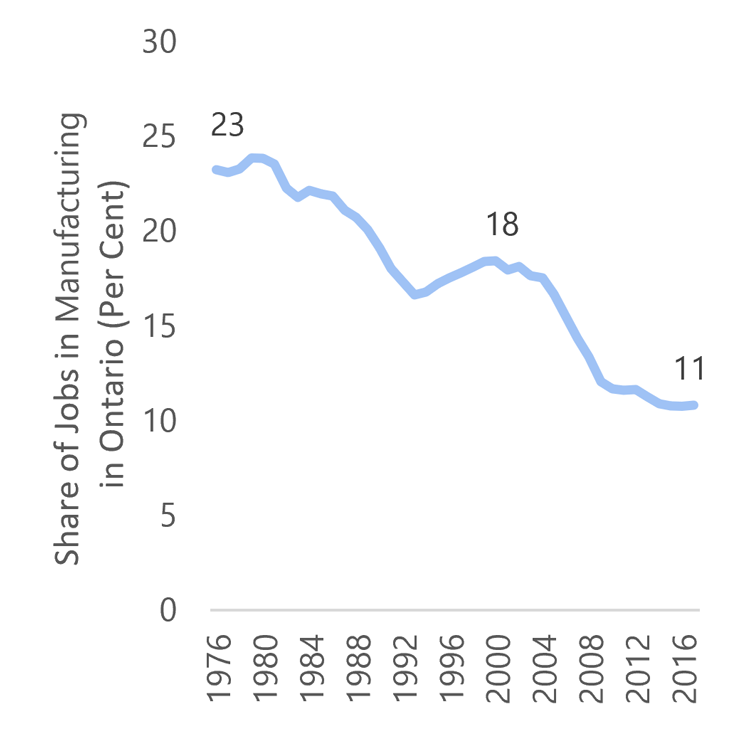
Source: Statistics Canada Labour Force Survey.
Chapter 4 goes on to examine two broad, inter-related areas of structural change that have contributed to these trends in Ontario incomes.
The first is a significant shift in Ontario’s industrial composition. The experience of Ontario’s manufacturing sector has been particularly dramatic, where employment has declined from a high of 1.1 million in 2004 to about 770,000 jobs in 2017. Manufacturing currently accounts for just over one in 10 Ontario jobs, down from almost one in four jobs in the late 1970s.
According to the OECD, the increased integration of the global economy has contributed to a similar shift in the industrial composition of many developed economies.
Export industries in high-wage, developed countries are increasingly competing with firms in developing, low-wage economies, leading to the “offshoring” of labour-intensive tasks, particularly in manufacturing. In addition, the sharp appreciation of the Canadian dollar during the 2000s presented additional competitiveness challenges for Ontario’s exporting industries.
The second broad development in Ontario’s economy involves structural changes that have occurred in Ontario’s labour market. Non-standard work, including part-time and temporary jobs, has become increasingly common, while the share of unionized jobs has declined.
The OECD notes that these labour market changes have contributed to slower income growth, rising income inequality and declining income mobility in many developed economies. Importantly, the pay gap between standard employment and non-standard work is much wider in Canada than the average across OECD countries.
These two factors – Ontario’s shifting industrial composition, coupled with an evolving labour market – have resulted in significant changes to the nature of work in Ontario. In addition, dramatic scientific advances, particularly in information technologies, have contributed to increased automation in many industries and occupations. Taken together, these trends have led to uneven wage growth among occupations in Ontario.
Ontario’s growing wage premium in higher-skilled jobs (2000-2017)
.png)
Source: Statistics Canada Labour Force Survey and FAO.
Since 2000, average wages for the highest-paying occupations outpaced more modest wage gains in middle-paying jobs. In contrast, average wages for the lowest-paying occupations have stagnated, except for natural resource-based occupations.
Recent research by the International Monetary Fund (IMF) and the OECD[10] has shown that slower income growth, higher income inequality and declining income mobility can be mutually reinforcing trends.
When children in lower-income families have fewer opportunities and face greater challenges in acquiring skills and education, their future potential may go unrealized. This can lower their potential productivity and reduce future economic growth, which in turn lowers income gains and ultimately reinforces income inequality.
OECD research has also shown that these trends can negatively impact overall well-being, and in particular the well-being of lower-income citizens. It can also negatively impact social cohesion and civic engagement. This, in turn, can undermine confidence in public institutions and discourage democratic participation.
In Ontario, slow income growth for lower-income families, an unequal distribution of market incomes and reduced income mobility raise important questions about the appropriate role of government in ensuring that all individuals have access to similar opportunities to improve their economic circumstances.
1. Income Growth
Summary
- Between 2000 and 2016, the market income (before taxes and government transfers) of the median[11] Ontario family declined after adjusting for inflation. When income taxes and government transfers are included, median family income in Ontario increased only modestly during the same period.
- During this period, the incomes of the poorest 40 per cent of Ontario families increased much more slowly than the incomes of the richest 40 per cent of Ontario families. Families with a higher incidence of low income, particularly working-age people living alone and single-parent families, experienced absolute declines in their real after-tax income.
- Median after-tax income in Ontario was higher than the average for all other provinces in 2016. However, Ontario recorded the slowest growth in median family in
Family income in Ontario
In 2016, there were 13.8 million people living in 5.7 million families[12] in Ontario. In total, these families earned $447 billion in market income, and received an additional $63 billion in government transfers.
Definitions of income
In this report, market income refers to earnings from employment, investment returns, private pension income and other sources, but excludes taxes and government transfers. After-tax income is defined as market income plus government transfers less taxes paid.
All dollar figures presented in this report are in constant (inflation adjusted) 2016 dollars, unless otherwise noted.
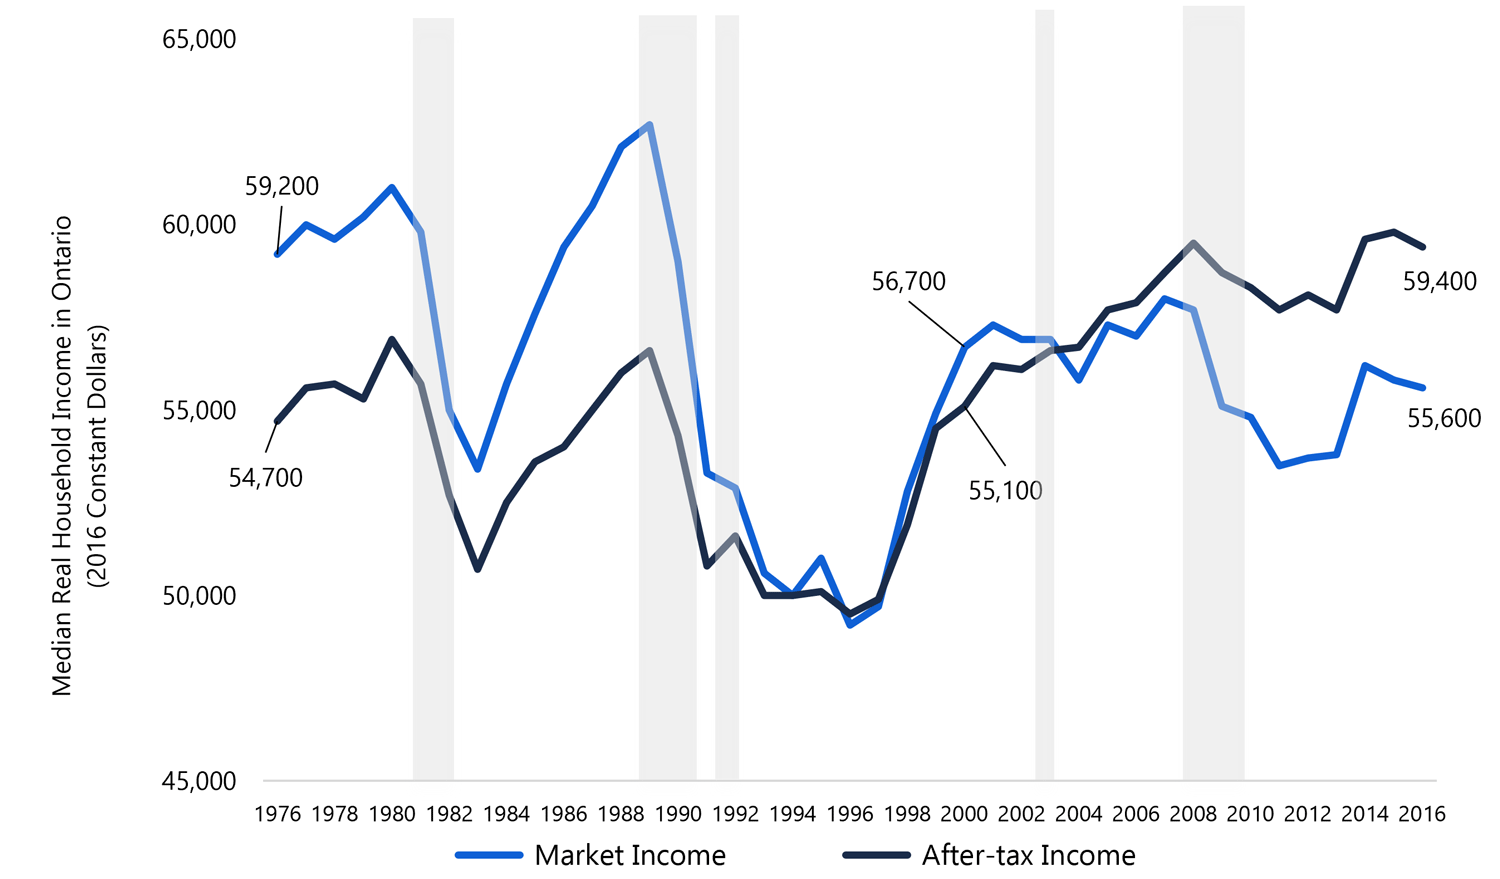
Based on Statistics Canada’s Canadian Income Survey[13], the market income of the median14 Ontario family (the family at the mid-point of the income distribution) was $55,600 in 2016, an increase of roughly $2,000 (or almost 4 per cent) since 2011, as incomes continued to recover from the 2008-2009 recession.
However, in 2016, median market income for Ontario families remained more than $1,000 below its level in 2000 (Figure 1.1).
Figure 1.1Family market income lower than in 2000
Note: Shaded areas indicate recession.
Source: Statistics Canada Canadian Income Survey and FAO.
In the 25 years before 2000, median family income in Ontario experienced dramatic swings. During the recessions of the early 1980s and 1990s, it declined significantly, then recovered partially during the boom of the late 1990s. Notably, the market income of the median Ontario family in 2016 remained below its level in 1976, after adjusting for inflation.
Including government transfers and taxes, median family income in 2016 was $59,400, about $3,800 higher than median market income. After-tax median family income declined during and following the 2009 recession, but has since recovered to reach new highs. Since 2000, the median after-tax income of Ontario families has increased at an average annual pace of 0.5 per cent.
Since 2000, changes in median income in Ontario have been influenced by many overlapping factors.
- Ontario’s aging population is resulting in a shift in the composition of income; the importance of employment income is declining, while the importance of retirement and investment income is increasing.
- The average family size has gradually declined, and more individuals are living alone.
- Working-age Ontarians have experienced relatively slower growth in employment income.
- Governments have made a number of changes to the tax and transfer system, largely focused on supporting the incomes of Canadians and Ontarians in the middle of the income distribution.
These factors are explored in turn.
Ontario’s aging population is changing the composition of income
Ontarians receive income from a variety of sources, including employment, investments, private retirement savings and government transfers.
In 2016:
- Ontarians earned 72 per cent of their total income through employment or self-employment, largely in the form of wages and salaries;
- returns from private retirement savings, investments and other private income accounted for 15 per cent of total income; and
- transfers from the federal and provincial governments – including Old Age Security, Guaranteed Income Supplement, Canada Pension Plan, child benefits, Employment Insurance and social assistance – accounted for 12 per cent of total income.
Figure 1.2Employment earnings comprise smaller share of income
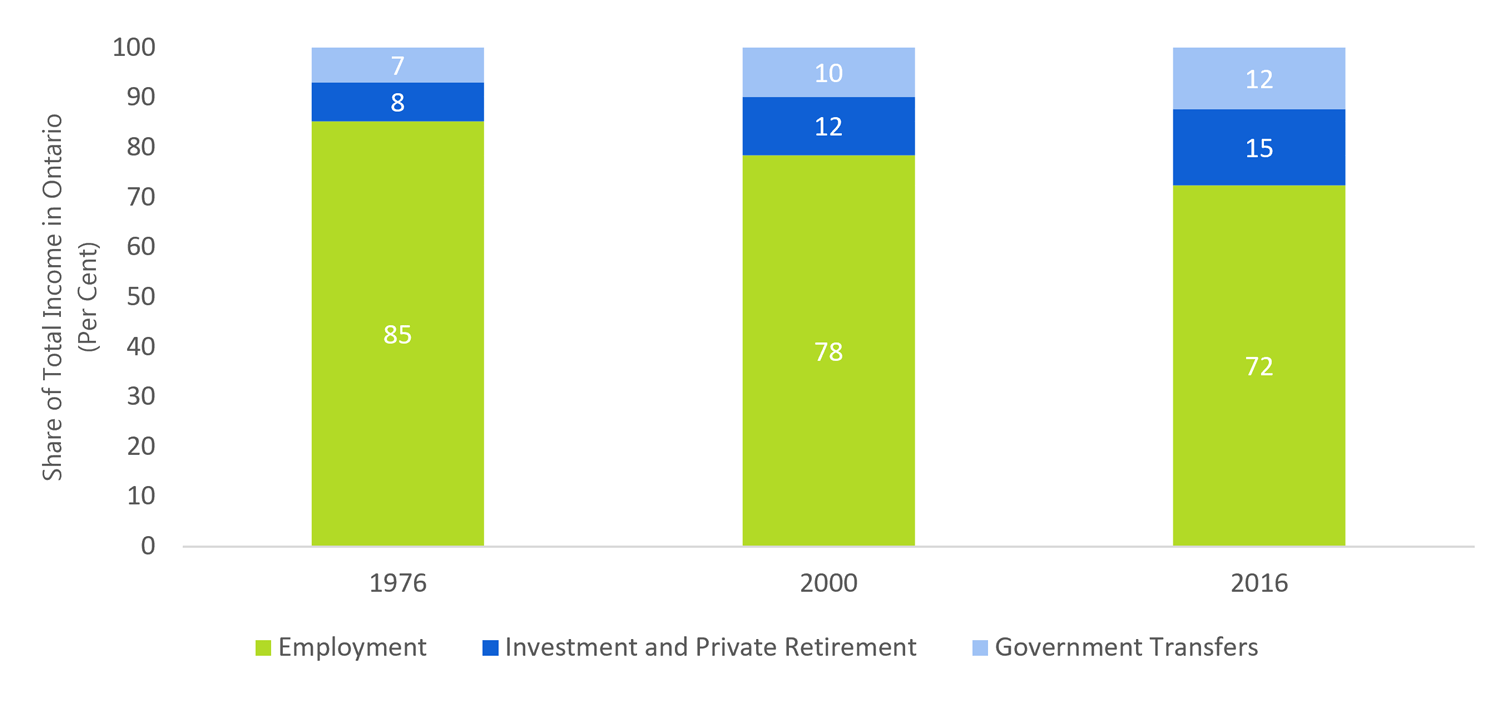
Note: Numbers may not add up due to rounding.
Source: Statistics Canada Canadian Income Survey and FAO.
The composition of income has evolved over the past four decades. The rising proportion of Ontario seniors has increased the share of income earned from investments, retirement income and government transfers. At the same time, the share of employment income has decreased from 85 per cent of total income in 1976 to 72 per cent in 2016 (Figure 1.2).
The average family size has declined
Figure 1.3Rising Share of Single-Person Families
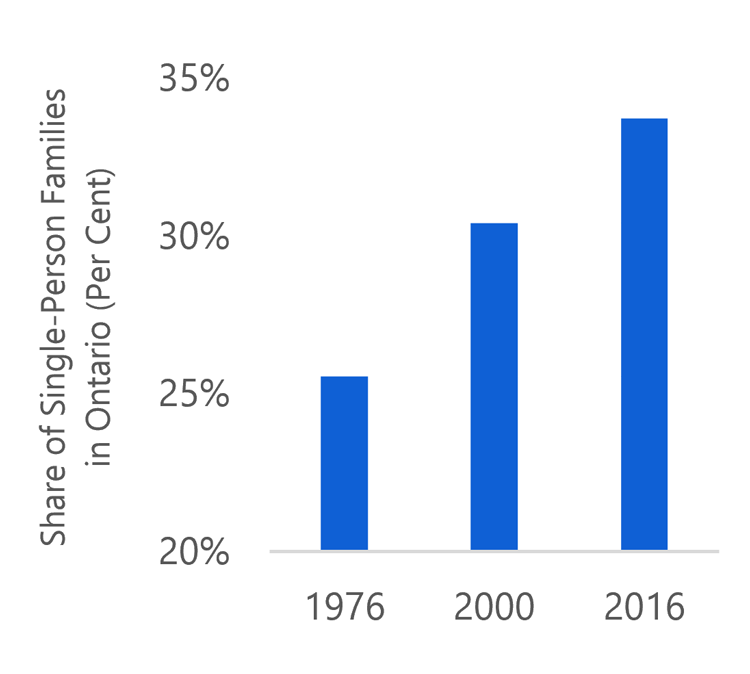
Source: Statistics Canada Canadian Income Survey and FAO.
Trends in family incomes over the past four decades reflect not only an aging population and significant changes in the labour market, but also ongoing shifts in the structure and make-up of Ontario families.
Since 1976, Ontario experienced a gradual decline in the average family size, while more individuals are living alone. The share of single-person families increased from 26 per cent in 1976 to 30 per cent in 2000, and continued increasing to 34 per cent in 2016.
The evolving make-up of Ontario families has also included:
- an increase in dual-income families, as women have entered the workforce in increasing numbers, a trend that has also coincided with a narrowing in the gender pay gap[15];
- an increase in the number of multi-generational and non-traditional families[16]; and
- a trend towards adolescents and adult children living with parents for longer periods of time.
These demographic shifts have contributed to changes in family incomes over the past several decades. As a result, caution should be used when comparing historical family incomes with more recent values.
Growth in employment income has slowed for working-age Ontario families
Figure 1.4Growth in employment income of working-age Ontarians
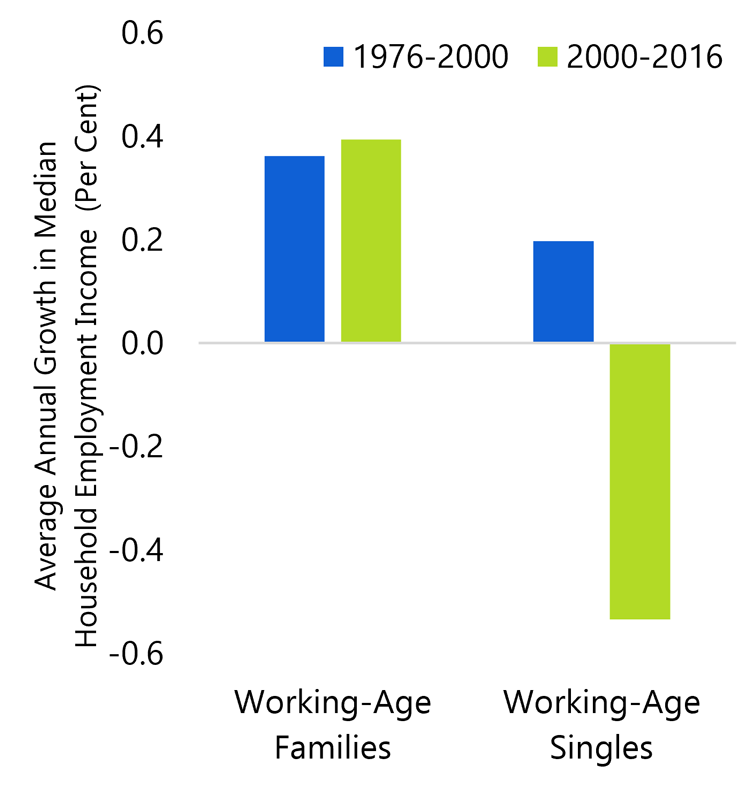
Source: Statistics Canada Canadian Income Survey and FAO.
Ontario families (both multi-person families and individuals) can be divided into those headed by a senior aged 65 and older and working-age families in which the family head is aged 64 or younger. Focusing on working-age families can largely control for the effect of Ontario’s aging population and better isolate the impact of changes in the labour market on overall income growth.
The median employment income of working-age families has grown slowly since 2000. Specifically, employment income of working-age families increased at an annual average rate of 0.4 per cent before and after 2000.
However, for working-age singles living alone, modest employment income gains in the period prior to 2000 have reversed, with median employment income declining by 0.5 per cent since 2000 (Figure 1.4).
The slowdown in employment income growth in the post-2000 period reflects three factors: the significant restructuring of Ontario’s economy; associated changes in the labour market; and a generally slower pace of economic growth that occurred during this period. The underlying economic factors that contributed to this weak growth since 2000 are analyzed further in Chapter 4.
Changes to the tax and transfer system have supported median after-tax incomes
As noted at the outset of this chapter, the median market income of Ontario families declined between 2000 and 2016, while median after-tax income increased modestly. The modest growth in after-tax incomes partly reflects changes to the tax and transfer system that benefited middle-income Ontarians.
The tax and transfer system includes both federal and provincial income taxes as well as social benefit programs administered by all levels of government. The Ontario government collects about 40 per cent of personal income taxes paid by Ontario residents.
However, most major transfers are administered by the federal government. They include the Canada Pension Plan, Old Age Security, Guaranteed Income Supplement, Employment Insurance and child benefits.
The Ontario government administers two primary social assistance programs: the Ontario Disability Support Program and the Ontario Works Program, as well as other smaller transfers. Combined, Ontario’s social assistance payments accounted for 17 per cent of total government transfers to Ontario families in 2016.
Figure 1.5Ontario Government plays a smaller, but key role in the tax and transfer system
Source: Statistics Canada and FAO.
The increasing role of government programs in supporting median family income is partly a reflection of Ontario’s aging population (and rising CPP payments in particular). However, it also reflects enhancements to government income support programs, as well as a number of tax changes that benefited middle-income Ontarians.
These tax changes have included:
- a number of reductions to Ontario personal income taxes, particularly in the late 1990s,[17] and more recently in 2010,[18] as well as
- reductions to federal personal income taxes, particularly in the early 2000s and again in the early 2010s.[19]
The combined effect of these and other tax changes has lowered the median tax burden for middleincome Ontario families.
Figure 1.6Median income tax has declined
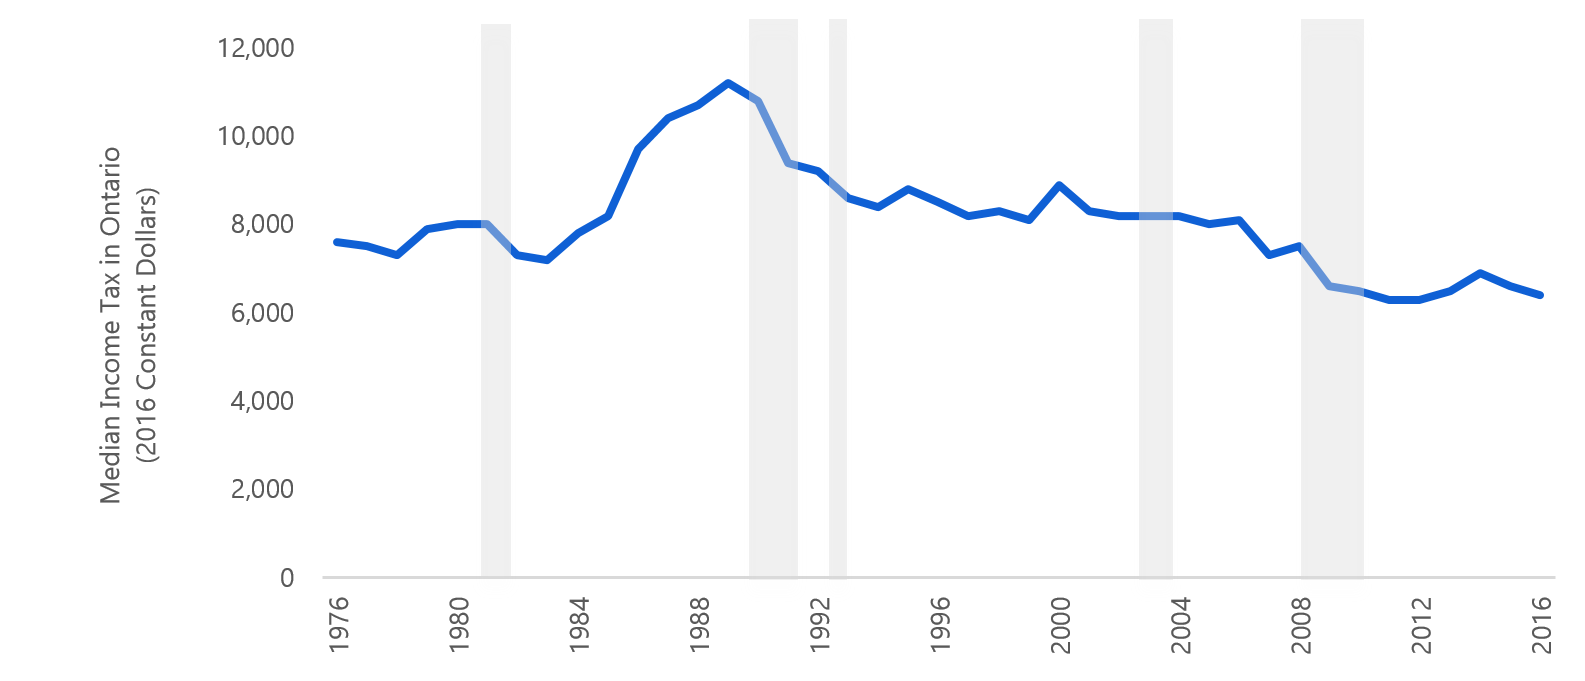
Note: This represents the 50th percentile amount of income tax paid by Ontario families. Shaded areas indicate recession.
Source: Statistics Canada Canadian Income Survey and FAO
In addition, both the provincial and federal governments have made changes to social transfer programs.
These include:
- The federal government’s introduction of the Universal Child Care Benefit (UCCB) in 2006, which provided all families with a monthly payment for each child under the age of six.[20] In 2016, the federal government replaced the UCCB with the Canada Child Benefit, which provides monthly, tax-free payments to families with children under 18, targeted to low- and middle-income families.[21]
- The federal government’s extension of Employment Insurance benefits in 2010.[22]
Taken together, changes to government transfers have raised the amount of government-funded income support for middle-income Ontario families.
Figure 1.7Government transfers to median family have increased
Note: This represents the 50th percentile amount of government transfers received by Ontario families. Shaded areas indicate recession.
Source: Statistics Canada’s Canadian Income Survey and FAO.
After-tax income gains have not been uniform across families
Figure 1.8Solid growth in after-tax income for families
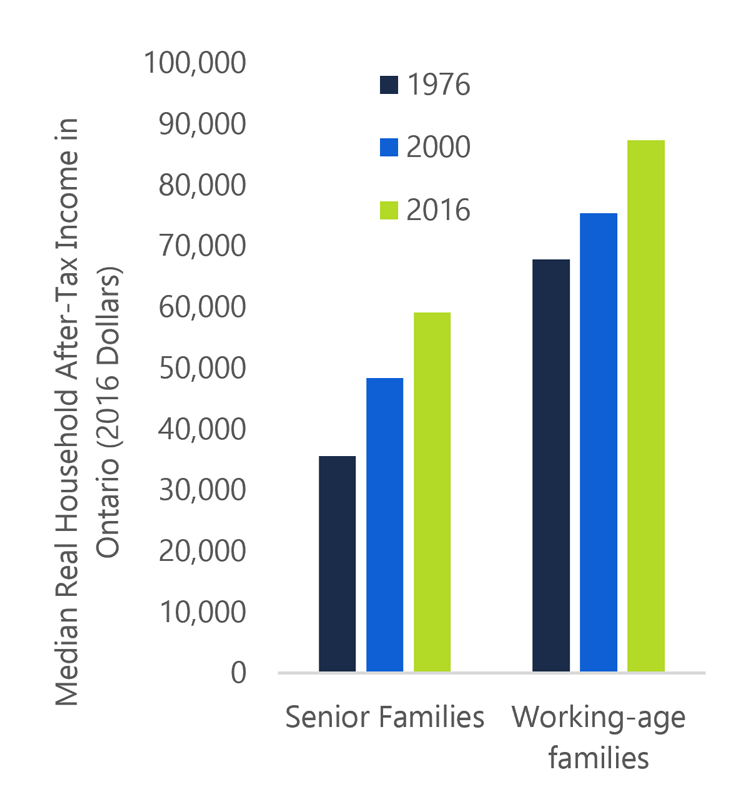
Source: Statistics Canada Canadian Income Survey and FAO.
Between 2000 and 2016, the median after-tax incomes of Ontario families (both senior and working-age) recorded reasonably strong growth. For senior families, median after-tax income increased by a robust 1.3 per cent a year on average, reaching $59,100 by 2016.
Figure 1.9Working-age singles and single-parent families saw declines in after-tax income post-2000
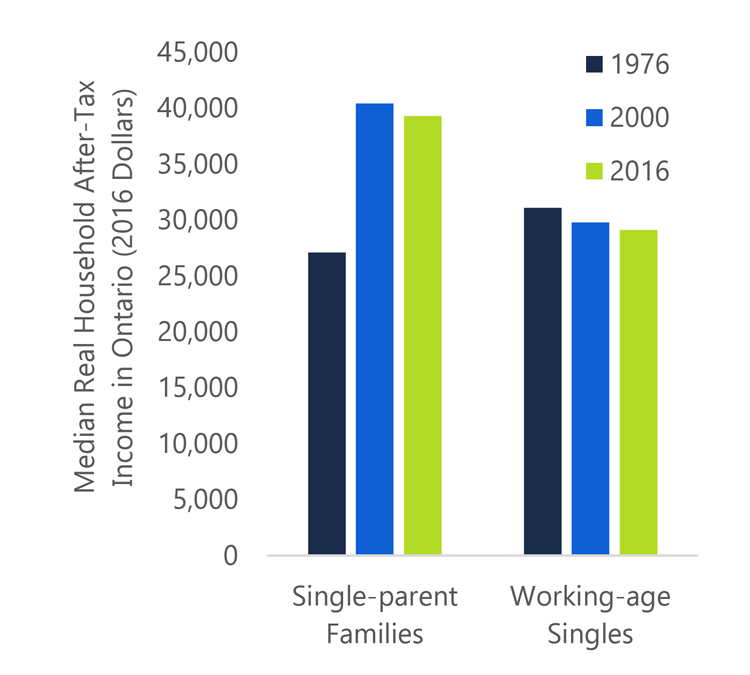
Source: Statistics Canada Canadian Income Survey and FAO.
Similarly, for working-age families, growth has also been relatively solid; median after-tax income increased at an annual average rate of 0.9 per cent, reaching $87,400 by 2016.
However, gains in after-tax income have not been uniform across all Ontario families.
For single-parent families, median after-tax income increased strongly from 1976 to 2000. But in the post-2000 period, the median income of single-parent families declined by over $1,000, falling to $39,300 in 2016.
Working-age Ontarians living alone also experienced declines in after-tax incomes. In 2016, the median after-tax income for this group was $29,100, about $700 lower than in 2000 and about $2,000 lower than in 1976.
In 2016, single-parent families and working-age singles combined represented about 2.1 million Ontarians, or about 15 per cent of the population.[23]
Not only did these two groups experience outright declines in after-tax median incomes since 2000, they were also much more likely to be living in low income than other Ontario families.
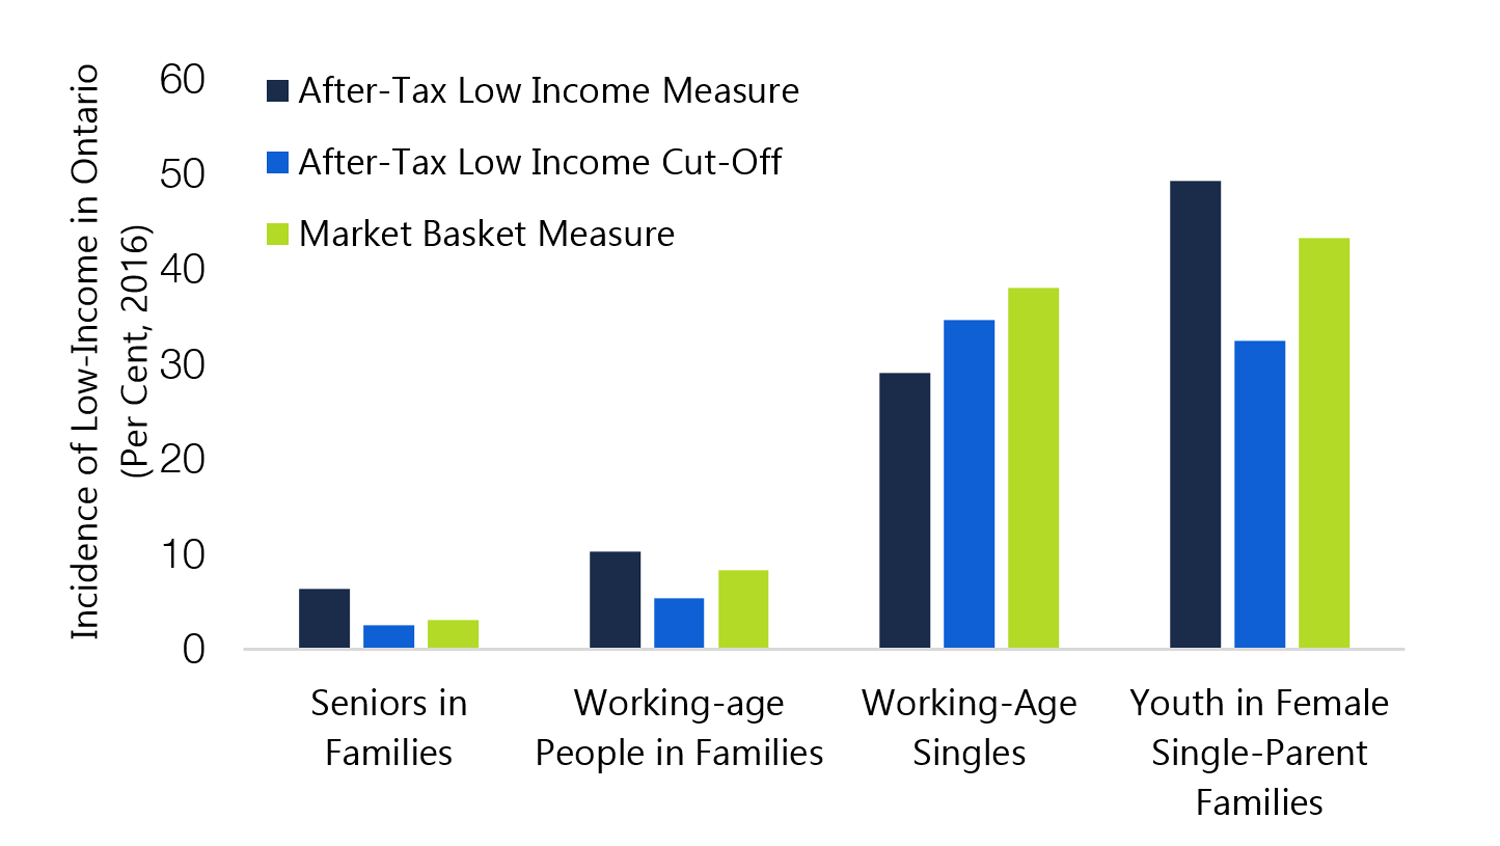
In 2016, fewer than 10 per cent of Ontario families on average (both senior families and working-age families) were considered living in low income, regardless of the low-income measure used.[24] However, more than 30 per cent of working-age singles were considered living in low income (Figure 1.10).
Figure 1.10Working-age singles and youth in single-parent families are more likely to be poor
Source: Statistics Canada Canadian Income Survey and FAO.
Figure 1.11Income growth has been much slower for lower-income Ontario families
Source: Statistics Canada Canadian Income Survey and FAO.
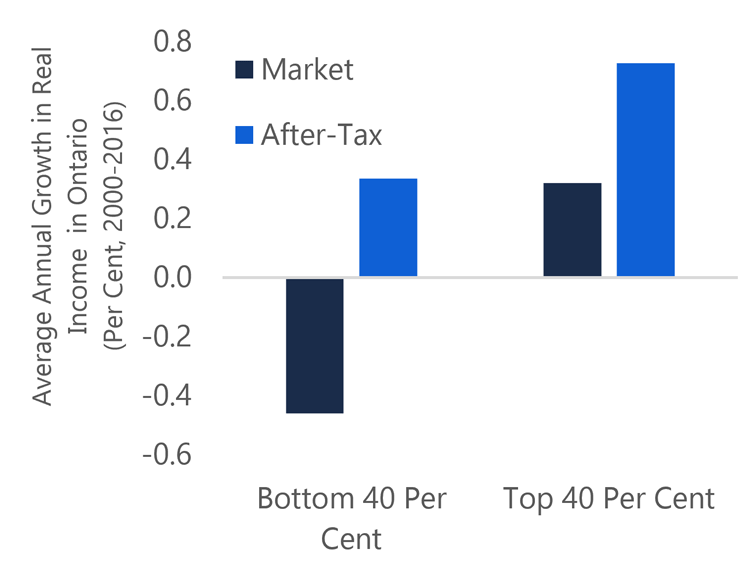
In general, incomes of the poorest Ontario families have recorded relatively weak growth since 2000. Between 2000 and 2016, the average after-tax income of the poorest 40 per cent of Ontario families increased at an annual average rate of 0.3 per cent, much slower than the 0.7 per cent average annual increase for the top 40 per cent of Ontario families.[25]
Notably, during the same time frame, the average market income of the poorest 40 per cent of Ontario families declined by an average of 0.5 per cent a year. This underlines the important role of government programs in supporting the incomes of Ontario’s most vulnerable families.
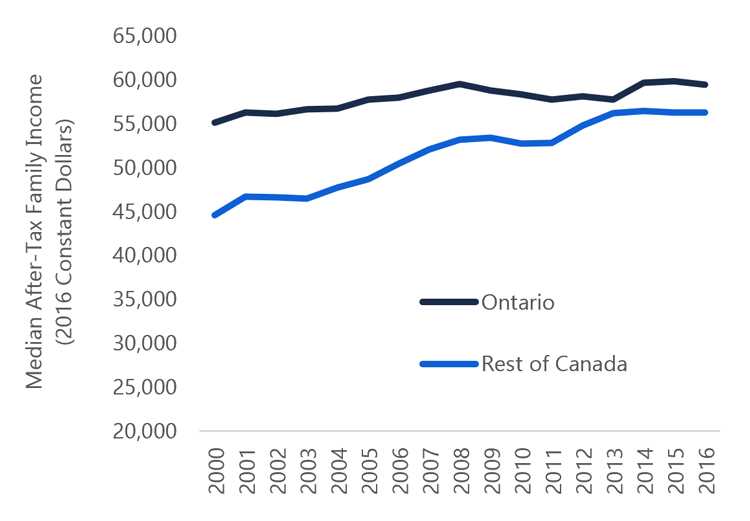
Income growth underperforming the rest of Canada
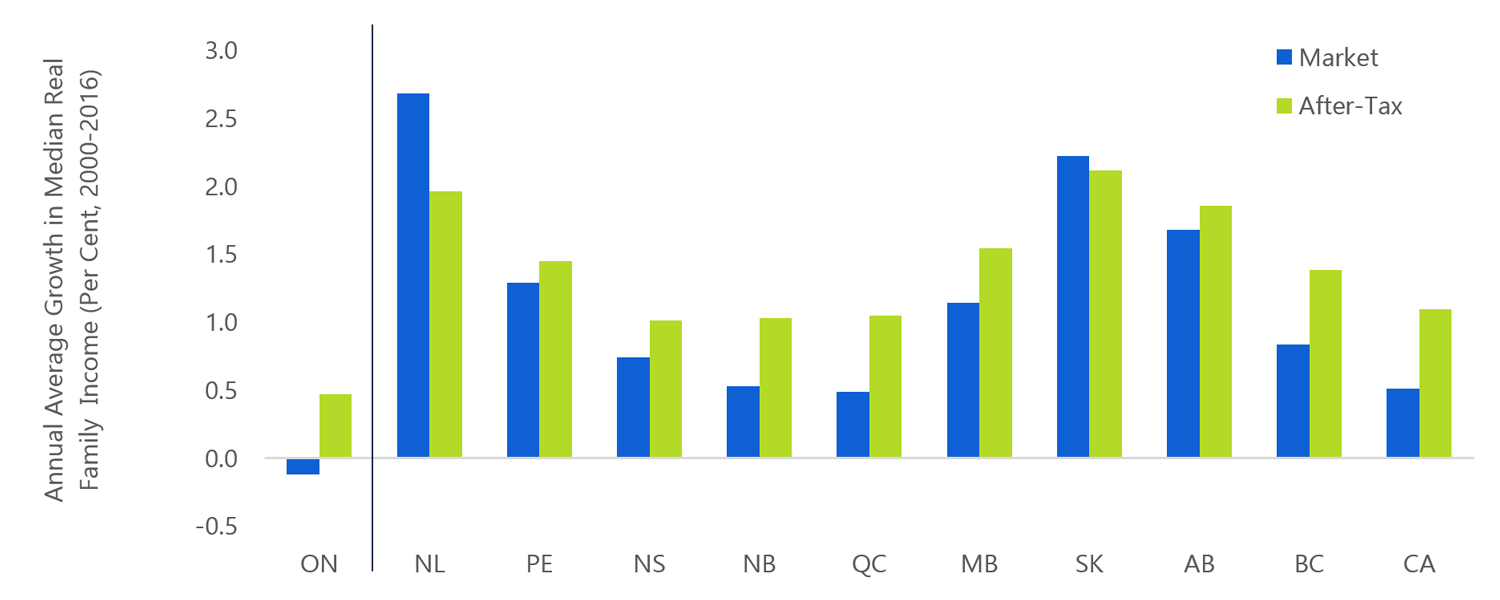
Between 2000 and 2016, Ontario’s median after-tax family income increased at an annual average rate of 0.5 per cent. Significantly, this was the slowest pace of growth among all provinces (Figure 1.12).
This relatively weak performance can largely be attributed to the outright decline in median market incomes in Ontario, compared to relatively solid gains in median market incomes in all other provinces. On average, median market earnings in the rest of Canada grew by a relatively robust 1.5 per cent a year between 2000 and 2016.[26]
Figure 1.12Ontario’s median income growth slowest among provinces between 2000 and 2016
Source: Statistics Canada Canadian Income Survey and FAO.
Figure 1.13Median after-tax incomes in rest of Canada approaching Ontario’s
Note: Income data for the rest of Canada are weighted by population.
Source: Statistics Canada Canadian Income Survey and FAO.
In 2000, Ontario’s median family aftertax income was more than $10,000 (almost 20 per cent) higher than the average median after-tax income in other provinces.
However, the commodity price boom of the early 2000s led to strong income gains in the resource rich provinces of Newfoundland and Labrador, Alberta, Saskatchewan and British Columbia.
By 2016, the gap between Ontario and the rest of Canada had narrowed. The average median after-tax income in other provinces reached $56,200, just $3,000 below that of Ontario.
2. Income distribution
Summary
- Between 2000 and 2016, the inequality of market income increased in Ontario. In 2000, average market earnings of the richest 20 per cent of Ontarians (the top quintile) were 16 times larger than the average earnings of the bottom quintile. By 2016, they were 19 times larger. However, on an after-tax basis, income inequality has not increased since 2000 in Ontario.
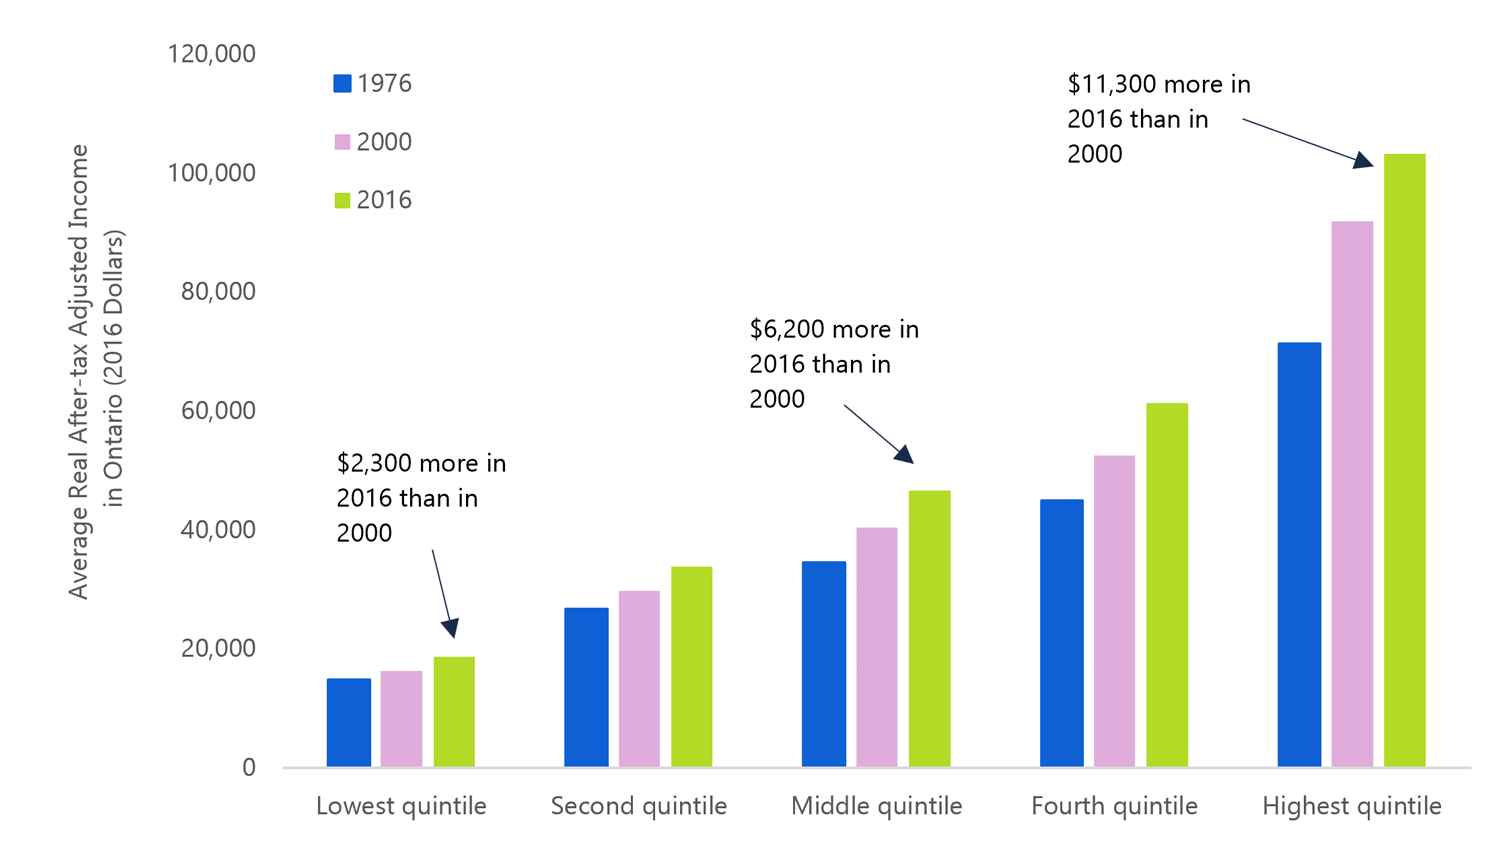
- Ontarians with higher incomes continued to capture the majority of the growth in total after-tax income. Those in the lowest income quintile received, on average, $2,300 more in after-tax income in 2016 than they did in 2000, while those in the highest quintile received $11,300 more, on average, in after-tax income.
- Ontario’s inequality in after-tax income is similar to other provinces and to the OECD average, but lower than in the United States.
- In 2016, taxes and transfers reduced income inequality by almost 30 per cent; Ontario’s income taxes and social assistance programs contributed more than one-third of this reduction. However, the tax and transfer system in Ontario redistributed less income per capita relative to most other OECD countries.
- Research by the OECD and IMF has concluded that higher income inequality inhibits a jurisdiction’s economic growth. It does so by lowering human capital investment, discouraging initative and innovation, and lowering potential productivity.
Income in Ontario is unevenly distributed
If all Ontarians were lined up according to their annual income from lowest to highest and divided into five equal groups, this would form five “income quintiles”, each representing 20 per cent or one-fifth of the population.
In 2016, the average market income for Ontarians in the lowest income quintile (the poorest 20 per cent) was $6,750.[27] In contrast, the average market income of the highest quintile (the richest 20 per cent) was $130,250, roughly 19 times the level of the lowest quintile.
Figure 2.1Income is unevenly distributed in Ontario (2016)
.png)
Source: Statistics Canada Canadian Income Survey and FAO.
Ontario’s income distribution is less uneven on an after-tax basis, since the tax and transfer system redistributes income from higher-income to lower-income Ontarians. In 2016, on an after-tax basis, Ontarians in the lowest income quintile reported an average income of $18,600, while those in the top quintile reported average incomes of $103,200, roughly five times higher (Figure 2.1).
In 2016, Ontarians in the highest quintile (the 20 per cent of Ontarians with the highest incomes) received 47 per cent of total market income, compared to 39 per cent of income on an after-tax basis. At the same time, the 20 per cent of Ontarians in the lowest income quintile received just 2.4 per cent of total market income; government taxes and transfers increased that share to 7 per cent on an after-tax basis.
After-tax income inequality plateaued after 2000
A common way of assessing income inequality is to calculate the ratio of incomes accruing to the top quintile with the incomes of those in the bottom quintile.
In 2000, the average market earnings of the top quintile were 16 times higher than those of the bottom quintile. By 2016, earnings in the top quintile were more than 19 times higher.[28]
Figure 2.2After 2000, market income inequality grew while after-tax inequality remained constant
Source: Statistics Canada Canadian Income Survey and FAO.
However, on an after-tax basis, the top quintile’s average income was 5.5 times higher than that of the bottom quintile in 2000. This ratio has remained relatively constant from 2000 to 2016.
The relatively stable ratio for after-tax incomes reflects the fact that the tax and transfer system (comprising both federal and provincial components) has played an important role in reducing income inequality by transferring income from higher- to lower-income Ontarians.
Another common measure of aggregate income inequality is the ‘Gini coefficient’, a measure which summarizes the degree of inequality across the entire income distribution in a single number that ranges from zero to one. The higher the value of the Gini coefficient, the more unequal is the distribution of incomes.[29]
From 1976 to the mid-1990s, market income inequality increased in Ontario, reflected in an upward trend in the Gini coefficient. This rising income inequality was in part a result of the recessions of the early 1980s and 1990s, which affected lower-income Ontarians more severely than richer Ontarians.
Importantly, the Gini coefficient based on after-tax incomes was largely unchanged over the 1976 to 1995 period, as the tax and transfer system effectively offset much of the rising inequality of market incomes (Figure 2.3).
Figure 2.3 Lower transfers in the 1990s raised after-tax income inequality
Note: Shaded areas indicate recession.
Source: Statistics Canada Canadian Income Survey and FAO.
Changes in the tax and transfer system can have significant impacts on the distribution of income. During the 1990s, the federal government reduced the generosity of Employment Insurance, while the Ontario government lowered social assistance payments. These policy changes contributed to a steady rise in after-tax income inequality in the 1990s, even as market income inequality was stabilizing.
Since 2000, after-tax income inequality – as measured by the Gini coefficient – has largely plateaued close to its current level.[30]
Higher-Income Ontarians Continue to Capture Most of the After-Tax Income Gains
Despite a fairly constant level of after-tax income inequality in Ontario since 2000, the incomes of higher-earning Ontarians increased much more substantially than for lower-income Ontarians, on an after-tax basis.
Those in the lowest quintile received, on average, $2,300 more in after-tax income in 2016 than in 2000, while Ontarians in the highest income quintile received $11,300 more in after-tax income (Figure 2.4).
Figure 2.4 Income gains have been strongest for higher-income Ontarians
Source: Statistics Canada Canadian Income Survey and FAO.
Ontario’s after-tax income distribution is similar to other jurisdictions
Ontario’s market income inequality is modestly higher than the average in the rest of Canada. Since the tax and transfer system reduces inequality by similar degrees in all provinces, Ontario’s after-tax income inequality is also marginally higher than in other provinces. However Ontario’s market income inequality is lower than both the US and OECD average (Figure 2.5).
Figure 2.5Ontario’s after-tax income distribution similar to other jurisdictions
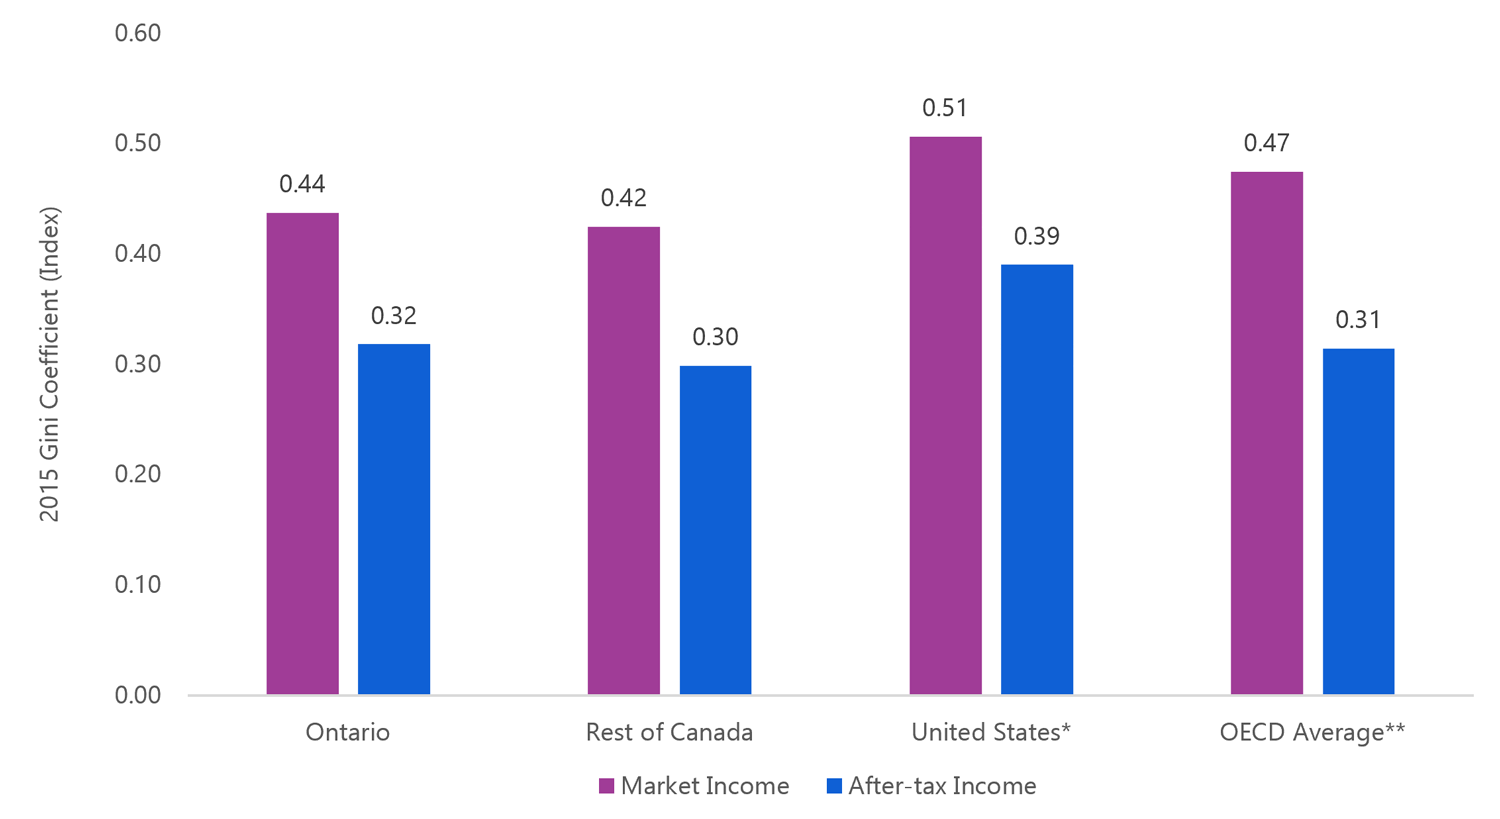
* US and OECD average after-tax income Gini Coefficients are based on disposable income as defined by the OECD.
** OECD average includes all OECD members besides Australia, Hungary, Iceland, Japan, Mexico and New Zealand.
Note: Averages for the rest of Canada and OECD are calculated as simple averages.
Source: Statistics Canada Canadian Income Survey, OECD and FAO.
Figure 2.6 Tax and transfer system in Ontario redistributes less income per capita than the OECD average
Source: Statistics Canada Canadian Income Survey, OECD and FAO.
Overall, the tax and transfer system in Ontario contributes to a roughly 30 per cent reduction in income inequality (as measured by the Gini coefficient). By comparison, the tax and transfer systems of OECD countries reduce income inequality by roughly 35 per cent on average (Figure 2.6).[31]
According to OECD estimates, Canada’s tax and transfer system ranks 25th out of 31 countries in terms of its effectiveness at reducing income inequality.
The tax and transfer system in Ontario includes both federal and provincial income taxes, as well as social benefit programs administered by all levels of government. These include: the Canada Pension Plan, Guaranteed Income Supplement, Employment Insurance, child benefits and social assistance programs.
In 2015, the Ontario government’s taxes and transfers contributed 36 per cent to the overall reduction in income inequality; federal government taxes and transfers accounted for the rest (Figure 2.7).[32]
Figure 2.7Ontario government’s tax and transfer system contributes more than one-third of total reduction in income inequality
Note: Based on 2015 data, the most recent year available.
Source: Statistics Canada Canadian Income Survey and FAO.
Higher income inequality associated with slower income growth
Figure 2.8Income inequality slows the rate of long-term economic growth
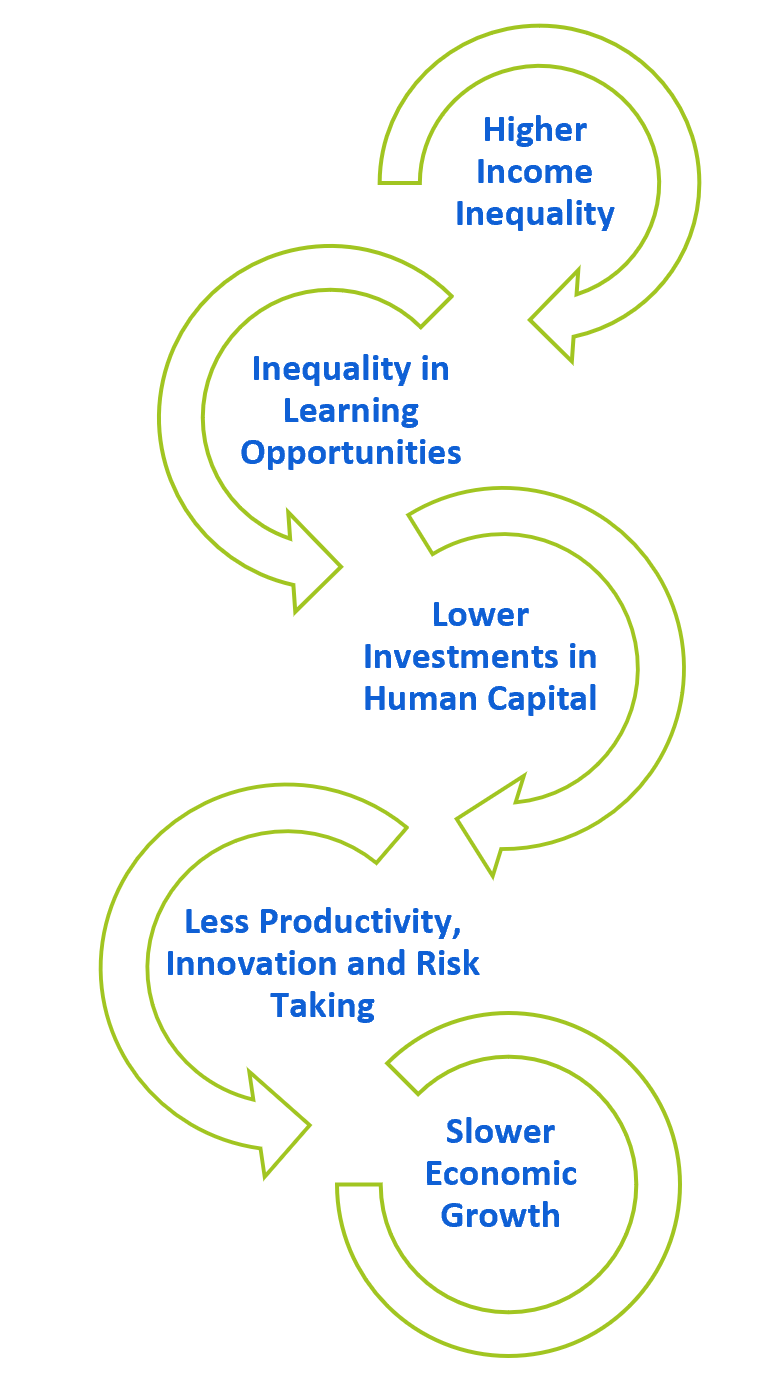
Note: Arrows represent correlation between these trends and not necessarily causation.
Research by both the OECD and IMF has concluded that higher income inequality can slow the rate of long-term economic growth.[33]
The OECD estimates that the rise of income inequality between 1990 and 2010 lowered the cumulative growth of real gross domestic product (GDP) in OECD countries by 4.7 percentage points. These estimates have also been echoed by similar research from the US Federal Reserve.[34]
Investments in education and knowledge can improve the quality of the workforce, and contribute to more innovation and initiative, spurring economic growth. Investments in human capital are defined by the OECD as the “knowledge, skills, competencies, and attributes that facilitate the creation of personal, social and economic wellbeing”.[35]
Research by the OECD has noted that “inequality in learning opportunities begins at birth, and often widens as individuals grow older. Children from more affluent families tend to develop better skills in reading and problem-solving, are less likely to drop out of school without a diploma and are more likely to complete tertiary education.”[36]
Higher income inequality can lead to less investment in the educational attainment of lower income families, eventually lowering their potential productivity.[37] This decreases aggregate productivity and output in the economy, slowing the pace of overall economic growth in the long term.
3. Income mobility
Summary
- It has become more difficult for Ontarians to “get ahead” – that is, move up the income distribution. In this report, upward income mobility is defined as the share of working-age Ontarians who move up at least one income quintile over a five-year period. This share declined from 41 per cent in the early 1980s to 32 per cent more recently. The decline was most pronounced for lower-income Ontarians.
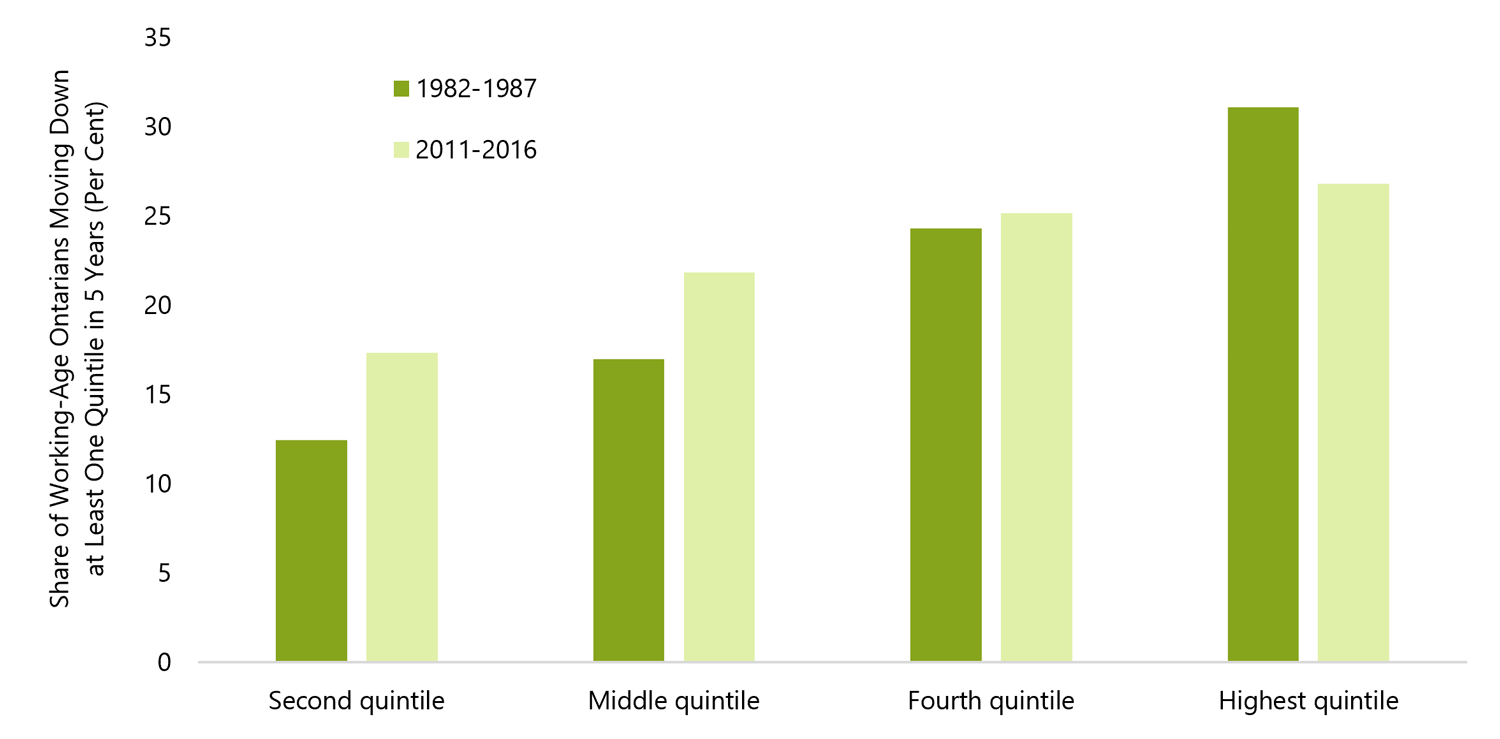
- The prevalence of downward income mobility (the share of working-age Ontarians moving down one quintile over five years) has risen for low- and middle-income Ontarians since the 1980s. In contrast, higher income Ontarians are less likely to experience downward income mobility.
- “Income immobility” (the share of working-age Ontarians who remain in the same income quintile over a five-year period) has also increased steadily since the 1980s. This increase in income immobility has been most pronounced for lower-income Ontarians, indicating that the income distribution in Ontario has become more “sticky” over the last 35 years.
- Income mobility can also be assessed across generations, by measuring the extent to which a parent’s income influences the adult earnings of their children. In Ontario, the children of higherincome parents are more likely to be high-income earners themselves, while children raised in lower-income families are more likely to become lower-income earners.
- Ontario has higher intergenerational income mobility than most OECD countries, including the United States. This implies that parental income matters less to a child’s future earnings potential in Ontario than it does in other jurisdictions. OECD research indicates that high quality and universally accessible education and health care, as is the case in Ontario, coupled with a strong tax and transfer system, are key contributors to intergenerational income mobility.
Relative income mobility
Relative income mobility[38] measures the extent to which an individual’s position in the income distribution changes over time. In this report, relative income mobility compares the income quintile of an individual in a starting year to their income quintile five years later.[39] This determines if they have moved up or down, or stayed in the same position relative to others.
Income mobility reflects both sustained changes in an individual’s economic circumstance (such as a promotion or career change) as well as other income shocks (such as job loss, a severe illness, divorce or child birth). Higher income mobility implies that more Ontarians are transitioning in and out of low income or moving in and out of higher income brackets. A more dynamic income distribution, with more individuals shifting from one quintile to another over time, can mitigate some of the negative implications of income inequality.[40]
Based on the after-tax income of working-age Ontario tax filers[41], about 50 per cent of working-age Ontarians moved from one quintile in the income distribution to another between 2011 and 2016.
Income mobility includes both upward mobility (those who moved up at least one quintile in a five-year period) and downward mobility (those who moved down at least one quintile in a five-year period). Between 2011 and 2016, 32 per cent of Ontarians experienced upward mobility, 18 per cent experienced downward mobility, and 50 per cent were “immobile”; that is, they remained in the same income quintile.
Of those who experienced mobility (either up or down), most moved by only one quintile. Only 9 per cent of working-age Ontarians moved up by two quintiles or more, while just 5 per cent moved down by more than one quintile.
Income “immobility” has increased
Income immobility – the share of working-age Ontarians remaining in the same income quintile over a given five-year period – has been steadily increasing over the past three decades. That is, the share of Ontarians moving up or down the income distribution has declined.
Between 1982 and 1987, roughly 42 per cent of working-age Ontarians remained in the same income quintile. Income immobility remained relatively constant until the early 1990s when it began to increase.
During the five-year period from 2011 to 2016, however, 50 per cent of working-age Ontarians remained in the same income quintile, an increase of 8 percentage points from the 1980s (Figure 3.1).
Figure 3.1Income immobility has increased
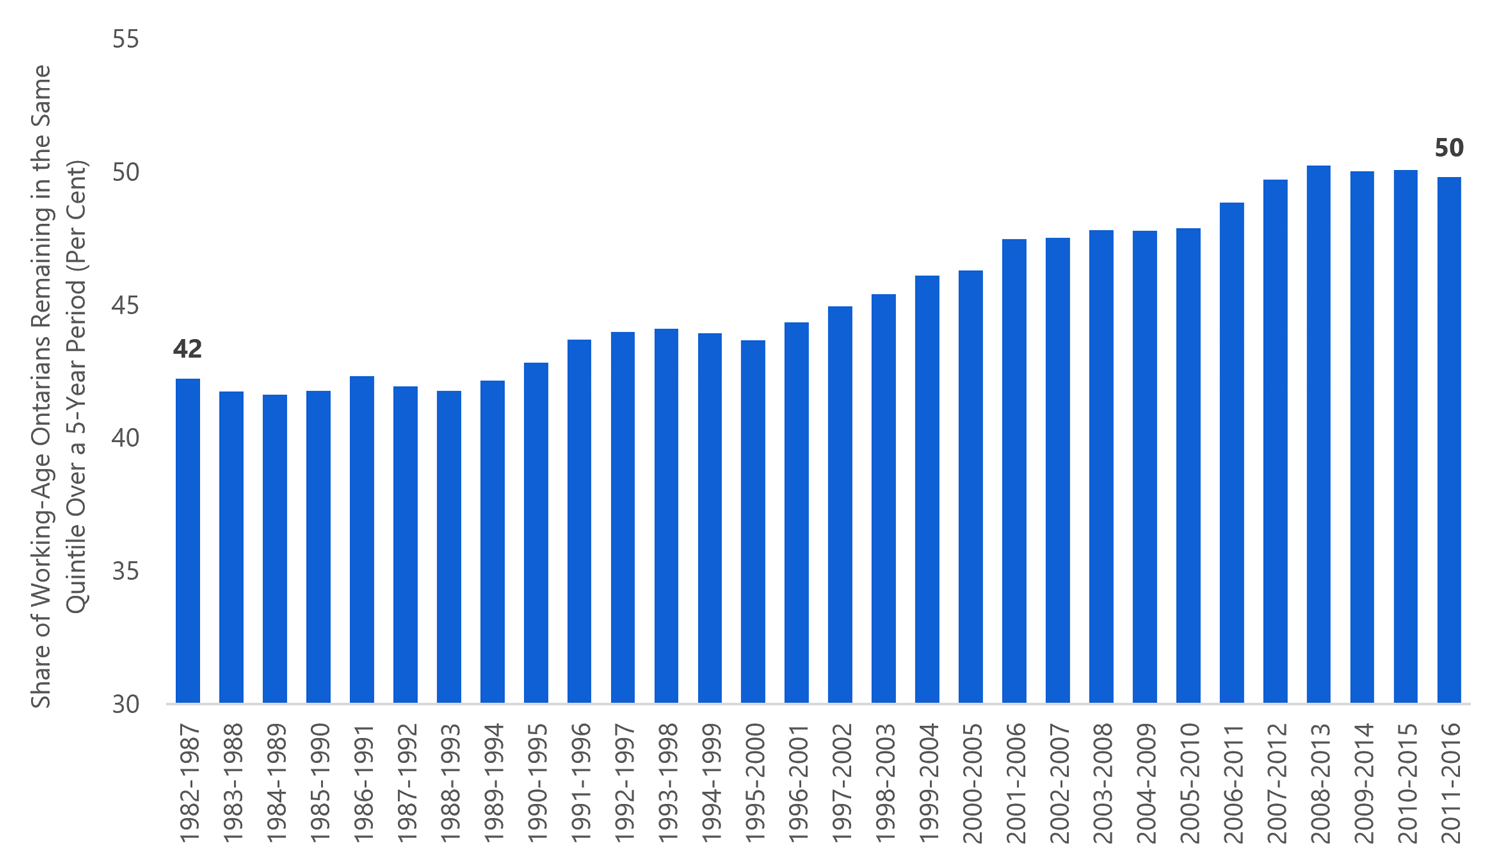
Source: Statistics Canada Longitudinal Administrative Databank custom tabulation and FAO.
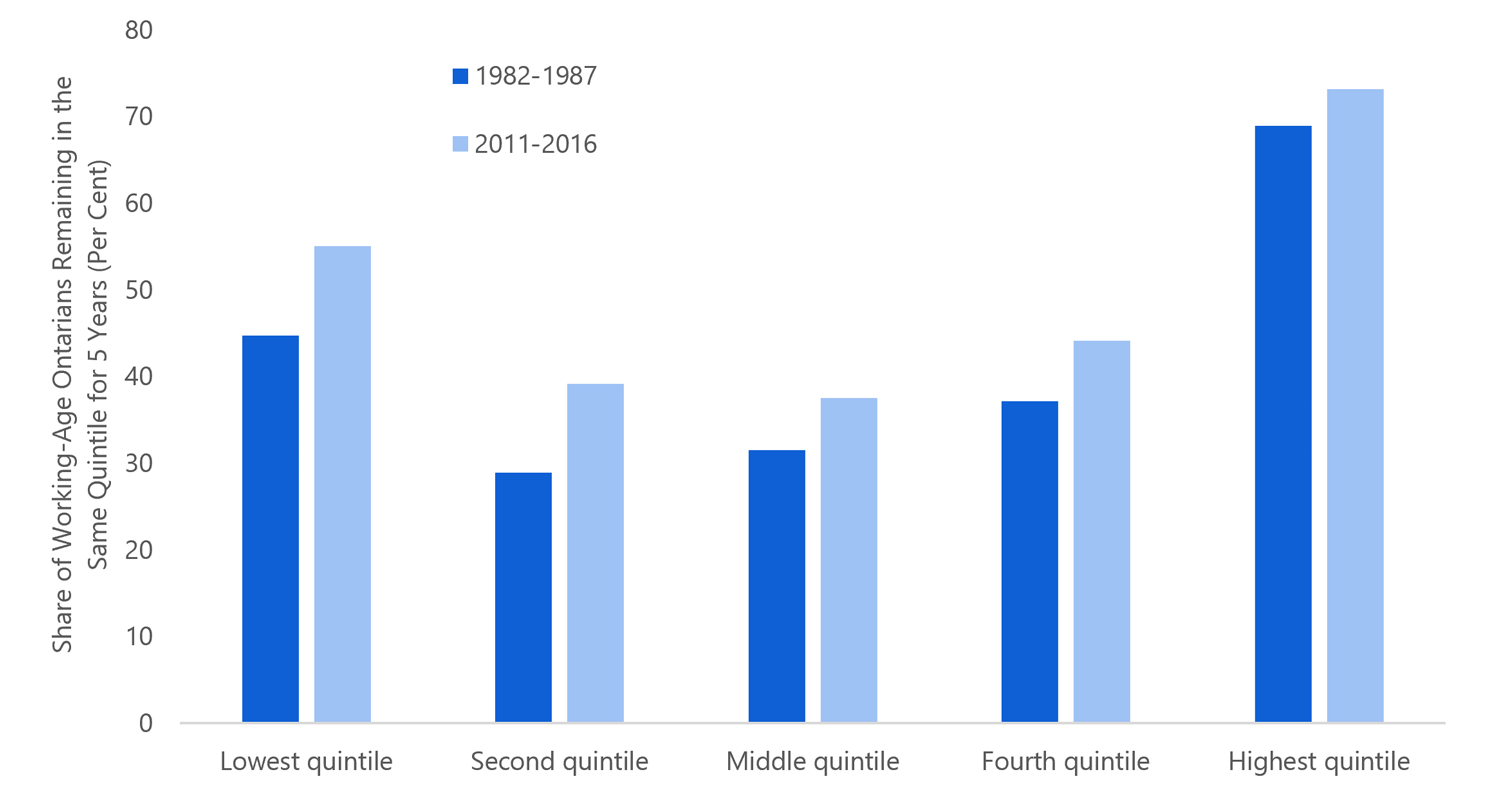
More importantly, income immobility is becoming more common for the poorest Ontarians. Over the last 35 years, the share of working-age Ontarians in the bottom two income quintiles who experienced income immobility increased by more than 10 percentage points.
Over the same period, the share of working-age Ontarians in the third and fourth income quintiles who remained in the same position increased by roughly six percentage points. Those in the highest income quintile saw an increase in immobility of four percentage points.
The increased “stickiness” of the income distribution suggests low-income Ontarians are finding it harder to change their relative standing in the income distribution (Figure 3.2).
Figure 3.2 Income distribution is becoming “stickier”, especially for low-income working-age Ontarians
Source: Statistics Canada Longitudinal Administrative Databank custom tabulation and FAO.
Harder to achieve upward mobility in Ontario
The steady rise in income immobility in Ontario is mirrored by a significant decrease in upward mobility, particularly during the 1990s. The proportion of working-age Ontarians moving up the income distribution fell from 41 per cent between 1982 and 1987 to 32 per cent between 2011 and 2016.
Figure 3.3 Achieving upward mobility has become more challenging in Ontario
Source: Statistics Canada Longitudinal Administrative Databank custom tabulation and FAO.
The decline in upward mobility occurred for both low- and middle-income Ontarians. During the five-year period in 1982-1987, roughly 57 per cent of working-age Ontarians in the bottom two quintiles succeeded in moving up at least one quintile. However, between 2011 and 2016, this share had dropped 13 percentage points to 44 per cent.
For working-age Ontarians in the 3rd and 4th quintiles, the share who moved up the income distribution declined by roughly nine percentage points between the two five-year periods (Figure 3.4).[42]
Figure 3.4 Lower-income Ontarians have less upward mobility compared to the 1980s
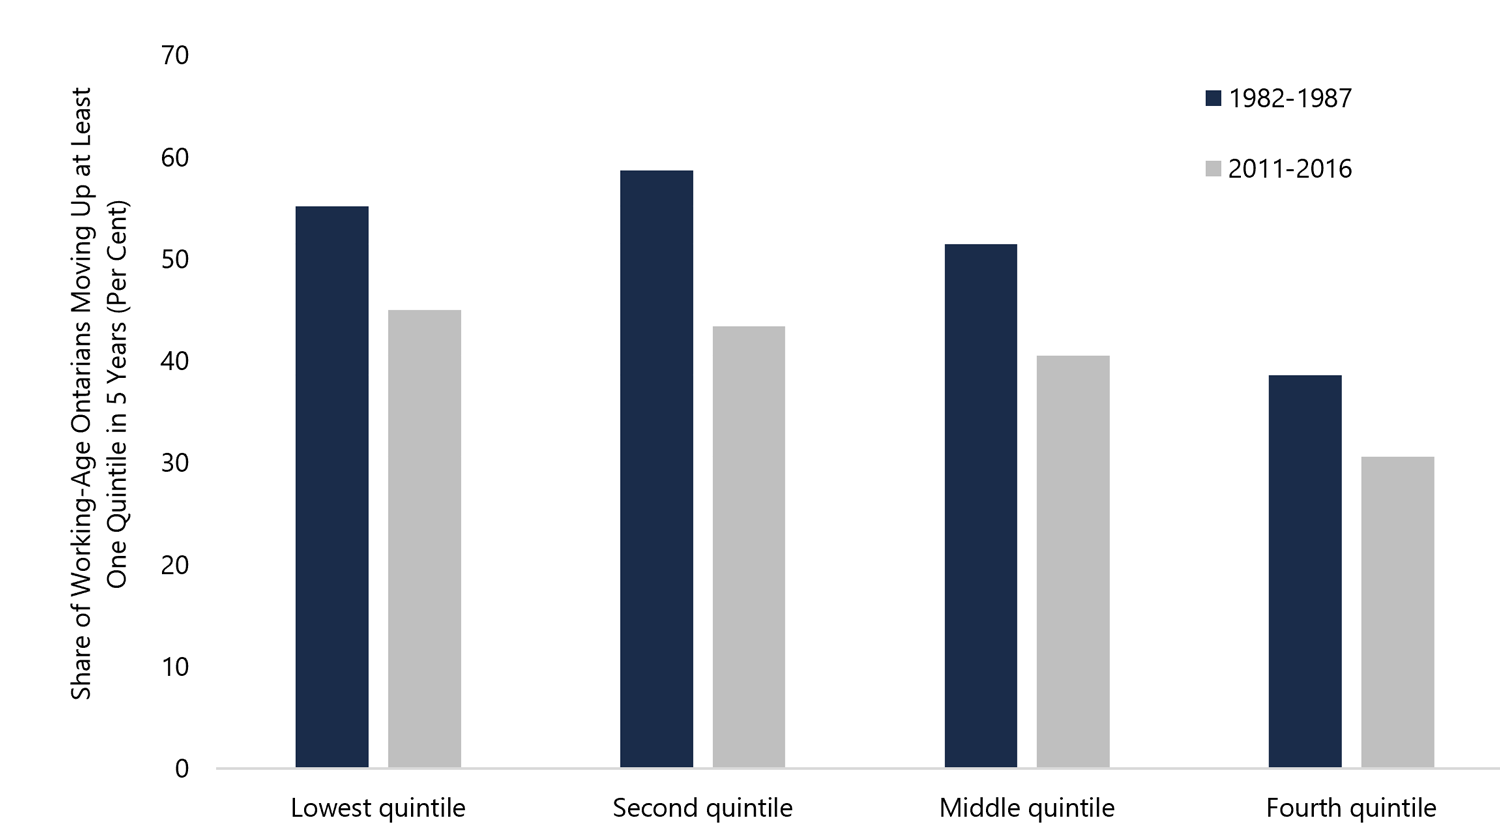
Source: Statistics Canada Longitudinal Administrative Databank custom tabulation and FAO.
Downward mobility less prevalent since the 2000s
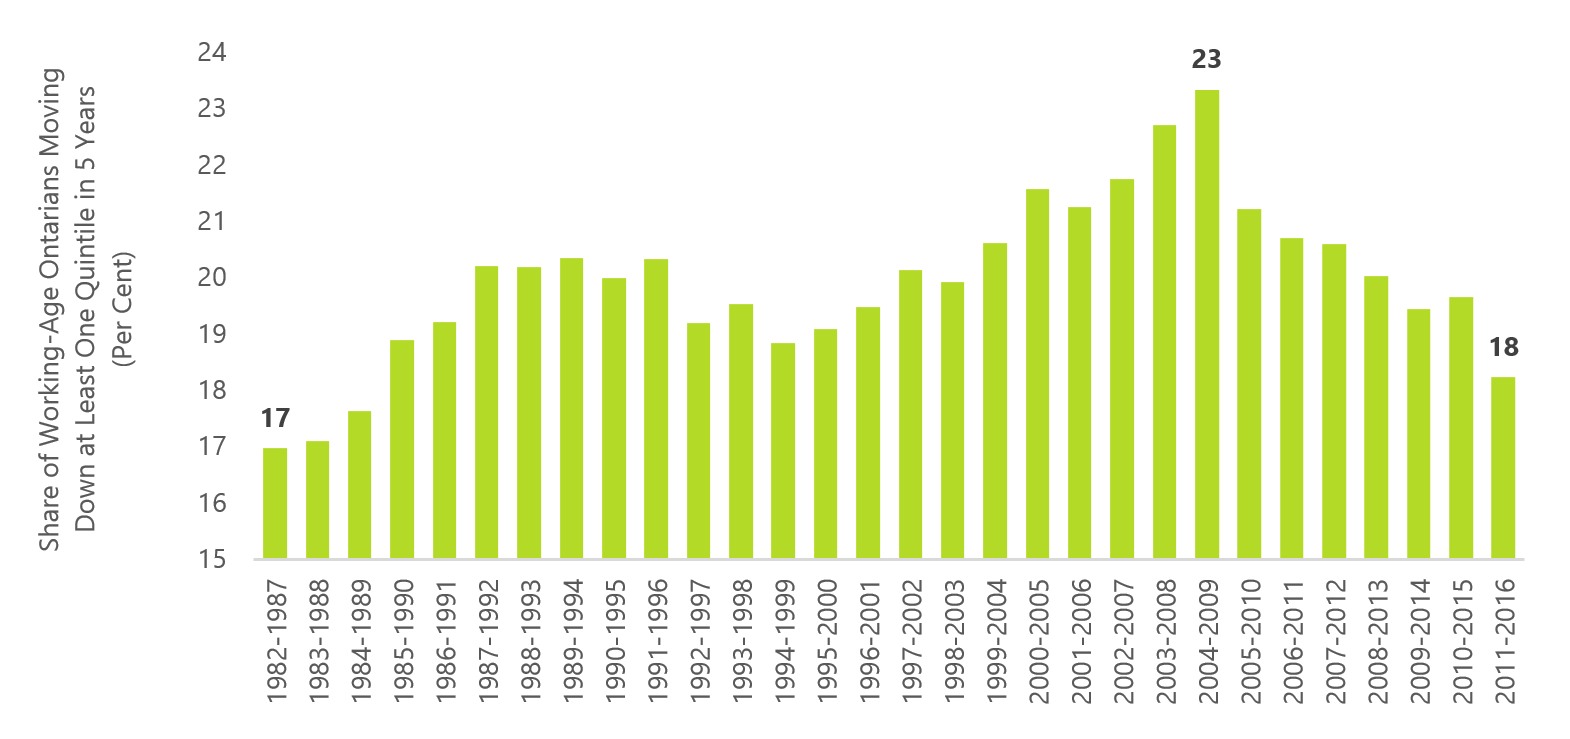
As would be expected, the share of working-age Ontarians experiencing downward mobility typically increases during recessions and decreases during economic expansions.
During the 1982-1987 period, 17 per cent of working Ontarians moved down at least one income quintile. This share increased gradually through the late 1990s into the early 2000s, reaching a peak of 23 per cent between 2004 and 2009. This share has trended lower over the past decade; by the 2011-2016 period, it had declined to 18 per cent (Figure 3.5).
Figure 3.5 Downward mobility less prevalent since the 2000s
Source: Statistics Canada Longitudinal Administrative Databank custom tabulation and FAO.
However, downward mobility has become more prevalent for lower- and middle-income Ontarians. Compared to the early 1980s, the share of working-age Ontarians in the 2nd and 3rd quintiles experiencing downward mobility had increased by roughly five percentage points by 2011-2016. This compares with a one-percentage-point increase for those in the 4th quintile.
Notably, the share of working-age Ontarians in the highest income quintile experienced less downward mobility compared to the early 1980s (Figure 3.6).
Figure 3.6 Downward mobility on the rise for middle-income Ontarians
Source: Statistics Canada Longitudinal Administrative Databank custom tabulation and FAO.
Concerns regarding income inequality might be lessened if the differences in economic standing among Ontarians were more temporary. However, the decline in income mobility in Ontario indicates that these income differences are becoming more permanent, reinforcing existing income inequalities.
Intergenerational income mobility
Over longer periods of time, intergenerational income mobility measures the extent to which a family’s economic position in one generation influences the economic position of their children in adulthood.[43]
In Ontario, as in the rest of Canada, there is a positive relationship between a parent’s income and their children’s income as adults. Children of higher-income parents are more likely to be high-income earners themselves, while children raised in lower-income families are more likely to become lower-income earners.[44]
The OECD uses the term “opportunity hoarding” to describe how those at the top of the income distribution can ensure that a variety of economic advantages are passed on to their children. These opportunities can include social connections that facilitate access to good schools and employment, as well as other activities that can enhance human and social capital. The highest-income families are also better able to finance investments in training and skills development.
Many of these advantages are unavailable to lower-income families, and work against intergenerational income mobility.[45] At the same time, OECD research indicates that high quality and universally accessible education and health care are key contributors to intergenerational income mobility.[46]
The level of intergenerational income mobility in a society is typically estimated by ‘intergenerational income elasticities’, which measure the extent to which parents’ incomes impact their children’s adult income. The lower the intergenerational elasticity, the lower is the influence of parental incomes on the incomes of their children as adults. This implies that more children (regardless of their parent’s income) have a reasonable chance at higher incomes as adults.
Estimates of intergenerational income mobility involve tracking tax information over many decades. As such, it is not currently possible to examine its evolution over time. The following sections compare Ontario’s intergenerational income mobility with that of other jurisdictions and examines its relationship with income inequality.
Ontario’s intergenerational income mobility is in line with most provinces
Ontario’s intergenerational income elasticity is 0.19[47], near the Canadian average. Most children in Canada enjoy a relatively similar level of intergenerational opportunity (in terms of incomes). However, intergenerational income elasticities in Saskatchewan and Manitoba are much higher than other provinces (Figure 3.7).[48]
In Canada, communities with higher intergenerational income elasticities (and by extension lower intergenerational income mobility) are typically far from major urban areas and tend to have higher poverty rates, and increased income inequality.[49]
Figure 3.7 Ontario’s intergenerational income mobility in line with most provinces
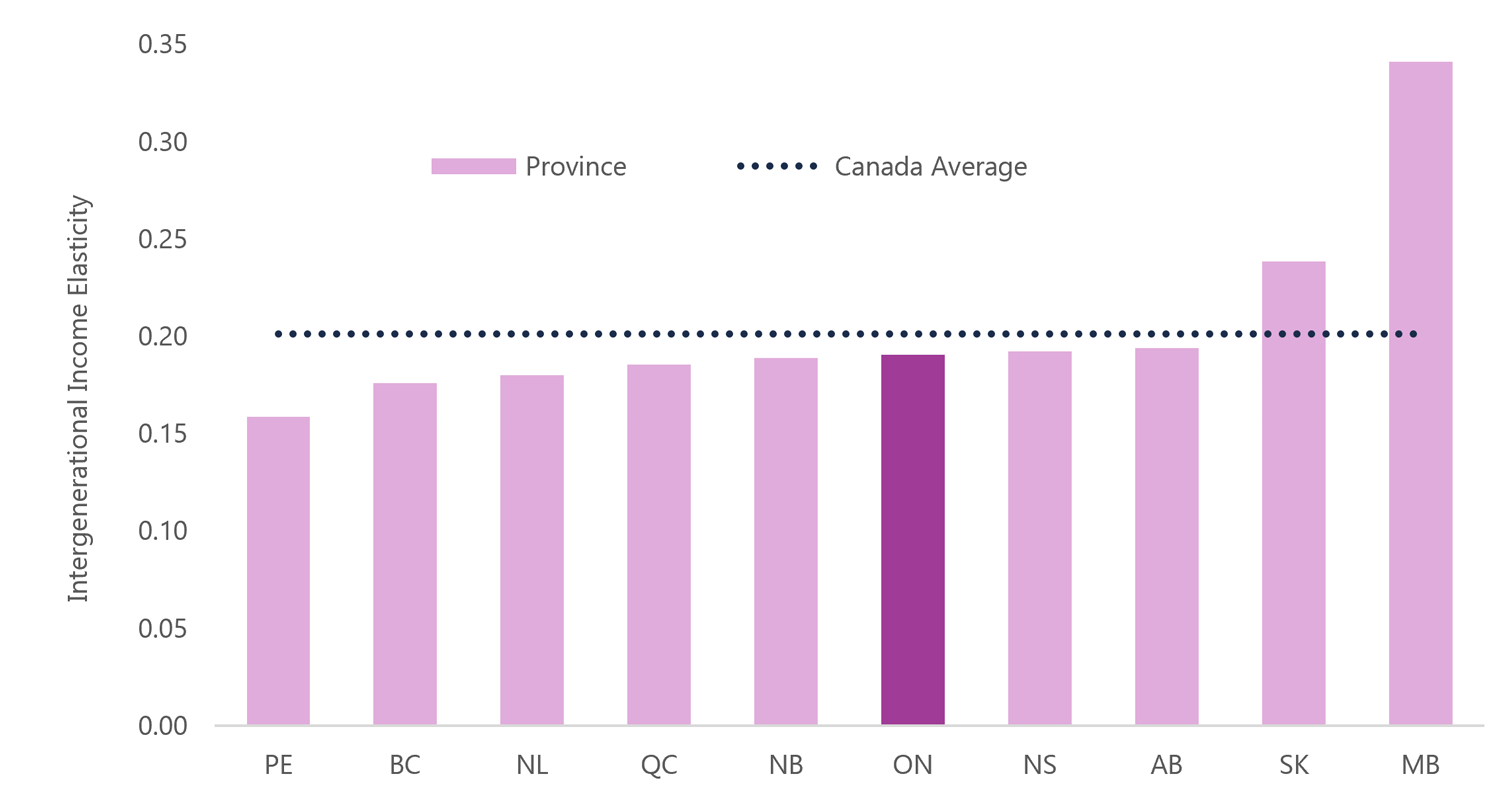
Source: Miles Corak, Divided Landscapes of Economic Opportunity: The Canadian Geography of Intergenerational Income Mobility, 2017.
Internationally, there is a much stronger relationship between a parent’s income and their children’s future income than in Ontario. Ontario’s intergenerational income elasticity ranks quite low when compared to other jurisdictions; it is almost 60 per cent below that of the United States and United Kingdom. The only jurisdictions in which a parent’s income matters less to their child’s future economic status are Denmark, Norway and Finland (Figure 3.8).
Figure 3.8 Ontario’s intergenerational income mobility better than most nations
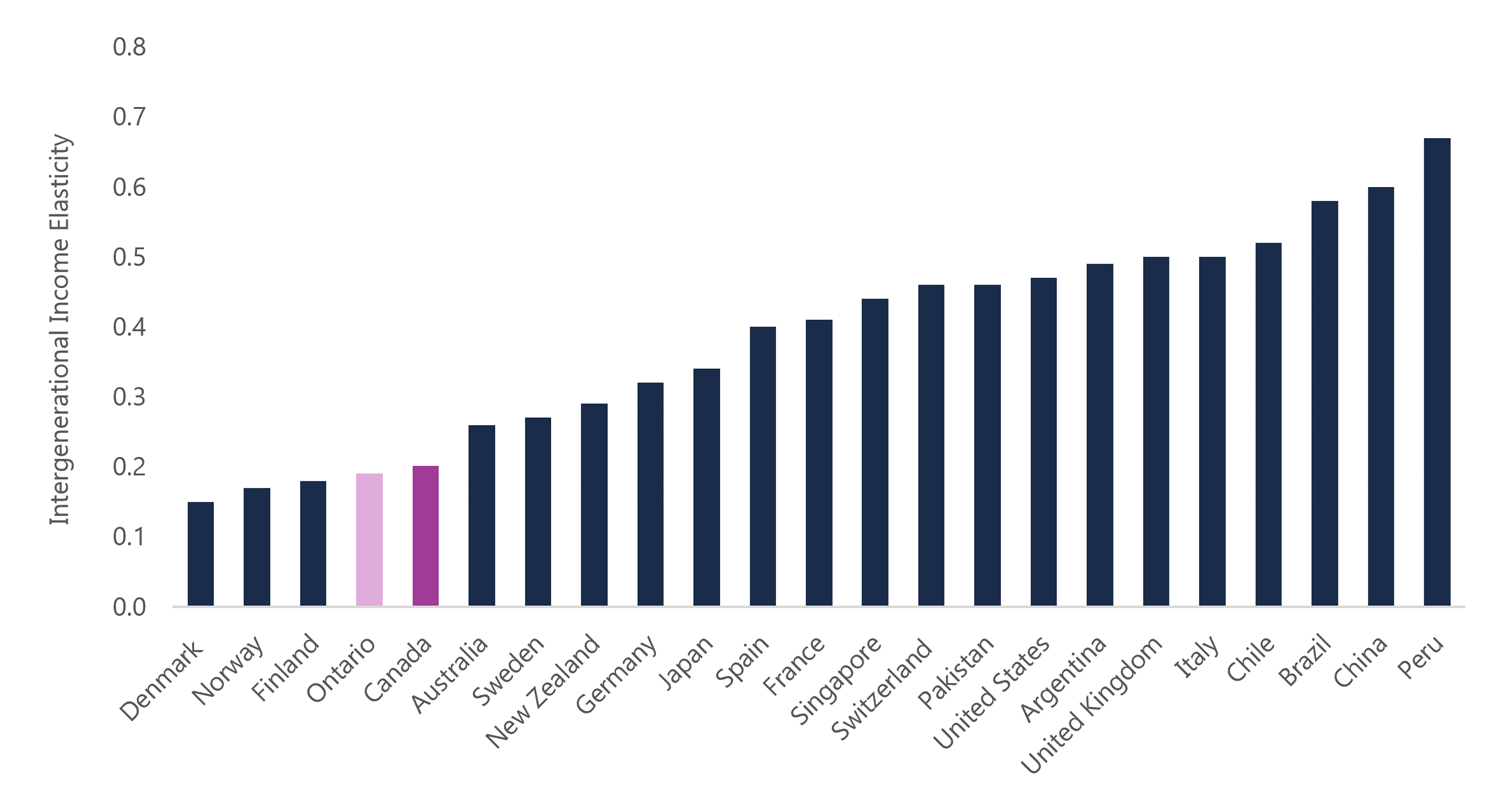
Note: Elasticities for Ontario and Canada were published in: Corak (2017) while the other country elasticities were published in Corak (2016).
Source: Miles Corak (2017) Divided Landscapes of Economic Opportunity: The Canadian Geography of Intergenerational Income Mobility and Miles Corak (2016) Inequality from Generation to Generation: The United States in Comparison.
Lower income mobility can reinforce income inequality
Economic growth, income inequality and income mobility are interconnected factors that can be mutually reinforcing. In a cross-country comparison, countries with higher income inequality also tend to have less income mobility between generations. This is a phenomenon typically known as the Great Gatsby curve.[50]
Investments in human capital can improve the quality of the workforce and contribute to aggregate productivity, income growth and income mobility. However, higher income inequality can impede human capital investment and prevent low-income children from reaching their full potential.
Both Ontario and Canada benefit from a number of comparative strengths which have contributed to relatively higher intergenerational income mobility compared to other advanced economies. In particular, the OECD notes that a strong tax and transfer system and high quality and universally accessible education and health care are key contributors to intergenerational income mobility.[51]
Figure 3.9 Higher income inequality associated with lower intergenerational income mobility
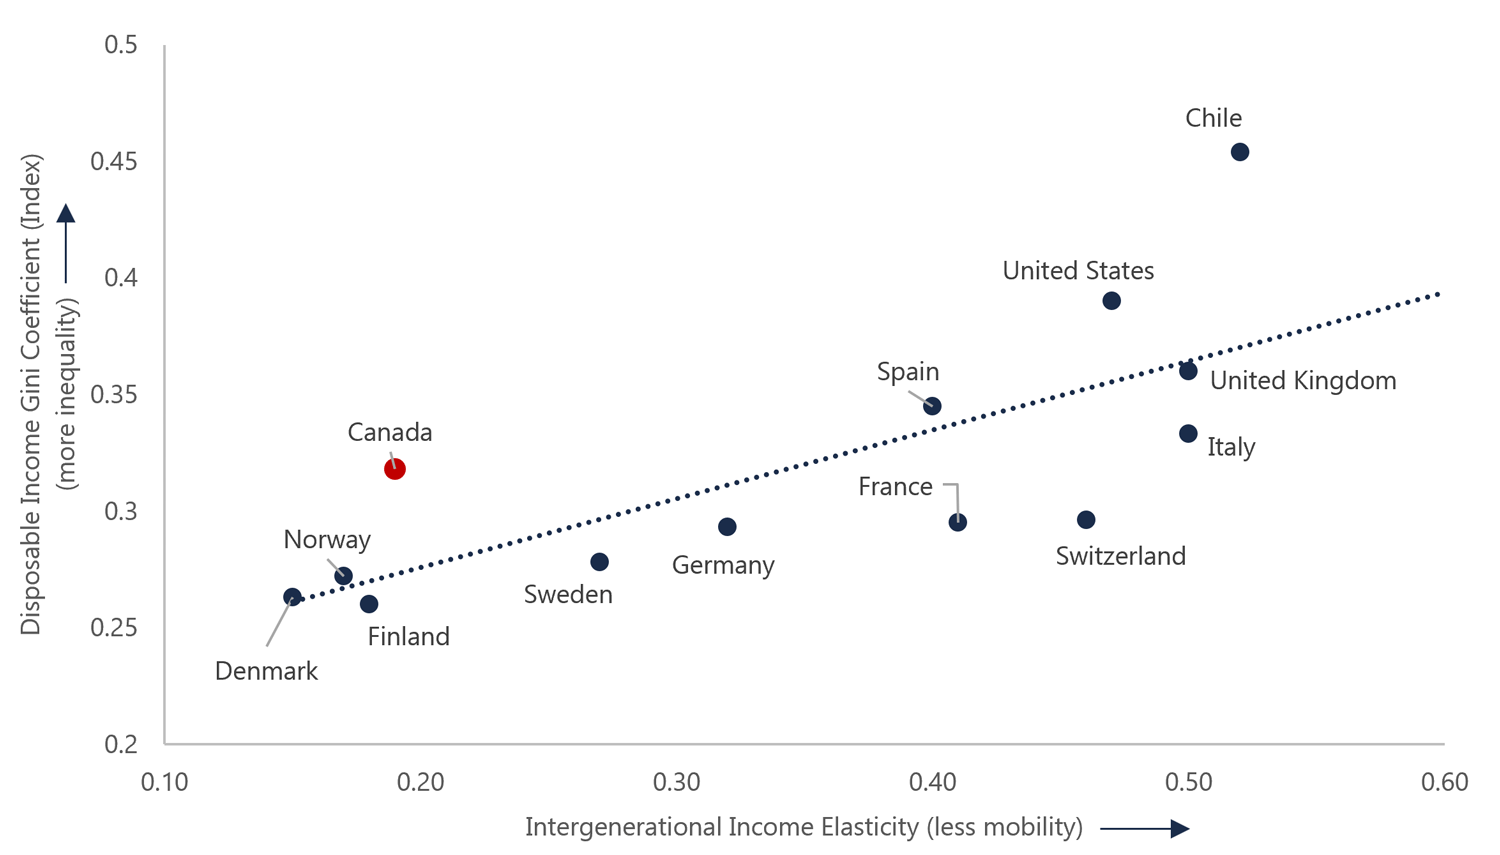
Note: Elasticities for Ontario and Canada are from Corak (2017), while other country elasticities are from Corak (2016) and collected by Corak from various studies. Gini coefficients are from the OECD database for 2015, the most recent year that includes data for each country.
Source: Miles Corak (2017) Divided Landscapes of Economic Opportunity: The Canadian Geography of Intergenerational Income Mobility and Miles Corak (2016) Inequality from Generation to Generation: The United States in Comparison and OECD.
There is also some consensus among researchers that education plays the most important role in increasing intergenerational income mobility. For example, a recent study using the Longitudinal and International Survey of Adults found that the educational attainment of children was the single largest factor explaining the correlation between children’s and parents’ income in Canada.[52]
Other factors frequently suggested as determinants of intergenerational income mobility include: family resources and connections; certain cognitive and non-cognitive skills; location of residence; health; immigration status; and the attainment of specific work-related skills (such as communication).[53] However, the causal relationship between these factors and intergenerational income mobility remains ambiguous because of the complex relationships among the many factors.[54]
4. Incomes and the changing economic environment
Summary
- Despite a growing economy, increases in Ontario’s economic output over the past three decades have not translated into comparable gains in the market income of the median working-age Ontarian.
- Median wages have stagnated since 1997, while a rising share of economy-wide income growth is being earned as corporate profits.
- Two broad, inter-related structural changes in the economy and labour market have contributed to these trends in Ontario incomes.
- Ontario’s industrial composition has changed dramatically over the past three decades, with job growth concentrated in the service sector, while manufacturing employment has declined.
- Over the same period, the structure of the Ontario labour market has also changed. Non-standard work – that is, part-time and temporary employment – has become increasingly common, while the share of unionized jobs has declined. These labour market trends have put downward pressure on wages.
- Ontario is not alone in experiencing these changes. OECD research has shown that slowing income growth, rising income inequality and declining income mobility are common across many developed economies.[55] Globalization and rapid technological advances have been key contributors to these broad structural changes.
- Due to the globalization of goods markets, export industries in developed economies are increasingly competing with firms in developing, low-wage economies. This has contributed to declines in output and downward pressure on wages in these industries.
- Scientific advances, particularly in information technologies, are leading to increased automation for many sectors and occupations. In turn, this has contributed to strong wage growth for high-skilled occupations coupled with stagnant wages for lower-skilled workers.
- The sharp appreciation of the Canadian dollar during the 2000s – which hurt the competitiveness of export industries – also played a significant role in the relative decline of Ontario’s manufacturing sector. Over this same period, a commodity price boom led to strong income gains in resource-rich provinces, partly explaining the divergence in income growth between Ontario and the rest of Canada.
Ontario’s economic growth not translating into higher median incomes
Between 1981 and 2016, output per worker in Ontario increased by 49 per cent.[56] Over this same period, the average market earnings of working-age Ontarians rose by 19 per cent.
However, in sharp contrast, the market income of the median working-age Ontarian (the individual at the mid-point of the income distribution) increased by just 3 per cent (Figure 4.1).
Figure 4.1 Economic growth did not raise the median income of working-age Ontarians
Note: Real GDP per worker is calculated as real GDP divided by the labour force.
Source: Statistics Canada Labor Force Survey, Income and Expenditure Accounts, Canadian Income Survey and FAO.
The stronger growth of average market income, compared with the median, implies that Ontarians in the upper half of the income distribution are benefiting from much stronger income growth than those in the lower half – a fact that was explored in Chapter 1 of this report.
However, the even stronger gains in economy-wide income (as measured by output per worker) implies that the income generated through economic growth is not being broadly shared with all Ontarians.
The underperformance of median income relative to output per worker can partly be explained by the weak growth of wages.
In Ontario, the median wage increased by less than one dollar (or by less than 3 per cent) in total from 1997 to 2017, after adjusting for inflation.
Figure 4.2 Median hourly wages have stagnated
Source: Statistics Canada Labor Force Survey and FAO.
In addition, a rising share of the gains from Ontario’s economic growth has been earned as a return to capital (largely corporate profits) since 1981.
Figure 4.3 Share of economy-wide income paid as corporate income has increased
Source: Statistics Income and Expenditure Accounts and FAO.
Trends in Ontario’s incomes over the past several decades have been influenced by a wide range of factors. However, broad interrelated structural changes to both Ontario’s industrial composition and labour market have played major roles.
Ontario’s industrial composition has changed
Figure 4.4 Job growth has been dominated by Ontario’s service sector
Source: Statistics Canada Labour Force Survey.
Figure 4.5 Decline in manufacturing jobs
Source: Statistics Canada Labour Force Survey.
The experience of Ontario’s manufacturing sector has been particularly dramatic. Employment in the sector has declined from a high of 1.1 million in 2004 to 770,000 jobs in 2017. In 2000, manufacturing jobs accounted for 18 per cent of total employment; by 2017, this share had declined to 11 per cent.
According to the OECD, the increased integration of the global economy has contributed to a similar shift in the industrial composition of many developed economies. Export industries in high-wage countries are increasingly competing with firms in developing, low-wage economies, leading to the “offshoring” of labour-intensive tasks, particularly in manufacturing.[57]
Figure 4.6 Growth in Ontario’s GDP per worker has lagged that of other provinces since 2000
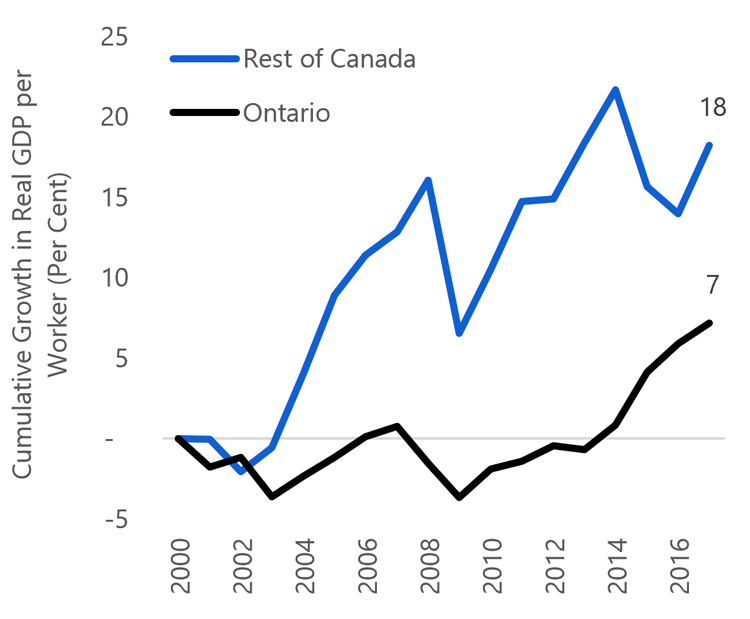
Note: The average for the rest of Canada is calculated as a weighted average.
Source: Statistics Canada Labour Force Survey, Income and Expenditure Accounts and FAO.
Globalization and increased international competition played an important role in the decline of manufacturing jobs in Ontario. However, the sharp appreciation of the Canadian dollar during the 2000s also contributed to an erosion in the competitiveness of Ontario firms exporting to the United States.
At the same time, slower economic growth in the United States also contributed to weaker demand for Ontario exports. These factors were significant drivers in the decline of Ontario’s manufacturing sector after 2000.[58]
Ontario’s economy was also more severely impacted by these competitive challenges than other provinces, partly explaining the divergence in income growth between Ontario and the rest of Canada.
The commodity price boom of the early 2000s (which coincided with the appreciation of the Canadian dollar) led to strong income gains in resource-rich provinces, while Ontario’s real GDP per worker was flat between 2000 and 2014. More recently, Ontario’s GDP per worker has shown solid growth, while lower commodity prices have held back gains in other provinces.
Structural changes in Ontario’s labour market
Over the past few decades, globalization and technological advances have contributed to significant structural changes in Ontario’s labour market. In particular, Ontario has experienced a rise in non-standard employment and a decline in the share of unionized jobs.
Rise in non-standard employment
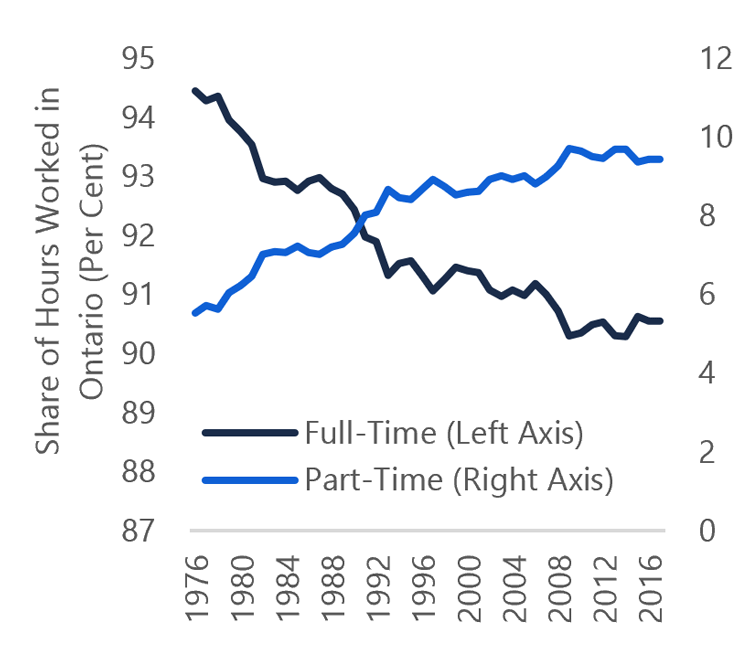
From 1976 to 2000, the share of part-time work in Ontario’s economy increased, while the share of full-time positions declined. This trend continued after 2000 but at a more moderate pace. Since full-time employment typically pays higher wages than part-time work[59], the declining share of fulltime work has put downward pressure on average hourly wage growth in Ontario.
Figure 4.7More part-time work
Source: Statistics Canada Labour Force Survey and FAO.
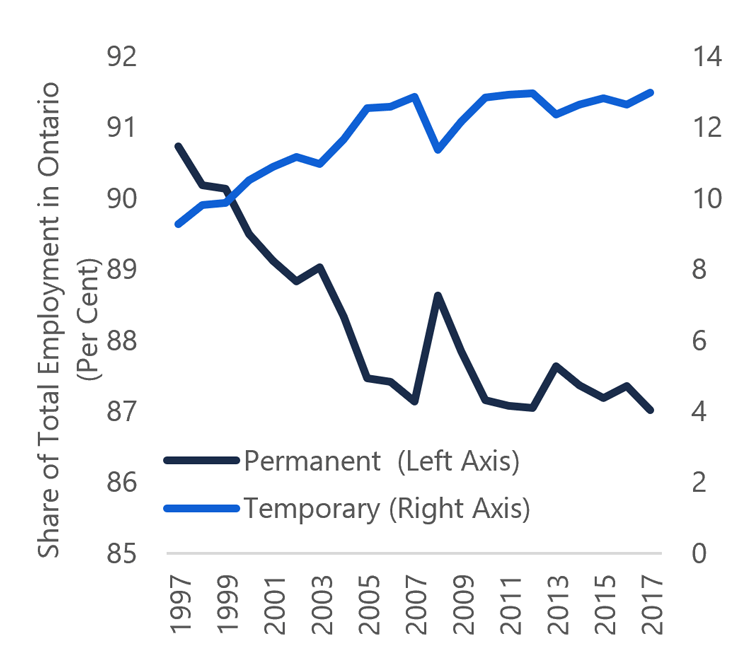
Similarly, the increasing use of temporary workers in many industries has also contributed to slower hourly wage growth in Ontario. From 1997 to 2017, the share of lower-paid temporary workers increased by almost 4 percentage points, while the share of permanent jobs declined by the same amount.[60]This rise in lower-paid temporary work also contributed to slower overall wage growth in Ontario.
Figure 4.8Increase in share of temporary work
Source: Statistics Canada Labour Force Survey and FAO.
Less unionized work
Unionized workers tend to earn higher wages than non-unionized workers for the same work.[61] However, the unionization rate – the share of workers represented by a union – declined from 30 per cent in 1997 to 27 per cent in 2017. The unionization rate in the goods sector declined more steeply, from 35 per cent in 1997 to 25 per cent in 2017.
Figure 4.9Decline in share of unionized work since 1997
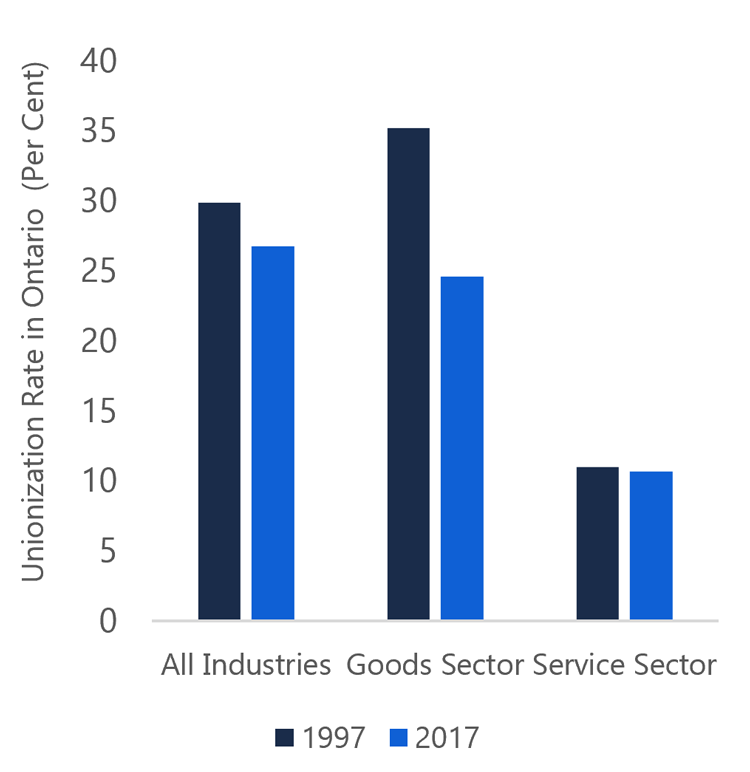
Source: Statistics Canada Labour Force Survey and FAO.
Based on OECD research, these labour market changes have contributed to slower income growth, rising inequality and declining income mobility in many developed economies. But importantly, the pay gap between standard work (full-time, permanent jobs) and non-standard work (temporary, part-time or selfemployed work) is much wider in Canada than the average across OECD countries.[62]
Wage growth uneven among Ontario’s occupations
A shifting industrial composition, coupled with an evolving labour market, has resulted in significant changes to the nature of work in Ontario. In addition, dramatic scientific advances, particularly in information technologies, have contributed to increased automation in many industries and occupations.[63]
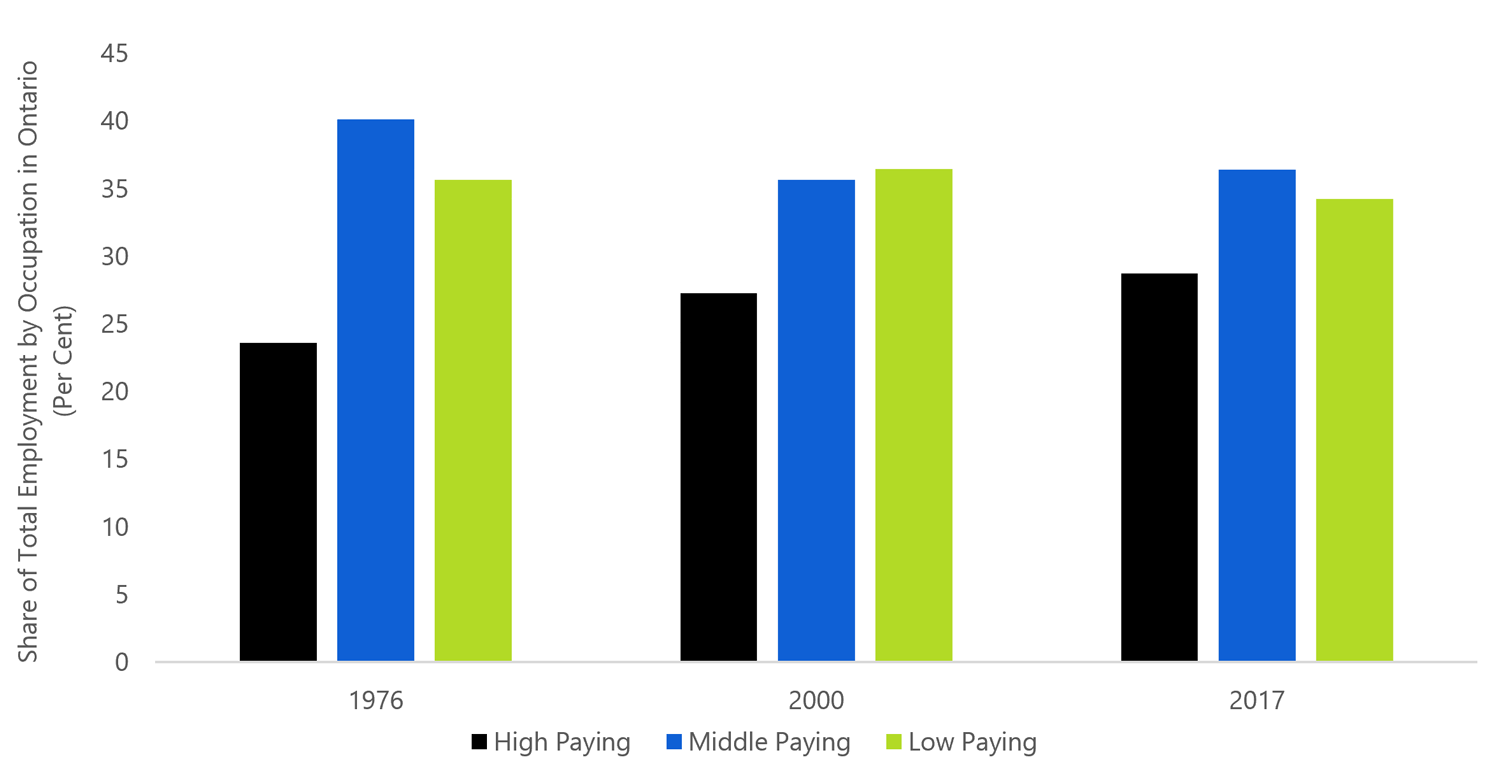
Grouping occupations in Ontario into high paying, middle paying and low paying[64] shows that the share of middle-paying jobs declined from 1976 to 2000, while the shares of high- and low-paying jobs increased.[65]
Since 2000, the share of low-paying jobs declined slightly, while the share of middle- and high-paying jobs increased modestly.
Figure 4.10 Modestly more higher paying occupations since 2000
Source: Statistics Canada Labour Force Survey and FAO.
Figure 4.11Ontario’s growing wage premium in higher-skilled jobs (2000-2017)
.png)
Source: Statistics Canada Labour Force Survey and FAO.
Between 2000 and 2017, economy-wide real hourly wages increased at an annual average rate of 0.5 per cent. However, there has been a wide disparity in wage growth between low-, medium-, and high-paying occupations.
During this period, average wages for the highest-paying occupations outpaced more modest wage gains in middle-paying jobs. By contrast, average wages for the lowest-paying occupations have stagnated, except for natural resource-based occupations.[66]
Strong wage growth in high paying occupations coupled with weaker wage growth in the middle- and lower-paying occupations contributed to the increase in market income inequality in Ontario since 2000.
5. Appendices
Ontario’s family income distribution
Figure A.1 Market income percentiles[67], 2016
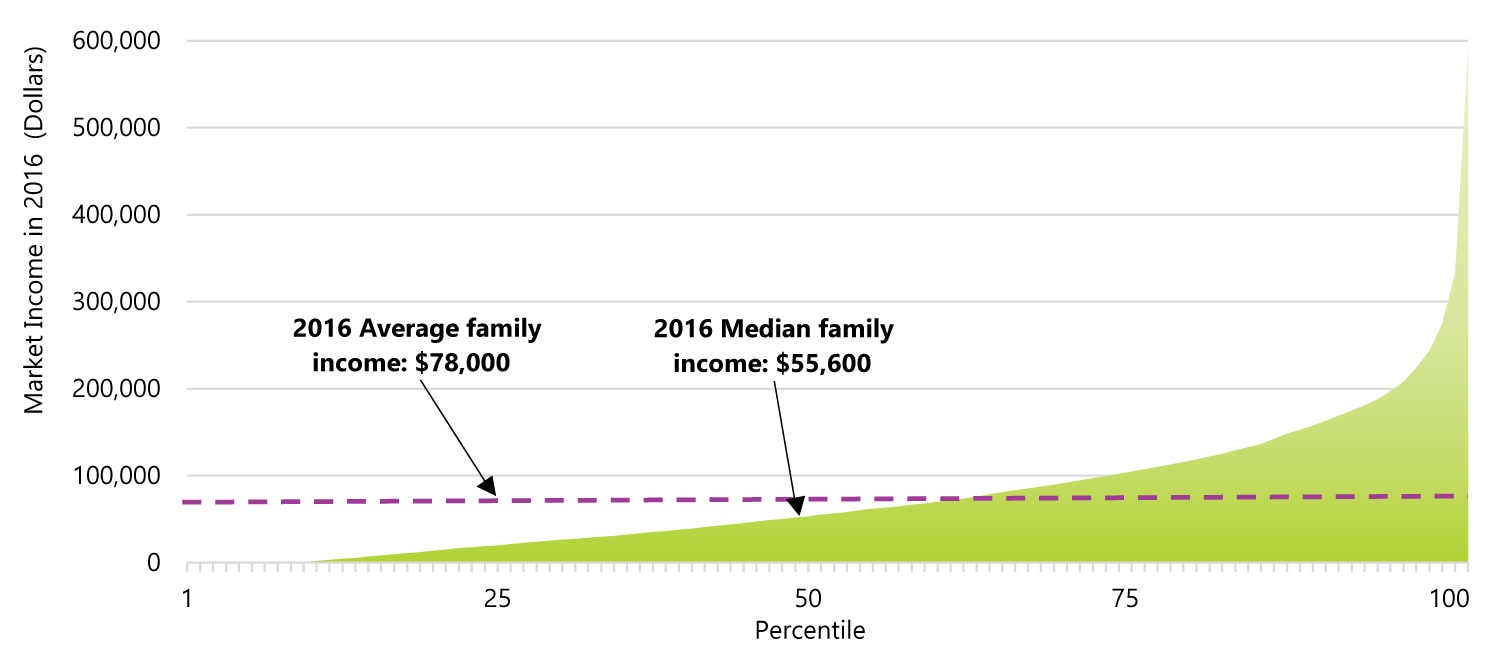
Source: Statistics Canada Canadian Income Survey Custom Tabulation and FAO.
Figure A.2 After-tax income percentiles, 2016
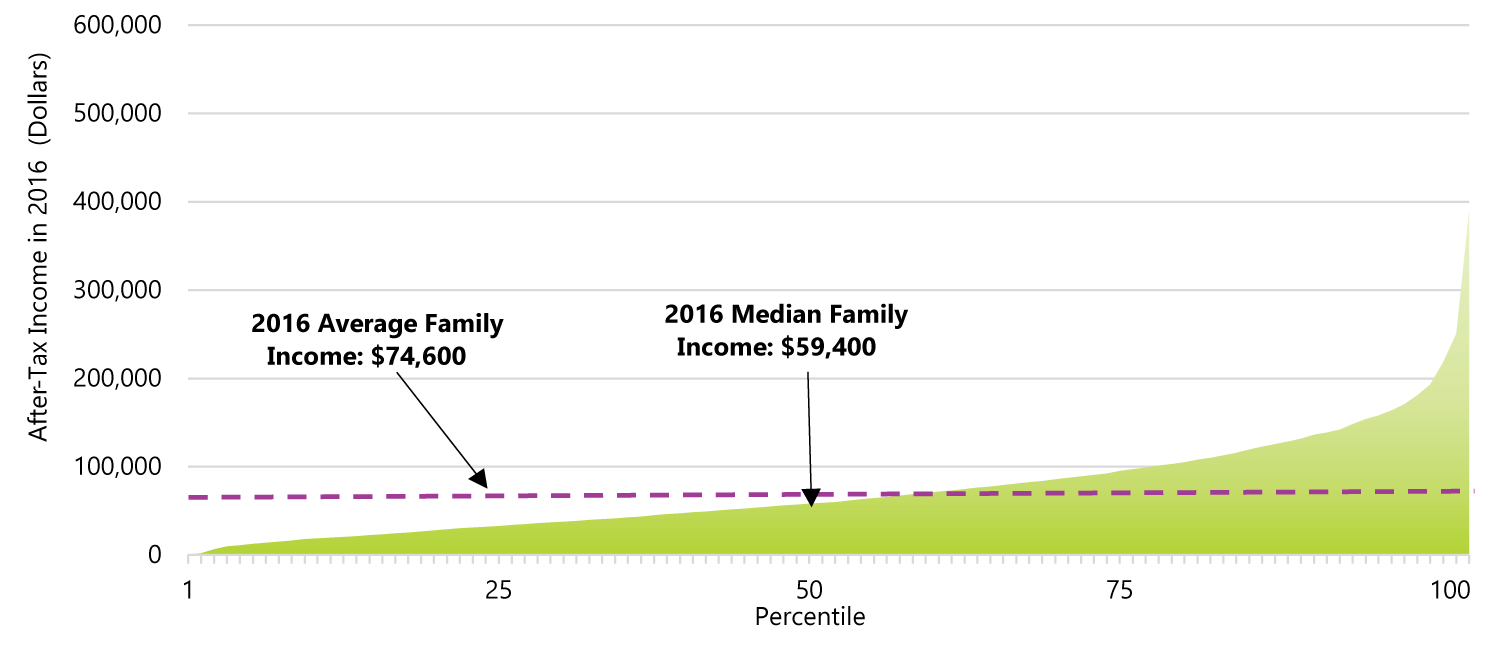
Source: Statistics Canada Canadian Income Survey Custom Tabulation and FAO.
Income by region
While this report focused on Ontario-wide incomes, the Census provides household income data[68] for sub-provincial regions. In Ontario, median household income varies considerably across census divisions.[69]
In 2015, areas with the highest median household incomes were located in census divisions surrounding Toronto as well as in the Ottawa region. Households in rural and northern areas had lower levels of median income.
Figure B.1 Median household income across census divisions in Ontario
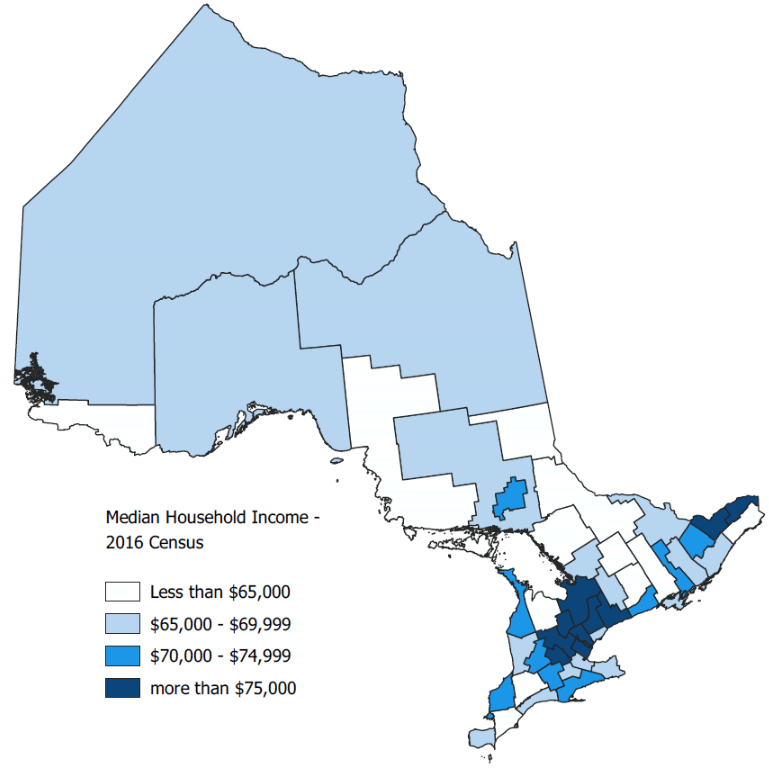
Source: Statistics Canada Census and FAO.
Data tables
| Income (2016 Constant Dollars) | Compound Average Growth Rate (Per Cent) | |||||
|---|---|---|---|---|---|---|
| 1976 | 2000 | 2016 | 1976–2000 | 2000–2016 | 1976–2016 | |
| Median Market Income | ||||||
| All Families and Singles* | 59,200 | 56,700 | 55,600 | -0.2 | -0.1 | -0.2 |
| All Families | 72,000 | 77,600 | 79,900 | 0.3 | 0.2 | 0.3 |
| Senior Families** | 21,100 | 25,400 | 35,700 | 0.8 | 2.2 | 1.3 |
| Working-age Families*** | 76,900 | 85,500 | 91,900 | 0.4 | 0.5 | 0.4 |
| Couples | 72,000 | 79,500 | 90,700 | 0.4 | 0.8 | 0.6 |
| Couples with Children | 79,100 | 94,500 | 100,200 | 0.7 | 0.4 | 0.6 |
| Single-parent Families | 21,100 | 36,300 | 22,600 | 2.3 | -2.9 | 0.2 |
| Couples with Other Relatives | 105,700 | 120,600 | 124,500 | 0.6 | 0.2 | 0.4 |
| Other Working-age Families | 49,500 | 63,200 | 67,900 | 1.0 | 0.4 | 0.8 |
| All Singles | 24,100 | 21,300 | 24,200 | -0.5 | 0.8 | 0.0 |
| Senior Singles | 4,100 | 8,000 | 14,000 | 2.8 | 3.6 | 3.1 |
| Working-age Singles | 33,500 | 32,300 | 29,900 | -0.2 | -0.5 | -0.3 |
| Median After-Tax Income | ||||||
| All Families and Singles* | 54,700 | 55,100 | 59,400 | 0.0 | 0.5 | 0.2 |
| All Families | 64,900 | 71,300 | 80,800 | 0.4 | 0.8 | 0.5 |
| Senior Families** | 35,600 | 48,400 | 59,100 | 1.3 | 1.3 | 1.3 |
| Working-age Families*** | 67,800 | 75,400 | 87,400 | 0.4 | 0.9 | 0.6 |
| Couples | 63,800 | 68,600 | 81,400 | 0.3 | 1.1 | 0.6 |
| Couples with Children | 70,800 | 81,200 | 95,600 | 0.6 | 1.0 | 0.8 |
| Single-parent Families | 27,100 | 40,400 | 39,300 | 1.7 | -0.2 | 0.9 |
| Couples with Other Relatives | 93,500 | 106,000 | 116,900 | 0.5 | 0.6 | 0.6 |
| Other Working-age Families | 48,700 | 66,800 | 70,600 | 1.3 | 0.3 | 0.9 |
| All Singles | 25,900 | 26,800 | 29,300 | 0.1 | 0.6 | 0.3 |
| Senior Singles | 15,100 | 23,400 | 29,600 | 1.8 | 1.5 | 1.7 |
| Working-age Singles | 31,100 | 29,800 | 29,100 | -0.2 | -0.1 | -0.2 |
| Number (x1000) | Share of Total (Per Cent) | |||||
|---|---|---|---|---|---|---|
| 1976 | 2000 | 2016 | 1976 | 2000 | 2016 | |
| Families | ||||||
| All Families and Singles* | 2,962 | 4,602 | 5,733 | 100.0 | 100.0 | 100.0 |
| All Families | 2,206 | 3,202 | 3,800 | 74.5 | 69.6 | 66.3 |
| Senior Families** | 238 | 454 | 734 | 8.0 | 9.9 | 12.8 |
| Working-age Families*** | 1,967 | 2,748 | 3,067 | 66.4 | 59.7 | 53.5 |
| Couples | 446 | 661 | 798 | 15.1 | 14.4 | 13.9 |
| Couples with Children | 1,136 | 1,206 | 1,162 | 38.4 | 26.2 | 20.3 |
| Single-parent Families | 124 | 242 | 239 | 4.2 | 5.3 | 4.2 |
| Couples with Other Relatives | 192 | 360 | 497 | 6.5 | 7.8 | 8.7 |
| Other Working-age Families | 69 | 279 | 371 | 2.3 | 6.1 | 6.5 |
| All Singles | 757 | 1,399 | 1,933 | 25.6 | 30.4 | 33.7 |
| Senior Singles | 218 | 384 | 550 | 7.4 | 8.3 | 9.6 |
| Working-age Singles | 539 | 1,016 | 1,383 | 18.2 | 22.1 | 24.1 |
| Persons | ||||||
| All Families and Singles* | 8,329 | 11,587 | 13,806 | 100.0 | 100.0 | 100.0 |
| All Families | 7,573 | 10,188 | 11,873 | 90.9 | 87.9 | 86.0 |
| Senior Families** | 561 | 999 | 1,608 | 6.7 | 8.6 | 11.6 |
| Working-age Families*** | 7,012 | 9,188 | 10,264 | 84.2 | 79.3 | 74.3 |
| Couples | 891 | 1,322 | 1,597 | 10.7 | 11.4 | 11.6 |
| Couples with Children | 4,906 | 5,004 | 5,026 | 58.9 | 43.2 | 36.4 |
| Single-parent Families | 395 | 731 | 703 | 4.7 | 6.3 | 5.1 |
| Couples with Other Relatives | 659 | 1,323 | 1,898 | 7.9 | 11.4 | 13.7 |
| Other Working-age Families | 160 | 808 | 1,041 | 1.9 | 7.0 | 7.5 |
| All Singles | 757 | 1,399 | 1,933 | 9.1 | 12.1 | 14.0 |
| Senior Singles | 218 | 384 | 550 | 2.6 | 3.3 | 4.0 |
| Working-age Singles | 539 | 1,016 | 1,383 | 6.5 | 8.8 | 10.0 |
| Income (2016 Constant Dollars) | Compound Average Growth Rate (Per Cent) | |||||
|---|---|---|---|---|---|---|
| 1976 | 2000 | 2016 | 1976–2000 | 2000–2016 | 1976–2016 | |
| Market Income | ||||||
| Lowest Quintile | 9,450 | 7,400 | 6,750 | -1.0 | -0.6 | -0.8 |
| Second Quintile | 27,100 | 27,600 | 27,150 | 0.1 | -0.1 | 0.0 |
| Middle Quintile | 38,100 | 43,750 | 45,550 | 0.6 | 0.3 | 0.4 |
| Fourth Quintile | 51,450 | 61,200 | 67,700 | 0.7 | 0.6 | 0.7 |
| Highest Quintile | 89,200 | 122,600 | 130,250 | 1.3 | 0.4 | 1.0 |
| After-Tax Income | ||||||
| Lowest Quintile | 14,800 | 16,300 | 18,600 | 0.4 | 0.8 | 0.6 |
| Second Quintile | 26,650 | 29,750 | 33,800 | 0.5 | 0.8 | 0.6 |
| Middle Quintile | 34,550 | 40,400 | 46,600 | 0.7 | 0.9 | 0.8 |
| Fourth Quintile | 44,900 | 52,550 | 61,300 | 0.7 | 1.0 | 0.8 |
| Highest Quintile | 71,250 | 91,850 | 103,200 | 1.1 | 0.7 | 0.9 |
Glossary
| Term | Description |
|---|---|
| After-tax income | Market income plus government transfers less taxes paid (i.e. total income received less taxes paid). |
| Census division | Grouping of neighbouring municipalities sharing common services and regional planning. |
| Gini coefficient | A measure which summarizes the degree of inequality across the entire income distribution in a single number that ranges from zero to one. The higher the value of the Gini coefficient, the more unequal is the distribution of income. Trends in the Gini coefficient over time are a useful indicator of the direction of income inequality. |
| Market income | Earnings from employment, investment returns, private pension income and other private sources (i.e. income before taxes and transfers). |
| Median income | The income of the family or individual at the mid-point of the income distribution. |
| Income quintile | Division of all Ontarians into five equal groups after sorting their annual income from lowest to highest. Each income quintile represents 20 per cent or one-fifth of the population. |
| Intergenerational income elasticity | Measure of the extent to which parents’ incomes impact their children’s adult income. Represents the expected per cent increase in the children’s future total income for every percentage point increase in the parents’ total income. The higher the elasticity, the more a parent’s income positively influences their children’s future income as adults. |
| Intergenerational income mobility | Measure of the extent to which a family’s economic position in one generation influences the economic position of their children in adulthood. Typically estimated by intergenerational income elasticities. |
| Output per worker | Real GDP per worker, calculated as real GDP divided by number of individuals in the labour force. |
| Relative income mobility | In this report, defined as the share of working-age Ontarians who move up or down at least one income quintile over five years. Upward income mobility refers to the share of working-age Ontarians who move up at least one income quintile over a five-year period, and downward income mobility refers to the share of working-age Ontarians who move down at least one quintile over a five-year period. |
| Relative income immobility | Defined as the share of working-age Ontarians who remain in the same income quintile over a five-year period. |
| Tax and transfer system | Federal and provincial income taxes, as well as social benefit programs administered by all levels of government. Important transfer programs include the Canada Pension Plan, Guaranteed Income Supplement, Employment Insurance, child benefits and social assistance programs. |
Note: Numbers may not add up due to rounding.
This chart shows the incidence of low income for seniors in families, working-age people in families, working-age singles and youth in female single-parent families in Ontario in 2016. The chart uses three low-income measures: (1) an after-tax low-income measure, (2) an after-tax low-income cut-off and (3) a market basket measure.
Using the after-tax low-income measure, the incidence of low income was 6.3 per cent for seniors in families, 10.3 per cent for working-age people in families, 29.1 per cent for working-age singles and 49.2 per cent for youth in female single-parent families.
Using the after-tax income cut-off measure, the incidence of low income was 2.5 per cent for seniors in families, 5.4 per cent for working-age people in families, 34.6 per cent for working-age singles and 32.4 per cent for youth in female single-parent families.
Using the market basket measure, the incidence of low income was 3.1 per cent for seniors in families, 8.3 per cent for working-age people in families, 38 per cent for working-age singles and 43.2 per cent for youth in female single-parent families.
This chart shows the share of working-age Ontarians remaining in the same income quintile over a 5-year period, categorized by quintile for the periods of 1982 to 1987 and 2011 to 2016.
For the lowest quintile, the share was 44.7 per cent from 1982 to 1987 and 55.1 per cent from 2011 to 2016.
For the second quintile, the share was 28.9 per cent from 1982 to 1987 and 39.2 per cent from 2011 to 2016.
For the middle quintile, the share was 31.5 per cent from 1982 to 1987 and 37.5 per cent from 2011 to 2016.
For the fourth quintile, the share was 47.2 per cent from 1982 to 1987 and 44.2 per cent from 2011 to 2016.
For the highest quintile, the share was 69 per cent from 1982 to 1987 and 73.2 per cent from 2011 to 2016.
This chart shows the share of working-age Ontarians moving up at least one income quintile in over a 5-year period, categorized by quintile for the periods of 1982 to 1987 and 2011 to 2016.
For the lowest quintile, the share was 55.2 per cent from 1982 to 1987 and 45 per cent from 2011 to 2016.
For the second quintile, the share was 58.8 per cent from 1982 to 1987 and 43.5 per cent from 2011 to 2016.
For the middle quintile, the share was 51.5 per cent from 1982 to 1987 and 40.6 per cent from 2011 to 2016.
For the fourth quintile, the share was 38.7 per cent from 1982 to 1987 and 30.7 per cent from 2011 to 2016.
This chart shows the share of working-age Ontarians moving down at least one income quintile over a 5-year period, categorized by quintile for the periods of 1982 to 1987 and 2011 to 2016.
For the second quintile, the share was 12.5 per cent from 1982 to 1987 and 17.4 per cent from 2011 to 2016.
For the middle quintile, the share was 17 per cent from 1982 to 1987 and 21.9 per cent from 2011 to 2016.
For the fourth quintile, the share was 24.3 per cent from 1982 to 1987 and 25.2 per cent from 2011 to 2016.
For the highest quintile, the share was 31.1 per cent from 1982 to 1987 and 26.8 per cent from 2011 to 2016.
Footnotes
[1] Core housing need is an indicator developed by the Canada Mortgage and Housing Corporation (CMHC) to identify households that need housing-related financial assistance. A household is in core housing need if it does not live in acceptable housing and its before-tax income is not sufficient to access acceptable housing. Housing is considered acceptable when the total cost of housing is equal to or less than 30 per cent of a household’s before-tax income, there are enough bedrooms to accommodate the size of the household and the housing is not in need of major repairs. In 2018, 13.9 per cent of households in Ontario were in core housing need, which was higher than the Canadian average of 11.6 per cent and was the second highest rate among all provinces.
[2] Chronic homelessness refers to people who are currently homeless and have been homeless for six months or more in the past year. In 2018, Ontario municipalities reported that there were over 16,000 Ontarians experiencing homelessness on any given night.
[3] Municipalities also spend approximately $1 billion each year in connection with the Province’s housing programs. Unlike the federal government’s contribution, municipal spending is not recorded as spending by the Province.
[4] The Province’s social housing wait list represents a compilation of data received from municipal service managers. It may include double counting of individuals on multiple local wait lists.
[5] The three new programs are the Canada-Ontario Community Housing Initiative (COCHI), the Ontario Priorities Housing Initiative (OPHI) and the Canada-Ontario Housing Benefit (COHB).
[6] The estimate of $4.0 billion includes $35 million of provincial spending in 2018-19 that has been allocated towards the NHS spending commitment and $168 million for the COHB program that the Province will spend in 2028-29.
[7] This consists of an increase of 45,200 households supported by rent supplements and 15,100 additional RGI units, as well as a loss of 5,000 below-market rent housing units.
[8] After accounting for population growth, the share of the Province’s households in core housing need will remain unchanged in 2027, compared to 2018, at 13.9 per cent.
[9] Vulnerable populations include survivors of domestic violence and human trafficking, people experiencing or at risk of experiencing homelessness, Indigenous people, and people with disabilities.
[10] Based on data from a number of communities in Ontario that conducted homelessness enumerations in 2018.
[11] Although the commitment to end chronic homelessness by 2025 was made by the previous government, the Ministry of Municipal Affairs and Housing confirmed with the FAO that the commitment to end chronic homelessness by the end of 2025 remains government policy.
[12] Nearly all homeless individuals in Ontario report that the lack of affordable housing options and long social housing wait lists are the main reasons they cannot obtain and retain housing.
[13] Excludes temporary COVID-19-related spending in 2020-21.
[14] Excludes temporary COVID-19 relief funding in 2020-21.
[15] Although support under the COHB program does not guarantee that a household will be removed from core housing need, it is sufficient to remove ‘high housing need’ households from risk of homelessness.
[16] National Housing Strategy Act, S.C. 2019, c. 29, s. 313.
[17] Statistics Canada, “Census of Canada,” 2011.
[18] Statistics Canada, “Canada Housing Survey,” 2018.
[19] Between 2011 and 2018, the average residential home resale price in Ontario increased by 68 per cent and the average market rent increased by 29 per cent, while median personal income increased by 24 per cent.
[20] Statistics Canada, “Canada Housing Survey,” 2018. In 2011, the rate of core housing need in Ontario was 13.4 per cent and the Canadian average was 12.5 per cent. Statistics Canada, “Census of Canada,” 2011.
[21] https://www.ontario.ca/document/community-housing-renewal-ontarios-action-plan-under-national-housing-strategy/housing-needs-ontario.
[22] In this report, high need households have after-tax income that is below the Low-Income Measure threshold, as defined by Statistics Canada, and spend 50 per cent or more of their gross income on the cost of shelter.
[23] 2018 point in time homelessness count from the municipalities of York, Toronto, Peel, Durham, Ottawa, Niagara, Thunder Bay, Waterloo, Peterborough, Sudbury, Nipissing, Kingston, Halton, Guelph, Brantford and Belleville.
[24] See Chapter 6 for analysis.
[25] Ibid.
[26] Municipalities in this report refers to municipal service managers and Indigenous Program Administrators.
[28] The estimated municipal contribution reflects reported municipal spending on provincial housing programs. See FAO, “Ontario Municipal Finances: An Overview of Municipal Budgets and an Estimate of the Financial Impact of the COVID-19 Pandemic,” 2020 for more information on municipal spending on housing and other programs.
[29] Social housing providers also offer some below-market rent units and rent supplements.
[30] For the purposes of this report, the term “rent supplements” refers to both rent supplements, which are rent subsidies paid to landlords, and housing allowances, which are rent subsidies paid to households.
[31] Under affordable housing programs, rent supplements may be tied to a household’s income. However, rent supplements do not limit a household’s rent or guarantee a household is spending less than 30 per cent of its gross income on shelter costs.
[32] The Housing Services Act, 2011 sets income limits that apply to most social housing programs and some affordable housing programs. However, municipal service managers have the authority to set higher income limits than prescribed in the Act and regulations. See O. Reg. 370/11 for household size and income limits by municipality, https://www.ontario.ca/laws/regulation/110370.
[33] Excludes home repair programs that provided repair assistance to an additional 8,500 homeowner households in 2018-19.
[34] Municipal service managers are required under the Housing Services Act, 2011 to provide 186,717 households with RGI assistance.
[35] Auditor General of Ontario, “Social and Affordable Housing,” 2017.
[36] The below-market rent unit and rent supplement subsidies represent the average difference between market rent and rent paid by a recipient household. The RGI unit subsidy represents the average difference between costs associated with operating and maintaining a social housing building and rent paid by a recipient household.
[37] Based on the FAO’s review of Statistics Canada, “Canada Housing Survey,” 2018.
[38] Between 2011 and 2018, the average residential home resale price in Ontario increased by 68 per cent and the average market rent increased by 29 per cent, while median personal income increased by 24 per cent. Ontario’s population also increased by 8 per cent.
[39] The Housing Services Act, 2011 requires municipal service managers to have a centralized wait list that is used to select eligible households for rent-geared-to-income assistance. The Province’s social housing wait list represents a compilation of data received from municipal service managers. It may include double counting of individuals on multiple local wait lists.
[40] According to the City of Toronto, the current wait time for a one-bedroom unit in Toronto is 12 years.
[41] See Appendix A for more information on the three new programs. In addition to the three federal-provincial funded components of the NHS, there are other federal initiatives that will affect the supply of affordable housing in Ontario. These programs are administered by the CMHC and do not affect the Province’s housing programs; therefore, detailed analysis of these components is outside the scope of this report. These programs include the National Housing Co-investment Fund, the Rapid Housing Initiative, the Rental Construction Financing Initiative and the Federal Lands Initiative.
[42] The estimate of $4.0 billion includes $35 million of provincial spending in 2018-19 that has been allocated towards the NHS spending commitment and $168 million for the COHB program that the Province will spend in 2028-29.
[43] See Government of Ontario, “Community Housing Renewal: Ontario’s Action Plan Under the National Housing Strategy.” Note that the Province projects that 215,632 households will receive support from NHS programs by 2027-28. However, the FAO excludes 6,584 households that will not receive direct housing support in 2027-28, including 3,248 households receiving housing support services (e.g., counselling and job placements) and 3,336 households that received one-year affordability assistance in 2019-20.
[44] See Appendix A for more information on the timing of funding under the three NHS programs.
[45] The FAO projects that the cost of housing will grow by 1.9 per cent annually on average from 2018 to 2027, which is higher than expected average annual per capita household income growth of 1.7 per cent. The FAO projects the number of households in Ontario to increase at an average annual rate of 1.1 per cent.
[46] Vulnerable populations include survivors of domestic violence and human trafficking, people experiencing or at risk of experiencing homelessness, Indigenous people, and people with disabilities.
[47] Ministry of Municipal Affairs and Housing, “Ontario’s Long-Term Affordable Housing Strategy,” 2016. The ministry confirmed with the FAO that the commitment to end chronic homelessness by the end of 2025 remains government policy.
[48] Auditor General of Ontario, “Social and Affordable Housing,” 2017.
[49] Ministry of Municipal Affairs and Housing, “Ontario’s Long-Term Affordable Housing Strategy,” 2016.
[50] The Province also offers social assistance programs including Ontario Works, the Ontario Disability Support Program and the Low-Income Energy Assistance Program that provide financial support including shelter allowances and energy arrears. Those programs are not administered by MMAH and are outside the scope of this report.
[51] The $566 million of COVID-19-related spending includes $234 million in federal funds. Of the $566 million in COVID-19-related spending, $498 million is part of the government’s Social Services Relief Fund, $26 million is for temporary pandemic pay and $42 million is for COVID-19 isolation centres.
[52] The commitment to end chronic homelessness formed a central piece of the Province’s five-year poverty reduction strategy that was in place from 2014 to 2019, as well as the 2016 Long-Term Affordable Housing Strategy. This included a commitment to increase CHPI funding to $339 million by 2019-20 and create the HFG program. In December 2020, the Province released a new five-year (2020 to 2025) poverty reduction strategy; however, the new strategy does not address the commitment to end chronic homelessness.
[53] See indicator 11 of the Ontario Poverty Reduction Strategy 2019 Annual Report, https://www.ontario.ca/page/poverty-reduction-strategy-2019-annual-report#section-3. The Province has committed to introduce a “by name list” approach to homelessness enumeration beginning in 2021.
[54] 2018 point in time homelessness count from the municipalities of York, Toronto, Peel, Durham, Ottawa, Niagara, Thunder Bay, Waterloo, Peterborough, Sudbury, Nipissing, Kingston, Halton, Guelph, Brantford and Belleville.
[55] This includes emergency shelters, transitional housing and violence against women shelters, https://www150.statcan.gc.ca/t1/tbl1/en/cv.action?pid=1410035301.
[56] City of Toronto daily and overnight shelter usage and 2018 Street Needs Assessment.
[57] According to data from municipal point in time homelessness counts, the most common causes of homelessness in Ontario are family conflict and addiction.
[58] From 2018 point in time homelessness counts from the municipalities of York, Toronto, Peel, Durham, Ottawa, Niagara, Thunder Bay, Waterloo, Peterborough, Sudbury, Nipissing, Kingston, Halton, Guelph, Brantford and Belleville.
[59] The spending projections exclude spending related to the COVID-19 pandemic in 2020-21.
[60] Excludes temporary COVID-19 relief funding in 2020-21.
[61] See Appendix 1 and 2 of Building a Strong Foundation for Success: Reducing Poverty in Ontario (2020-2025).
[62] Reaching Home: Canada’s Homelessness Strategy Directives.
[63] A list of the 26 designated communities in Ontario can be found on the Employment and Social Development Canada website at https://www.canada.ca/en/employment-social-development/programs/homelessness/find-community/on.html.
[64] To date, communities in Ontario have been allocated a total of $382 million, which includes $331 million of funding to support the program objectives from April 1, 2019 to March 31, 2024 and $51 million of additional funding to provide support during the COVID-19 pandemic. The FAO expects that the remaining funding will be allocated in future years.
[65] Parliamentary Budget Office, “Federal Spending on Housing Affordability,” 2019.
[66] ‘High housing need’ households spend 50 per cent or more of their gross income on shelter costs and have an after-tax income below the Low-Income Measure threshold, as defined by Statistics Canada. ‘High housing need’ households are a subset of core housing need households.
[67] See Chapter 5 for more information.
[68] In 2018-19, municipalities funded approximately 73 per cent of the cost of social housing.
[69] The FAO projects shelter costs for 2020 using data for the rent component of the Consumer Price Index as well as CMHC mortgage obligation data. The FAO forecasts shelter costs to 2027 using projections from its 2021 Winter Economic and Budget Outlook for personal disposable income, population growth, mortgage rates and housing market indicators.
[70] The Core Need Income Threshold is a measure developed by the CMHC, which reflects the maximum income level at which a household would have difficulty finding suitable affordable housing in its community.