


Comparing Ontario’s Fiscal Position with Other Provinces after the First Year of the COVID-19 Pandemic
Summary
This report provides a comparison of Ontario government revenue, program spending, budget balance, net debt and interest expense with other provinces based on Statistics Canada’s Government Finance Statistics (GFS).[1] The report focuses on results from the 2020-21 fiscal year,[2] referred to as 2020 throughout the report.
Ontario’s total revenue per capita was the second lowest in Canada
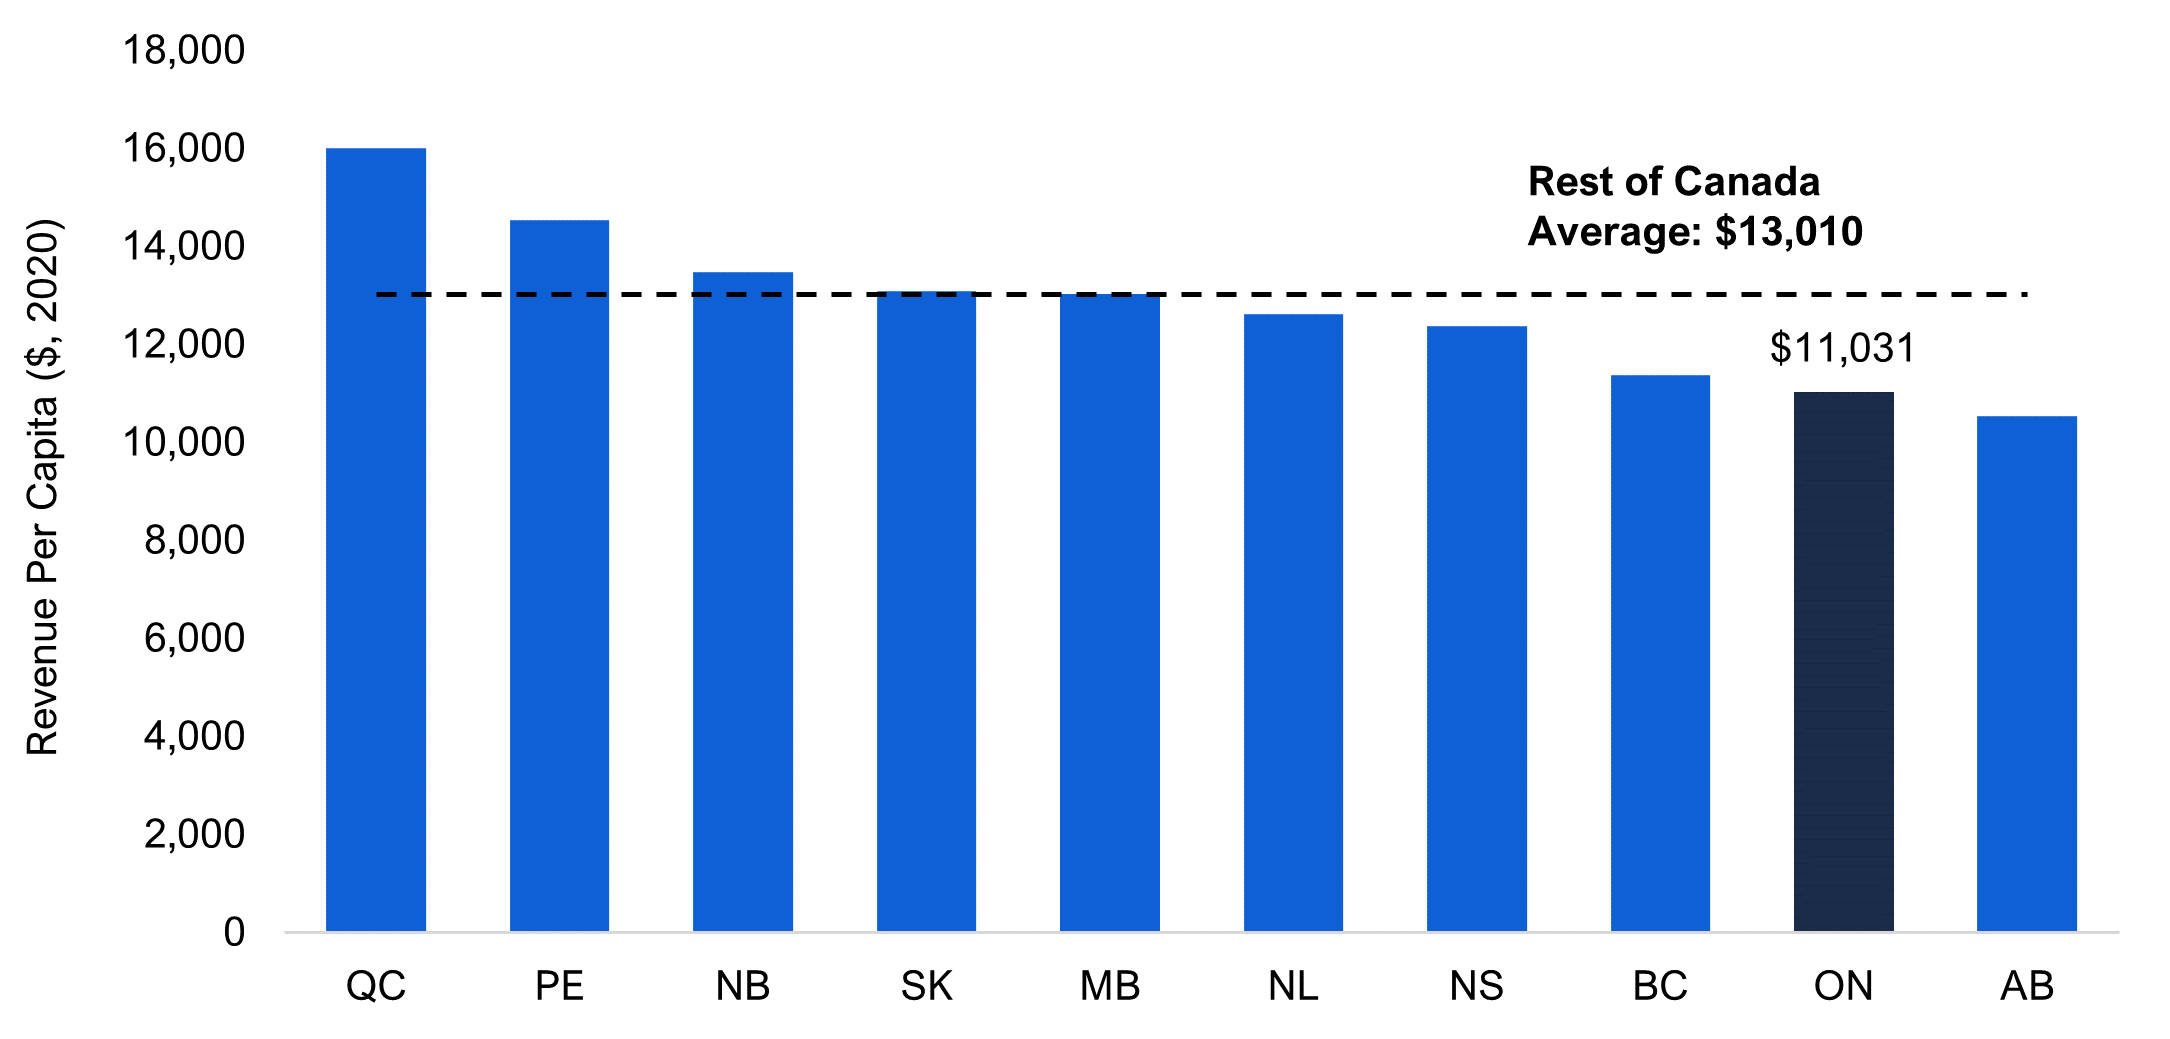
- In 2020, Ontario received $11,031 in revenue per capita, the second lowest in the country. Ontario’s lower revenue per capita reflects its low federal transfers and other revenues, slightly offset by the Province’s higher tax revenue per capita.
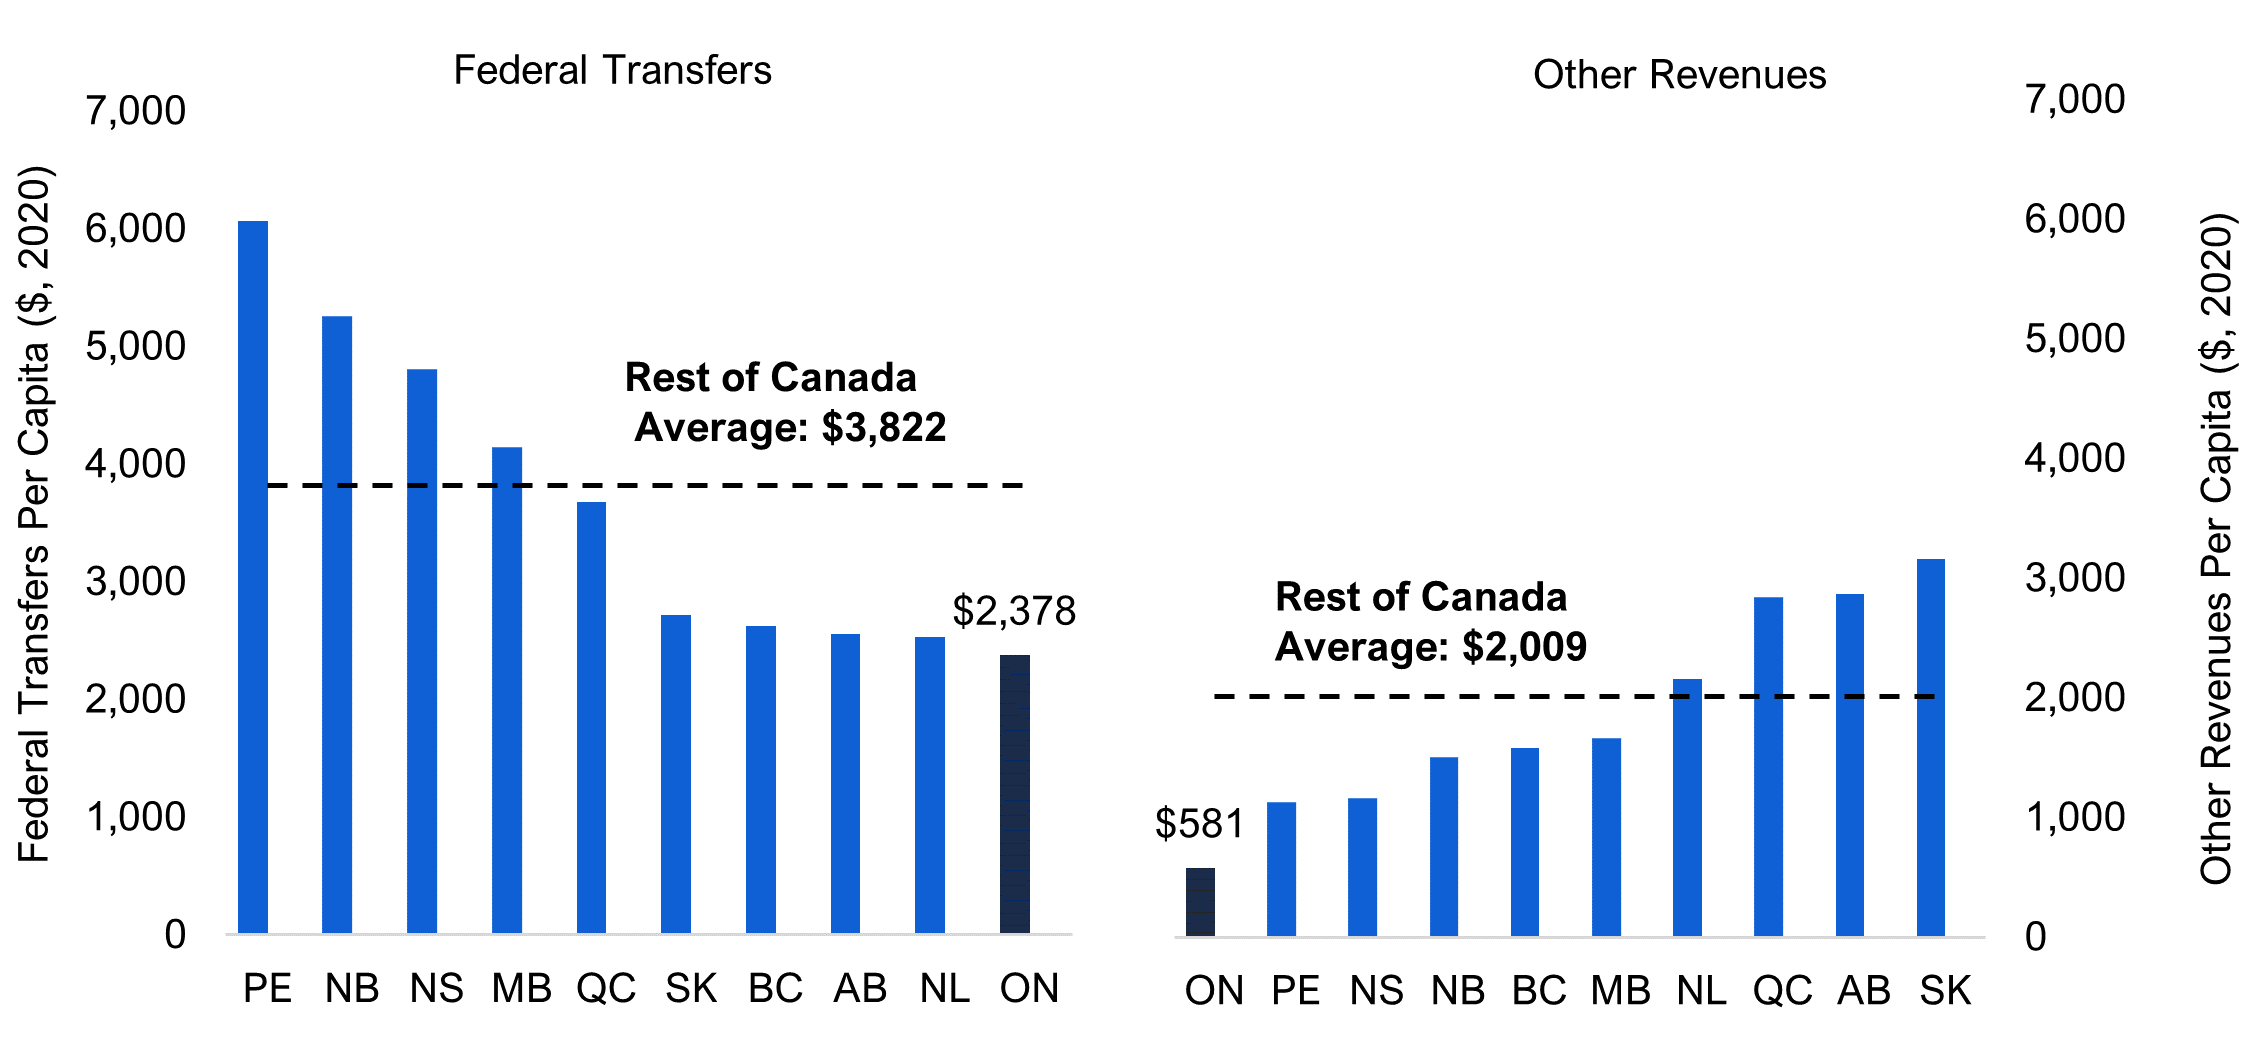
- Ontario received the lowest federal transfers per capita among the provinces in 2020, reflecting the Province’s greater ability to generate tax revenues relative to other provinces, which limits its eligibility to qualify for transfers such as Equalization payments. Since 2008,[3] Ontario has consistently received below-average transfers from the federal government.
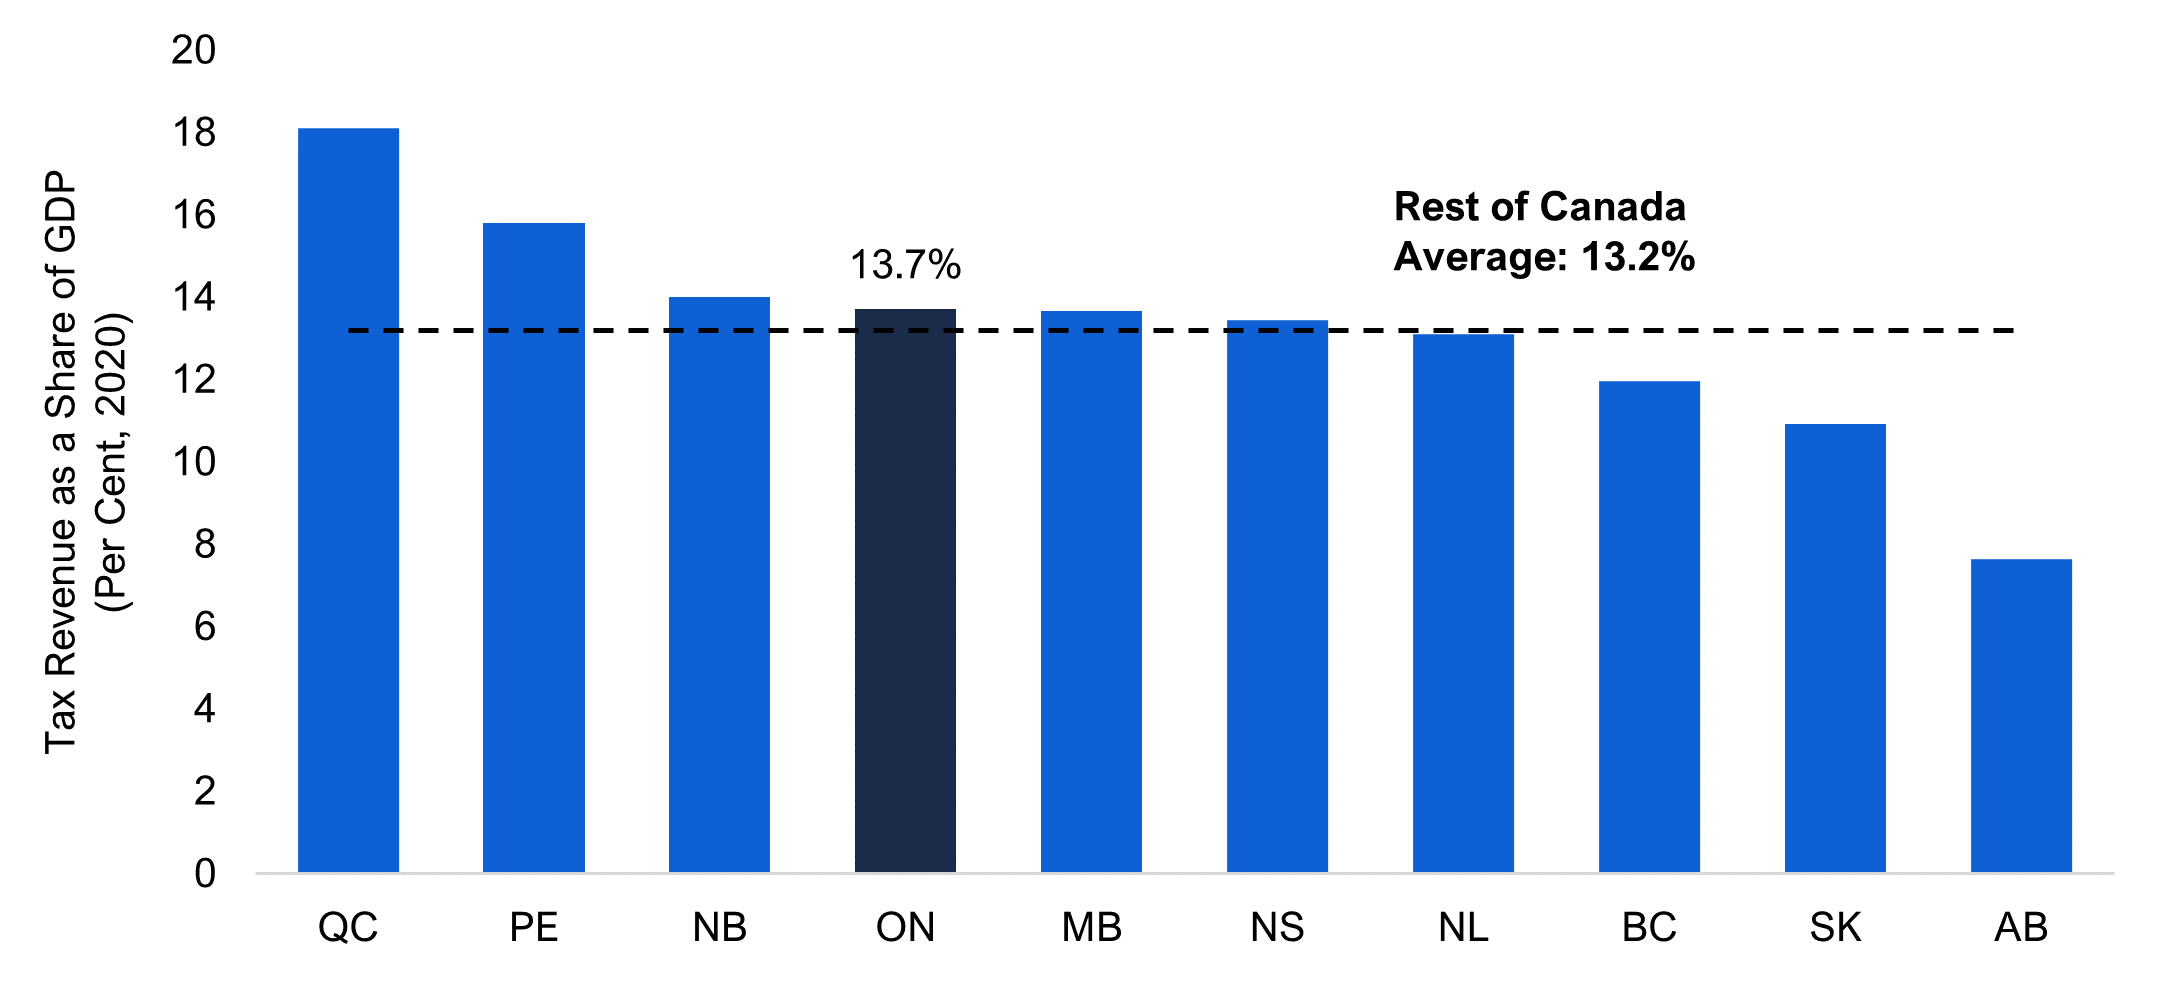
- Ontario received the second highest tax revenue per capita in 2020, reflecting in part the province’s stronger economic base. Measured against economic activity, tax revenue
(13.7 per cent of GDP) was slightly above the provincial average (13.2 per cent of GDP).
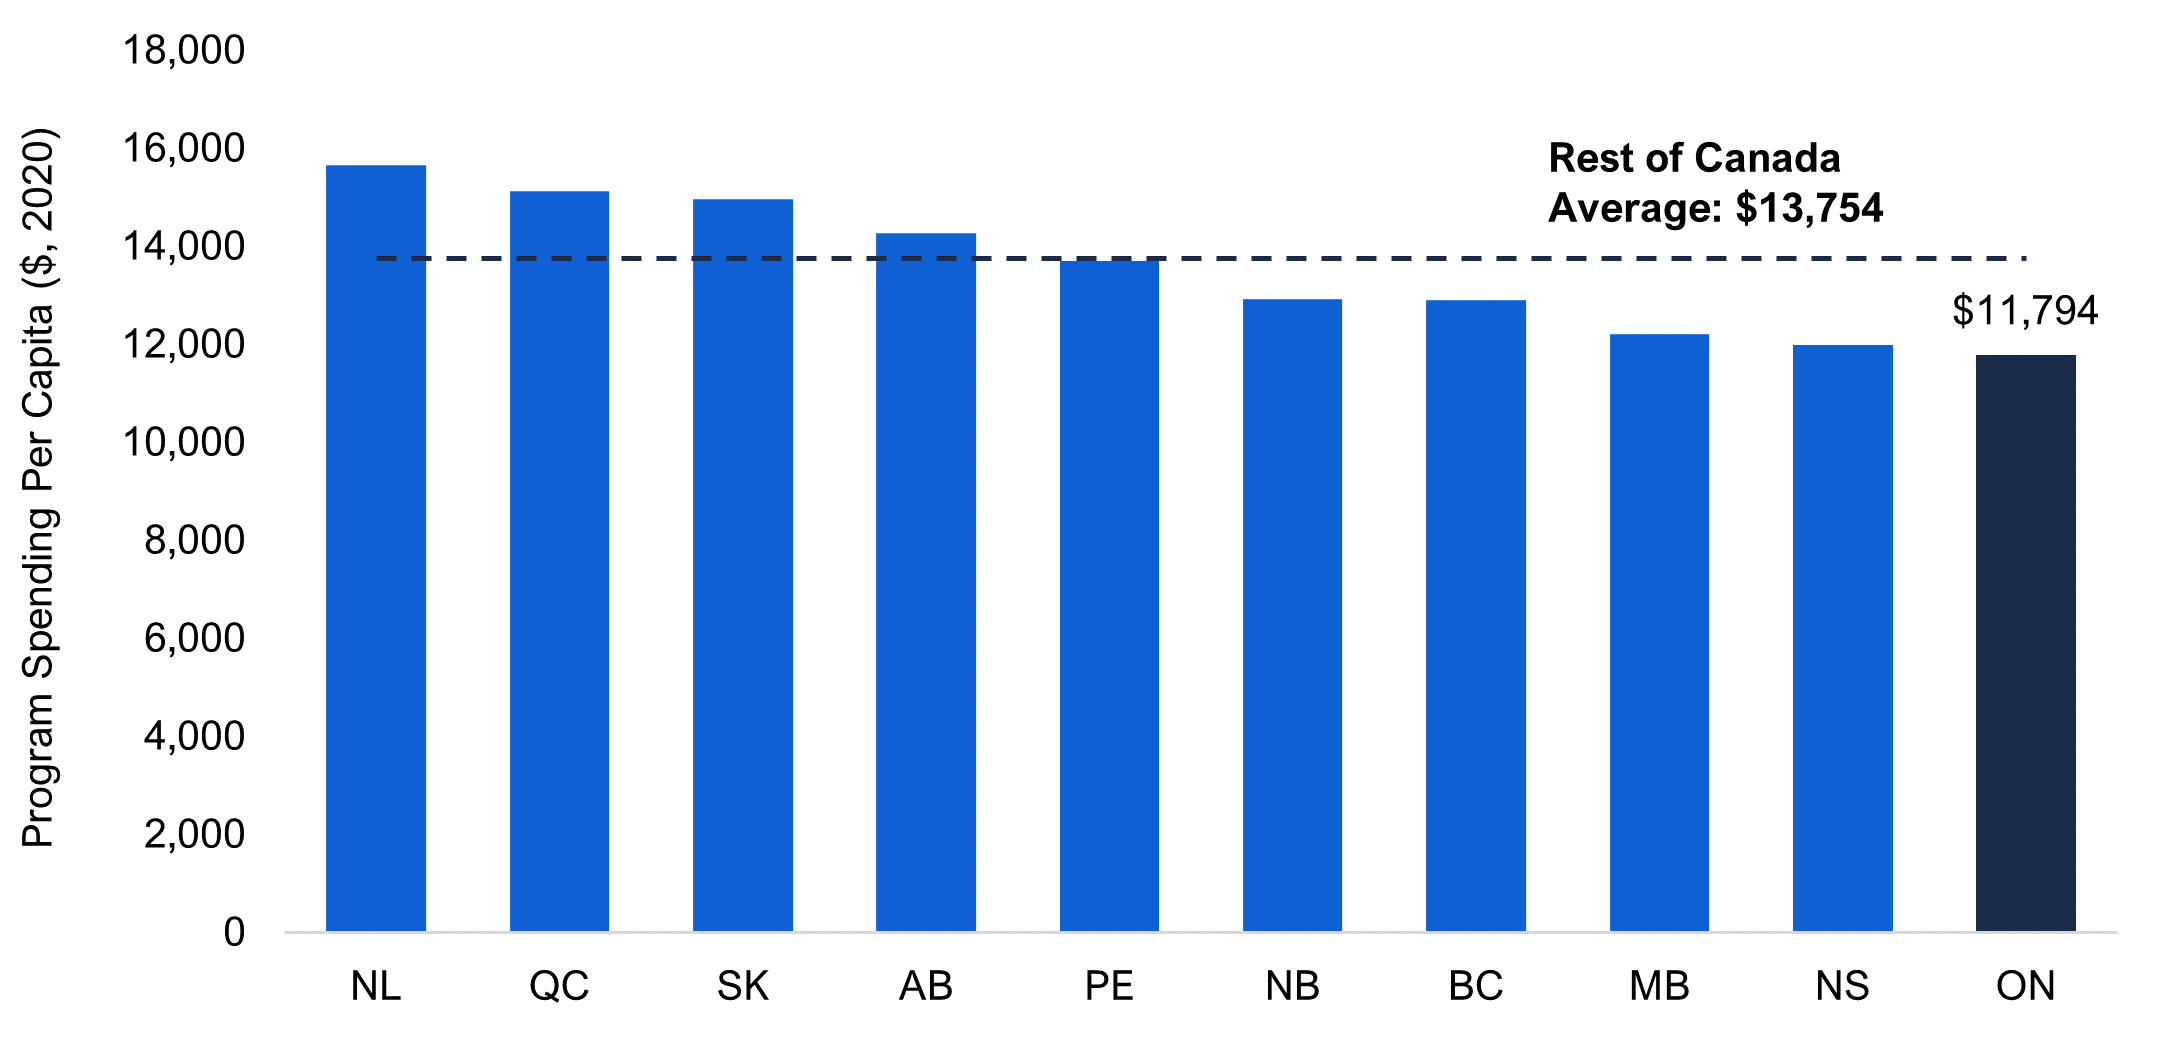
Ontario’s program spending per capita continues to be the lowest in the country
- Program spending per capita in Ontario in 2020 was $11,794, the lowest in the country.
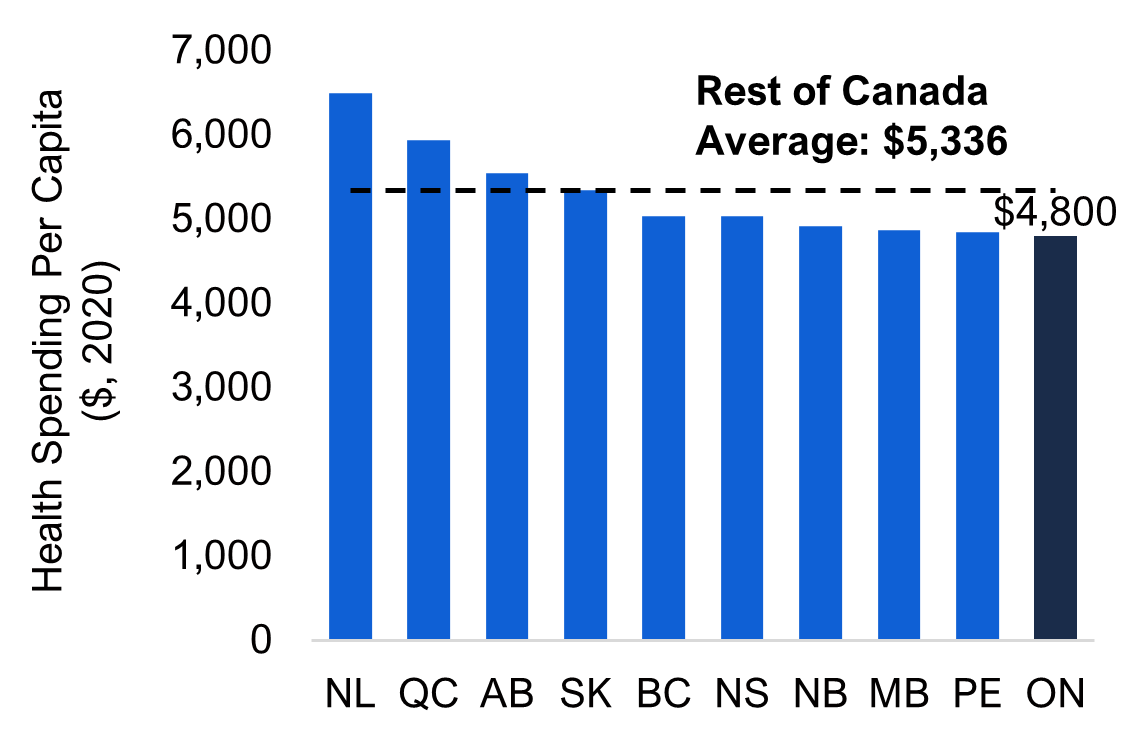
- Ontario’s health spending per capita was the lowest in Canada. Since 2008, Ontario has consistently had among the lowest levels of per capita health spending in the country.
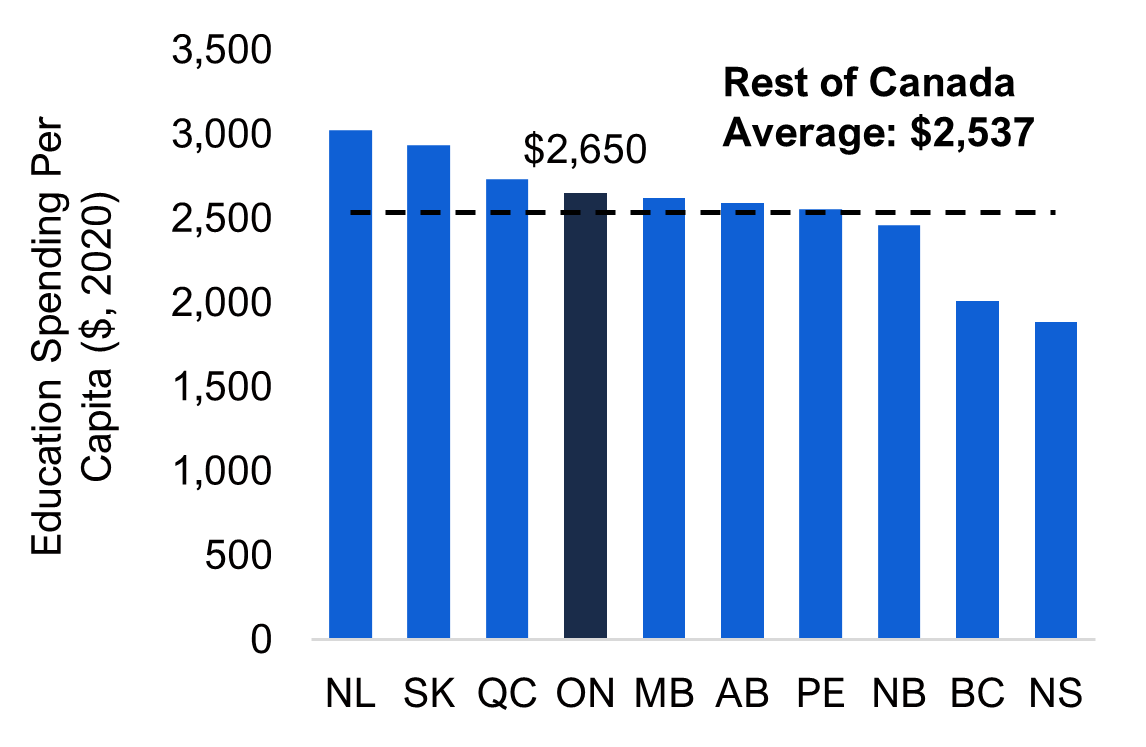
- Education spending per capita in Ontario was the fourth highest among the provinces, a higher ranking compared to 2008 when Ontario had the fourth lowest spending among the provinces.
Ontario’s below-average interest expense reflects its lower borrowing rates, easing the burden of its considerably higher net debt per capita
- Ontario’s net debt was the highest among the provinces in 2020, both in per capita terms ($21,924) and as a share of GDP (37.3 per cent) – the result of frequent budget deficits over the last 40 years.[4]
- Despite Ontario’s higher debt burden, its interest expense per capita was $834, below the provincial average, reflecting its comparatively lower borrowing rates.
The COVID-19 pandemic had a significant impact on the finances of all provinces in 2020, but little effect on Ontario’s relative rankings
- For most provinces, budget balances deteriorated with the onset of the pandemic, as large spending increases outpaced weak revenue growth. As a result, net debt levels increased in 2020.
- However, despite the impact of the pandemic on provincial finances, Ontario’s interprovincial per capita rankings did not change significantly from 2019 to 2020.
Revenues
Canadian provinces receive revenue from taxation, federal transfers and other non-tax sources. In 2020, these sources generated $11,031 in total revenue per person in Ontario, the second lowest in the country and $1,980 (15.2 per cent) below the average in the rest of Canada ($13,010). Ontario’s lower revenue per capita reflects the province’s low federal transfers and other revenues, which offset its higher tax revenue per capita. Since 2008, Ontario has ranked last or second last among the provinces in terms of total revenue per capita.
Figure 1 Ontario’s revenue per capita was the second lowest in Canada in 2020
Sources: Statistics Canada Tables 10-10-0017-01,17-10-0005-01, 10-10-0019-01 and FAO.
Tax revenues
Although Ontario received the second lowest total revenue per person among the provinces in 2020, Ontario’s tax revenue per capita was the second highest in Canada at $8,071. Ontario’s higher tax revenues partially reflect the province’s above-average level of economic activity.[5] When measured against the province’s economic output, Ontario’s tax revenues represent 13.7 per cent of GDP, slightly above the 13.2 per cent average among other provinces. On this basis, Ontario’s tax revenues are about four percentage points below Quebec (the highest ranked province at 18.1 per cent of GDP) and six percentage points above Alberta (the lowest ranked province at 7.7 per cent of GDP).
Figure 2 Ontario’s tax revenue as a share of GDP was slightly above the average of other provinces
Sources: Statistics Canada Tables 10-10-0017-01,17-10-0005-01, 36-10-0222-01, 10-10-0019-01 and FAO.
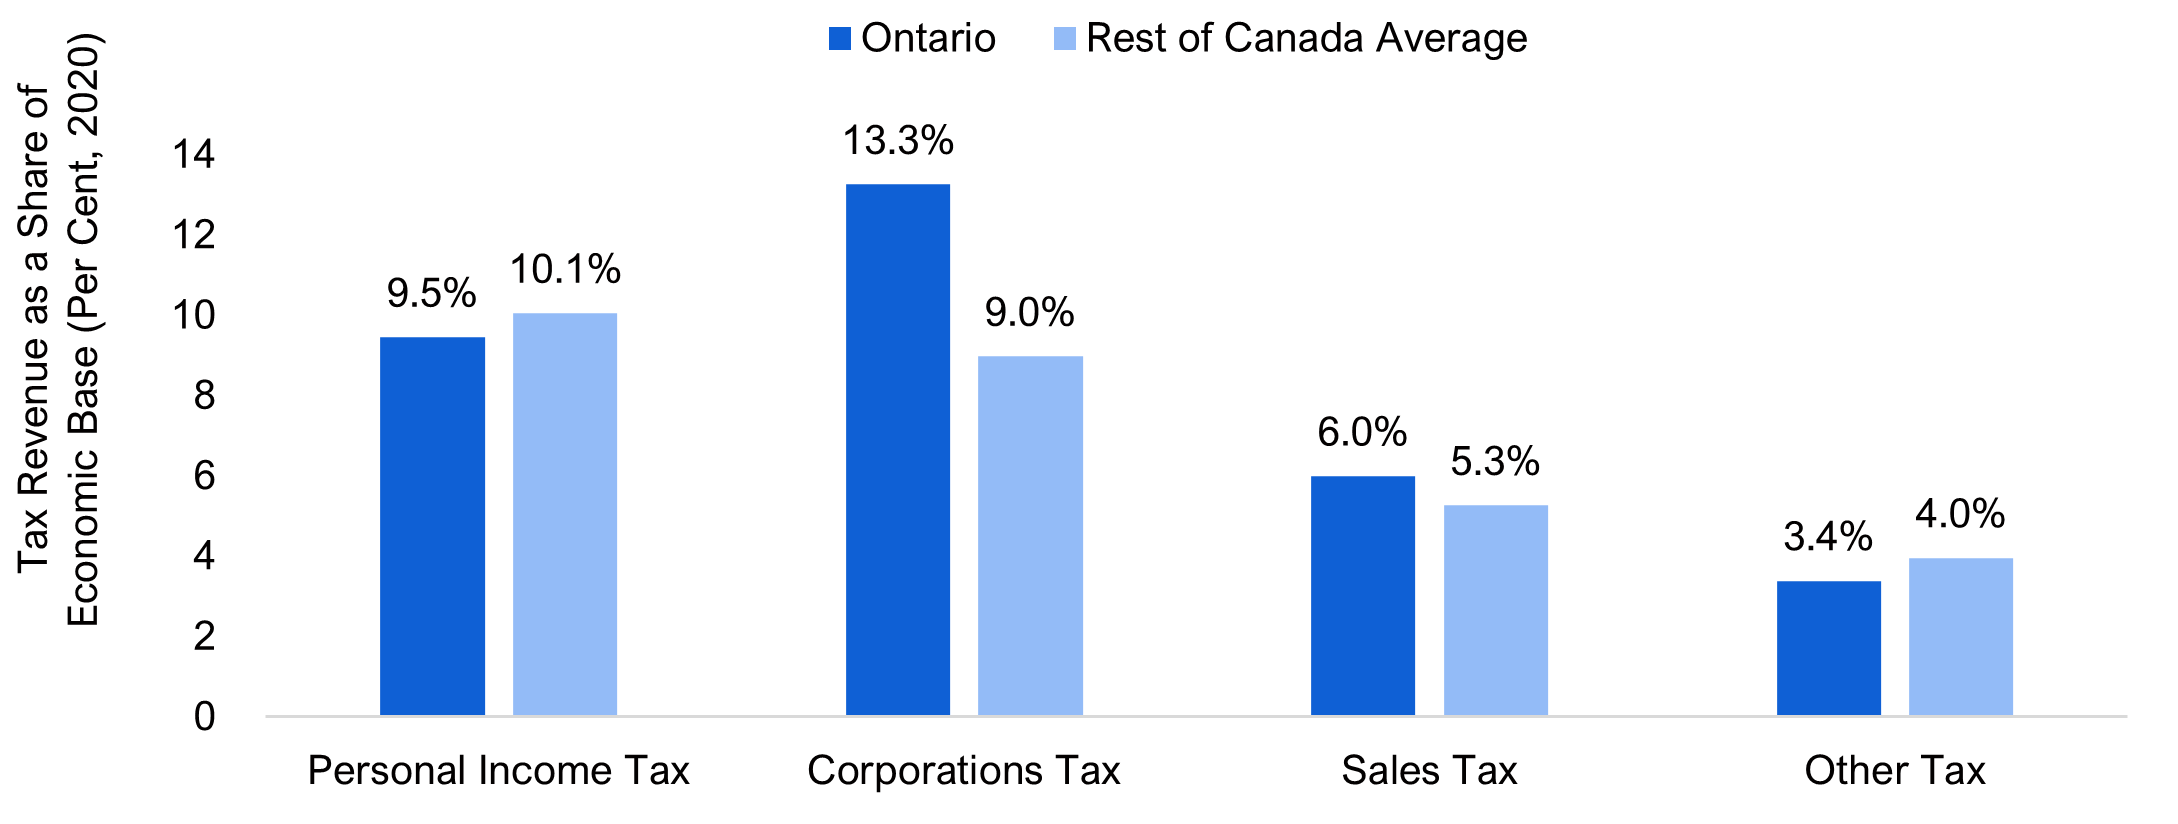
Dividing each major tax revenue category by its corresponding economic tax base provides an indication of its tax burden.[6]
- Personal income tax revenue represented 9.5 per cent of labour income in Ontario, ranking fifth lowest among the provinces and slightly below the rest of Canada average of 10.1 per cent.
- Corporations tax revenue represented 13.3 per cent of corporate profits in Ontario, the second highest among the provinces and much higher than the rest of Canada average of 9.0 per cent.
- Sales tax revenue represented 6.0 per cent of household spending in Ontario, the fifth highest among the provinces and above the rest of Canada average of 5.3 per cent.
- Other tax revenue represented 3.4 per cent of GDP in Ontario, the third lowest among the provinces and below the rest of Canada average of 4.0 per cent.
Figure 3 Corporations tax and sales tax revenue represented a larger share of their economic tax bases in Ontario compared to the average of other provinces
Note: See Footnote 6 for an explanation of the economic tax bases.
Sources: Statistics Canada Tables 10-10-0017-01, 36-10-0221-01, 36-10-0222-01, 10-10-0019-01 and FAO.
While these shares vary over time, since 2008 Ontario’s tax shares for personal income tax and other tax revenue[7] have been below the average in the rest of Canada, while corporations tax[8] and sales tax shares have been above the average in the rest of Canada.
Transfers and other revenues
Provincial governments receive transfers from the federal government and collect other non-tax revenues, including those received from the sale of goods and services and property income (such as resource royalties), among others.[9]
In 2020, Ontario received $2,378 per capita in transfers, the lowest among the provinces and $1,443 below the rest of Canada average ($3,822). Ontario’s lower federal transfers reflect its greater ability to generate tax revenues relative to other provinces, which limits its eligibility to qualify for transfers such as Equalization payments.[10] Ontario also collected the lowest amount of other revenues in the country ($581 per capita), reflecting its limited property income[11] and its below-average revenue from the sale of goods and services.[12]
Figure 4 Ontario had the lowest federal transfers and other revenue per capita in 2020
Sources: Statistics Canada Tables 10-10-0017-01, 17-10-0005-01 and FAO.
Program spending
Program spending in Canadian provinces includes money spent on providing services such as health and education as well as other program spending, which includes expenses for police services, prisons, transportation, housing, old age, unemployment, sickness and disability, and children services.
In 2020, program spending per capita in Ontario was $11,794, the lowest among the provinces and $1,960 (14.3 per cent) lower than the rest of Canada average ($13,754). Ontario’s relatively low level of spending is comprised of below-average health and ‘other’ program spending and above-average education spending.[13] Since 2008, Ontario’s program spending per capita has consistently ranked at or near the lowest among the provinces.
Figure 5 Ontario’s program spending per capita was the lowest in Canada
Sources: Statistics Canada Tables 10-10-0017-01,17-10-0005-01, 10-10-0019-01 and FAO.
Table 1 Per capita program spending by category
Health
- Health spending per capita in Ontario was $4,800 in 2020, the lowest in Canada and $536 (10.0 per cent) below the average of the other provinces.
- Since 2008, Ontario’s health spending per capita has consistently ranked at or near the lowest in Canada.
Education
- Education spending in Ontario was $2,650 per capita in 2020, the fourth highest among the provinces and $113 (4.4 per cent) above the average of the other provinces.
- Since 2008, Ontario’s ranking has increased from seventh to fourth highest.
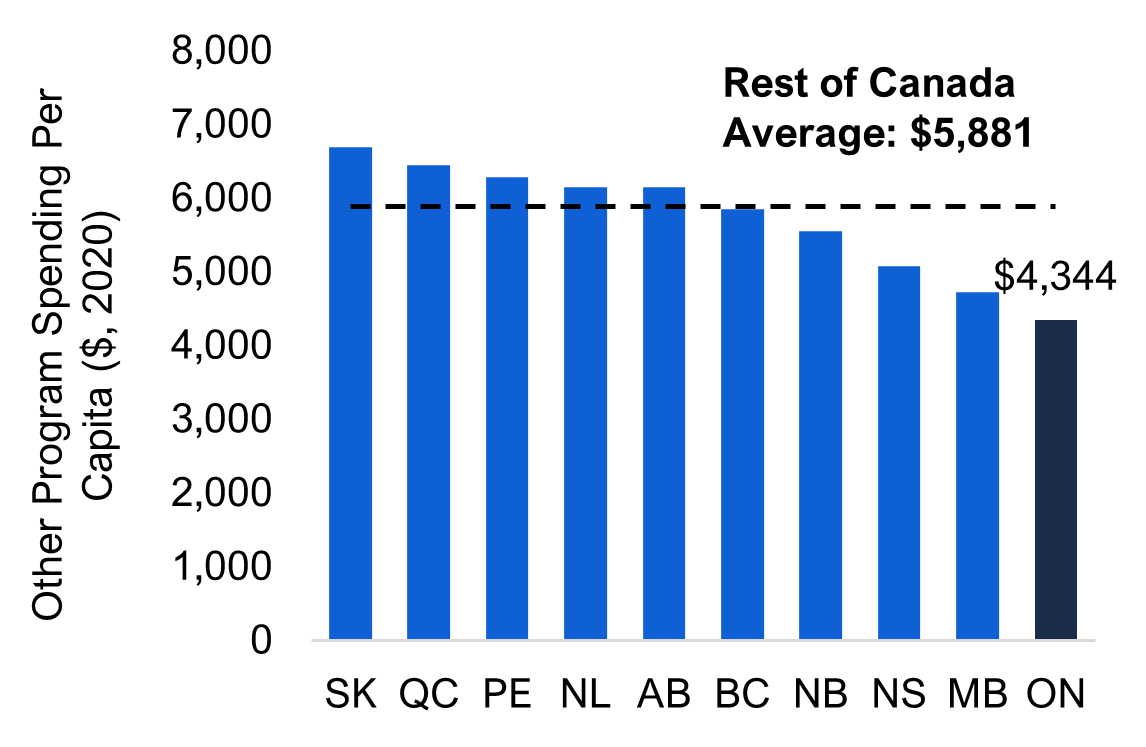
Other program spending
- Other program spending per capita was $4,344 in 2020, the lowest among the provinces and $1,537 (26.1 per cent) below the average in the rest of Canada.
- Since 2008, Ontario has consistently had the lowest or second lowest other program spending per capita.
Note: Health and education estimates are calculated from Statistics Canada’s Table: 10-10-0024-01 (Canadian classification of functions of government estimates) and then subtracted from program expense to calculate other program spending. School board education property taxes (from Statistics Canada Table: 10-10-0019-01) are added where relevant to better align with Ontario’s Public Accounts.
Sources: Statistics Canada Tables 10-10-0024-01, 17-10-0005-01, 10-10-0019-01 and FAO.
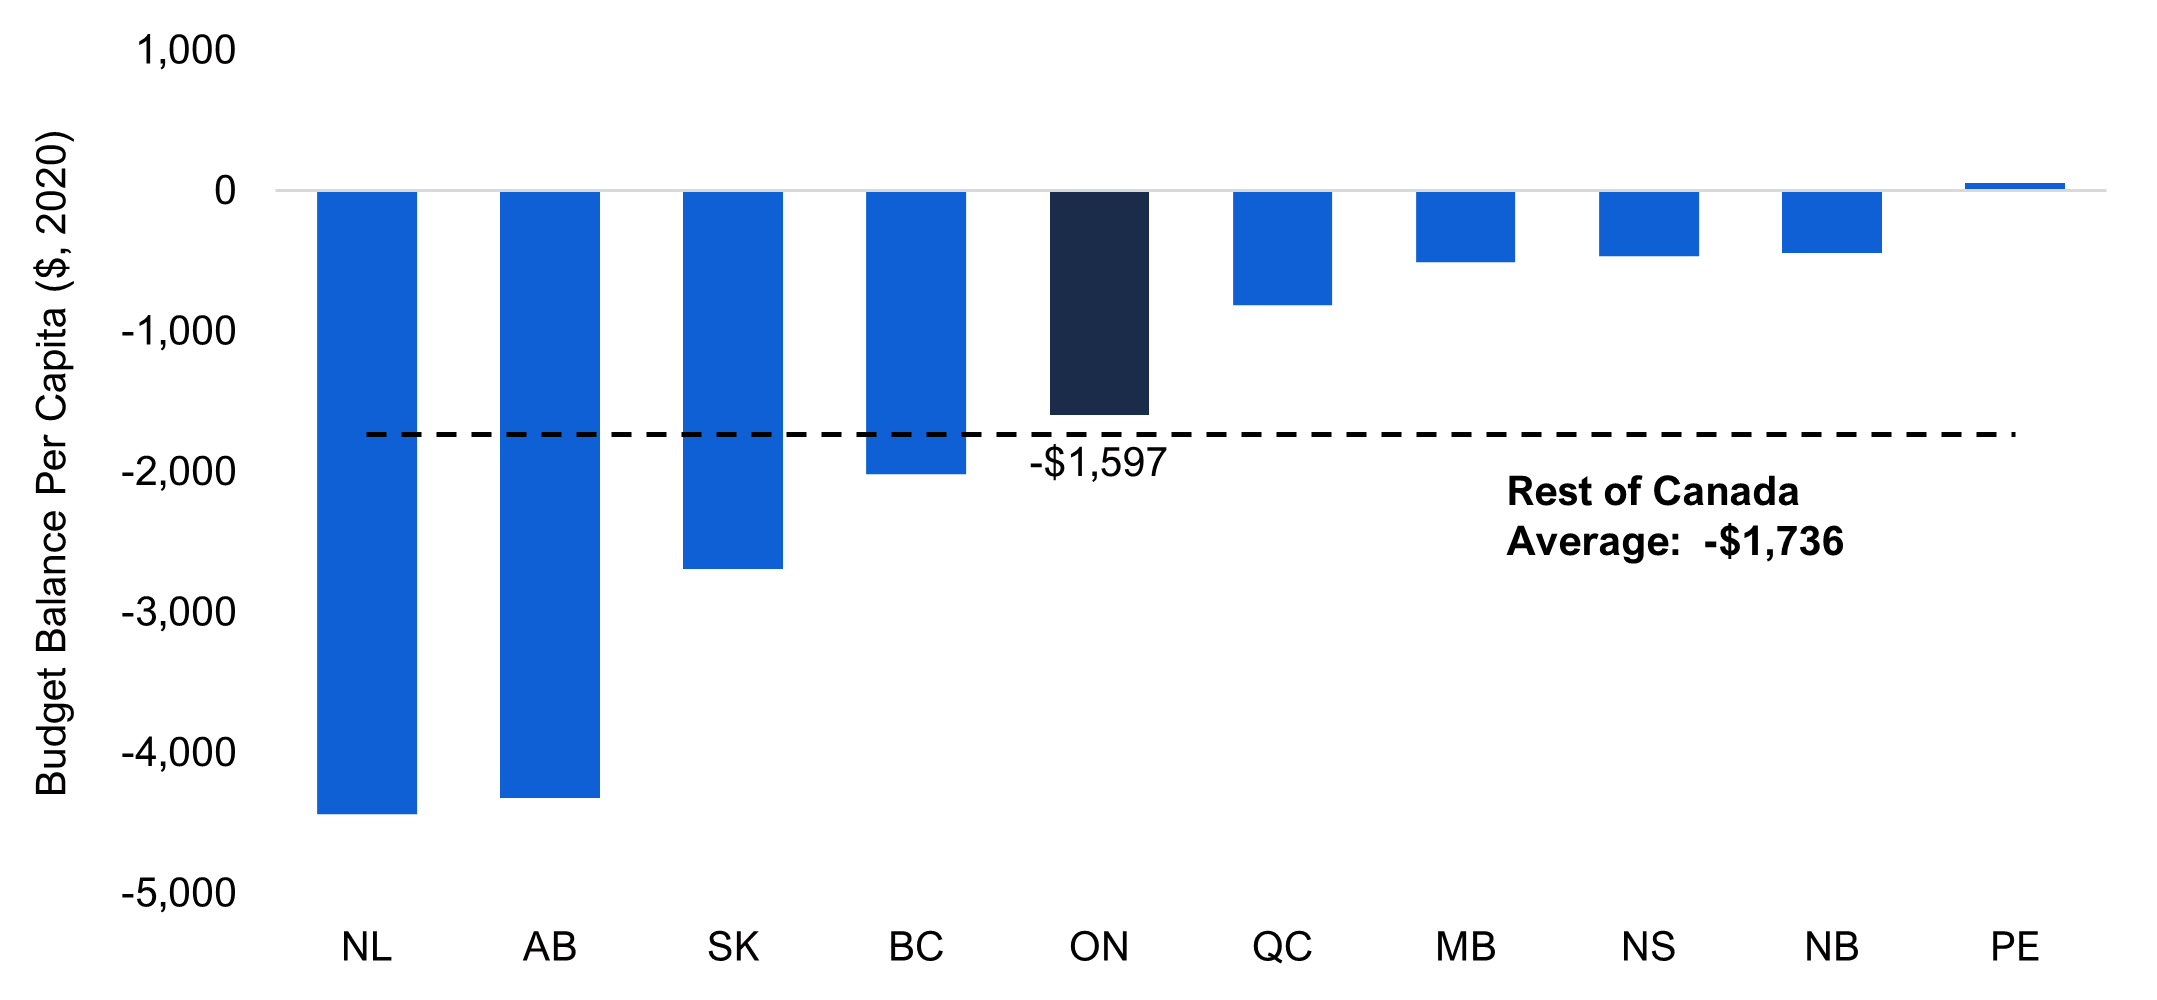
Budget balance
Ontario’s budget deficit amounted to $1,597 per person in 2020, the fifth highest in the country and slightly below the rest of Canada average of $1,736. Since 2008, Ontario’s per capita budget balance has only been smaller than the average in the rest of Canada in four years – 2015, 2016, 2017 and 2020.
Figure 6 Ontario’s budget deficit in 2020 was less than the average of other provinces
Sources: Statistics Canada Tables 10-10-0017-01,17-10-0005-01 and FAO.
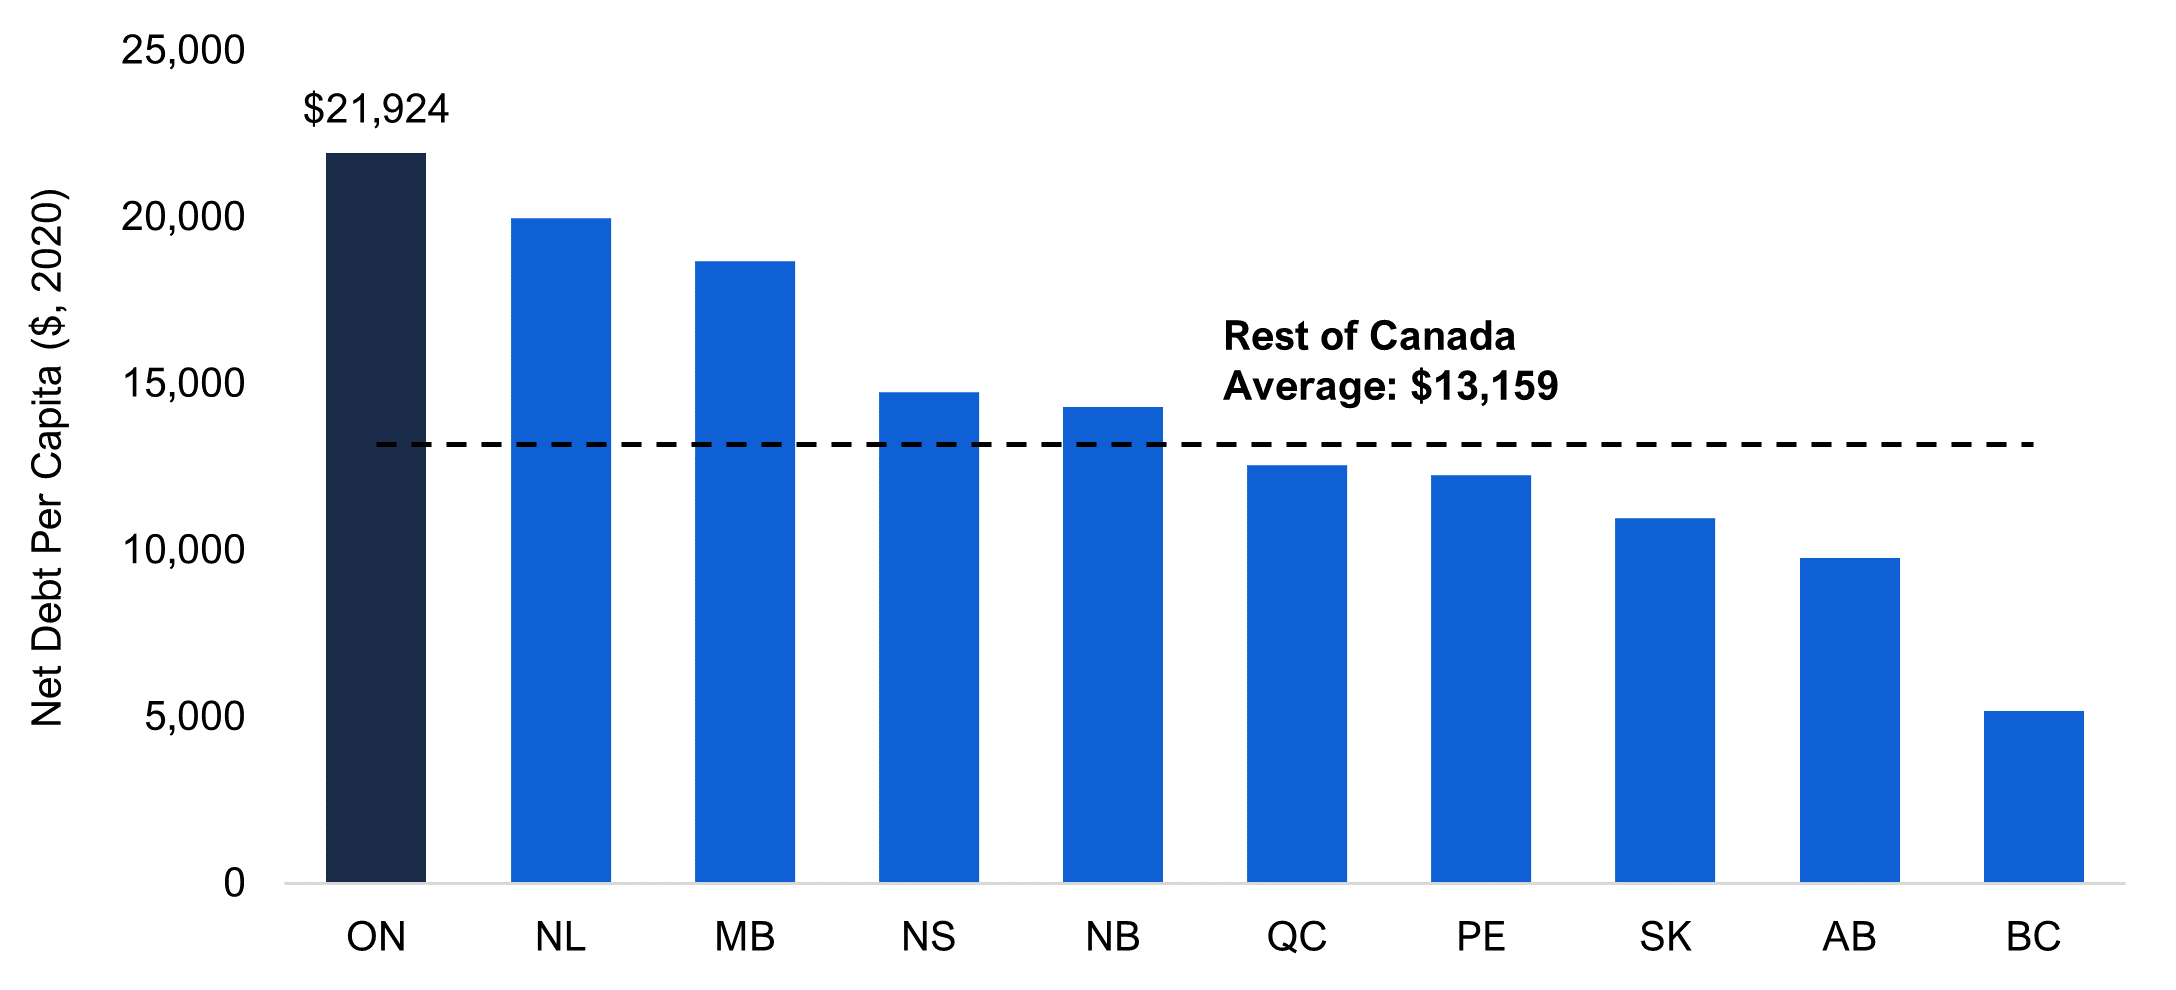
Net debt and interest expense
Ontario’s per capita net debt was $21,924 in 2020, the highest among the provinces and $8,765 (66.6 per cent) above the rest of Canada average ($13,159). Ontario also had the highest net debt as a share of GDP in 2020 at 37.3 per cent, which was 12.9 percentage points higher than the rest of Canada average of 24.4 per cent. Since 2010, Ontario has consistently had the highest or second-highest net debt, in both per capita terms and as a share of GDP. The Province’s net debt levels reflect frequent budget deficits over the last 40 years.[14]
Figure 7 Ontario’s net debt per capita was well above the rest of Canada average
Sources: Statistics Canada Tables 10-10-0017-01,17-10-0005-01, 36-10-0222-01 and FAO.
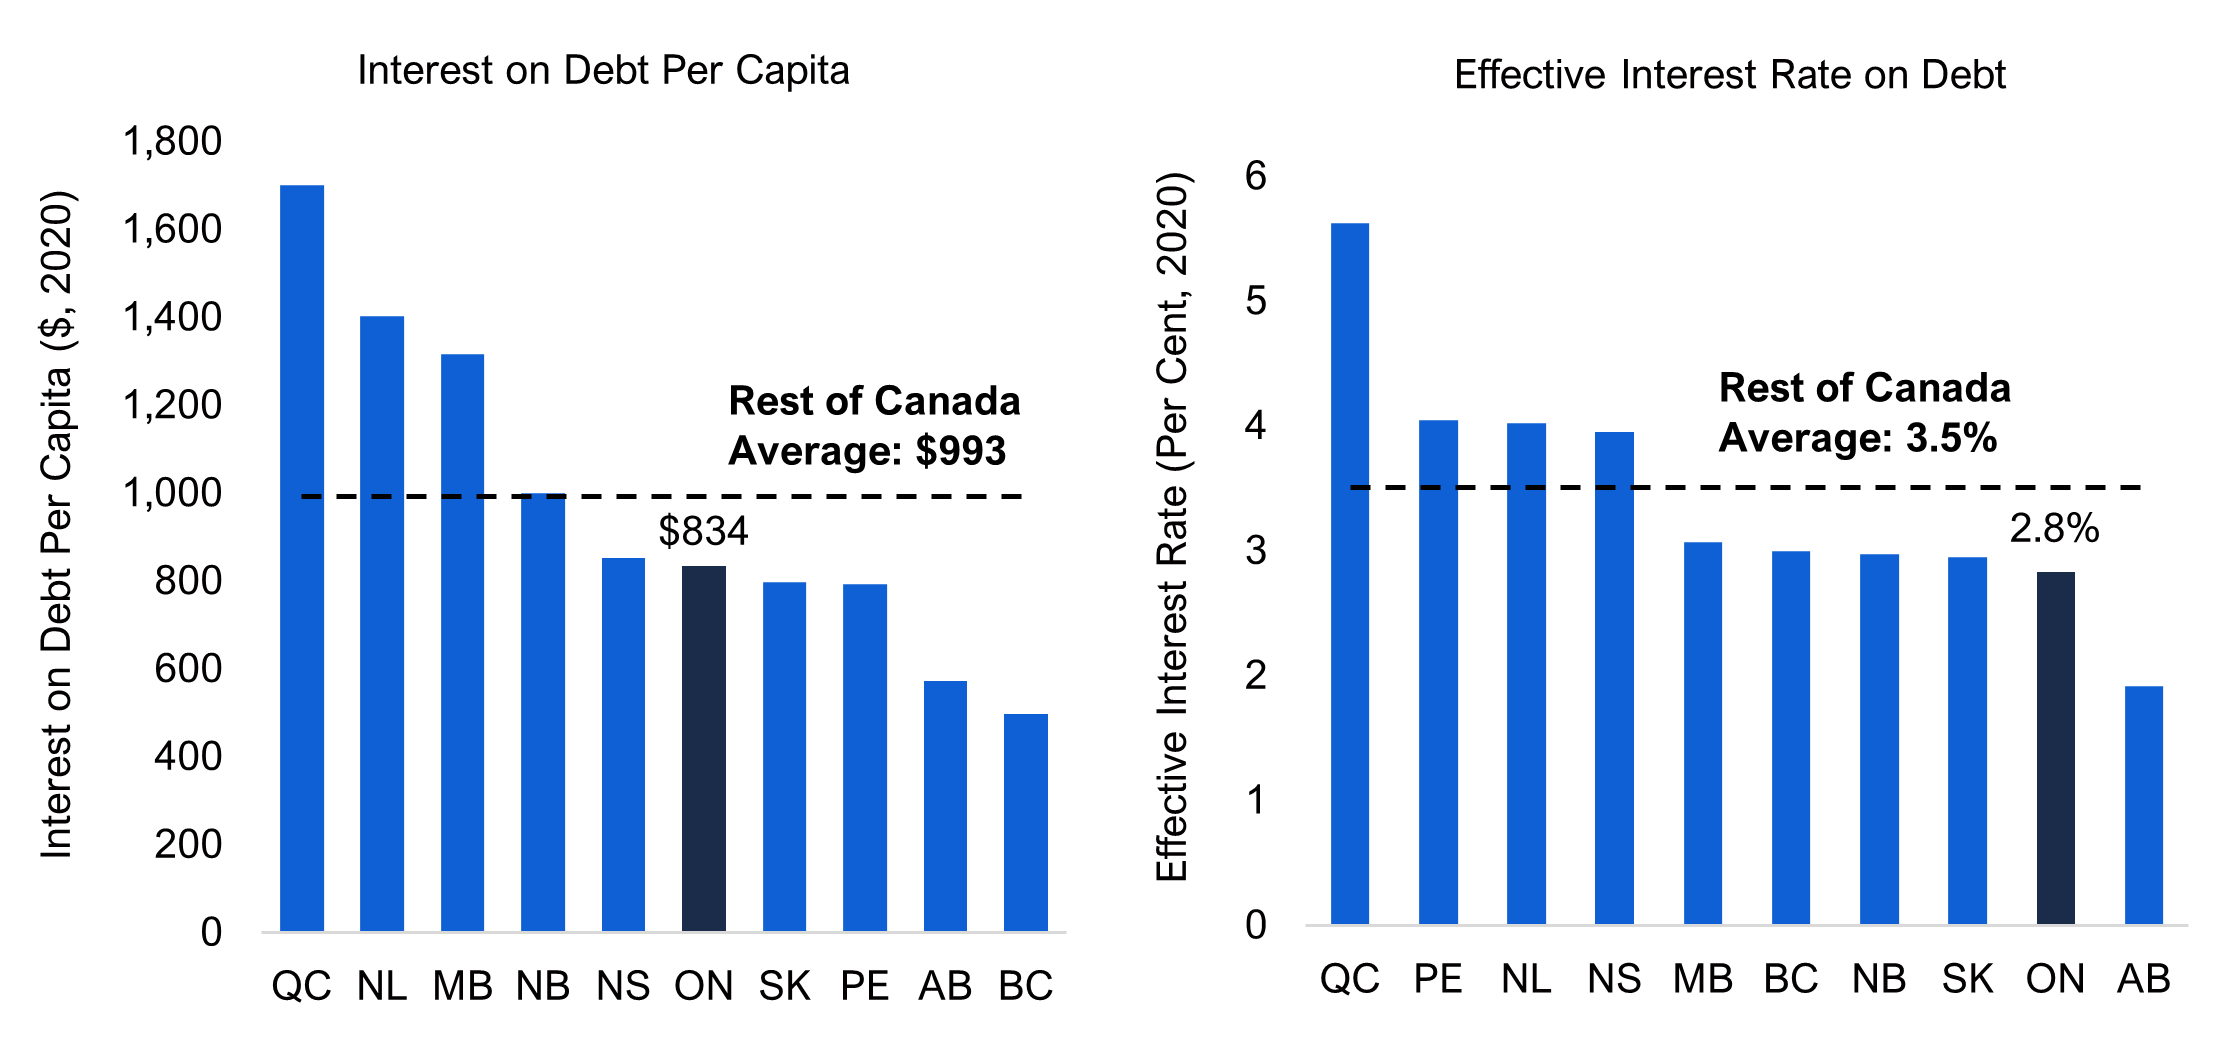
Despite its relatively higher debt levels, Ontario’s interest expense per capita was the fifth lowest among the provinces at $834 in 2020, $159 lower than the rest of Canada average. Ontario’s lower per capita interest payments reflects the province’s relatively low borrowing rates. Ontario’s effective interest rate on debt[15] was 2.8 per cent in 2020, the second lowest among the provinces and below the 3.5 per cent average effective rate of the other provinces.
Figure 8 Ontario’s below-average interest expense reflected its lower effective interest rate on debt
Sources: Statistics Canada Tables 10-10-0017-01,17-10-0005-01, 10-10-0019-01 and FAO.
Impact of COVID-19 on Provincial Rankings
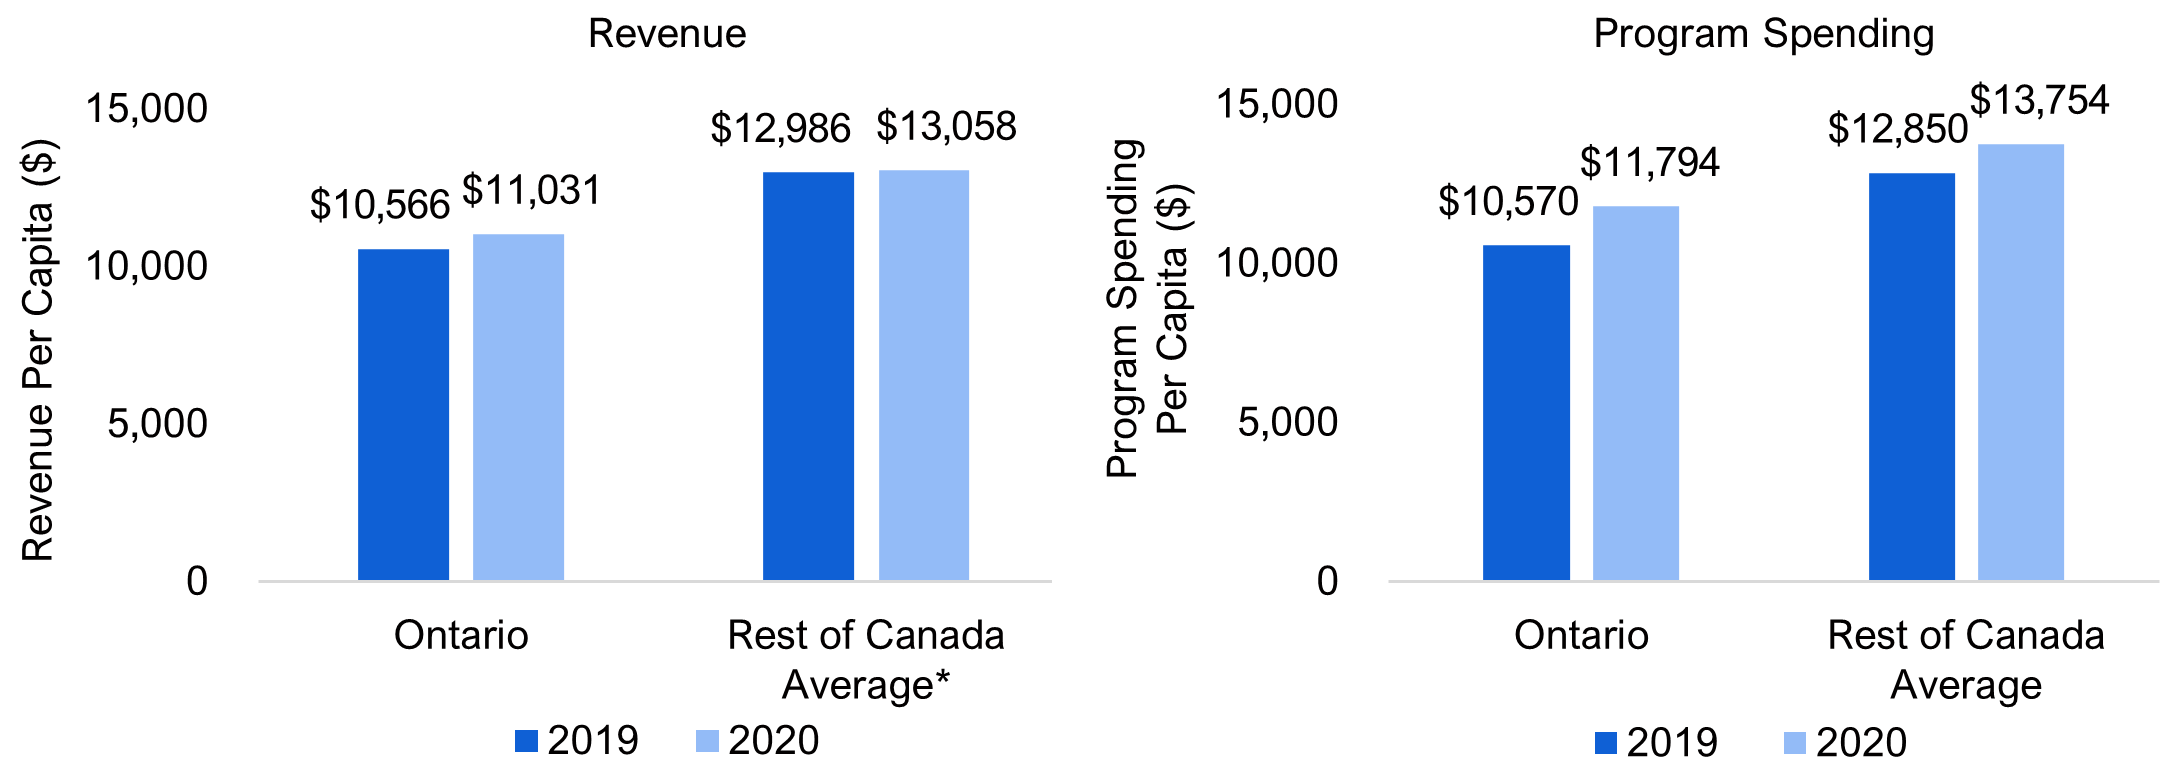
The COVID-19 pandemic had a significant impact on the finances of all provinces in 2020. Revenues per capita in most provinces increased despite lower economic activity, as falling tax and other revenues were more than offset by the significant increases in transfers from the federal government. Program spending per capita increased substantially from 2019 levels for all provinces, largely driven by increases in health spending and other program spending.
Figure 9 Ontario's per capita revenues and program spending both increased in the first year of the COVID-19 pandemic
* The rest of Canada average for revenue per capita excludes Newfoundland and Labrador, whose revenues were significantly impacted by the 2019 Atlantic Accord.
Sources: Statistics Canada Tables 10-10-0017-01,17-10-0005-01, 10-10-0019-01 and FAO.
For most provinces, budget balances deteriorated with the onset of the pandemic, as large spending increases outpaced weak revenue growth. As a result, net debt levels increased in 2020. However, despite the impact of the pandemic on provincial finances, Ontario’s interprovincial per capita rankings did not change significantly from 2019 to 2020.
|
Ranking |
2019 | 2020 | Ranking Position Change* |
|---|---|---|---|
| Budget Balance | 9 | 6 | 3 |
| Net Debt | 1 | 1 | 0 |
| Total Revenue | 10 | 9 | 1 |
|
Taxes |
3 | 2 | 1 |
| Federal Transfers | 10 | 10 | 0 |
| Other Revenue | 10 | 10 | 0 |
| Program Expense | 10 | 10 | 0 |
| Health** | 10 | 10 | 0 |
| Education** | 6 | 4 | 2 |
| Other Program Spending** | 10 | 10 | 0 |
| Interest Expense | 6 | 6 | 0 |
Appendix A : Fiscal Comparison Tables
| NL | PE | NS | NB | QC | ON | MB | SK | AB | BC | Provincial Average | Rest of Canada Average* | ||||||||||||||||||||
|---|---|---|---|---|---|---|---|---|---|---|---|---|---|---|---|---|---|---|---|---|---|---|---|---|---|---|---|---|---|---|---|
| Budget Balance | -4,436 | 56 | -464 | -440 | -814 | -1,597 | -503 | -2,688 | -4,318 | -2,017 | -1,722 | -1,736 | |||||||||||||||||||
| Net Debt | 19,976 | 12,248 | 14,759 | 14,302 | 12,561 | 21,924 | 18,667 | 10,979 | 9,774 | 5,168 | 14,036 | 13,159 | |||||||||||||||||||
| Total Revenue | 12,628 | 14,548 | 12,386 | 13,484 | 16,012 | 11,031 | 13,027 | 13,088 | 10,534 | 11,385 | 12,812 | 13,010 | |||||||||||||||||||
| Taxes | 7,941 | 7,351 | 6,413 | 6,715 | 9,486 | 8,071 | 7,217 | 7,212 | 5,104 | 7,183 | 7,269 | 7,180 | |||||||||||||||||||
| Federal Transfers | 2,530 | 6,068 | 4,806 | 5,263 | 3,679 | 2,378 | 4,146 | 2,719 | 2,561 | 2,621 | 3,677 | 3,822 | |||||||||||||||||||
| Other Revenue | 2,158 | 1,128 | 1,167 | 1,507 | 2,847 | 581 | 1,664 | 3,157 | 2,868 | 1,581 | 1,866 | 2,009 | |||||||||||||||||||
| Program Expense | 15,663 | 13,699 | 11,998 | 12,925 | 15,124 | 11,794 | 12,214 | 14,978 | 14,279 | 12,905 | 13,558 | 13,754 | |||||||||||||||||||
| Health** | 6,493 | 4,847 | 5,034 | 4,909 | 5,938 | 4,800 | 4,873 | 5,346 | 5,544 | 5,037 | 5,282 | 5,336 | |||||||||||||||||||
| Education** | 3,025 | 2,560 | 1,885 | 2,464 | 2,737 | 2,650 | 2,621 | 2,938 | 2,591 | 2,012 | 2,548 | 2,537 | |||||||||||||||||||
| Other Program Spending** | 6,145 | 6,291 | 5,079 | 5,552 | 6,449 | 4,344 | 4,720 | 6,694 | 6,143 | 5,855 | 5,727 | 5,881 | |||||||||||||||||||
| Interest Expense | 1,404 | 793 | 852 | 1,000 | 1,702 | 834 | 1,317 | 799 | 573 | 497 | 977 | 993 | |||||||||||||||||||
| NL | PE | NS | NB | QC | ON | MB | SK | AB | BC | Provincial Average | Rest of Canada Average* | ||||
|---|---|---|---|---|---|---|---|---|---|---|---|---|---|---|---|
| Budget Balance | -7.3 | 0.1 | -1.0 | -0.9 | -1.6 | -2.7 | -1.0 | -4.1 | -6.5 | -3.4 | -2.8 | -2.8 | |||
| Net Debt | 33.0 | 26.3 | 30.9 | 29.8 | 24.0 | 37.3 | 35.4 | 16.6 | 14.7 | 8.6 | 25.7 | 24.4 | |||
| Total Revenue | 20.8 | 31.3 | 26.0 | 28.1 | 30.6 | 18.8 | 24.7 | 19.8 | 15.8 | 19.0 | 23.5 | 24.0 | |||
|
Taxes |
13.1 | 15.8 | 13.4 | 14.0 | 18.1 | 13.7 | 13.7 | 10.9 | 7.7 | 12.0 | 13.2 | 13.2 | |||
|
Federal Transfers |
4.2 | 13.0 | 10.1 | 11.0 | 7.0 | 4.0 | 7.9 | 4.1 | 3.8 | 4.4 | 7.0 | 7.3 | |||
|
Other Revenue |
3.6 | 2.4 | 2.4 | 3.1 | 5.4 | 1.0 | 3.2 | 4.8 | 4.3 | 2.6 | 3.3 | 3.5 | |||
| Program Expense | 25.9 | 29.4 | 25.1 | 27.0 | 28.9 | 20.1 | 23.1 | 22.7 | 21.4 | 21.5 | 24.5 | 25.0 | |||
|
Health** |
10.7 | 10.4 | 10.6 | 10.2 | 11.3 | 8.2 | 9.2 | 8.1 | 8.3 | 8.4 | 9.5 | 9.7 | |||
|
Education** |
5.0 | 5.5 | 4.0 | 5.1 | 5.2 | 4.5 | 5.0 | 4.5 | 3.9 | 3.4 | 4.6 | 4.6 | |||
|
Other Program Spending** |
10.1 | 13.5 | 10.6 | 11.6 | 12.3 | 7.4 | 8.9 | 10.1 | 9.2 | 9.8 | 10.4 | 10.7 | |||
| Interest Expense | 2.3 | 1.7 | 1.8 | 2.1 | 3.3 | 1.4 | 2.5 | 1.2 | 0.9 | 0.8 | 1.8 | 1.8 | |||
| NL | PE | NS | NB | QC | ON | MB | SK | AB | BC | Provincial Average | Rest of Canada Average* | ||||
|---|---|---|---|---|---|---|---|---|---|---|---|---|---|---|---|
| Personal Income Tax | 11.1 | 11.0 | 11.7 | 9.5 | 14.5 | 9.5 | 10.2 | 7.9 | 7.4 | 7.3 | 10.0 | 10.1 | |||
| Corporations Tax | 8.0 | 6.7 | 6.5 | 6.9 | 12.3 | 13.3 | 6.3 | 4.9 | 16.3 | 12.8 | 9.4 | 9.0 | |||
| Sales Tax | 6.6 | 6.7 | 6.0 | 5.9 | 6.8 | 6.0 | 5.4 | 6.0 | 0.0 | 4.1 | 5.3 | 5.3 | |||
| Other Taxes | 3.4 | 4.8 | 2.6 | 4.3 | 4.6 | 3.4 | 4.7 | 4.0 | 2.8 | 4.3 | 3.9 | 4.0 | |||
Graphical Descriptions
| Revenue Per Capita ($, 2020) |
||
|---|---|---|
| Province | Revenue Per Capita | Rest of Canada Average |
| QC | 16,012 | 13,010 |
| PE | 14,548 | 13,010 |
| NB | 13,484 | 13,010 |
| SK | 13,088 | 13,010 |
| MB | 13,027 | 13,010 |
| NL | 12,628 | 13,010 |
| NS | 12,386 | 13,010 |
| BC | 11,385 | 13,010 |
| ON | 11,031 | 13,010 |
| AB | 10,534 | 13,010 |
| Tax Revenue as a Share of GDP (Per Cent, 2020) |
||
|---|---|---|
| Province | Tax Revenue as a Share of GDP | Rest of Canada Average |
| QC | 18.1 | 13.2 |
| PE | 15.8 | 13.2 |
| NB | 14.0 | 13.2 |
| ON | 13.7 | 13.2 |
| MB | 13.7 | 13.2 |
| NS | 13.4 | 13.2 |
| NL | 13.1 | 13.2 |
| BC | 12.0 | 13.2 |
| SK | 10.9 | 13.2 |
| AB | 7.7 | 13.2 |
| Tax Revenue as a Share of Economic Base (Per Cent, 2020) |
||
|---|---|---|
| Tax Revenue Category | Ontario | Rest of Canada Average |
| Personal Income Tax | 9.5 | 10.1 |
| Corporations Tax | 13.3 | 9.0 |
| Sales Tax | 6.0 | 5.3 |
| Other Tax | 3.4 | 4.0 |
| Federal Transfers ($, 2020) |
Other Revenues ($, 2020) |
||||
|---|---|---|---|---|---|
| Province | Federal Transfers Per Capita | Rest of Canada Average | Province | Other Revenues Per Capita | Rest of Canada Average |
| PE | 6,068 | 3,822 | ON | 581 | 2,009 |
| NB | 5,263 | 3,822 | PE | 1,128 | 2,009 |
| NS | 4,806 | 3,822 | NS | 1,167 | 2,009 |
| MB | 4,146 | 3,822 | NB | 1,507 | 2,009 |
| QC | 3,679 | 3,822 | BC | 1,581 | 2,009 |
| SK | 2,719 | 3,822 | MB | 1,664 | 2,009 |
| BC | 2,621 | 3,822 | NL | 2,158 | 2,009 |
| AB | 2,561 | 3,822 | QC | 2,847 | 2,009 |
| NL | 2,530 | 3,822 | AB | 2,868 | 2,009 |
| ON | 2,378 | 3,822 | SK | 3,157 | 2,009 |
| Program Spending Per Capita ($, 2020) |
||
|---|---|---|
| Province | Program Spending Per Capita | Rest of Canada Average |
| NL | 15,663 | 13,754 |
| QC | 15,124 | 13,754 |
| SK | 14,978 | 13,754 |
| AB | 14,279 | 13,754 |
| PE | 13,699 | 13,754 |
| NB | 12,925 | 13,754 |
| BC | 12,905 | 13,754 |
| MB | 12,214 | 13,754 |
| NS | 11,998 | 13,754 |
| ON | 11,794 | 13,754 |
| Health Spending Per Capita ($, 2020) |
||
|---|---|---|
| Province | Health Spending Per Capita | Rest of Canada Average |
| NL | 6,493 | 5,336 |
| QC | 5,938 | 5,336 |
| AB | 5,544 | 5,336 |
| SK | 5,346 | 5,336 |
| BC | 5,037 | 5,336 |
| NS | 5,034 | 5,336 |
| NB | 4,909 | 5,336 |
| MB | 4,873 | 5,336 |
| PE | 4,847 | 5,336 |
| ON | 4,800 | 5,336 |
| Education Spending Per Capita ($, 2020) |
||
| Province | Education Spending Per Capita | Rest of Canada Average |
| NL | 3,025 | 2,537 |
| SK | 2,938 | 2,537 |
| QC | 2,737 | 2,537 |
| ON | 2,650 | 2,537 |
| MB | 2,621 | 2,537 |
| AB | 2,591 | 2,537 |
| PE | 2,560 | 2,537 |
| NB | 2,464 | 2,537 |
| BC | 2,012 | 2,537 |
| NS | 1,885 | 2,537 |
| Other Program Spending ($, 2020) |
||
| Province | Other Program Spending Per Capita | Rest of Canada Average |
| SK | 6,694 | 5,881 |
| QC | 6,449 | 5,881 |
| PE | 6,291 | 5,881 |
| NL | 6,145 | 5,881 |
| AB | 6,143 | 5,881 |
| BC | 5,855 | 5,881 |
| NB | 5,552 | 5,881 |
| NS | 5,079 | 5,881 |
| MB | 4,720 | 5,881 |
| ON | 4,344 | 5,881 |
| Budget Balance Per Capita ($, 2020) |
||
| Province | Budget Balance Per Capita | Rest of Canada Average |
| NL | -4,436 | -1,736 |
| AB | -4,318 | -1,736 |
| SK | -2,688 | -1,736 |
| BC | -2,017 | -1,736 |
| ON | -1,597 | -1,736 |
| QC | -814 | -1,736 |
| MB | -503 | -1,736 |
| NS | -464 | -1,736 |
| NB | -440 | -1,736 |
| PE | 56 | -1,736 |
| Net Debt Per Capita ($, 2020) |
||
|---|---|---|
| Province | Net Debt Per Capita | Rest of Canada Average |
| ON | 21,924 | 13,159 |
| NL | 19,976 | 13,159 |
| MB | 18,667 | 13,159 |
| NS | 14,759 | 13,159 |
| NB | 14,302 | 13,159 |
| QC | 12,561 | 13,159 |
| PE | 12,248 | 13,159 |
| SK | 10,979 | 13,159 |
| AB | 9,774 | 13,159 |
| BC | 5,168 | 13,159 |
| Interest on Debt Per Capita ($, 2020) |
||
|---|---|---|
| Province | Interest on Debt Per Capita | Rest of Canada Average |
| QC | 1,702 | 993 |
| NL | 1,404 | 993 |
| MB | 1,317 | 993 |
| NB | 1,000 | 993 |
| NS | 852 | 993 |
| ON | 834 | 993 |
| SK | 799 | 993 |
| PE | 793 | 993 |
| AB | 573 | 993 |
| BC | 497 | 993 |
|
Effective Interest Rate |
||
| Province | Effective Interest Rate | Rest of Canada Average |
| QC | 5.6 | 3.5 |
| PE | 4.0 | 3.5 |
| NL | 4.0 | 3.5 |
| NS | 3.9 | 3.5 |
| MB | 3.1 | 3.5 |
| BC | 3.0 | 3.5 |
| NB | 3.0 | 3.5 |
| SK | 3.0 | 3.5 |
| ON | 2.8 | 3.5 |
| AB | 1.9 | 3.5 |
| Revenue Per Capita ($) | ||
|---|---|---|
| Year | Ontario | Rest of Canada Average* |
| 2019 | 10,566 | 12,986 |
| 2020 | 11,031 | 13,058 |
| Program Spending Per Capita ($) | ||
| Year | Ontario | Rest of Canada Average |
| 2019 | 10,570 | 12,850 |
| 2020 | 11,794 | 13,754 |
Footnotes
[1] Government Finance Statistics (GFS) differ from the Ontario government’s own reported numbers as published in the Ontario Public Accounts. Financial results published by each province in their public accounts are not directly comparable due to differences in each government’s organizational structure and accounting practices. Statistics Canada’s GFS data adjust for these differences, allowing fiscal results to be compared across provinces.
[2] Some provinces’ program expenditure data have not been finalized. Revisions to 2020 data are expected when the final data become available.
[3] Government Finance Statistics are not available prior to 2008.
[4] Ontario has recorded deficits in 34 of the past 40 years.
[5] In 2020, Ontario’s GDP per capita was $58,793, the fifth highest in the country and higher than the rest of Canada average of $55,616.
[6] The economic tax bases of personal income tax, corporations tax and sales tax revenues are labour income (total compensation of employees), corporate profits (net operating surplus of corporations) and household spending (household consumption), respectively. While these economic tax bases are used as proxies for the actual tax bases, they do provide an indication of the tax burden between provinces on a common basis. As there are many different bases for other tax revenue, this category is compared against overall economic activity.
[7] Ontario’s other tax revenue as a share of GDP has been below the rest of Canada average in all but two years since 2008.
[8] Ontario’s corporations tax revenue as a share of corporate profits has been above the rest of Canada average in all but two years since 2008.
[9] The FAO calculates ‘other revenues’ in this report as the sum of the Social Contributions and Other Revenue categories in GFS. These items comprise revenue from social security contributions, property income such as rents (including resource royalties), interest and dividends in addition to revenue generated from the sales of goods and services (including administration fees), fines and penalties, and voluntary transfers as well as other miscellaneous revenues. For more information on GFS categories, see the Government Financial Statistics Manual 2001.
[10] Equalization payments are determined by a province’s fiscal capacity to raise revenues through five board revenue categories: personal income taxes, business taxes, consumption taxes, property taxes and natural resource revenues. See Equalization Program, Government of Canada. Ontario has qualified for Equalization payments in only 10 years since the program’s inception in 1957.
[11] Ontario’s lack of property income reflects its low resource royalties, as well as its below-average income from its financial assets and ownership of corporations. In 2020, Ontario collected $135 in property income per capita, well below the average in rest of Canada ($925).
[12] Sales of good and services includes administration fees, which in 2020 generated $85 per capita in Ontario, lower than the rest of Canada average ($138). From the sale of other goods and services (excluding administration fees), Ontario collected $116 per capita, below the rest of Canada average ($434).
[13] Examining the causes of differences in per capita program spending among the provinces is beyond the scope of this report. Lower per capita spending in Ontario may reflect a combination of factors, including lower demand for services, lower costs of delivering public services from economies of scale, and/or lower quality or quantity of services provided. Per capita health and education spending are calculated from Statistics Canada Table: 10-10-0005-01 (Canadian classification of functions of government).
[14] Based on Ontario’s Public Accounts, Ontario has balanced its budget in only six of the past 40 years, with deficits worsening during economic downturns and improving during expansions. See the FAO’s 2022 Long-Term Budget Outlook for more information.
[15] The effective interest rate is calculated as total interest paid divided by gross debt. Gross debt is calculated as the sum of debt securities and loans in Statistics Canada’s GFS Table 10-10-0017-01.