


Key Points
- The COVID-19 pandemic has resulted in a significant deterioration in labour markets across all of Ontario’s major cities, with large declines in employment and corresponding increases in unemployment rates.[1]
- Among Ontario’s major cities, Windsor was the most affected by the pandemic, with employment declining by 19.1 per cent from February to May, followed by St. Catharines-Niagara (-15.6 per cent) and Thunder Bay (-15.2 per cent). Guelph was the least affected by the pandemic, with employment down 4.9 per cent.
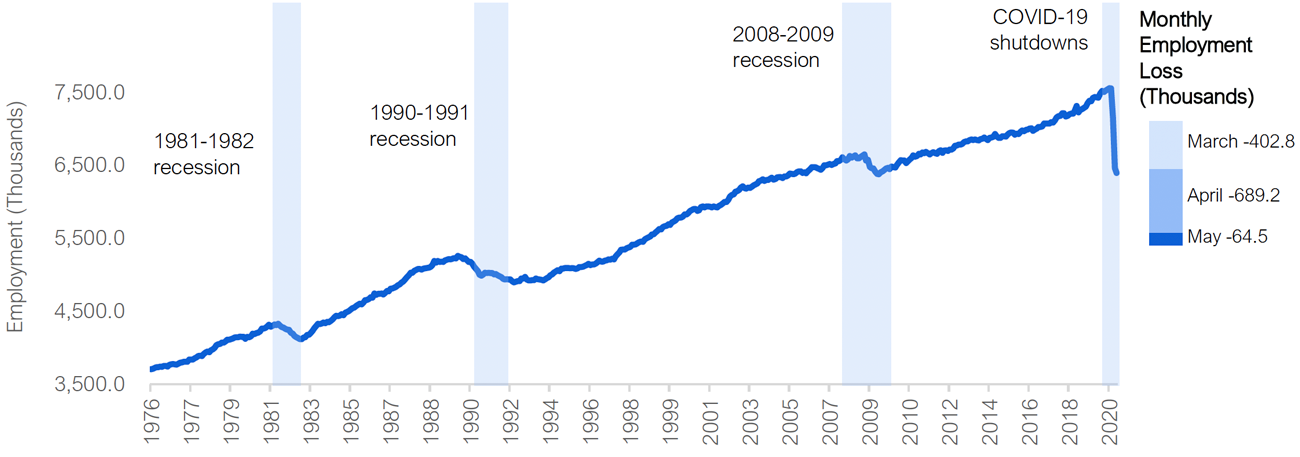
- Province-wide, Ontario continued to experience job losses in May, with employment declining by 64,500 (or -1.0 per cent), adding to the much larger job losses posted in March and April. [2]
- Since the pandemic shutdowns began three months ago, Ontario employment has fallen by 1.2 million workers (or -15.3 per cent), the sharpest job loss among all of the Canadian provinces.
- Ontario’s unemployment rate jumped to a record high of 13.6 per cent in May, as more people returned to the labour market looking for work and employment continued to decline.
- Over the February to May period, an estimated 2.2 million Ontario workers have been directly affected by the pandemic-related shutdowns, either through lost jobs or sharply reduced hours.
- In May, there were some early signs of recovery, with employment increasing modestly in manufacturing, accommodation and food services, wholesale and retail trade, and construction.
- Ontario is likely to see an increase in employment in June, reflecting the gradual reopening of the economy through the month. However, given the different timing of the reopening across the province, the pace of job creation may vary among the CMAs.[3]
Impact of the COVID-19 Pandemic on Ontario’s Regional Labour Markets
The COVID-19 pandemic resulted in a broad, mandated shutdown of non-essential activities in Ontario that began in mid-March. The pandemic-related shutdowns have had significant impacts on the province’s economy and labour markets. This report highlights the pandemic’s impact on labour markets in Ontario’s major cities, based on Statistics Canada’s Census Metropolitan Areas (CMAs). All major cities saw sharp and sudden employment losses during the February to May period, although the extent varied. In almost all the cities, accommodation and food services, and wholesale and retail trade industries experienced significant job losses.
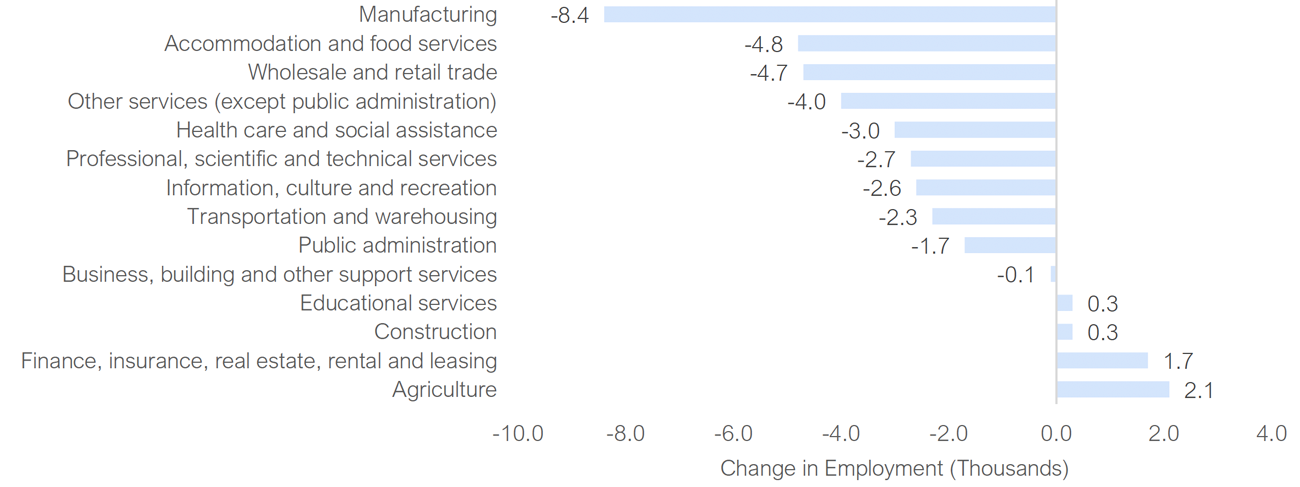
In some of the hardest hit CMAs, COVID-19 related job losses have exacerbated already difficult labour markets.[4] On a proportional basis, job losses were the sharpest in Windsor (-19.1 per cent) which was already experiencing weakness in the manufacturing sector, compounded by temporary auto plant closures due to COVID-19. In Peterborough, the pace of manufacturing job losses was the fastest compared to the other CMAs, leading to a 13.8 per cent decline in total employment. For St. Catharines-Niagara, nearly two-fifths of the 15.6 per cent drop in total employment occurred in the accommodation and food services industry, even though the pandemic-related shutdowns and travel bans began before peak tourism season.
Figure 1 All CMAs have had large employment loss since the beginning of the pandemic
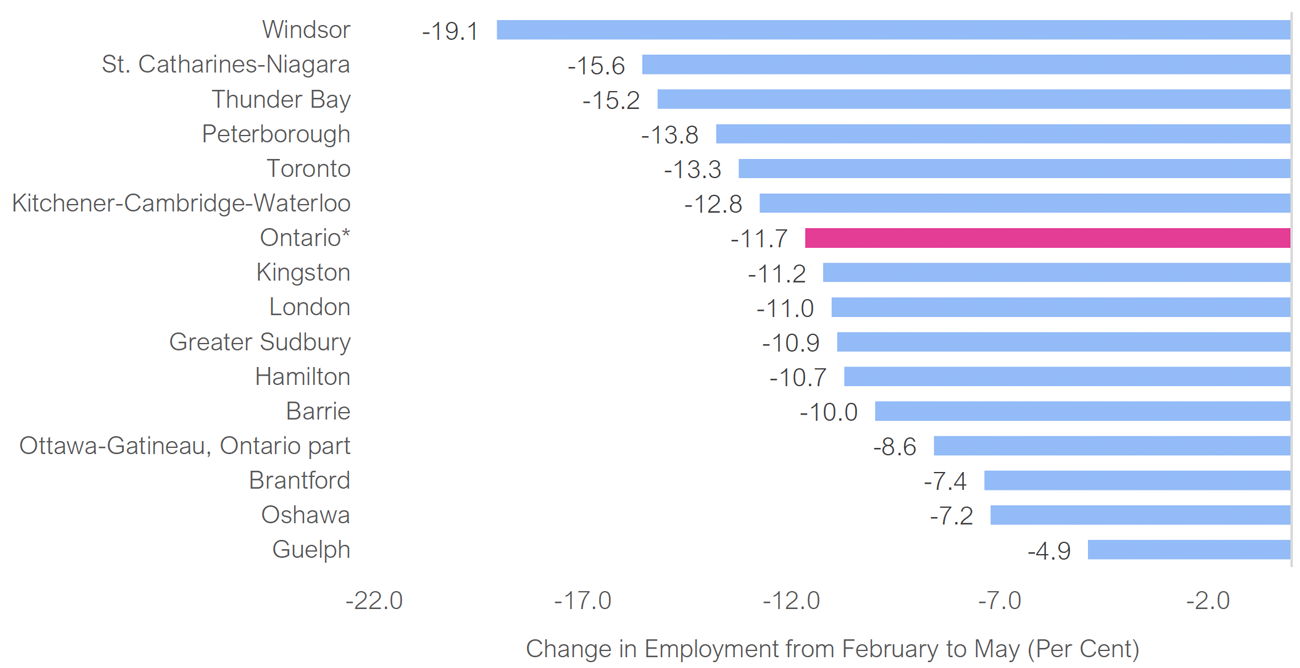
*Ontario total is based on three-month moving averages and is different than the total decline based on single-month data reported elsewhere in this report.
Source: Statistics Canada and FAO.
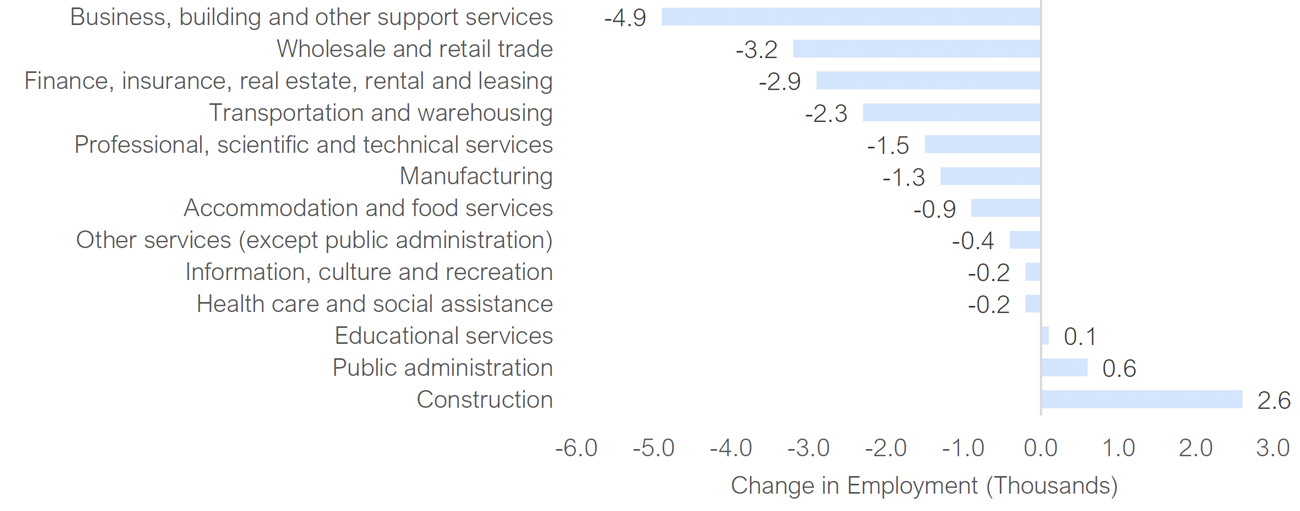
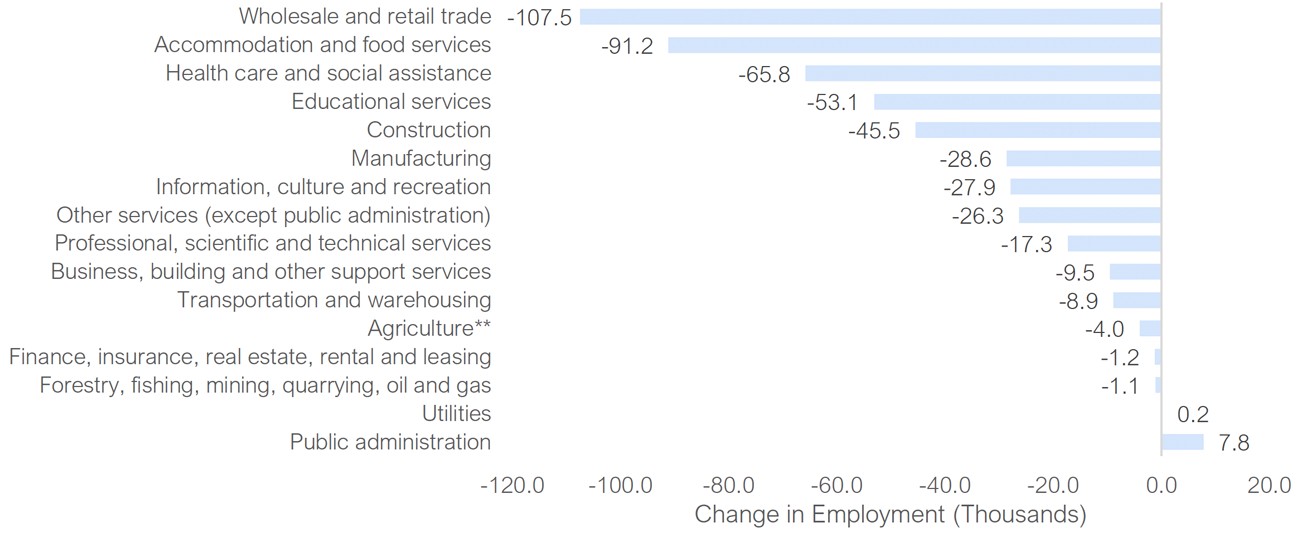
Toronto, which accounted for more than half the province-wide decline in employment, saw job losses of 13.3 per cent over the February to May period. In Ottawa, employment declined by a smaller 8.6 per cent, reflecting the heavy concentration of public administration jobs. In Kingston, the pace of job loss was 11.2 per cent, one-fourth in the accommodation and food industry. Within Northern Ontario, Thunder Bay recorded a steep 15.2 per cent decline in employment, with job losses in all major sectors. In contrast, Greater Sudbury recorded a relatively smaller loss (-10.9 per cent), supported by job gains in its public administration, and finance, insurance, real estate, rental and leasing sectors.
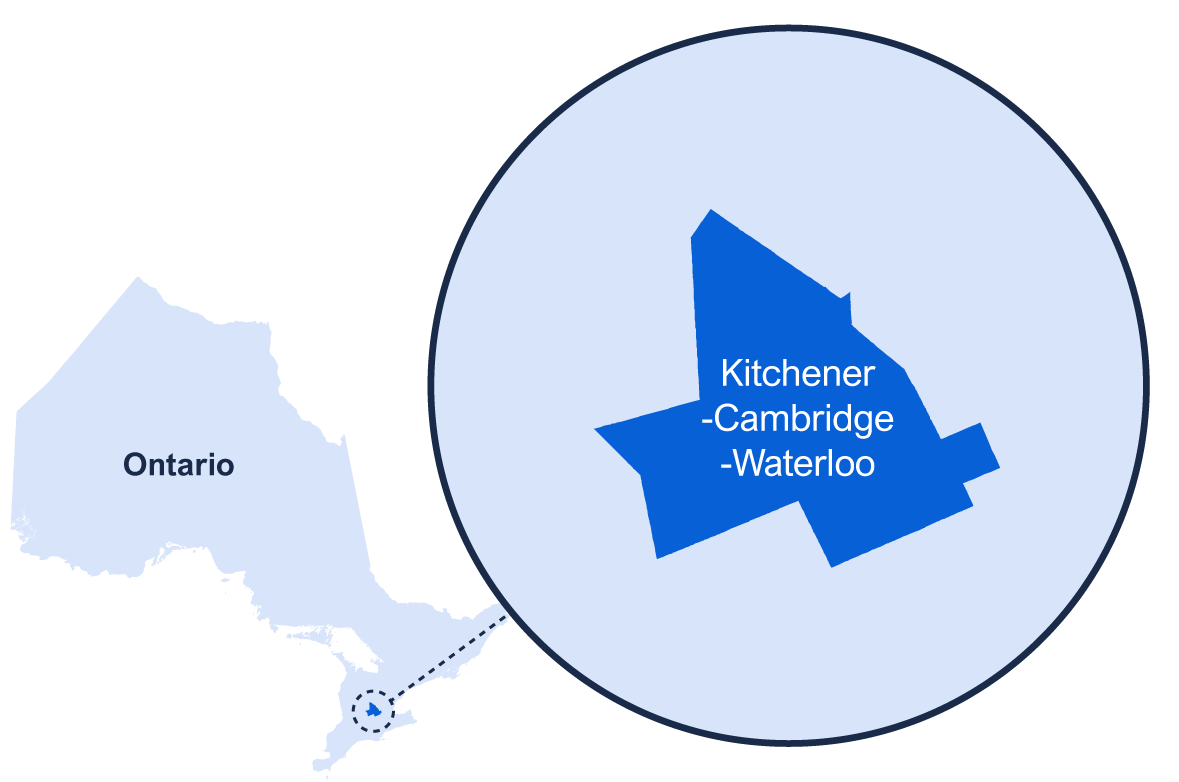
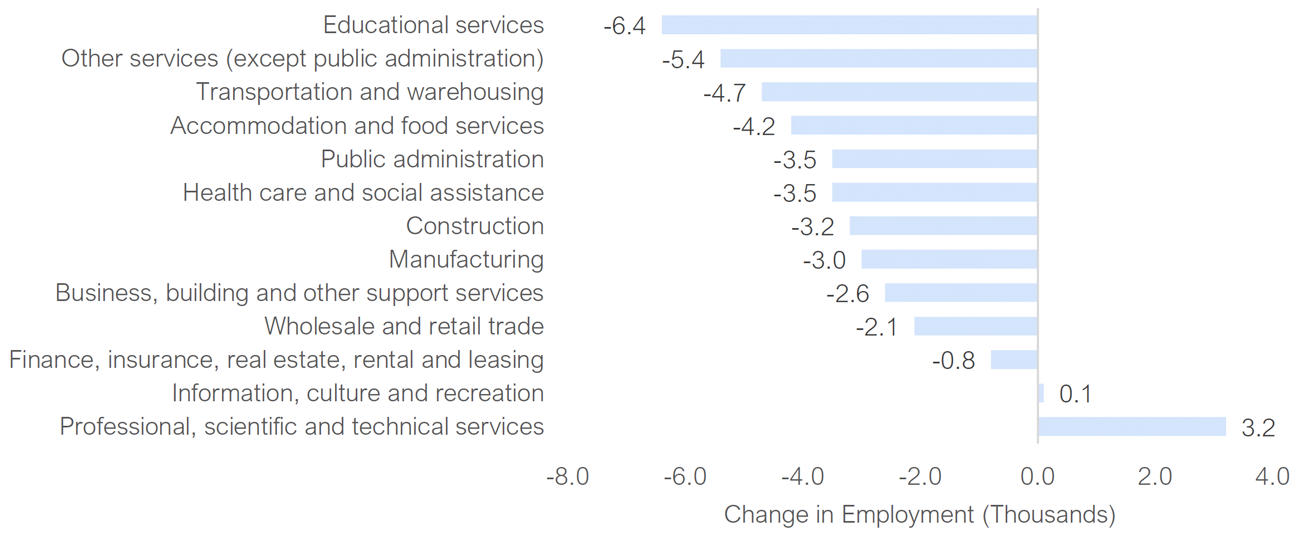
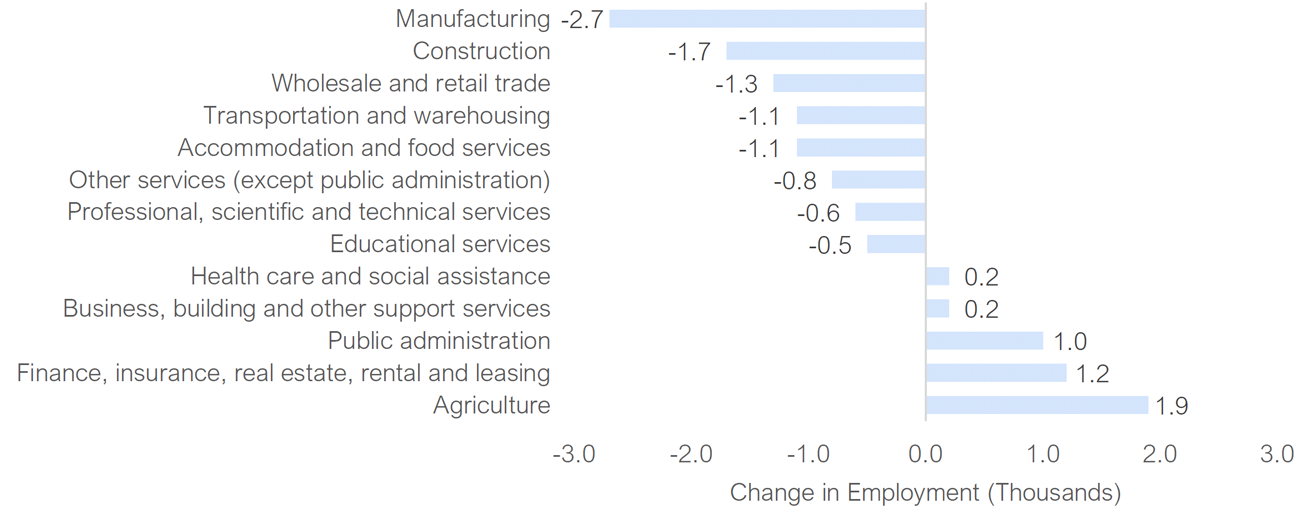
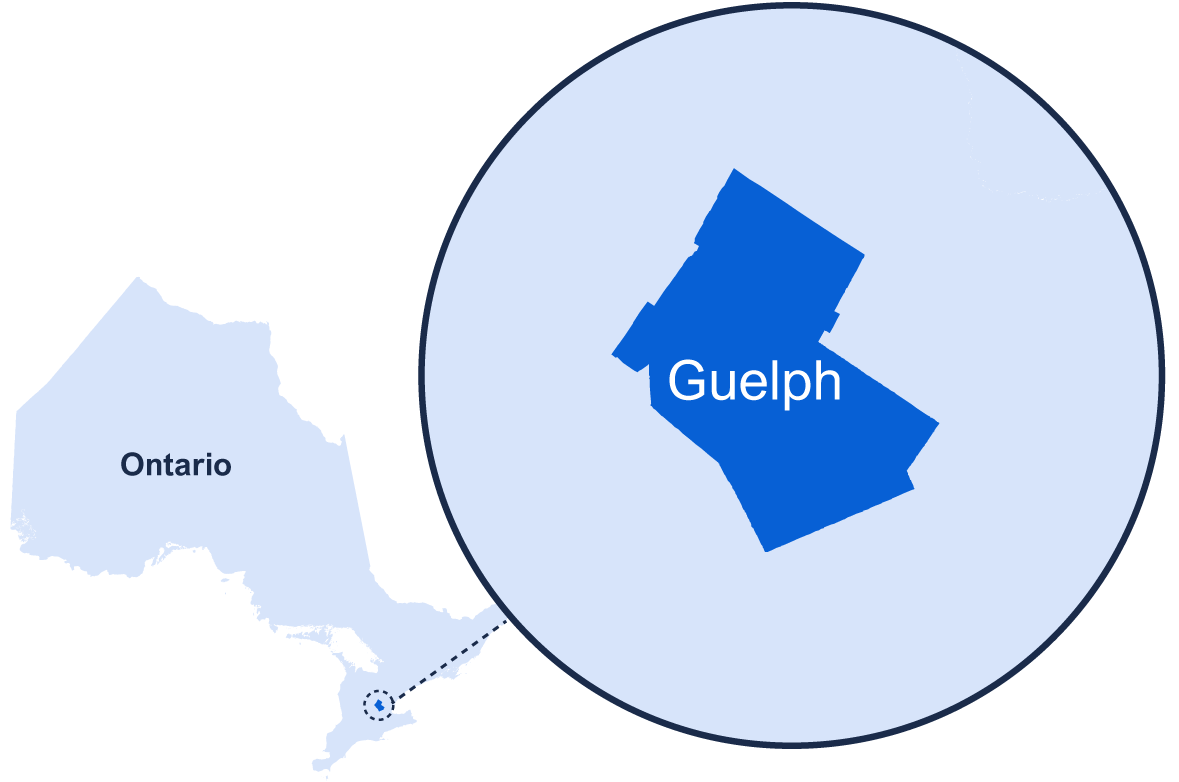
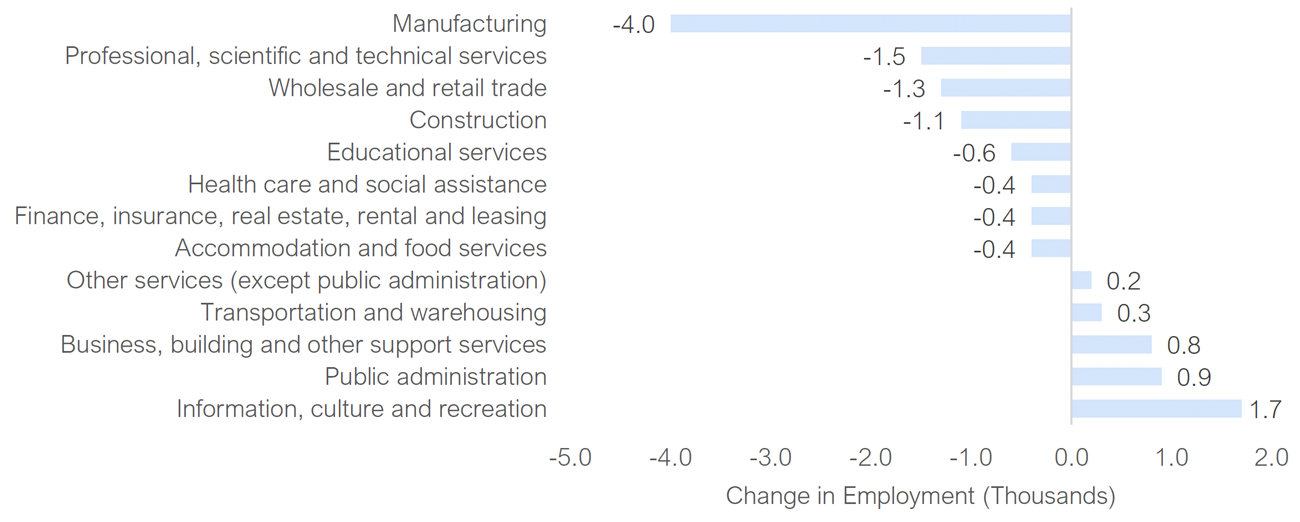
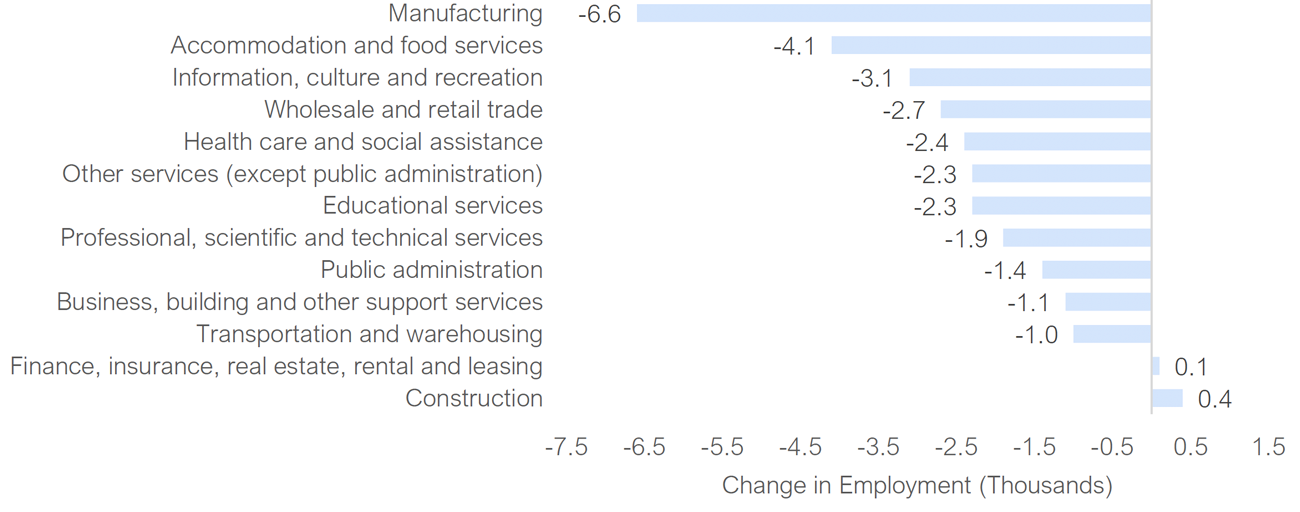
London (-11.0 per cent), Hamilton (-10.7 per cent), and Barrie (-10.0 per cent) posted a similar pace of job losses over the past three months. Nearly two-fifths of the jobs lost in London and Hamilton were in manufacturing, and accommodation and food services industries. Barrie’s hardest hit industry was unique compared to other CMAs, with the business, building, and other support services sector representing more than one-third of the job losses. Guelph experienced the smallest rate of job loss among CMAs over the February to May period, with employment declining by 4.9 per cent. In neighboring Kitchener-Cambridge-Waterloo, job losses (-12.8 per cent) were more significant, with large declines in educational services, and transportation and warehousing industries. Brantford (-7.4 per cent) and Oshawa (-7.2 per cent) experienced relatively moderate employment declines compared to other CMAs, as both areas saw small job gains in select sectors.
Unemployment Rates Rise Across all CMAs
Over the February to May period, all CMAs experienced sharp increases in unemployment rates. In nine of 15 CMAs, unemployment rates more than doubled. Windsor had the highest unemployment rate among CMAs in May at 16.7 per cent, up sharply from 8.3 per cent in February. Guelph, which had an unemployment rate (5.1 per cent) below the provincial average in February, saw a significant spike in its jobless rate in May, jumping to 12.9 per cent, the second highest in the province. The relatively large rise in Guelph’s unemployment rate reflects an increase in the number of people actively looking for work over the period. Notable increases in the unemployment rate also occurred in St. Catharines-Niagara (5.5 per cent in February to 12.6 per cent in May), London (from 4.9 per cent to 11.7 per cent), and Barrie (from 4.3 per cent to 11.6 per cent).
Figure 2 All CMAs saw significant increase in unemployment rates
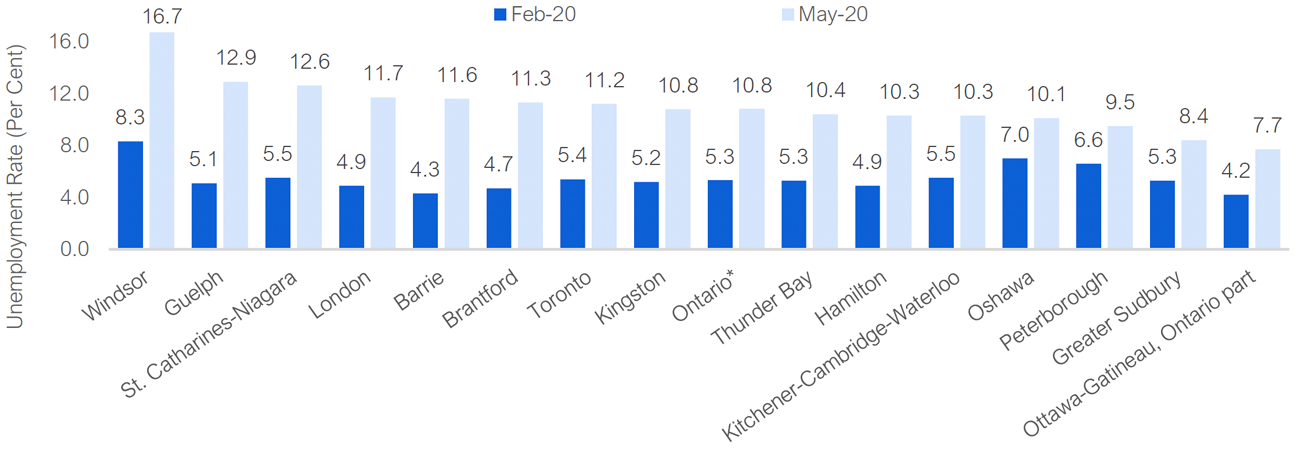
*Based on three-month moving averages and is different than the single-month unemployment rate reported elsewhere in this report.
Source: Statistics Canada and FAO.
Ottawa-Gatineau, which recorded the fourth smallest rate of employment loss among the CMAs, had the lowest unemployment rate at 7.7 per cent in May, up from 4.2 per cent in February. Ottawa’s relatively smaller job loss and lower unemployment rate during the pandemic reflect its sectoral composition and the relatively high proportion of employees who can work from home.
Refer to the Appendix for detailed information on each of Ontario’s 15 CMAs and five regions, including employment impacts by industry.
A Snapshot of the Pandemic’s Impact on Ontario’s Regional Labour Markets
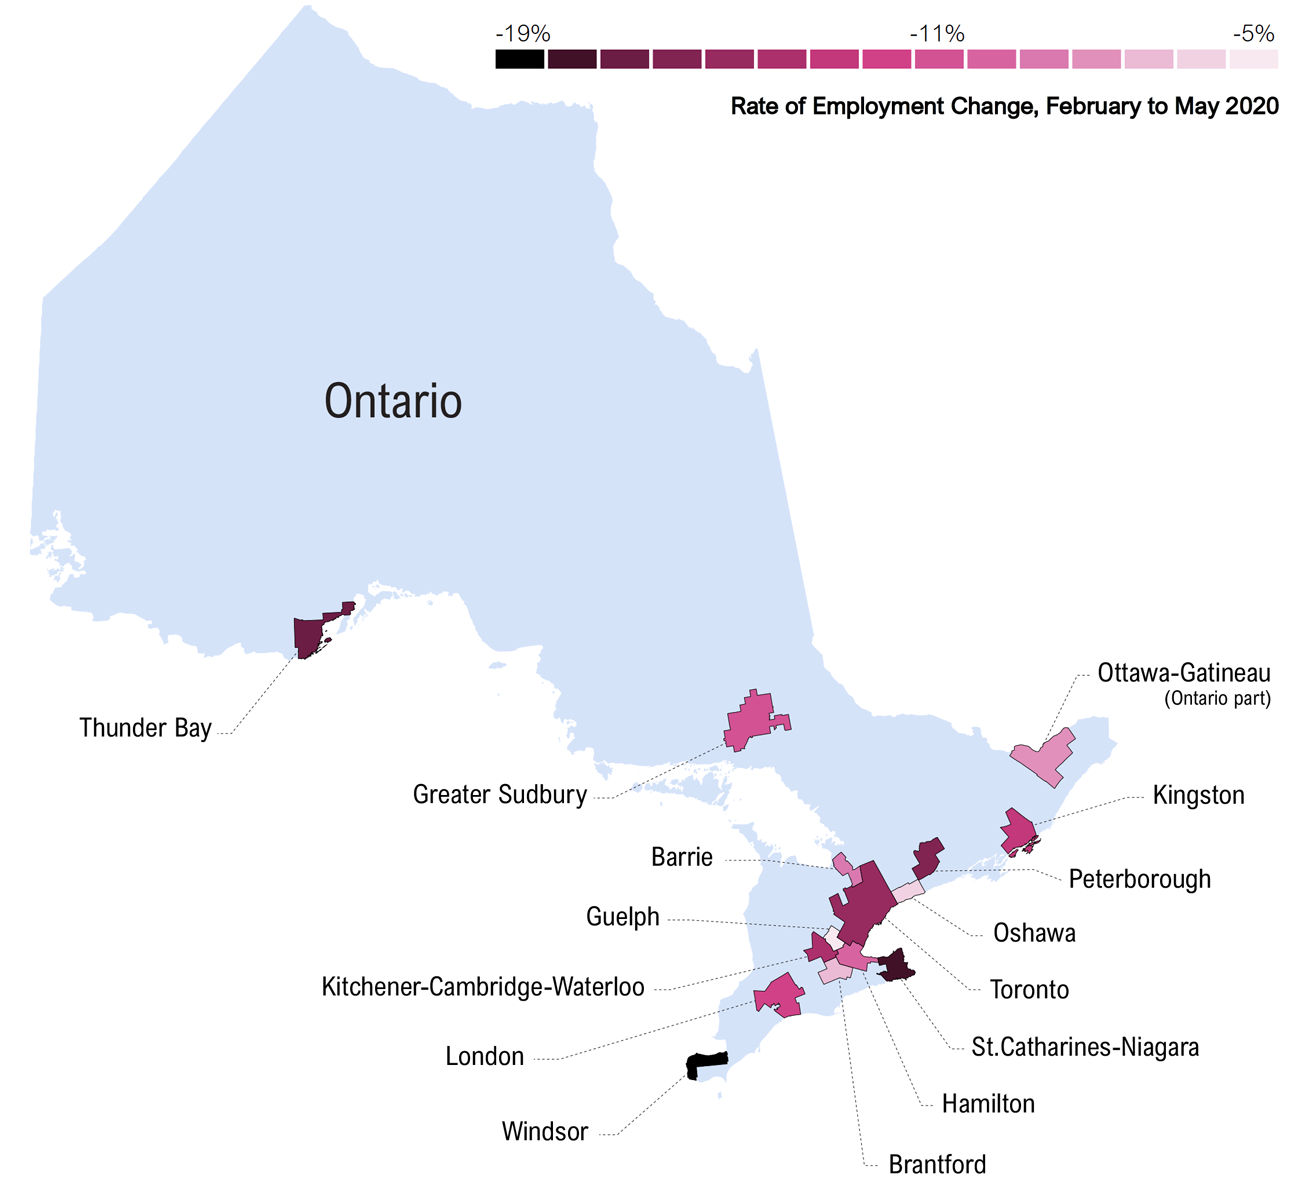
Source: Statistics Canada and FAO.
Ontario Job Losses Continued in May, but at a Slower Pace
According to Statistics Canada’s Labour Force Survey, Ontario employment declined by 64,500 jobs (or -1.0 per cent) in May, significantly slower than the pace of job losses in March (-402,800) and April (-689,200). Since the COVID-19 pandemic began, the number of workers who have been directly affected by the shutdowns was unchanged at 2.2 million in May, as the decline in employment was largely offset by an increase in the number of employees working more hours.
Figure 3 All CMAs saw significant increase in unemployment rates
*Based on three-month moving averages and is different than the single-month unemployment rate reported elsewhere in this report.
Source: Statistics Canada and FAO.
Ontario’s unemployment rate reached a record 13.6 per cent in May, as more people returned to the labour market looking for work and employment continued to decline. Ontario’s labour force increased by 116,500 (or 1.6 per cent), the largest single-month increase on record, leading to an improvement in the labour force participation rate from 59.2 per cent in April to 60.1 per cent in May. Despite the increase in May, the rate of labour market participation remained five percentage points lower than the February rate of 65.1 per cent.
| 2019 | 2020 | Annual Average | ||||||||
|---|---|---|---|---|---|---|---|---|---|---|
| Oct | Nov | Dec | Jan | Feb | Mar | Apr | May | 2018 | 2019 | |
| Total employment change (Thousands) | -11.9 | 17.9 | 17.1 | 15.9 | -3.2 | -402.8 | -689.2 | -64.5 | 114.4 | 210.2 |
| Unemployment rate (Per Cent) | 5.3 | 5.5 | 5.3 | 5.2 | 5.5 | 7.6 | 11.3 | 13.6 | 5.6 | 5.6 |
| Employment change by category (Thousands) | ||||||||||
| Full-time | -17.5 | 32.5 | 35.5 | 10.0 | 20.3 | -248.5 | -464.4 | -59.2 | 130.3 | 156.8 |
| Part-time | 5.6 | -14.6 | -18.5 | 6.0 | -23.5 | -154.3 | -224.8 | -5.2 | -15.9 | 53.4 |
| Public sector employees | 20.2 | 6.4 | -3.5 | -6.0 | 5.3 | -43.5 | -45.2 | -59.1 | 47.6 | 9.2 |
| Private sector employees | -36.1 | 37.4 | 34.3 | 9.3 | -18.1 | -319.5 | -628.0 | 1.4 | 50.0 | 122.8 |
| Self-employed | 3.9 | -25.9 | -13.8 | 12.7 | 9.5 | -39.7 | -16.0 | -6.8 | 16.8 | 78.2 |
For young workers (aged 15 to 24 years), many of whom are employed in temporary or part-time positions, employment declined by 4.4 per cent (or -30,100 jobs) in May. Since February, young workers have experienced almost three times the rate of job loss compared to older workers (25 years and older).[5] Similarly, female workers have experienced more severe job losses, with employment down by 17.2 per cent (or -616,900) since February compared to a 13.6 per cent (or -539,600) drop for males.
Reopened Industries Show Early Signs of Recovery
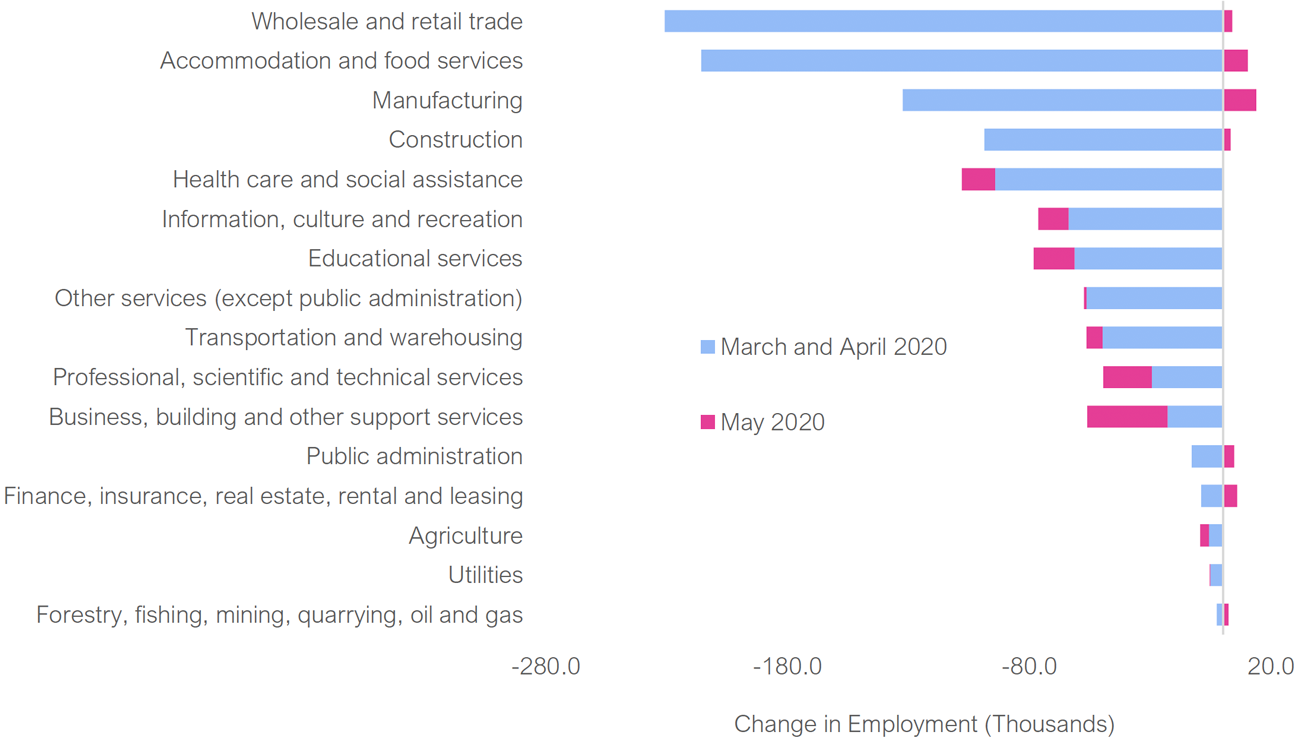
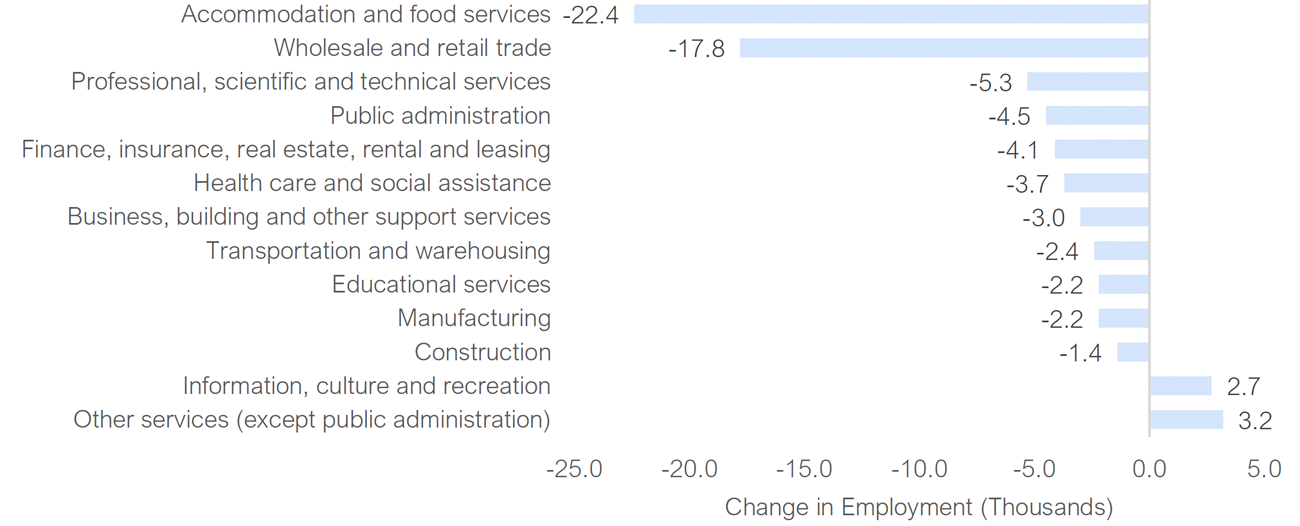
Employment gains in May occurred in industries that have been gradually reopening, including manufacturing (13,700, or 2.2 per cent), accommodation and food services (10,200, or 4.4 per cent), wholesale and retail trade (3,800, or 0.4 per cent), and construction (3,100, or 0.7 per cent).[6] However, these gains were outweighed by continuing job losses among service-producing industries, notably business, building and other support (-33,200 or -10.9 per cent), professional, scientific and technical (-20,200, or -3.1 per cent), and education (-16,900 or -3.5 per cent).
Figure 4 Reopening industries show small job gains in May
Source: Statistics Canada and FAO.
Although some industries saw gains in employment in May, the extent of the recovery was small compared to the large job losses recorded in March and April. For example, while manufacturing jobs increased by 13,700 in May, the level of employment is still 15.6 per cent lower than in February. Similarly, despite modest job gains in May in wholesale and retail trade, and accommodation and food services, the level of employment in those industries remains far below February levels (-20.4 per cent, and -45.8 per cent, respectively).
Industries that saw relatively smaller employment declines during the pandemic shutdown have so far recovered a greater share of the jobs lost compared to other sectors. For example, while finance, insurance, real estate, rental and leasing has recovered nearly two-thirds of the employment decline from February to April, its pandemic-related job loss was relatively small at -9,000 jobs, or -1.5 per cent.
Ontario’s Job Losses Steeper Than All Other Provinces
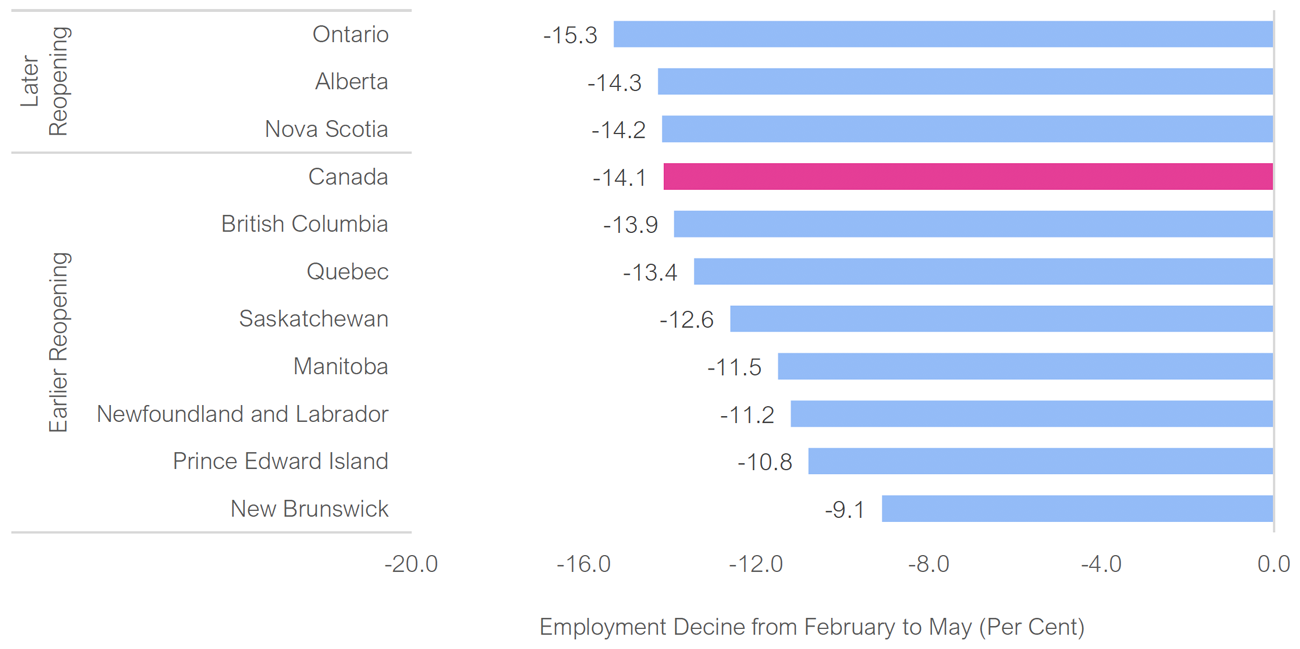
Ontario was the only province to record a net decline in employment in May, as restrictions on economic activity in Ontario remained largely in place during the Labour Force Survey (LFS) survey week of May 10 to 16. Over the past three months, employment in Ontario has declined by 15.3 per cent, the steepest job loss among all provinces. In addition to Ontario, Alberta (-14.3 per cent) and Nova Scotia (-14.2 per cent) have also posted job declines above the national average. In contrast, the other three Atlantic provinces, where re-openings occurred earlier, have experienced more modest job losses.
Figure 5 Rate of employment decline reflects the extent of reopening across provinces
Source: Statistics Canada and FAO.
Looking Ahead
Ontario is likely to see an increase in employment in June, given the gradual re-openings that have continued throughout the month. However, because the timing of the reopening differed between regions of the province, the pace of job gains may vary by CMA.
The Financial Accountability Office will release an update of its economic and budget outlook report in early fall which will include an updated assessment of the impact of the COVID-19 pandemic on Ontario’s labour market.
Appendix
Appendix – Labour Market Results by CMA
Ottawa-Gatineau, Ontario part
| Key Statistics (2019) | |
| Population (Thousands) | 1,095 |
| Population share of Ontario | 7.5% |
| Employment (Thousands) | 590 |
| Employment share of Ontario | 7.9% |
| Median age | 39.3 |
administration |
|||||
| Employment | 125,600 | 72,000 | 69,400 | 68,900 | 47,400 |
| (Share of Total Employment) | (21.3%) | (12.2%) | (11.8%) | (11.7%) | (8.0%) |
| 2018 | 2019 | 2020 | Feb to May 2020 | |||||
|---|---|---|---|---|---|---|---|---|
| Jan | Feb | Mar | Apr | May | ||||
| Employment Change (Thousands) | 10.9 | 32.5 | -8.9 | -9.5 | -15.3 | -20.3 | -15.5 | -51.1 (-8.6%) |
|
Unemployment Rate (Per Cent) |
4.6 | 4.7 | 4.2 | 4.2 | 4.9 | 6.3 | 7.7 | 3.5 |
|
Participation Rate (Per Cent) |
67.2 | 69.6 | 70.1 | 69.0 | 67.5 | 66.0 | 65.1 | -3.9 |
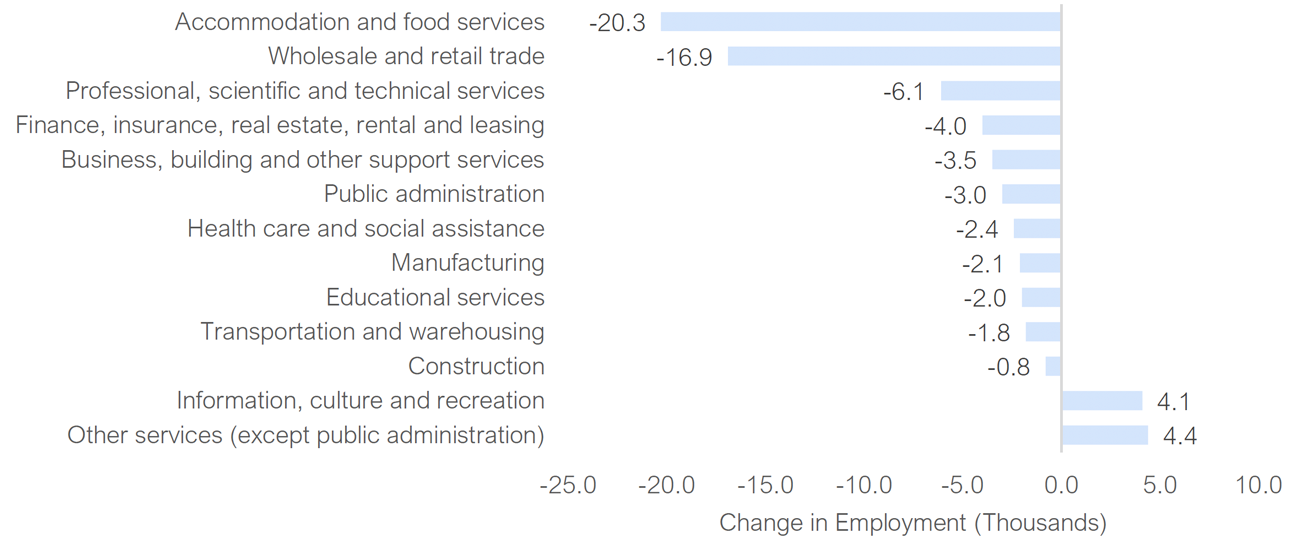
Industry Breakdown of Job Losses During the Pandemic (February to May 2020)*
*Not seasonally adjusted.
Source: Statistics Canada and FAO.
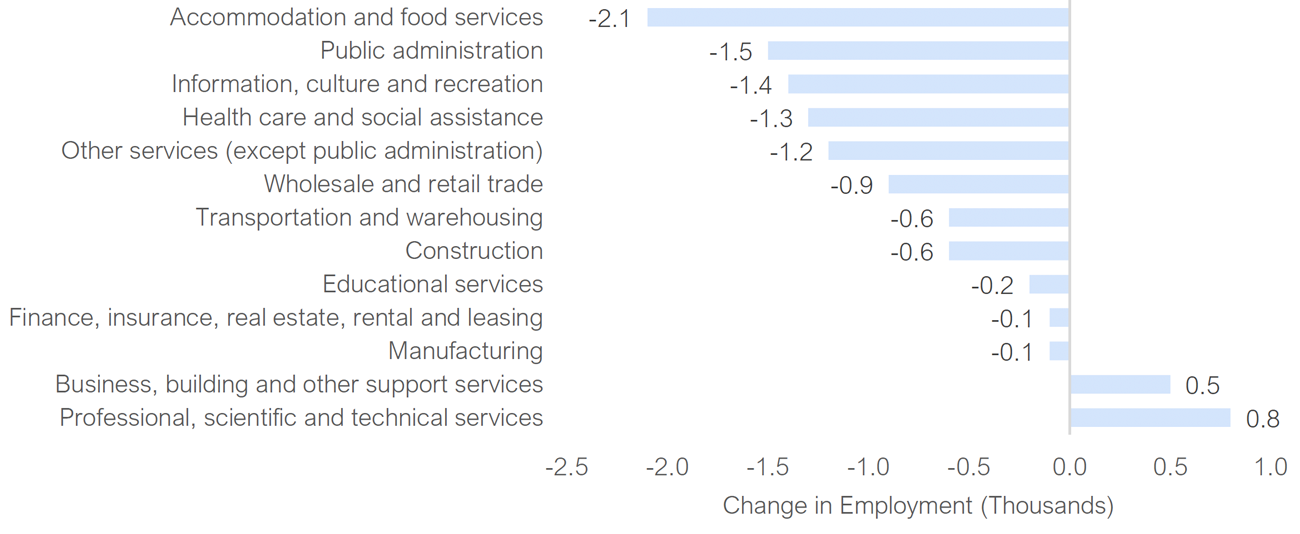
Kingston
| Key Statistics (2019) | |
| Population (Thousands) | 176 |
| Population share of Ontario | 1.2% |
| Employment (Thousands) | 88 |
| Employment share of Ontario | 1.2% |
| Median age | 41.9 |
|
|
|
|
|
|
|
| Employment | 18,400 | 11,400 | 10,300 | 7,800 | 6,900 |
| (Share of Total Employment) | (21.0%) | (13.0%) | (11.8%) | (8.9%) | (7.9%) |
| 2018 | 2019 | 2020 | Feb to May 2020 | |||||
|---|---|---|---|---|---|---|---|---|
| Jan | Feb | Mar | Apr | May | ||||
| Employment Change (Thousands) | -0.9 | 1.1 | 0.2 | 0.5 | -1.3 | -4.5 | -4.0 | -9.8 (-11.2%) |
| Unemployment Rate (Per Cent) | 5.5 | 5.3 | 5.7 | 5.2 | 5.7 | 7.9 | 10.8 | 5.6 |
| Participation Rate (Per Cent) | 63.7 | 63.4 | 62.4 | 62.5 | 61.8 | 59.9 | 58.8 | -3.7 |
Industry Breakdown of Job Losses During the Pandemic (February to May 2020)*
*Not seasonally adjusted.
Source: Statistics Canada and FAO.
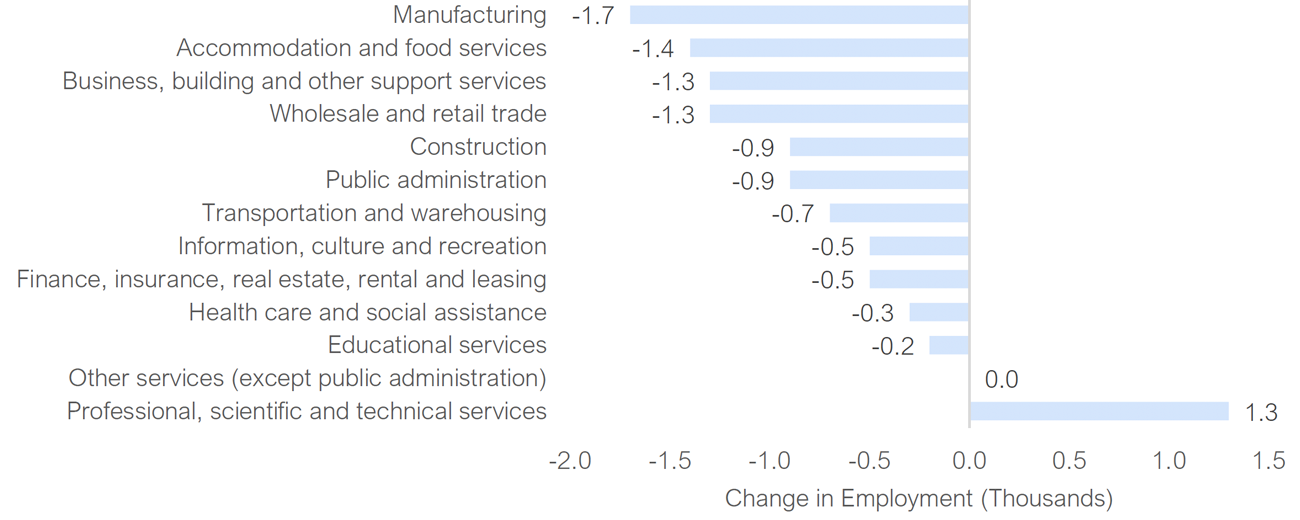
Peterborough
| Key Statistics (2019) | |
| Population (Thousands) | 131 |
| Population share of Ontario | 0.9% |
| Employment (Thousands) | 88 |
| Employment share of Ontario | 0.8% |
| Median age | 44.1 |
|
|
|
|
|
|
|
| Employment | 10,000 | 9,300 | 6,400 | 5,200 | 4,400 |
| (Share of Total Employment) | (16.4%) | (15.2%) | (10.5%) | (8.5%) | (7.2%) |
| 2018 | 2019 | 2020 | Feb to May 2020 | |||||
|---|---|---|---|---|---|---|---|---|
| Jan | Feb | Mar | Apr | May | ||||
| Employment Change (Thousands) | 2.4 | -2.5 | -0.7 | 0.4 | -2.3 | -2.4 | -3.1 | -7.8 (-13.8%) |
| Unemployment Rate (Per Cent) | 4.8 | 6.0 | 7.6 | 6.6 | 6.7 | 7.7 | 9.5 | 2.9 |
| Participation Rate (Per Cent) | 63.0 | 60.4 | 56.0 | 56.0 | 53.6 | 51.7 | 49.5 | -6.5 |
Industry Breakdown of Job Losses During the Pandemic (February to May 2020)*
*Not seasonally adjusted.
Source: Statistics Canada and FAO.
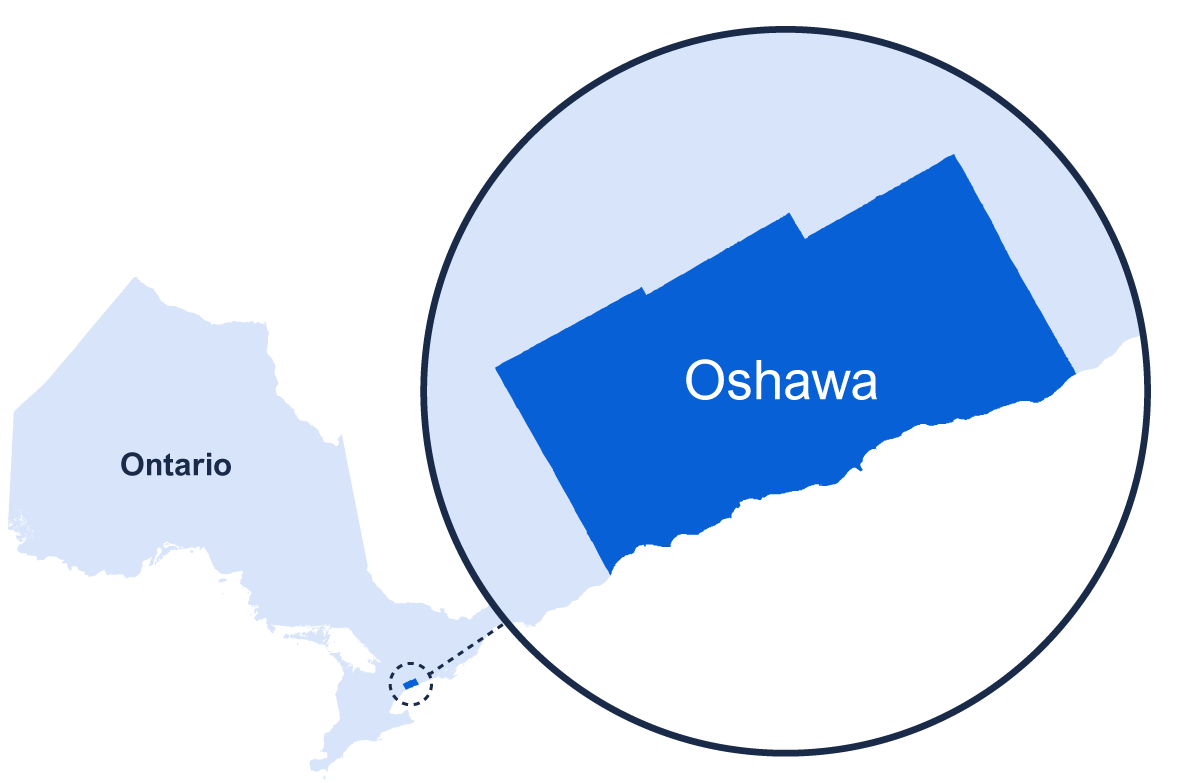
Oshawa
| Key Statistics (2019) | |
| Population (Thousands) | 414 |
| Population share of Ontario | 2.8% |
| Employment (Thousands) | 219 |
| Employment share of Ontario | 2.9% |
| Median age | 39.5 |
|
|
|
|
|
|
|
| Employment | 36,600 | 27,800 | 20,000 | 17,000 | 17,000 |
| (Share of Total Employment) | (16.7%) | (12.7%) | (9.1%) | (7.8%) | (7.8%) |
| 2018 | 2019 | 2020 | Feb to May 2020 | |||||
|---|---|---|---|---|---|---|---|---|
| Jan | Feb | Mar | Apr | May | ||||
| Employment Change (Thousands) | 10.2 | -2.0 | 0.9 | 3.6 | -0.6 | -5.4 | -9.7 | -15.7 (-7.2%) |
| Unemployment Rate (Per Cent) | 5.1 | 5.4 | 6.7 | 7.0 | 7.8 | 8.5 | 10.1 | 3.1 |
| Participation Rate (Per Cent) | 68.6 | 66.8 | 65.7 | 66.9 | 67.3 | 66.0 | 64.0 | -2.9 |
Industry Breakdown of Job Losses During the Pandemic (February to May 2020)*
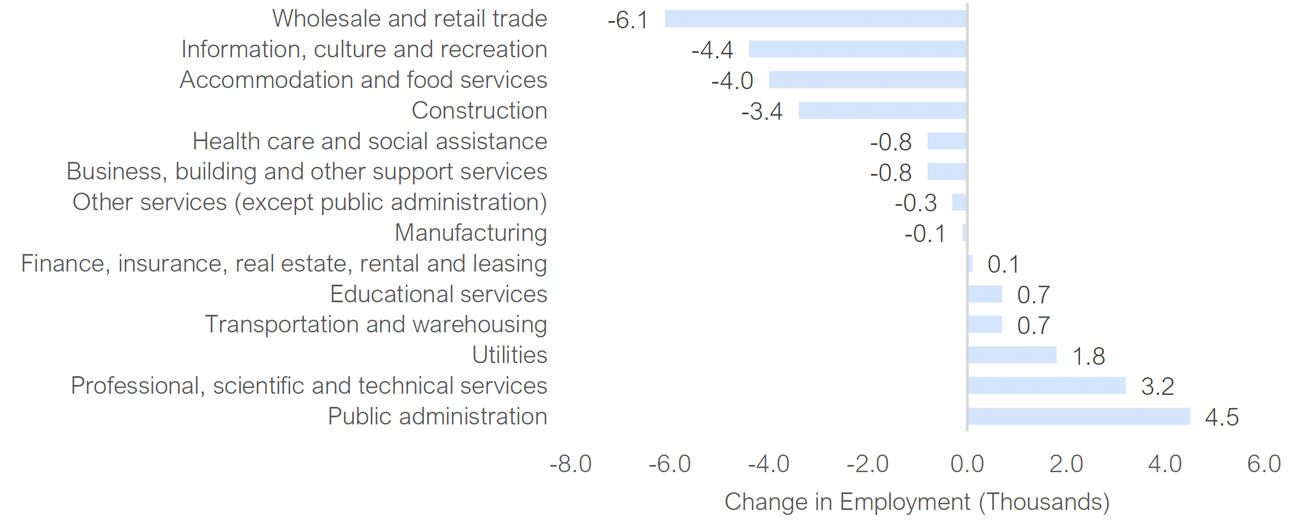
*Not seasonally adjusted.
Source: Statistics Canada and FAO.
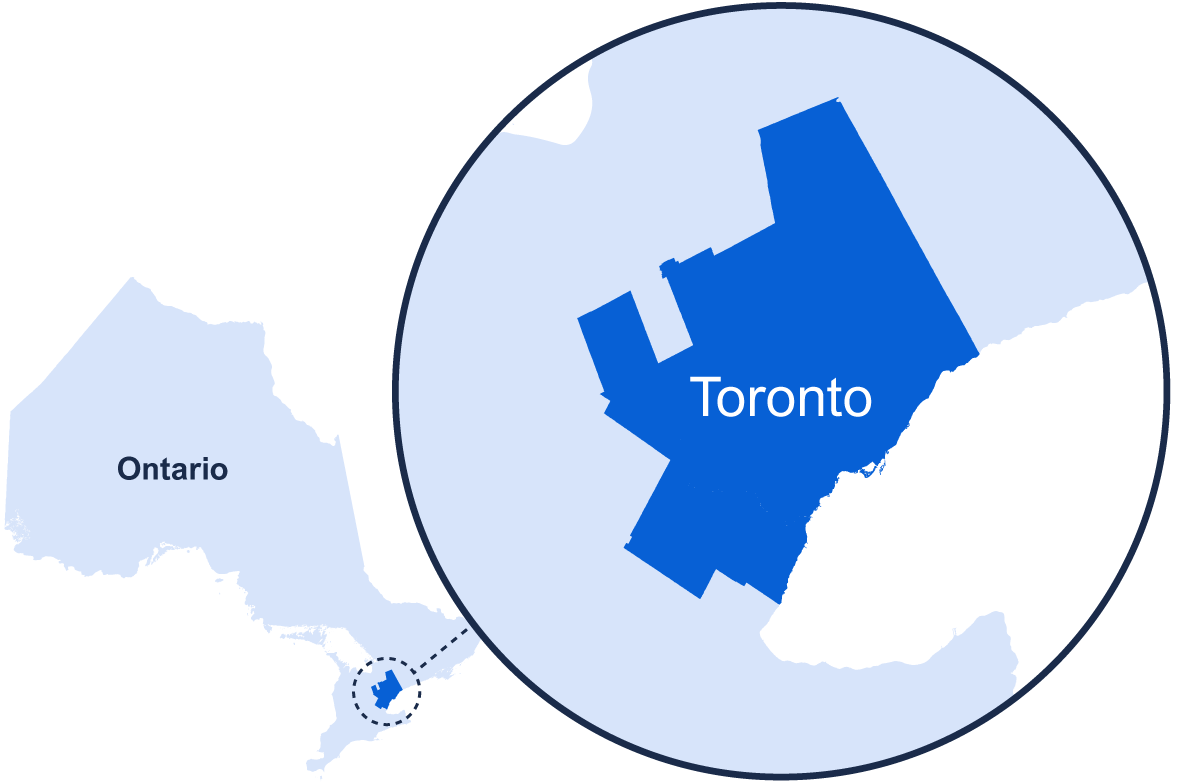
Toronto
| Key Statistics (2019) | |
| Population (Thousands) | 6,472 |
| Population share of Ontario | 44.4% |
| Employment (Thousands) | 3,492 |
| Employment share of Ontario | 46.8% |
| Median age | 38.6 |
|
|
|
|
|
|
|
| Employment | 515,600 | 425,400 | 381,800 | 372,300 | 328,400 |
| (Share of Total Employment) | (14.8%) | (12.2%) | (10.9%) | (10.7%) | (9.4%) |
| 2018 | 2019 | 2020 | Feb to May 2020 | |||||
|---|---|---|---|---|---|---|---|---|
| Jan | Feb | Mar | Apr | May | ||||
| Employment Change (Thousands) | 63.4 | 138.5 | 23.9 | 6.2 | -72.6 | -190.6 | -209.2 | -472.4 (-13.3%) |
| Unemployment Rate (Per Cent) | 6.0 | 6.0 | 5.5 | 5.4 | 6.0 | 7.9 | 11.2 | 5.8 |
| Participation Rate (Per Cent) | 65.8 | 66.7 | 66.9 | 66.8 | 65.7 | 63.3 | 61.4 | -5.4 |
Industry Breakdown of Job Losses During the Pandemic (February to May 2020)*
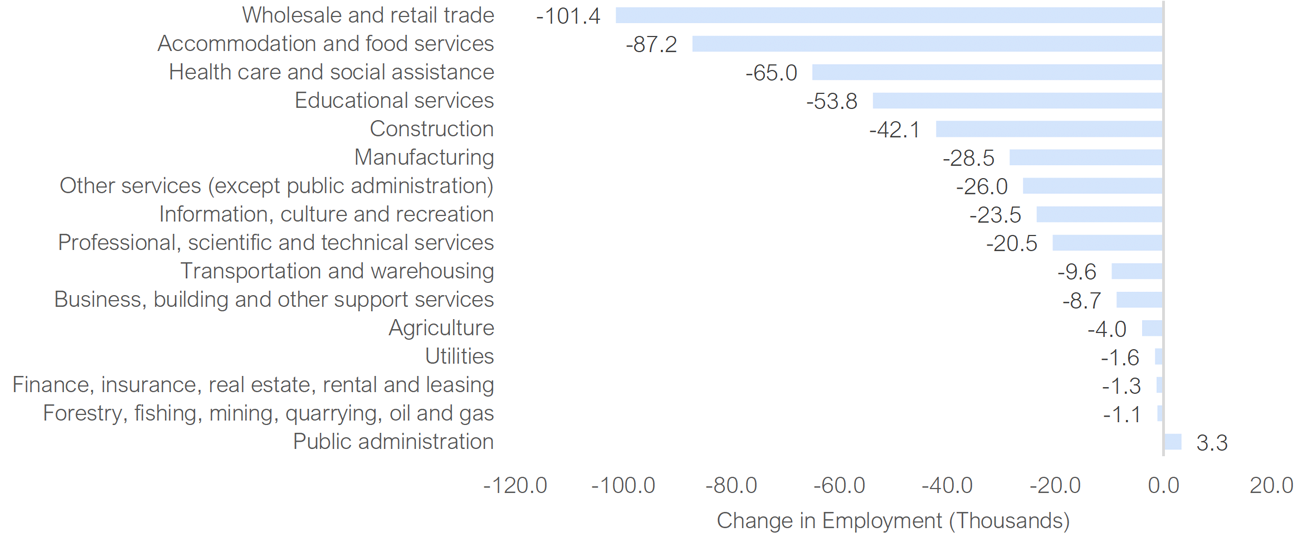
*Not seasonally adjusted.
Source: Statistics Canada and FAO.
Hamilton
| Key Statistics (2019) | |
| Population (Thousands) | 795 |
| Population share of Ontario | 5.5% |
| Employment (Thousands) | 423 |
| Employment share of Ontario | 5.7% |
| Median age | 41.5 |
|
|
|
|
|
|
|
| Employment | 67,300 | 57,900 | 50,200 | 33,900 | 31,100 |
| (Share of Total Employment) | (15.9%) | (13.7%) | (11.9%) | (8.0%) | (7.4%) |
| 2018 | 2019 | 2020 | Feb to May 2020 | |||||
|---|---|---|---|---|---|---|---|---|
| Jan | Feb | Mar | Apr | May | ||||
| Employment Change (Thousands) | -4.1 | 9.0 | -2.8 | 1.2 | -3.9 | -16.6 | -25.4 | -45.9 (-10.7%) |
| Unemployment Rate (Per Cent) | 4.9 | 4.3 | 4.8 | 4.9 | 5.7 | 7.5 | 10.3 | 5.4 |
| Participation Rate (Per Cent) | 65.0 | 65.1 | 65.6 | 65.8 | 65.6 | 64.3 | 62.1 | -3.7 |
Industry Breakdown of Job Losses During the Pandemic (February to May 2020)*
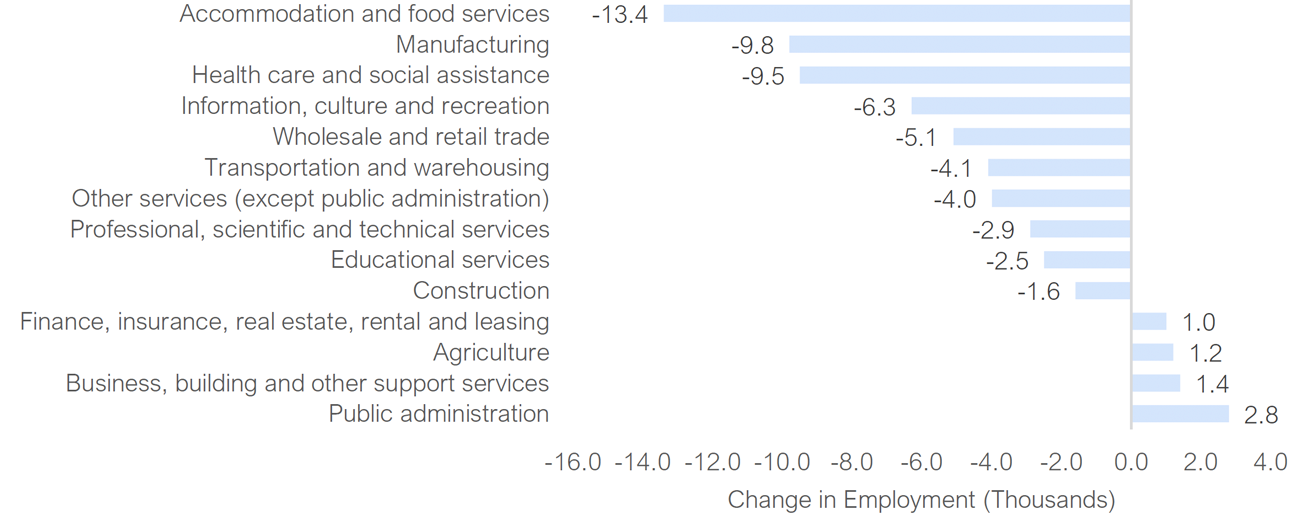
*Not seasonally adjusted.
Source: Statistics Canada and FAO.
St. Catharines-Niagara
| Key Statistics (2019) | |
| Population (Thousands) | 435 |
| Population share of Ontario | 3.0% |
| Employment (Thousands) | 200 |
| Employment share of Ontario | 2.7% |
| Median age | 45.4 |
|
|
|
|
|
|
|
| Employment | 31,100 | 26,000 | 24,000 | 18,500 | 18,300 |
| (Share of Total Employment) | (15.6%) | (13.0%) | (12.0%) | (9.3%) | (9.2%) |
| 2018 | 2019 | 2020 | Feb to May 2020 | |||||
|---|---|---|---|---|---|---|---|---|
| Jan | Feb | Mar | Apr | May | ||||
| Employment Change (Thousands) | 4.1 | -2.1 | -1.5 | -2.1 | -9.2 | -10.4 | -12.0 | -31.6 (-15.6%) |
| Unemployment Rate (Per Cent) | 6.6 | 5.8 | 5.2 | 5.5 | 7.8 | 9.9 | 12.6 | 7.1 |
| Participation Rate (Per Cent) | 61.2 | 59.3 | 60.1 | 59.6 | 58.4 | 56.4 | 54.3 | -5.3 |
Industry Breakdown of Job Losses During the Pandemic (February to May 2020)*
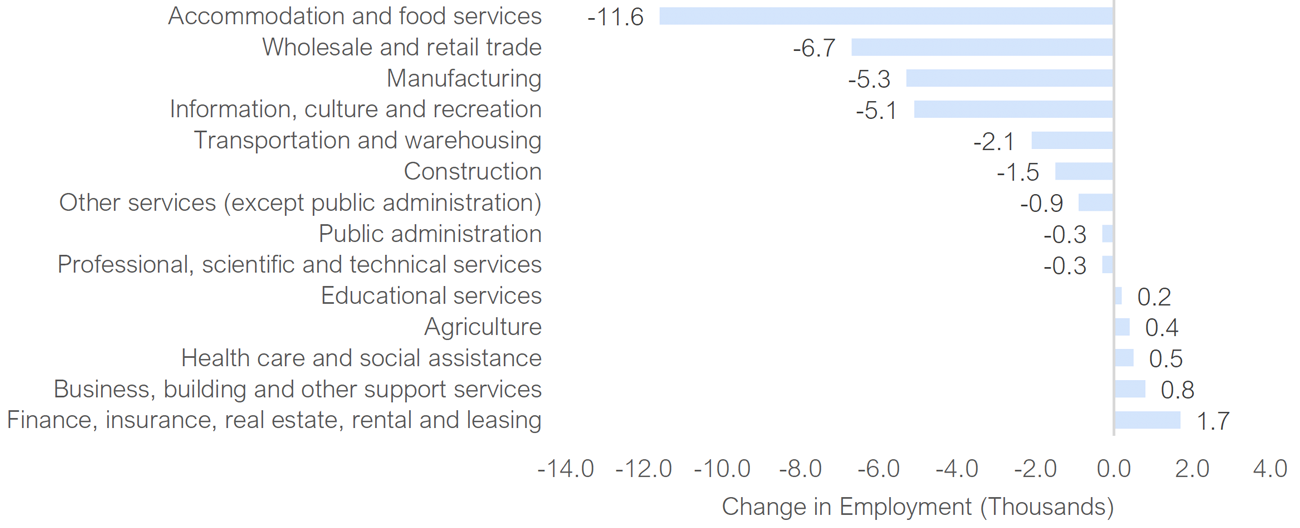
*Not seasonally adjusted.
Source: Statistics Canada and FAO.
Kitchener-Cambridge-Waterloo
| Key Statistics (2019) | |
| Population (Thousands) | 584 |
| Population share of Ontario | 4.0% |
| Employment (Thousands) | 302 |
| Employment share of Ontario | 4.1% |
| Median age | 37.4 |
|
|
|
|
|
|
|
| Employment | 51,100 | 42,800 | 29,600 | 26,800 | 24,800 |
| (Share of Total Employment) | (16.9%) | (14.2%) | (9.8%) | (8.9%) | (8.2%) |
| 2018 | 2019 | 2020 | Feb to May 2020 | |||||
|---|---|---|---|---|---|---|---|---|
| Jan | Feb | Mar | Apr | May | ||||
| Employment Change (Thousands) | 4.4 | 9.9 | 0.1 | 3.6 | -2.9 | -16.4 | -20.2 | -39.5 (-12.8%) |
| Unemployment Rate (Per Cent) | 5.1 | 5.3 | 5.4 | 5.5 | 6.0 | 7.8 | 10.3 | 4.8 |
| Participation Rate (Per Cent) | 70.0 | 71.1 | 71.3 | 72.3 | 71.8 | 69.2 | 66.1 | -6.2 |
Industry Breakdown of Job Losses During the Pandemic (February to May 2020)*
*Not seasonally adjusted.
Source: Statistics Canada and FAO.
Brantford
| Key Statistics (2019) | |
| Population (Thousands) | 149 |
| Population share of Ontario | 1.0% |
| Employment (Thousands) | 79 |
| Employment share of Ontario | 1.1% |
| Median age | 41.2 |

|
|
|
|
|
|
|
| Employment | 14,700 | 13,100 | 9,800 | 6,200 | 5,400 |
| (Share of Total Employment) | (18.7%) | (16.6%) | (12.5%) | (7.9%) | (6.9%) |
| 2018 | 2019 | 2020 | Feb to May 2020 | |||||
|---|---|---|---|---|---|---|---|---|
| Jan | Feb | Mar | Apr | May | ||||
| Employment Change (Thousands) | -2.3 | 8.7 | -1.0 | -1.8 | -1.7 | -3.0 | -0.8 | -5.5 (-7.4%) |
| Unemployment Rate (Per Cent) | 6.2 | 4.3 | 4.3 | 4.7 | 5.9 | 9.4 | 11.3 | 6.6 |
| Participation Rate (Per Cent) | 64.1 | 69.5 | 67.1 | 65.8 | 65.1 | 64.7 | 65.3 | -0.5 |
Industry Breakdown of Job Losses During the Pandemic (February to May 2020)*
*Not seasonally adjusted.
Source: Statistics Canada and FAO.
Guelph
| Key Statistics (2019) | |
| Population (Thousands) | 165 |
| Population share of Ontario | 1.1% |
| Employment (Thousands) | 93 |
| Employment share of Ontario | 1.2% |
| Median age | 39.0 |
|
|
|
|
|
|
|
| Employment | 18,800 | 14,800 | 12,300 | 9,000 | 6,200 |
| (Share of Total Employment) | (20.3%) | (16.0%) | (13.3%) | (9.7%) | (6.7%) |
| 2018 | 2019 | 2020 | Feb to May 2020 | |||||
|---|---|---|---|---|---|---|---|---|
| Jan | Feb | Mar | Apr | May | ||||
| Employment Change (Thousands) | -2.0 | 3.8 | 0.1 | 0.4 | 0.4 | -2.7 | -2.0 | -4.3 (-4.9%) |
| Unemployment Rate (Per Cent) | 3.8 | 4.6 | 5.0 | 5.1 | 5.3 | 8.6 | 12.9 | 7.8 |
| Participation Rate (Per Cent) | 68.0 | 69.7 | 65.5 | 65.7 | 66.1 | 66.3 | 67.7 | 2.0 |
Industry Breakdown of Job Losses During the Pandemic (February to May 2020)*
*Not seasonally adjusted.
Source: Statistics Canada and FAO.
London
| Key Statistics (2019) | |
| Population (Thousands) | 545 |
| Population share of Ontario | 3.7% |
| Employment (Thousands) | 251 |
| Employment share of Ontario | 3.4% |
| Median age | 39.5 |
|
|
|
|
|
|
|
| Employment | 37,500 | 37,400 | 34,300 | 21,700 | 18,100 |
| (Share of Total Employment) | (14.9%) | (14.9%) | (13.7%) | (8.6%) | (7.2%) |
| 2018 | 2019 | 2020 | Feb to May 2020 | |||||
|---|---|---|---|---|---|---|---|---|
| Jan | Feb | Mar | Apr | May | ||||
| Employment Change (Thousands) | 7.1 | -1.7 | 3.7 | 0.8 | -1.9 | -16.3 | -11.0 | -29.2 (-11.0%) |
| Unemployment Rate (Per Cent) | 5.6 | 5.5 | 5.0 | 4.9 | 5.8 | 8.9 | 11.7 | 6.8 |
| Participation Rate (Per Cent) | 61.0 | 59.4 | 61.5 | 61.5 | 61.6 | 59.7 | 58.8 | -2.7 |
Industry Breakdown of Job Losses During the Pandemic (February to May 2020)*
*Not seasonally adjusted.
Source: Statistics Canada and FAO.
Windsor
| Key Statistics (2019) | |
| Population (Thousands) | 355 |
| Population share of Ontario | 2.4% |
| Employment (Thousands) | 170 |
| Employment share of Ontario | 2.3% |
| Median age | 40.9 |
|
|
|
|
|
|
|
| Employment | 36,000 | 22,400 | 22,200 | 12,100 | 11,500 |
| (Share of Total Employment) | (21.1%) | (13.1%) | (13.0%) | (7.1%) | (6.7%) |
| 2018 | 2019 | 2020 | Feb to May 2020 | |||||
|---|---|---|---|---|---|---|---|---|
| Jan | Feb | Mar | Apr | May | ||||
| Employment Change (Thousands) | 1.7 | 5.9 | -1.5 | 2.0 | -6.1 | -13.4 | -12.4 | -31.9 (-19.1%) |
| Unemployment Rate (Per Cent) | 6.0 | 6.4 | 8.3 | 8.3 | 10.5 | 12.9 | 16.7 | 8.4 |
| Participation Rate (Per Cent) | 60.3 | 61.7 | 60.6 | 61.2 | 60.4 | 56.8 | 54.4 | -6.8 |
Industry Breakdown of Job Losses During the Pandemic (February to May 2020)*
*Not seasonally adjusted.
Source: Statistics Canada and FAO.
Barrie
| Key Statistics (2019) | |
| Population (Thousands) | 214 |
| Population share of Ontario | 1.5% |
| Employment (Thousands) | 119 |
| Employment share of Ontario | 1.6% |
| Median age | 39.5 |
|
|
|
|
|
|
|
| Employment | 19,000 | 16,700 | 13,300 | 12,800 | 9,800 |
| (Share of Total Employment) | (15.9%) | (14.0%) | (11.2%) | (10.7%) | (8.2%) |
| 2018 | 2019 | 2020 | Feb to May 2020 | |||||
|---|---|---|---|---|---|---|---|---|
| Jan | Feb | Mar | Apr | May | ||||
| Employment Change (Thousands) | -1.0 | 4.6 | 0.9 | 3.3 | -1.1 | -5.4 | -6.4 | -12.9 (-10.0%) |
| Unemployment Rate (Per Cent) | 6.5 | 5.9 | 5.0 | 4.3 | 5.7 | 9.1 | 11.6 | 7.3 |
| Participation Rate (Per Cent) | 69.5 | 70.3 | 72.8 | 74.0 | 74.4 | 73.8 | 71.9 | -2.1 |
Industry Breakdown of Job Losses During the Pandemic (February to May 2020)*
*Not seasonally adjusted.
Source: Statistics Canada and FAO.
Greater Sudbury
| Key Statistics (2019) | |
| Population (Thousands) | 172 |
| Population share of Ontario | 1.2% |
| Employment (Thousands) | 85 |
| Employment share of Ontario | 1.1% |
| Median age | 42.6 |
|
|
|
|
|
|
|
| Employment | 14,200 | 12,200 | 8,000 | 7,700 | 6,900 |
| (Share of Total Employment) | (16.7%) | (14.3%) | (9.4%) | (9.0%) | (8.1%) |
| 2018 | 2019 | 2020 | Feb to May 2020 | |||||
|---|---|---|---|---|---|---|---|---|
| Jan | Feb | Mar | Apr | May | ||||
| Employment Change (Thousands) | 0.3 | 3.8 | 0.4 | 0.3 | -1.7 | -4.2 | -3.4 | -9.3 (-10.9%) |
| Unemployment Rate (Per Cent) | 6.4 | 5.4 | 5.0 | 5.3 | 5.6 | 6.8 | 8.4 | 3.1 |
| Participation Rate (Per Cent) | 61.8 | 63.9 | 63.3 | 63.8 | 62.7 | 60.3 | 58.8 | -5.0 |
Industry Breakdown of Job Losses During the Pandemic (February to May 2020)*
*Not seasonally adjusted.
Source: Statistics Canada and FAO.
Thunder Bay
| Key Statistics (2019) | |
| Population (Thousands) | 127 |
| Population share of Ontario | 0.9% |
| Employment (Thousands) | 62 |
| Employment share of Ontario | 0.8% |
| Median age | 43.5 |
|
|
|
|
|
|
|
| Employment | 12,600 | 8,700 | 5,200 | 4,700 | 4,200 |
| (Share of Total Employment) | (20.4%) | (14.1%) | (8.4%) | (7.6%) | (6.8%) |
| 2018 | 2019 | 2020 | Feb to May 2020 | |||||
|---|---|---|---|---|---|---|---|---|
| Jan | Feb | Mar | Apr | May | ||||
| Employment Change (Thousands) | 2.2 | -2.0 | -0.1 | 0.1 | -1.9 | -3.7 | -4.0 | -9.6 (-15.2%) |
| Unemployment Rate (Per Cent) | 5.1 | 5.5 | 5.1 | 5.3 | 6.1 | 8.3 | 10.4 | 5.1 |
| Participation Rate (Per Cent) | 64.0 | 62.5 | 63.4 | 63.5 | 62.3 | 59.9 | 57.1 | -6.4 |
Industry Breakdown of Job Losses During the Pandemic (February to May 2020)*
*Not seasonally adjusted.
Source: Statistics Canada and FAO.
Appendix – Labour Market Results by Region
Eastern Ontario
| Key Statistics (2019) | |
| Population (Thousands) | 1,271 |
| Population share of Ontario | 8.7% |
| Employment (Thousands) | 678 |
| Employment share of Ontario | 9.1% |
| Median age | 39.7 |
|
|
|
|
|
|
|
| Employment | 133,400 | 87,300 | 80,800 | 76,100 | 57,700 |
| (Share of Total Employment) | (19.7%) | (12.9%) | (11.9%) | (11.2%) | (8.5%) |
| 2018 | 2019 | 2020 | Feb to May 2020 | |||||
|---|---|---|---|---|---|---|---|---|
| Jan | Feb | Mar | Apr | May | ||||
| Employment Change (Thousands) | 10.0 | 33.6 | -8.7 | -9.0 | -16.6 | -24.8 | -19.5 | -60.9 (-8.9%) |
| Unemployment Rate (Per Cent) | 4.7 | 4.8 | 4.4 | 4.3 | 5.0 | 6.5 | 8.1 | 3.7 |
| Participation Rate (Per Cent) | 66.7 | 68.7 | 69.0 | 68.0 | 66.7 | 65.2 | 64.2 | -3.8 |
Industry Breakdown of Job Losses During the Pandemic (February to May 2020)*
*Not seasonally adjusted.
Source: Statistics Canada and FAO.
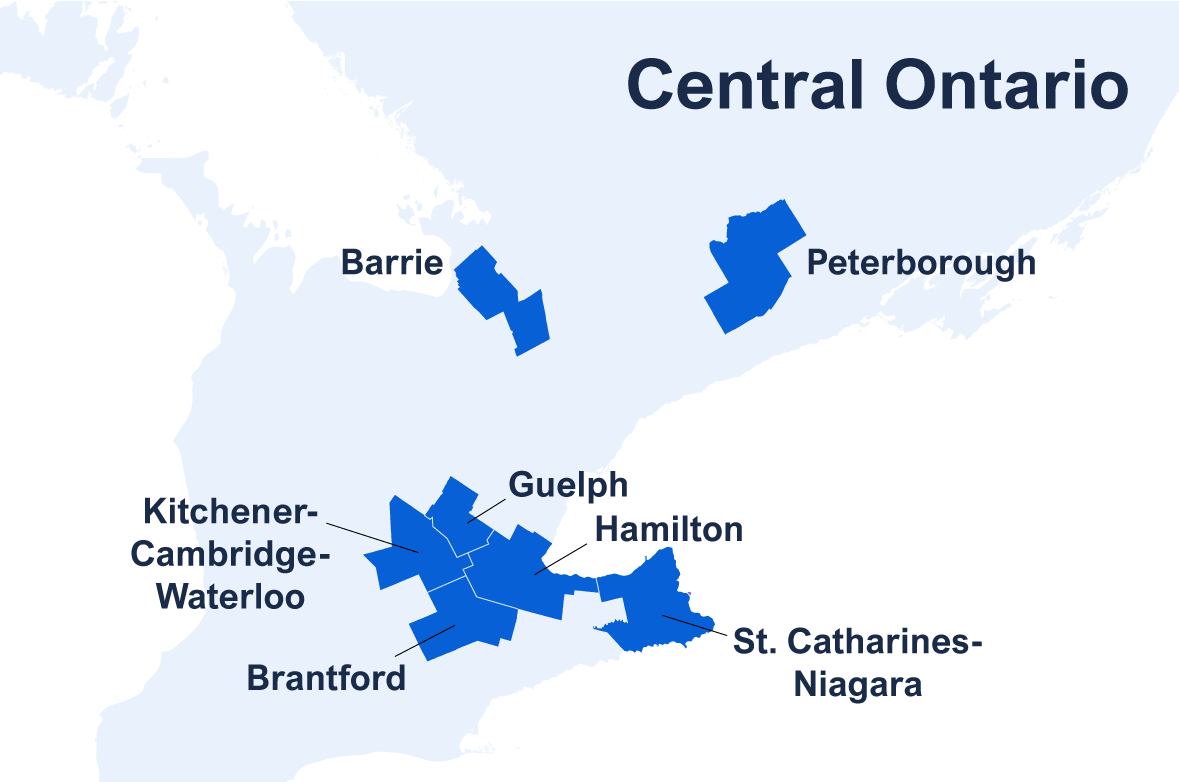
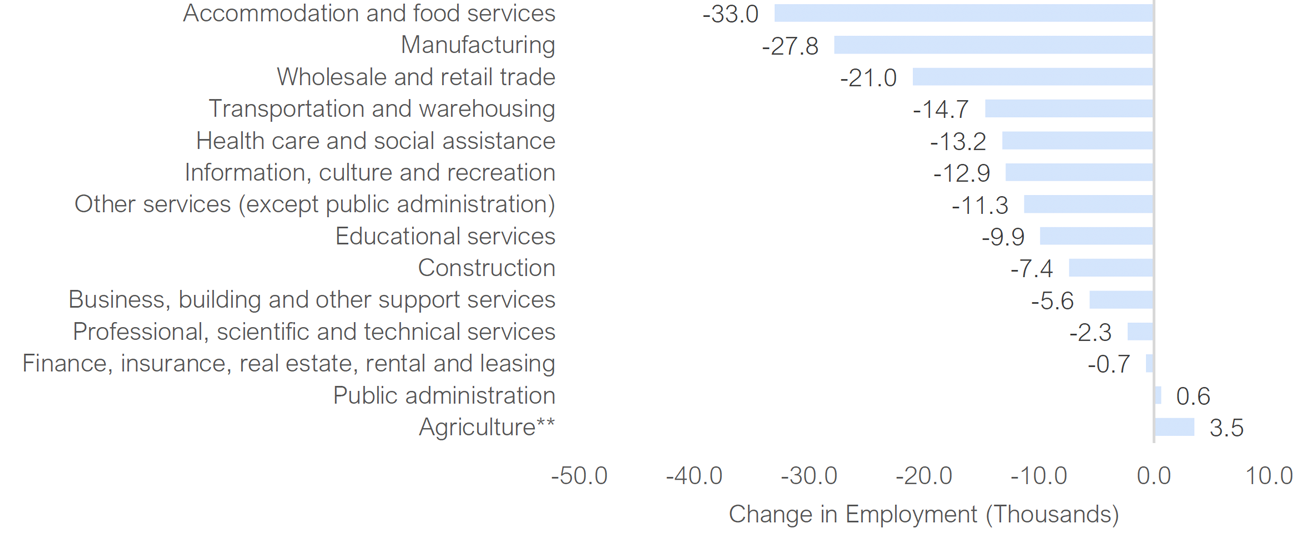
Central Ontario
| Key Statistics (2019) | |
| Population (Thousands) | 2,473 |
| Population share of Ontario | 17.0% |
| Employment (Thousands) | 1,276 |
| Employment share of Ontario | 17.1% |
| Median age | 41.0 |
|
|
|
|
|
|
|
| Employment | 197,400 | 171,000 | 159,000 | 105,600 | 101,600 |
| (Share of Total Employment) | (15.5%) | (13.4%) | (12.5%) | (8.3%) | (8.0%) |
| 2018 | 2019 | 2020 | Feb to May 2020 | |||||
|---|---|---|---|---|---|---|---|---|
| Jan | Feb | Mar | Apr | May | ||||
| Employment Change (Thousands) | 1.5 | 31.4 | -4.9 | 5.0 | -20.7 | -56.9 | -69.9 | -147.5 (-11.4%) |
| Unemployment Rate (Per Cent) | 5.4 | 5.0 | 5.1 | 5.1 | 6.1 | 8.3 | 11.0 | 5.9 |
| Participation Rate (Per Cent) | 65.9 | 66.2 | 66.1 | 66.3 | 65.9 | 64.3 | 62.4 | -3.9 |
Industry Breakdown of Job Losses During the Pandemic (February to May 2020)*
*Not seasonally adjusted.
Source: Statistics Canada and FAO.
Greater Toronto Area
| Key Statistics (2019) | |
| Population (Thousands) | 1,271 |
| Population share of Ontario | 8.7% |
| Employment (Thousands) | 678 |
| Employment share of Ontario | 9.1% |
| Median age | 39.7 |
|
|
|
|
|
|
|
| Employment | 552,200 | 440,200 | 400,100 | 396,400 | 345,400 |
| (Share of Total Employment) | (14.9%) | (11.9%) | (10.8%) | (10.7%) | (9.3%) |
| 2018 | 2019 | 2020 | Feb to May 2020 | |||||
|---|---|---|---|---|---|---|---|---|
| Jan | Feb | Mar | Apr | May | ||||
| Employment Change (Thousands) | 73.6 | 136.5 | 24.8 | 9.8 | -73.2 | -196.0 | -218.9 | -488.1 (-12.9%) |
| Unemployment Rate (Per Cent) | 6.0 | 5.9 | 5.6 | 5.5 | 6.1 | 7.9 | 11.2 | 5.7 |
| Participation Rate (Per Cent) | 66.0 | 66.7 | 66.8 | 66.8 | 65.8 | 63.4 | 61.6 | -5.2 |
Industry Breakdown of Job Losses During the Pandemic (February to May 2020)*
*Not seasonally adjusted.
Source: Statistics Canada and FAO.
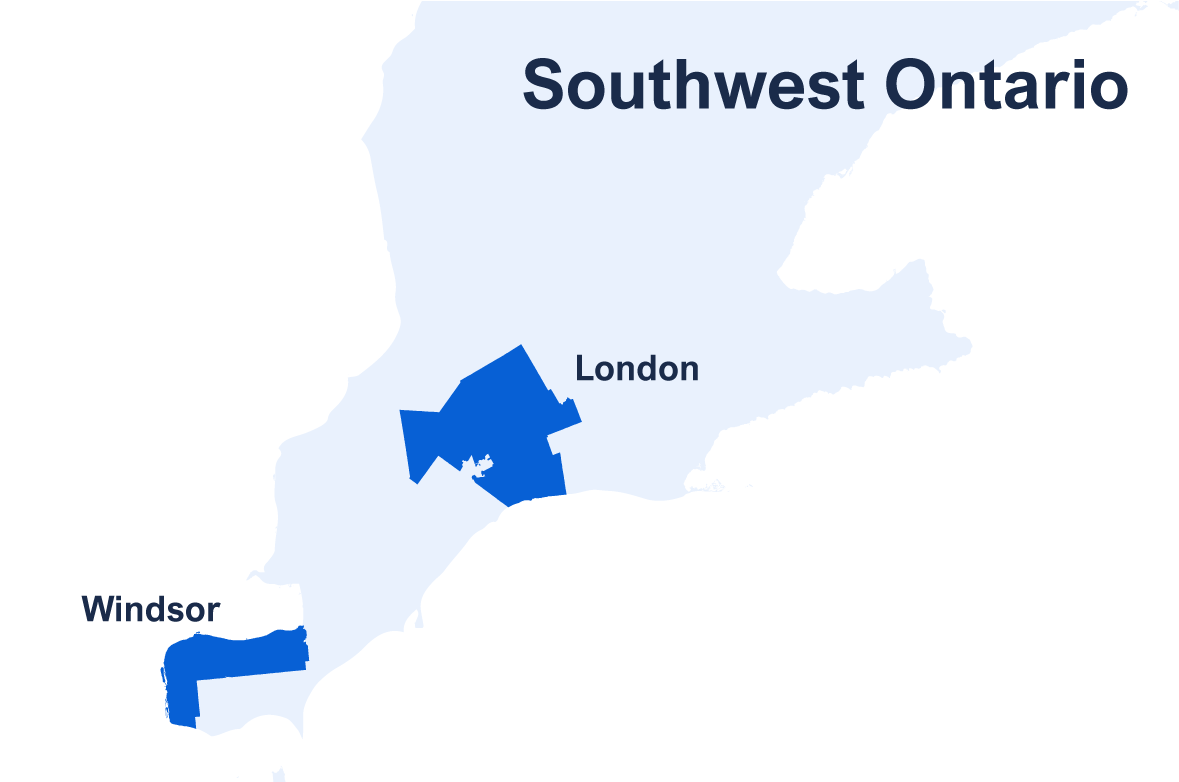
Southwest Ontario
| Key Statistics (2019) | |
| Population (Thousands) | 900 |
| Population share of Ontario | 6.2% |
| Employment (Thousands) | 422 |
| Employment share of Ontario | 5.7% |
| Median age | 40.1 |
|
|
|
|
|
|
|
| Employment | 70,300 | 59,900 | 59,600 | 32,600 | 29,100 |
| (Share of Total Employment) | (16.7%) | (14.2%) | (14.1%) | (7.7%) | (6.9%) |
| 2018 | 2019 | 2020 | Feb to May 2020 | |||||
|---|---|---|---|---|---|---|---|---|
| Jan | Feb | Mar | Apr | May | ||||
| Employment Change (Thousands) | 8.8 | 4.2 | 2.2 | 2.8 | -8.0 | -29.7 | -23.4 | -61.1 (-14.1%) |
| Unemployment Rate (Per Cent) | 5.7 | 5.9 | 6.3 | 6.3 | 7.7 | 10.4 | 13.6 | 7.4 |
| Participation Rate (Per Cent) | 60.7 | 60.3 | 61.1 | 61.4 | 61.1 | 58.6 | 57.0 | -4.4 |
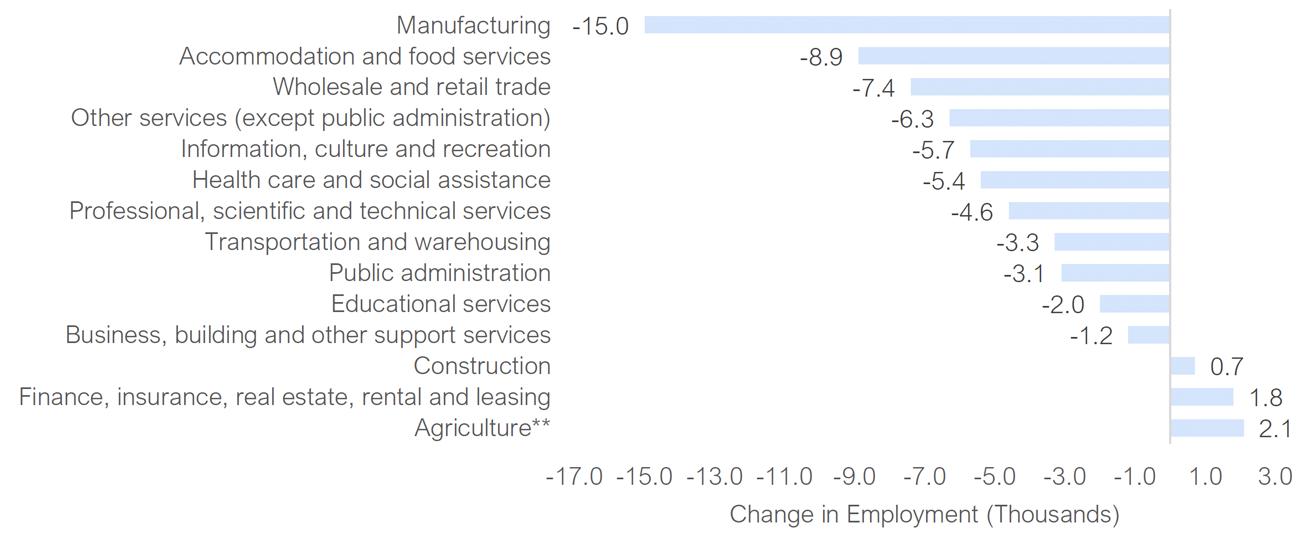
Industry Breakdown of Job Losses During the Pandemic (February to May 2020)*
*Not seasonally adjusted.
Source: Statistics Canada and FAO.
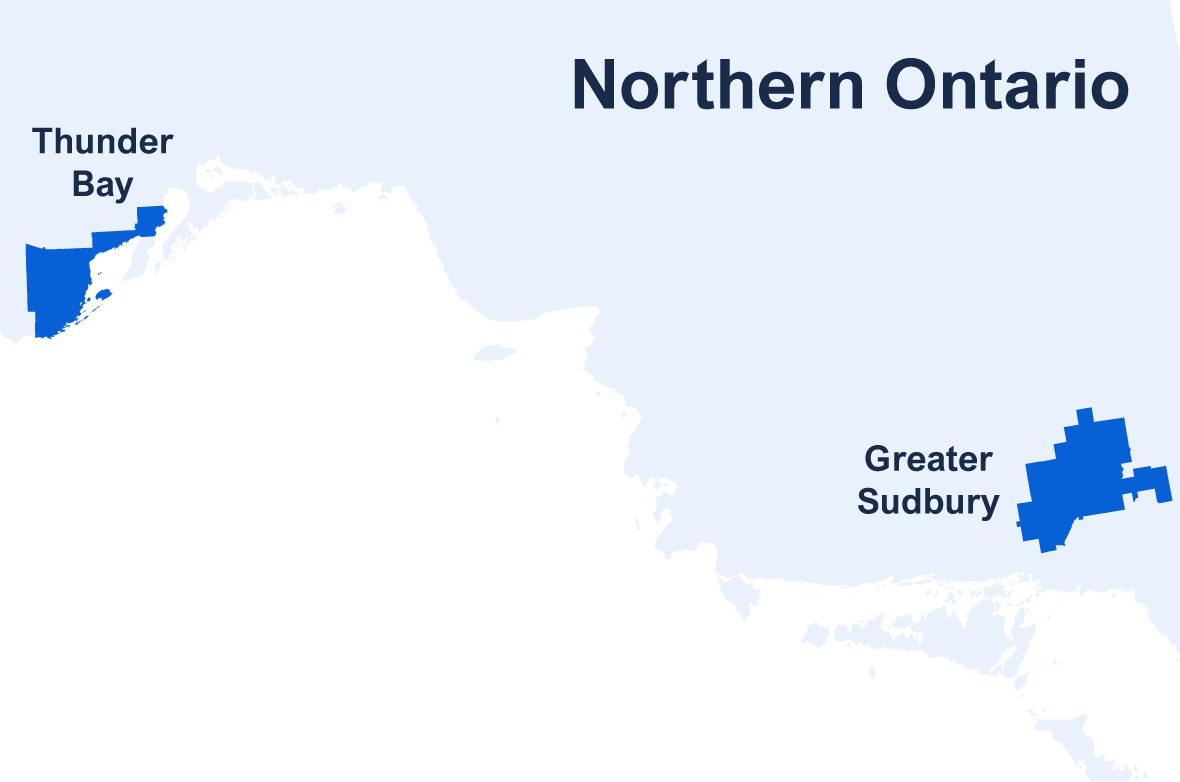
Northern Ontario
| Key Statistics (2019) | |
| Population (Thousands) | 299 |
| Population share of Ontario | 2.1% |
| Employment (Thousands) | 147 |
| Employment share of Ontario | 2.0% |
| Median age | 43.0 |
|
|
|
|
|
|
|
| Employment | 26,800 | 20,900 | 12,400 | 12,100 | 10,800 |
| (Share of Total Employment) | (18.2%) | (14.2%) | (8.4%) | (8.2%) | (7.4%) |
| 2018 | 2019 | 2020 | Feb to May 2020 | |||||
|---|---|---|---|---|---|---|---|---|
| Jan | Feb | Mar | Apr | May | ||||
| Employment Change (Thousands) | 2.5 | 1.8 | 0.3 | 0.4 | -3.6 | -7.9 | -7.4 | -18.9 (-12.7%) |
| Unemployment Rate (Per Cent) | 5.8 | 5.5 | 5.1 | 5.3 | 5.9 | 7.4 | 9.3 | 4.0 |
| Participation Rate (Per Cent) | 62.7 | 63.3 | 63.4 | 63.7 | 62.5 | 60.2 | 58.1 | -5.6 |
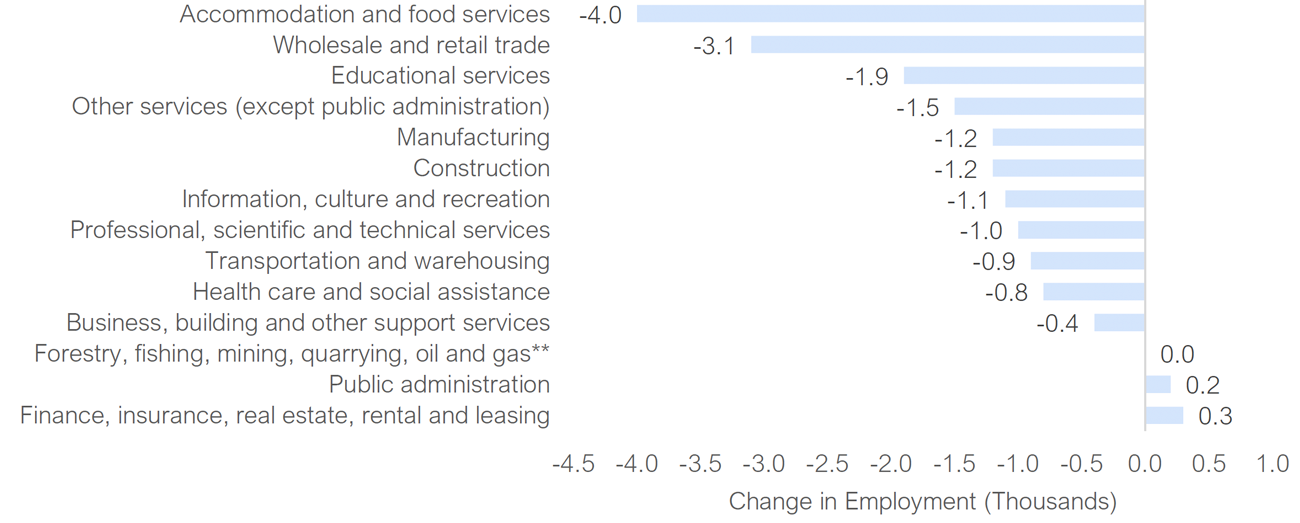
Industry Breakdown of Job Losses During the Pandemic (February to May 2020)*
*Not seasonally adjusted.
Source: Statistics Canada and FAO.
| Census Metropolitan Area | Change in Employment from February to May (Per Cent) |
|---|---|
| Windsor | -19.1 |
| St. Catharines-Niagara | -15.6 |
| Thunder Bay | -15.2 |
| Peterborough | -13.8 |
| Toronto | -13.3 |
| Kitchener-Cambridge-Waterloo | -12.8 |
| Ontario | -11.7 |
| Kingston | -11.2 |
| London | -11.0 |
| Greater Sudbury | -10.9 |
| Hamilton | -10.7 |
| Barrie | -10.0 |
| Ottawa-Gatineau, Ontario part | -8.6 |
| Brantford | -7.4 |
| Oshawa | -7.2 |
| Guelph | -4.9 |
| Census Metropolitan Area, Unemployment Rate (Per Cent) | Feb-20 | May-20 |
|---|---|---|
| Windsor | 8.3 | 16.7 |
| Guelph | 5.1 | 12.9 |
| St. Catharines-Niagara | 5.5 | 12.6 |
| London | 4.9 | 11.7 |
| Barrie | 4.3 | 11.6 |
| Brantford | 4.7 | 11.3 |
| Toronto | 5.4 | 11.2 |
| Kingston | 5.2 | 10.8 |
| Ontario | 5.3 | 10.8 |
| Thunder Bay | 5.3 | 10.4 |
| Hamilton | 4.9 | 10.3 |
| Kitchener-Cambridge-Waterloo | 5.5 | 10.3 |
| Oshawa | 7.0 | 10.1 |
| Peterborough | 6.6 | 9.5 |
| Greater Sudbury | 5.3 | 8.4 |
| Ottawa-Gatineau, Ontario part | 4.2 | 7.7 |
The infographic shows the rate of job loss between February and May 2020 in the Census Metropolitan Areas (CMAs) of Ontario. The rate of job loss ranged from -19 per cent to -5 per cent across different CMAs. The job losses were the sharpest in Windsor and the smallest in Guelph.
| Monthly Employment Loss | Thousands |
|---|---|
| March-20 | -402.8 |
| April-20 | -689.2 |
| May-20 | -64.5 |
| Change in Employment (Thousands) | March and April 2020 | May 2020 |
|---|---|---|
| Forestry, fishing, mining, quarrying, oil and gas | -2.6 | 2.3 |
| Utilities | -5.3 | -0.2 |
| Agriculture | -5.8 | -3.7 |
| Finance, insurance, real estate, rental and leasing | -9.0 | 5.8 |
| Public administration | -13.0 | 4.6 |
| Business, building and other support services | -23.0 | -33.2 |
| Professional, scientific and technical services | -29.4 | -20.2 |
| Transportation and warehousing | -49.8 | -6.6 |
| Other services (except public administration) | -56.4 | -1.1 |
| Educational services | -61.4 | -16.9 |
| Information, culture and recreation | -63.9 | -12.6 |
| Health care and social assistance | -94.3 | -13.7 |
| Construction | -98.7 | 3.1 |
| Manufacturing | -132.5 | 13.7 |
| Accommodation and food services | -215.8 | 10.2 |
| Wholesale and retail trade | -230.9 | 3.8 |
| Province | Unemployment Rate (Per Cent) February to May |
|
|---|---|---|
| Earlier Reopening | New Brunswick | -9.1 |
| Prince Edward Island | -10.8 | |
| Newfoundland and Labrador | -11.2 | |
| Manitoba | -11.5 | |
| Saskatchewan | -12.6 | |
| Quebec | -13.4 | |
| British Columbia | -13.9 | |
| Canada | -14.1 | |
| Later Reopening | Nova Scotia | -14.2 |
| Alberta | -14.3 | |
| Ontario | -15.3 |
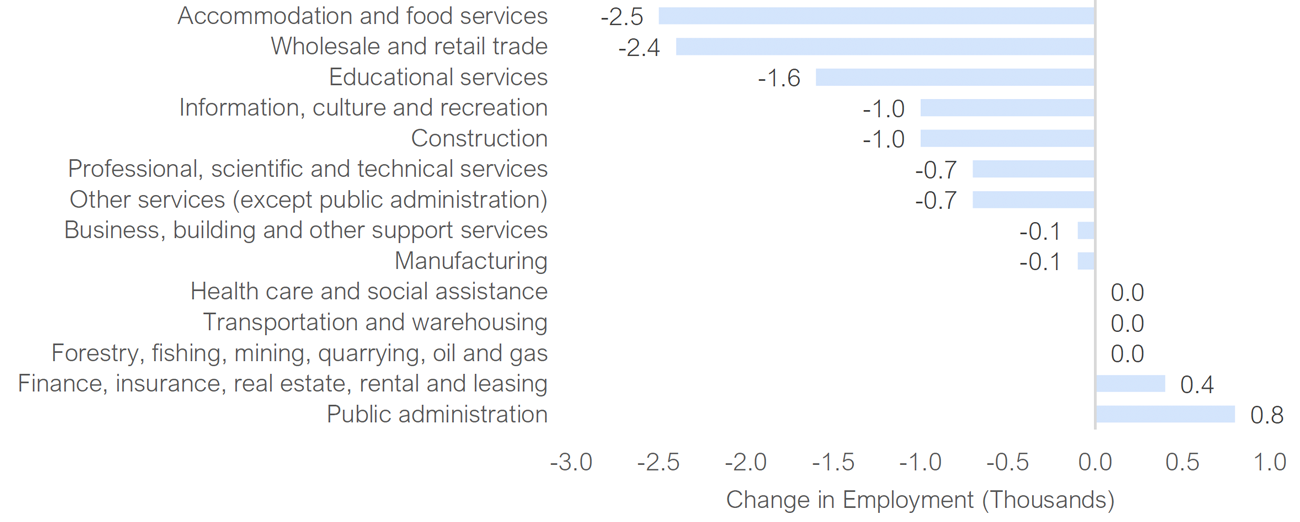
This appendix shows the key demographic and employment statistics (2019), top five industries by employment (2019), Key Labour market indicators from 2018 to 2020, and the industry breakdown of job losses during the pandemic (February to May 2020) in Ottawa-Gatineau, Ontario Part.
This appendix shows the key demographic and employment statistics (2019), top five industries by employment (2019), Key Labour market indicators from 2018 to 2020, and the industry breakdown of job losses during the pandemic (February to May 2020) in Kingston.
This appendix shows the key demographic and employment statistics (2019), top five industries by employment (2019), Key Labour market indicators from 2018 to 2020, and the industry breakdown of job losses during the pandemic (February to May 2020) in Peterborough.
This appendix shows the key demographic and employment statistics (2019), top five industries by employment (2019), Key Labour market indicators from 2018 to 2020, and the industry breakdown of job losses during the pandemic (February to May 2020) in Oshawa.
This appendix shows the key demographic and employment statistics (2019), top five industries by employment (2019), Key Labour market indicators from 2018 to 2020, and the industry breakdown of job losses during the pandemic (February to May 2020) in Toronto.
This appendix shows the key demographic and employment statistics (2019), top five industries by employment (2019), Key Labour market indicators from 2018 to 2020, and the industry breakdown of job losses during the pandemic (February to May 2020) in Hamilton.
This appendix shows the key demographic and employment statistics (2019), top five industries by employment (2019), Key Labour market indicators from 2018 to 2020, and the industry breakdown of job losses during the pandemic (February to May 2020) in St. Catharines-Niagara.
This appendix shows the key demographic and employment statistics (2019), top five industries by employment (2019), Key Labour market indicators from 2018 to 2020, and the industry breakdown of job losses during the pandemic (February to May 2020) in Kitchener-Cambridge-Waterloo.
This appendix shows the key demographic and employment statistics (2019), top five industries by employment (2019), Key Labour market indicators from 2018 to 2020, and the industry breakdown of job losses during the pandemic (February to May 2020) in Brantford.
This appendix shows the key demographic and employment statistics (2019), top five industries by employment (2019), Key Labour market indicators from 2018 to 2020, and the industry breakdown of job losses during the pandemic (February to May 2020) in Guelph.
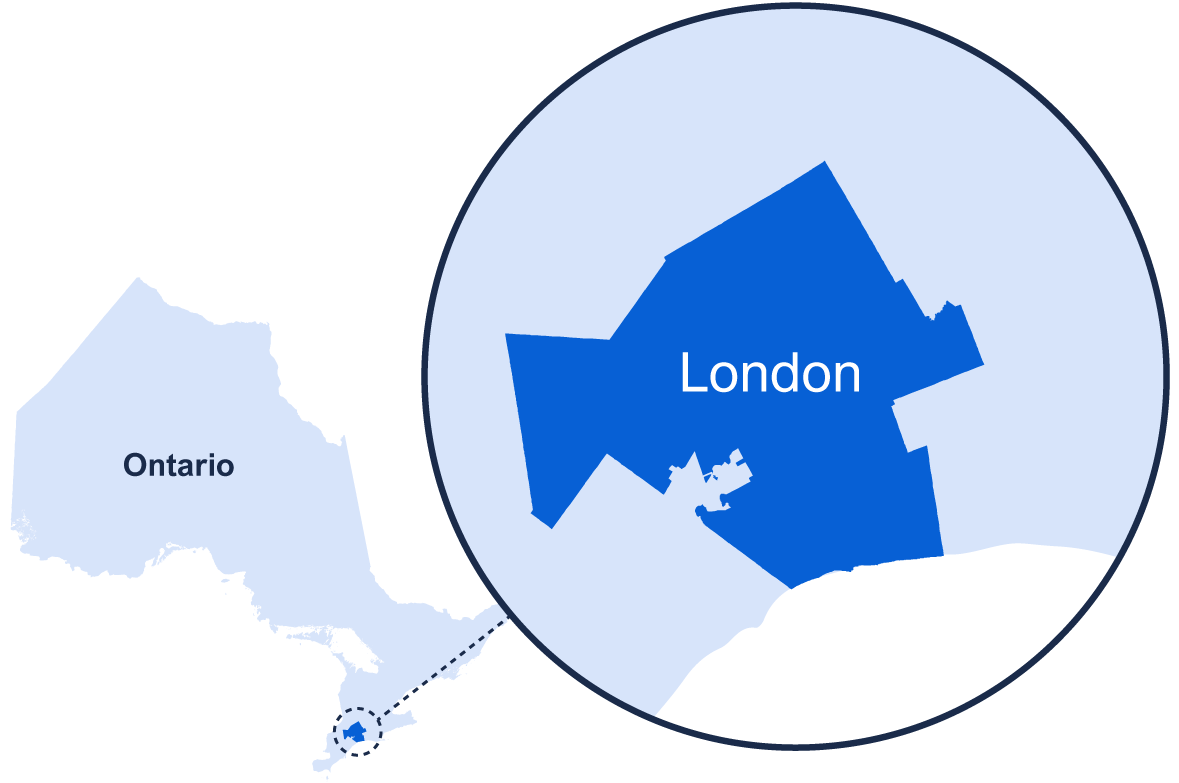
This appendix shows the key demographic and employment statistics (2019), top five industries by employment (2019), Key Labour market indicators from 2018 to 2020, and the industry breakdown of job losses during the pandemic (February to May 2020) in London.
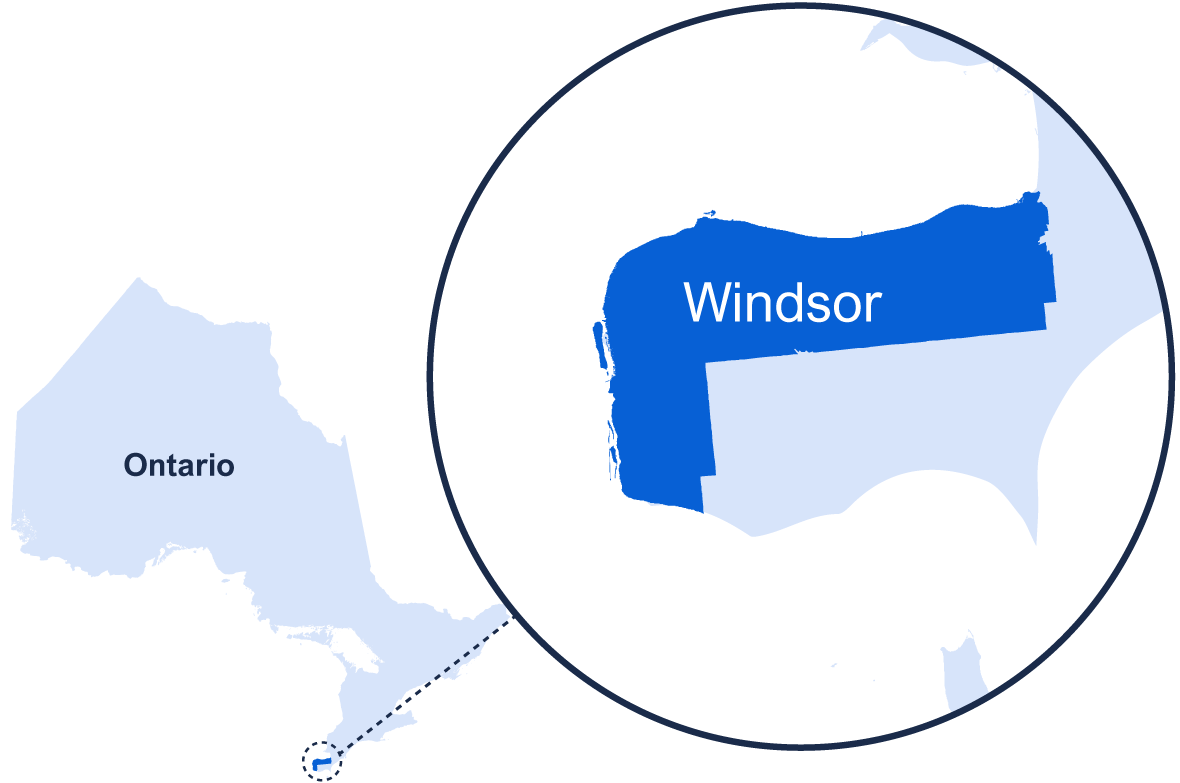
This appendix shows the key demographic and employment statistics (2019), top five industries by employment (2019), Key Labour market indicators from 2018 to 2020, and the industry breakdown of job losses during the pandemic (February to May 2020) in Windsor.
This appendix shows the key demographic and employment statistics (2019), top five industries by employment (2019), Key Labour market indicators from 2018 to 2020, and the industry breakdown of job losses during the pandemic (February to May 2020) in Barrie.
This appendix shows the key demographic and employment statistics (2019), top five industries by employment (2019), Key Labour market indicators from 2018 to 2020, and the industry breakdown of job losses during the pandemic (February to May 2020) in Greater Sudbury.
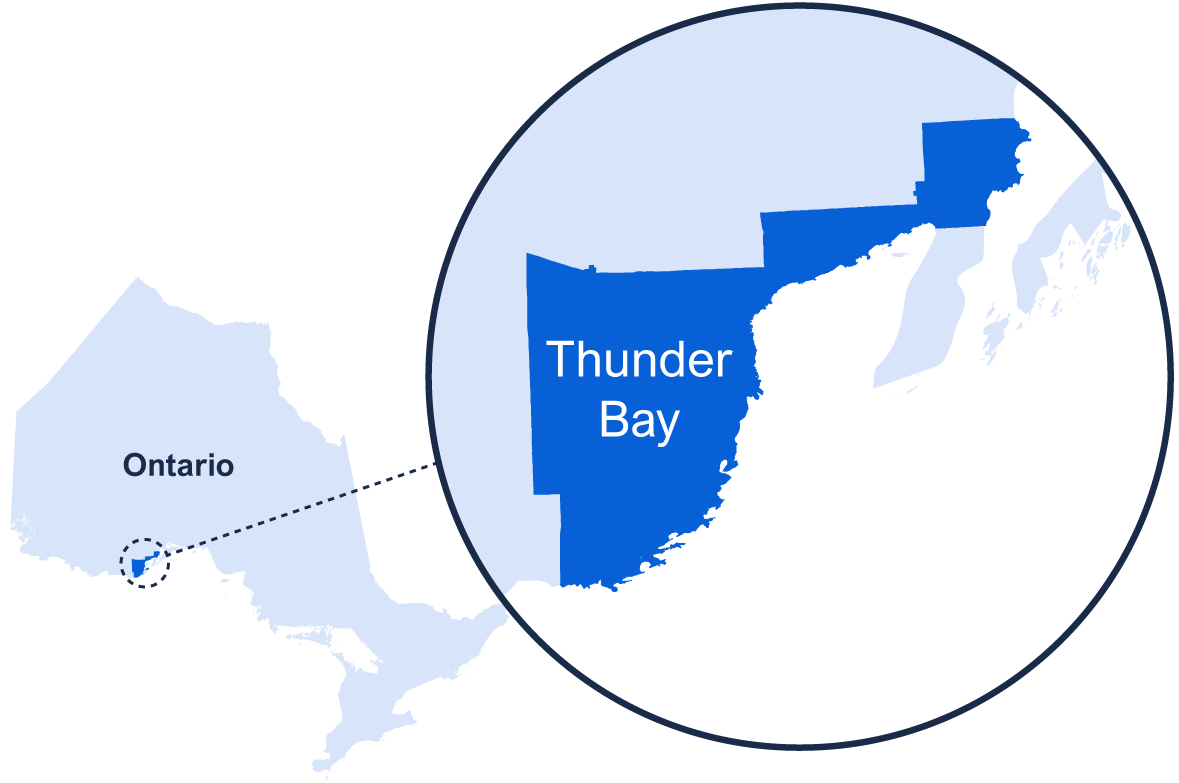
This appendix shows the key demographic and employment statistics (2019), top five industries by employment (2019), Key Labour market indicators from 2018 to 2020, and the industry breakdown of job losses during the pandemic (February to May 2020) in Thunder Bay.
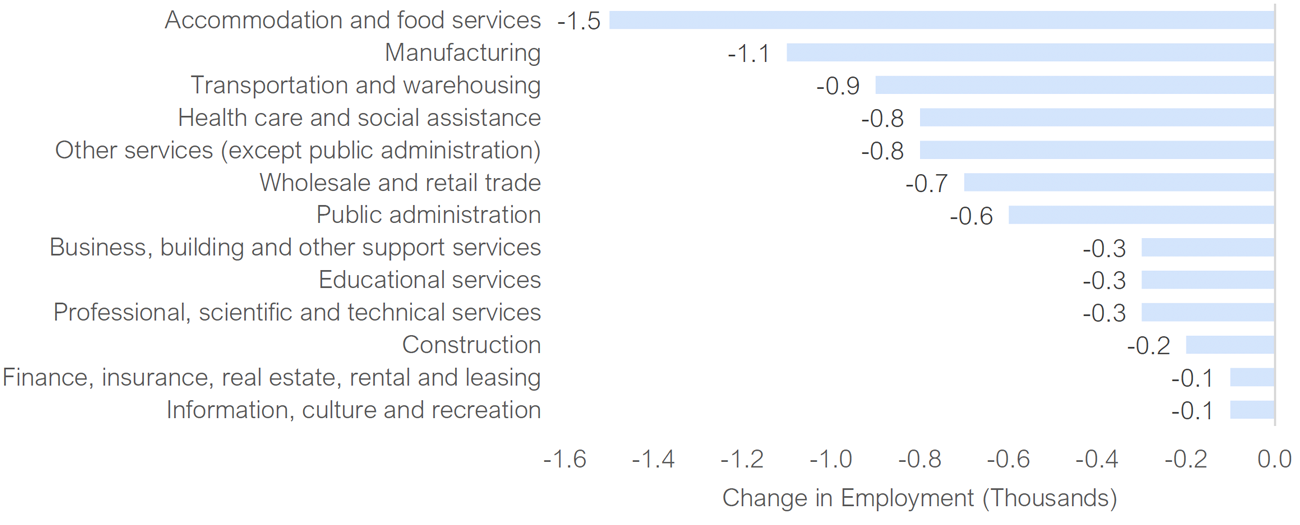
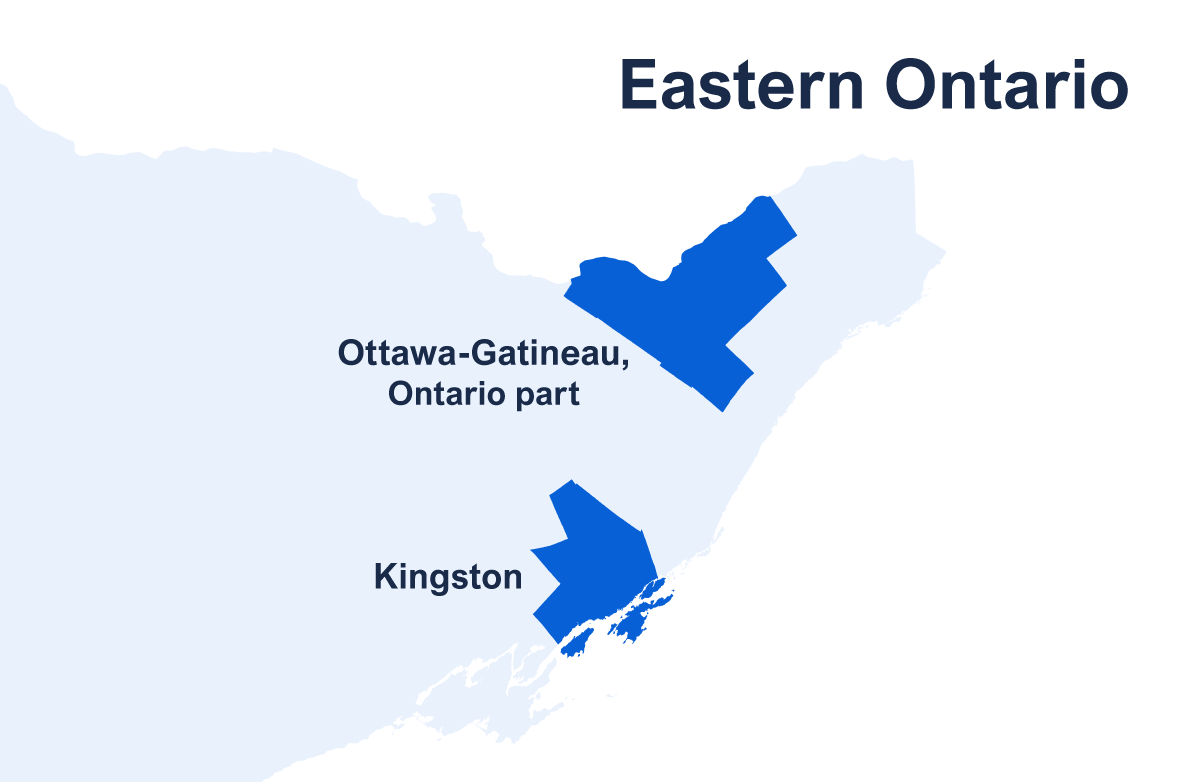
This appendix shows the key demographic and employment statistics (2019), top five industries by employment (2019), Key Labour market indicators from 2018 to 2020, and the industry breakdown of job losses during the pandemic (February to May 2020) in Eastern Ontario (Ottawa-Gatineau and Kingston).
This appendix shows the key demographic and employment statistics (2019), top five industries by employment (2019), Key Labour market indicators from 2018 to 2020, and the industry breakdown of job losses during the pandemic (February to May 2020) in Central Ontario (Peterborough, St. Catharines-Niagara, Hamilton, Guelph, Barrie, Kitchener-Cambridge-Waterloo, and Brantford).
This appendix shows the key demographic and employment statistics (2019), top five industries by employment (2019), Key Labour market indicators from 2018 to 2020, and the industry breakdown of job losses during the pandemic (February to May 2020) in Greater Toronto Area (Toronto and Oshawa).
This appendix shows the key demographic and employment statistics (2019), top five industries by employment (2019), Key Labour market indicators from 2018 to 2020, and the industry breakdown of job losses during the pandemic (February to May 2020) in Southwest Ontario (London and Windsor).
This appendix shows the key demographic and employment statistics (2019), top five industries by employment (2019), Key Labour market indicators from 2018 to 2020, and the industry breakdown of job losses during the pandemic (February to May 2020) in Northern Ontario (Thunder Bay and Greater Sudbury).
Footnotes
[1] Ontario cities included in this report are based on Statistics Canada’s Census Metropolitan Areas (CMAs). Statistics Canada defines a CMA as a large population centre together with adjacent fringe and rural areas that have a high degree of social and economic integration with the centres. A CMA must have a population of at least 100,000. Statistics Canada publishes the main labour force statistics of CMAs as three-month moving averages to reduce irregular movements caused by relatively small sample sizes. This means that CMA data for May is the average of March, April, and May. The labour force data published in May provides a fuller indication of the initial impact of the COVID-19 shutdowns on the CMAs in Ontario during the March to May 2020 period. The Ontario data in the section on regional labour markets are also on a three-month moving average basis and differ from the results presented in other sections of this report. It is important to note that CMA employment data is based on where employees live and not the location of their workplace.
[2] All the data used in this report are based on Statistics Canada’s Labour Force Survey (LFS). The monthly LFS is based on a sample of about 15,000 Ontario households who report on their employment status, hours worked, and wages. The survey provides broad coverage of labour market information, including industry, demographic and regional data. The monthly data used in this report are seasonally adjusted, unless otherwise noted. Statistics Canada’s current Labour Force Survey was introduced in 1976.
[3] For details on the regional approach of reopening in Ontario, see A Framework for Reopening our Province: Stage 2.
[4] Peterborough, Thunder Bay, and St. Catharines-Niagara, three of the most affected labour markets during the pandemic, also saw a decline in employment in 2019, even as the province recorded largest annual job gain on record. For details, see the FAO’s Labour Market Report 2019.
[5] From February to May 2020, employment among young workers (aged 15 to 24 years) declined by 35.4 per cent, compared to a 12.2 per cent decrease for older workers (aged 25 years and over).
[6] The Ontario government allowed a gradual reopening in several industries including the construction sector and retail stores with a street entrance to offer curbside pickup and delivery in early May, which were likely reflected in the May Labour Force Survey (LFS). For details, see Reopening Ontario: what’s in each stage.