


COVID‑19 Pandemic Causes Record Job Loss
Summary
- The COVID‑19 pandemic shutdowns caused an unparalleled disruption in Ontario’s labour market, with the province’s employment declining by 355,300 jobs (or ‑4.8 per cent) in 2020, marking the largest annual loss of employment on record.[1]
- The province’s annual unemployment rate jumped to 9.6 per cent in 2020, the highest since 1993.
- In addition to the job losses, an increasing number of Ontarians worked far fewer hours for reasons likely due to the pandemic, bringing the total number of employees affected to 765,340 – representing about one in 10 jobs.
- Female workers experienced larger job losses compared to male workers across all the major age groups. Young workers (ages 15‑24) were hit hard by the pandemic, with employment declining at nearly five times the pace of job loss for workers aged 25 and over.
- The service sector experienced sharp declines in employment, with the largest job losses concentrated in industries that require close customer contact, had more extensive restrictions, or limited ability to work from home.
- Employment declined sharply across most of the major cities of Ontario. Peterborough and Windsor experienced the steepest employment losses. In contrast, Barrie and London posted small gains in annual employment.
- The pandemic intensified the challenges faced by vulnerable groups, including immigrants, mothers with young children, and workers in low‑wage jobs. The disruptions triggered by the pandemic could cause lasting structural changes and result in an uneven job recovery.
This report is focused on annual labour market trends, measuring changes for the average of the 12 months in 2020 compared to the average of the 12 months in 2019. When the report discusses Ontario’s job recovery, it uses seasonally adjusted monthly employment data and looks at changes only within 2020, without a comparison to the previous year.
Largest annual job loss on record driven by the pandemic
The COVID‑19 pandemic caused an unparalleled disruption in Ontario’s labour market in 2020. According to Statistics Canada’s Labour Force Survey, the province lost 355,300 jobs in 2020 (a 4.8 per cent decline), the largest annual loss of employment on record.[2] The annual unemployment rate jumped to 9.6 per cent in 2020, the highest since 1993 but lower than observed in most previous recessions. The rise in the unemployment rate in 2020 was tempered by a surge in individuals who left the labour force and as a result were not counted as unemployed. Due to these exits, the province’s labour force participation rate dropped to 63.6 per cent, down sharply from 64.9 per cent in 2019 and the lowest rate on record.
Figure 1 Ontario records largest annual job loss in 2020
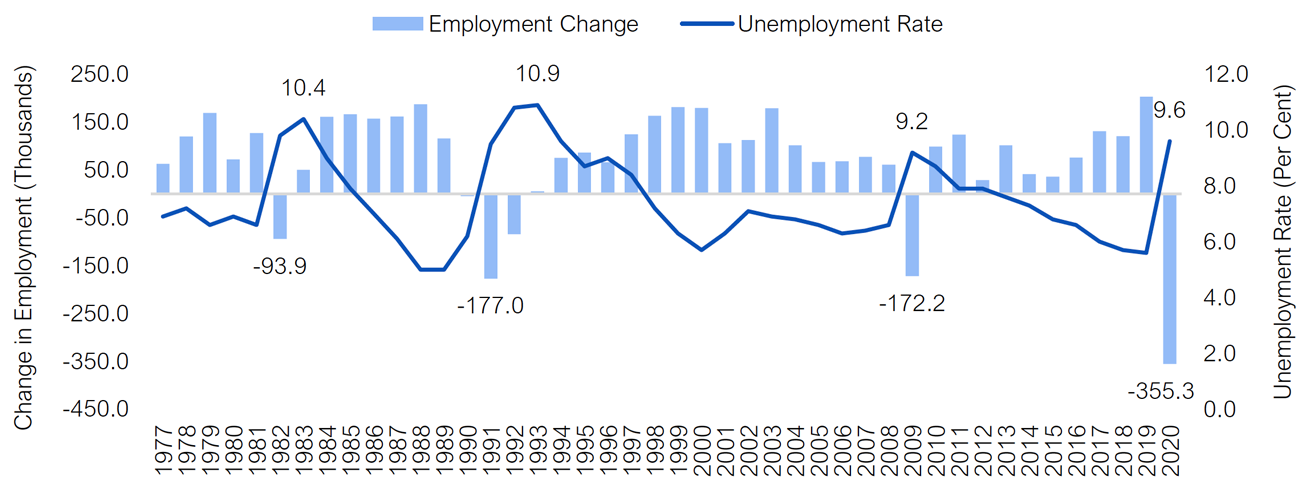
Source: Statistics Canada and FAO.
The decline in employment in 2020 was broadly based and affected workers in all age groups, industries and major cities across the province. While this report focuses on average annual data, employment fluctuated dramatically over the course of the year, declining sharply in the spring during the initial pandemic lockdowns, followed by a rapid increase over the summer as the economy reopened.
On an average annual basis, a large majority of job losses were concentrated in the private sector (‑288,600 or ‑6.0 per cent), driven by the accommodation and food services, and wholesale and retail trade industries. Self‑employed (‑50,100 or ‑4.3 per cent) individuals also experienced record job losses, led by declines in construction, and transportation and warehousing industries. Public sector workers lost 16,600 jobs (or -1.2 per cent), with losses concentrated in educational services, and information, culture and recreation industries.
Female workers (‑202,600 or ‑5.8 per cent) experienced larger job losses compared to male workers (‑152,600 or ‑3.9 per cent), with declines across all major age groups. While female workers recorded similar employment declines compared to male workers in some of the hardest hit industries, they experienced far larger job losses in information, culture and recreation, and real estate, rental and leasing. The pandemic also created additional labour market attachment challenges for mothers with young children.
Young workers (ages 15‑24) were deeply affected by the pandemic, with employment declining at five times the pace of job loss for workers aged 25 and over. The job losses among young workers were concentrated in the accommodation and food services, and information, culture and recreation industries. Part‑time workers (‑152,300 or ‑11.1 per cent) lost jobs at a much faster pace compared to full‑time workers (‑202,900 or ‑3.4 per cent), a trend that was prevalent across all age groups.
The job loss figures provide only a partial picture of the dramatic labour market disruptions caused by the COVID‑19 pandemic in 2020. The pandemic severely impacted the total hours worked across all jobs by Ontarians, which declined by a record 9.0 per cent. In addition to the 355,300 annual job losses, 342,690 more Ontarians had essentially no hours worked, while a further 67,350 employees worked less than half their usual hours for reasons likely due to COVID‑19. Combined, the total number of employees impacted by the pandemic was 765,340 in 2020. During the height of the initial lockdowns, the number of workers affected by the pandemic reached 2.1 million in May, declining rapidly as lockdown restrictions were eased through the summer.
Ontario’s labour underutilization rate reached an unprecedented 22.1 per cent in 2020, meaning one in five workers were either unemployed, did not look for a job although they wanted one, or worked fewer hours than they desired.
Labour market outcome by demographic groups
Core‑age employment contracted at record pace
Ontario’s core‑age (25‑54) employment declined by 175,200 (or ‑3.7 per cent) in 2020, the largest drop on record. With jobs declining at a steep pace, the unemployment rate among core‑age workers rose from 4.6 per cent in 2019 to 7.7 per cent, the highest since 2009. The unemployment rate would have been higher if not for a record number of individuals who dropped out of the labour force and were not classified as unemployed. Annual employment losses were larger among core‑age females (‑104,900 or ‑4.6 per cent) compared to males (‑70,200 or ‑2.8 per cent).
Figure 2 Record decline in Ontario’s core‑age employment
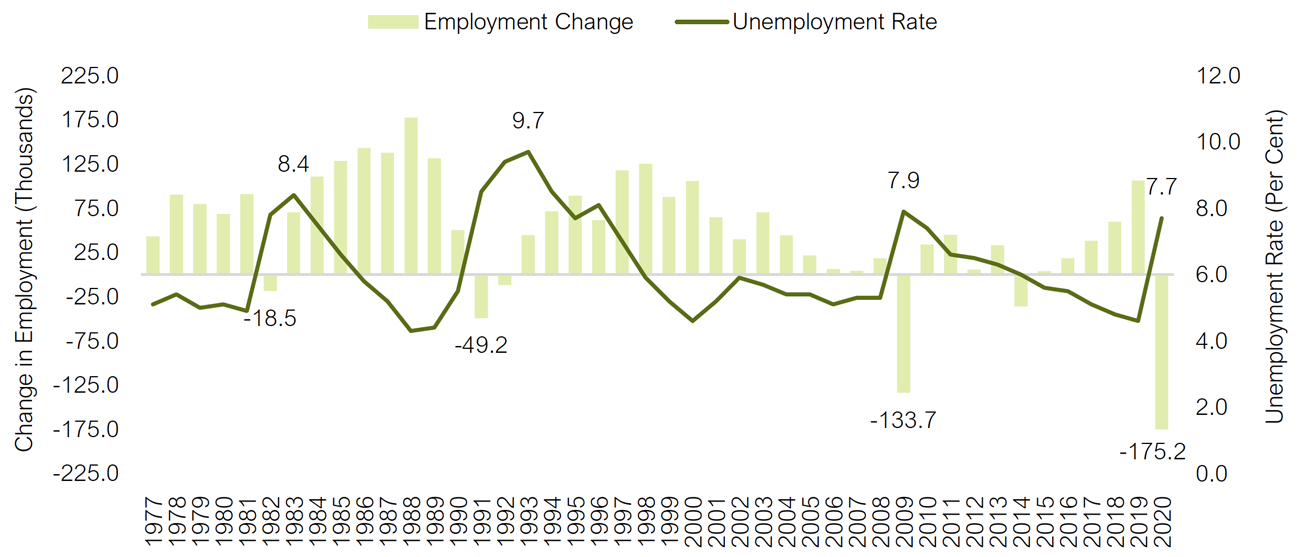
Source: Statistics Canada and FAO.
Part‑time workers, who represent about one‑tenth of core‑age employment, lost jobs at nearly twice the pace (‑6.0 per cent) of full‑time workers (‑3.4 per cent). However, by December, part‑time workers, driven by core‑age males, had fully recovered the jobs lost during the spring lockdown. In contrast, employment among full‑time core‑age workers remained 3.2 per cent below their February level of employment.[3] Annual core‑age employment declined in both the service sector (‑132,200 or ‑3.5 per cent) and the goods sector (‑42,900 or ‑4.4 per cent). Nearly 70 per cent of the job losses were concentrated in accommodation and food services, transportation and warehousing, other services, and health care and social assistance.
Figure 3 Core‑age immigrants faced sharp increase in unemployment rate
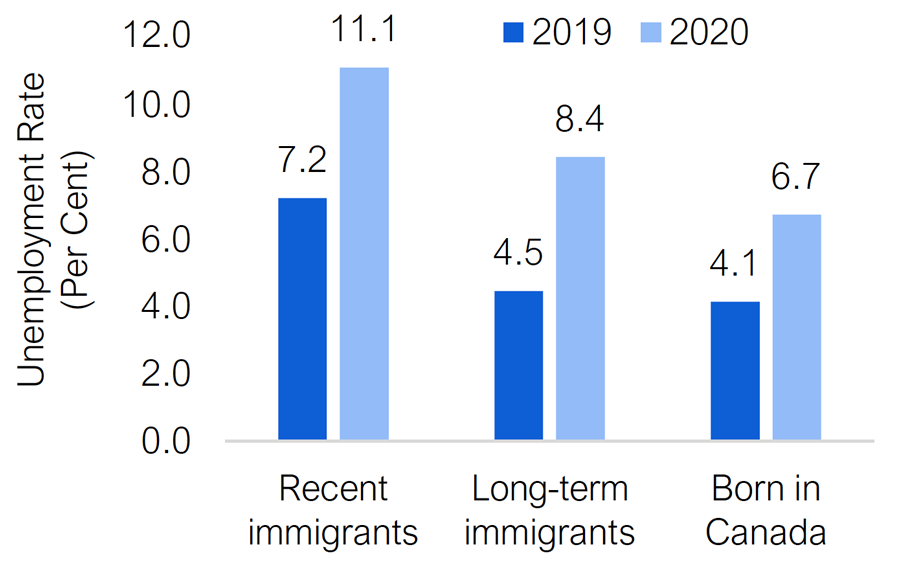
Source: Statistics Canada and FAO.
The pandemic had a significant impact on the labour market outcomes of immigrants. Employment among core‑age immigrants,[4] who represent more than one‑third of total employment in this age group, declined by 6.6 per cent, nearly three times the rate of job loss among those born in Canada (‑2.3 per cent). The unemployment rate increased more sharply for both recent immigrants (11.1 per cent) and long‑term immigrants (8.4 per cent), compared to those born in Canada (6.7 per cent).
Youth employment reached lowest level in two decades
The pandemic‑related shutdowns had a pronounced impact on the province’s youngest workers (ages 15‑24 years), who tend to have less labour market experience and be employed in less stable jobs. Ontario’s youth employment declined by 156,900 (or ‑15.5 per cent) in 2020, representing more than four in 10 jobs lost in the province, and bringing youth employment to a level not seen since 1999. With the sharp job loss, the youth unemployment rate reached 22.0 per cent, the highest on record. The very high youth unemployment rate could have negative long‑term impacts on the earnings, job quality and career trajectory of young individuals.[5]
Figure 4 Youth unemployment rate reached highest on record
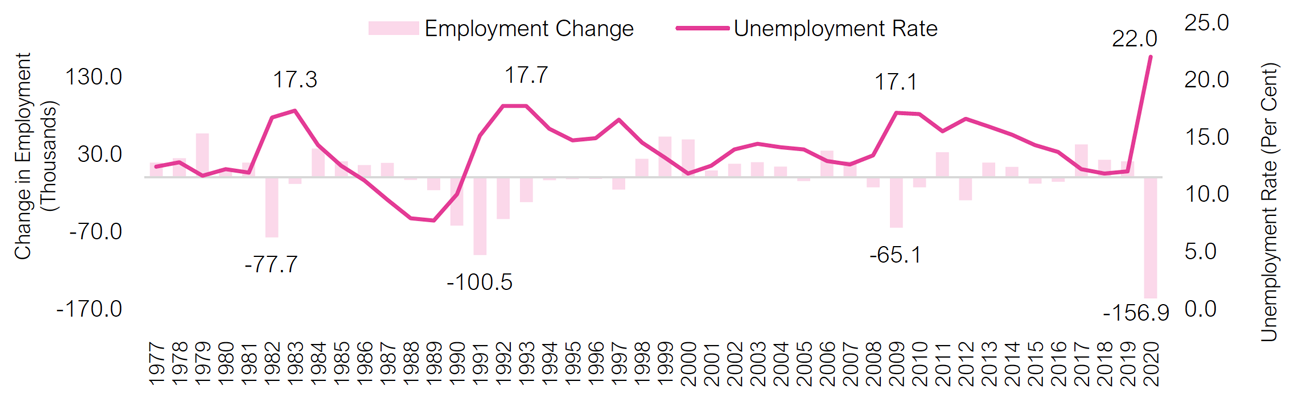
Source: Statistics Canada and FAO.
Youth employed part-time were more affected, accounting for nearly two‑thirds of the total job loss in this age group. Total employment among young females declined at a faster pace (‑16.9 per cent) compared to their male counterparts (‑14.1 per cent) and has also experienced a slower recovery throughout the year. By December, employment of young males was 2.2 per cent below the February level, while for young females it was 13.2 per cent lower.
Nearly three‑quarters of all the job losses among young Ontarians were concentrated in industries most affected by the pandemic‑related shut downs, including accommodation and food services (‑57,000 or ‑29.9 per cent), information, culture and recreation (‑33,200 or ‑43.3 per cent), and retail trade (‑23,300 or ‑9.3 per cent).
Older workers experienced relatively modest job losses compared to other age groups
Employment among Ontarians aged 55 years and over declined by 23,300 (or ‑1.4 per cent) in 2020, a smaller job loss compared to other major age groups, which may reflect their relatively longer job tenure. Nonetheless, the unemployment rate of older workers increased from 4.2 per cent in 2019 to 7.0 per cent in 2020, the highest since 1994.
Older part‑time workers (‑5.0 per cent), who represent more than one‑fifth of employment in this age group, lost jobs at a significantly faster pace compared to full‑time workers (‑0.5 per cent). Similar to other age groups, older females saw a faster pace of employment loss (‑2.0 per cent) compared to their male counterparts (‑1.0 per cent).
Nearly all industries experienced sharp job losses in 2020
The wide‑ranging pandemic‑related shutdowns in the spring and targeted restrictions late in the year caused job losses across most industries in Ontario. Unlike all previous recessions, the services‑producing sector (‑298,800 or ‑5.1 per cent) experienced sharper job losses in 2020 compared to the decline in the goods‑producing sector (‑56,600 or ‑3.9 per cent).
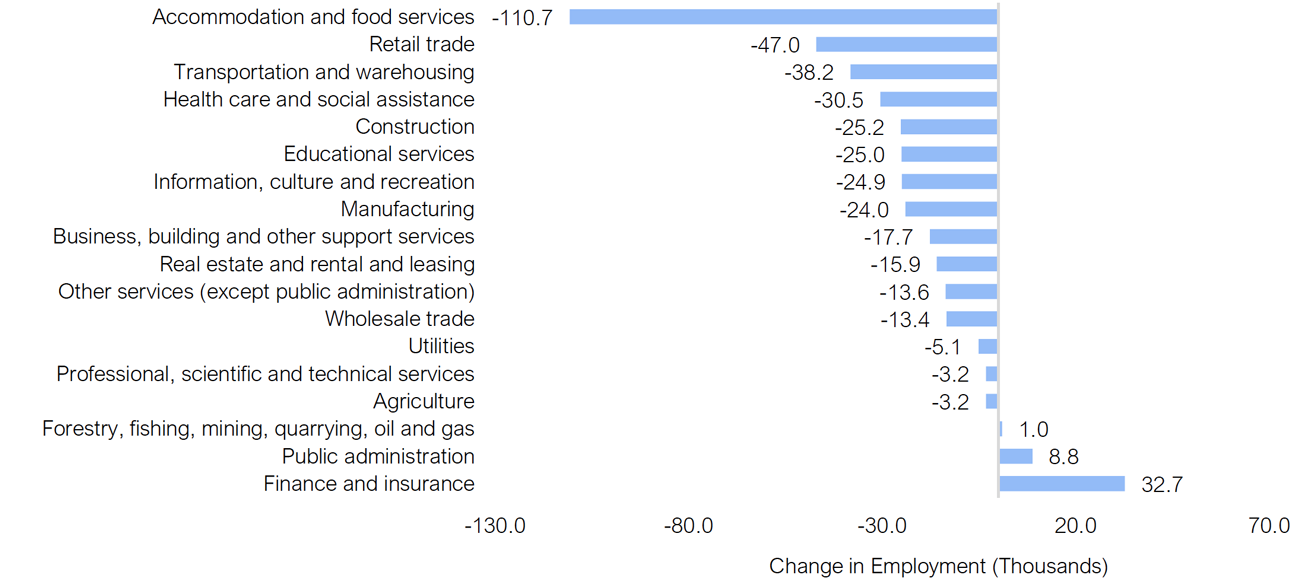
Figure 5 Nearly all industries saw sharp contraction in annual employment
Source: Statistics Canada and FAO.
In the service sector, the largest job losses were concentrated in industries with close customer contact, more extensive restrictions, and limited capacity to work from home. This included job losses in accommodation and food services (‑110,700 or ‑24.7 per cent), retail trade (‑47,000 or ‑5.6 per cent), and transportation and warehousing (‑38,200 or ‑9.7 per cent). In contrast, employment grew in some sectors where many jobs can be performed remotely, such as finance and insurance (32,700 or 7.7 per cent) and public administration (8,800 or 2.4 per cent).[6] Almost all the goods‑producing industries saw fewer jobs in 2020, with the majority of losses in construction (‑25,200 or ‑4.7 per cent) and manufacturing (‑24,000 or ‑3.2 per cent).
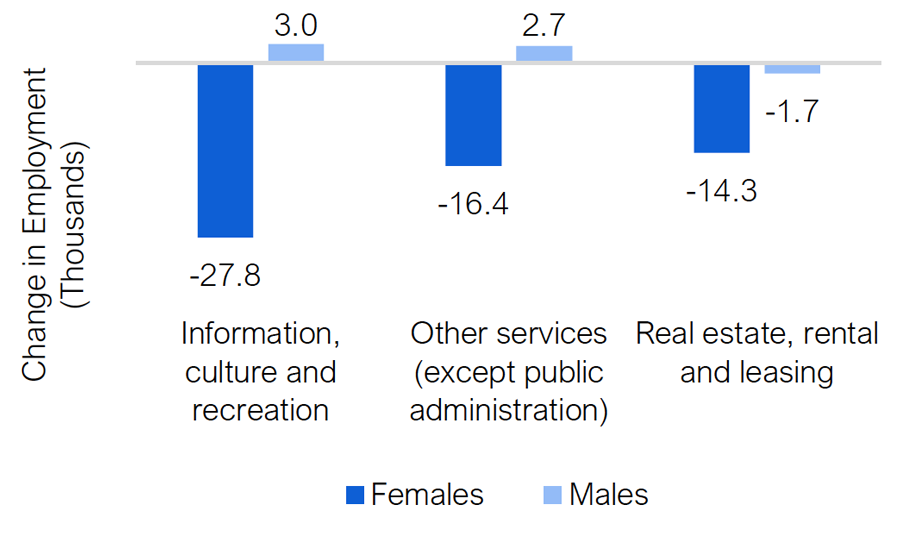
Figure 6 Women faced disproportionately large job losses in some industries
Source: Statistics Canada and FAO.
By December, accommodation and food services (23.7 per cent below February) and business, building and support services (15.3 per cent below February) had the weakest pace of job recovery of all the industries. Among goods‑producing industries, the pace of job recovery in manufacturing has been stronger and as of December, the sector was 3.9 per cent above its pre‑pandemic February level of employment. In contrast, construction sector employment was 4.3 per cent below February, with almost all losses driven by self‑employed individuals.
In some of the hardest hit industries such as accommodation and food services, and retail trade, job losses among males and females were largely proportional.
However, in some industries, females had much larger job losses compared to males. Females experienced larger employment declines in information, culture and recreation (-27,800 vs +3,000 for males), other services[7] (‑16,400 vs +2,700 for males), and real estate, rental and leasing (‑14,300 vs ‑1,700 for males).
Weak labour market conditions in Ontario’s major cities
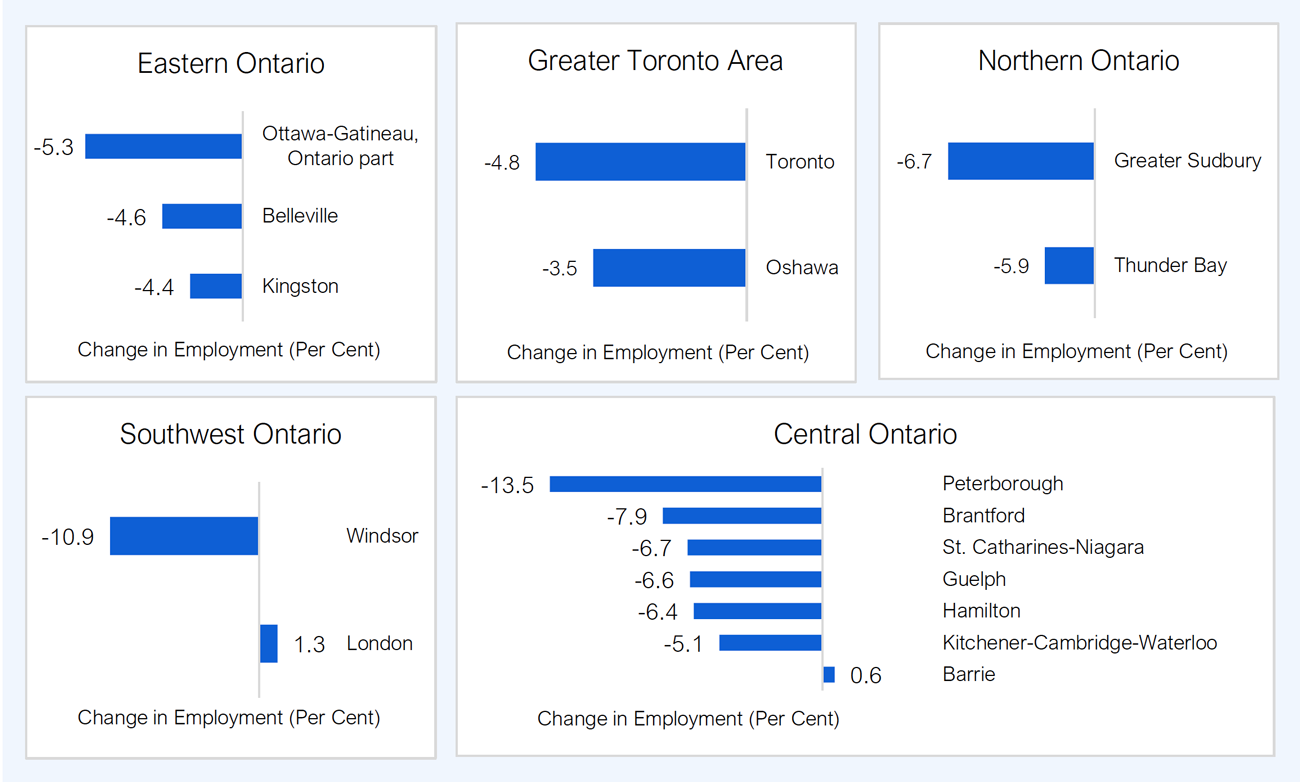
With the onset of the COVID‑19 pandemic, many of Ontario’s Census Metropolitan Areas (CMAs)[8] experienced record declines in annual employment, although the pace varied across regions. Peterborough recorded the steepest job losses (‑13.5 per cent) among the major cities in 2020, with two‑fifths of the decline in the construction sector. Windsor (‑10.9 per cent) posted the second sharpest employment loss, with significant contractions in wholesale and retail trade, and information, culture and recreation.
In Northern Ontario, both Thunder Bay (‑5.9 per cent) and Greater Sudbury (‑6.7 per cent) experienced job loss at a sharper pace relative to the provincial average. Construction in Greater Sudbury and wholesale and retail trade in Thunder Bay drove the job losses.
Figure 7 Employment declined sharply across majority of CMAs in Ontario
Source: Statistics Canada and FAO.
In the Greater Toronto Area, employment declined by 4.8 per cent in Toronto, and a smaller 3.5 per cent in Oshawa. Accommodation and food services and construction in Toronto, and wholesale and retail trade and transportation and warehousing in Oshawa drove the job losses.
Several cities across Central Ontario experienced notable job losses. Employment declines in St. Catharines‑Niagara (‑6.7 per cent) and Hamilton (‑6.4 per cent) were mainly in the accommodation and food services industry. Job losses in Brantford (‑7.9 per cent), Guelph (‑6.6 per cent) and Kitchener‑Cambridge‑Waterloo (‑5.1 per cent) were concentrated in the manufacturing, wholesale and retail trade, and construction sectors, respectively. In Eastern Ontario, Ottawa (‑5.3 per cent), Belleville (‑4.6 per cent) and Kingston (‑4.4 per cent) recorded smaller job losses than many other CMAs, reflecting employment gains in industries that could support working from home, which partially offset losses in other industries.
Only two CMAs recorded an increase in annual employment in 2020, including Barrie (0.6 per cent) and London (1.3 per cent) where job gains occurred in professional, scientific and technical services, construction, and transportation and warehousing.
By December, Barrie[9] (11.6 per cent below February) and Windsor (9.6 per cent below February) had the weakest pace of job recovery across all the CMAs, while Oshawa (1.3 per cent above February), Kingston (1.0 per cent above February) and Brantford (0.8 per cent above February) saw the strongest recovery.[10]
All provinces experienced labour market challenges
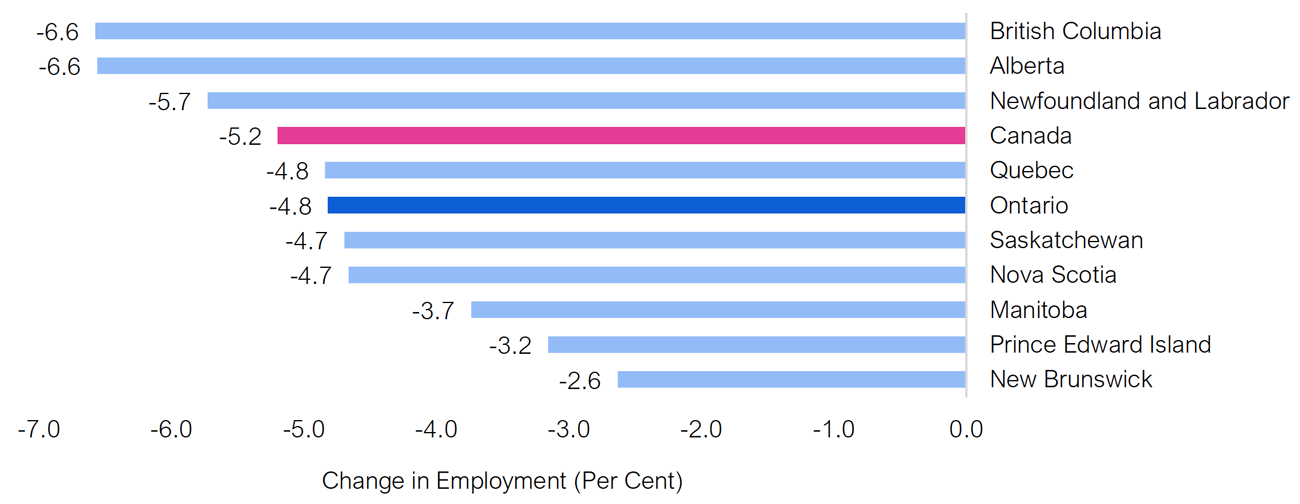
While the labour market outcomes across the provinces showed significant monthly fluctuations based on the timing of public health measures, on an average annual basis, all provinces experienced sharp declines in employment. Ontario (‑4.8 per cent) recorded the fifth deepest pace of job loss, trailing British Columbia (‑6.6 per cent), Alberta (‑6.6 per cent), and Newfoundland and Labrador (‑5.7 per cent).
The Canada‑wide unemployment rate increased sharply, reaching 9.5 per cent in 2020, up from 5.7 per cent in the previous year. All provinces saw sharply higher unemployment rates in 2020. Ontario recorded the sixth highest unemployment rate at 9.6 per cent, exceeded by Newfoundland and Labrador (14.1 per cent), Alberta (11.4 per cent), Prince Edward Island (10.4 per cent), New Brunswick (10.0 per cent) and Nova Scotia (9.8 per cent). Manitoba had the lowest unemployment rate among the provinces in 2020 at 8.0 per cent.
Figure 8 Ontario experienced the fifth fastest pace of job loss among all the provinces
Source: Statistics Canada and FAO.
The Canada-wide unemployment rate increased sharply, reaching 9.5 per cent in 2020, up from 5.7 per cent in the previous year. All provinces saw sharply higher unemployment rates in 2020. Ontario recorded the sixth highest unemployment rate at 9.6 per cent, exceeded by Newfoundland and Labrador (14.1 per cent), Alberta (11.4 per cent), Prince Edward Island (10.4 per cent), New Brunswick (10.0 per cent) and Nova Scotia (9.8 per cent). Manitoba had the lowest unemployment rate among the provinces in 2020 at 8.0 per cent.
Table 1Ontario’s labour market presented particular challenges for many workers in 2020
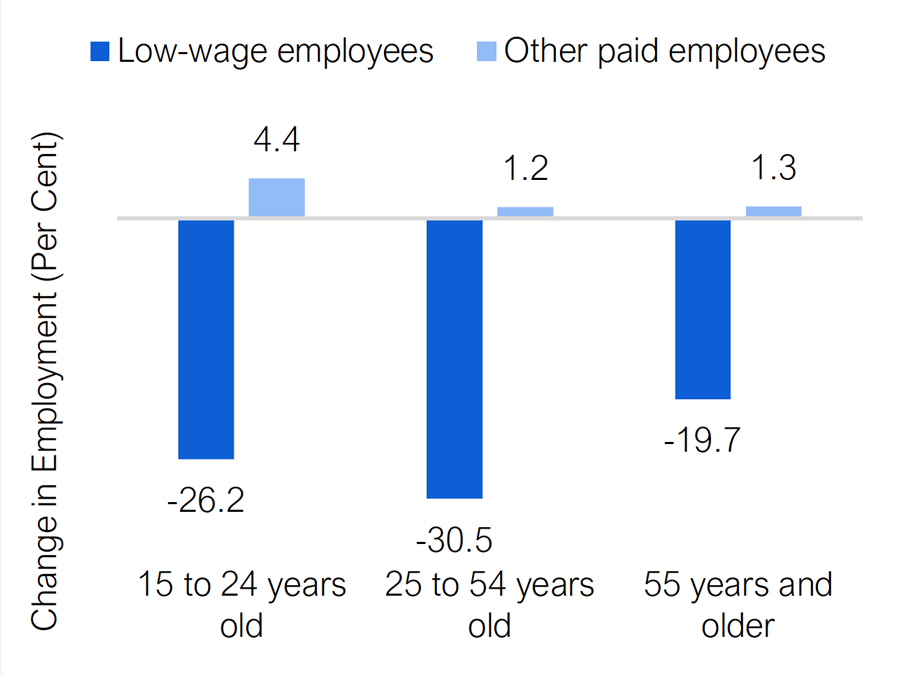
Employees in low‑wage jobs
Source: Statistics Canada and FAO.
Accessible version
| Change in Employment (Per Cent) |
Low-wage employees | Other paid employees |
| 15 to 24 years old | -26.2 | 4.4 |
| 25 to 54 years old | -30.5 | 1.2 |
| 55 years and older | -19.7 | 1.3 |
- Workers in low‑wage[11] jobs represented nearly one-fifth of pre‑pandemic employment in Ontario, with the majority in the 15‑24 age group and in industries such as accommodation and food, and retail trade. These workers faced starkly different employment outcomes compared to other employees in 2020.
- Ontario employees in low‑wage jobs saw their employment decline by 27.0 per cent, while employment in other wage categories increased by 1.4 per cent.
- The job market disparity was visible across all age groups, with core‑age workers (ages 25‑54) in low‑wage jobs experiencing the sharpest job losses at 30.5 per cent.
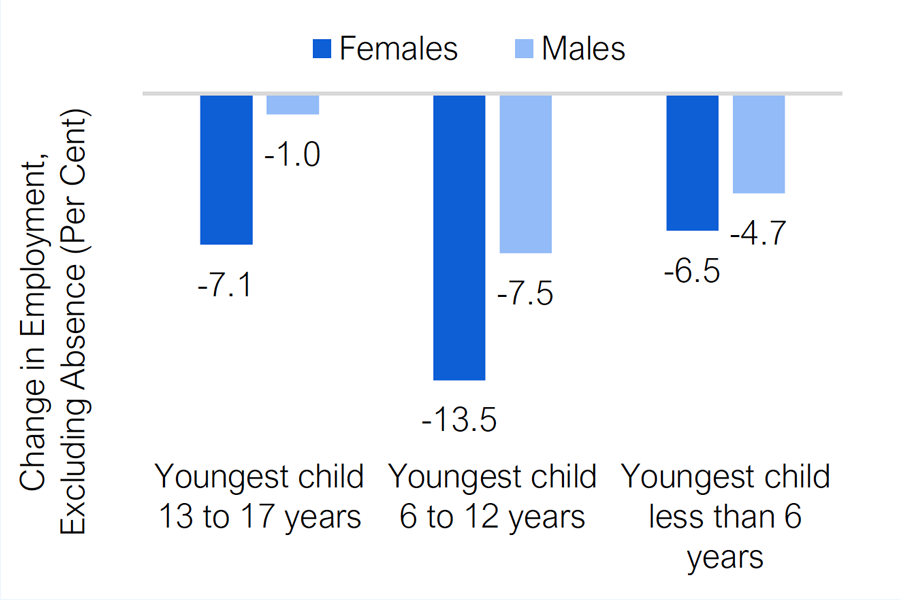
Core‑age mothers with children under 18
Source: Statistics Canada and FAO.
Accessible version
| Change in Employment, Excluding Absence (Per Cent) |
Females | Males |
| Youngest child 13 to 17 years | -7.1 | -1.0 |
| Youngest child 6 to 12 years | -13.5 | -7.5 |
| Youngest child less than 6 years | -6.5 | -4.7 |
- The pandemic created additional difficulties for working parents who had to balance childcare responsiblities.[12] In particular, core‑age (25‑54) working mothers with children under the age of 18 faced greater labour market attachment challenges compared to fathers.
- Nearly one‑fifth of core‑age mothers with children under the age of 18 were absent from work, more than twice the share of absence among fathers (9.1 per cent).[13]
- The number of core‑age mothers who were ‘at work’ (which excludes absences) declined at a much sharper pace compared to fathers across all age groups of children.
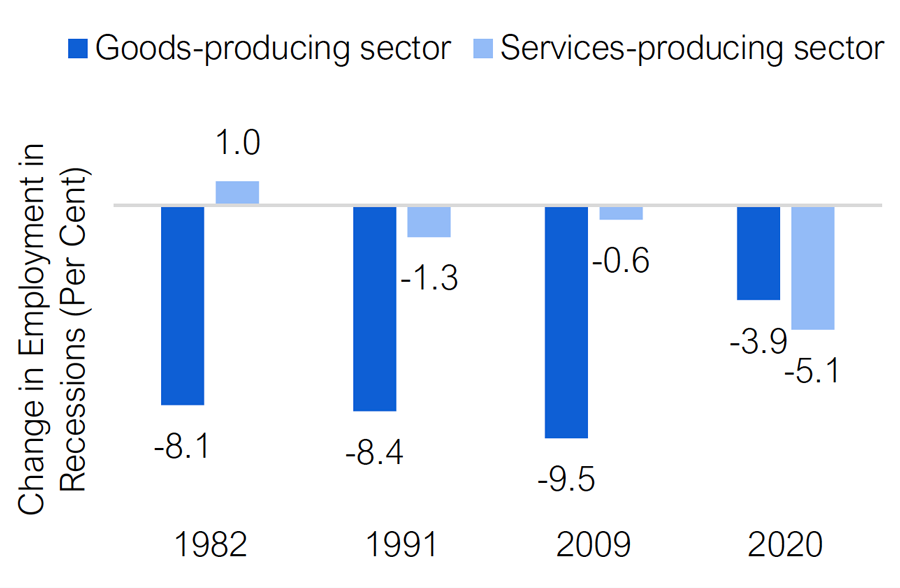
Service sector employees
Source: Statistics Canada and FAO.
Accessible version
| Change in Employment in Recessions (Per Cent) |
1982 | 1991 | 2009 | 2020 |
| Goods-producing sector | -8.1 | -8.4 | -9.5 | -3.9 |
| Services-producing sector | 1.0 | -1.3 | -0.6 | -5.1 |
- Unlike past recessions, employment declined faster in the service sector compared to goods‑producing industries.
- The disruption from the pandemic has accelerated many ongoing shifts in consumer[14] and business preferences.[15] Hesitancy to fully re‑engage in pre‑pandemic activities would result in a slow recovery in some service‑providing jobs such as retail, tourism and in‑person dining. [16]
- In addition, accelerated automation could affect vulnerable workers, who with limited resources to upgrade their skills may face a higher risk of job displacement.[17]
Appendix
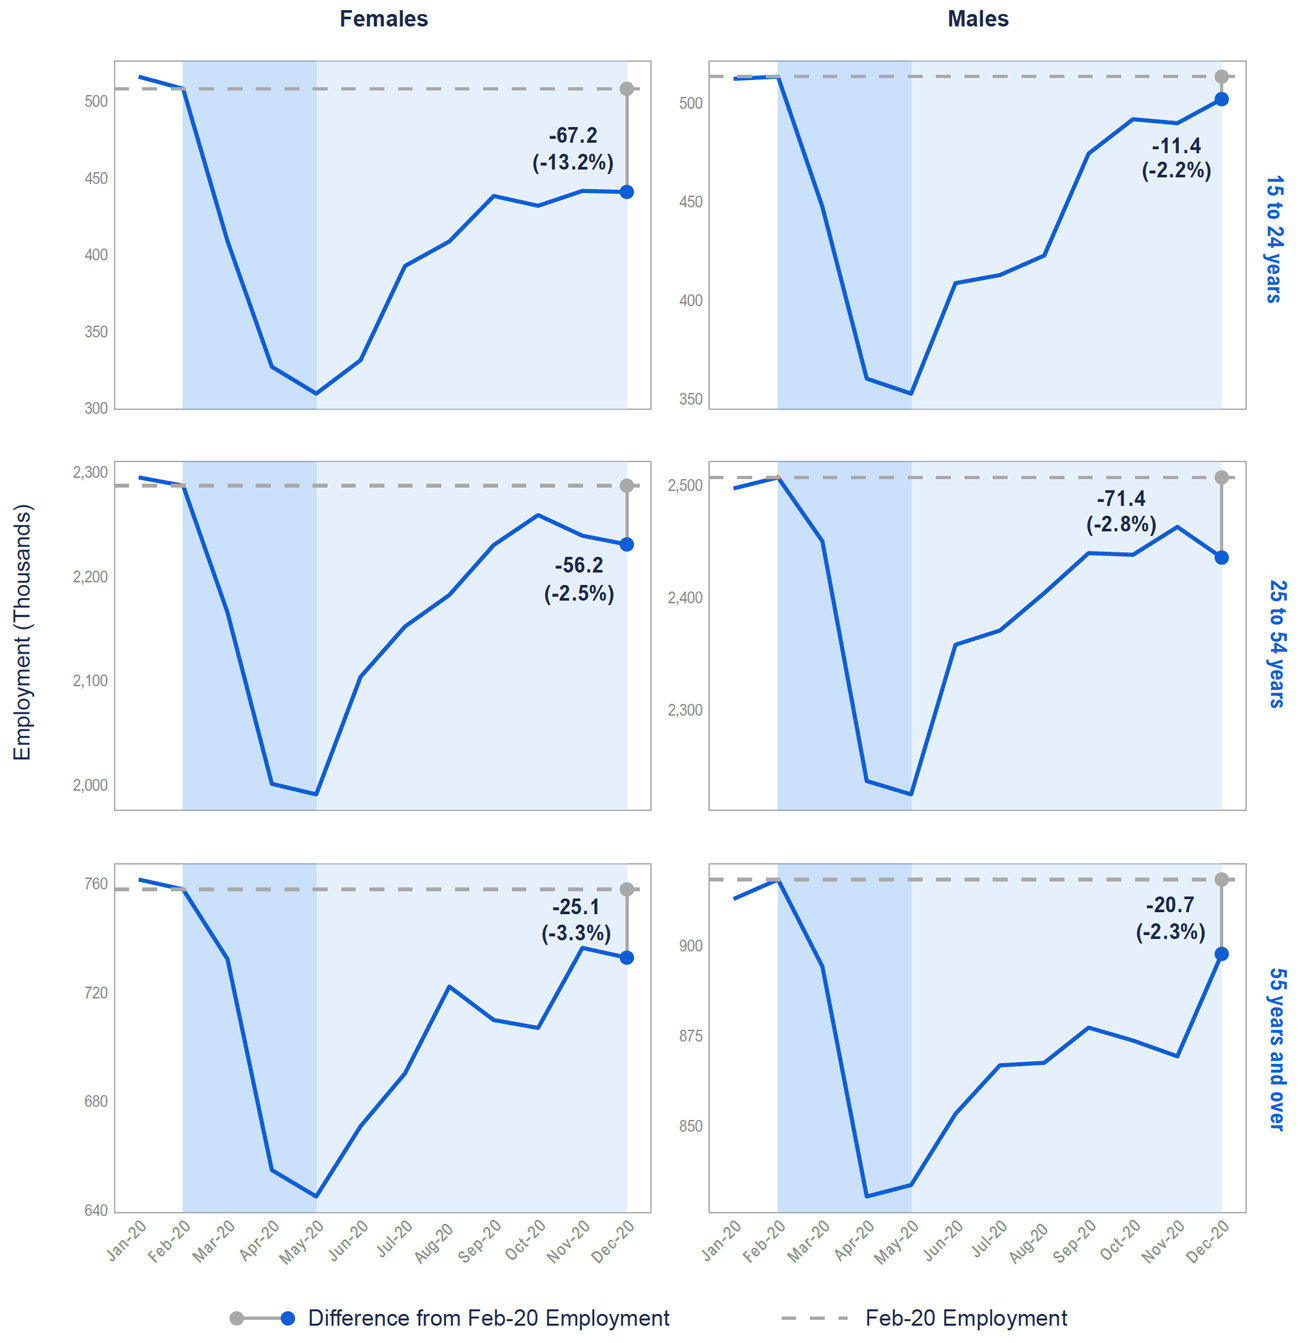
Monthly employment trend in 2020 by demographic groups
Young females saw the slowest pace of recovery since May, while young males experienced the strongest
Source: Statistics Canada and FAO.
Accessible version
| Employment Change from Feb-20 to Dec-20 (Thousands) |
Employment Change from Feb-20 to Dec-20 (Per Cent) |
|||
| Females | Males | Females | Males | |
| 15 to 24 years | -67.2 | -11.4 | -13.2 | -2.2 |
| 25 to 54 years | -56.2 | -71.4 | -2.5 | -2.8 |
| 55 years and over | -25.1 | -20.7 | -3.3 | -2.3 |
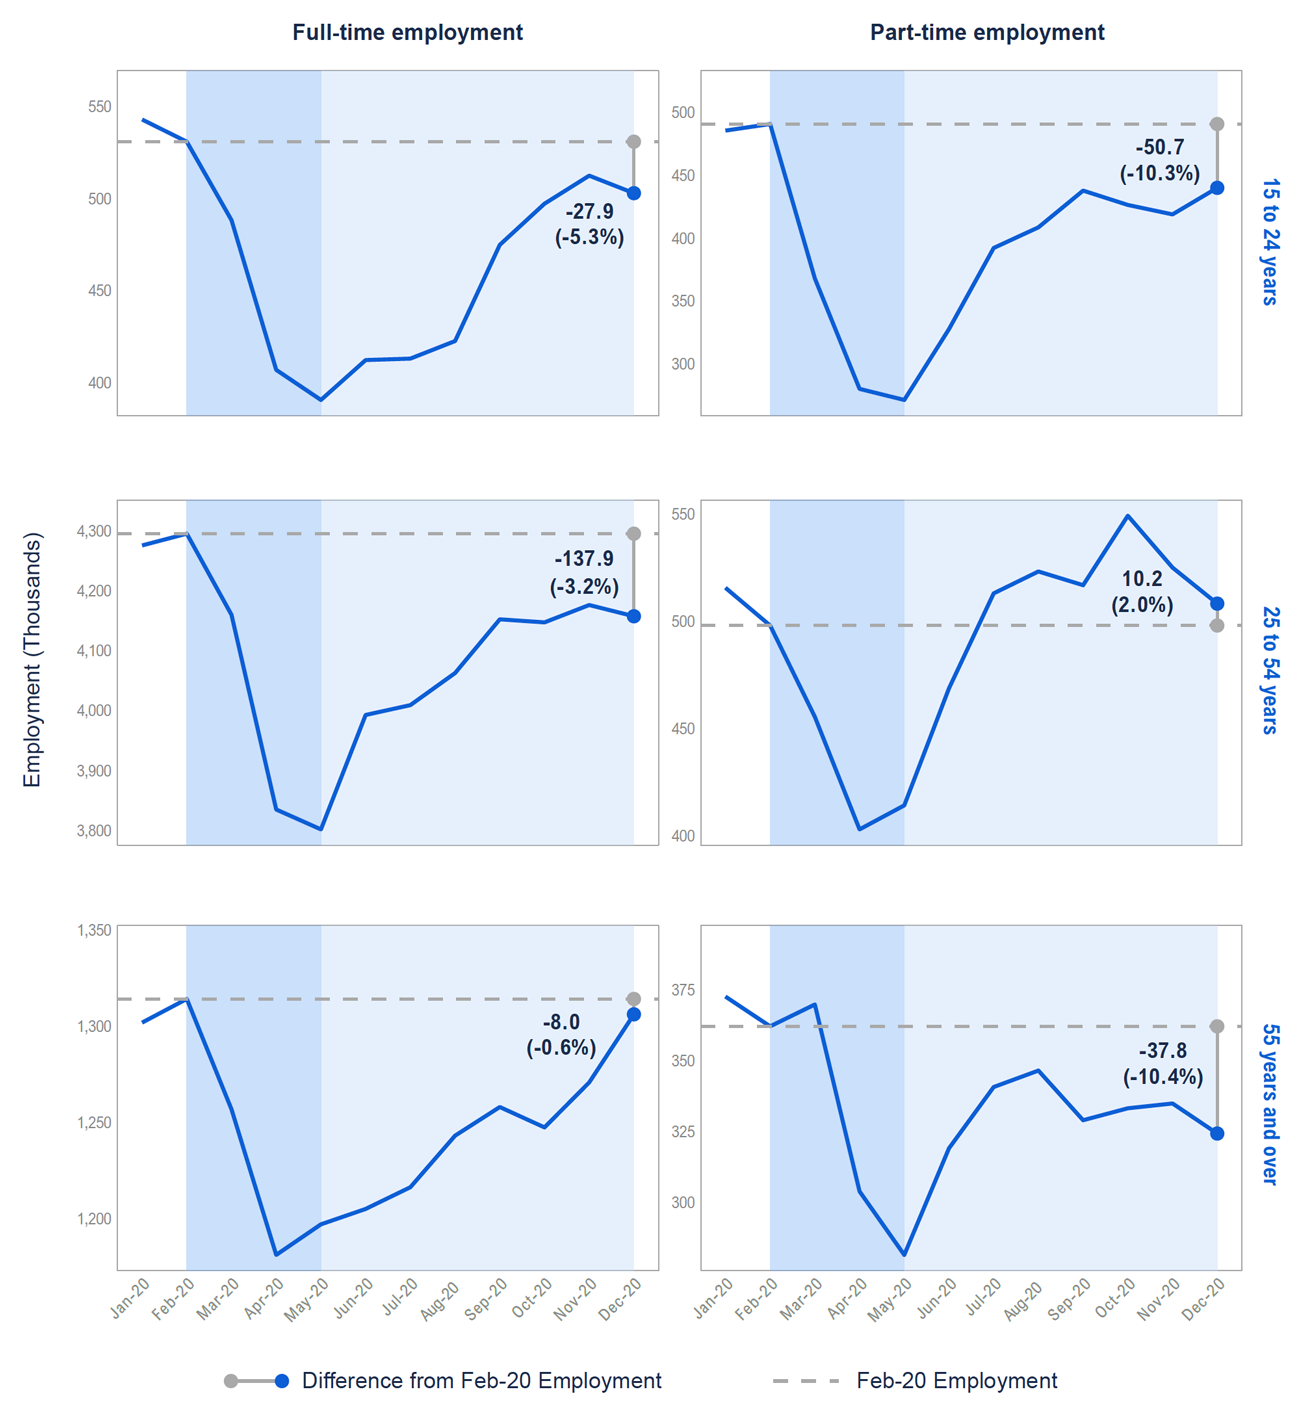
Monthly employment trend in 2020 by job types
Core‑age part‑time employment recorded strongest recovery, while many other groups struggled
Source: Statistics Canada and FAO.
Accessible version
| Employment Change from Feb-20 to Dec-20 (Thousands) | Employment Change from Feb-20 to Dec-20 (Per Cent) | |||
| Full-time Employment | Part-time Employment | Full-time Employment | Part-time Employment | |
| 15 to 24 years | -27.9 | -50.7 | -5.3 | -10.3 |
| 25 to 54 years | -137.9 | 10.2 | -3.2 | 2.0 |
| 55 years and over | -8.0 | -37.8 | -0.6 | -10.4 |
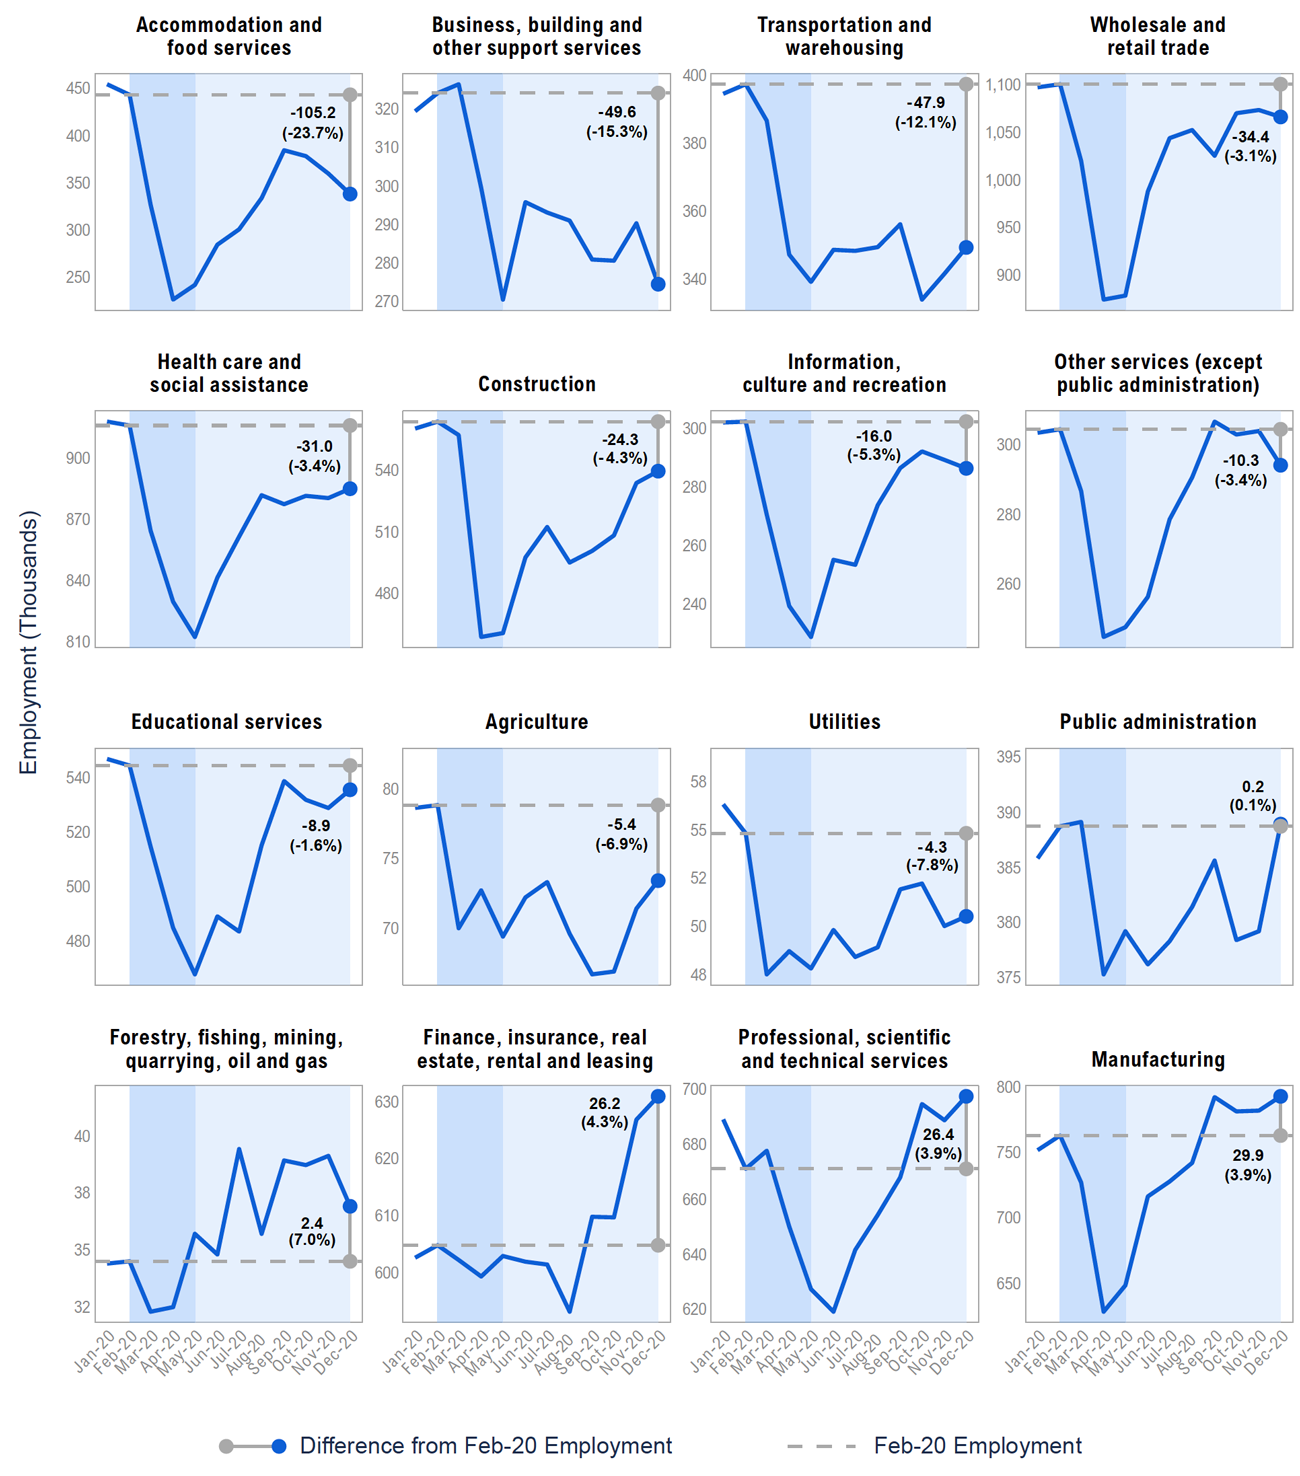
Monthly employment trend in 2020 by industry
Accommodation and food services experienced the weakest recovery pace, while finance, professional and manufacturing reached above pre‑pandemic level
Source: Statistics Canada and FAO.
Accessible version
| North American Industry Classification System (NAICS) | Employment Change from Feb-20 to Dec-20 (Thousands) | Employment Change from Feb-20 to Dec-20 (Per Cent) |
| Accommodation and food services | -105.2 | -23.7 |
| Business, building and other support services | -49.6 | -15.3 |
| Transportation and warehousing | -47.9 | -12.1 |
| Wholesale and retail trade | -34.4 | -3.1 |
| Health care and social assistance | -31.0 | -3.4 |
| Construction | -24.3 | -4.3 |
| Information, culture and recreation | -16.0 | -5.3 |
| Other services (except public administration) | -10.3 | -3.4 |
| Educational services | -8.9 | -1.6 |
| Agriculture | -5.4 | -6.9 |
| Utilities | -4.3 | -7.8 |
| Public administration | 0.2 | 0.1 |
| Forestry, fishing, mining, quarrying, oil and gas | 2.4 | 7.0 |
| Finance, insurance, real estate, rental and leasing | 26.2 | 4.3 |
| Professional, scientific and technical services | 26.4 | 3.9 |
| Manufacturing | 29.9 | 3.9 |
Monthly employment trend in 2020 by Ontario’s Census Metropolitan Areas (CMAs)
Barrie saw the weakest recovery among all CMAs, while Oshawa experienced the strongest recovery
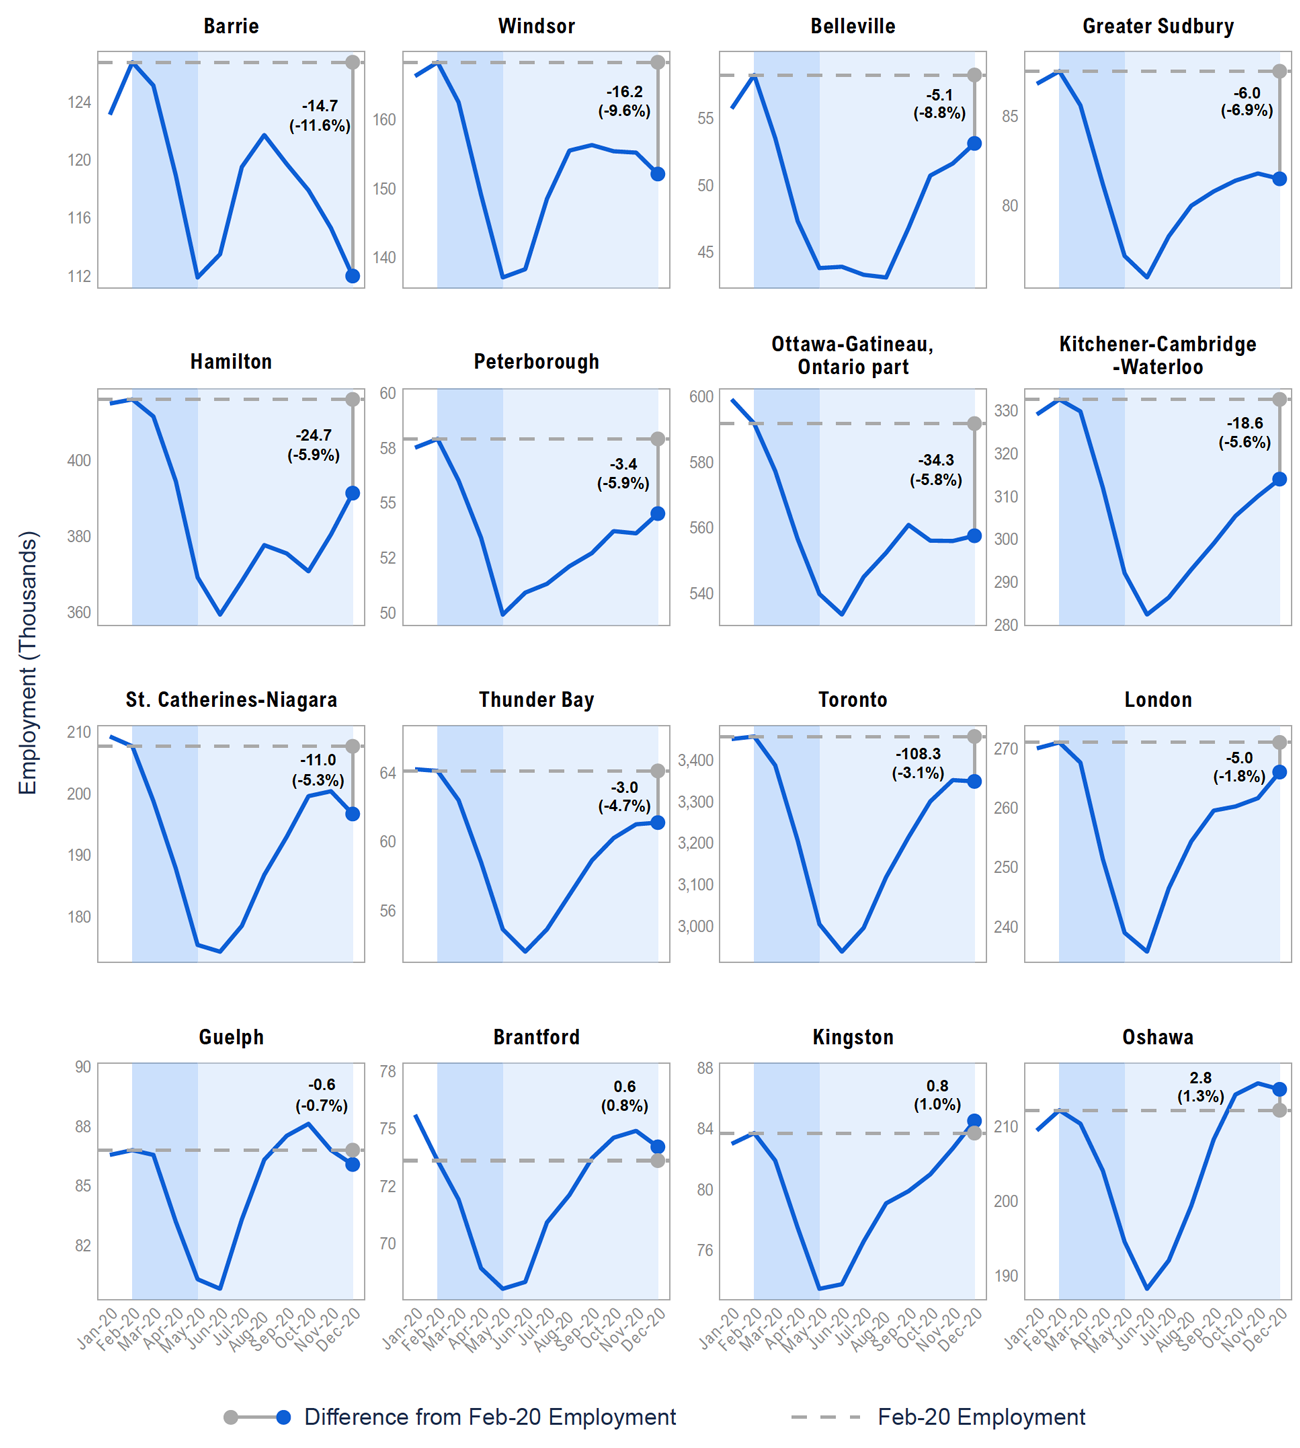
Note: Monthly figures for CMAs are three-month moving averages, seasonally adjusted.
Source: Statistics Canada and FAO.
Accessible version
| Census Metropolitan Areas(CMAs) | Employment Change from Feb-20 to Dec-20 (Thousands) |
Employment Change from Feb-20 to Dec-20 (Per Cent) |
| Barrie | -14.7 | -11.6 |
| Windsor | -16.2 | -9.6 |
| Belleville | -5.1 | -8.8 |
| Greater Sudbury | -6.0 | -6.9 |
| Hamilton | -24.7 | -5.9 |
| Peterborough | -3.4 | -5.9 |
| Ottawa-Gatineau, Ontario part | -34.3 | -5.8 |
| Kitchener-Cambridge-Waterloo | -18.6 | -5.6 |
| St. Catharines-Niagara | -11.0 | -5.3 |
| Thunder Bay | -3.0 | -4.7 |
| Toronto | -108.3 | -3.1 |
| London | -5.0 | -1.8 |
| Guelph | -0.6 | -0.7 |
| Brantford | 0.6 | 0.8 |
| Kingston | 0.8 | 1.0 |
| Oshawa | 2.8 | 1.3 |
Graphic Descriptions
| Change in Employment (Thousands) | Unemployment Rate (Per Cent) | |
| 1977 | 63.2 | 6.9 |
| 1978 | 119.7 | 7.2 |
| 1979 | 169.2 | 6.6 |
| 1980 | 72.3 | 6.9 |
| 1981 | 127.4 | 6.6 |
| 1982 | -93.9 | 9.8 |
| 1983 | 50.4 | 10.4 |
| 1984 | 161.2 | 9 |
| 1985 | 166.4 | 7.9 |
| 1986 | 157.3 | 7 |
| 1987 | 161.7 | 6.1 |
| 1988 | 187.5 | 5 |
| 1989 | 115.9 | 5 |
| 1990 | -4.9 | 6.2 |
| 1991 | -177 | 9.5 |
| 1992 | -84.2 | 10.8 |
| 1993 | 5.1 | 10.9 |
| 1994 | 75.6 | 9.6 |
| 1995 | 86.4 | 8.7 |
| 1996 | 65.9 | 9 |
| 1997 | 124.8 | 8.4 |
| 1998 | 163.2 | 7.2 |
| 1999 | 181.4 | 6.3 |
| 2000 | 179.6 | 5.7 |
| 2001 | 106.4 | 6.3 |
| 2002 | 112.9 | 7.1 |
| 2003 | 178.7 | 6.9 |
| 2004 | 101.4 | 6.8 |
| 2005 | 66.7 | 6.6 |
| 2006 | 68 | 6.3 |
| 2007 | 77.5 | 6.4 |
| 2008 | 61.2 | 6.6 |
| 2009 | -172.2 | 9.2 |
| 2010 | 99.1 | 8.7 |
| 2011 | 123.6 | 7.9 |
| 2012 | 28.5 | 7.9 |
| 2013 | 101.4 | 7.6 |
| 2014 | 41 | 7.3 |
| 2015 | 36.3 | 6.8 |
| 2016 | 76 | 6.6 |
| 2017 | 131.1 | 6 |
| 2018 | 120.8 | 5.7 |
| 2019 | 203.6 | 5.6 |
| 2020 | -355.3 | 9.6 |
| Employment Change (Thousands) | Unemployment Rate (Per Cent) | |
| 1977 | 43 | 5.1 |
| 1978 | 90.3 | 5.4 |
| 1979 | 79.5 | 5 |
| 1980 | 68.6 | 5.1 |
| 1981 | 91 | 4.9 |
| 1982 | -18.5 | 7.8 |
| 1983 | 70.6 | 8.4 |
| 1984 | 110.7 | 7.5 |
| 1985 | 128.6 | 6.6 |
| 1986 | 143.2 | 5.8 |
| 1987 | 137.6 | 5.2 |
| 1988 | 177.4 | 4.3 |
| 1989 | 131.4 | 4.4 |
| 1990 | 50.1 | 5.5 |
| 1991 | -49.2 | 8.5 |
| 1992 | -11.7 | 9.4 |
| 1993 | 44.5 | 9.7 |
| 1994 | 71.5 | 8.5 |
| 1995 | 89.1 | 7.7 |
| 1996 | 61.7 | 8.1 |
| 1997 | 117.9 | 7 |
| 1998 | 125.5 | 5.9 |
| 1999 | 87.8 | 5.2 |
| 2000 | 106 | 4.6 |
| 2001 | 64.7 | 5.2 |
| 2002 | 39.9 | 5.9 |
| 2003 | 70.5 | 5.7 |
| 2004 | 44.1 | 5.4 |
| 2005 | 21.7 | 5.4 |
| 2006 | 6.4 | 5.1 |
| 2007 | 4.3 | 5.3 |
| 2008 | 18.3 | 5.3 |
| 2009 | -133.7 | 7.9 |
| 2010 | 33.9 | 7.4 |
| 2011 | 45.1 | 6.6 |
| 2012 | 5.8 | 6.5 |
| 2013 | 33.4 | 6.3 |
| 2014 | -35.9 | 6 |
| 2015 | 3.7 | 5.6 |
| 2016 | 18.4 | 5.5 |
| 2017 | 38.3 | 5.1 |
| 2018 | 59.7 | 4.8 |
| 2019 | 106.4 | 4.6 |
| 2020 | -175.2 | 7.7 |
| Unemployment Rate (Per Cent) | 2019 | 2020 |
| Recent immigrants | 7.2 | 11.1 |
| Long-term immigrants | 4.5 | 8.4 |
| Born in Canada | 4.1 | 6.7 |
| Change in Employment (Thousands) | Unemployment Rate (Per Cent) | |
| 1977 | 18.9 | 12.4 |
| 1978 | 24.5 | 12.8 |
| 1979 | 56.4 | 11.6 |
| 1980 | 11 | 12.2 |
| 1981 | 18.8 | 11.9 |
| 1982 | -77.7 | 16.7 |
| 1983 | -8.6 | 17.3 |
| 1984 | 37.2 | 14.3 |
| 1985 | 20.3 | 12.5 |
| 1986 | 15.6 | 11.2 |
| 1987 | 18.5 | 9.5 |
| 1988 | -3.2 | 7.9 |
| 1989 | -16.6 | 7.7 |
| 1990 | -62.3 | 10 |
| 1991 | -100.5 | 15.1 |
| 1992 | -54 | 17.7 |
| 1993 | -32.3 | 17.7 |
| 1994 | -3.8 | 15.7 |
| 1995 | -2.7 | 14.7 |
| 1996 | -2.2 | 14.9 |
| 1997 | -16.1 | 16.5 |
| 1998 | 23.7 | 14.5 |
| 1999 | 52.4 | 13.2 |
| 2000 | 49 | 11.8 |
| 2001 | 8.9 | 12.5 |
| 2002 | 17.1 | 13.9 |
| 2003 | 19.1 | 14.4 |
| 2004 | 13.8 | 14.1 |
| 2005 | -5.1 | 13.9 |
| 2006 | 34.2 | 12.9 |
| 2007 | 20.6 | 12.6 |
| 2008 | -12.9 | 13.4 |
| 2009 | -65.1 | 17.1 |
| 2010 | -13 | 17 |
| 2011 | 32.4 | 15.5 |
| 2012 | -29.5 | 16.6 |
| 2013 | 18.9 | 15.9 |
| 2014 | 13.2 | 15.2 |
| 2015 | -8.2 | 14.3 |
| 2016 | -5.9 | 13.7 |
| 2017 | 42.4 | 12.2 |
| 2018 | 22.4 | 11.8 |
| 2019 | 20.4 | 12 |
| 2020 | -156.9 | 22 |
| Change in Employment (Thousands) | |
| Finance and insurance | 32.7 |
| Public administration | 8.8 |
| Forestry, fishing, mining, quarrying, oil and gas | 1.0 |
| Agriculture | -3.2 |
| Professional, scientific and technical services | -3.2 |
| Utilities | -5.1 |
| Wholesale trade | -13.4 |
| Other services (except public administration) | -13.6 |
| Real estate and rental and leasing | -15.9 |
| Business, building and other support services | -17.7 |
| Manufacturing | -24.0 |
| Information, culture and recreation | -24.9 |
| Educational services | -25.0 |
| Construction | -25.2 |
| Health care and social assistance | -30.5 |
| Transportation and warehousing | -38.2 |
| Retail trade | -47.0 |
| Accommodation and food services | -110.7 |
| Change in Employment (Thousands) | Females | Males |
| Information, culture and recreation | -27.8 | 3.0 |
| Other services (except public administration) | -16.4 | 2.7 |
| Real estate, rental and leasing | -14.3 | -1.7 |
| Region | Census Metropolitan Area | Change in Employment (Per Cent) |
| Central Ontario | Barrie | 0.6 |
| Central Ontario | Kitchener-Cambridge-Waterloo | -5.1 |
| Central Ontario | Hamilton | -6.4 |
| Central Ontario | Guelph | -6.6 |
| Central Ontario | St. Catharines-Niagara | -6.7 |
| Central Ontario | Brantford | -7.9 |
| Central Ontario | Peterborough | -13.5 |
| Eastern Ontario | Kingston | -4.4 |
| Eastern Ontario | Belleville | -4.6 |
| Eastern Ontario | Ottawa-Gatineau, Ontario part | -5.3 |
| Greater Toronto Area | Oshawa | -3.5 |
| Greater Toronto Area | Toronto | -4.8 |
| Northern Ontario | Thunder Bay | -5.9 |
| Northern Ontario | Greater Sudbury | -6.7 |
| Southwest Ontario | London | 1.3 |
| Southwest Ontario | Windsor | -10.9 |
| Change in Employment (Per Cent) | |
| New Brunswick | -2.6 |
| Prince Edward Island | -3.2 |
| Manitoba | -3.7 |
| Nova Scotia | -4.7 |
| Saskatchewan | -4.7 |
| Ontario | -4.8 |
| Quebec | -4.8 |
| Canada | -5.2 |
| Newfoundland and Labrador | -5.7 |
| Alberta | -6.6 |
| British Columbia | -6.6 |
Footnotes
[1] Since the report was finalized, Statistics Canada released January 2021 Labour Force Survey results showing significant job losses for Ontario. The FAO will provide updates on Ontario’s labour market over the course of the year in other reports.
[2] Based on the current Labour Force Survey (LFS) going back to 1976.
[4] Includes recent immigrants who landed in Canada within 10 years or less, and long‑term immigrants who have been in Canada more than 10 years. For details on labour market challenges faced by immigrants, see Transitions into and out of employment by immigrants during the COVID‑19 lockdown and recovery.
[5] See To what extent might COVID‑19 affect the earnings of the class of 2020? and Unlucky cohorts: Estimating the long‑term effects of entering the labor market in a recession in large cross‑sectional data sets.
[6] Finance and insurance and public administration industries had a relatively higher share of jobs that could be performed remotely even before the pandemic (Running the economy remotely: Potential for working from home during and after COVID‑19).
[7] Other services include repair and maintenance; personal and laundry services; religious, grant‑making, civic and professional services; and private household services. For details, see North American Industry Classification System (NAICS) Canada 2017 Version 3.0.
[8] Ontario cities included in this report are based on Statistics Canada’s Census Metropolitan Areas (CMAs). Statistics Canada defines a CMA as a large population centre together with adjacent fringe and rural areas that have a high degree of social and economic integration with the centres. A CMA must have a population of at least 100,000. CMA employment data is based on where employees live and not the location of their workplace.
[9] Barrie’s February 2020 level of employment was significantly above its 2019 average annual employment.
[10] Monthly figures for CMAs are three-month moving averages, seasonally adjusted.
[11] Low‑wage workers are defined as paid employees (excluding self‑employed individuals) who earned less than two‑thirds of the 2019 median earnings of $24.04 in Ontario. See Wage levels (indicator), OECD.
[13] See Labour Force Survey, September 2020 and Labour Force Survey, November 2020 for patterns in absence and caregiving concerns among mothers.
[14] See Canadians spend more money and time online during pandemic and over two‑fifths report a cyber incident.
[15] See COVID‑19: New data and analysis for monitoring Canada’s economic recovery and Economic Impacts and Recovery Related to the Pandemic.