


The province records another year of strong employment growth
Summary
This report provides an update on Ontario's labour market performance in 2022. It presents a summary of the overall labour market in the province, followed by information for demographic groups, industries, major cities and other provinces. The report also highlights some major challenges facing Ontario's labour market.
Ontario's labour market records another strong year in 2022
- Ontario's strong post-pandemic job creation continued in 2022, with employment increasing by 338,300 jobs (or 4.6 per cent). When combined with the rise in 2021, this marks the strongest two-year period of job gains on record. The annual unemployment rate in the province dropped to 5.6 per cent, the same as the pre-pandemic rate observed in 2019.
Nearly all groups of workers saw job gains
- Ontario's job gains were broad-based across all major age groups and genders. The share of the core-aged population (25-54) that was employed reached a record in 2022, with the rate for females climbing to an all-time high.
- The majority of job gains in 2022 were concentrated in full-time, private sector, and permanent positions. Self-employment in Ontario increased modestly following two years of decline – this weakness may reflect record job openings in paid employment as well as a shift in people's willingness to pursue self-employment.
- After declining for two consecutive years, the number of workers 55 years and older who reported leaving their job due to retirement increased sharply by 41.8 per cent in 2022.
- Nearly all major industry groups saw employment gains. Professional, scientific and technical services recorded the largest job gains for the second consecutive year.
- Employment increased across all major Ontario cities. However, employment in Greater Sudbury, Thunder Bay and Brantford remained below the pre-pandemic 2019 level.
Wage gains for most workers trailed inflation
- The average hourly wage rate in Ontario increased 4.2 per cent to $32.94 in 2022, marking the second consecutive year when wage growth did not keep up with inflation. Only two out of 16 industry groups and five out of 34 occupation groups saw their wages grow above the 6.8 per cent average annual CPI inflation rate in 2022.
While labour market tightness challenges persist, some industries still weak
- Hiring challenges persisted in 2022. Of all job vacancies in Ontario, 36.3 per cent remained unfilled for 90 days or more, reaching a record high in the third quarter of 2022. In addition, a record 5.2 per cent of employees were absent from work either a full week or part of a week due to illness or disability in 2022.
- Five industries out of 16 remained below their pre-pandemic 2019 level of employment including accommodation and food services, other services, business, building and other support services, agriculture, and transportation and warehousing.
Ontario's labour market records another strong year in 2022
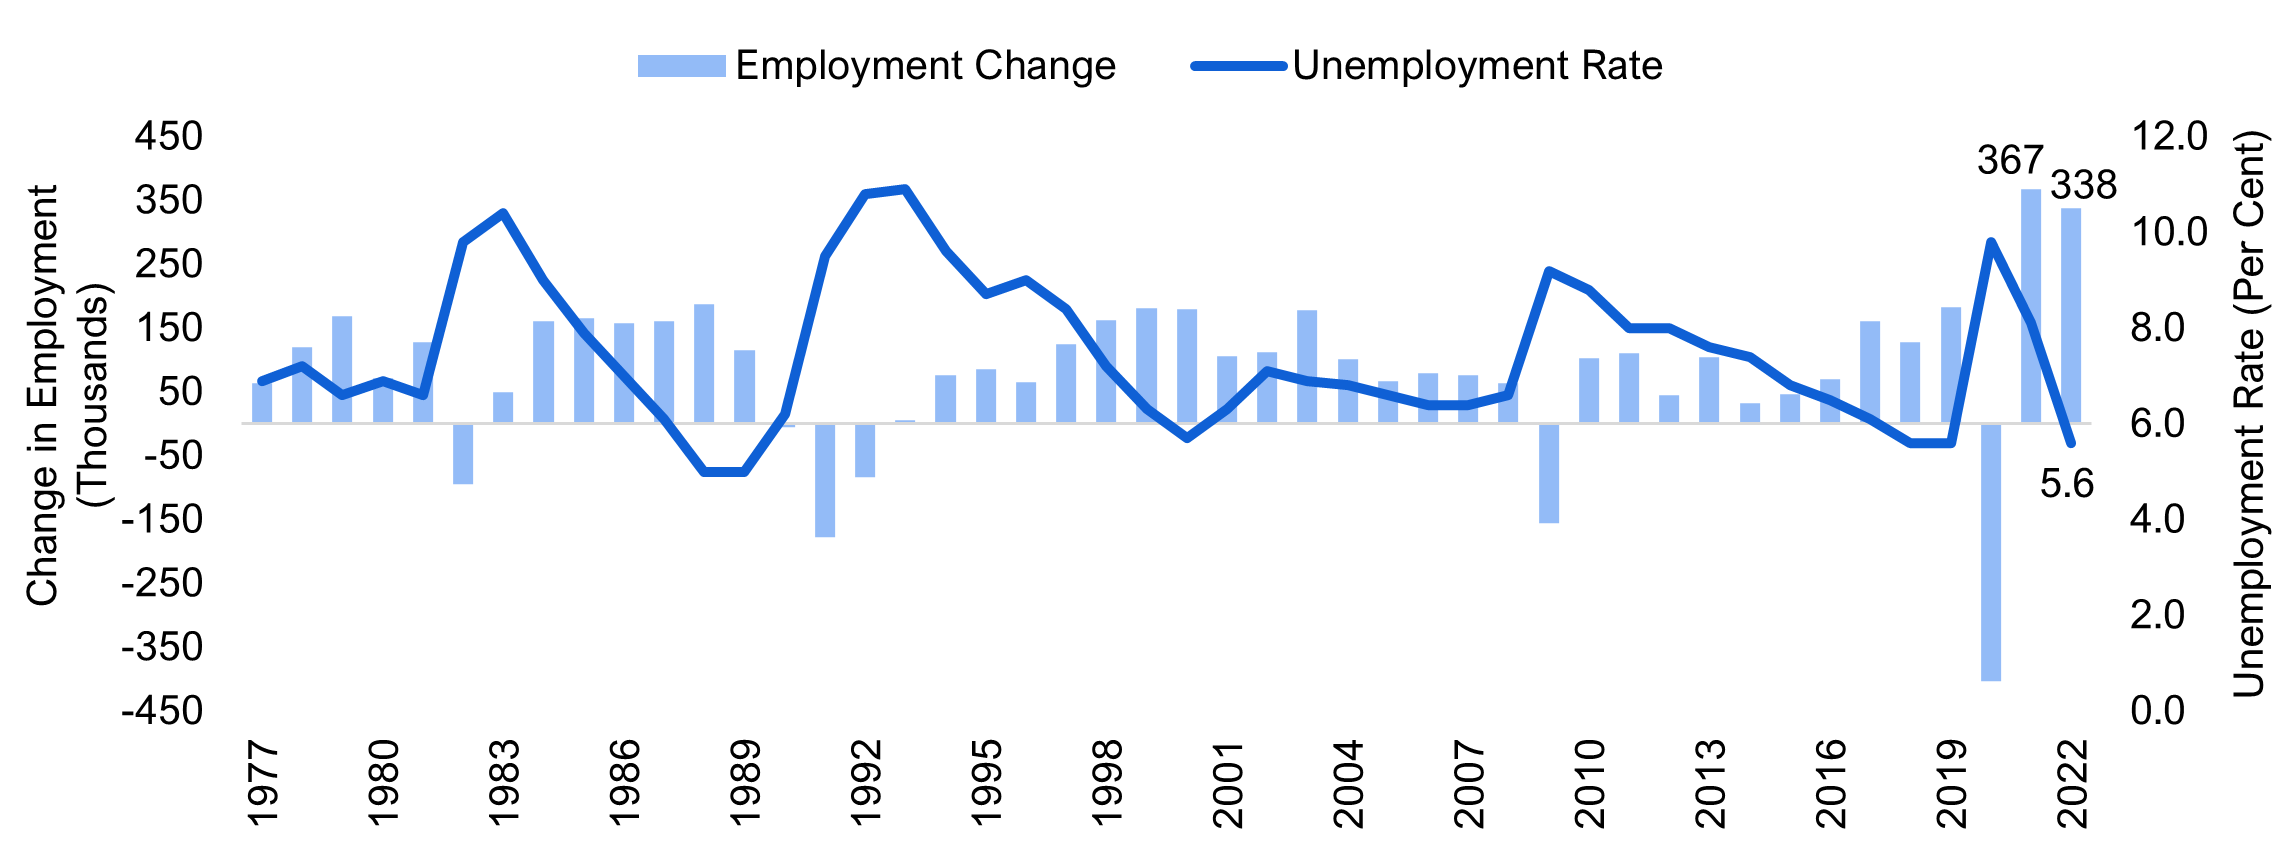
According to Statistics Canada's Labour Force Survey, Ontario's strong post-pandemic job creation continued in 2022, with employment rising by 338,300 jobs (or 4.6 per cent). When combined with the healthy employment increase in 2021, Ontario has experienced the strongest two-year period of job gains on record.
The average annual unemployment rate in the province dropped to 5.6 per cent in 2022, down from 8.1 per cent in 2021. This brought the annual unemployment rate to same as the pre-pandemic rate observed in 2019.
Figure 1 Record job gains in Ontario during the past two years
Source: Statistics Canada and FAO.
Accessible version
| Year | Employment Change (Thousands) | Unemployment Rate (Per Cent) |
|---|---|---|
| 1977 | 63.2 | 6.9 |
| 1978 | 119.7 | 7.2 |
| 1979 | 169.2 | 6.6 |
| 1980 | 72.3 | 6.9 |
| 1981 | 127.4 | 6.6 |
| 1982 | -93.9 | 9.8 |
| 1983 | 50.4 | 10.4 |
| 1984 | 161.2 | 9.0 |
| 1985 | 166.4 | 7.9 |
| 1986 | 157.3 | 7 |
| 1987 | 161.7 | 6.1 |
| 1988 | 187.5 | 5.0 |
| 1989 | 115.9 | 5.0 |
| 1990 | -4.9 | 6.2 |
| 1991 | -177 | 9.5 |
| 1992 | -84.2 | 10.8 |
| 1993 | 5.1 | 10.9 |
| 1994 | 75.6 | 9.6 |
| 1995 | 86.4 | 8.7 |
| 1996 | 65.9 | 9.0 |
| 1997 | 124.8 | 8.4 |
| 1998 | 163.2 | 7.2 |
| 1999 | 181.4 | 6.3 |
| 2000 | 179.6 | 5.7 |
| 2001 | 106.4 | 6.3 |
| 2002 | 112.9 | 7.1 |
| 2003 | 178.7 | 6.9 |
| 2004 | 101.4 | 6.8 |
| 2005 | 66.7 | 6.6 |
| 2006 | 79.5 | 6.4 |
| 2007 | 76.8 | 6.4 |
| 2008 | 63.4 | 6.6 |
| 2009 | -156 | 9.2 |
| 2010 | 102.7 | 8.8 |
| 2011 | 110.6 | 8.0 |
| 2012 | 44.9 | 8.0 |
| 2013 | 104 | 7.6 |
| 2014 | 33.1 | 7.4 |
| 2015 | 47.0 | 6.8 |
| 2016 | 69.4 | 6.5 |
| 2017 | 160.9 | 6.1 |
| 2018 | 128.6 | 5.6 |
| 2019 | 183.3 | 5.6 |
| 2020 | -403.3 | 9.8 |
| 2021 | 367.4 | 8.1 |
| 2022 | 338.3 | 5.6 |
Youth and core-aged workers experienced strong pace of job gains while older workers saw slower growth
In 2022, employment increased across all broad age and gender categories in Ontario. Young workers (15-24) recorded an 8.4 per cent rise in employment, the strongest pace of job growth compared to other major age groups. Female youth employment surpassed the pre-pandemic 2019 level, while employment among their male counterparts remained slightly below that threshold. Core-aged workers (25-54) experienced a job gain of 4.6 per cent in 2022, with the employment increase for males modestly faster than for females. Importantly, the employment rate of core-aged workers reached a record high of 83.9 per cent, as the rate for female workers climbed to an all-time high.
Among all the age groups, older workers (55 and over) saw the slowest pace of job growth in 2022 at 2.2 per cent. After declining for two consecutive years by 21.8 per cent, the number of workers 55 years and older who reported leaving their job in the past 12 months due to retirement increased by 41.8 per cent in 2022. Despite this surge, on a proportional basis, retirements in 2022 were similar to pre-pandemic rates. For female workers in the 55-64 age group, the proportion reached a record high.
All age and gender groups saw their unemployment rate decline in 2022. However, the unemployment rate remained slightly elevated compared to the pre-pandemic 2019 rate for core-aged female workers and older workers across both genders.
| Age and Gender | Annual Employment Change in 2022 (Thousands) | Annual Employment Change in 2022 (Per Cent) | Unemployment Rate (Per Cent) | ||
|---|---|---|---|---|---|
| 2020 | 2021 | 2022 | |||
| Youth (15-24 years) | 79.2 | 8.4 | 22.1 | 15.9 | 11.5 |
| Males | 31.4 | 6.4 | 22.3 | 16.5 | 12.4 |
| Females | 47.8 | 10.4 | 22.0 | 15.2 | 10.6 |
| Core (25-54 years) | 222.5 | 4.6 | 7.9 | 6.7 | 4.6 |
| Males | 122.7 | 4.9 | 7.7 | 6.6 | 4.3 |
| Females | 99.8 | 4.3 | 8.1 | 6.8 | 5.0 |
| Older (55 years and over) | 36.6 | 2.2 | 7.3 | 7.4 | 4.6 |
| Males | 14.4 | 1.6 | 7.1 | 7.2 | 4.5 |
| Females | 22.2 | 3.0 | 7.5 | 7.8 | 4.7 |
| Total | 338.3 | 4.6 | 9.8 | 8.1 | 5.6 |
Ontario saw broad based job gains across different types of employment categories
Employment grew across all major employment types. The majority of the job gains in 2022 were concentrated in full-time, private sector, and permanent positions. The pace of employment growth was generally similar across most types of jobs, except for those self-employed.
The number of self-employed Ontarians increased by merely 900 (0.1 per cent) in 2022, following two years of decline. This three-year period of weakness may reflect record job openings for paid employment as well as a shift in willingness to pursue self-employment in uncertain times. Since 2019, 62.5 per cent of the decline in self-employment was driven by self-employed individuals who were unincorporated and had no paid help.
| Annual Employment Change in 2022 (Thousands) | Annual Employment Change in 2022 (Per Cent) | |
|---|---|---|
| Type of Employment | ||
| Full-time | 283.5 | 4.7 |
| Part-time | 54.8 | 4.2 |
| Class of Workers | ||
| Private | 250.8 | 5.1 |
| Public | 86.6 | 6.1 |
| Self-employed | 0.9 | 0.1 |
| Job Permanency of Paid Employment* | ||
| Permanent | 295.7 | 5.3 |
| Temporary | 41.7 | 5.8 |
| Total | 338.3 | 4.6 |
Most industries in Ontario saw strong job growth in 2022
Of the 16 major industries in Ontario, 15 saw an increase in employment in 2022. Professional, scientific and technical services recorded the largest increase in employment (51,000, or 6.8 per cent) for the second consecutive year. The construction sector also had healthy job growth, with employment rising a strong 49,300 (or 9.2 per cent). Health care and social assistance, one of the largest sources of employment in Ontario, saw job growth of 34,400 (3.8 per cent) in 2022. Other services recorded a decline in employment of -5,600 (-2.2 per cent) in 2022, marking the third year of persistent job loss.[1]
| Industry | Annual Employment Change in 2022 (Thousands) | Annual Employment Change in 2022 (Per Cent) |
|---|---|---|
| Professional, scientific and technical services | 51.0 | 6.8 |
| Construction | 49.3 | 9.2 |
| Finance, insurance, real estate, rental and leasing | 41.1 | 6.5 |
| Wholesale and retail trade | 34.5 | 3.1 |
| Health care and social assistance | 34.4 | 3.8 |
| Public administration | 27.6 | 6.7 |
| Accommodation and food services | 26.5 | 7.1 |
| Information, culture and recreation | 18.1 | 6.1 |
| Transportation and warehousing | 12.7 | 3.5 |
| Educational services | 12.2 | 2.2 |
| Manufacturing | 11.9 | 1.5 |
| Utilities | 8.6 | 16.7 |
| Business, building and other support services | 8.4 | 3.0 |
| Agriculture | 5.0 | 7.5 |
| Forestry, fishing, mining, quarrying, oil and gas | 2.5 | 7.2 |
| Other services (except public administration) | -5.6 | -2.2 |
Employment grew across all Census Metropolitan Areas
All census metropolitan areas (CMAs) in Ontario saw an increase in employment in 2022. Belleville (14.8 per cent), St. Catharines-Niagara (11.5 per cent), and Kingston (8.1 per cent) had the fastest pace of job creation. In contrast, Thunder Bay (1.3 per cent), Hamilton (2.2 per cent), and Kitchener-Cambridge-Waterloo (3.3 per cent) experienced relatively slow rates of employment growth.
Despite seeing job growth in 2022, both the major cities in northern Ontario remained below the pre-pandemic level of employment. Total employment in Greater Sudbury remained 2.2 per cent below the pre-pandemic 2019 level while Thunder Bay remained 2.1 per cent below. Employment in Brantford was 1.3 per cent below the pre-pandemic 2019 level.
All major cities saw their unemployment rate decline in 2022. Across the CMAs, the highest unemployment rates in 2022 were recorded in Windsor (7.7 per cent) and Toronto (6.4 per cent). Belleville had the lowest unemployment rate at 3.7 per cent in 2022.
| Census Metropolitan Area | Annual Change in Employment, 2022 (Per Cent) | Unemployment Rate (Per Cent) | |
|---|---|---|---|
| 2021 | 2022 | ||
| Belleville | 14.8 | 8.4 | 3.7 |
| St. Catharines-Niagara | 11.5 | 10.3 | 5.2 |
| Kingston | 8.1 | 7.5 | 5.5 |
| Barrie | 7.6 | 8.1 | 5.5 |
| Oshawa | 7.3 | 7.8 | 5.3 |
| London | 4.8 | 7.9 | 5.7 |
| Brantford | 4.7 | 7.1 | 5.1 |
| Toronto | 4.7 | 9.3 | 6.4 |
| Guelph | 4.3 | 6.8 | 4.2 |
| Peterborough | 4.1 | 7.8 | 4.5 |
| Greater Sudbury | 4.0 | 7.5 | 4.3 |
| Windsor | 3.8 | 9.7 | 7.7 |
| Ottawa-Gatineau, Ontario part | 3.4 | 6.1 | 4.2 |
| Kitchener-Cambridge-Waterloo | 3.3 | 6.3 | 5.7 |
| Hamilton | 2.2 | 6.9 | 4.9 |
| Thunder Bay | 1.3 | 7.3 | 4.9 |
All provinces experienced employment growth in 2022
On an average annual basis, all provinces experienced job gains in 2022. Ontario's employment growth (4.6 per cent) was the third fastest pace of job gains, trailing Prince Edward Island (5.4 per cent) and Alberta (5.2 per cent). The unemployment rate also dropped across all the provinces. In 2022, Ontario recorded the fifth lowest unemployment rate in the country, trailing British Columbia, Saskatchewan, Manitoba and Quebec.
| Province | Annual Change in Employment, 2022 (Per Cent) | Unemployment Rate (Per Cent) | |
|---|---|---|---|
| 2021 | 2022 | ||
| Prince Edward Island | 5.4 | 9.7 | 7.6 |
| Alberta | 5.2 | 8.6 | 5.8 |
| Ontario | 4.6 | 8.1 | 5.6 |
| Newfoundland and Labrador | 4.4 | 13.1 | 11.3 |
| Nova Scotia | 3.6 | 8.6 | 6.5 |
| Saskatchewan | 3.5 | 6.6 | 4.7 |
| Manitoba | 3.2 | 6.5 | 4.6 |
| British Columbia | 3.2 | 6.6 | 4.6 |
| Quebec | 3.0 | 6.1 | 4.3 |
| New Brunswick | 2.8 | 9.2 | 7.2 |
| Canada | 4.0 | 7.5 | 5.3 |
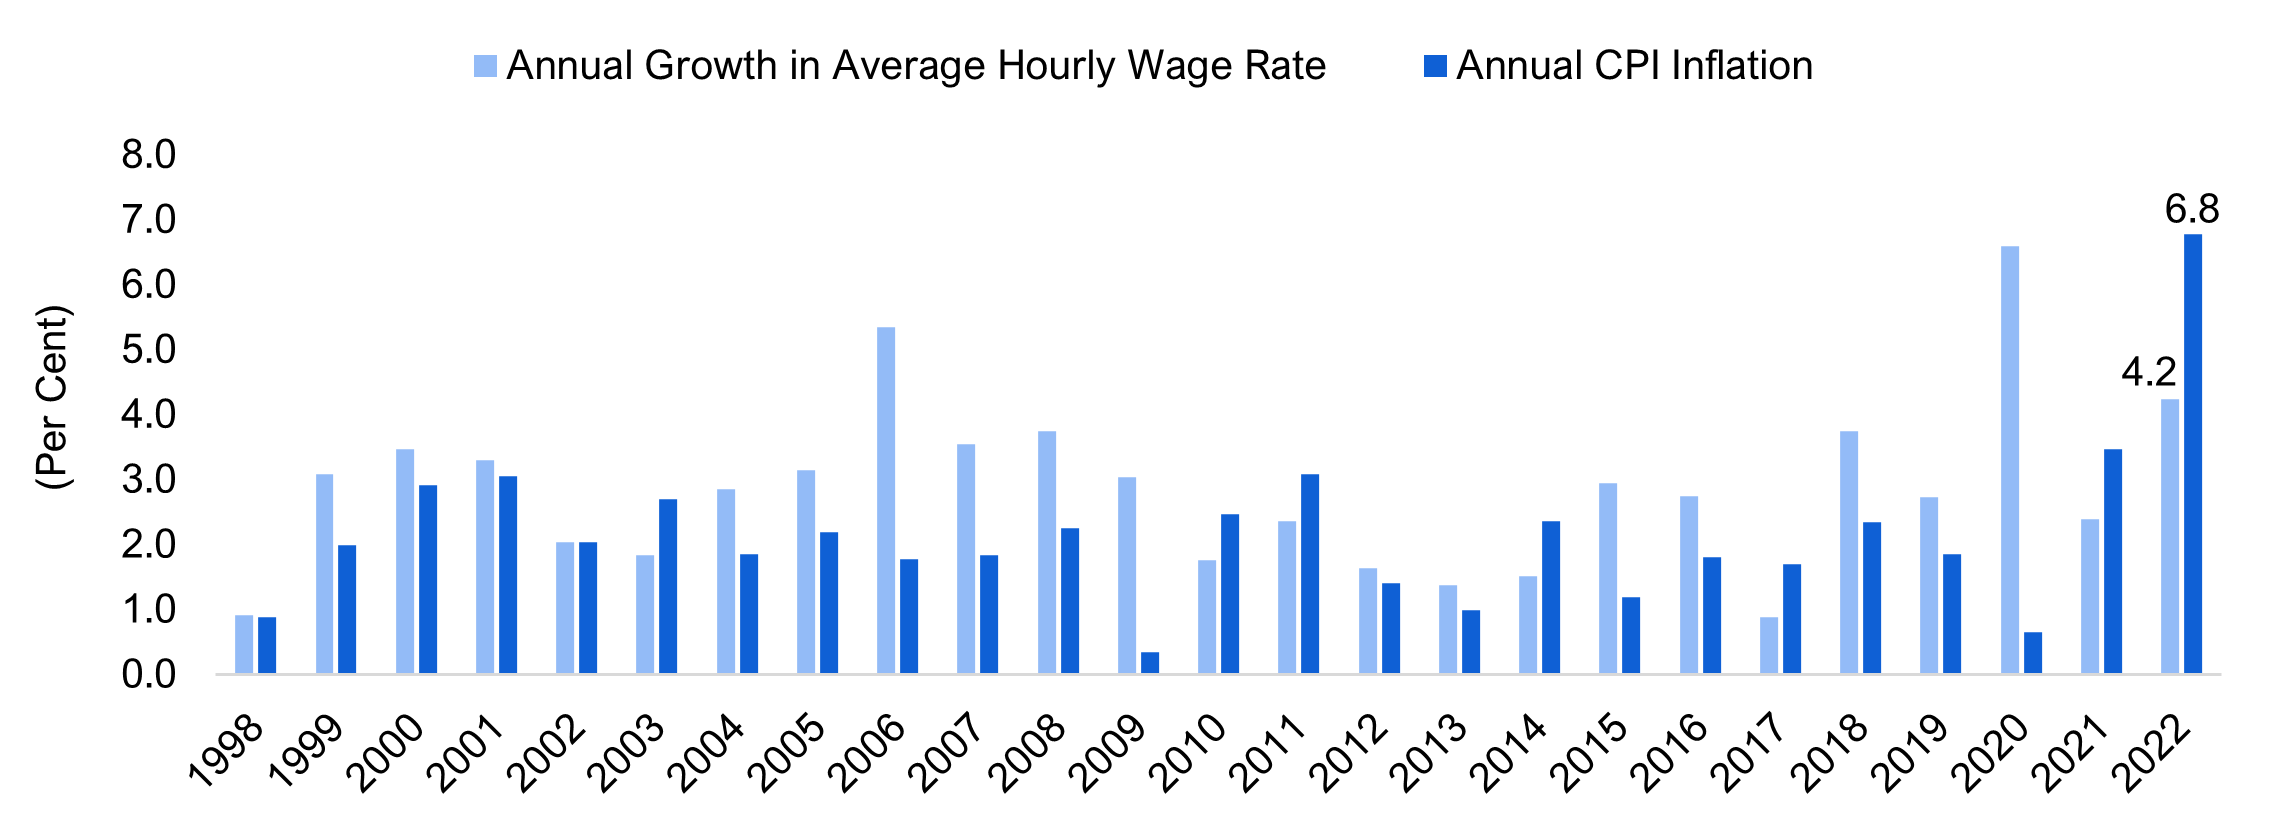
Wage growth in Ontario lagged inflation for the second consecutive year
The average hourly wage of Ontarians increased 4.2 per cent to $32.94 in 2022, below the 6.8 per cent CPI inflation rate. This marked the second consecutive year when wage growth did not keep up with inflation.
Figure 2 Average hourly wage growth did not keep up with inflation for the second consecutive year
Source: Statistics Canada and FAO.
Accessible version
| Year | Annual CPI Inflation (Per Cent) | Annual Growth in Average Hourly Wage Rate (Per Cent) |
|---|---|---|
| 1998 | 0.9 | 0.9 |
| 1999 | 2.0 | 3.1 |
| 2000 | 2.9 | 3.5 |
| 2001 | 3.0 | 3.3 |
| 2002 | 2.0 | 2.0 |
| 2003 | 2.7 | 1.8 |
| 2004 | 1.9 | 2.9 |
| 2005 | 2.2 | 3.1 |
| 2006 | 1.8 | 5.3 |
| 2007 | 1.8 | 3.6 |
| 2008 | 2.3 | 3.8 |
| 2009 | 0.4 | 3.0 |
| 2010 | 2.5 | 1.8 |
| 2011 | 3.1 | 2.4 |
| 2012 | 1.4 | 1.6 |
| 2013 | 1.0 | 1.4 |
| 2014 | 2.4 | 1.5 |
| 2015 | 1.2 | 2.9 |
| 2016 | 1.8 | 2.7 |
| 2017 | 1.7 | 0.9 |
| 2018 | 2.4 | 3.8 |
| 2019 | 1.9 | 2.7 |
| 2020 | 0.7 | 6.6 |
| 2021 | 3.5 | 2.4 |
| 2022 | 6.8 | 4.2 |
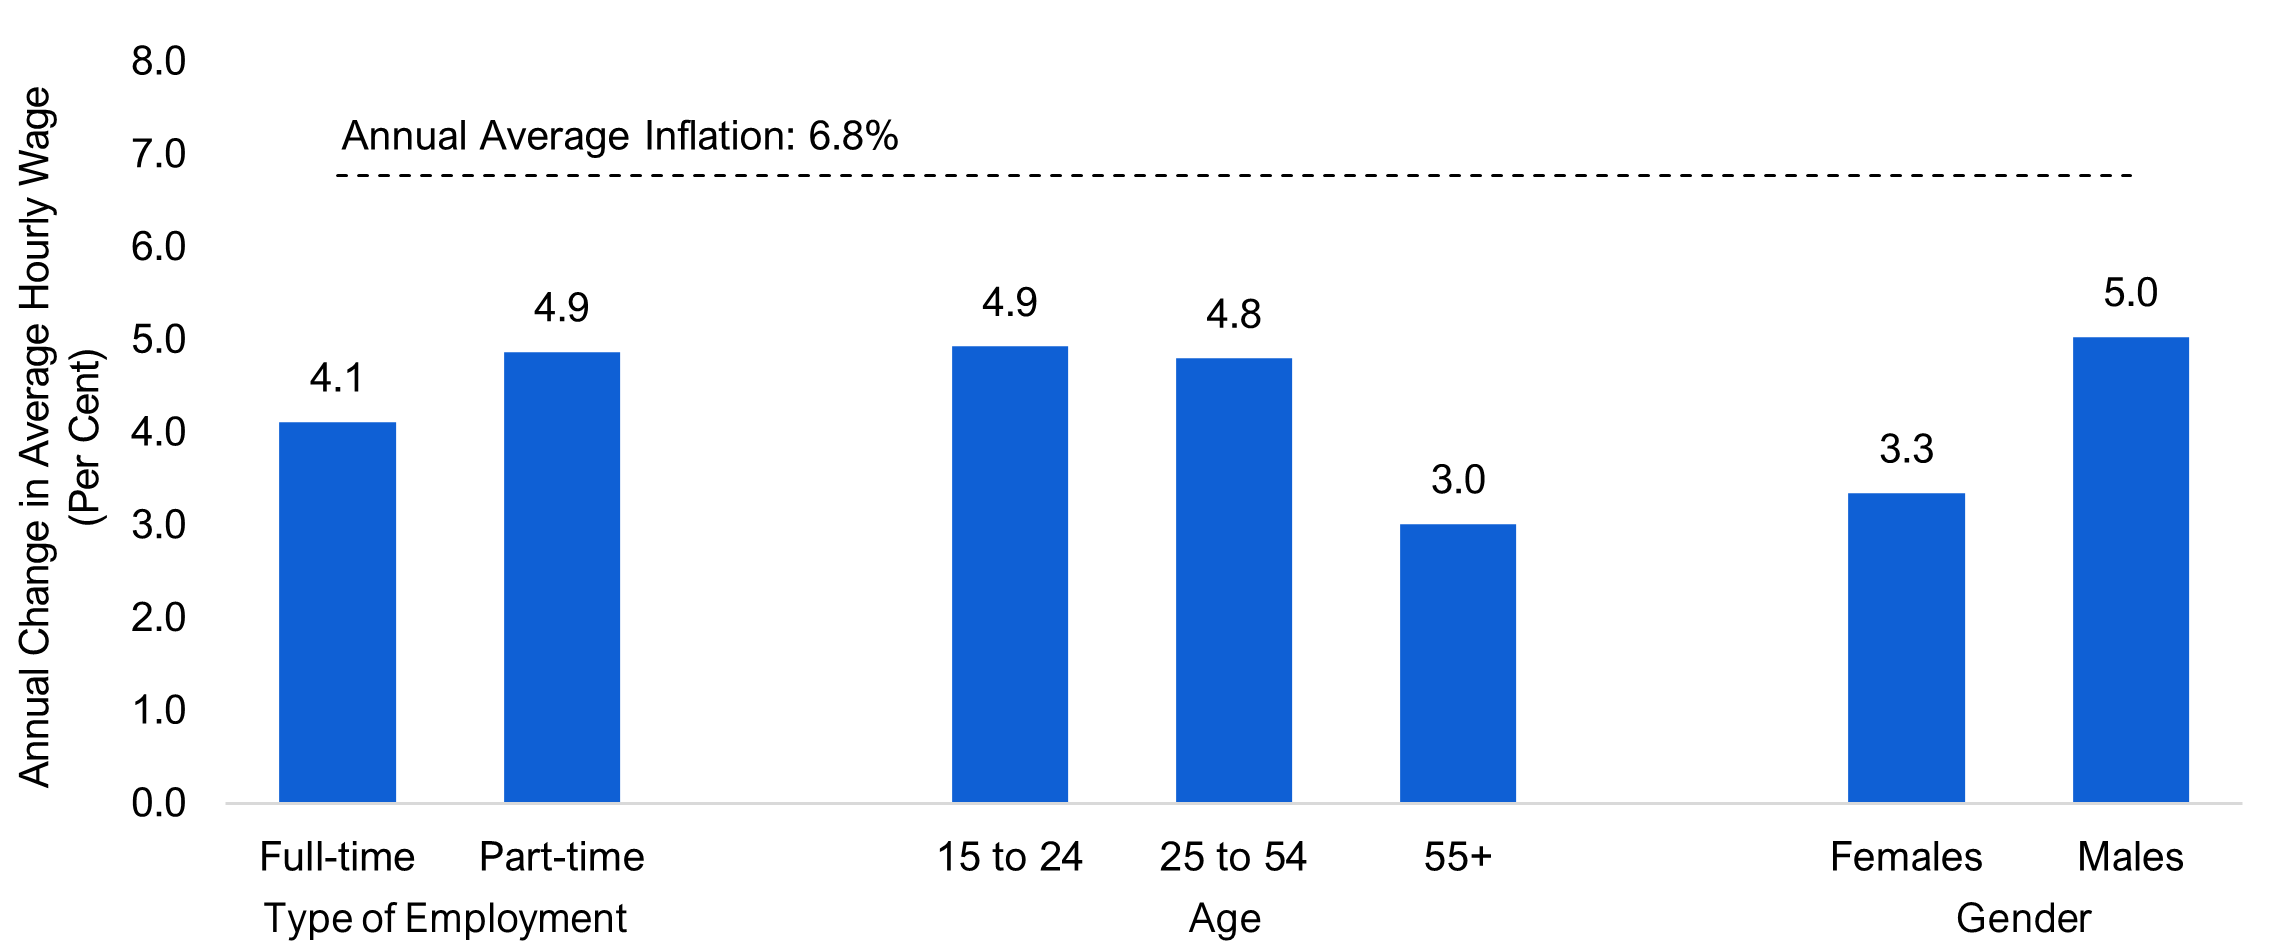
Wage growth remained below the inflation rate for all major groups. Wages for full-time employees increased 4.1 per cent, lower than the 4.9 per cent growth experienced by part-time workers. Across the broader age groups, young workers saw average wage gains of 4.9 per cent, followed by core-age workers (4.8 per cent), and older workers (3.0 per cent). Average wage growth for male workers (5.0 per cent) outpaced that for female workers (3.3 per cent).
Figure 3 Average hourly wage growth remained below inflation for all major groups
Source: Statistics Canada and FAO.
Accessible version
| Annual Change in Average Hourly Wage (Per Cent) | Annual Average Inflation (Per Cent) | ||
|---|---|---|---|
| Type of Employment | Full-time | 4.1 | 6.8 |
| Part-time | 4.9 | 6.8 | |
| Age | 15 to 24 | 4.9 | 6.8 |
| 25 to 54 | 4.8 | 6.8 | |
| 55+ | 3.0 | 6.8 | |
| Gender | Females | 3.3 | 6.8 |
| Males | 5.0 | 6.8 |
Wage growth across most industries and occupations did not keep up with inflation
Of the 16 major industry groups, only two industries saw their average hourly wage rate increase faster than inflation. Professional, scientific and technical services — an industry which had the second highest average hourly wage rate among all industries as well as the largest increase in employment in 2022 — recorded the strongest annual wage growth (9.0 per cent). The second highest wage growth (8.9 per cent) was recorded by accommodation and food services — an industry which had the lowest average hourly wage rate among all the industries, but the highest rate of job vacancy[2] as of the third quarter of 2022. Wage growth for workers in the wholesale and retail trade industry — an industry which accounts for a major share of minimum wage workers — did not keep up with inflation in 2022, rising 4.7 per cent.
| Industry | Average Hourly Wage Rate, 2022 ($) | Annual Change in Average Hourly Wage Rate in 2022 (Per Cent) |
|---|---|---|
| Professional, scientific and technical services | 43.6 | 9.0 |
| Accommodation and food services | 18.9 | 8.9 |
| Business, building and other support services | 25.3 | 5.9 |
| Manufacturing | 30.8 | 5.6 |
| Wholesale and retail trade | 25.4 | 4.7 |
| Health care and social assistance | 31.3 | 4.3 |
| Construction | 34.0 | 4.1 |
| Finance, insurance, real estate, rental and leasing | 41.1 | 3.0 |
| Agriculture | 21.6 | 2.9 |
| Utilities | 49.2 | 2.6 |
| Transportation and warehousing | 29.9 | 2.4 |
| Educational services | 39.4 | 1.9 |
| Information, culture and recreation | 32.5 | 1.0 |
| Public administration | 42.3 | 0.1 |
| Other services (except public administration) | 27.9 | -0.9 |
| Forestry, fishing, mining, quarrying, oil and gas | 40.5 | -3.7 |
| Total employees, all industries | 32.9 | 4.2 |
Across 34 different occupation groups, the average hourly wage for only five occupations increased more than inflation in 2022.[3] Occupation groups that had above-inflation wage growth include legislative and senior management (13.5 per cent), professional occupations in natural and applied sciences (8.0 per cent), labourers in processing, manufacturing and utilities (8.0 per cent), helpers and labourers and other transport drivers, operators and labourers in trades, transport and equipment operators and related occupations (7.5 per cent), and supervisors, central control and process operators in processing, manufacturing and utilities and aircraft assemblers and inspectors (7.2 per cent).
Figure 4 Several labour market challenges persist
Proportion of long-term job vacancies reached highest on record
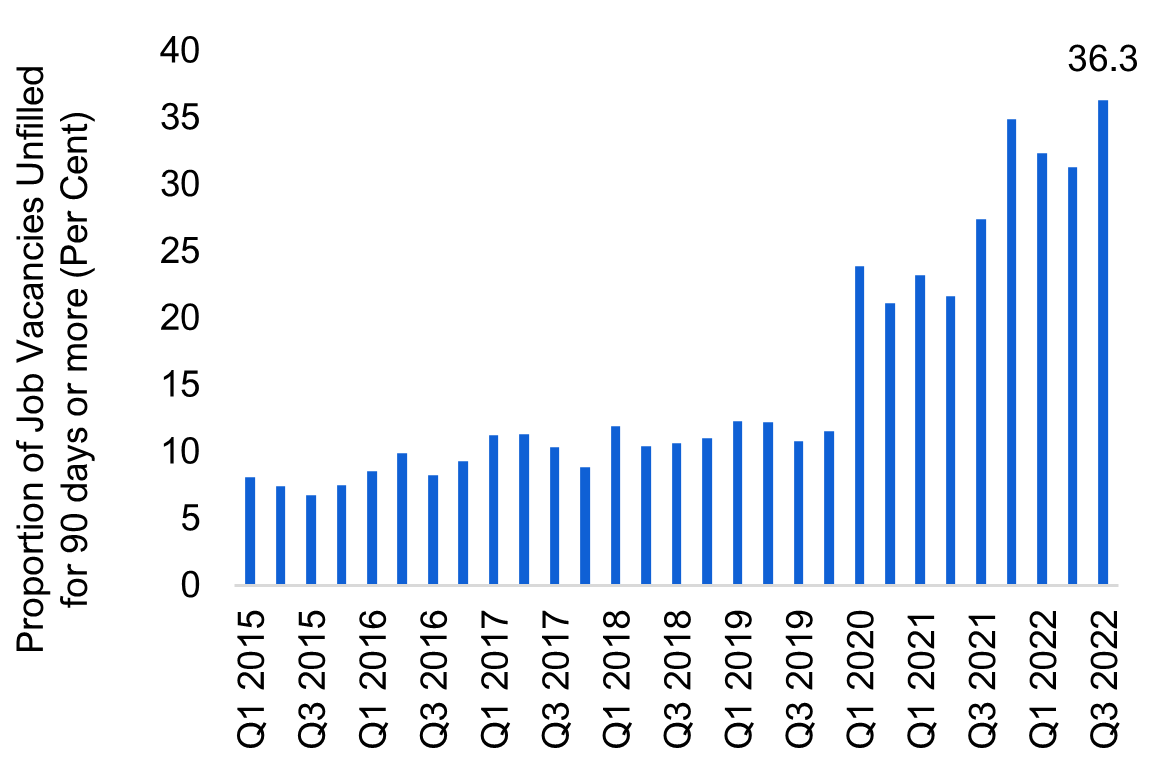
- Long-term job vacancies, defined as positions that remained unfilled for 90 days or more, represented 36.3 per cent of all job vacancies in the third quarter of 2022, the highest share on record.
- Trades, transport and equipment operators and related occupations and health occupations had the highest proportion of vacancies unfilled for 90 days or more. Close to half the job vacancies in trades, transport and equipment operators and related occupations remained unfilled for 90 days or longer as of the third quarter of 2022.
- Long-term job vacancies can impact businesses by decreasing production, creating additional costs, and causing backlogs, among other challenges.[4]
Record proportion of employees absent due to illness or disability
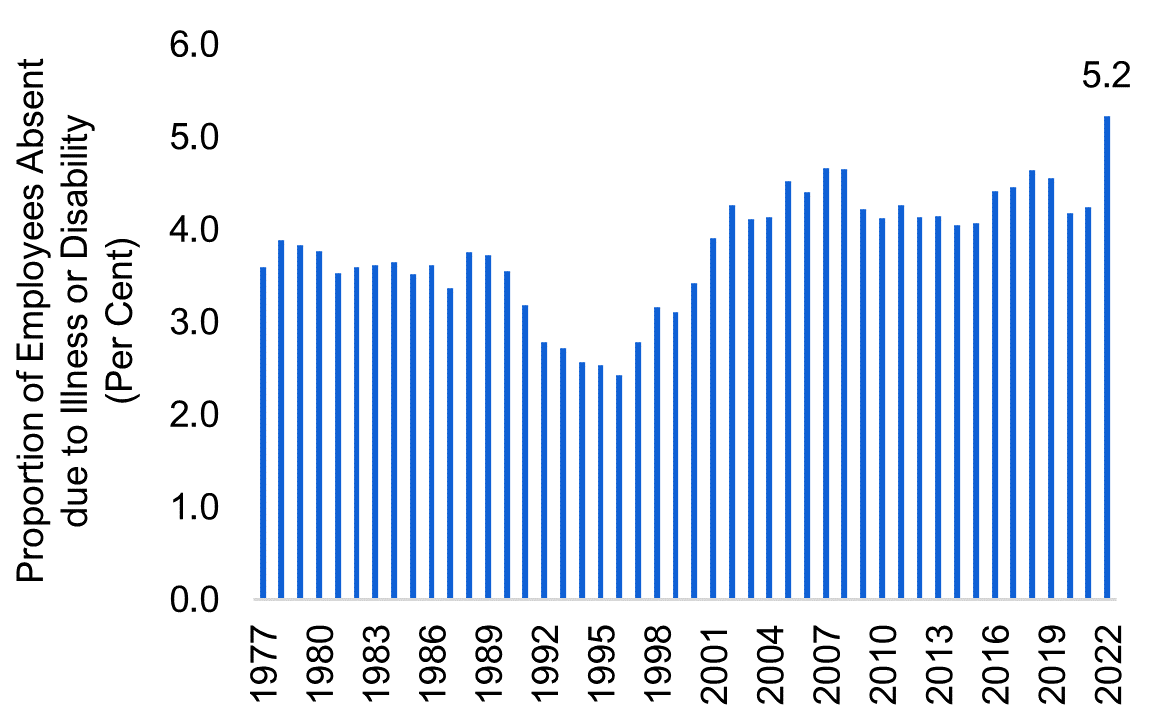
- With most pandemic-related restrictions more fully lifted, the share of Ontario employees who were absent either a full week or part of a week due to illness or disability reached 5.2 per cent in 2022, the highest on record.
- Overall, nearly 404,100 employees were absent either a full week or part of a week in 2022 due to illness or disability, a 22.2 per cent increase over the 2017-2019 average.
- Increased absence due to illness could reduce business operations and contribute to additional labour market tightness and wage pressure as employers might be forced to recruit additional workers.[5]
Employment in some industries not recovered from pandemic
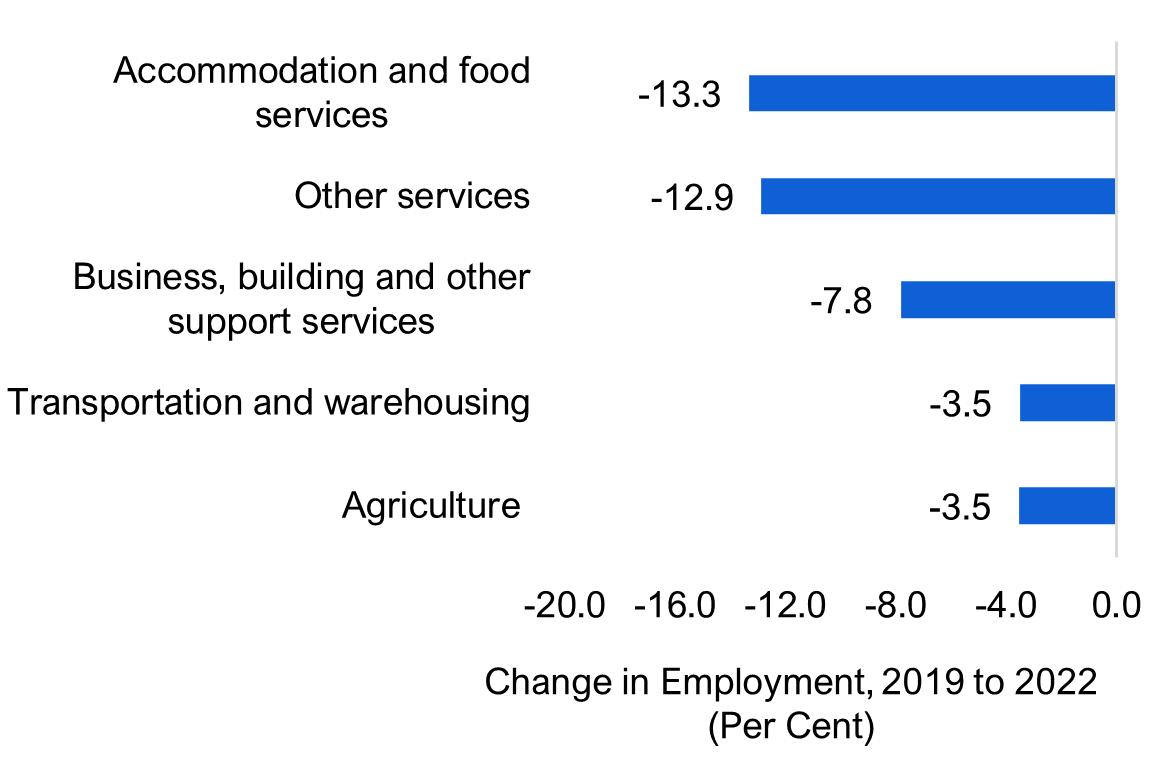
- Five out of 16 industries operated with fewer employees in 2022 compared to before the pandemic in 2019, including other services, accommodation and food services, agriculture, business, building and other support services, and transportation and warehousing. Collectively, the share of these industries in total employment has dropped from 20.5 per cent to 17.9 per cent over the period.
- As of the third quarter of 2022, overall job vacancies in these sectors represented nearly 31.4 per cent of all vacancies in Ontario, substantially higher than their share of employment.
- With demand for labour strong across most sectors, workers may be migrating away from lower-paying jobs in favour of employment openings that offer higher wages, regular hours and more comprehensive benefits.
Source: Statistics Canada and FAO.
Accessible version
| Proportion of Job Vacancies Unfilled for 90 days or more (Per Cent) | |
|---|---|
| Q1 2015 | 8.1 |
| Q2 2015 | 7.4 |
| Q3 2015 | 6.7 |
| Q4 2015 | 7.5 |
| Q1 2016 | 8.5 |
| Q2 2016 | 9.9 |
| Q3 2016 | 8.2 |
| Q4 2016 | 9.3 |
| Q1 2017 | 11.2 |
| Q2 2017 | 11.3 |
| Q3 2017 | 10.3 |
| Q4 2017 | 8.8 |
| Q1 2018 | 11.9 |
| Q2 2018 | 10.4 |
| Q3 2018 | 10.6 |
| Q4 2018 | 11 |
| Q1 2019 | 12.3 |
| Q2 2019 | 12.2 |
| Q3 2019 | 10.8 |
| Q4 2019 | 11.5 |
| Q1 2020 | 23.9 |
| Q4 2020 | 21.1 |
| Q1 2021 | 23.2 |
| Q2 2021 | 21.6 |
| Q3 2021 | 27.4 |
| Q4 2021 | 34.9 |
| Q1 2022 | 32.3 |
| Q2 2022 | 31.3 |
| Q3 2022 | 36.3 |
| Proportion of Employees Absent Due to Illness or Disability (Per Cent) | |
| 1976 | 3.8 |
| 1977 | 3.6 |
| 1978 | 3.9 |
| 1979 | 3.8 |
| 1980 | 3.8 |
| 1981 | 3.5 |
| 1982 | 3.6 |
| 1983 | 3.6 |
| 1984 | 3.6 |
| 1985 | 3.5 |
| 1986 | 3.6 |
| 1987 | 3.4 |
| 1988 | 3.8 |
| 1989 | 3.7 |
| 1990 | 3.6 |
| 1991 | 3.2 |
| 1992 | 2.8 |
| 1993 | 2.7 |
| 1994 | 2.6 |
| 1995 | 2.5 |
| 1996 | 2.4 |
| 1997 | 2.8 |
| 1998 | 3.2 |
| 1999 | 3.1 |
| 2000 | 3.4 |
| 2001 | 3.9 |
| 2002 | 4.3 |
| 2003 | 4.1 |
| 2004 | 4.1 |
| 2005 | 4.5 |
| 2006 | 4.4 |
| 2007 | 4.7 |
| 2008 | 4.7 |
| 2009 | 4.2 |
| 2010 | 4.1 |
| 2011 | 4.3 |
| 2012 | 4.1 |
| 2013 | 4.1 |
| 2014 | 4.0 |
| 2015 | 4.1 |
| 2016 | 4.4 |
| 2017 | 4.5 |
| 2018 | 4.6 |
| 2019 | 4.6 |
| 2020 | 4.2 |
| 2021 | 4.2 |
| 2022 | 5.2 |
| Industry | Change in Employment, 2019 to 2022 (Per Cent) |
| Agriculture | -3.5 |
| Transportation and warehousing | -3.5 |
| Business, building and other support services | -7.8 |
| Other services | -12.9 |
| Accommodation and food services | -13.3 |
Appendix
| National Occupational Classification (NOC) | Average Hourly Wage Rate, 2022 ($) | Annual Change in Average Hourly Wage Rate (Per Cent) |
|---|---|---|
| Management occupations | 56.6 | 4.5 |
| Legislative and senior management occupations | 87.5 | 13.5 |
| Specialized middle management occupations | 59.8 | 4.9 |
| Middle management occupations in retail and wholesale trade and customer services | 45.4 | 5.3 |
| Middle management occupations in trades, transportation, production and utilities | 49.7 | 2.3 |
| Business, finance and administration occupations, except management | 32.5 | 3.0 |
| Professional occupations in finance and business | 41.7 | 3.1 |
| Administrative and financial supervisors and specialized administrative occupations | 33.1 | 0.2 |
| Administrative occupations and transportation logistics occupations | 28.7 | 2.6 |
| Administrative and financial support and supply chain logistics occupations | 24.1 | 3.7 |
| Natural and applied sciences and related occupations, except management | 43.4 | 6.2 |
| Professional occupations in natural and applied sciences | 47.8 | 8.0 |
| Technical occupations related to natural and applied sciences | 33.5 | 2.1 |
| Health occupations, except management | 33.4 | 4.1 |
| Professional occupations in health | 42.3 | 3.1 |
| Technical occupations in health | 32.4 | 3.0 |
| Assisting occupations in support of health services | 23.2 | 3.3 |
| Occupations in education, law and social, community and government services, except management | 39.0 | 2.2 |
| Professional occupations in law, education, social, community and government services | 44.1 | 2.3 |
| Front-line public protection services and paraprofessional occupations in legal, social, community, education services | 30.8 | 2.9 |
| Assisting occupations in education and in legal and public protection | 27.5 | 2.7 |
| Care providers and public protection support occupations and student monitors, crossing guards and related occupations | 20.9 | 2.6 |
| Occupations in art, culture, recreation and sport, except management | 28.4 | -5.1 |
| Professional occupations in art and culture | 34.8 | -3.0 |
| Technical occupations in art, culture and sport | 33.2 | 3.6 |
| Occupations in art, culture and sport | 24.5 | -12.1 |
| Support occupations in art, culture and sport | 20.0 | -1.3 |
| Sales and service occupations, except management | 21.5 | 1.7 |
| Retail sales and service supervisors and specialized occupations in sales and services | 27.2 | -2.3 |
| Occupations in sales and services | 24.8 | 0.7 |
| Sales and service representatives and other customer and personal services occupations | 22.4 | 2.0 |
| Sales and service support occupations | 17.6 | 6.3 |
| Trades, transport and equipment operators and related occupations, except management | 29.6 | 4.0 |
| Technical trades and transportation officers and controllers | 34.4 | 4.0 |
| General trades | 26.8 | 4.7 |
| Mail and message distribution, other transport equipment operators and related maintenance workers | 26.3 | 3.6 |
| Helpers and labourers and other transport drivers, operators and labourers | 22.8 | 7.5 |
| Natural resources, agriculture and related production occupations, except management | 24.5 | 4.1 |
| Supervisors and occupations in natural resources, agriculture and related production | 35.6 | 0.0 |
| Workers and labourers in natural resources, agriculture and related production | 21.4 | 6.4 |
| Occupations in manufacturing and utilities, except management | 25.6 | 6.1 |
| Supervisors, central control and process operators in processing, manufacturing and utilities and aircraft assemblers and inspectors | 36.8 | 7.2 |
| Machine operators, assemblers and inspectors in processing, manufacturing and printing | 23.3 | 5.4 |
| Labourers in processing, manufacturing and utilities | 20.7 | 8.0 |
| Total employees, all occupations | 32.9 | 4.2 |
Footnotes
[1] Other services include industries related to repair and maintenance of motor vehicles, machinery and equipment, and other products, personal care services, funeral services, laundry services, and other services to individuals, religious, grant-making, civic, and professional and similar organizations, as well as private households engaged in employing workers such as cooks, maids, gardeners or caretakers, and babysitting. For details, see North American Industry Classification System (NAICS) Canada 2017 Version 3.0.
[2] Job vacancy rate is defined as the number of job vacancies expressed as a percentage of labour demand, that is, all occupied and vacant jobs.
[3] See Appendix for details.
[4] See Long-term job vacancies in Canada.
[5] See In sickness and in “health”: Canada’s labour market.