

Ontario’s strong 2019 labour market performance
Ontario’s labour market performed strongly in 2019, posting the largest increase in the level of employment on record. The annual unemployment rate remained at 5.6 per cent, unchanged from 2018, but the lowest rate since 1989. The strength in job creation was accompanied by sustained growth in average wages, and an increase in the proportion of Ontarians participating in the workforce for only the second time in the past 10 years.
However, Ontario’s labour market continues to face important challenges, including an uneven distribution of labour market gains across the province’s communities, a surge in self-employment which can be precarious, and a decline in average hours worked per employee, partially reflecting rising part-time employment.
Largest annual job gain on record, led by private sector
Ontario’s economy created a strong 210,000 net new jobs in 2019, the largest increase in the level of employment on record.[1] Despite the strong pace of job creation, the annual unemployment rate held steady at 5.6 per cent, as a relatively large number of people entered the labour market looking for work.
Strong employment gains, but the unemployment rate held steady in 2019

Source: Statistics Canada and FAO.
Accessible Version
This graph shows Ontario’s net employment change and unemployment rate from 2000 to 2019. Employment grew in 2019 by +210,200 positions, the largest increase in the level of employment on record. The graph shows a continued decline in the annual unemployment rate since 2009, reaching 5.6 per cent in 2019, unchanged from 2018.
Employment gains in 2019 were driven by strong increases in both full-time jobs (157,000, +2.7 per cent) and part-time jobs (53,000, +4.0 per cent). Job creation was concentrated in the private sector (123,000, +2.6 per cent) and self-employment (78,000, +7.0 per cent), which recorded its largest increase in level of employment since 1997. In contrast, public sector employment rose by only 9,000 new jobs in 2019 (+0.7 per cent), reflecting ongoing provincial government spending restraint.
The service sector accounted for the bulk of Ontario’s job creation last year, with employment rising by 196,000, the largest annual gain on record. Within the service sector, job creation was particularly strong in health care and social assistance (54,000, +6.4 per cent) and professional, scientific and technical services (45,000, +7.1 per cent). The goods-producing sector created just 15,000 net new jobs last year, with gains concentrated in construction (18,000, +3.4 per cent) and agriculture (5,000, +7.2 per cent). Manufacturing jobs declined by 6,500 in 2019, marking the second consecutive year of lower employment.
Highest wage growth since 2008
Average hourly wages (for all workers) increased by a solid 3.6 per cent to $28.34 in 2019, marking the strongest wage growth since 2008. After adjusting for the impact of consumer price inflation, Ontario’s average hourly wage increased by 1.7 per cent.
Solid wage growth sustained for two consecutive years

Source: Statistics Canada and FAO.
Accessible Version
This graph shows nominal growth in average hourly wages for all workers from 2000 to 2019. Wages increased sharply by 3.6 per cent in 2019, the largest increase since 2008.
Solid wage gains were recorded in professional, scientific, and technical services (+5.8 per cent), manufacturing (+5.7 per cent), and construction (+5.5 per cent). In contrast, workers in the broader public sector recorded more modest wage gains. For example, wages for health care and social assistance workers increased by just 0.5 per cent on average, while average education sector wages increased by 1.7 per cent.
For lower-wage workers, average wage gains moderated in 2019, after strong increases in 2018 that were boosted by the significant rise in Ontario’s minimum wage. For example, young workers (ages 15-24), who are more likely to be employed in minimum wage jobs, saw an average wage gain of 6.0 per cent in 2019, following a 10.5 per cent surge in 2018. Part-time workers recorded average wage gains of 2.3 per cent in 2019, following an increase of 6.4 per cent in 2018, while accommodation and food service workers received an average wage increase of 3.0 per cent in 2019, down from 9.9 per cent in 2018.
Wages for female workers increased by 3.8 per cent in 2019, outpacing a 3.3 per cent rise for male workers, and marking the third consecutive year of a declining gender wage gap.
Strong demand for labour supported solid average hourly wage growth

Source: Statistics Canada and FAO.
Accessible Version
This group of three charts shows nominal average hourly wage growth in 2018 and 2019 for three groups: age, part-time or full-time job status, and sex. Among the various age categories, young workers aged 15 to 24 years experienced 6.0 per cent wage growth in 2019, compared to 10.5 per cent wage growth in 2018. Wages of core aged workers (25-54 years) increased by 3.6 per cent in 2019, up from 3.1 per cent in 2018. Wages of older workers aged 55 years and over increased by 2.5 per cent in 2019, up from 2.2 per cent in 2018.
Wages for Full-time workers increased by 3.7 per cent in 2019, up from 2.9 per cent in 2018. Wages for part-time workers increased 2.3 per cent in 2019, down from 6.4 per cent in 2018.
Wages of male workers increased by 3.3 per cent in 2019, up from 2.9 per cent in 2018. Wages of female workers increased by 3.8 per cent in 2019, down from 4.4 per cent in 2018.
Ontario’s workforce participation rate increased in 2019
With healthy employment and wage growth, the proportion of Ontarians choosing to participate in the workforce increased to 65.1 per cent in 2019, up from 64.5 per cent in the previous year. This marked only the second increase in the overall labour force participation rate in the past 10 years. The rise in the participation rate was observed among all major age groups. For young workers (15-24 years), the participation rate increased to 61.3 per cent in 2019, up strongly from 60.2 per cent in 2018. Among core age workers (25-54 years), the participation rate increased to 86.3 per cent in 2019, up from 85.6 per cent in 2018, and the highest rate since 2013.
Labour force participation rate for older workers reached historical high

Source: Statistics Canada and FAO.
Accessible Version
This graph shows the labour force participation rate for older workers from 1976 to 2019. The labour force participation rate for older workers reached 38.7 per cent in 2019, the highest on record.
The most notable increase in the labour force participation rate was for older workers (55 years and over), with the rate reaching 38.7 per cent, the highest on record. The decision by an increasing proportion of older Ontarians to remain in the workforce longer has been an important trend in the Ontario labour market since the late 1990s. Research has indicated that this trend reflects several factors including the rising educational attainment of older workers, the shift of employment towards less physically demanding jobs in the service sector, economic circumstances and improvements in health outcomes.[2]
Despite the improvements, Ontario still trails most other provinces in labour force participation rates, including core-age workers. In 2019, the labour force participation rate for core-age Ontario women increased to 82.1 per cent from 81.5 per cent in the previous year but was third lowest among the provinces. In sharp contrast, the participation rate of core-age Quebec women was 86.9 per cent in 2019, about five percentage points higher than in Ontario.[3]
Labour force participation rates for Ontario adults among the lowest in Canada

Source: Statistics Canada and FAO.
Accessible Version
This graph shows a set of charts displaying the labour force participation rate of core age males and females in Ontario compared to all other provinces in 2019. The participation rate of adult males was 90.6 per cent in Ontario, the fifth lowest among provinces and lower than the Canadian average of 91.3 per cent. The participation rate of adult females was the third lowest in Ontario at 82.1 per cent, lower than the Canadian average of 83.6 per cent and significantly lower than Quebec’s participation rate of 86.9 per cent.
The participation rate of core-age Ontario men was 90.6 per cent in 2019, up from 89.7 per cent in 2018. However, Ontario’s core-age male participation rate was fifth lowest among the provinces.
Challenges remain in Ontario’s labour market
Although Ontario’s labour market posted significant improvements in 2019, several ongoing challenges remain.
Uneven regional distribution of job gains
Source: Statistics Canada and FAO.
Accessible version
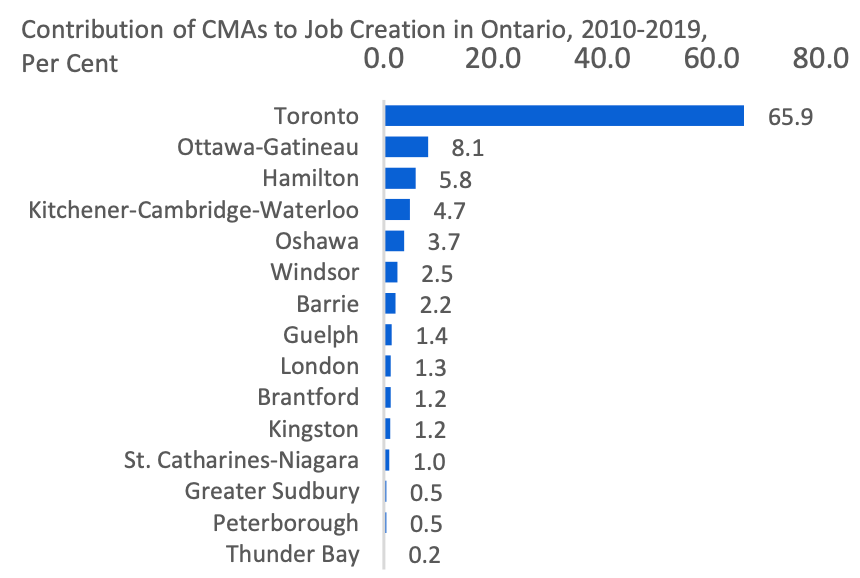
This graph shows the contribution of fifteen Census Metropolitan Areas (CMAs) to overall job creation in Ontario from 2010 to 2019. Toronto accounted for 65.9 per cent of the job creation in Ontario, followed by Ottawa-Gatineau (8.1 per cent), Hamilton (5.8 per cent), Kitchener-Cambridge-Waterloo (4.7 per cent), Oshawa (3.7 per cent), Windsor (2.5 per cent), Barrie (2.2 per cent), Guelph (1.4 per cent), London (1.3 per cent), Brantford (1.2 per cent), Kingston (1.2 per cent), St. Catharines-Niagara (1.0 per cent), Greater Sudbury (0.5 per cent), Peterborough (0.5 per cent), and Thunder Bay (0.2 per cent).
- Despite the strong job gains in 2019, five out 15 Census Metropolitan Areas (CMAs) in Ontario saw a drop in employment, with the largest declines in Peterborough, Thunder Bay, and St. Catharines-Niagara.
- Since the 2008-2009 recession, most of Ontario’s job gains have been concentrated in large CMAs, in particular Toronto. From 2010 to 2019, Toronto accounted for almost two-thirds (65.9 per cent) of the job creation in Ontario, higher than its share of population.
- The concentration of job creation within the major CMAs highlights the challenge of economic diversification among Ontario’s regions. Many CMAs are highly dependent on goods-producing industries such as manufacturing, which have struggled because of increasing global competition.
Increasing share of individual self-employment
Source: Statistics Canada and FAO.
Accessible version
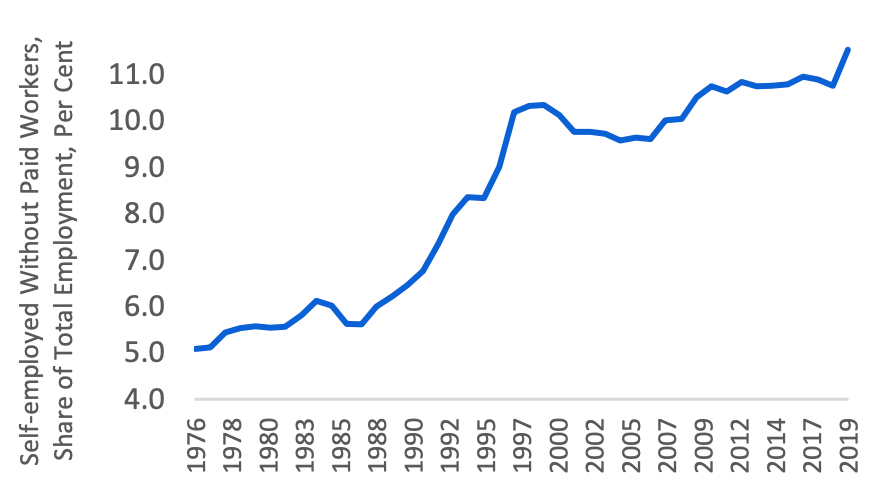
This graph shows the share of self-employed individuals without paid workers in total employment in Ontario from 1976 to 2019. The share of self-employed individuals without paid workers has been trending upward. In 2019, the share reached 11.5 per cent, the highest on record.
- Self-employed individuals without paid workers rose by 80,000 jobs (+10.3 per cent) in 2019, the largest on record and accounting for nearly two out of every five new jobs created in Ontario. As a result, the share of this category of self-employed in total employment rose to 11.5 per cent, the highest on record.
- Growth in individual self-employment was driven by workers in construction (19,400, +21.0 per cent) and transportation and warehousing (19,200, +26.2 per cent).
- Researchers view self-employed individuals without paid workers as a more precarious type of employment, lacking the security that comes with standard work arrangements.[4]
Average actual hours worked declining
Source: Statistics Canada and FAO.
Accessible version
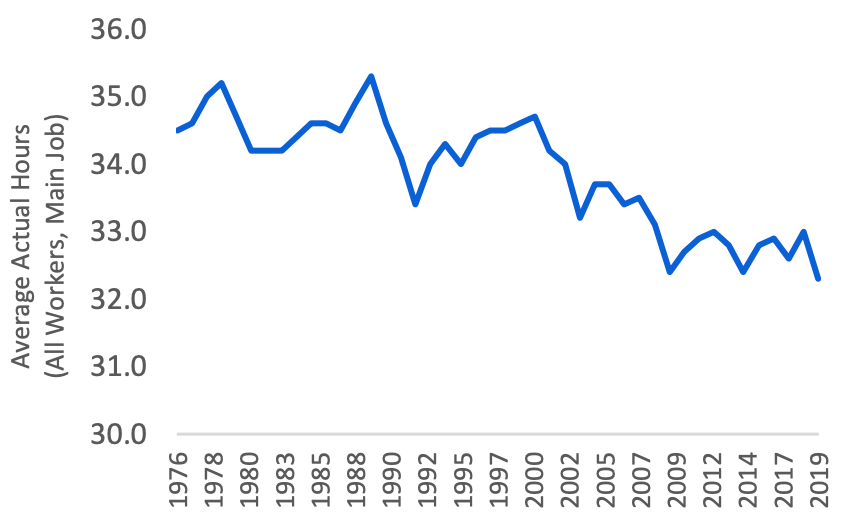
This graph shows the average actual hours worked (all workers, main job) per week in Ontario from 1976 to 2019. The average actual hours worked per week has been trending down and reached 32.3 hours in 2019, the lowest since 1976.
- In 2019, Ontarians worked 32.3 hours on average per week, the lowest on record.
- Average actual hours among paid employees declined across most industries, with the largest declines in health care and social assistance (-3.3 per cent), public administration (-3.0 per cent), and wholesale and retail trade (-2.9 per cent).
- The decline in average hours worked in 2019 partially reflects the rising share of part-time employees in the workforce. It also helps to explain why the increase in employment (+2.9 per cent) last year outpaced the estimated growth in real economic output (+1.7 per cent) by a substantial amount.[5]
Footnotes
[1] All labour market statistics in this note are taken from Statistics Canada’s Labour Force Survey (LFS) and reported on an average annual basis. The current LFS began in 1976.
[2] For details, see Employment and Social Development Canada (2018), Promoting the labour force participation of older Canadians – Promising initiatives.
[3] For a discussion on Ontario’s relatively low labour force participation rate for core-age women, see the FAO report: Child care in Ontario: A review of Ontario’s new child care tax credit.
[4] For a detailed discussion on self-employment, see OECD (2017), Is self-employment quality work?, in The Missing Entrepreneurs 2017: Policies for Inclusive Entrepreneurship and Olena Kostyshyna, C. L. (2019), The Size and Characteristics of Informal (“Gig”) Work in Canada.