


To the view the Distribution Illustrator click here.
1. Highlights
- This report analyzes Ontario families’ contributions to provincial government revenues and the benefits they receive from provincial government spending. Using 2019-20 as a representative year, the report estimates how many families were net beneficiaries from provincial government spending and revenue collection, and how many were net contributors.
- Importantly, this report presents the estimated net position for families by using averages for key family characteristics, such as family size and the age of its members. The actual net position for any individual family may differ materially from the results presented in this report, based on that family’s specific characteristics.
The Net Position of Ontario Families
- The FAO estimates that in 2019-20, Ontario’s 6.5 million families[1] contributed an average of $23,426 in revenue to the Province and received an average of $24,272 in services or payments, resulting in an average net benefit of $846 per family.
- Although the average family in Ontario received a net benefit from the provincial government, there was a wide variation across families. The FAO estimates that:
- 60 per cent of Ontario families, or 3.9 million families, received more in government services and payments than they contributed in revenue to the Province (“net beneficiaries”);
- 20 per cent of Ontario families, or 1.3 million families, received approximately the same amount in government services and payments as they contributed in revenue to the provincial government (a “net neutral” position); and
- 20 per cent of Ontario families, or 1.3 million families, contributed more to provincial government revenues than they received back in government services or payments (“net contributors”).
- The net position for each Ontario family differed depending on a variety of factors, the most important of which was the family’s income.[2], [3] By family income, the FAO estimates that:
- families earning less than $76,296 were net beneficiaries in 2019-20;
- families earning between $76,926 and $131,473 were in a net neutral position; and
- families earning $131,474 or more were net contributors.
Net Position as a Share of Family Income
- Ontario families’ net position as a share of family income helps to show the relative impact of provincial government spending and revenue collection. In general, the net benefit as a share of income for lower-income families is more significant than the net contribution as a share of income provided by higher-income families.
- Families in the second and third lowest income deciles[4] received an average net benefit equal to 294 per cent and 70 per cent of family income, respectively, while families in the two highest income deciles had average net contributions equal to eight per cent and 17 per cent of family income, respectively.
Contribution to Provincial Government Revenue
- Ontario families contribute directly to provincial government revenues through the payment of various taxes and fees, and indirectly through federal government transfers to the Province,[5] corporate income tax and other revenue sources.
- Overall, families with higher incomes contributed more to provincial government revenue than lower-income families, with the top 10 per cent of income-earning families contributing more to government revenues than the bottom 70 per cent of families combined. This trend is due to higher-income households generating higher taxable activity (such as income or consumption),[6] and the progressive tax rates of some taxes.[7]
- The FAO estimates that families in the lowest income decile (earning $27 or less) contributed an average of $5,169 to provincial revenue, largely through the Harmonized Sales Tax (HST) and service fees, while families in the highest income decile (earning more than $188,013) contributed an average of $86,142.
Benefit from Provincial Government Spending
- Families receive benefits from the provincial government through services and direct payments, such as health care, public education and child care, social services, income and employment supports, and housing and electricity subsidies.
- The average benefit from provincial services and payments was highest among families with incomes in the top 20 per cent and among families with incomes in the lowest 10 per cent. This trend reflects the objective of many social service and income support programs to target low-income families, as well as the impact of family size and the age of family members on the distribution of spending on health, and on child care, education and postsecondary education programs.
- The FAO estimates that families in the top two income deciles (earning $131,474 or more) received the highest average benefits in 2019-20, at $28,551 and $34,512, respectively, primarily due to their larger average family sizes.[8] Families in the lowest income decile, who earned $27 or less in 2019-20, received the next highest benefits, averaging $26,561, largely from income support programs and social services.
The distribution of Ontario families’ contribution to provincial revenue and benefit from provincial spending by category is also available on the FAO’s website at: https://fao-on.org/en/net-contribution.
2. Introduction
This report analyzes Ontario families’ contributions to provincial government revenues and the benefits they receive from provincial government spending. Using 2019-20 as a representative year, the report estimates how many families were net beneficiaries from provincial government spending and revenue collection, and how many were net contributors. The net position for each Ontario family differs depending on a variety of factors, the most important of which are family income, followed by each family’s size and the age of its members.
Undertaking a distributional analysis of how government revenue collection and spending impacts Ontario families is important because it helps MPPs and the public to understand who pays for, and who benefits from, government programs. This can support a more informed debate regarding the objectives and outcomes of provincial revenue policies and spending programs, including key issues such as fairness, effectiveness and transparency.
Structure of Report
Section 3 of this report shows the results of this study, with an analysis of the average benefit amounts, contribution amounts and overall net position of Ontario families, based on family income. Section 4 examines the distribution of families’ contributions to provincial government revenue in 2019-20 by major revenue source. Section 5 discusses the distribution of provincial government spending among Ontario families in 2019-20 (the benefit to families). Finally, Appendix A includes charts that provide additional context for the FAO’s analysis and Appendix B provides an overview of the methodology and data sources used for the analysis.
Scope of Report
The scope of this report is Ontario’s provincial government revenue and spending for the 2019-20 fiscal year. The report does not evaluate revenue raised or spending by other levels of government. The financial figures used are from the Government of Ontario’s (the Province’s) 2019-20 Public Accounts; however, the FAO excludes estimated revenue collected from and spending on non-residents. Importantly, this report only examines the monetary benefits from and contributions to the government’s finances in a single fiscal year. The report does not assign any further or future value or cost to these contributions or benefits, nor does it assess the objectives or outcomes of the Province’s revenue collection systems or spending programs. Finally, this report presents the estimated net position for families by family income using averages for key family characteristics, such as family size and the age of its members. The actual net position for any individual family may differ materially from the results presented in this report, based on that family’s specific characteristics.
3. The Net Position of Ontario Families
The FAO estimates that in 2019-20, the Province generated $152.9 billion in revenue from Ontario residents through taxation, transfers from the federal government and other sources, and spent $158.4 billion on programs that benefited Ontario families. In that year, Ontario’s 6.5 million families[9] contributed an average of $23,426 in revenue to the Province and received an average of $24,272 in services or payments, resulting in an average net benefit of $846 per family.
Figure 1 Ontario’s 6.5 million families averaged a net benefit from provincial revenue collection and spending in 2019-20

Note: “Families” refers to “couples living together, with or without children, and lone parents living with their children” (Statistics Canada’s definition of a census family) and single persons.
Source: FAO.
More specifically, the FAO estimates that:
- 60 per cent of Ontario families, or 3.9 million families, received more in government services and payments than they contributed in revenue to the Province (referred to in this report as “net beneficiaries”);
- 20 per cent of Ontario families, or 1.3 million families, received approximately the same amount in government services and payments as they contributed in revenue to the provincial government (referred to in this report as in a “net neutral” position); and
- 20 per cent of Ontario families, or 1.3 million families, contributed more to provincial government revenues than they received back in government services or payments (referred to in this report as “net contributors”).
Figure 2 The net position of Ontario families from provincial revenue collection and spending in 2019-20
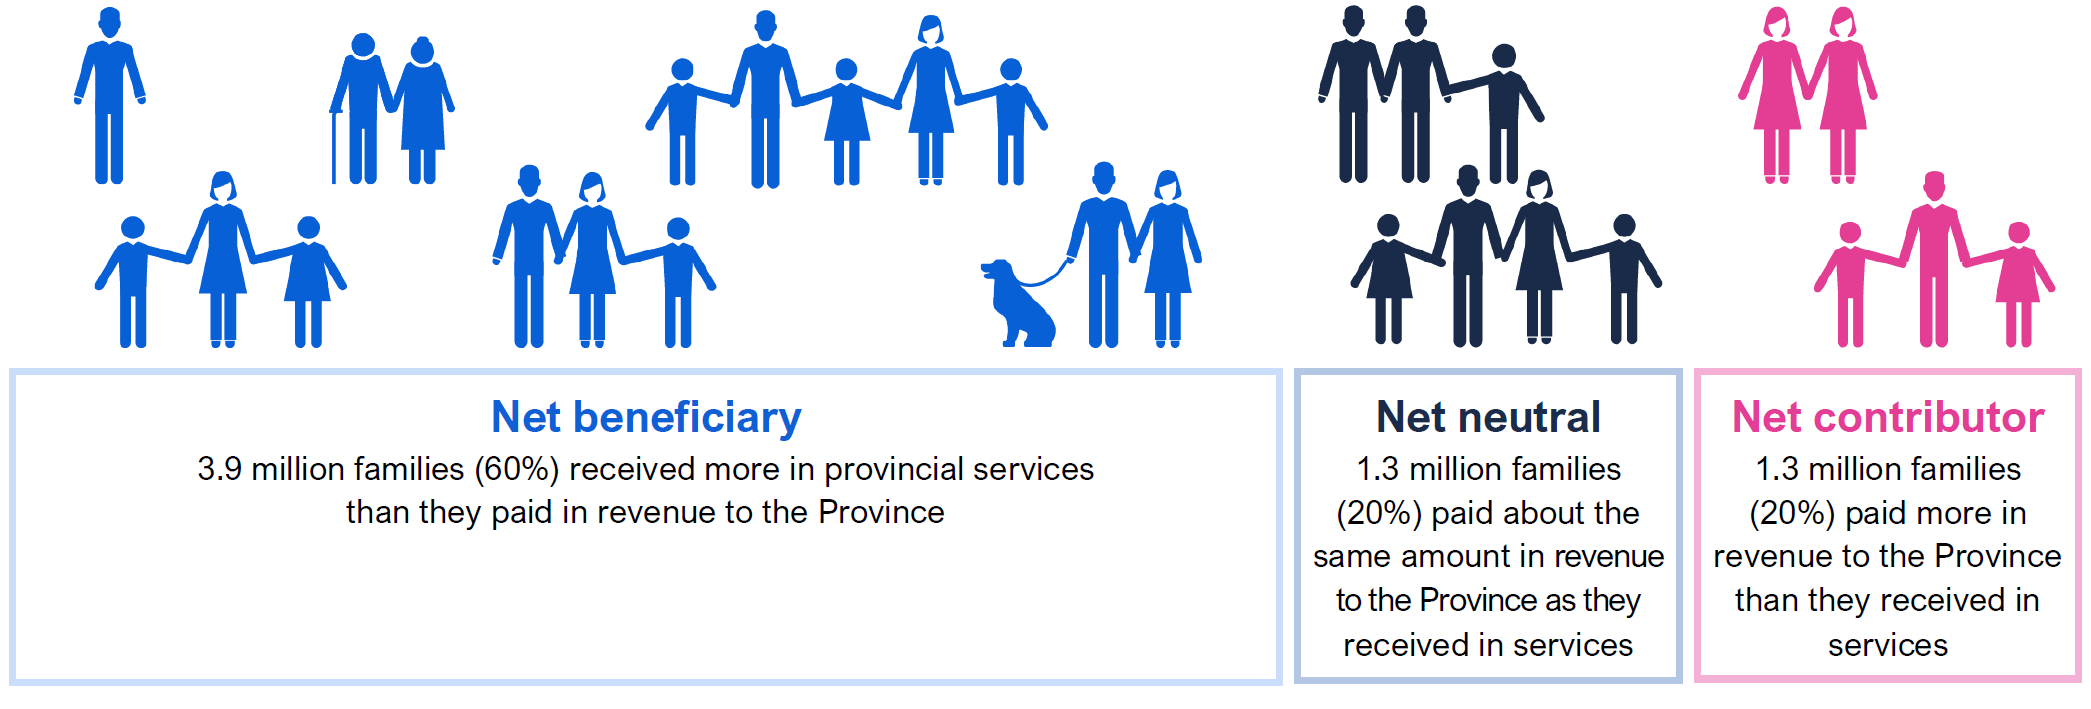
Note: Each family graphic represents 10 per cent of Ontario’s 6.5 million families in 2019-20, or approximately 650,000 families. “Families” refers to “couples living together, with or without children, and lone parents living with their children” (Statistics Canada’s definition of a census family) and single persons.
Source: FAO.
The net position for each Ontario family in 2019-20 differed depending on a variety of factors, the most important of which was the family’s income.[10],[11] On average, the FAO estimates that families earning less than $76,296 were net beneficiaries in 2019-20, families earning between $76,926 and $131,473 were in a net neutral position, and families earning $131,474 or more were net contributors.
Figure 3 The net position of Ontario families from provincial revenue collection and spending in 2019-20, by family income decile
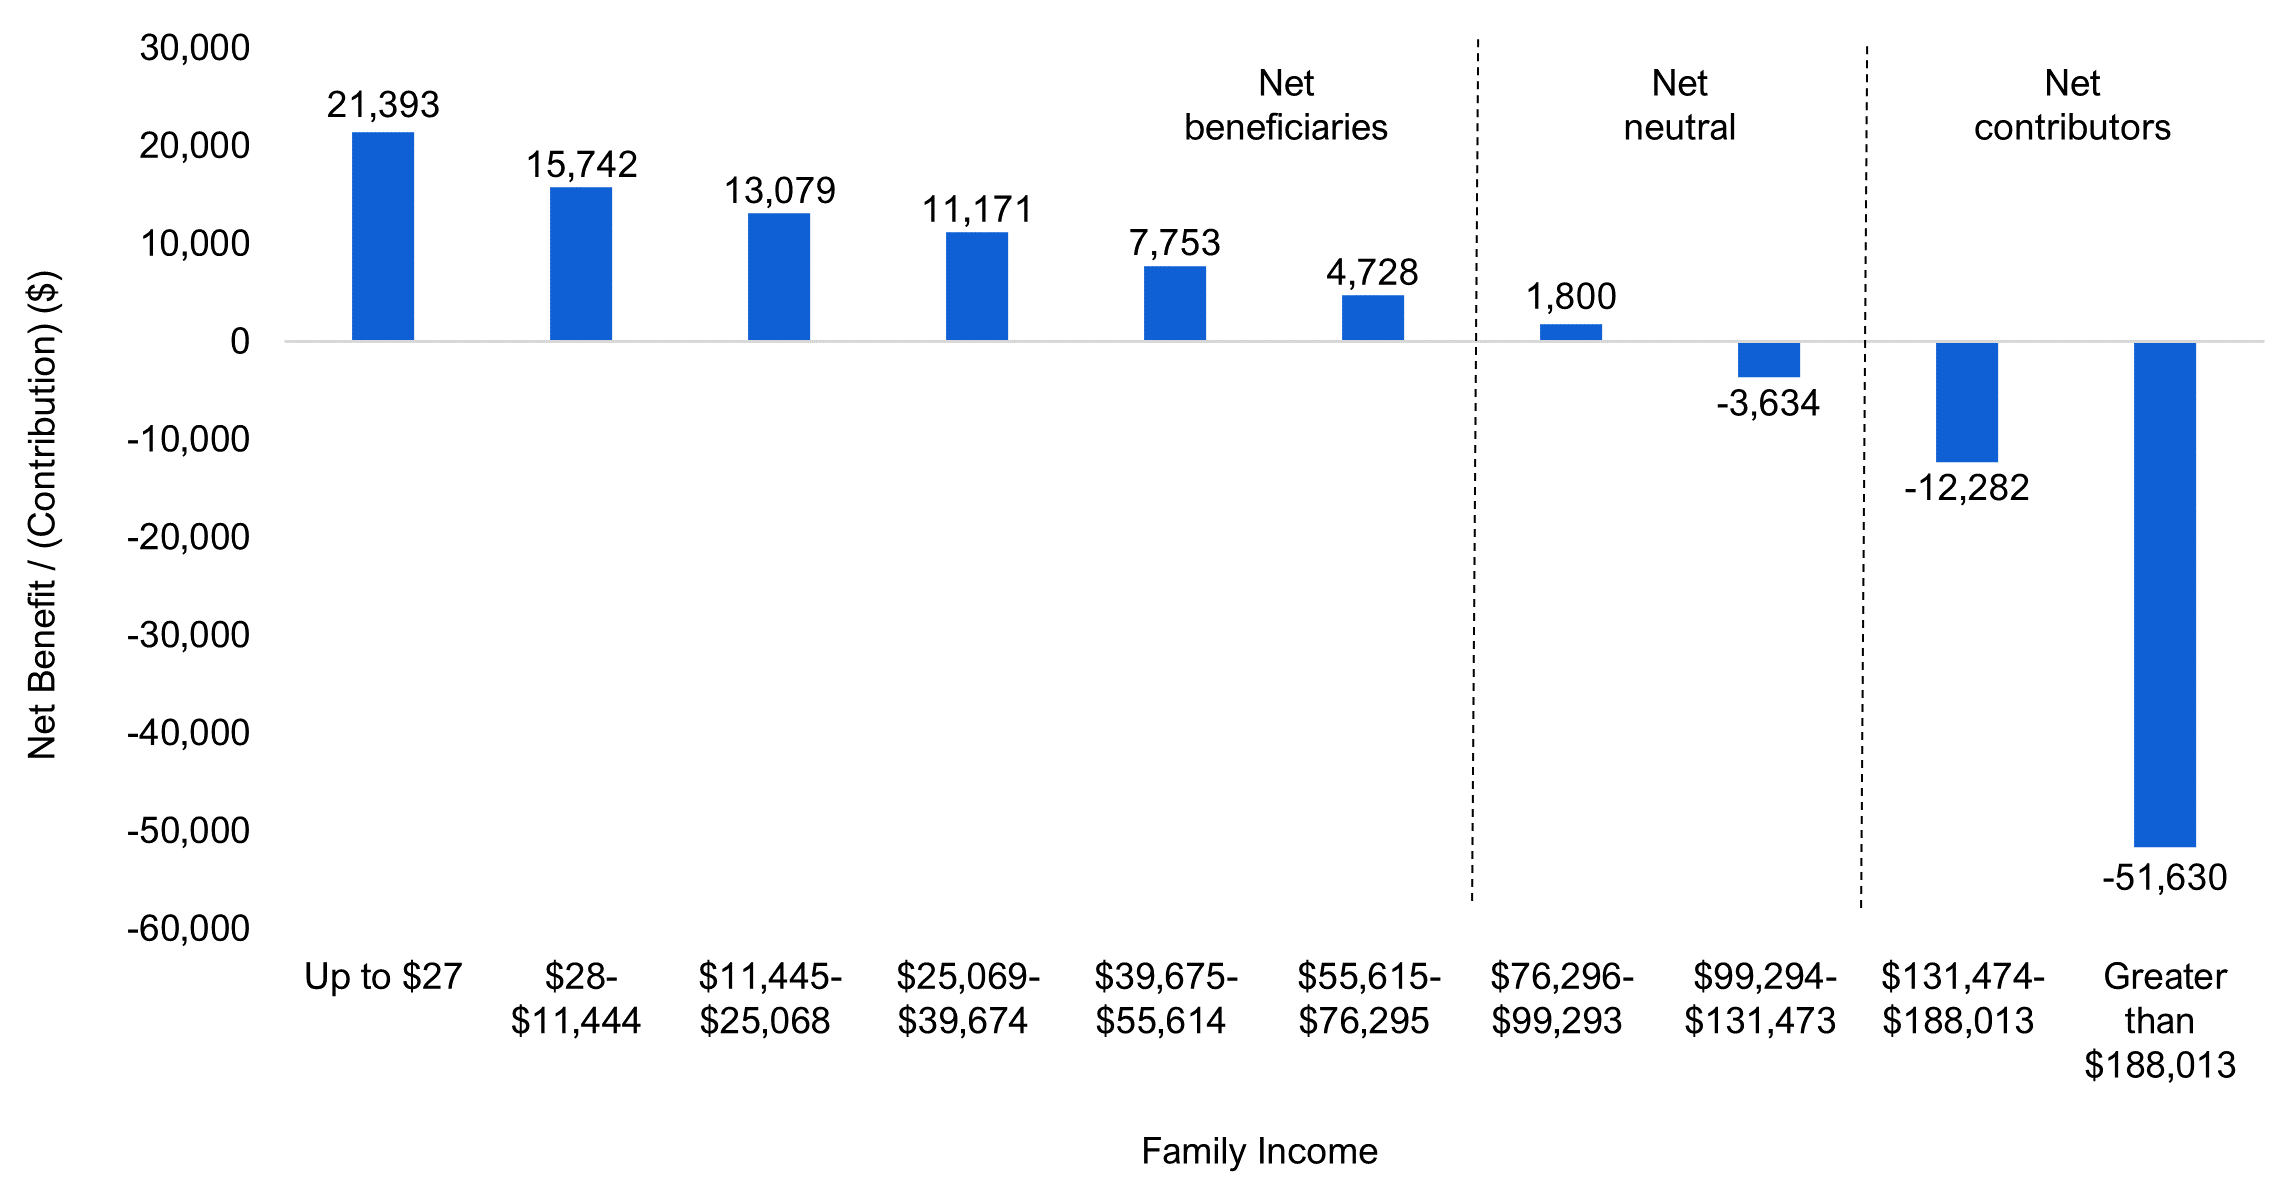
Note: “Family” refers to “couples living together, with or without children, and lone parents living with their children” (Statistics Canada’s definition of a census family) and single persons. “Income” refers to market income, which includes before-tax income generated through employment, investments, retirement pensions and annuities, and excludes income from government transfers. Income deciles reflect equal-sized groups of Ontario families, ordered from lowest to highest income. Each decile contains 10 per cent of Ontario’s 6.5 million families in 2019-20, or approximately 650,000 families.
Source: FAO.
Accessible version
| Family Income | Net Benefit/ (Contribution) ($) |
| Up to $27 | 21,393 |
| $28- $11,444 |
15,742 |
| $11,445- $25,068 |
13,079 |
| $25,069- $39,674 |
11,171 |
| $39,675- $55,614 |
7,753 |
| $55,615- $76,295 |
4,728 |
| $76,296- $99,293 |
1,800 |
| $99,294- $131,473 |
-3,634 |
| $131,474- $188,013 |
-12,282 |
| Greater than $188,013 |
-51,630 |
In 2019-20, families in the lowest income decile,[12] earning up to $27, received the largest net benefit from government spending and revenue collection, at an average of $21,393. As a family’s income increased, the average net benefit amount steadily declined, reaching an average net benefit of $4,728 for families in the sixth income decile (earning between $55,615 and $76,295).
On average, families in the seventh and eighth income deciles (earning between $76,296 and $131,473) were in net neutral positions, meaning these families received approximately as much in government services and payments as they contributed to provincial government revenues. Families in the seventh income decile (earning between $76,296 and $99,293) received an average net benefit of $1,800, while families in the eighth income decile (earning between $99,294 and $131,473) contributed an average of $3,634 per family. The FAO has classified families in the seventh and eighth income deciles as being in a net neutral position because the families’ average net benefit or net contribution were a relatively small portion of family income (see below).
Finally, families in the highest two income deciles (earning over $131,473) were net contributors, averaging net contributions of $12,282 and $51,630, respectively.
Net Position as a Share of Family Income
A review of Ontario families’ net position as a share of family income shows the relative impact of provincial government revenue collection and spending. Families in the bottom six deciles (earning $76,295 or less) received an average net benefit equal to a share of their income that ranged from seven per cent for families in the sixth income decile to 294 per cent for families in the second income decile.[13] Families in the seventh and eighth income deciles (earning between $76,296 and $131,473) were in a net neutral position, with net positions as a share of family income ranging from two per cent to negative three per cent. Finally, families in the top two income deciles (earning more than $131,473) had average net contributions equal to eight per cent and 17 per cent, respectively, of their family income.
Figure 4 Average position as a share of family income in 2019-20, by family income decile
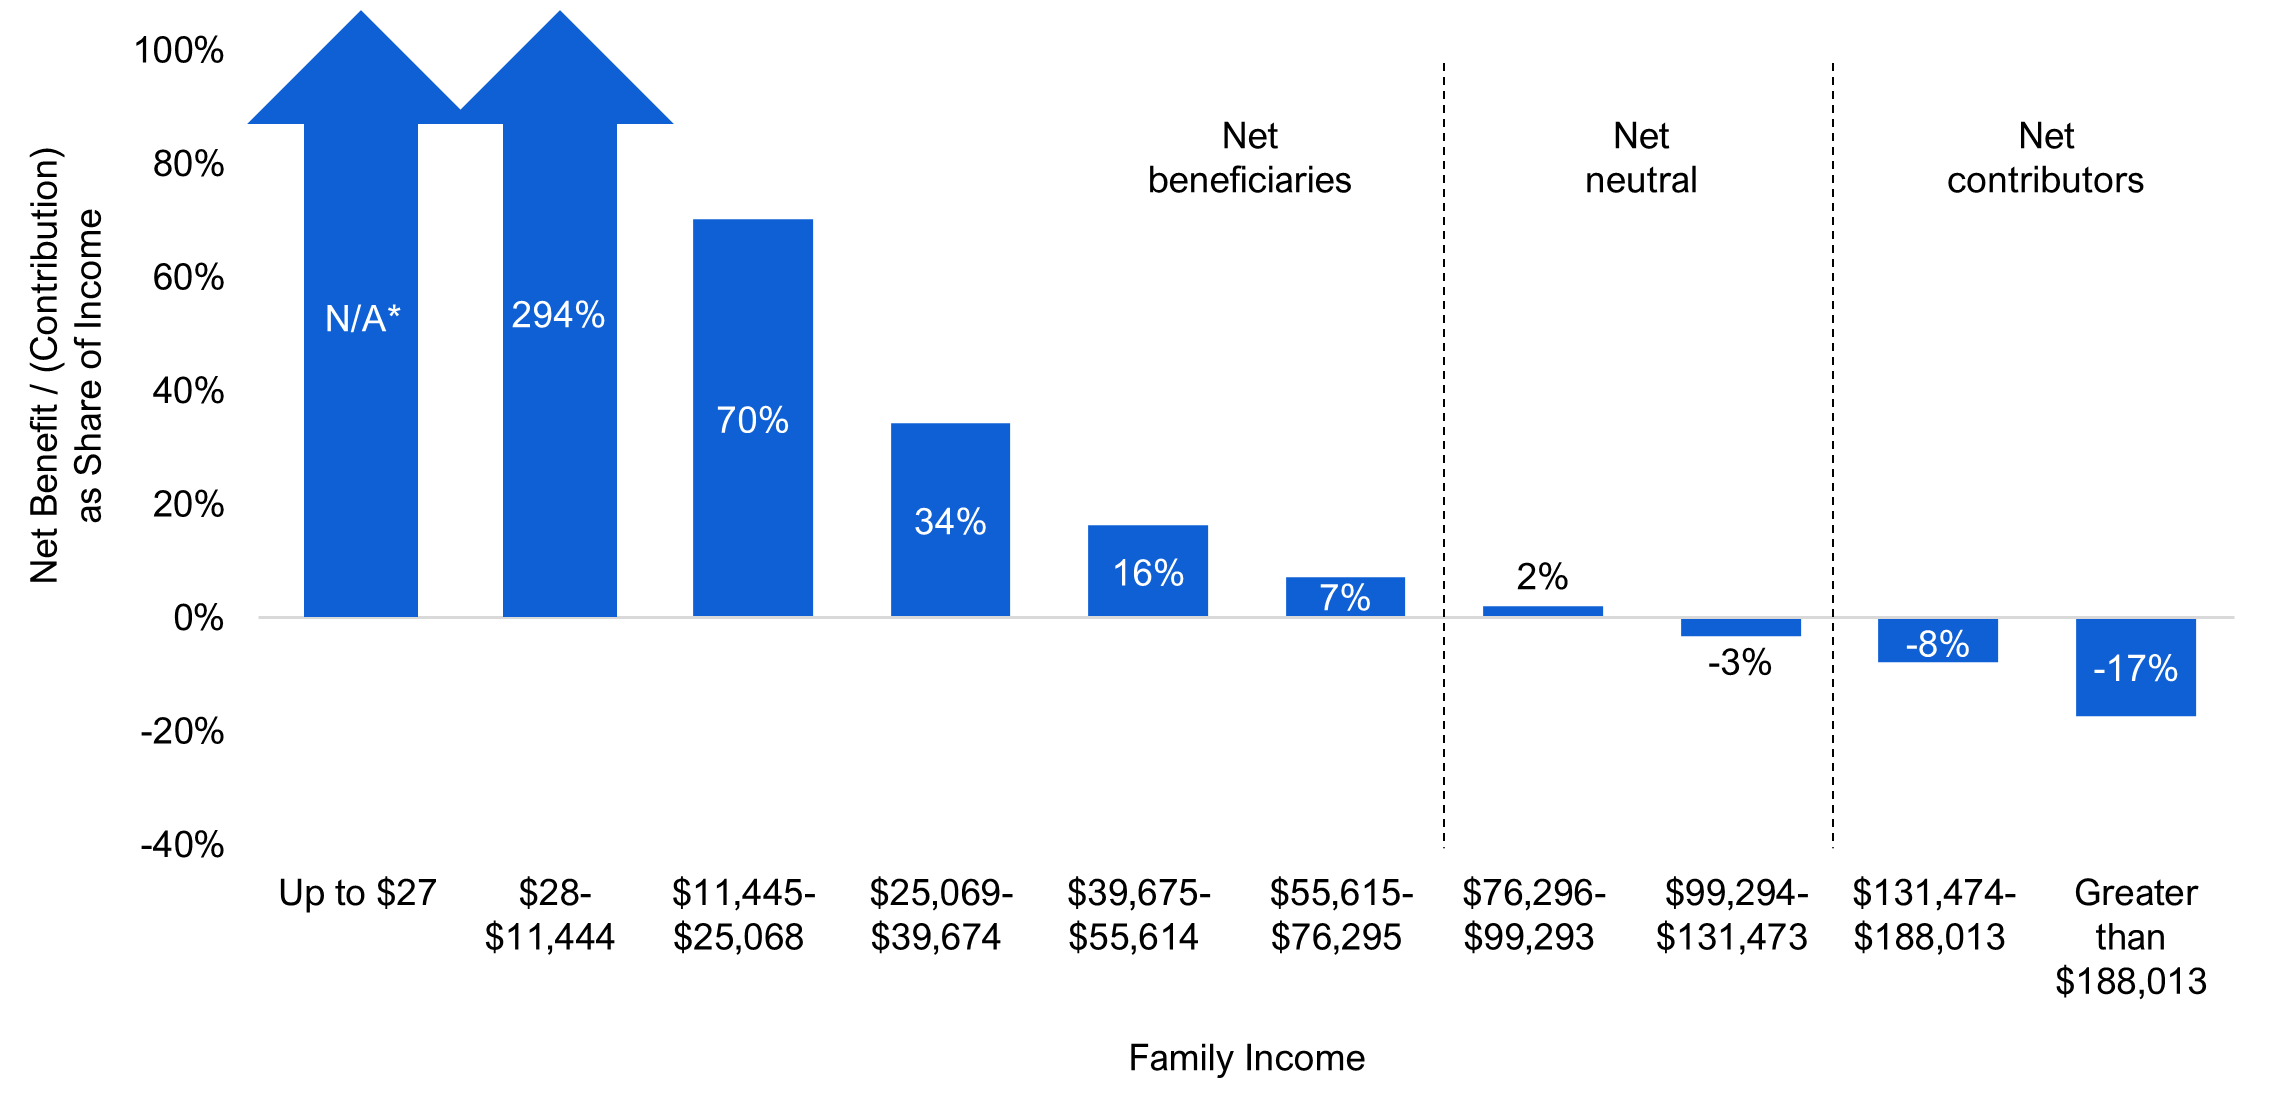
* Many families in the first income decile (with earnings up to $27) earned no market income or may have experienced market income losses. As such, net contribution as a share of income is not calculated for families in this decile.
Note: “Family” refers to “couples living together, with or without children, and lone parents living with their children” (Statistics Canada’s definition of a census family) and single persons. “Income” refers to market income, which includes before-tax income generated through employment, investments, retirement pensions and annuities, and excludes income from government transfers. Income deciles reflect equal-sized groups of Ontario families, ordered from lowest to highest income. Each decile contains 10 per cent of Ontario’s 6.5 million families in 2019-20, or approximately 650,000 families.
Source: FAO.
Accessible version
| Family Income | Net Benefit/ (Contribution) as a Share of Income |
| Up to $27 | N/A* |
| $28- $11,444 |
294% |
| $11,445- $25,068 |
70% |
| $25,069- $39,674 |
34% |
| $39,675- $55,614 |
16% |
| $55,615- $76,295 |
7% |
| $76,296- $99,293 |
2% |
| $99,294- $131,473 |
-3% |
| $131,474- $188,013 |
-8% |
| Greater than $188,013 |
-17% |
Average Benefit and Contribution
The distribution of Ontario families’ net position by income reflects both the distribution of families’ contribution to government revenues and the distribution of benefits from government spending. Figure 5 shows the average benefit and contribution amounts for families in each income decile, and their resulting average net position.
Figure 5 Ontario families’ contribution to provincial revenue and benefit from provincial spending by income decile, 2019-20
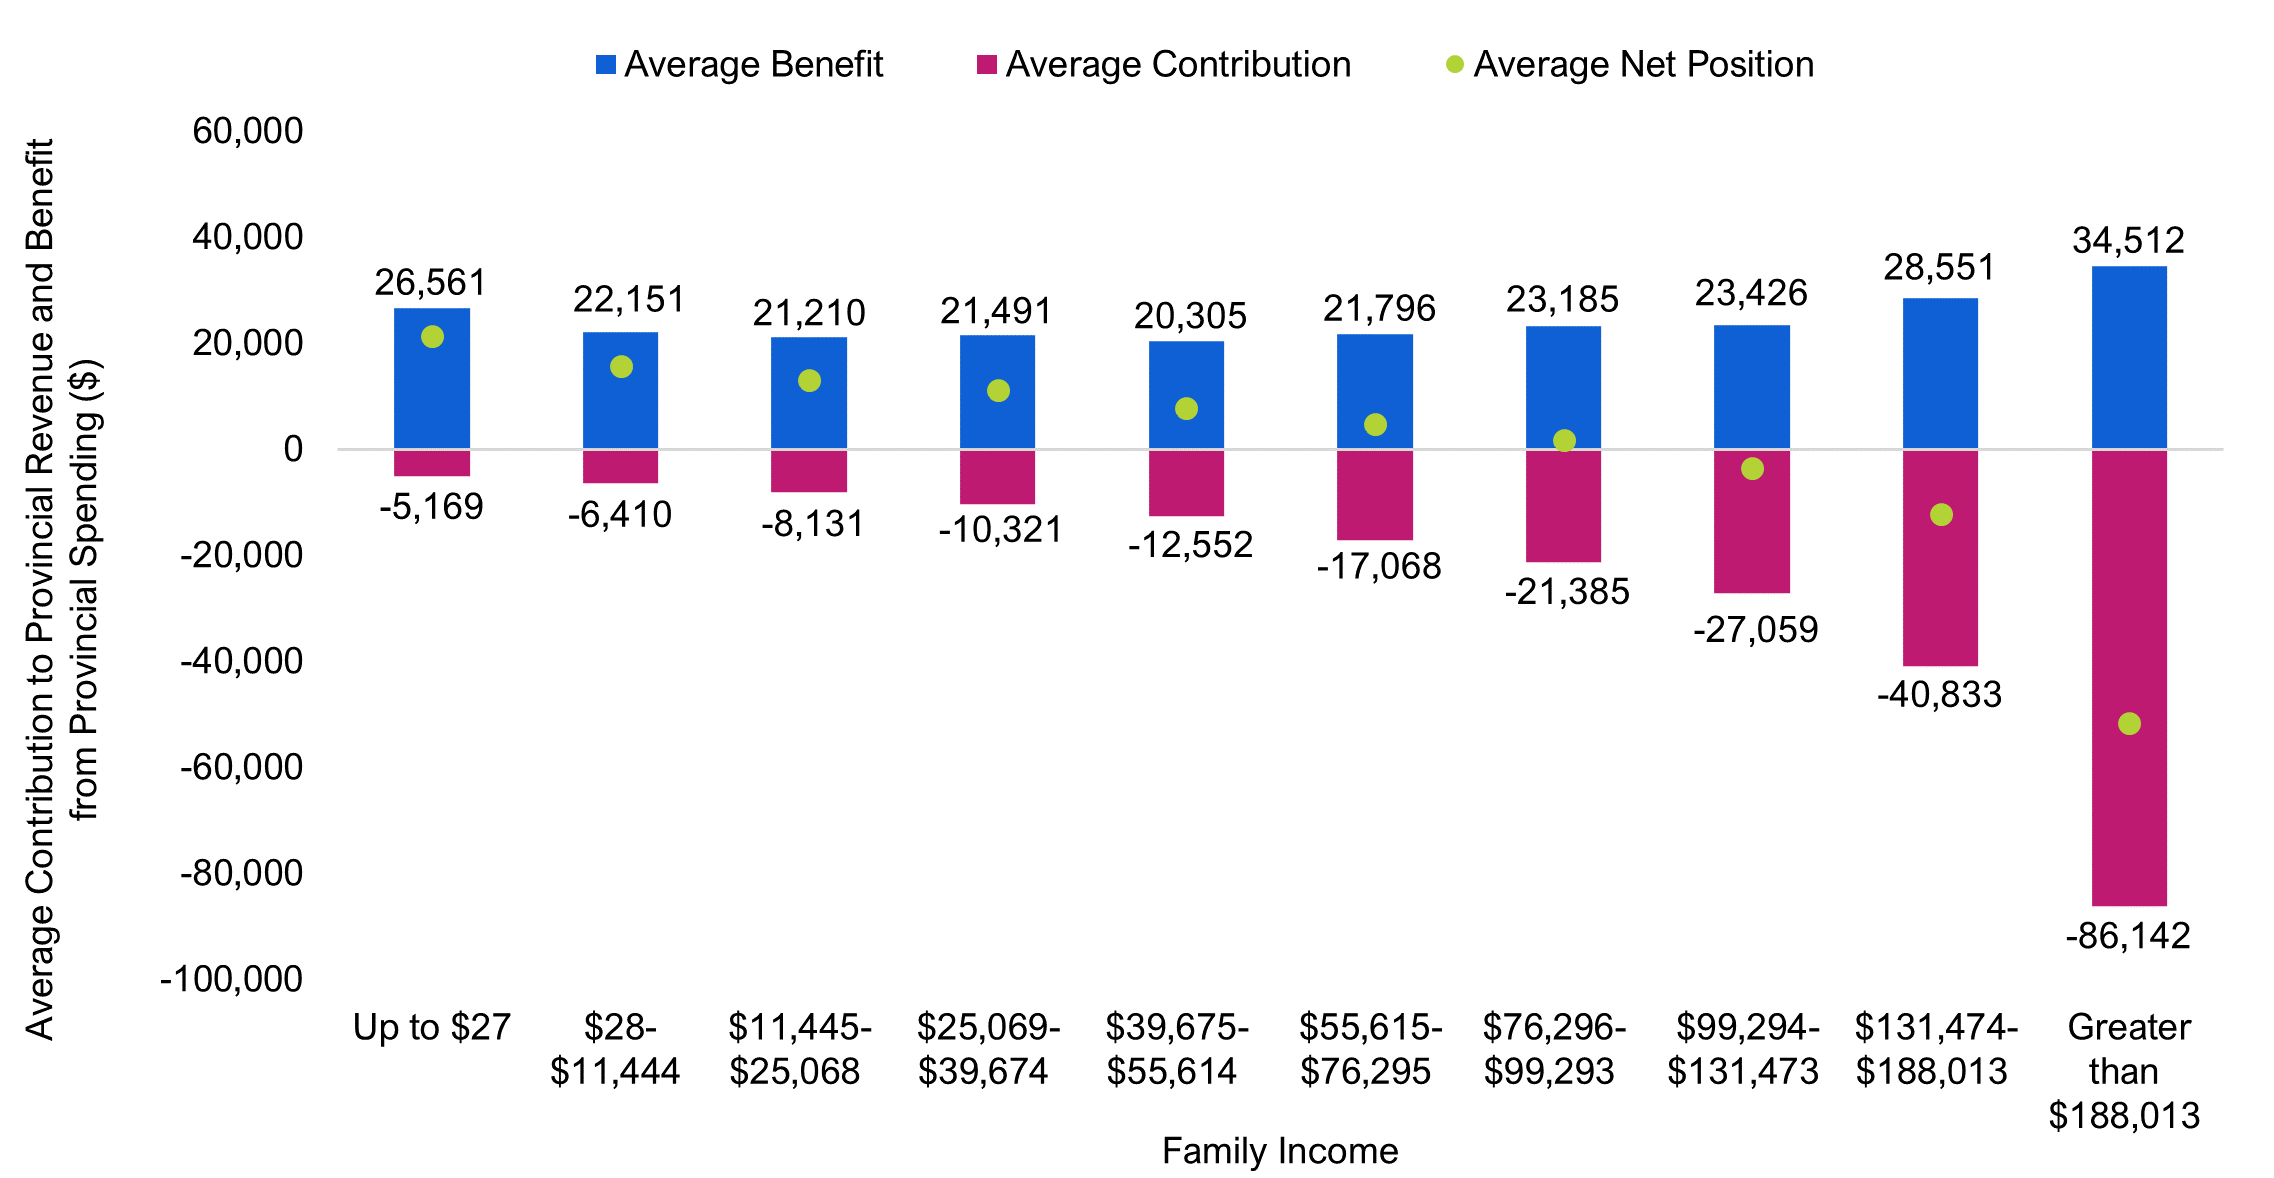
Note: “Family” refers to “couples living together, with or without children, and lone parents living with their children” (Statistics Canada’s definition of a census family) and single persons. “Income” refers to market income, which includes before-tax income generated through employment, investments, retirement pensions and annuities, and excludes income from government transfers. Income deciles reflect equal-sized groups of Ontario families, ordered from lowest to highest income. Each decile contains 10 per cent of Ontario’s 6.5 million families in 2019-20, or approximately 650,000 families.
Source: FAO.
Accessible version
| Family Income | Average Benefit ($) | Average Contribution ($) | Average Net Position ($) |
| Up to $27 | 26,561 | -5,169 | 21,393 |
| $28- $11,444 |
22,151 | -6,410 | 15,742 |
| $11,445- $25,068 |
21,210 | -8,131 | 13,079 |
| $25,069- $39,674 |
21,491 | -10,321 | 11,171 |
| $39,675- $55,614 |
20,305 | -12,552 | 7,753 |
| $55,615- $76,295 |
21,796 | -17,068 | 4,728 |
| $76,296- $99,293 |
23,185 | -21,385 | 1,800 |
| $99,294- $131,473 |
23,426 | -27,059 | -3,634 |
| $131,474- $188,013 |
28,551 | -40,833 | -12,282 |
| Greater than $188,013 |
34,512 | -86,142 | -51,630 |
Ontario families contribute directly to provincial government revenues through the payment of various taxes and fees, and indirectly through federal government transfers to the Province, corporate income tax and other revenue sources. Overall, in 2019-20, families with higher incomes contributed more to provincial government revenue than lower-income families. The FAO estimates that families in the lowest income decile (earning $27 or less) contributed an average of $5,169 to provincial revenue, largely through the Harmonized Sales Tax (HST) and service fees. As Ontario families’ incomes increased, their contribution to provincial revenue also increased, reaching an average contribution of $86,142 for families in the highest income decile (earning more than $188,013). The average revenue contribution for families in the highest income decile was over 16 times larger than the average contribution by families in the lowest income decile, and more than double the average contribution of families in the ninth income decile. Section 4 of this report provides a breakdown of the average contribution by family income for each provincial revenue category.
Families receive benefits from the provincial government through services and direct payments, such as health care, public education and child care, social services, income and employment supports, and housing and electricity subsidies. Unlike revenue collection, where a family’s contribution to provincial revenue increased with income, the average benefit from provincial services and payments was highest among families with incomes in the top 20 per cent and among families with incomes in the lowest 10 per cent.
The FAO estimates that families in the top two income deciles received the highest average benefits in 2019-20, at $28,551 and $34,512, respectively, primarily due to their relatively larger family sizes[14] (Figure 9) and through the collection of interest on debt payments from the Province. Families in the lowest income decile, who earned $27 or less in 2019-20, received the next highest benefits, averaging $26,561, largely from income support programs and social services. The remaining 70 per cent of Ontario families, earning between $28 and $131,473, ranged from an average benefit of $20,305 (for families in the fifth income decile) to an average benefit of $23,426 (for families in the eighth income decile). This is because lower-income families received more benefit from social services and income support spending, while higher-income families received more benefit from child care, education and postsecondary education spending. Section 5 of this report reviews the average benefit to Ontario families by provincial government spending category.
The distribution of families’ contribution to provincial revenue and benefit from provincial spending by category is also available on the FAO’s website at: https://fao-on.org/en/net-contribution.
4. Contribution to Provincial Government Revenue
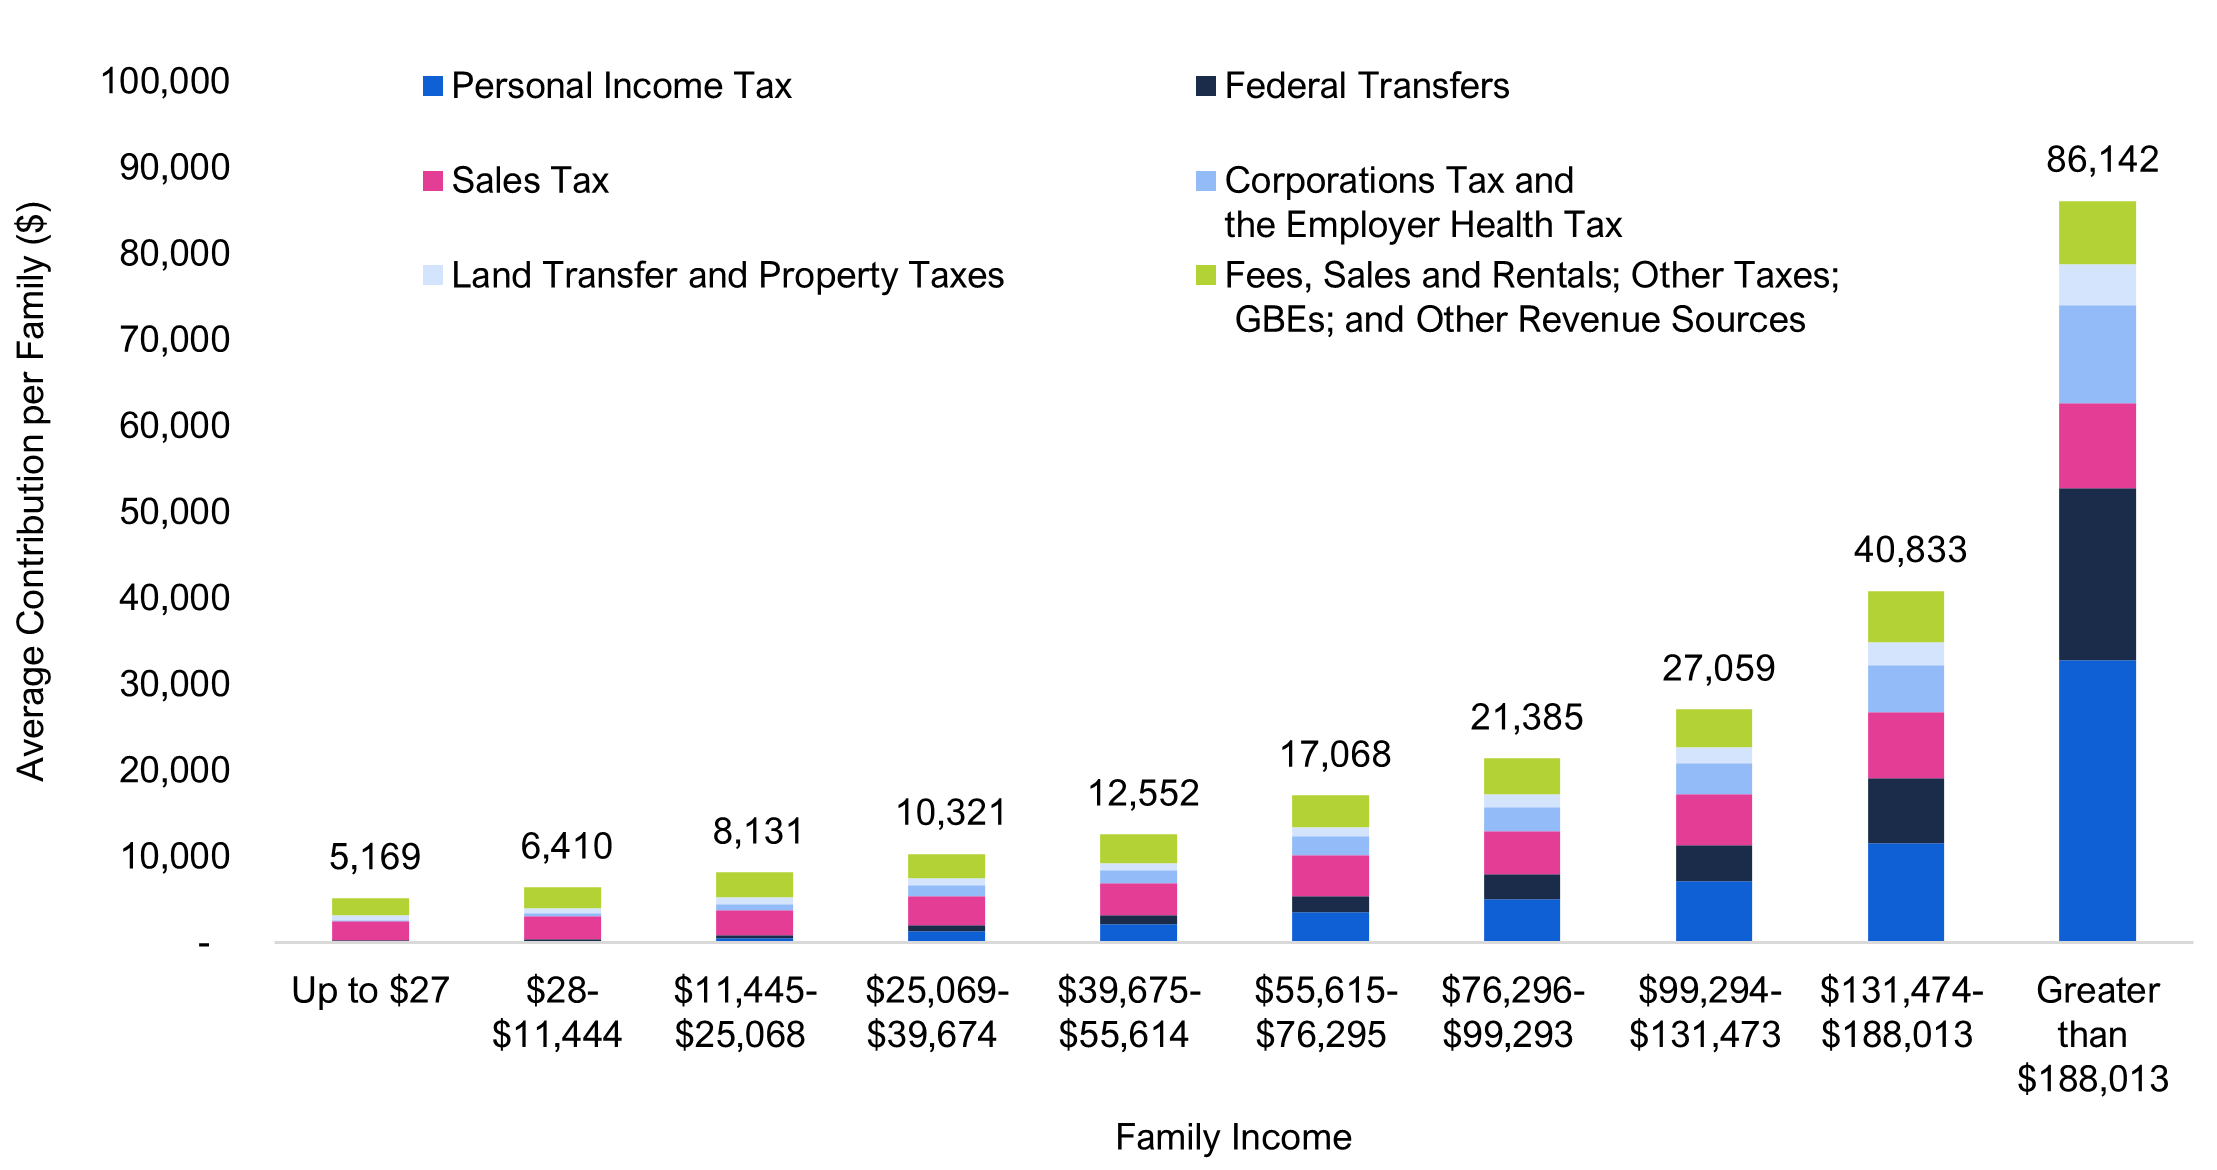
In 2019-20, the Province generated $152.9 billion in revenue from its residents.[15] The major sources of government revenue in Ontario were personal income tax ($41.8 billion); provincial sales tax ($31.5 billion); federal transfers ($25.4 billion); corporations tax and the Employer Health Tax ($19.0 billion); land transfer and property taxes ($9.9 billion); fees, sales and rentals ($11.6 billion); other taxes ($6.5 billion); government business enterprises ($5.9 billion); and other revenue sources ($1.3 billion).
Figure 6 Contribution to provincial revenue by source and family income decile, 2019-20
Note: “GBEs” are government business enterprises. “Family” refers to “couples living together, with or without children, and lone parents living with their children” (Statistics Canada’s definition of a census family) and single persons. “Income” refers to market income, which includes before-tax income generated through employment, investments, retirement pensions and annuities, and excludes income from government transfers. Income deciles reflect equal-sized groups of Ontario families, ordered from lowest to highest income. Each decile contains 10 per cent of Ontario’s 6.5 million families in 2019-20, or approximately 650,000 families.
Source: FAO.
Accessible version
| Family Income | Personal Income Tax ($) | Federal Transfers ($) |
Sales Tax ($) | Corporations Tax and Employer Health Tax ($) | Land Transfer and Property Taxes ($) |
Fees, Sales and Rentals, Other Taxes, GBEs and Other Revenue Sources ($) |
Total ($) |
| Up to $27 | 14 | 238 | 2,263 | 107 | 518 | 2,029 | 5,169 |
| $28- $11,444 |
94 | 253 | 2,738 | 385 | 552 | 2,388 | 6,410 |
| $11,445- $25,068 |
478 | 378 | 2,921 | 743 | 802 | 2,811 | 8,131 |
| $25,069- $39,674 |
1,322 | 686 | 3,406 | 1,229 | 872 | 2,805 | 10,321 |
| $39,675- $55,614 |
2,100 | 1,066 | 3,715 | 1,495 | 853 | 3,323 | 12,552 |
| $55,615- $76,295 |
3,543 | 1,856 | 4,774 | 2,132 | 1,061 | 3,702 | 17,068 |
| $76,296- $99,293 |
5,058 | 2,861 | 4,999 | 2,773 | 1,594 | 4,101 | 21,385 |
| $99,294- $131,473 |
7,177 | 4,170 | 5,922 | 3,594 | 1,887 | 4,310 | 27,059 |
| $131,474- $188,013 |
11,559 | 7,582 | 7,670 | 5,402 | 2,704 | 5,916 | 40,833 |
| Greater than $188,013 |
32,826 | 19,895 | 9,944 | 11,373 | 4,742 | 7,361 | 86,142 |
Overall, the FAO estimates that the top 10 per cent of income-earning families contributed more to government revenues than the bottom 70 per cent of families combined. This trend is due to higher-income households generating higher taxable activity (such as income or consumption),[16] and the progressive tax rates of some taxes.[17] Notably:
- The average provincial personal income tax (PIT) payable in 2019-20 was $14 for a family in the first income decile, rising to $32,826 for families in the highest income decile. The increase in PIT payable accelerates as income rises because of the progressivity of the PIT rates, meaning higher-income individuals are charged higher PIT rates.
- Although the Province receives transfers directly from the federal government, these payments are made indirectly by Ontario families through their contribution to federal government revenues.[18] The FAO estimates that in 2019-20, families in the lowest income decile contributed an average of $238 in federal transfers to the Province, increasing to an average of $19,895 for the highest-income families.
- The sales tax revenue category largely reflects the Harmonized Sales Tax (HST) but also includes the retail sales tax (RST), which applies to some insurance and benefit plan premiums and to the private purchase of certain vehicles. Since the HST rate is a flat eight per cent, the rate of increase in sales tax payable across families is more linear than the PIT. The FAO estimates that in 2019-20, families in the lowest income decile paid an average of $2,263 in sales tax, increasing to $9,944 for families in the highest income decile, reflecting larger average family sizes (Figure 9) and greater consumption for higher-income families.
- The FAO assumes that both shareholders and workers indirectly pay corporations tax and the Employer Health Tax (EHT). As a result, the FAO estimates that in 2019-20, families in the lowest income decile contributed an average of $107 to provincial corporations tax and EHT revenue, increasing to $11,373 for families in the highest income decile, reflecting increasing investment income for wealthier families.
- Land transfer and property taxes are paid by homeowners based on the purchase price and property value of their homes, respectively. The FAO estimates that in 2019-20, families in the first income decile contributed an average of $518 to land transfer and property tax revenue, increasing to $4,742 for families in the highest decile. This trend reflects the higher value and quantity of homes owned by higher-income groups.
- All other revenue includes fees, sales and rental revenue; revenue from government business enterprises[19] (GBEs); other taxes; and other revenue sources. The FAO estimates that in 2019-20, families in the lowest income decile contributed an average of $2,029 to all other revenues, increasing to $7,361 for families in the highest income decile.
5. Benefit from Provincial Government Spending
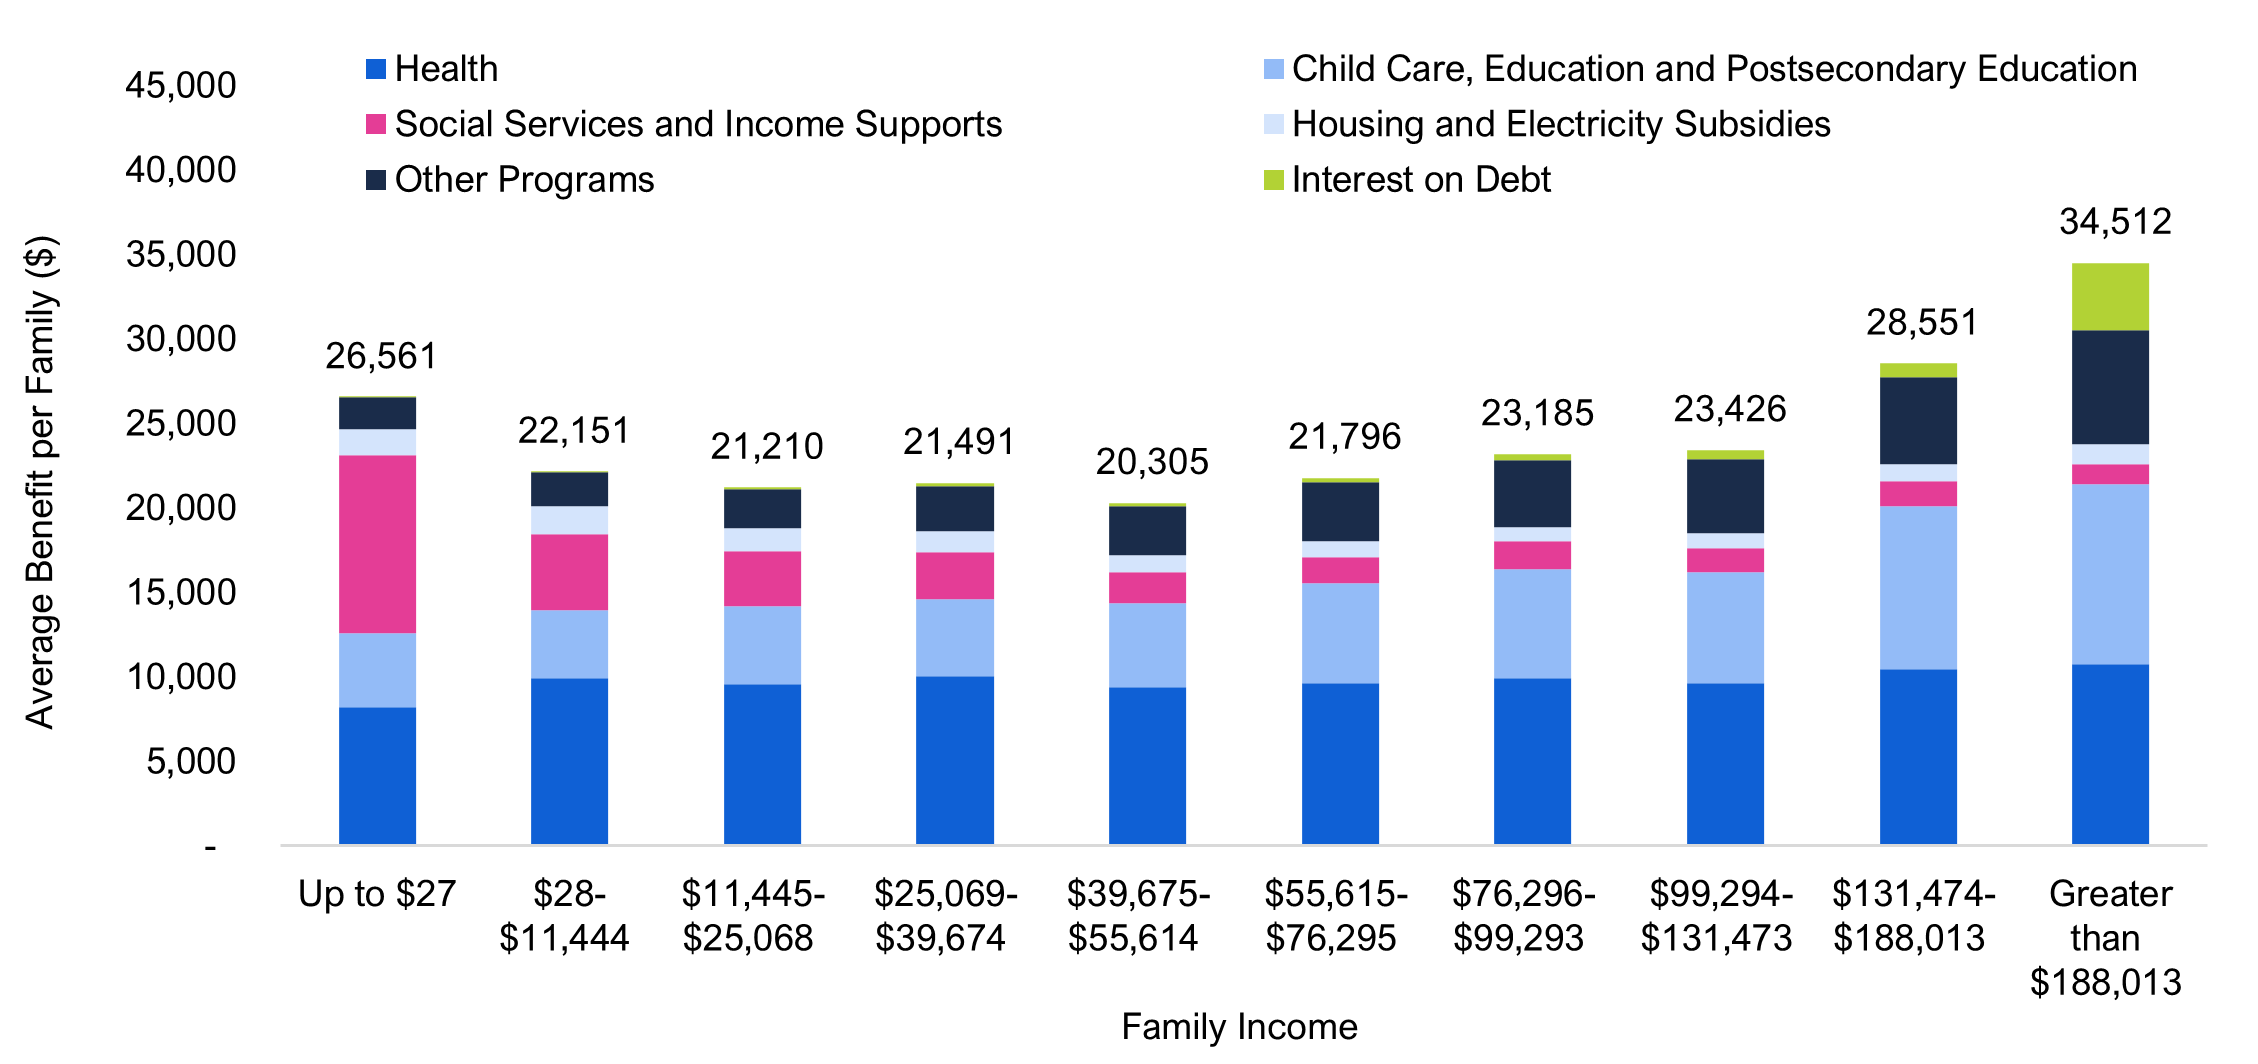
In 2019-20, the Province provided $158.4 billion in services and payments to Ontario families.[20] The three largest spending categories were health ($63.7 billion), child care, education and postsecondary education ($40.3 billion), and social services and income supports ($19.7 billion), which combined represented 78 per cent of government spending on Ontario families in 2019-20. In addition, the Province provided $7.4 billion for housing and electricity subsidies, $4.2 billion in interest on debt payments to Ontario families, and $23.2 billion in payments and services through all other programs.
Figure 7 Benefit from provincial spending by program and family income decile, 2019-20
Note: “Family” refers to “couples living together, with or without children, and lone parents living with their children” (Statistics Canada’s definition of a census family) and single persons. “Income” refers to market income, which includes before-tax income generated through employment, investments, retirement pensions and annuities, and excludes income from government transfers. Income deciles reflect equal-sized groups of Ontario families, ordered from lowest to highest income. Each decile contains 10 per cent of Ontario’s 6.5 million families in 2019-20, or approximately 650,000 families.
Source: FAO.
Accessible version
| Family Income | Health ($) |
Child Care, Education and Post-secondary Education ($) | Social Services and Income Supports ($) |
Housing and Electricity Subsidies ($) | Other Programs ($) | Interest on Debt ($) |
Total ($) |
| Up to $27 | 8,239 | 4,363 | 10,515 | 1,559 | 1,885 | 0 | 26,561 |
| $28- $11,444 |
9,908 | 4,044 | 4,497 | 1,673 | 1,980 | 49 | 22,151 |
| $11,445- $25,068 |
9,583 | 4,637 | 3,210 | 1,376 | 2,329 | 75 | 21,210 |
| $25,069- $39,674 |
10,063 | 4,569 | 2,742 | 1,233 | 2,709 | 175 | 21,491 |
| $39,675- $55,614 |
9,400 | 4,968 | 1,847 | 982 | 2,923 | 185 | 20,305 |
| $55,615- $76,295 |
9,644 | 5,894 | 1,569 | 919 | 3,537 | 233 | 21,796 |
| $76,296- $99,293 |
9,943 | 6,444 | 1,635 | 853 | 3,946 | 365 | 23,185 |
| $99,294- $131,473 |
9,651 | 6,529 | 1,463 | 901 | 4,363 | 519 | 23,426 |
| $131,474- $188,013 |
10,457 | 9,675 | 1,487 | 968 | 5,158 | 805 | 28,551 |
| Greater than $188,013 |
10,754 | 10,682 | 1,171 | 1,189 | 6,732 | 3,983 | 34,512 |
On average, families in the highest two income deciles (earning over $131,473) received the largest benefit from government payments and services, while families in the lowest income decile (earning less than $28) received the third largest benefit amount. Families in the fifth income decile (earning between $39,675 and $55,614) received the lowest average benefit from government payments and services. Overall, this trend reflects the objective of many social service and income support programs to target low-income families, as well as the impact of family size and the age of family members on the distribution of spending on health, and on child care, education and postsecondary education programs.[21] Notably:
- The distribution of health spending is relatively flat, ranging from an average of $8,239 for families in the lowest income decile to $10,754 for families in the highest income decile (Figure 11). On average, lower-income families have more seniors (Figure 9), who receive a higher per person health spending benefit (Figure 10), while higher-income families have more family members (Figure 9), leading to a higher total family benefit.
- On average, the distribution of spending on child care, education and postsecondary education programs increases with family income level. This is largely due to the fact that, on average, higher-income families have more children (Figure 9) and so receive more of the benefit from provincial spending on kindergarten to grade 12 education (Figure 12). This is partially offset by provincial spending on child care programs, which provides a greater benefit to lower-income families (Figure 13).
- The FAO estimates that the average benefit amount for social services and income supports was highest for families in the lowest income decile, at $10,515, declining to $1,171 for families in the highest income decile. The distribution of social services spending reflects the objective of many of the programs in this category to support low- and moderate-income individuals and families.
- The FAO estimates that families in the two lowest income deciles received the largest average benefit from housing and electricity subsidies ($1,559 and $1,673 per family, respectively), because of several housing and electricity programs that are targeted to low-income residents.[22] Families earning between $55,615 and $131,473 in income received the smallest average benefit from housing and electricity subsidies (a low of $853 for families in the seventh income decile). Finally, housing and electricity subsidy benefits increased from the seventh through tenth income deciles, because a significant portion of the benefit provided through the Province’s electricity subsidy programs is based on electricity consumption, which, on average, increases as family incomes increase.
- The FAO estimates that the average benefit from spending on all other programs increased from $1,885 for families in the first income decile to $6,732 for families in the highest income decile, largely because the benefits from many of these programs (such as policing and correctional services) are assumed to be distributed evenly among all Ontario residents. Consequently, as average family size increases with family income (Figure 9), families in higher income deciles receive a larger average benefit.
- The collection of provincial interest on debt payments was zero for families in the lowest income decile, increasing to $805 for families in the ninth income decile, and then reaching $3,983 for families in the highest income decile, reflecting the FAO’s estimate of direct and indirect collection of provincial interest on debt payments by Ontario families.
Appendix A: Additional Context
Figure 8 Average contribution to provincial revenue and benefit from provincial spending per person by family income decile, 2019-20
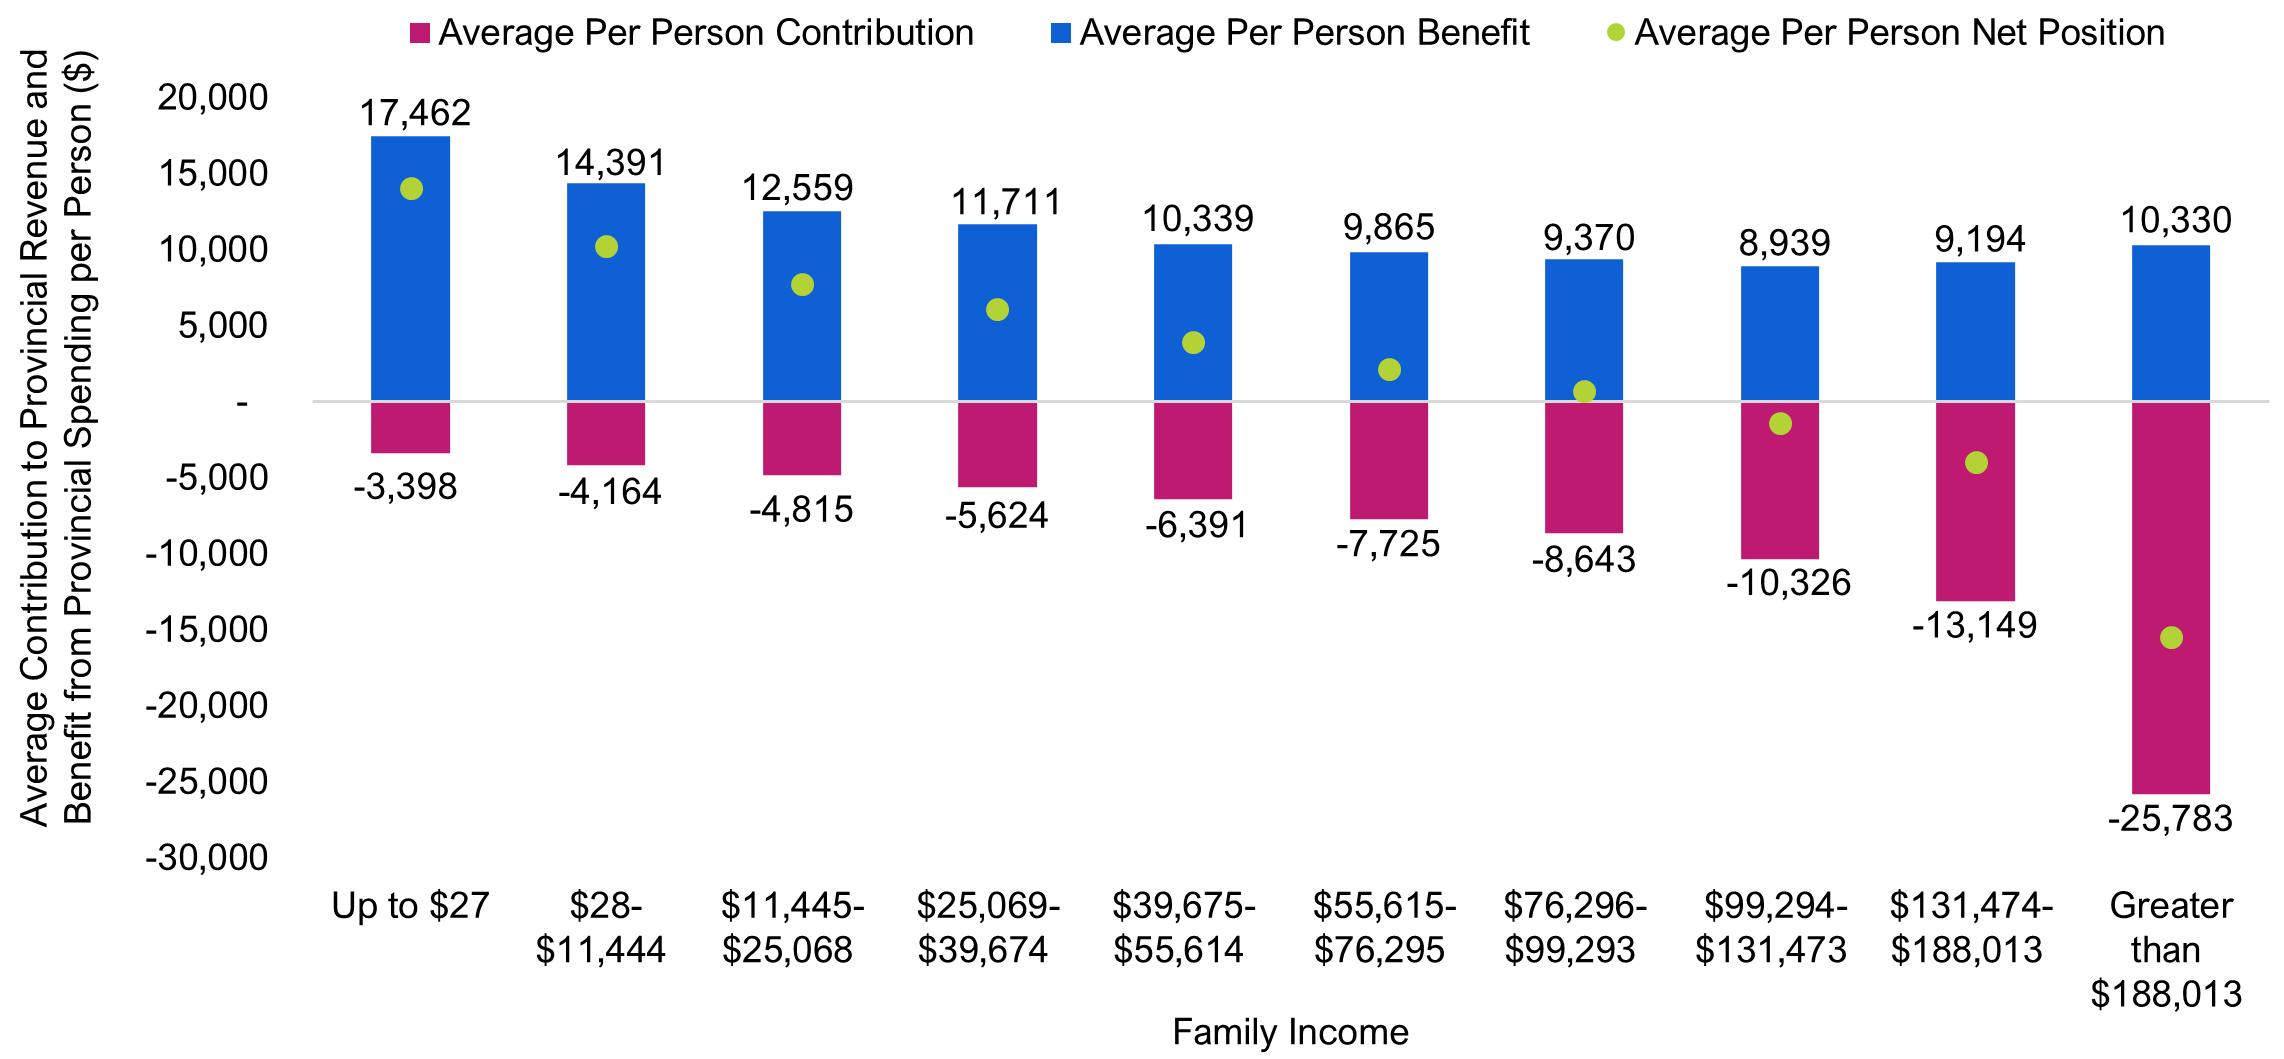
Note: “Income” refers to market income, which includes before-tax income generated through employment, investments, retirement pensions and annuities, and excludes income from government transfers. Income deciles reflect equal-sized groups of Ontario families, ordered from lowest to highest income. Each decile contains 10 per cent of families, or approximately 650,000 families.
Source: FAO.
Accessible version
| Family Income | Average Benefit ($) | Average Contribution ($) | Average Net Position ($) |
| Up to $27 | 17,462 | -3,398 | 14,064 |
| $28- $11,444 |
14,391 | -4,164 | 10,227 |
| $11,445- $25,068 |
12,559 | -4,815 | 7,744 |
| $25,069- $39,674 |
11,711 | -5,624 | 6,087 |
| $39,675- $55,614 |
10,339 | -6,391 | 3,948 |
| $55,615- $76,295 |
9,865 | -7,725 | 2,140 |
| $76,296- $99,293 |
9,370 | -8,643 | 727 |
| $99,294- $131,473 |
8,939 | -10,326 | -1,387 |
| $131,474- $188,013 |
9,194 | -13,149 | -3,955 |
| Greater than $188,013 |
10,330 | -25,783 | -15,453 |
Figure 9 Average number of people in a family by family income decile, 2019-20
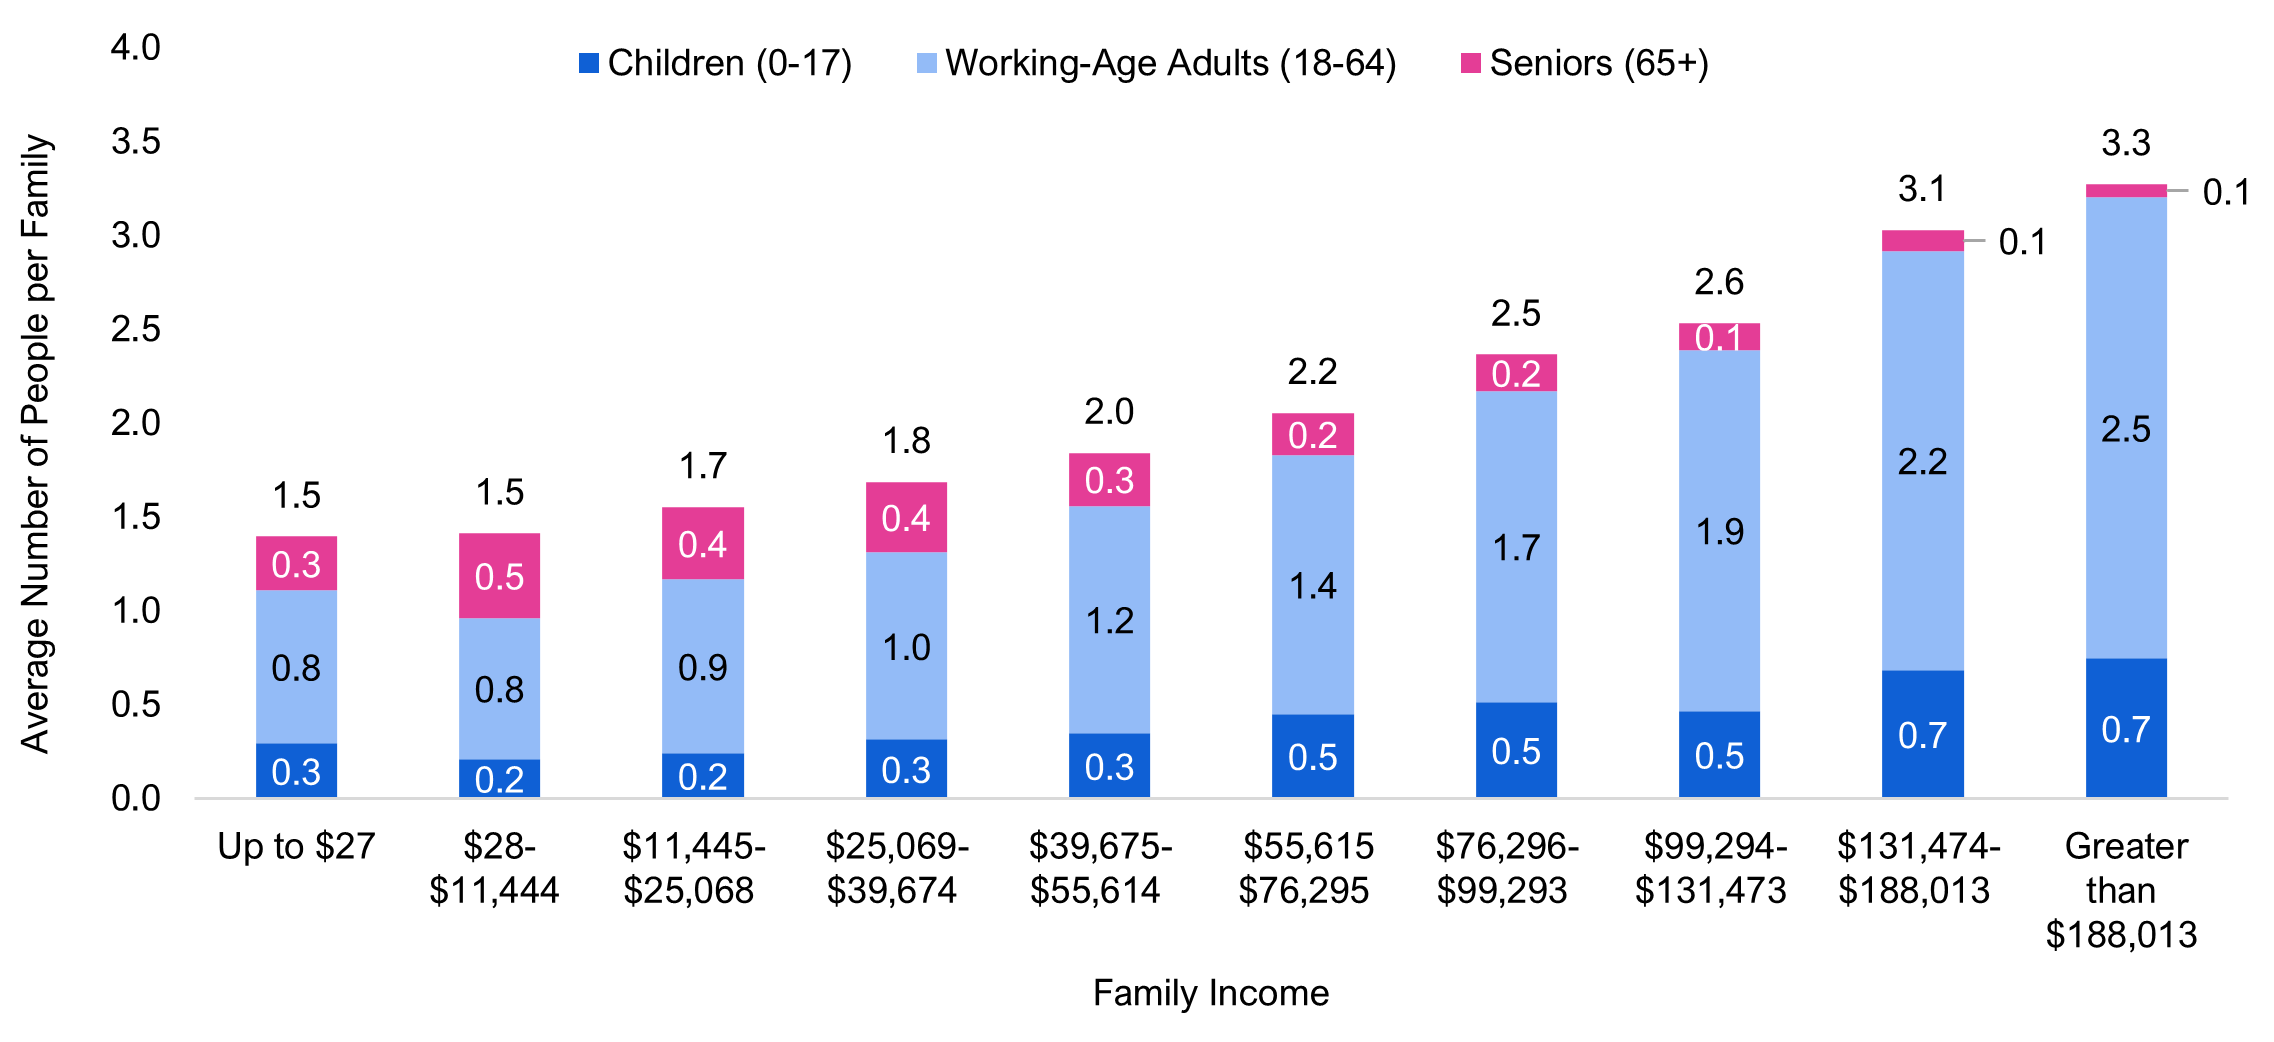
Note: “Family” refers to “couples living together, with or without children, and lone parents living with their children” (Statistics Canada’s definition of a census family) and single persons living alone. “Income” refers to market income, which includes before-tax income generated through employment, investments, retirement pensions and annuities, and excludes income from government transfers. Income deciles reflect equal-sized groups of Ontario families, ordered from lowest to highest income. Each decile contains 10 per cent of families, or approximately 650,000 families.
Source: FAO.
Accessible version
| Family Income | Children (0-17) |
Working Age Adults (18-64) | Seniors (65+) |
Total |
| Up to $27 | 0.3 | 0.8 | 0.3 | 1.5 |
| $28- $11,444 |
0.2 | 0.8 | 0.5 | 1.5 |
| $11,445- $25,068 |
0.2 | 0.9 | 0.4 | 1.7 |
| $25,069- $39,674 |
0.3 | 1.0 | 0.4 | 1.8 |
| $39,675- $55,614 |
0.3 | 1.2 | 0.3 | 2.0 |
| $55,615- $76,295 |
0.5 | 1.4 | 0.2 | 2.2 |
| $76,296- $99,293 |
0.5 | 1.7 | 0.2 | 2.5 |
| $99,294- $131,473 |
0.5 | 1.9 | 0.1 | 2.6 |
| $131,474- $188,013 |
0.7 | 2.2 | 0.1 | 3.1 |
| Greater than $188,013 |
0.7 | 2.5 | 0.1 | 3.3 |
Figure 10 Average benefit from health program spending by age in 2019-20
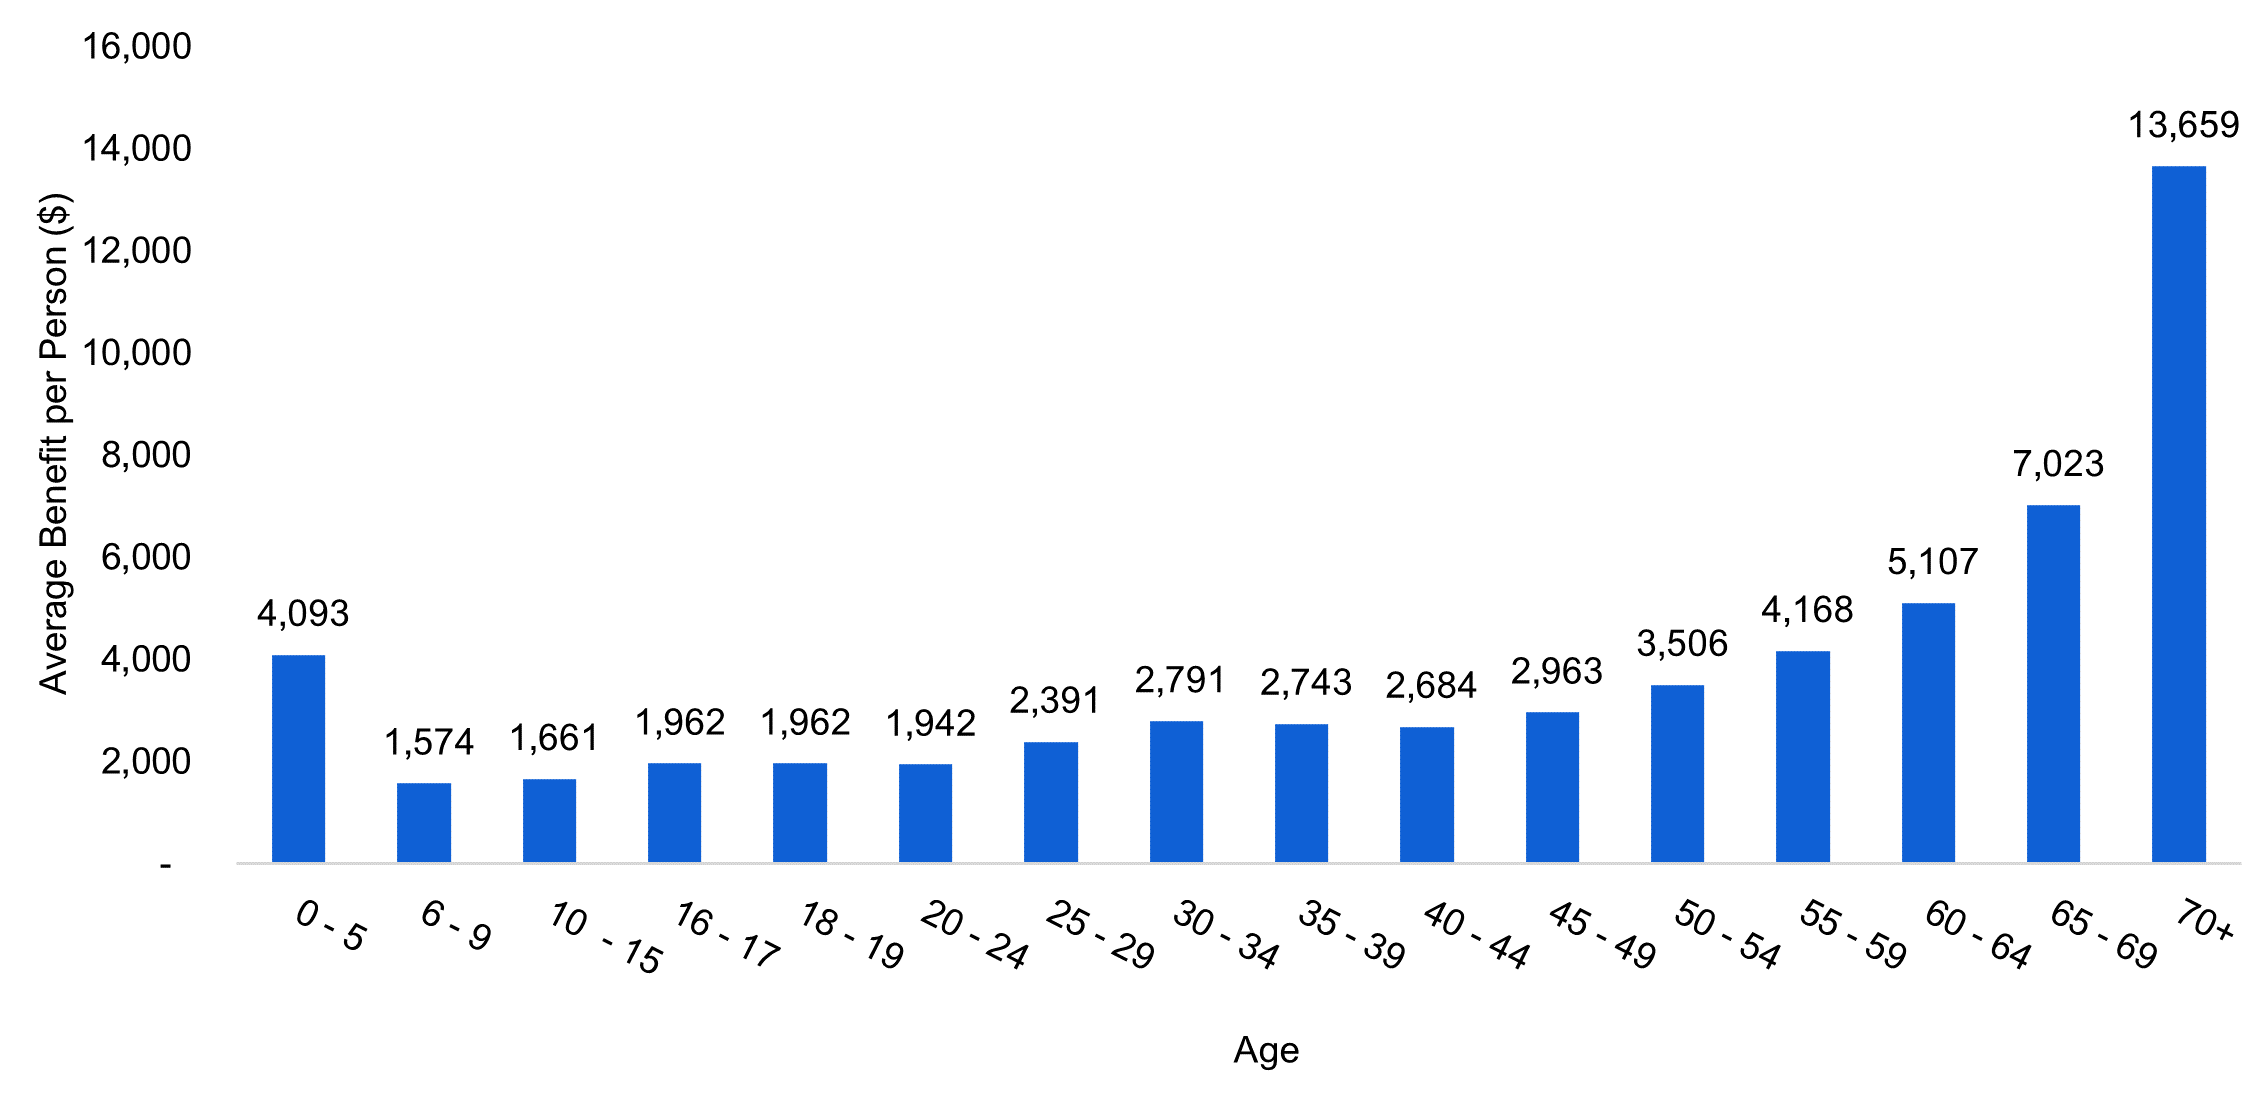
Source: FAO.
Accessible version
| Age | Average Health Benefit per Person ($) |
| 0 - 5 | 4,093 |
| 6 - 9 | 1,574 |
| 10 - 15 | 1,661 |
| 16 - 17 | 1,962 |
| 18 - 19 | 1,962 |
| 20 - 24 | 1,942 |
| 25 - 29 | 2,391 |
| 30 - 34 | 2,791 |
| 35 - 39 | 2,743 |
| 40 - 44 | 2,684 |
| 45 - 49 | 2,963 |
| 50 - 54 | 3,506 |
| 55 - 59 | 4,168 |
| 60 - 64 | 5,107 |
| 65 - 69 | 7,023 |
| 70+ | 13,659 |
Figure 11 Average benefit from health program spending by family income decile, 2019-20
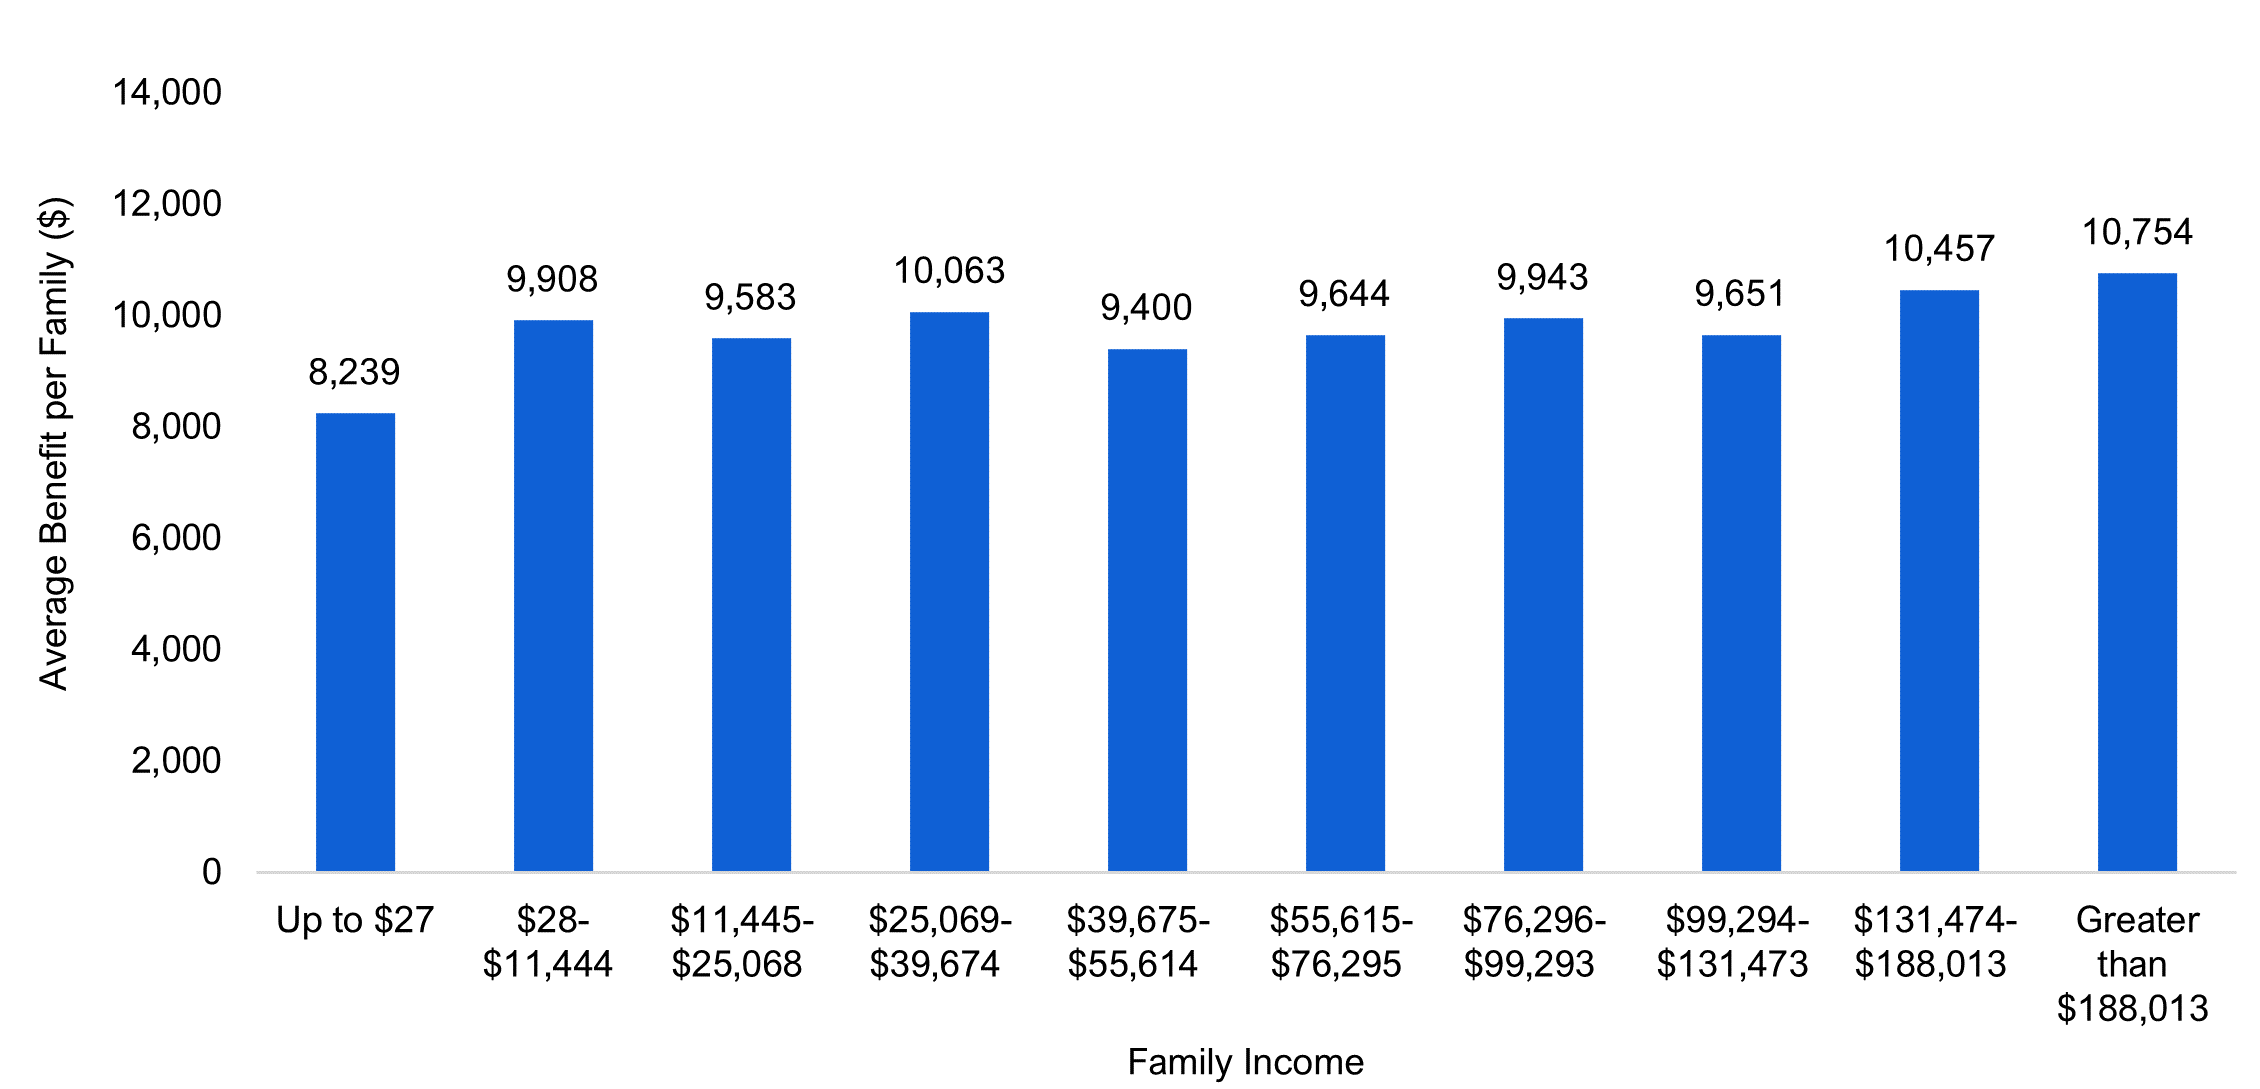
Note: “Family” refers to “couples living together, with or without children, and lone parents living with their children” (Statistics Canada’s definition of a census family) and single persons. “Income” refers to market income, which includes before-tax income generated through employment, investments, retirement pensions and annuities, and excludes income from government transfers. Income deciles reflect equal-sized groups of Ontario families, ordered from lowest to highest income. Each decile contains 10 per cent of Ontario’s 6.5 million families in 2019-20, or approximately 650,000 families.
Source: FAO.
Accessible version
| Family Income | Average Benefit per Family ($) |
| Up to $27 | 8,239 |
| $28- $11,444 |
9,908 |
| $11,445- $25,068 |
9,583 |
| $25,069- $39,674 |
10,063 |
| $39,675- $55,614 |
9,400 |
| $55,615- $76,295 |
9,644 |
| $76,296- $99,293 |
9,943 |
| $99,294- $131,473 |
9,651 |
| $131,474- $188,013 |
10,457 |
| Greater than $188,013 |
10,754 |
Figure 12 Average benefit from education and postsecondary education spending by age, 2019-20
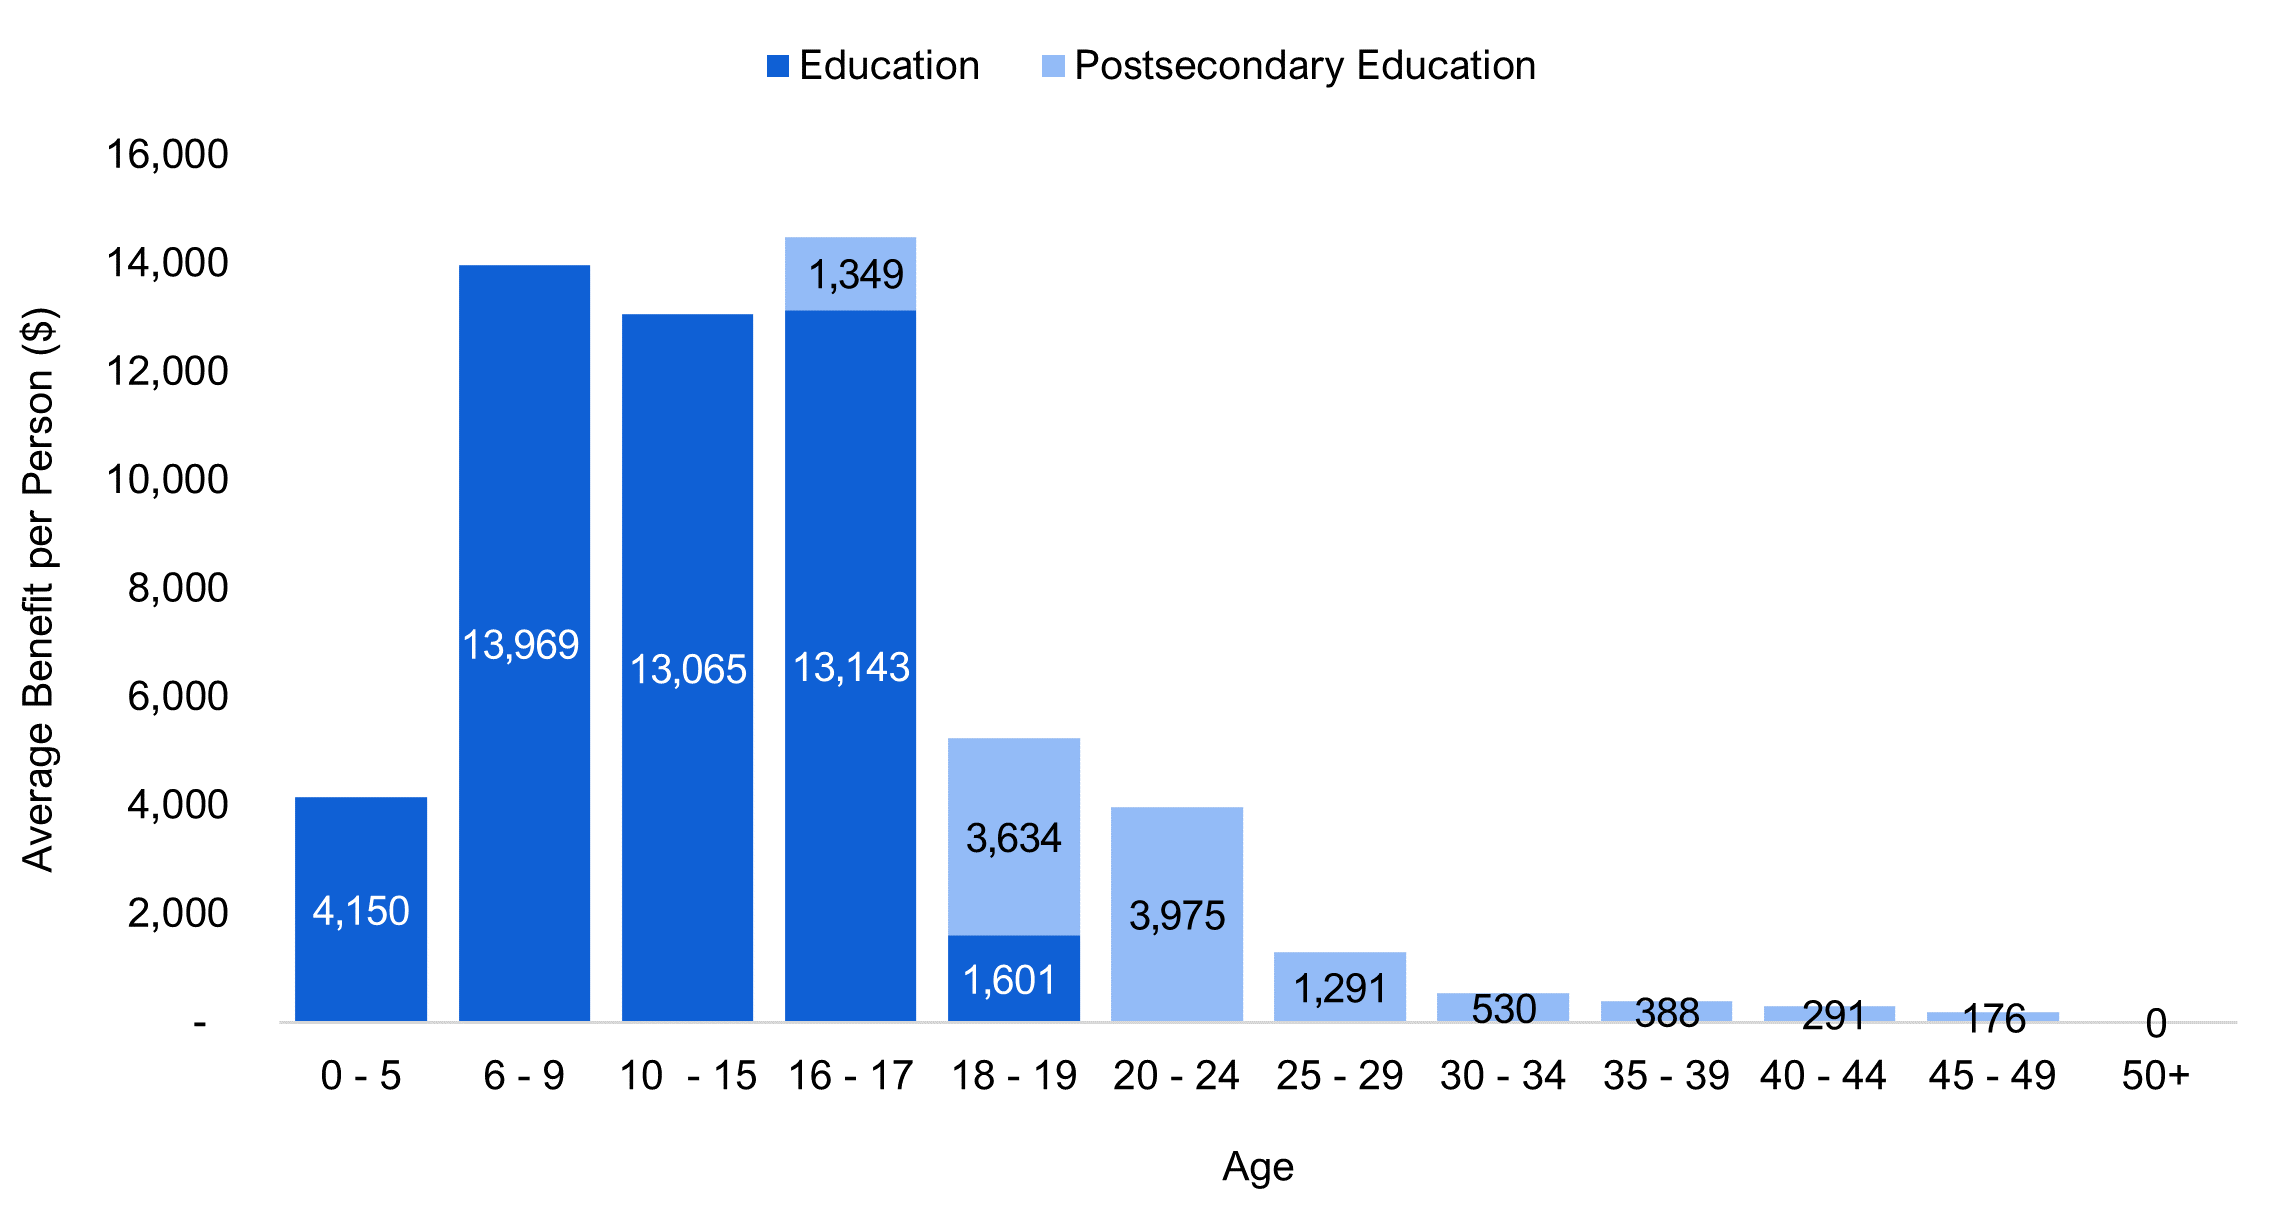
Source: FAO.
Accessible version
| Age | Education ($) | Postsecondary Education ($) |
| 0 - 5 | 4,150 | 0 |
| 6 - 9 | 13,969 | 0 |
| 10 - 15 | 13,065 | 0 |
| 16 - 17 | 13,143 | 1,349 |
| 18 - 19 | 1,601 | 3,634 |
| 20 - 24 | 0 | 3,975 |
| 25 - 29 | 0 | 1,291 |
| 30 - 34 | 0 | 530 |
| 35 - 39 | 0 | 388 |
| 40 - 44 | 0 | 291 |
| 45 - 49 | 0 | 176 |
| 50+ | 0 | 0 |
Figure 13 Average benefit from provincial spending on child care programs by family income decile, 2019-20
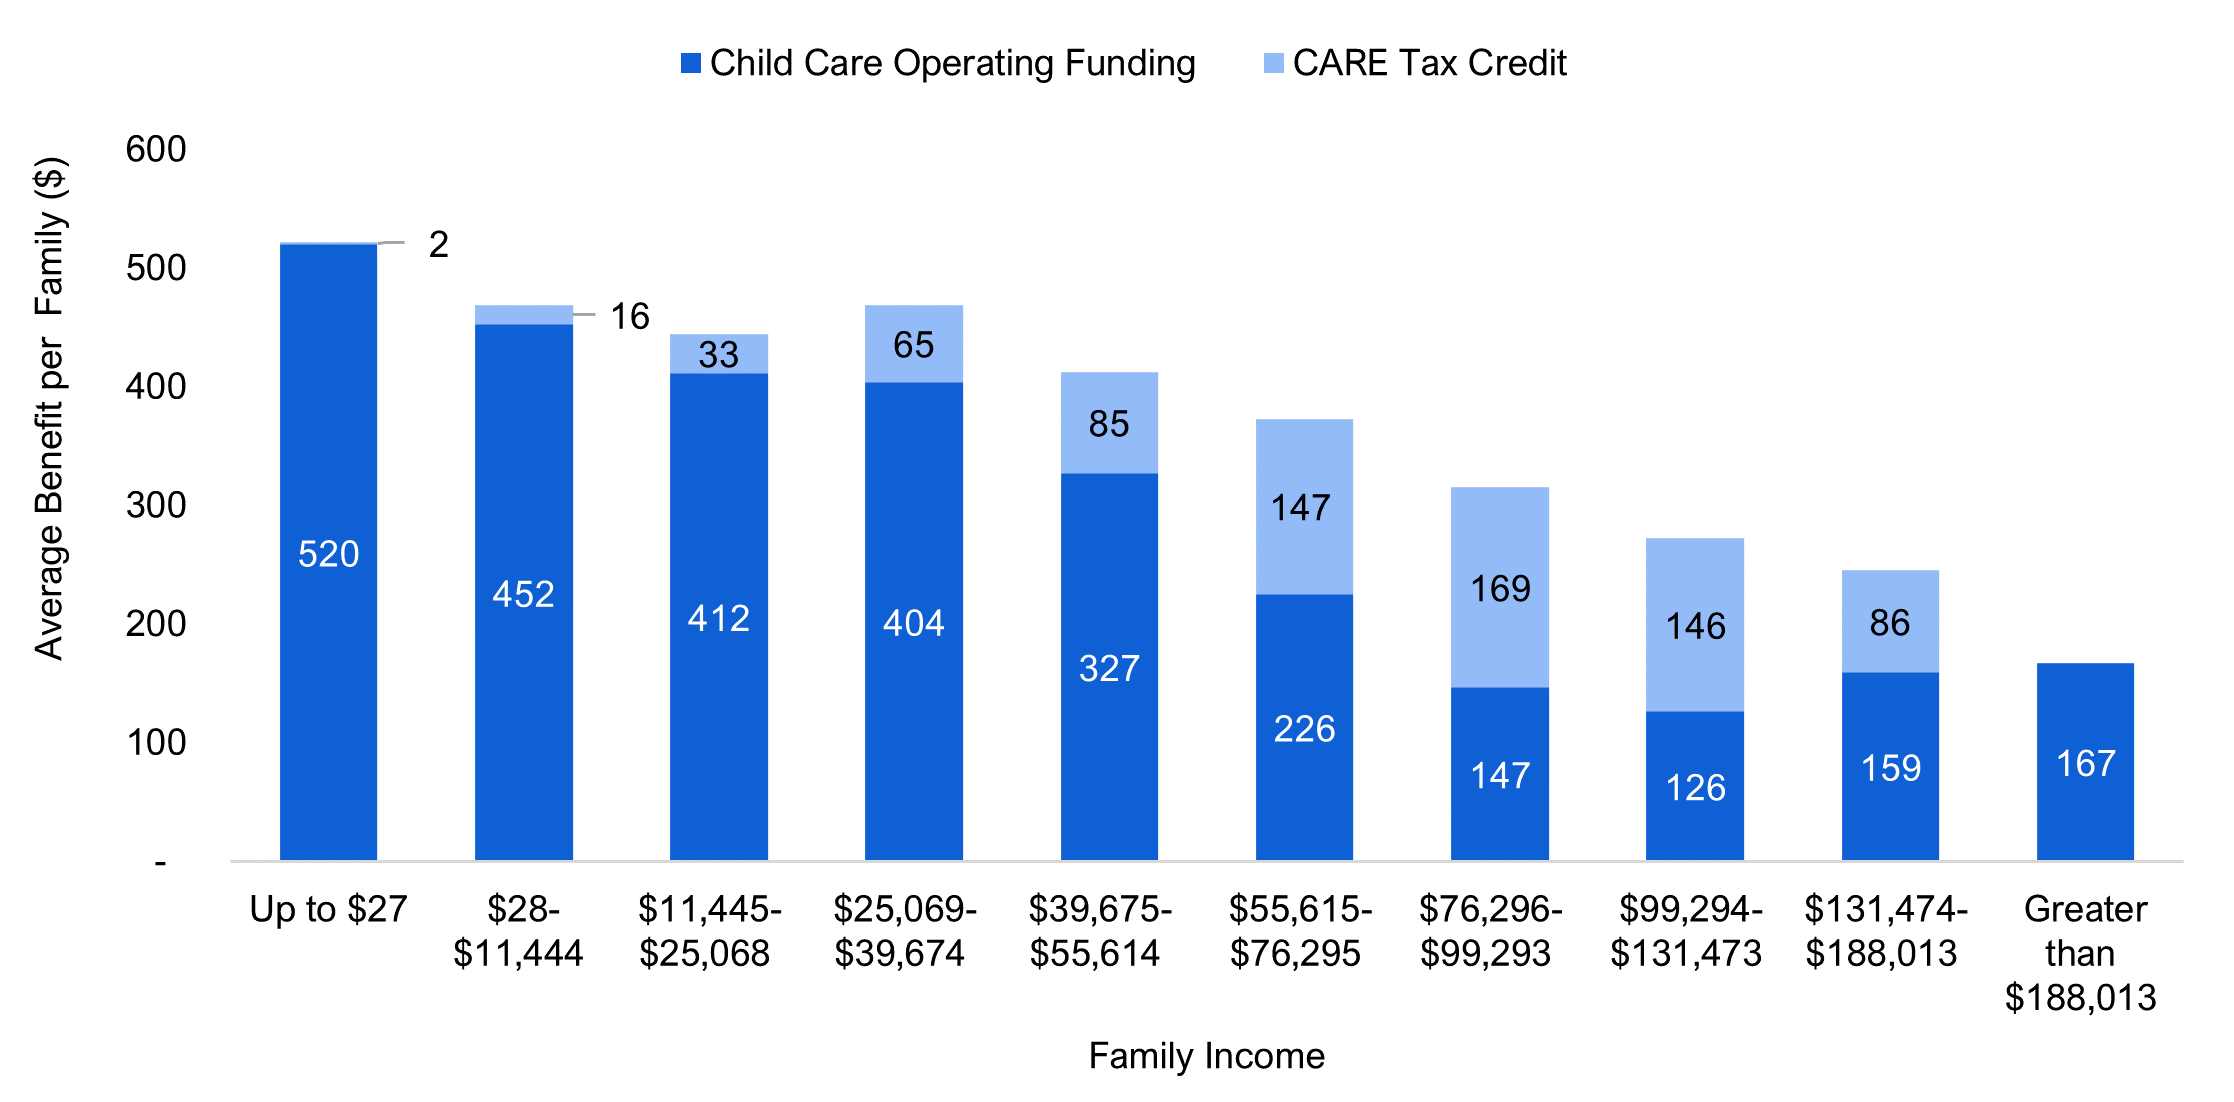
Note: “CARE Tax Credit” refers to the Ontario Childcare Access and Relief from Expenses Tax Credit. “Family” refers to “couples living together, with or without children, and lone parents living with their children” (Statistics Canada’s definition of a census family) and single persons. “Income” refers to market income, which includes before-tax income generated through employment, investments, retirement pensions and annuities, and excludes income from government transfers. Income deciles reflect equal-sized groups of Ontario families, ordered from lowest to highest income. Each decile contains 10 per cent of Ontario’s 6.5 million families in 2019-20, or approximately 650,000 families.
Source: FAO.
Accessible version
| Family Income | Child Care Operating Funding ($) | CARE Tax Credit ($) |
| Up to $27 | 520 | 2 |
| $28- $11,444 |
452 | 16 |
| $11,445- $25,068 |
412 | 33 |
| $25,069- $39,674 |
404 | 65 |
| $39,675- $55,614 |
327 | 85 |
| $55,615- $76,295 |
226 | 147 |
| $76,296- $99,293 |
147 | 169 |
| $99,294- $131,473 |
126 | 146 |
| $131,474- $188,013 |
159 | 86 |
| Greater than $188,013 |
167 | 0 |
Appendix B: Sources and Methodology
Appendix B provides a brief overview of the sources and methodology the FAO used for the analysis in this report. Additional information on sources and methodology is available upon request.
The FAO’s revenue and expense figures are based on the Province’s 2019-20 Public Accounts. The figures are adjusted by the FAO in several ways. For example:
- In the Public Accounts of Ontario, revenue from the provincial sales tax and Education Property Tax is shown net of certain tax expenditures (such as the Ontario Energy and Property Tax Credit and the Ontario Sales Tax Credit). These tax expenditures are included in the FAO’s analysis as benefits to families from provincial spending, rather than reductions in revenues.
- The FAO excludes estimated revenue collected from non-residents and spending that benefits non-residents. For example, a portion of corporations tax is assumed to be indirectly paid by non-Ontario residents, while a portion of interest on debt payments is assumed to be paid to non-Ontario residents.
- 2019-20 revenue attributed to recoveries and reimbursements from prior year expenditures is excluded from the FAO’s analysis.
To estimate families’ contributions to government revenue, benefits from government spending and their overall net positions, the FAO developed a model that uses data from the Canada Income Survey, the Census, Statistics Canada’s Social Policy Simulation Database/Model (SPSD/M), as well as other Statistics Canada surveys, including the General Social Survey, the Survey of Household Spending and the Survey of Financial Security. These sources provide anonymized data on the household characteristics of respondents, such as income and demographics.
Key assumptions for families’ contribution to government revenue include the following:
- The FAO uses anonymized income and tax data from survey and census respondents to estimate families’ contribution to most provincial revenue categories. For example, for personal income tax (PIT) contributions, the FAO uses actual anonymized Canada Revenue Agency data, while for smaller revenue sources, the FAO uses information about families’ income, demographics and consumption habits to estimate families’ contributions.
- For corporations tax contributions, the FAO assumes 50 per cent of the corporations tax incidence lies with workers (distributed based on employment income) and the remaining 50 per cent lies with shareholders.[23] The FAO assumes 72 per cent of the shareholders’ contributions are from Ontario residents, and distributes this share based on family investment income.
- The FAO assumes all federal transfer revenue to the Province is paid by Ontarians based on analysis which indicates that in 2019 Ontario residents contributed more to federal revenues than they received back in federal transfers.[24] A family’s contribution to federal transfers is estimated based on their contribution to major federal revenue sources, such as the federal PIT.
For the distribution of benefits from government spending, the FAO’s model uses demographic information (such as family size, the presence of children, and the age of family members), income (particularly investment income), expenditure patterns and other data. For interest on debt payments, the FAO assumes that one-third of provincial debt was directly or indirectly owned by Ontario residents, which was distributed based on family investment income.
Footnotes
[1] In this report, “families” refers to “couples living together, with or without children, and lone parents living with their children” (Statistics Canada’s definition of a census family) and single persons.
[2] In this report, “income” refers to market income, which includes before-tax income generated through employment, investments, retirement pensions and annuities, and excludes income from government transfers.
[3] The number of family members and their ages also affect families’ net position. See Figure 8 for an analysis of Ontarians’ net contribution after adjusting for family size.
[4] Income deciles reflect equal-sized groups of Ontario families, ordered from lowest to highest income. Each decile contains 10 per cent of Ontario’s 6.5 million families in 2019-20, or approximately 650,000 families. Many families in the first income decile (with earnings up to $27) earned no market income or may have experienced market income losses. As such, net position as a share of income is not calculated for families in this decile.
[5] The FAO assumes that all federal transfer revenue to the Province is paid by Ontarians. See https://financesofthenation.ca/2020/11/17/who-pays-and-who-receives-in-confederation/.
[6] Note that on average, higher-income families have more children and working-age adults, while lower-income families have more seniors. See Figure 8 for average contributions to provincial revenue per person by family income.
[7] Progressivity refers to a tax or revenue source whose rate increases as the taxable amount (e.g., income) increases. Examples include the personal income tax and the land transfer tax.
[8] See Figure 9. Larger families receive more in government spending from programs that are distributed on a per capita basis, such as health care spending. They are also likely to have more children, which means a larger benefit from education spending. On a per-person basis, lower-income families receive the largest average benefit from government spending (see Figure 8).
[9] In this report, “families” refers to “couples living together, with or without children, and lone parents living with their children” (Statistics Canada’s definition of a census family) and single persons.
[10] In this report, “income” refers to market income, which includes before-tax income generated through employment, investments, retirement pensions and annuities, and excludes income from government transfers.
[11] The number of family members and their ages also affect families’ net position. See Figure 8 in Appendix A for an analysis of Ontarians’ net contribution after adjusting for family size.
[12] Income deciles reflect equal-sized groups of Ontario families, ordered from lowest to highest income. Each decile contains 10 per cent of Ontario’s 6.5 million families in 2019-20, or approximately 650,000 families.
[13] Many families in the first income decile (with earnings up to $27) earned no market income or may have experienced market income losses. As such, net position as a share of income is not calculated for families in this decile.
[14] Larger families receive more in government spending from programs that are distributed on a per capita basis, such as health care spending. They are also likely to have more children, which means a larger benefit from education spending. On a per-person basis, lower-income families receive the largest average benefit from government spending (see Figure 8).
[15] Excludes revenue generated from individuals who resided outside of Ontario.
[16] Note that on average, higher-income families have more children and working-age adults, while lower-income families have more seniors. See Figure 8 for average contributions to provincial revenue per person by family income.
[17] Progressivity refers to a tax or revenue source whose rate increases as the taxable amount (e.g., income) increases. Examples include the personal income tax and the land transfer tax.
[18] The FAO assumes that all federal transfer revenue to the Province is paid by Ontarians. See https://financesofthenation.ca/2020/11/17/who-pays-and-who-receives-in-confederation/.
[19] The Province’s GBEs are the Liquor Control Board of Ontario, the Ontario Lottery and Gaming Corporation, Ontario Power Generation Inc., Hydro One Limited, and the Ontario Cannabis Retail Corporation.
[20] Excludes provincial government spending on individuals who resided outside of Ontario.
[21] On average, higher-income families have more children and working-age adults, while lower-income families have more seniors (Figure 9). For an estimate of average provincial spending and services per person by family income, see Figure 8.
[22] See FAO, “Housing and Homelessness Programs in Ontario,” 2021 and FAO, “Ontario's Energy and Electricity Subsidy Programs: Cost, Recent Changes and the Impact on Electricity Bills,” 2022.
[23] Wiji Arulampalam, Michael P. Devereux and Giorgia Maffini, “The Direct Incidence of Corporate Income Tax on Wages,” 2010.
[24] See https://financesofthenation.ca/2020/11/17/who-pays-and-who-receives-in-confederation/.