


A Review of the Province’s Infrastructure and an Assessment of the State of Repair
1 | Summary
Overview and Background
- Public infrastructure, and the state of repair of that infrastructure, has a direct impact on communities, facilitating the day-to-day operation of the economy and society, as well as providing capacity to deal with economic and social challenges that arise.
- The Government of Ontario (the Province) owns an estimated 38 per cent of public infrastructure in Ontario, municipalities own 52 per cent and the Government of Canada owns 10 per cent.
- This report reviews the infrastructure assets owned by the Province, assesses the state of repair of those assets, and estimates the cost to bring the Province’s assets into a state of good repair in 2020-21 and over the next 10 years.
The Value of the Province’s Infrastructure
- This report focuses on assets that are owned or controlled by the Province.[1] These assets include building infrastructure, engineering infrastructure, and machinery and equipment, and are grouped into six sectors: transit, highways and bridges, hospitals, schools, colleges, and ‘other.’[2]
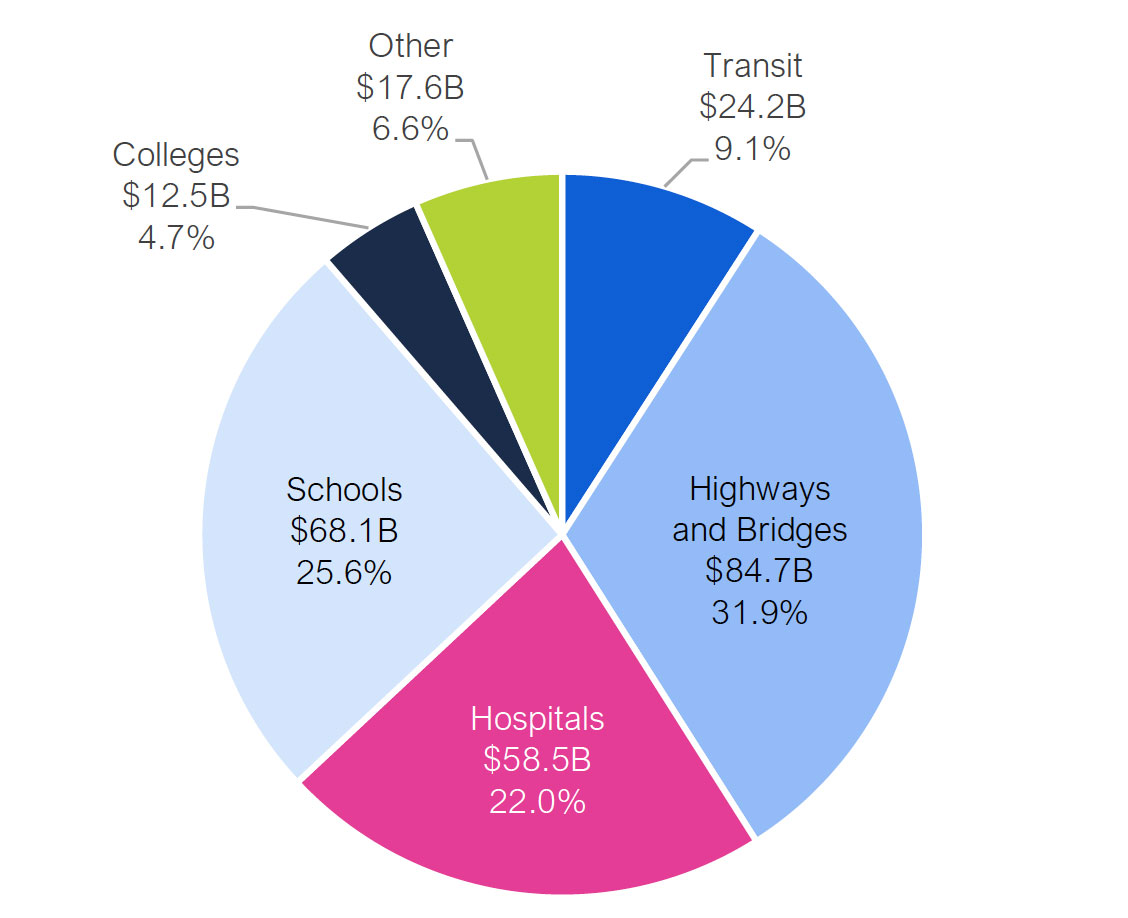
- The FAO estimates that the current replacement value (CRV) of the Province’s infrastructure was $265.6 billion as of March 31, 2020. CRV is the current cost of rebuilding an asset with the equivalent capacity, functionality and performance as the original asset.
- Highways and bridges ($84.7 billion), schools ($68.1 billion) and hospitals ($58.5 billion) account for nearly 80 per cent of the value of the Province’s infrastructure assets.
The State of Repair of the Province’s Infrastructure and the Infrastructure Backlog
- Keeping assets in a state of good repair helps to maximize the benefits of public infrastructure in a cost-effective manner and ensures these assets are operating in a condition that is considered acceptable from both an engineering and cost management perspective.
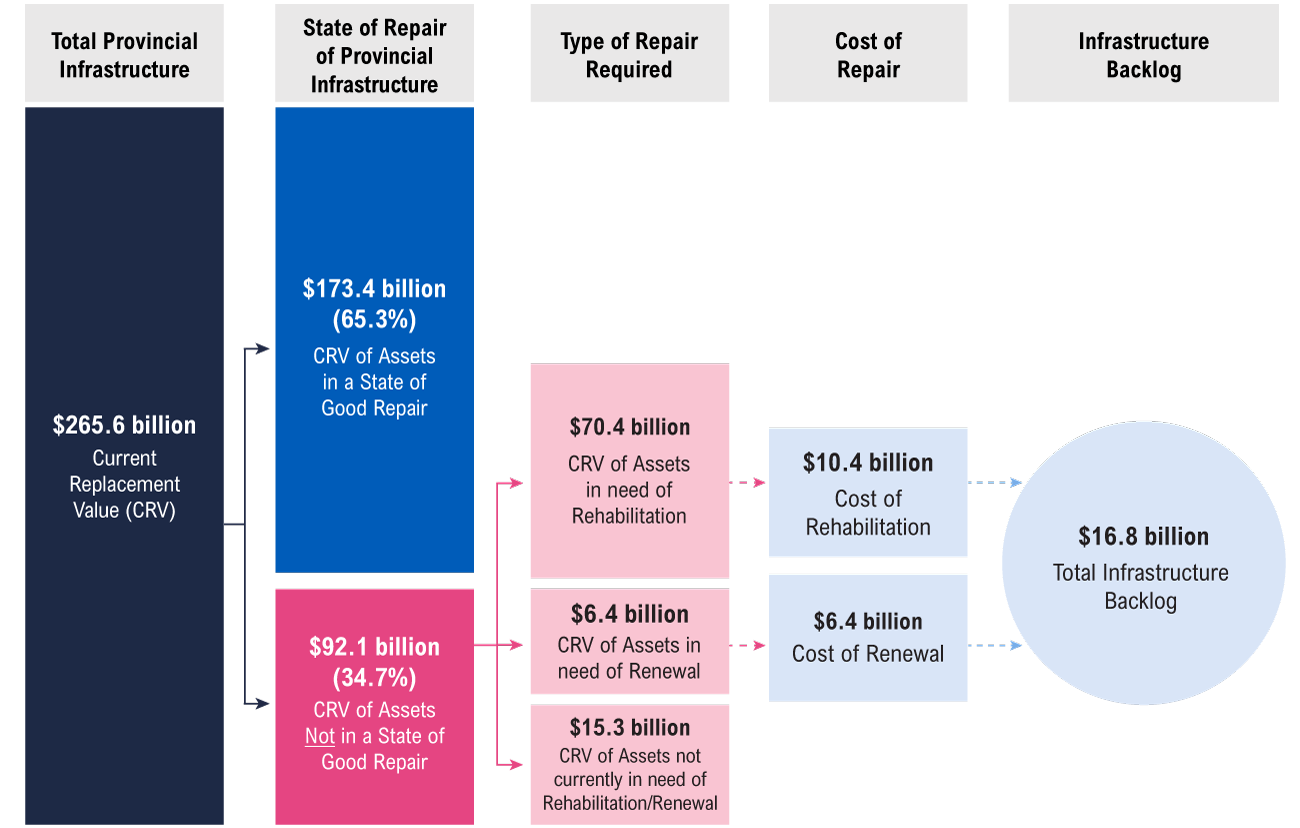
- Based on the FAO’s review, 65.3 per cent of Provincial assets (valued at $173.4 billion) are currently in a state of good repair. The remaining 34.7 per cent of the Province’s assets (valued at $92.1 billion) are not in a state of good repair.
- The highways and bridges, schools and ‘other’ sectors all have a relatively higher share of assets in a state of good repair compared to the provincial average.
- In contrast, only 54.1 per cent of hospitals sector assets are in a state of good repair.
- The capital spending required to bring eligible assets up to a state of good repair is defined in this report as the infrastructure backlog.[3] Estimating the spending required to address the infrastructure backlog helps asset managers plan and budget accordingly.
- The FAO estimates that the current infrastructure backlog totals $16.8 billion. This is the cost to bring the 34.7 per cent of Provincial assets that require capital spending into a state of good repair in 2020-21.[4]
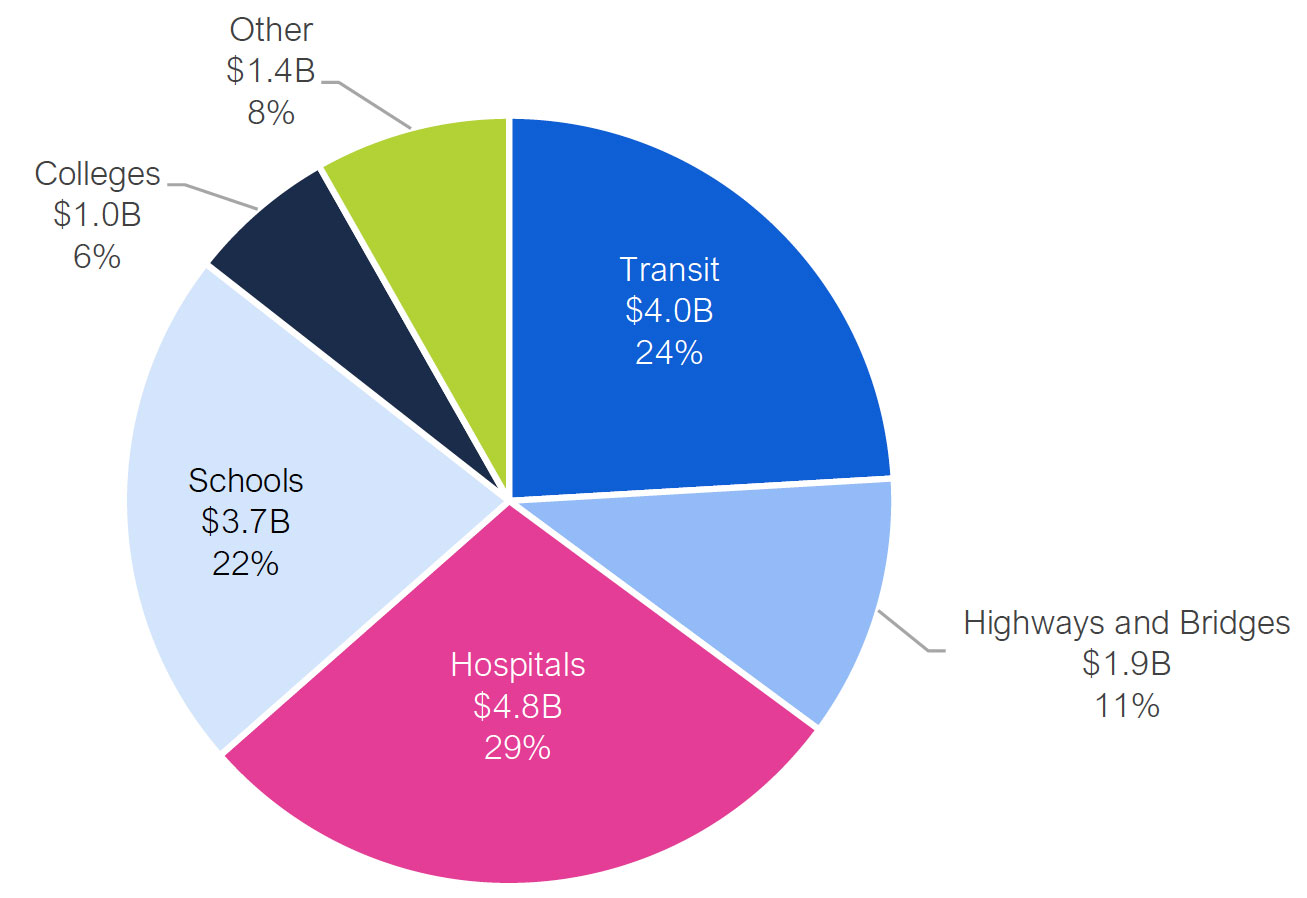
- Hospitals sector assets represent the largest share of the infrastructure backlog at $4.8 billion, followed by transit ($4.0 billion) and schools ($3.7 billion). The infrastructure backlog for the highways and bridges sector is $1.9 billion, $1.4 billion for the ‘other’ sector and $1.0 billion for the colleges sector.
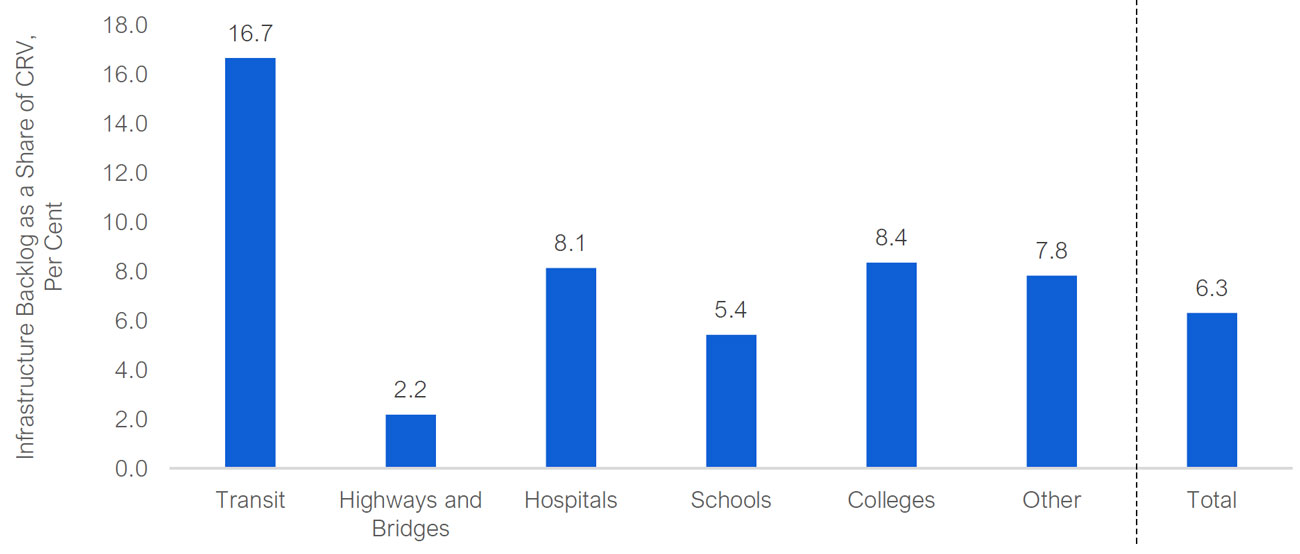
- On a relative basis, Ontario’s highways and bridges sector has the lowest infrastructure backlog relative to the size of the sector’s assets (2.2 per cent), implying that assets in this sector are in relatively better condition compared to the other sectors. In contrast, the transit sector has by far the largest infrastructure backlog as a share of the sector’s assets (16.7 per cent), implying that assets in the transit sector are in worse condition compared to other Provincial assets.
- For information on the state of repair and infrastructure backlog by economic region, see Appendix A. For a complete sectoral and asset-type breakdown of the state of repair and infrastructure backlog, see Appendix B.
Provincial infrastructure, the state of repair and the infrastructure backlog, 2020-21
Source: FAO analysis of information provided by the Ministry of Infrastructure and several other ministries as detailed in Appendix C.
Accessible version
| ($ Billions) | Total Provincial Infrastructure | State of Repair of Provincial Infrastructure | Type of Spending Required | Infrastructure Backlog |
|---|---|---|---|---|
| Current Replacement Value (CRV) | 265.6 | |||
| CRV of Assets in a State of Good Repair | 173.4 | |||
| CRV of Assets Not in a State of Good Repair | 92.1 | |||
| CRV of Assets in Need of Rehabilitation | 70.4 | |||
| CRV of Assets in Need of Renewal | 6.4 | |||
| CRV of Assets that currently do not need Rehabilitation/Renewal | 15.3 | |||
| Cost of Rehabilitation | 10.4 | |||
| Cost of Renewal | 6.4 | |||
| Total Infrastructure Backlog | 16.8 |
Addressing the Province’s Infrastructure Backlog
- Eliminating the $16.8 billion infrastructure backlog entirely in 2020-21 is not realistic due to capacity constraints and the development time required for complex infrastructure projects.
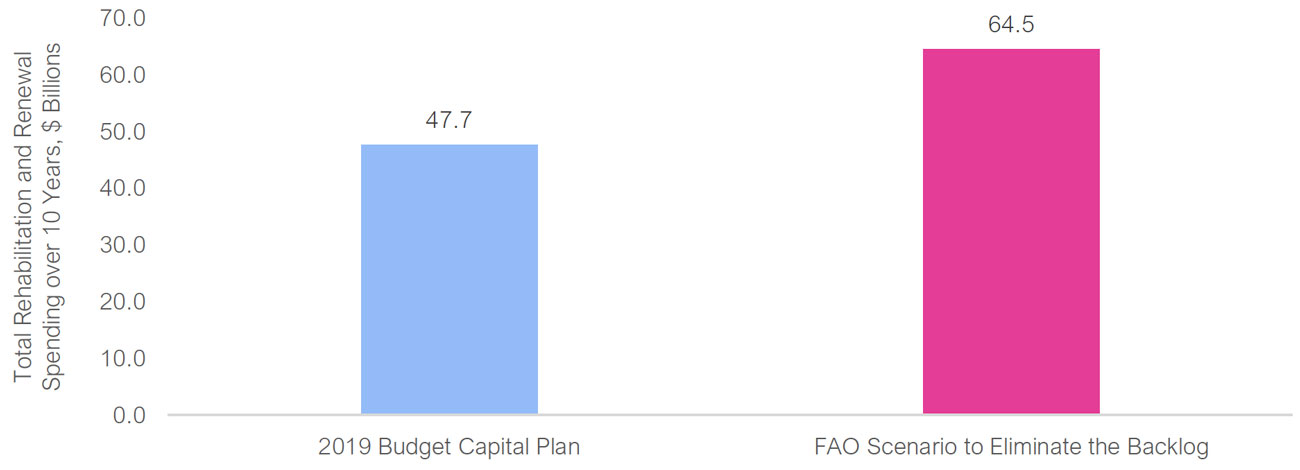
- Instead, the FAO estimates that the cost (in nominal dollars) to eliminate the infrastructure backlog over five years, and then maintain all of the Province’s assets in a state of good repair, as appropriate, over the following five years is $64.5 billion. This represents an annual average investment over 10 years of $6.5 billion.[5]
- In comparison, the FAO estimates that the 10-year capital plan in the 2019 Ontario Budget only earmarked $47.7 billion in spending to address the infrastructure backlog. This amounts to a $16.9 billion (or 35 per cent) funding shortfall or gap between what is necessary to eliminate the infrastructure backlog and maintain the Province’s assets in a state of good repair, and what is included in the capital plan. As a result, the 2019 budget’s capital plan will not adequately address the Province’s infrastructure backlog over the next 10 years.[6]
- Based on the 2019 budget’s capital plan, the Province’s infrastructure backlog is projected to decline from its current value of $16.8 billion to a low of $8.2 billion by 2022-23 and then remain relatively stable until 2025-26. However, the backlog is projected to increase significantly over the 2026-27 to 2029-30 period, as the Province’s capital plan over this period calls for relatively more spending on new infrastructure and less on addressing the condition of existing assets. By 2029-30, the Province’s infrastructure backlog is expected to reach $22.7 billion.
- Finally, the FAO reviewed the $16.9 billion funding shortfall in the 2019 budget by sector and found that highways and bridges was the only sector with sufficient funding over the next 10 years to completely eliminate the infrastructure backlog.
- All other sectors had funding gaps, with the largest funding shortfall in the transit sector ($7.2 billion funding gap), followed by colleges ($3.2 billion funding gap), the ‘other’ sector ($2.9 billion funding gap), hospitals ($2.5 billion funding gap) and schools ($1.9 billion funding gap).
2 | Introduction and Background
Overview of Public Infrastructure
Public infrastructure, and the state of repair of that infrastructure, has a direct impact on communities, facilitating the day-to-day operation of the economy and society, as well as providing capacity to deal with economic and social challenges that arise.[7]
Infrastructure assets are generally capital intensive, require extended development periods, and tend to have long useful lives.[8] Public infrastructure assets in Ontario include buildings, such as schools and hospitals; engineering infrastructure, such as the highway network and sewage and water systems; and machinery and equipment (M&E), such as transit buses and hospital equipment.
The Government of Ontario (the Province) owns about 38 per cent of public infrastructure in Ontario, with municipalities owning 52 per cent and the Government of Canada owning 10 per cent.[9] Ownership of public infrastructure varies by the type of asset. For example, sewage infrastructure is largely owned by municipalities, while ownership of transportation infrastructure (road and highway networks and transit assets) is distributed largely between the Province and municipalities.[10]
Figure 2‑1 Public infrastructure ownership in Ontario by level of government
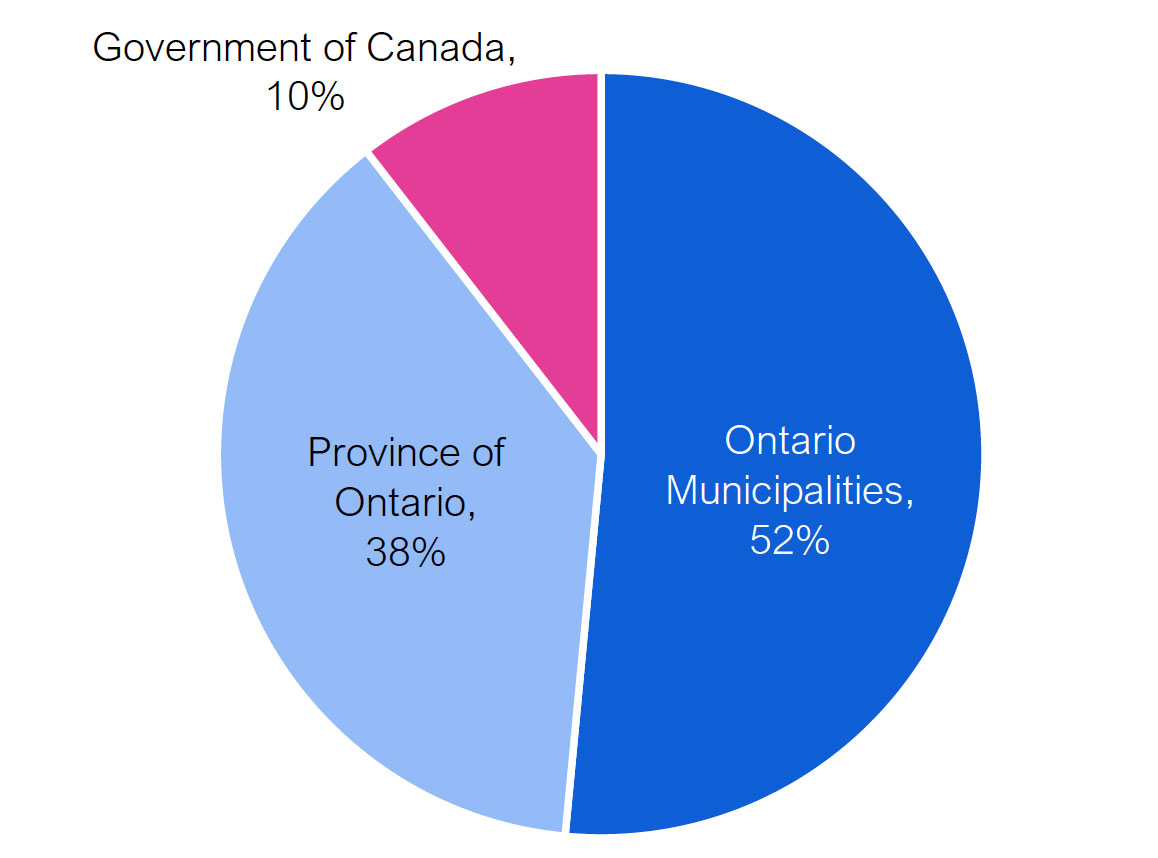
Note: Includes only tangible capital assets that are consolidated on government balance sheets. Excludes non-consolidated assets, such as university buildings, and excludes assets owned by government business enterprises, such as Ontario Power Generation.
Source: FAO analysis of the Ministry of Municipal Affairs and Housing’s Financial Information Return, Public Accounts of Ontario, and Public Accounts of Canada.
Accessible version
| Per Cent | |
|---|---|
| Ontario Municipalities | 52 |
| Province of Ontario | 38 |
| Government of Canada | 10 |
State of Repair and Infrastructure Backlog
Assessing the state of repair of public infrastructure, and determining the capital investment needed for those assets, helps to ensure that the Province’s infrastructure delivers the services which it was placed into operation to provide.[11] Keeping assets in a state of good repair[12] helps to maximize the benefits of public infrastructure in a cost-effective manner and ensures these assets are operating in a condition that is considered acceptable from both an engineering[13] and cost management perspective.
New assets enter service in a state of good repair. However, over time, as an asset deteriorates due to aging and ongoing use, the asset eventually falls out of a state of good repair, at which point capital rehabilitation projects could be undertaken to maximize the service life of the asset. Falling out of a state of good repair does not necessarily mean that the asset is unsafe for use or that the asset is not providing the services, or fulfilling the function, it was placed into operation to provide.
Generally, when an asset is no longer in a state of good repair, managers endeavor to bring it back into a state of good repair. The cost required to bring eligible assets into a state of good repair is defined in this report as the infrastructure backlog.[14] This cost includes both rehabilitating[15] assets that have fallen out of a state of good repair, and renewing[16] assets that cannot or should not be rehabilitated.
The calculations presented in this report are largely based on information provided by the Ministry of Infrastructure, which standardized information received from various ministries. This information is then modelled through a series of simplified asset management decisions to estimate the state of repair of the Province’s infrastructure and the current and future infrastructure backlog.[17]
Purpose of this Report
The purpose of this report is to provide an overview of the infrastructure assets owned by the Province and an assessment of the state of repair of those assets. The first section of this report reviews the infrastructure owned by the Province and provides an estimate of its value. The second section assesses the state of repair of the Province’s infrastructure and provides an estimate of the infrastructure backlog. The final section of the report forecasts the capital investment required to eliminate the infrastructure backlog and maintain the Province’s assets in a state of good repair over the next 10 years. The report then compares this level of capital investment against the Province’s capital plan from the 2019 Ontario Budget.[18]
This report does not analyze the Province’s fiscal capacity to undertake the amount of capital investment required to eliminate the infrastructure backlog, nor does it assess the Province’s infrastructure stock against current demand and future expansion needs. Also, this report does not provide a jurisdictional comparison as the different definitions and methodologies used by various jurisdictions and organizations to estimate the state of repair and the infrastructure backlog could lead to inaccurate comparisons.
Appendix C provides more information on the development of this report.
3 | The Province’s Infrastructure
What Infrastructure Does the Province Own?
This report focuses on infrastructure assets that are consolidated on the Province’s financial statements. Consolidated assets include those owned by the Province, such as Highway 401, and assets deemed under Provincial control, such as school buildings. Infrastructure assets deemed under the Province’s control include those owned by Provincial agencies (e.g., Metrolinx) and those owned by broader public sector (BPS) organizations, which includes Ontario’s hospitals, school boards and colleges. Table 3‑1 summarizes the infrastructure assets owned and controlled by the Province. For each sector, the table shows the different types of infrastructure assets included – buildings, machinery and equipment (M&E) or engineering infrastructure – and provides a brief description of those assets.[19]
| Sector | Asset-Types | Description |
|---|---|---|
| Transit |
Buildings Machinery & Equipment Engineering Infrastructure |
|
| Highways and Bridges |
Engineering Infrastructure |
|
| Hospitals |
Buildings Machinery & Equipment |
|
| Schools |
Buildings Machinery & Equipment |
|
| Colleges |
Buildings Machinery & Equipment |
|
| Other |
Buildings Machinery & Equipment Engineering Infrastructure |
|
Non-consolidated public infrastructure funded by the Province
Infrastructure assets that are not owned or controlled by the Province (i.e., that are not consolidated onto the Province’s financial statements) are beyond the scope of this report. However, each year the Province provides a significant amount of funding (approximately $2.9 billion in 2020-21) for infrastructure assets that are not owned or controlled by the Province. The recipients of these funds include provincial transfer payment partners and municipalities. Assets owned by provincial transfer payment partners include:
- universities;
- social service facilities; and
- long-term care facilities.
Assets owned by municipalities include:
- municipal roads and bridges;
- municipal transit;
- water and wastewater systems;
- stormwater and sewer systems; and
- other municipal assets, such as culture and recreation facilities or social housing.
The Value of the Province’s Infrastructure
In the Public Accounts of Ontario, the Province reports the value of its consolidated infrastructure as the net book value of tangible capital assets ($126 billion as of March 31, 2020).[21] Adding back accumulated amortization[22] yields the historical cost of the Province’s infrastructure ($191 billion as of March 31, 2020).
Current replacement value (CRV) is a more appropriate and relevant value measurement for infrastructure planning purposes. CRV is the current cost of rebuilding an asset with the equivalent capacity, functionality and performance as the original asset. In contrast to historical cost, CRV is adjusted for inflation and provides an estimate of the value of an asset in today’s dollars.[23] Despite its importance for asset management purposes, CRV is not a measurement that is reported on the Province’s financial statements.[24]
Overall, the FAO estimates that the CRV of the Province’s infrastructure was $265.6 billion, as of March 31, 2020.[25]
Figure 3‑1 The current replacement value of the Province’s infrastructure is $265.6 billion in 2020
Source: FAO analysis of information provided by the Ministry of Infrastructure and several other ministries as detailed in Appendix C.
Accessible version
| Sector | ($ Billions) | Per Cent |
|---|---|---|
| Transit | 24.2 | 9.1 |
| Highways and Bridges | 84.7 | 31.9 |
| Hospitals | 58.5 | 58.5 |
| Schools | 68.1 | 68.1 |
| Colleges | 12.5 | 12.5 |
| Other | 17.6 | 17.6 |
| Sector | Total CRV (billions) | Description |
|---|---|---|
| Transit | $24.2 | · $13.6 billion in engineering infrastructure (e.g., rail corridors) owned by Metrolinx and Ontario Northland Transportation Commission (ONTC). $10.6 billion in buildings and machinery and equipment (e.g., locomotives). |
| Highways and Bridges | $84.7 | · $56.4 billion in roads and highways engineering infrastructure, which includes over 40,000 lane kilometres of pavement. $28.3 billion in other engineering infrastructure, which includes about 2,800 bridges and 2,000 culverts. |
| Hospitals | $58.5 | · $44.7 billion in buildings and $13.8 billion in machinery and equipment. |
| Schools | $68.1 | · $67.4 billion in buildings and $0.7 billion in machinery and equipment. |
| Colleges | $12.5 | · $10.6 billion in buildings and $1.9 billion in machinery and equipment. |
| Other | $17.6 | · $12.9 billion in buildings (e.g., government owned offices, special purpose buildings, correctional facilities, courthouses, etc.), $2.1 billion in engineering infrastructure, and $2.6 billion in machinery and equipment. |
4 | The State of Repair of the Province’s Infrastructure
Why State of Repair is Important
The state of repair of public infrastructure has a direct impact on the communities that the assets are designed to serve. Assessing the state of repair of the Province’s infrastructure, and determining the capital investment needed for those assets, helps to ensure that the Province’s infrastructure operates as intended.[26]
Keeping assets in a state of good repair[27] helps to maximize the benefits of public infrastructure in a cost-effective manner and ensures these assets are operating in a condition that is considered acceptable from both an engineering[28] and cost management perspective.
New assets enter service in a state of good repair. However, over time, as an asset deteriorates due to aging and ongoing use, the asset eventually falls out of a state of good repair, at which point capital rehabilitation projects could be undertaken to maximize the service life of the asset. Falling out of a state of good repair does not necessarily mean that the asset is unsafe for use or that the asset is not providing the services, or fulfilling the function, it was placed into operation to provide.
To assess whether assets are in a state of good repair, the FAO compared an asset’s condition[29] against standardized performance targets provided by the Ministry of Infrastructure.[30] For each asset, these performance standards include repair targets, failure thresholds and useful life.[31]
Details on the State of Repair of Provincial Infrastructure
As discussed in Chapter 3, the current replacement value (CRV) of the Province’s infrastructure assets is $265.6 billion. Based on the FAO’s analysis, 65.3 per cent of these assets (valued at $173.4 billion) are currently in a state of good repair. The remaining 34.7 per cent of the Province’s assets (valued at $92.1 billion) are not in a state of good repair.
There is considerable variation in the state of repair of the Province’s assets among sectors. Overall, the highways and bridges sector has a relatively higher share of assets (77.3 per cent) in a state of good repair compared to the provincial average of 65.3 per cent. The schools and ‘other’ sectors also have a relatively higher share of assets in a state of good repair compared to the provincial average, at 71.6 per cent and 71.1 per cent, respectively.
In contrast, only 54.1 per cent of hospitals sector assets are in a state of good repair, well below the overall average for Provincial assets. In the colleges sector, almost two-thirds of assets (65.1 per cent) are in a state of good repair, consistent with the provincial average.
Importantly, the FAO could not accurately calculate the share of assets in a state of good repair for the transit sector as Metrolinx (which owns $23.2 billion in assets) and Ontario Northland Transportation Commission (ONTC) (which owns $1.0 billion in assets) were unable to provide the FAO with asset-level detail on the condition of their assets.[32]
Figure 4‑1 State of repair of Ontario’s infrastructure by sector
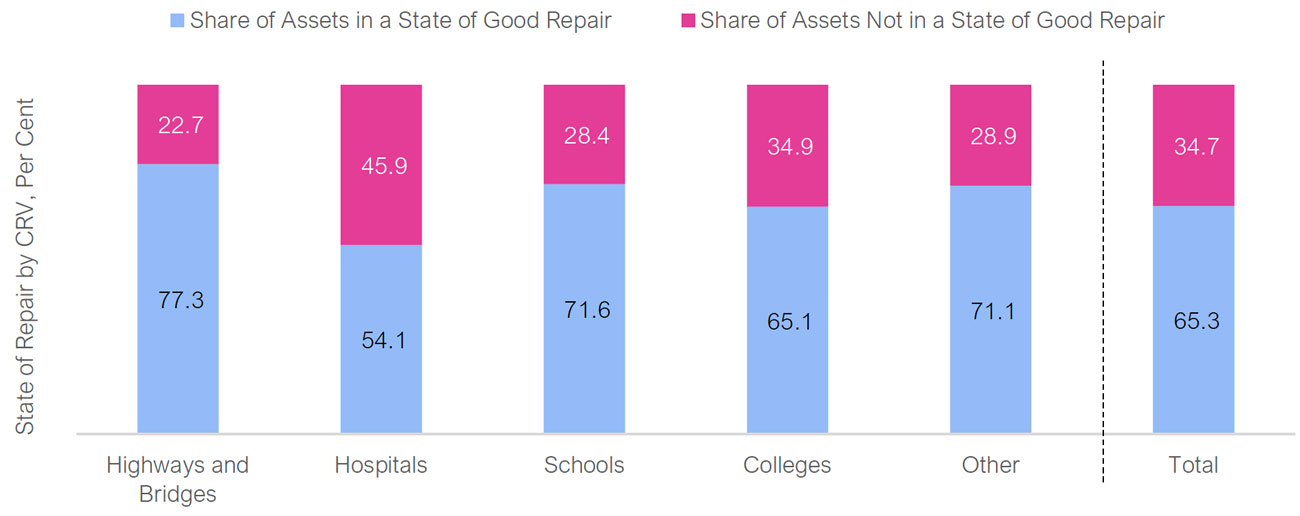
Note: Transit sector assets are not presented separately in this chart as Metrolinx and ONTC were unable to provide the FAO with asset-level condition information.
Source: FAO analysis of information provided by the Ministry of Infrastructure and several other ministries as detailed in Appendix C.
Accessible version
| State of Repair by CRV (Per Cent) | Share of Assets in a State of Good Repair | Share of Assets Not in a State of Good Repair |
|---|---|---|
| Highways and Bridges | 77.3 | 22.7 |
| Hospitals | 54.1 | 45.9 |
| Schools | 71.6 | 28.4 |
| Colleges | 65.1 | 34.9 |
| Other | 71.1 | 28.9 |
| Total | 65.3 | 34.7 |
What is the Infrastructure Backlog?
Generally, when an asset is no longer in a state of good repair, managers endeavor to bring the asset back into a state of good repair. The cost required to bring eligible assets up to a state of good repair is defined in this report as the infrastructure backlog.[33] This cost includes both rehabilitating[34] assets that have fallen out of a state of good repair, and renewing[35] assets that cannot or should not be rehabilitated.
Estimating the spending required to address the infrastructure backlog helps asset managers plan and budget accordingly.
Importantly, while some assets may not be in a state of good repair, it may be a prudent asset management strategy to not immediately undertake rehabilitation or renewal. For example, older assets that are no longer in a state of good repair might be left to deteriorate for several years before being completely replaced.[36] Optimal asset management strategies will focus on maximizing the use of an asset while minimizing related costs.
The calculations for the infrastructure backlog presented in this report are largely based on information provided by the Ministry of Infrastructure, which standardized information received from various ministries. This information is then modelled through a series of simplified asset management decisions to estimate the infrastructure backlog.[37]
The Province’s Infrastructure Backlog
Based on the state of repair of Provincial infrastructure, the FAO estimates that the current infrastructure backlog totals $16.8 billion. The backlog is comprised of:
- $10.4 billion in rehabilitation costs, which are required to bring the $70.4 billion worth of assets in need of rehabilitation back to a state of good repair; and
- $6.4 billion in renewal costs, which are required for $6.4 billion worth of assets in need of replacement.
Importantly, of the $92.1 billion in Provincial assets that are not in a state of good repair, roughly 83 per cent ($76.8 billion) currently require capital spending on rehabilitation or renewal. The remaining 17 per cent of assets ($15.3 billion) that are not in a state of good repair, do not currently require capital spending, and are not included in the infrastructure backlog.[38]
Figure 4‑2 State of repair and the infrastructure backlog
Source: FAO analysis of information provided by the Ministry of Infrastructure and several other ministries as detailed in Appendix C.
Accessible version
| ($ Billions) | Total Provincial Infrastructure | State of Repair of Provincial Infrastructure | Type of Spending Required | Infrastructure Backlog |
|---|---|---|---|---|
| Current Replacement Value (CRV) | 265.6 | |||
| CRV of Assets in a State of Good Repair | 173.4 | |||
| CRV of Assets Not in a State of Good Repair | 92.1 | |||
| CRV of Assets in Need of Rehabilitation | 70.4 | |||
| CRV of Assets in Need of Renewal | 6.4 | |||
| CRV of Assets that currently do not need Rehabilitation/Renewal | 15.3 | |||
| Cost of Rehabilitation | 10.4 | |||
| Cost of Renewal | 6.4 | |||
| Total Infrastructure Backlog | 16.8 |
On a sector level, hospitals represent the largest share of the infrastructure backlog at $4.8 billion, followed by transit[39] ($4.0 billion) and schools ($3.7 billion). The infrastructure backlog for the highways and bridges sector is $1.9 billion, $1.4 billion for the ‘other’ sector and $1.0 billion for the colleges sector.
Figure 4‑3 Ontario’s $16.8 billion infrastructure backlog by sector
Source: FAO analysis of information provided by the Ministry of Infrastructure and several other ministries as detailed in Appendix C.
Accessible version
| ($ Billions) | Per Cent | |
|---|---|---|
| Transit | 4.0 | 24 |
| Highways and Bridges | 1.9 | 11 |
| Hospitals | 4.8 | 29 |
| Schools | 3.7 | 22 |
| Colleges | 1.0 | 6 |
| Other | 1.4 | 8 |
The Province’s infrastructure backlog can also be presented as a share of CRV. This ratio provides a measurement of average asset condition[40] and allows for comparisons across sectors, asset-types and regions. Overall, Ontario’s infrastructure backlog of $16.8 billion represents 6.3 per cent of the current replacement value of the Province’s infrastructure.
Figure 4‑4 Infrastructure backlog relative to the current replacement value of each sector
Source: FAO analysis of information provided by the Ministry of Infrastructure and several other ministries as detailed in Appendix C.
Accessible version
| Per Cent | ||
|---|---|---|
| Transit | 16.7 | |
| Highways and Bridges | 2.2 | |
| Hospitals | 8.1 | |
| Schools | 5.4 | |
| Colleges | 8.4 | |
| Other | 7.8 | |
| Total | 6.3 |
- Ontario’s highways and bridges sector has the lowest infrastructure backlog relative to the size of the sector’s assets (2.2 per cent), implying that assets in this sector are in relatively better condition compared to the other sectors.
- In contrast, the transit sector has by far the largest infrastructure backlog as a share of current replacement value, at 16.7 per cent, implying that assets in this sector are in worse condition compared to other sectors.
- The hospitals sector, which has the largest infrastructure backlog in magnitude ($4.8 billion), also has an infrastructure backlog as a share of total current replacement value (8.1 per cent) that is higher than the overall provincial average (6.3 per cent).
- The schools sector has the third highest infrastructure backlog by total magnitude ($3.7 billion) but has a lower than average backlog relative to the current replacement value of the sector’s assets (5.4 per cent). This indicates that school assets are in relatively better condition than assets in the other sectors, with the exception of highways and bridges.
- Finally, the colleges and ‘other’ sectors, with infrastructure backlogs of $1.0 billion (8.4 per cent as a share of current replacement value) and $1.4 billion (7.8 per cent as a share of current replacement value), respectively, both require a higher than average level of rehabilitation and renewal spending, relative to the size of each sector’s assets.
State of Repair and Infrastructure Backlog by Region and Sector
For information on the state of repair and infrastructure backlog by economic region, see Appendix A.
For a complete sectoral and asset-type breakdown of the state of repair and infrastructure backlog see Appendix B.
5 | Addressing the Province’s Infrastructure Backlog
The $16.8 billion infrastructure backlog discussed in Chapter 4 is the estimated cost to immediately address the backlog and perform all required rehabilitation and renewal by the end of the 2020-21 fiscal year. However, given the size of the infrastructure backlog, eliminating the backlog in one year is not realistic due to capacity constraints and the development time required for complex infrastructure projects.
Eliminating the Infrastructure Backlog
Given that it is not feasible to eliminate the infrastructure backlog in one year, the FAO estimated the cost to eliminate the infrastructure backlog over five years and then maintain all of the Province’s assets in a state of good repair, as appropriate, over the following five years. Overall, the FAO estimates that the Province would be required to invest approximately $64.5 billion over 10 years,[41] representing an annual average investment of $6.5 billion (in nominal dollars). Under this scenario:
- $29.8 billion would be required to eliminate the infrastructure backlog over the first five years (2020-21 to 2024-25).
- $34.7 billion would be required over the following five years (2025-26 to 2029-30) to maintain the Province’s infrastructure in a state of good repair.
A Review of the 2019 Capital Plan
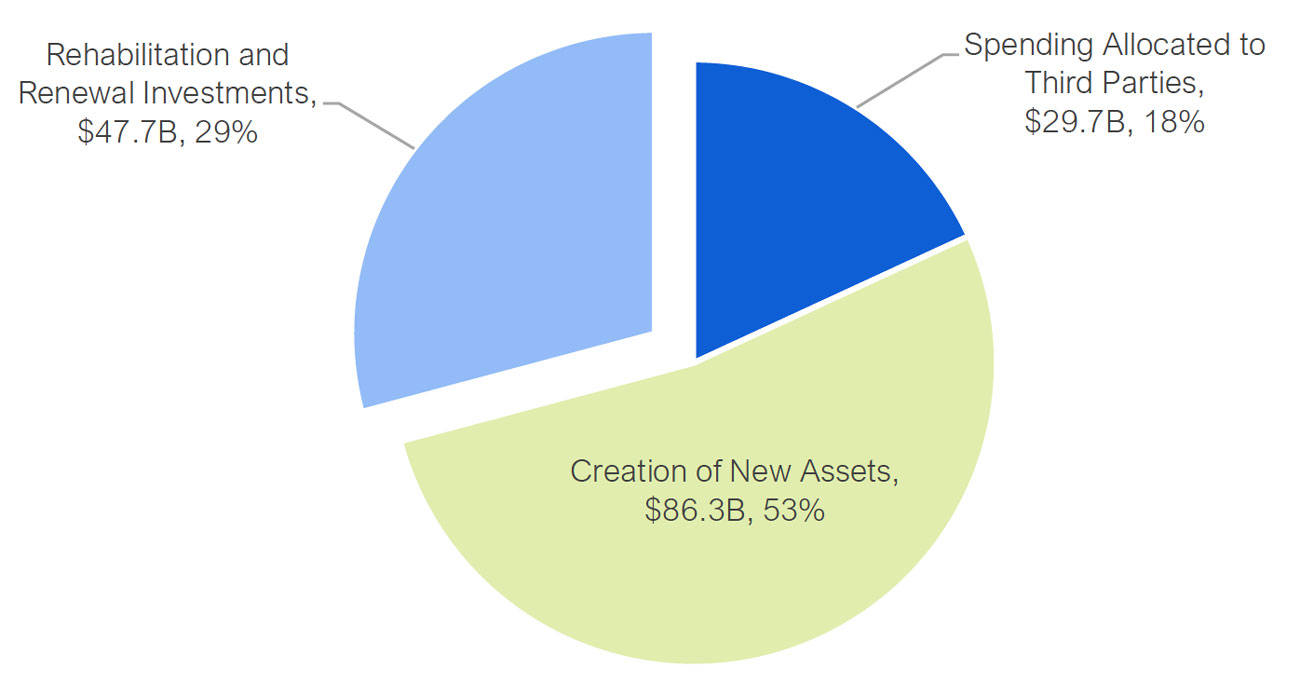
In the 2019 Ontario Budget, the Province presented a 10-year capital plan with projected infrastructure spending of $163.6 billion.[42] The Province’s capital plan includes spending allocated to third parties (such as universities and municipalities), for the creation of new assets to meet demand (i.e., building new transit lines or new schools) and for rehabilitation and renewal investments (i.e., to bring the Province’s existing infrastructure into a state of good repair).
Based on the FAO’s review of the Province’s 2019 budget 10-year capital plan,[43] $29.7 billion (18 per cent) was earmarked for third parties or other capital spending, $86.3 billion (53 per cent) was for the creation of new assets, while only $47.7 billion (29 per cent) was earmarked for rehabilitation and renewal investments to address the infrastructure backlog.[44]
Figure 5‑1 Spending to address the infrastructure backlog (rehabilitation and renewal) accounts for 29 per cent of the Province’s 2019 budget 10-year capital plan
Source: FAO analysis of information provided by Treasury Board Secretariat.
Accessible version
| ($ Billions) | Per Cent | |
|---|---|---|
| Spending Allocated to Third-Parties | 29.7 | 18 |
| Creation of New Assets | 86.3 | 53 |
| Rehabilitation and Renewal Investments | 47.7 | 29 |
The difference between the FAO’s estimate of $64.5 billion required to address the infrastructure backlog and the $47.7 billion in rehabilitation and renewal spending in the 2019 budget’s 10-year capital plan results in a $16.9 billion (or 35 per cent) funding shortfall or gap. As a result, the 2019 budget capital plan will not adequately address the Province’s infrastructure backlog over the next 10 years.
Figure 5‑2 Province’s 2019 budget 10-year capital plan will not eliminate the infrastructure backlog
Source: FAO analysis of information provided by Treasury Board Secretariat and several other ministries as detailed in Appendix C.
Accessible version
| Total Rehabilitation and Renewal Spending over 10 Years | ($ Billions) |
|---|---|
| 2019 Budget Capital Plan | 47.7 |
| FAO Scenario to Eliminate the Backlog | 64.5 |
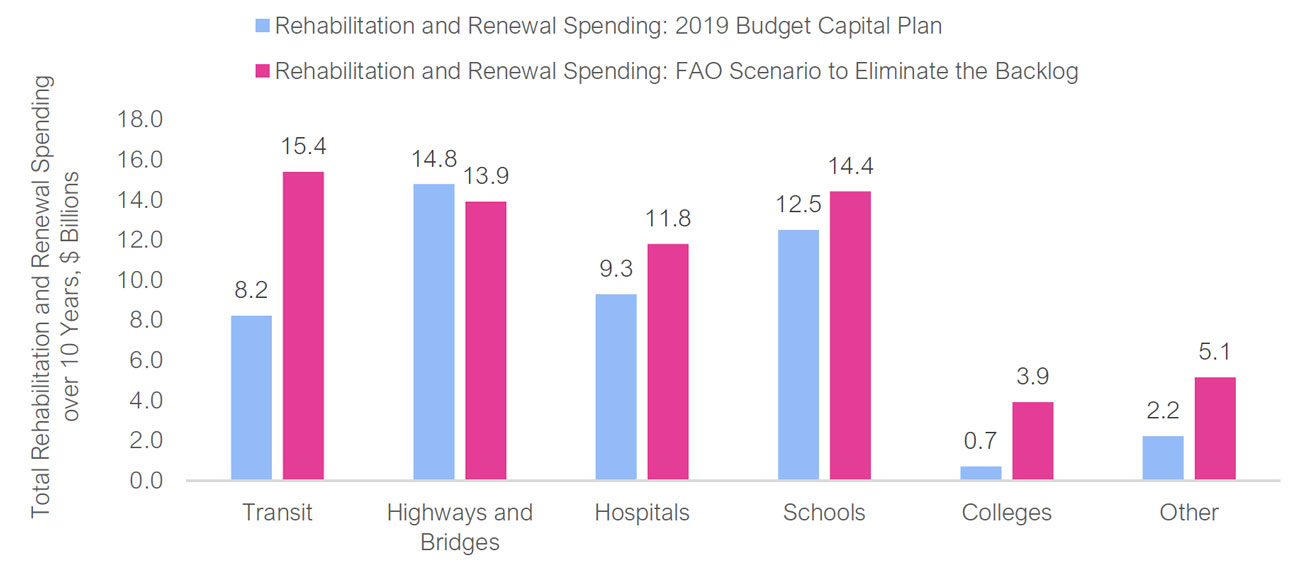
The FAO also reviewed the $16.9 billion funding shortfall by sector[45] and found that highways and bridges was the only sector with sufficient funding over the next 10 years to completely eliminate the infrastructure backlog. In fact, planned capital spending in the highways and bridges sector was $0.9 billion more than required to keep highways and bridges sector assets in a state of good repair over the next 10 years.
In contrast, all other sectors had funding shortfalls in the 2019 budget capital plan, meaning that the capital plan does not include enough funds to address the infrastructure backlog and keep assets in these sectors in a state of good repair. The largest funding gap was in the transit sector, with a shortfall of $7.2 billion over the next 10 years, followed by the colleges sector ($3.2 billion funding shortfall), the ‘other’ sector ($2.9 billion funding shortfall), hospitals ($2.5 billion funding shortfall) and schools ($1.9 billion funding shortfall).
Figure 5‑3 Comparison of 2019 budget 10-year capital plan spending against required spending to eliminate the infrastructure backlog by sector
Source: FAO analysis of information provided by Treasury Board Secretariat and several other ministries as detailed in Appendix C.
Accessible version
| Rehabilitation and Renewal Spending over 10 Years, ($ Billions) |
2019 Budget Capital Plan | FAO Scenario to Eliminate the Backlog |
|---|---|---|
| Transit | 8.2 | 15.4 |
| Highways and Bridges | 14.8 | 13.9 |
| Hospitals | 9.3 | 11.8 |
| Schools | 12.5 | 14.4 |
| Colleges | 0.7 | 3.9 |
| Other | 2.2 | 5.1 |
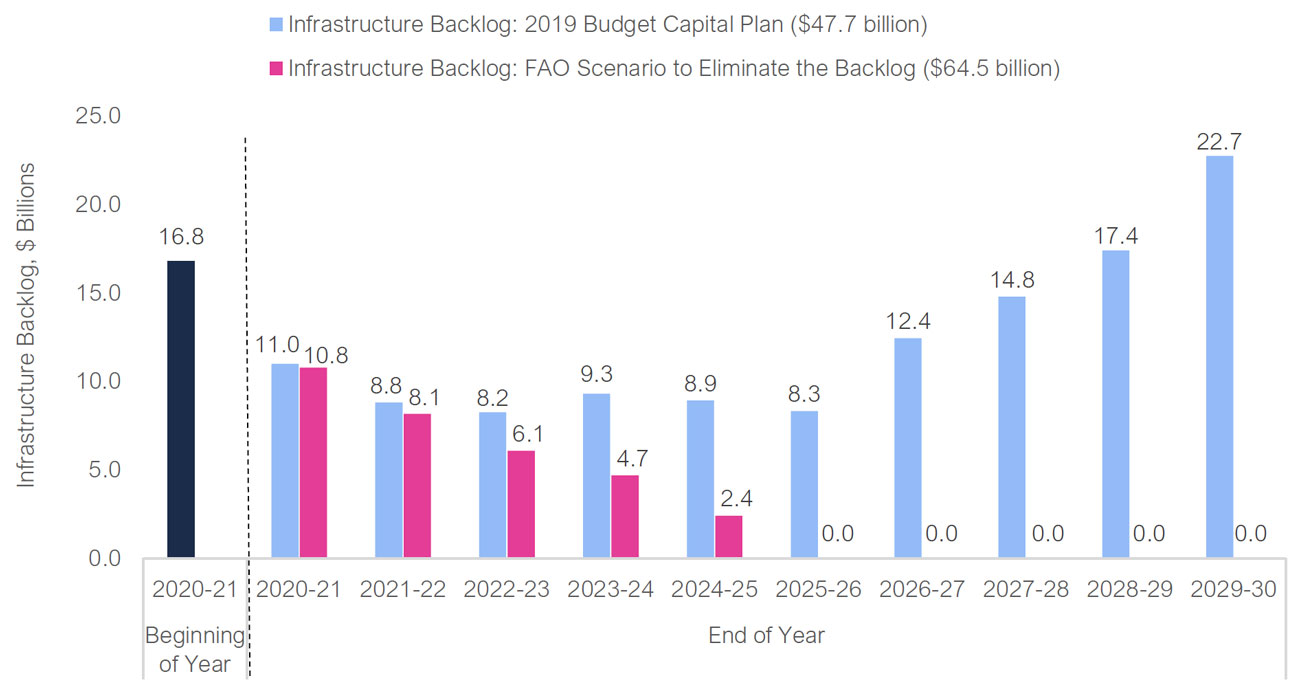
Finally, the FAO projects that the rehabilitation and renewal spending in the 2019 budget will lower the Province’s infrastructure backlog from its current value of $16.8 billion to $8.2 billion by 2022-23 and remain relatively stable until 2025-26. The infrastructure backlog is then projected to increase significantly between 2026-27 and 2029-30, as the Province’s capital plan calls for relatively more spending on new infrastructure and less on addressing the condition of existing assets. By 2029-30, the Province’s infrastructure backlog is expected to reach $22.7 billion.[46]
As a share of current replacement value, the infrastructure backlog is projected to increase from 6.3 per cent in 2020-21 to 7.1 per cent by the end of 2029-30, indicating that the overall average condition of the Province’s assets would be expected to deteriorate over the next 10 years, based on the 2019 budget’s capital plan.
Figure 5‑4 Infrastructure backlog projected to grow to $22.7 billion under the Province’s 2019 budget 10-year capital plan
Source: FAO analysis of information provided by Treasury Board Secretariat and several other ministries as detailed in Appendix C.
Accessible version
| Infrastructure Backlog, End of Year ($ Billions) |
2019 Budget Capital Plan ($47.7 billion) |
FAO Scenario to Eliminate the Backlog ($64.5 billion) |
|---|---|---|
| Beginning of year, 2020-21 | 16.8 | 16.8 |
| 2020-21 | 11.0 | 10.8 |
| 2021-22 | 8.8 | 8.1 |
| 2022-23 | 8.2 | 6.1 |
| 2023-24 | 9.3 | 4.7 |
| 2024-25 | 8.9 | 2.4 |
| 2025-26 | 8.3 | 0.0 |
| 2026-27 | 12.4 | 0.0 |
| 2027-28 | 14.8 | 0.0 |
| 2028-29 | 17.4 | 0.0 |
| 2029-30 | 22.7 | 0.0 |
6 | Appendices
A. State of Repair by Economic Region
This appendix examines the state of repair of the Province’s infrastructure by economic region.[47] The assets presented in this section include only those for which geographic information[48] was available (82.1 per cent of the Province’s assets) and include all highways and bridges sector assets as well as all buildings in the hospitals, schools, colleges and ‘other’ sectors. The remaining 17.9 per cent of assets (by CRV) do not have geographic information and are excluded from this regional analysis.[49]
Figure 6‑1 Share of Provincial assets in a state of good repair by economic region
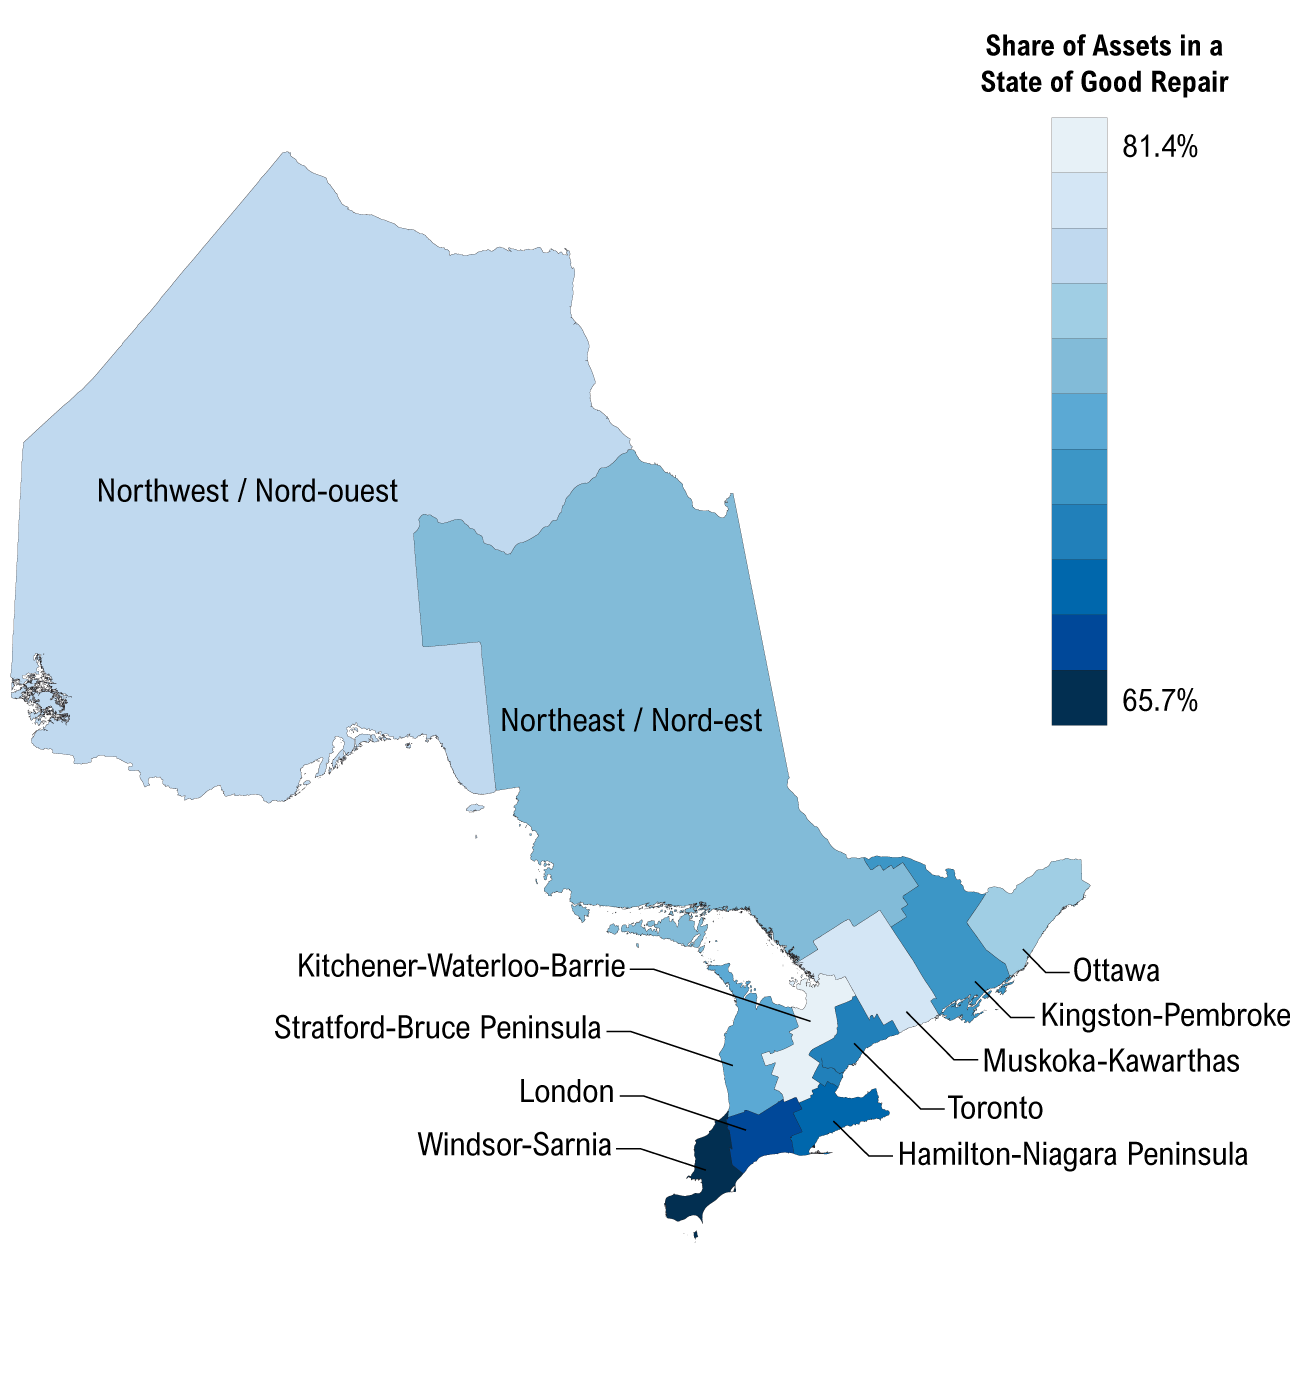
Note: Geographic location is available for 82.1 per cent of Provincial assets, which accounts for $9.6 billion of the Province’s infrastructure backlog. The remaining 17.9 per cent of Provincial asset data provided to the FAO did not have geographic information. This data is comprised of transit assets (Metrolinx and ONTC), Ministry of Natural Resources and Forestry assets, and all M&E assets.
Source: Statistics Canada and FAO analysis of information provided by the Ministry of Infrastructure and several other ministries as detailed in Appendix C.
Accessible version
| Share of Assets in a State of Good Repair | Per Cent |
|---|---|
| Hamilton–Niagara Peninsula | 69.5 |
| Kingston–Pembroke | 70.9 |
| Kitchener–Waterloo–Barrie | 81.4 |
| London | 70.3 |
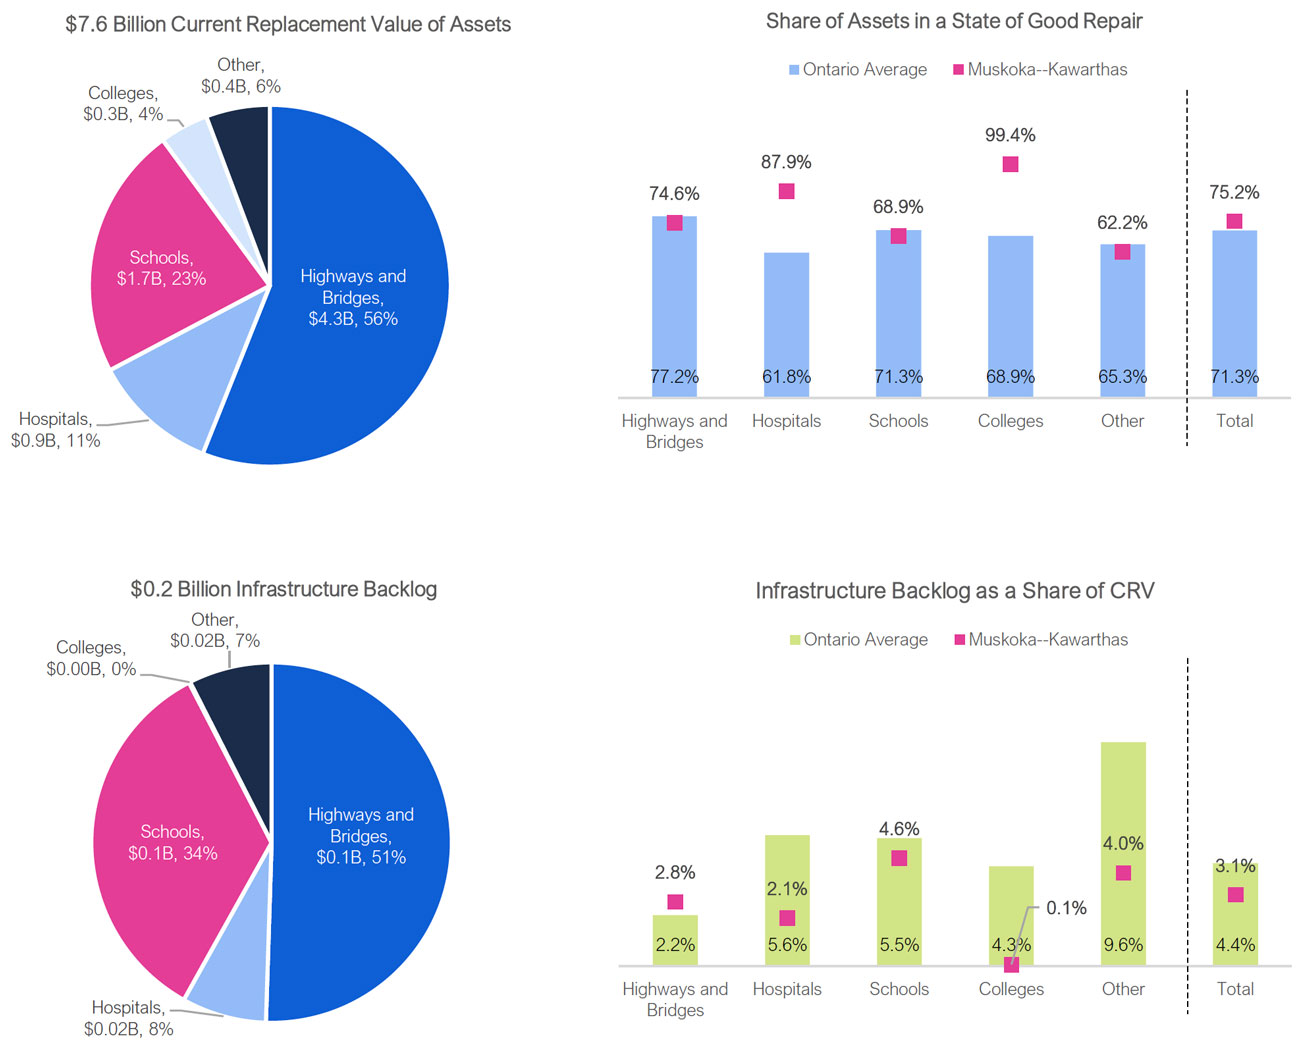
| Muskoka–Kawarthas | 75.2 |
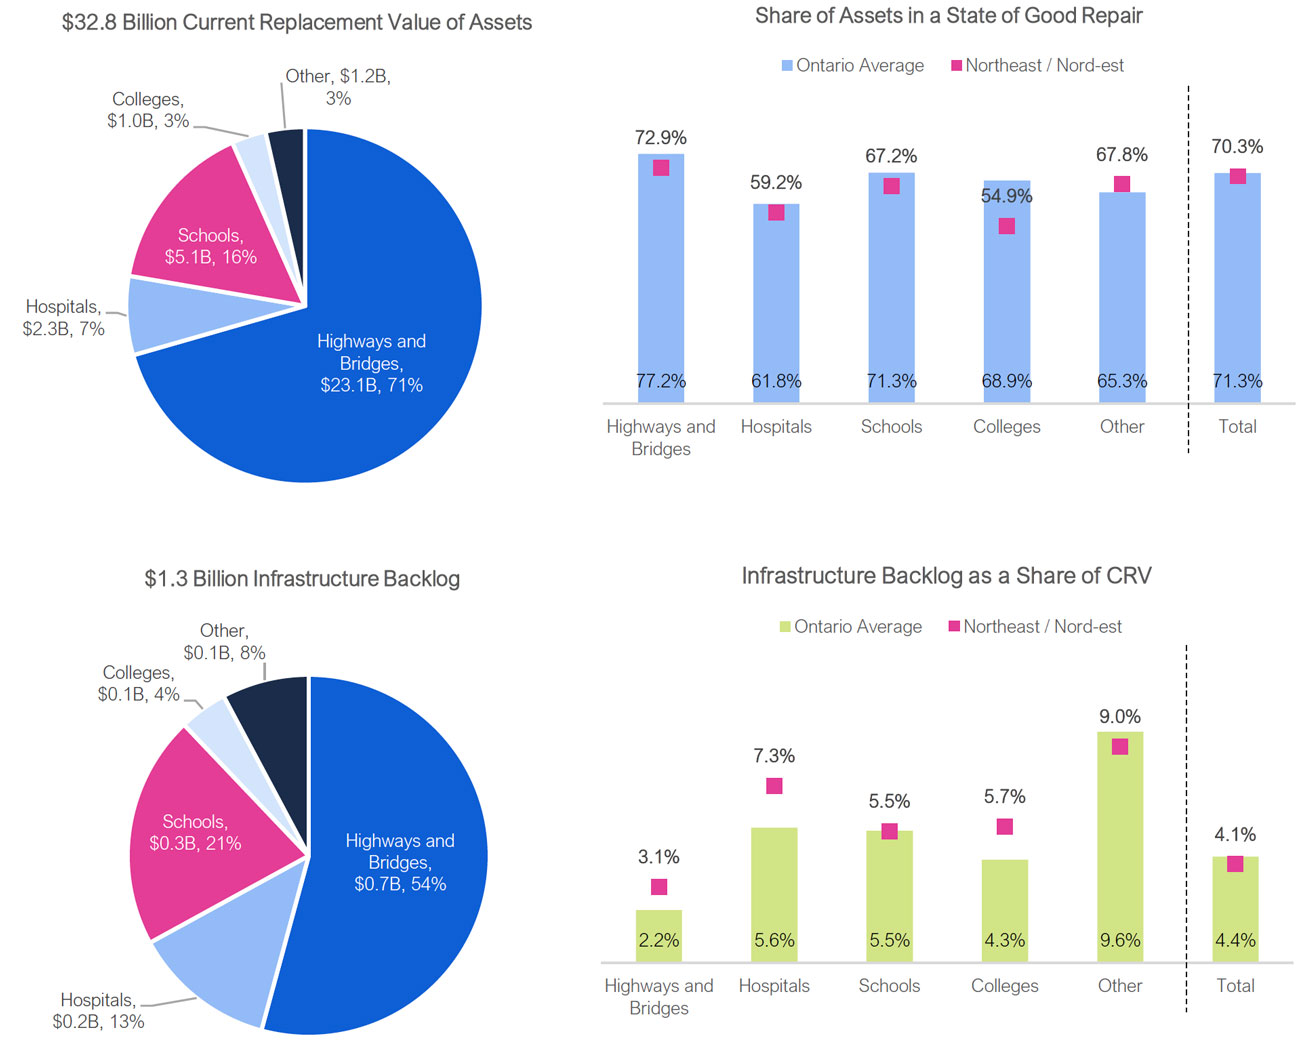
| Northeast | 70.3 |
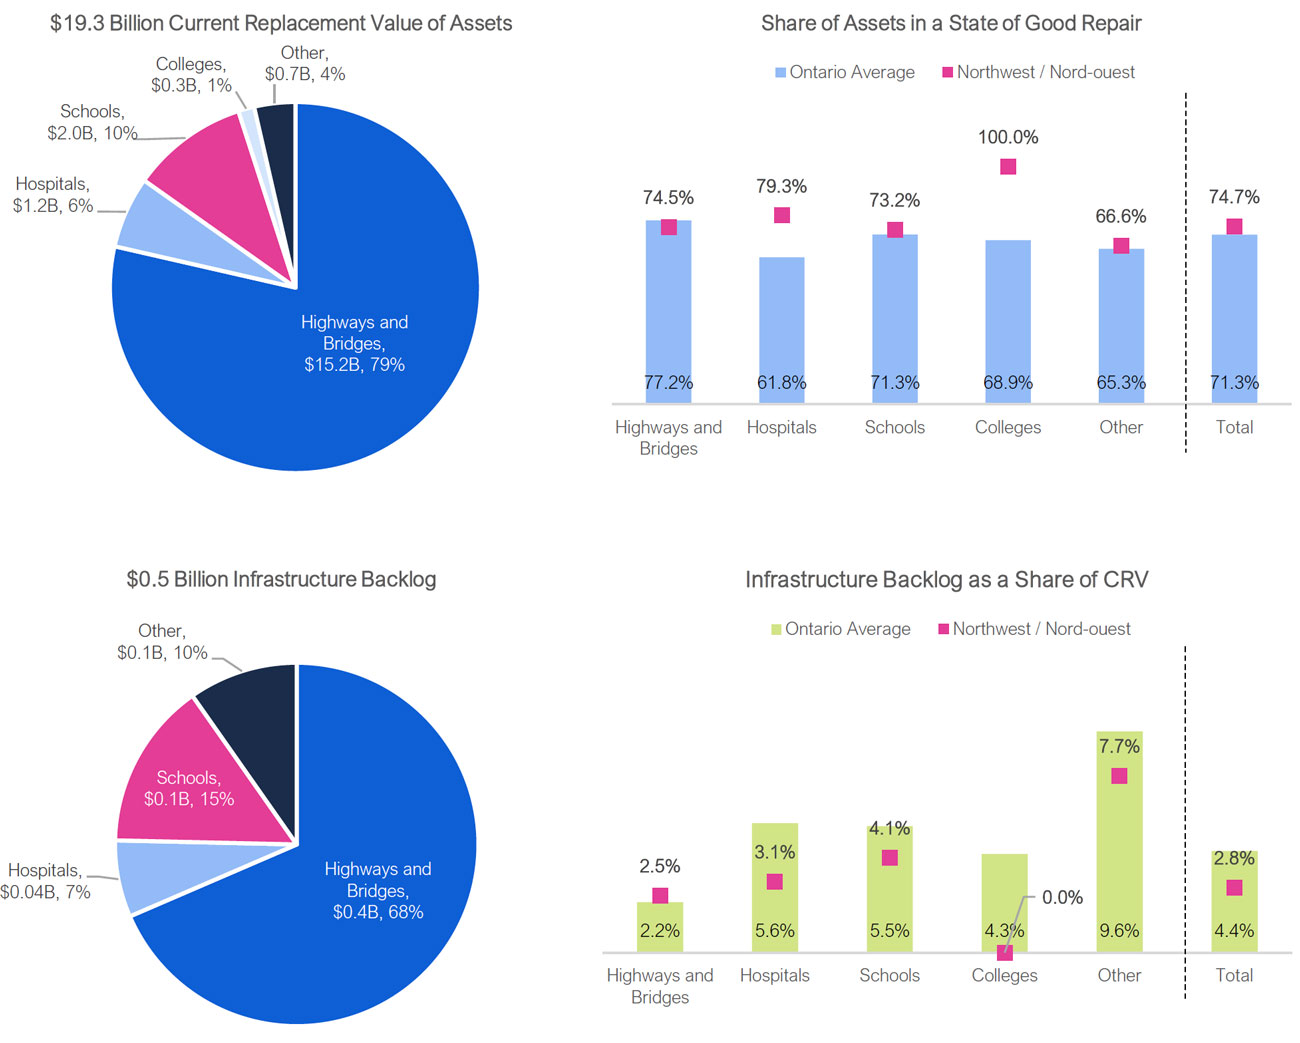
| Northwest | 74.7 |
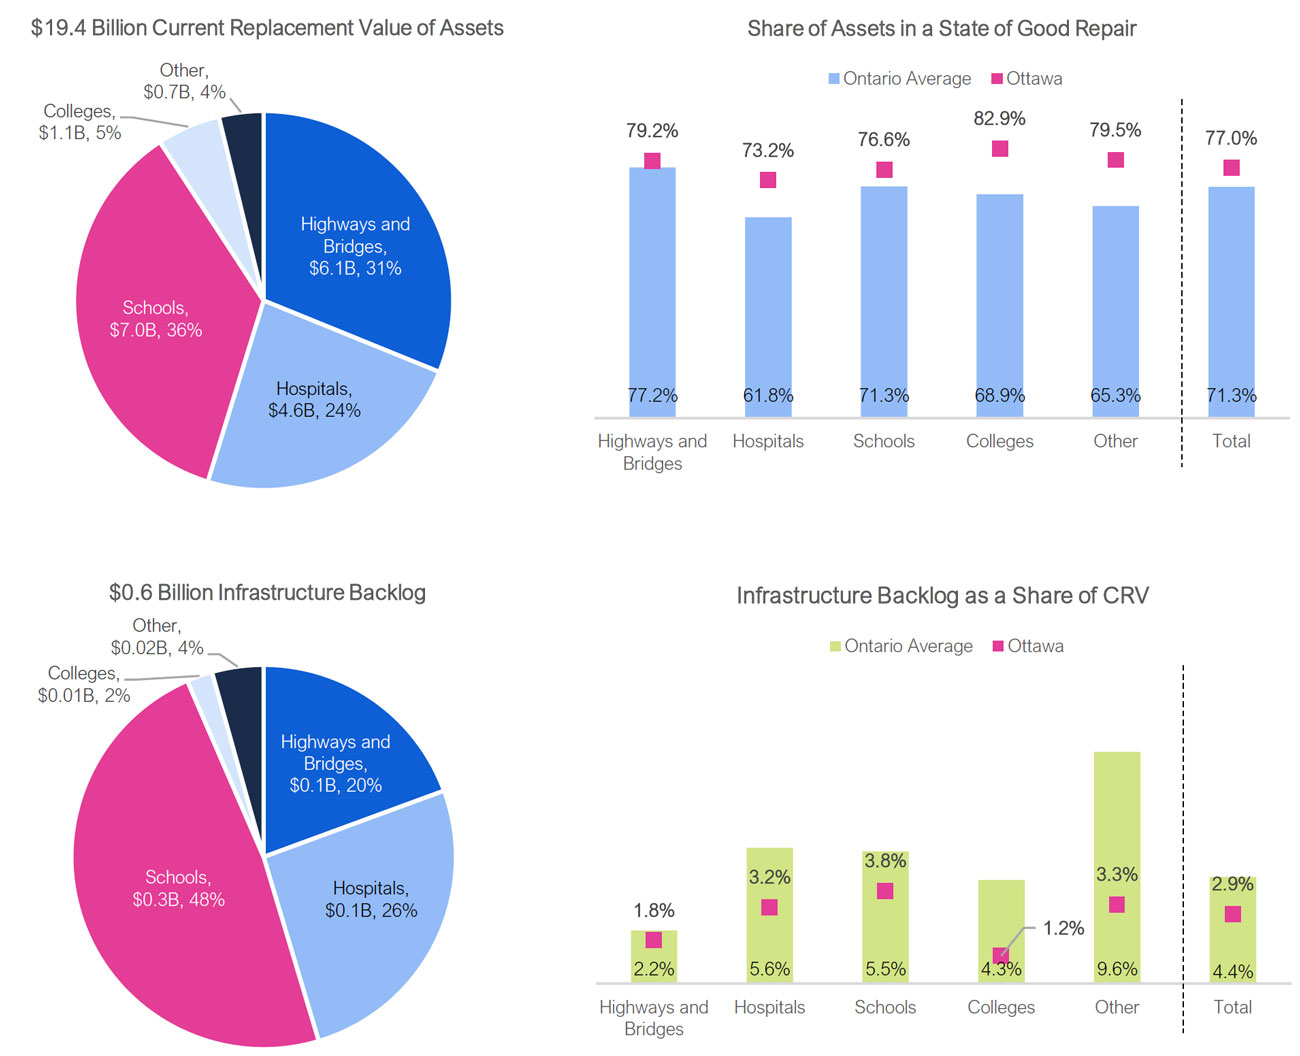
| Ottawa | 77.0 |
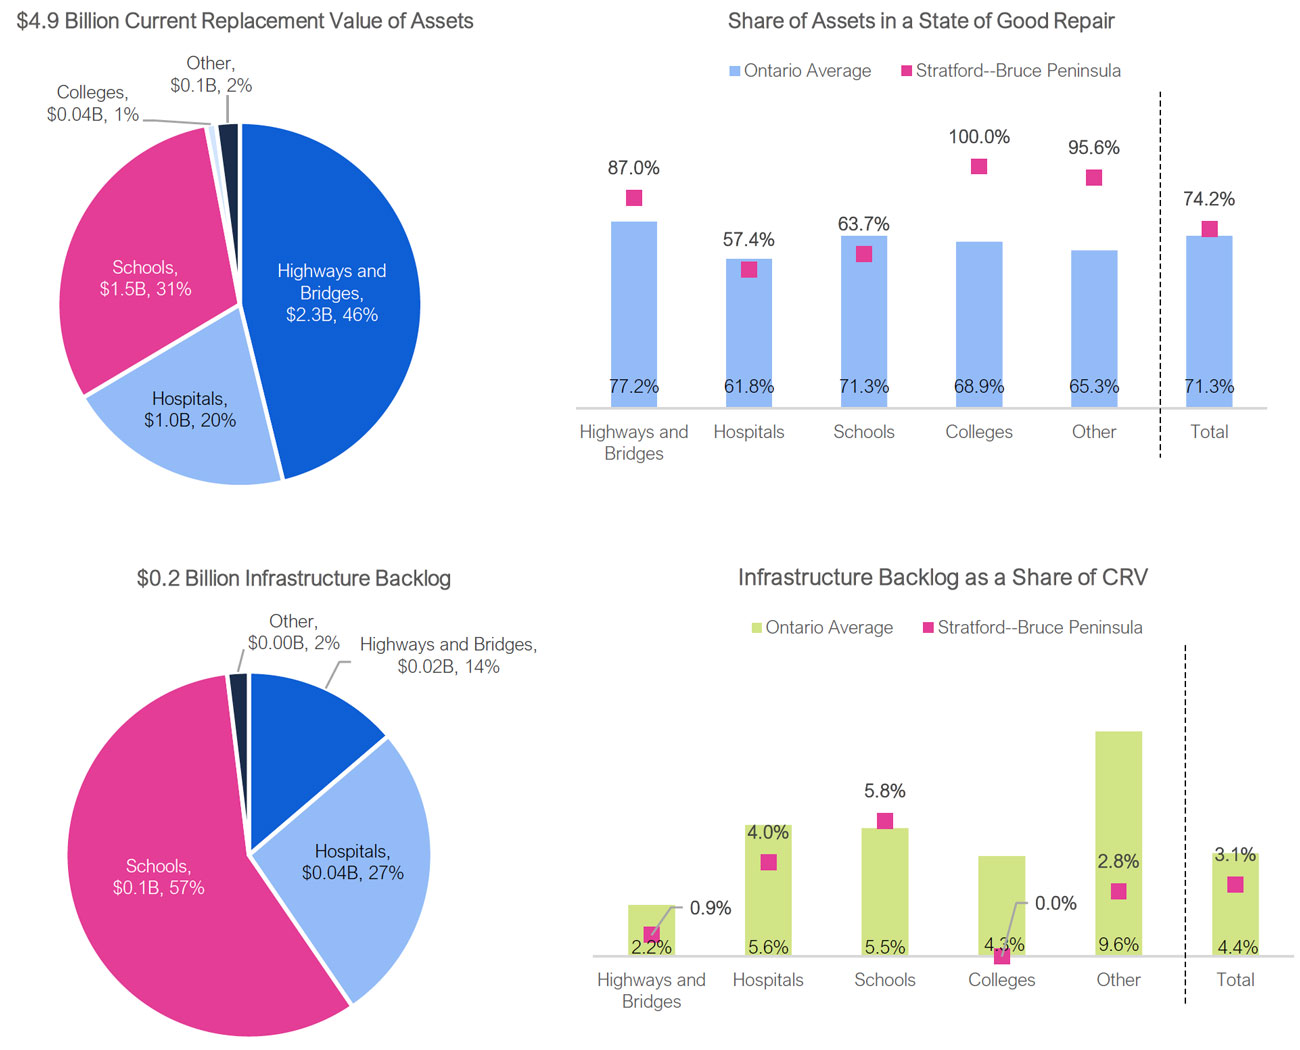
| Stratford–Bruce Peninsula | 74.2 |
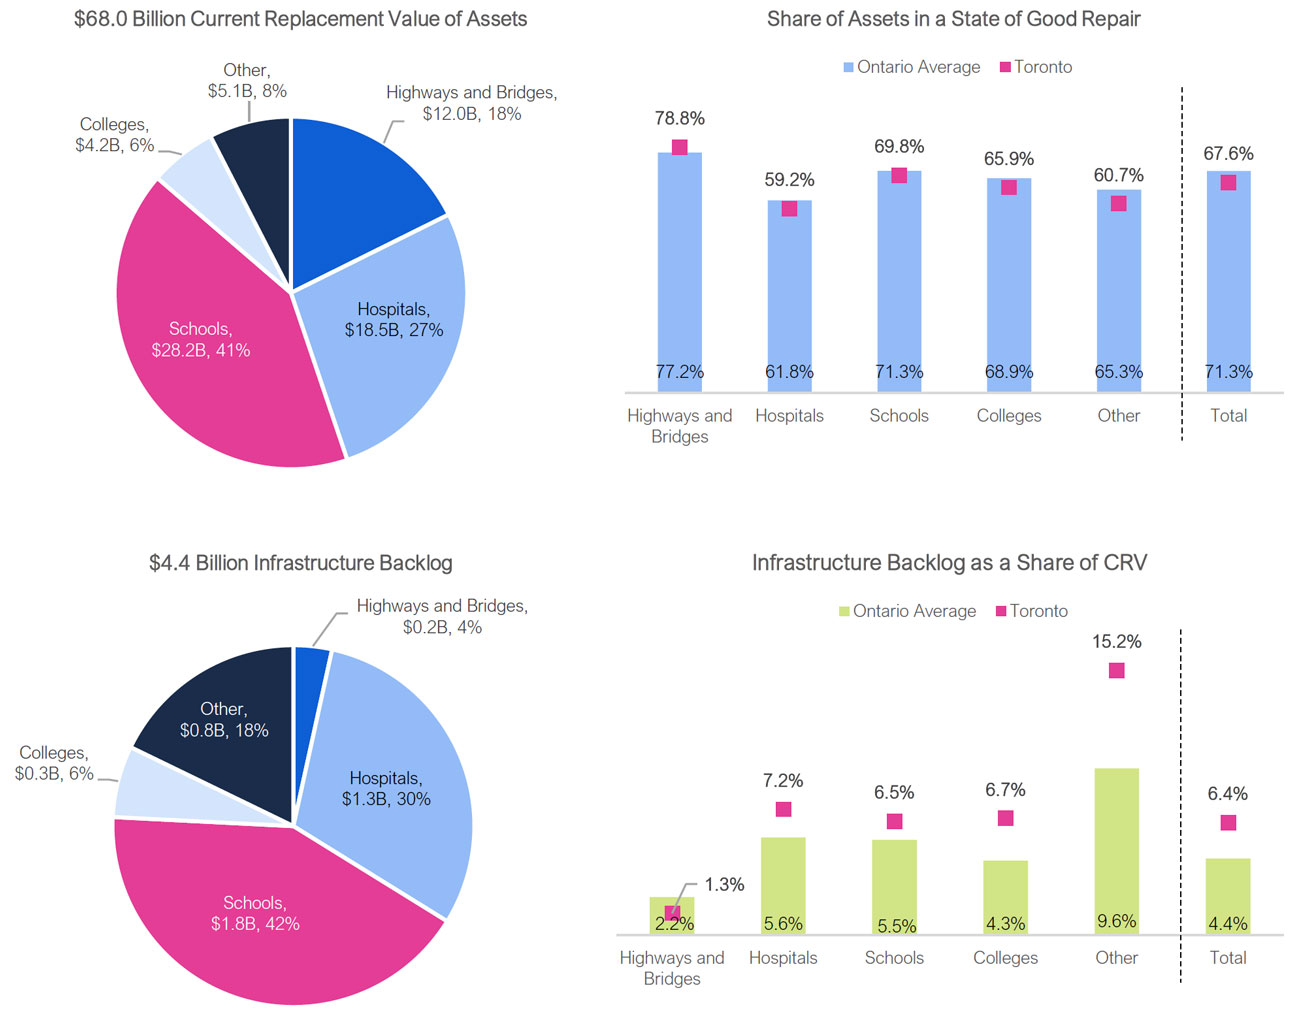
| Toronto | 67.6 |
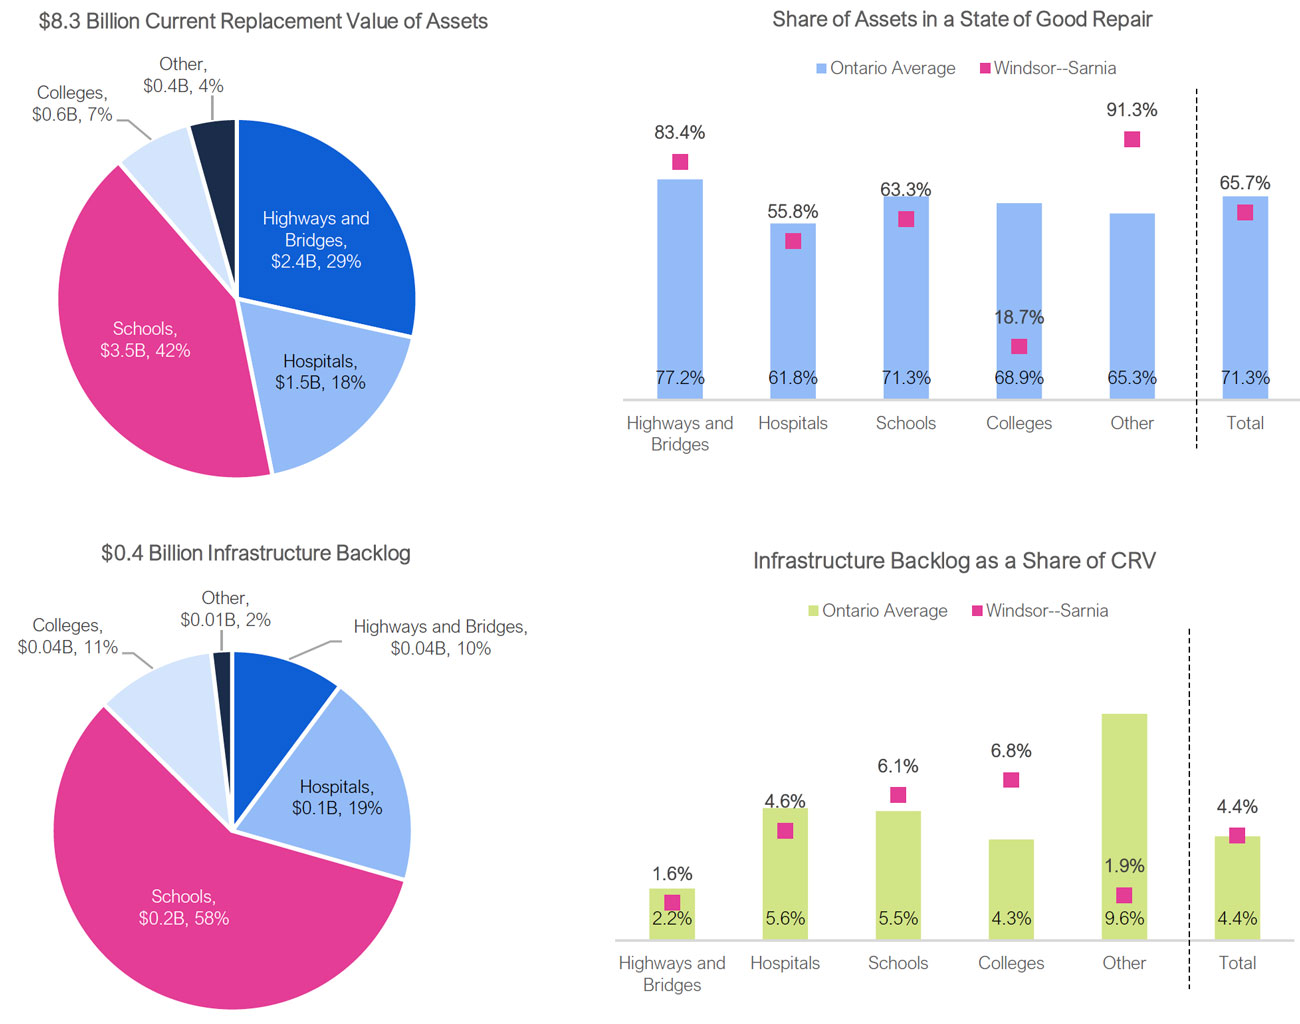
| Windsor–Sarnia | 65.7 |
The total current replacement value of Provincial assets with geographic information is $217.9 billion, of which 71.3 per cent are in a state of good repair. However, there are large variations in the state of repair among Ontario’s economic regions. The region with the largest share of assets in a state of good repair is the Kitchener-Waterloo-Barrie economic region at 81.4 per cent, 10.1 percentage points higher than the provincial average of 71.3 per cent (for those assets which have geographic information). In contrast, the Windsor-Sarnia economic region has the lowest share of assets in a state of good repair at 65.7 percent, 5.6 percentage points lower than the provincial average.
In terms of the infrastructure backlog as a share of total current replacement value, the regions of Kitchener-Waterloo-Barrie (2.6 per cent), the Northwest (2.8 per cent) and Ottawa (2.9 per cent) have the lowest shares. This implies that the assets in these regions are in better relative condition compared to other regions. On the other hand, the region with the largest infrastructure backlog relative to its total CRV is Toronto, at 6.4 per cent, followed by Windsor-Sarnia at 4.4 per cent.
Figure 6‑2 Infrastructure backlog as a share of current replacement value by economic region
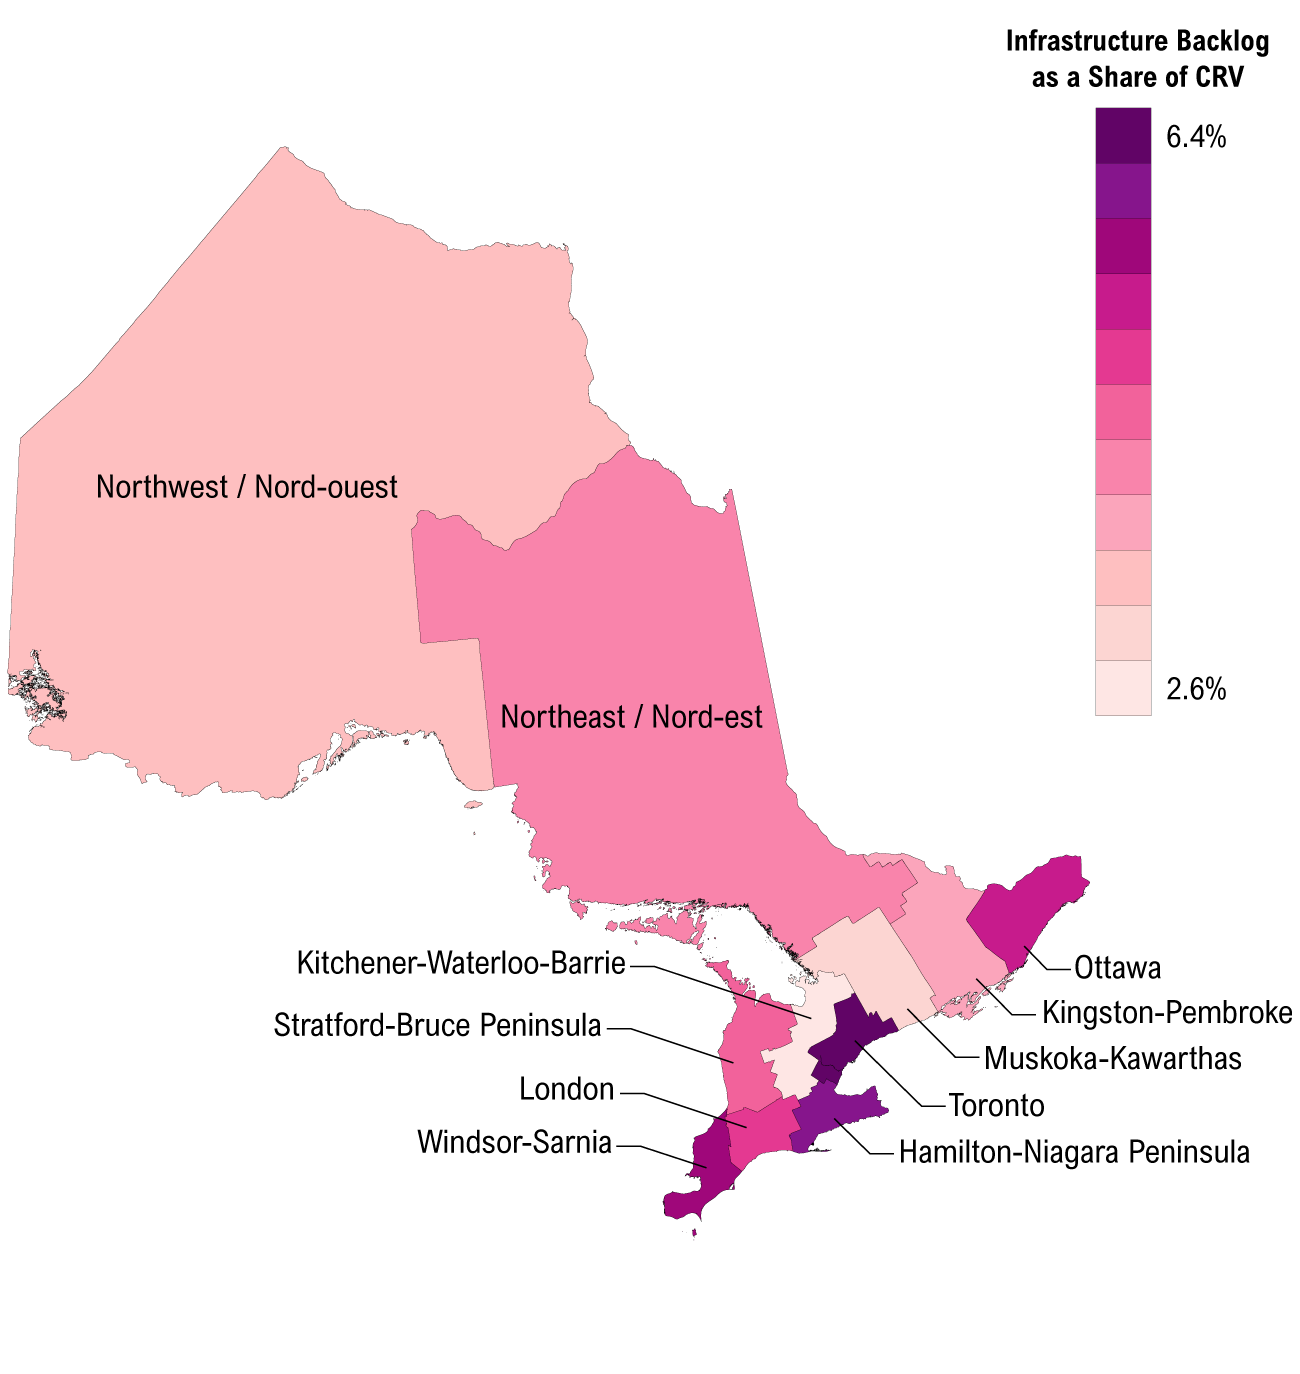
Note: Geographic location is available for 82.1 per cent of Provincial assets, which accounts for $9.6 billion of the Province’s infrastructure backlog. The remaining 17.9 per cent of Provincial asset data provided to the FAO did not have geographic information. This data is comprised of transit assets (Metrolinx and ONTC), Ministry of Natural Resources and Forestry assets and all M&E assets.
Source: Statistics Canada and FAO analysis of information provided by the Ministry of Infrastructure and several other ministries as detailed in Appendix C.
Accessible version
| Infrastructure Backlog as a Share of CRV | Per Cent |
|---|---|
| Hamilton–Niagara Peninsula | 3.8 |
| Kingston–Pembroke | 3.8 |
| Kitchener–Waterloo–Barrie | 2.6 |
| London | 3.9 |
| Muskoka–Kawarthas | 3.1 |
| Northeast | 4.1 |
| Northwest | 2.8 |
| Ottawa | 2.9 |
| Stratford–Bruce Peninsula | 3.1 |
| Toronto | 6.4 |
| Windsor–Sarnia | 4.4 |
| Economic Region | Current Replacement Value (CRV) ($ Billions) | CRV of Assets in a State of Good Repair ($ Billions) | Share of Assets in a State of Good Repair (% CRV) | CRV of Assets Not in a State of Good Repair ($ Billions) | Share of Assets Not in a State of Good Repair (% CRV) | Infrastructure Backlog ($ Billions) | Infrastructure Backlog as a Share of CRV (% CRV) |
|---|---|---|---|---|---|---|---|
| Hamilton-Niagara Peninsula | 21.6 | 15.0 | 69.5% | 6.6 | 30.5% | 0.8 | 3.8% |
| Kingston-Pembroke | 10.4 | 7.3 | 70.9% | 3.0 | 29.1% | 0.4 | 3.8% |
| Kitchener-Waterloo-Barrie | 15.6 | 12.7 | 81.4% | 2.9 | 18.6% | 0.4 | 2.6% |
| London | 10.1 | 7.1 | 70.3% | 3.0 | 29.7% | 0.4 | 3.9% |
| Muskoka-Kawarthas | 7.6 | 5.7 | 75.2% | 1.9 | 24.8% | 0.2 | 3.1% |
| Northeast | 32.8 | 23.1 | 70.3% | 9.7 | 29.7% | 1.3 | 4.1% |
| Northwest | 19.3 | 14.4 | 74.7% | 4.9 | 25.3% | 0.5 | 2.8% |
| Ottawa | 19.4 | 15.0 | 77.0% | 4.5 | 23.0% | 0.6 | 2.9% |
| Stratford-Bruce Peninsula | 4.9 | 3.7 | 74.2% | 1.3 | 25.8% | 0.2 | 3.1% |
| Toronto | 68.0 | 46.0 | 67.6% | 22.0 | 32.4% | 4.4 | 6.4% |
| Windsor-Sarnia | 8.3 | 5.4 | 65.7% | 2.8 | 34.3% | 0.4 | 4.4% |
| Regional Subtotal | 217.9 | 155.4 | 71.3% | 62.6 | 28.7% | 9.6 | 4.4% |
| No Geographical Information | 47.6 | NA | 7.2 | 15.0% | |||
| Total | 265.6 | 173.4 | 65.3% | 92.1 | 34.7% | 16.8 | 6.3% |
The information presented in the regional profiles below describes the state of repair and infrastructure backlog by sector for each of Ontario’s 11 economic regions.[50] This information includes:
- Land area, population, current replacement value of assets and infrastructure backlog as a share of the Provincial total.
- The share of assets in a state of good repair compared to the Provincial average, which provides a measure of the relative condition of the region’s assets.
- The infrastructure backlog relative to current replacement value compared to the Provincial average, which indicates whether the assets in a region require higher or lower spending, relative to the Provincial average.
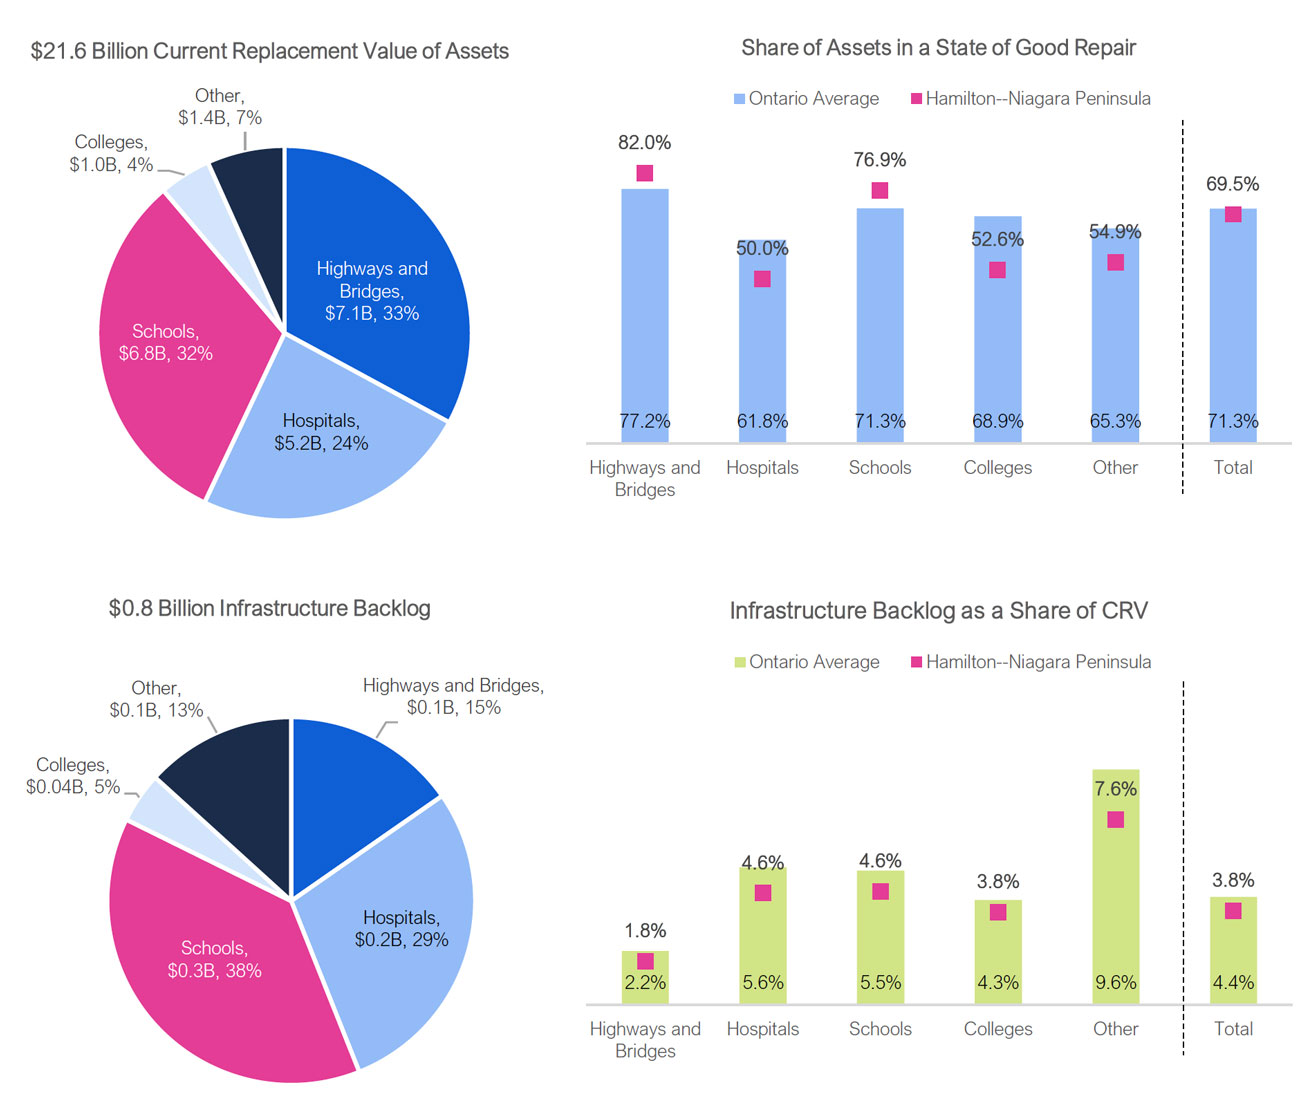
Profile of Provincial Infrastructure: Hamilton-Niagara Peninsula
Key Facts
| Current Replacement Value (CRV) of assets (billions) | $21.6 |
|---|---|
| CRV of assets share of Ontario | 9.9% |
| Infrastructure backlog (billions) | $0.8 |
| Infrastructure backlog share of Ontario | 8.6% |
| Population | 1,523,062 |
| Population share of Ontario | 10.5% |
| Land area (square km) | 7,145 |
| Land area share of Ontario | 0.8% |
Note: The regional figures presented in these tables only encompass assets that have geolocations.
Source: Statistics Canada and FAO.
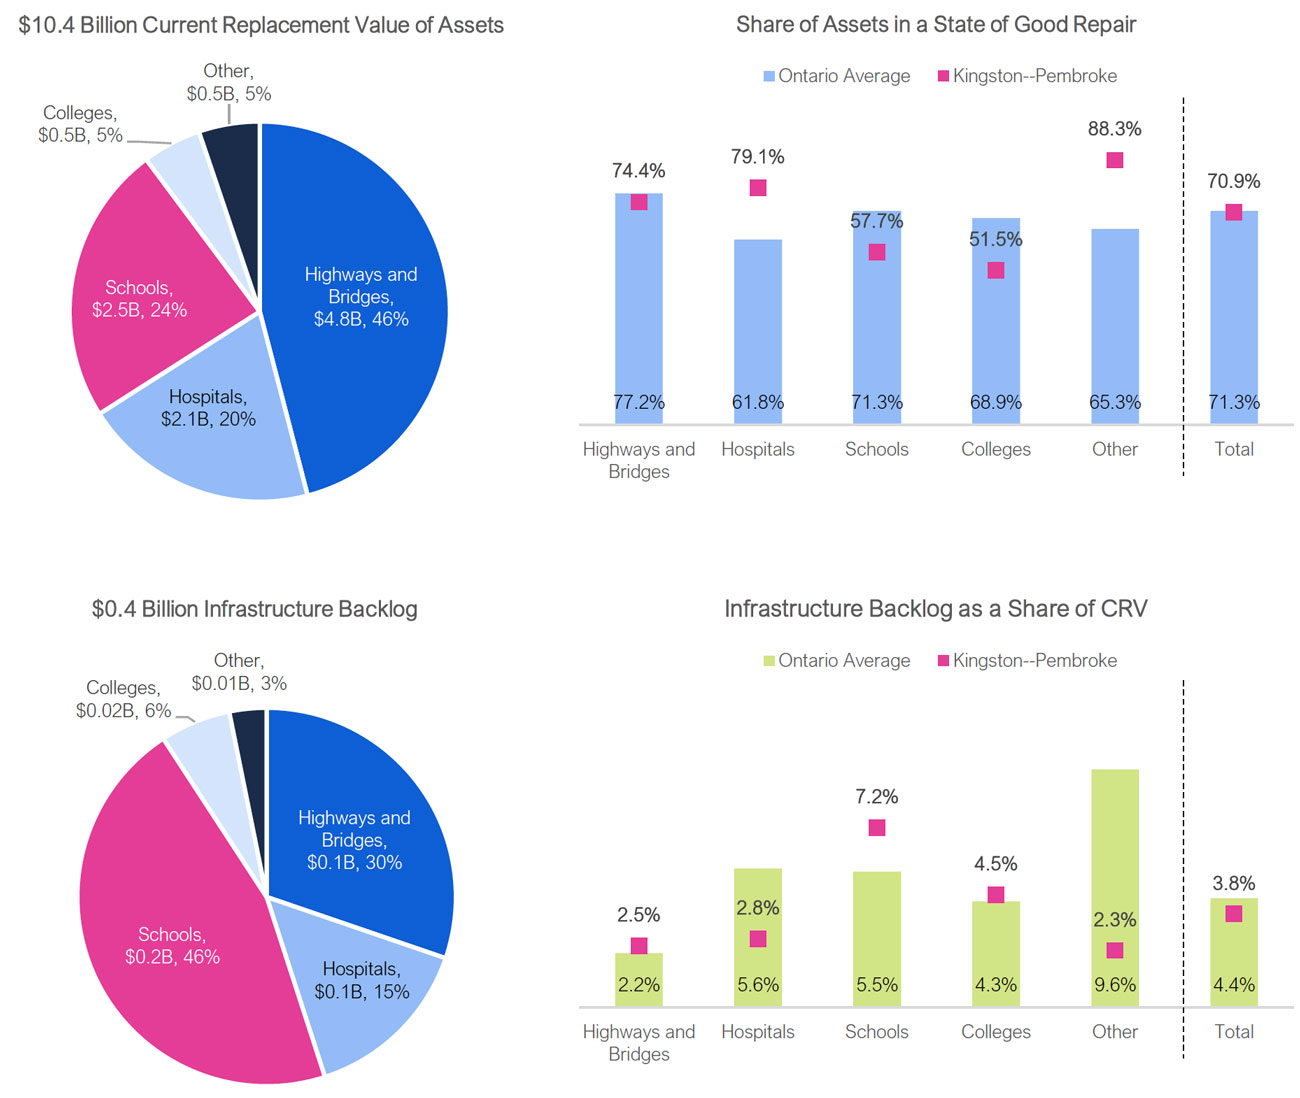
Profile of Provincial Infrastructure: Kingston-Pembroke
Key Facts
| Current Replacement Value (CRV) of assets (billions) | $10.4 |
|---|---|
| CRV of assets share of Ontario | 4.7% |
| Infrastructure backlog (billions) | $0.4 |
| Infrastructure backlog share of Ontario | 4.1% |
| Population | 486,133 |
| Population share of Ontario | 3.3% |
| Land area (square km) | 21,230 |
| Land area share of Ontario | 2.3% |
Note: The regional figures presented in these tables only encompass assets that have geolocations.
Source: Statistics Canada and FAO.
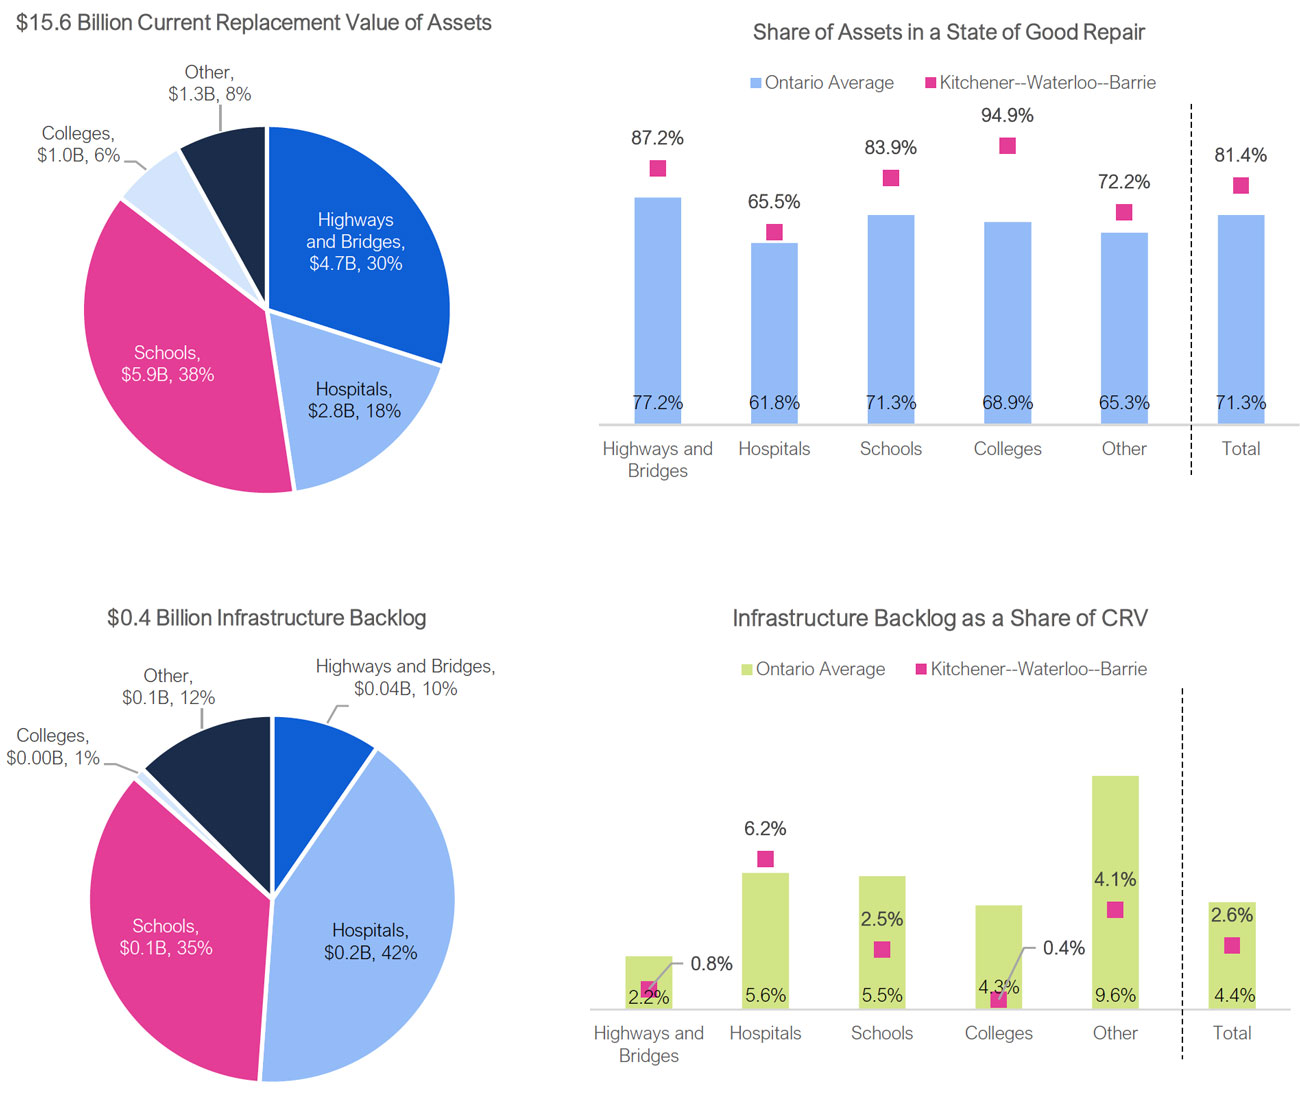
Profile of Provincial Infrastructure: Kitchener-Waterloo-Barrie
Key Facts
| Current Replacement Value (CRV) of assets (billions) | $15.6 |
|---|---|
| CRV of assets share of Ontario | 7.2% |
| Infrastructure backlog (billions) | $0.4 |
| Infrastructure backlog share of Ontario | 4.3% |
| Population | 1,432,654 |
| Population share of Ontario | 9.8% |
| Land area (square km) | 10,376 |
| Land area share of Ontario | 1.1% |
Note: The regional figures presented in these tables only encompass assets that have geolocations.
Source: Statistics Canada and FAO.
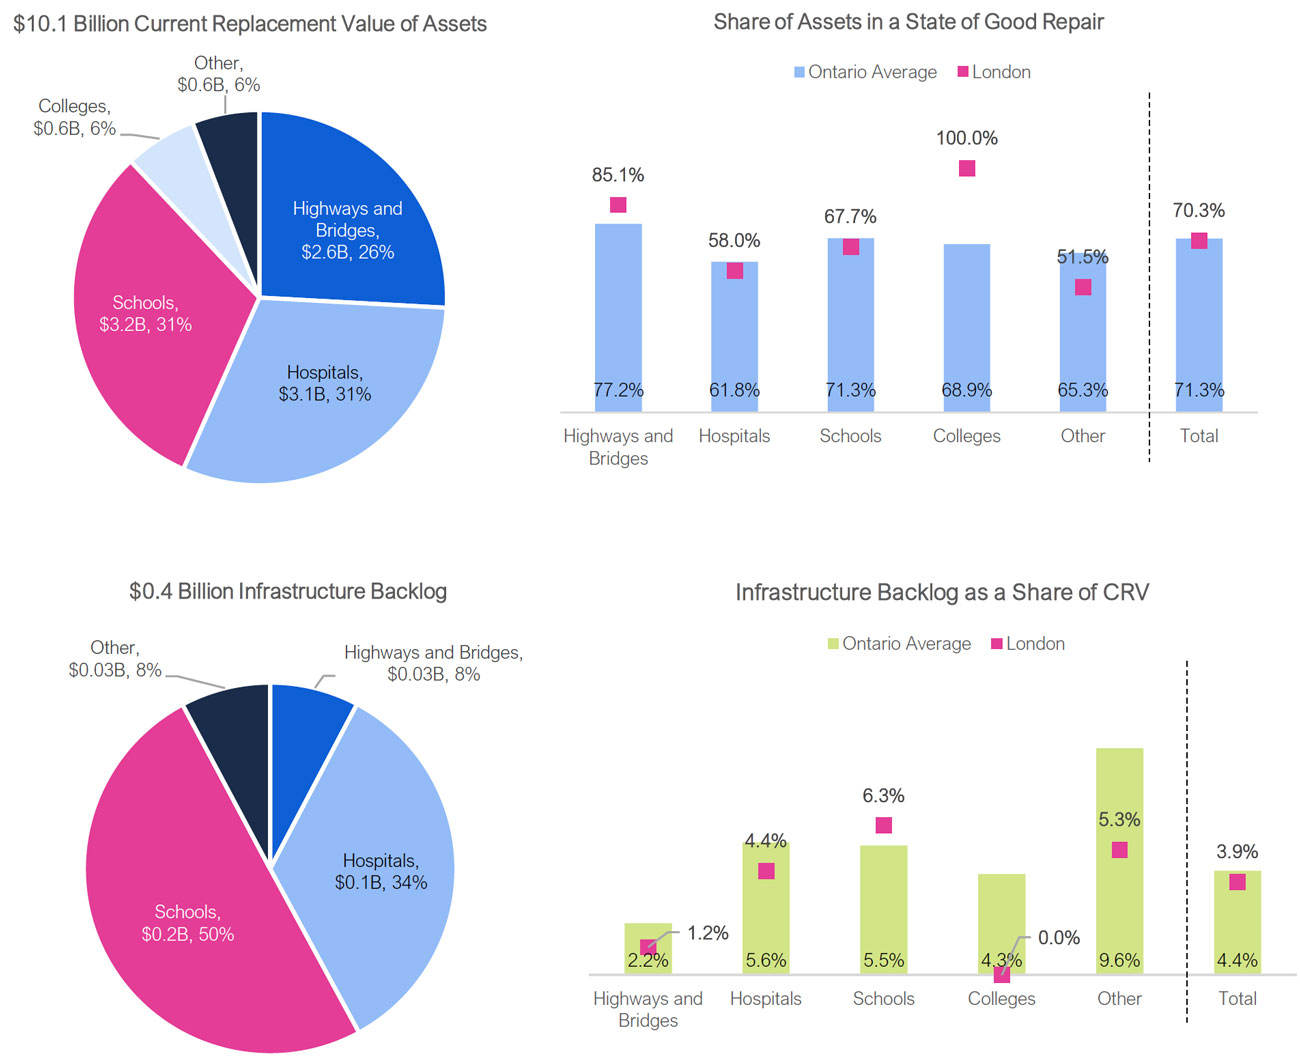
Profile of Provincial Infrastructure: London
Key Facts
| Current Replacement Value (CRV) of assets (billions) | $10.1 |
|---|---|
| CRV of assets share of Ontario | 4.6% |
| Infrastructure backlog (billions) | $0.4 |
| Infrastructure backlog share of Ontario | 4.2% |
| Population | 721,409 |
| Population share of Ontario | 5.0% |
| Land area (square km) | 7,238 |
| Land area share of Ontario | 0.8% |

Note: The regional figures presented in these tables only encompass assets that have geolocations.
Source: Statistics Canada and FAO.
Profile of Provincial Infrastructure: Muskoka-Kawarthas
Key Facts
| Current Replacement Value (CRV) of assets (billions) | $7.6 |
|---|---|
| CRV of assets share of Ontario | 3.5% |
| Infrastructure backlog (billions) | $0.2 |
| Infrastructure backlog share of Ontario | 2.4% |
| Population | 404,158 |
| Population share of Ontario | 2.8% |
| Land area (square km) | 16,854 |
| Land area share of Ontario | 1.9% |
Note: The regional figures presented in these tables only encompass assets that have geolocations.
Source: Statistics Canada and FAO.
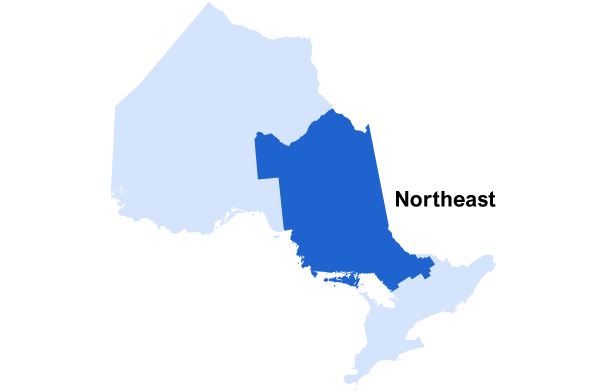
Profile of Provincial Infrastructure: Northeast
Key Facts
| Current Replacement Value (CRV) of assets (billions) | $32.8 |
|---|---|
| CRV of assets share of Ontario | 15.0% |
| Infrastructure backlog (billions) | $1.3 |
| Infrastructure backlog share of Ontario | 14.0% |
| Population | 568,361 |
| Population share of Ontario | 3.9% |
| Land area (square km) | 276,368 |
| Land area share of Ontario | 30.4% |
Note: The regional figures presented in these tables only encompass assets that have geolocations.
Source: Statistics Canada and FAO.
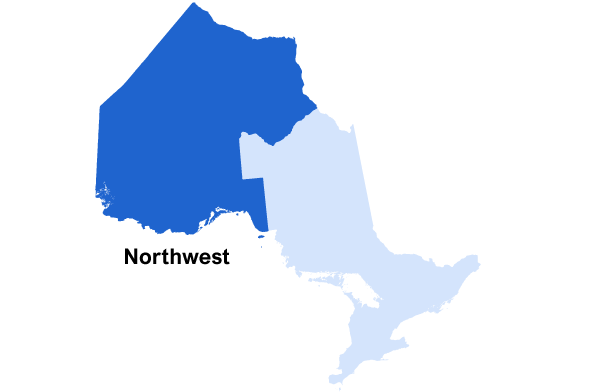
Profile of Provincial Infrastructure: Northwest
Key Facts
| Current Replacement Value (CRV) of assets (billions) | $19.3 |
|---|---|
| CRV of assets share of Ontario | 8.8% |
| Infrastructure backlog (billions) | $0.5 |
| Infrastructure backlog share of Ontario | 5.7% |
| Population | 243,044 |
| Population share of Ontario | 1.7% |
| Land area (square km) | 526,478 |
| Land area share of Ontario | 57.9% |
Note: The regional figures presented in these tables only encompass assets that have geolocations.
Source: Statistics Canada and FAO.
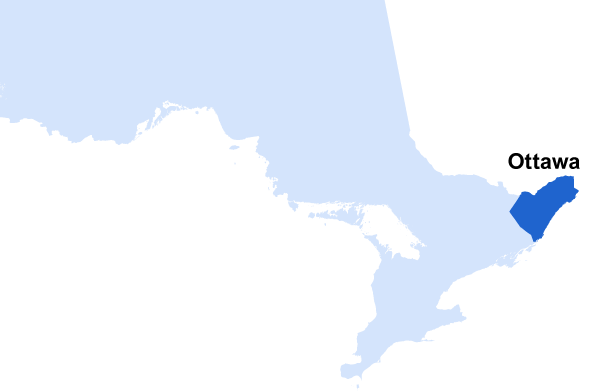
Profile of Provincial Infrastructure: Ottawa
Key Facts
| Current Replacement Value (CRV) of assets (billions) | $19.4 |
|---|---|
| CRV of assets share of Ontario | 8.9% |
| Infrastructure backlog (billions) | $0.6 |
| Infrastructure backlog share of Ontario | 5.8% |
| Population | 1,419,183 |
| Population share of Ontario | 9.7% |
| Land area (square km) | 14,523 |
| Land area share of Ontario | 1.6% |
Note: The regional figures presented in these tables only encompass assets that have geolocations.
Source: Statistics Canada and FAO.
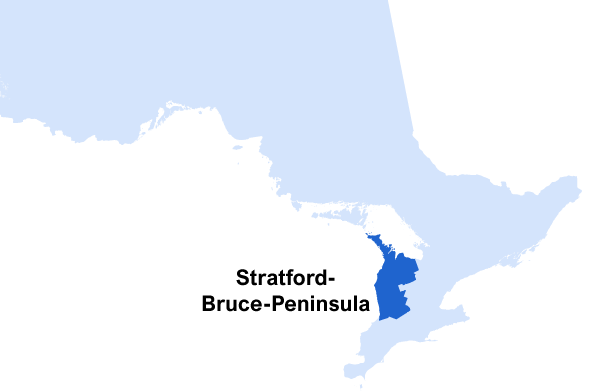
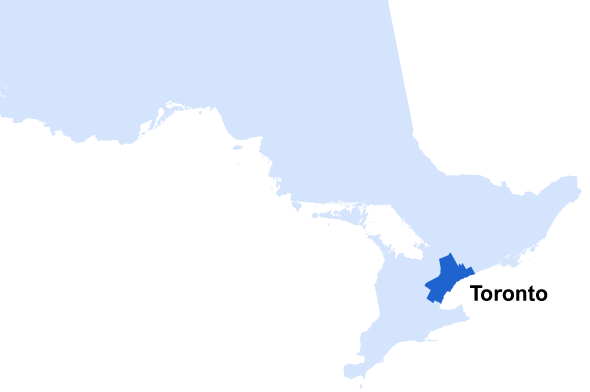
Profile of Provincial Infrastructure: Stratford-Bruce Peninsula
Key Facts
| Current Replacement Value (CRV) of assets (billions) | $4.9 |
|---|---|
| CRV of assets share of Ontario | 2.3% |
| Infrastructure backlog (billions) | $0.2 |
| Infrastructure backlog share of Ontario | 1.6% |
| Population | 318,173 |
| Population share of Ontario | 2.2% |
| Land area (square km) | 14,221 |
| Land area share of Ontario | 1.6% |
Note: The regional figures presented in these tables only encompass assets that have geolocations.
Source: Statistics Canada and FAO.
Profile of Provincial Infrastructure: Toronto
Key Facts
| Current Replacement Value (CRV) of assets (billions) | $68.0 |
|---|---|
| CRV of assets share of Ontario | 31.2% |
| Infrastructure backlog (billions) | $4.4 |
| Infrastructure backlog share of Ontario | 45.6% |
| Population | 6,783,480 |
| Population share of Ontario | 46.6% |
| Land area (square km) | 6,941 |
| Land area share of Ontario | 0.8% |
Note: The regional figures presented in these tables only encompass assets that have geolocations.
Source: Statistics Canada and FAO.
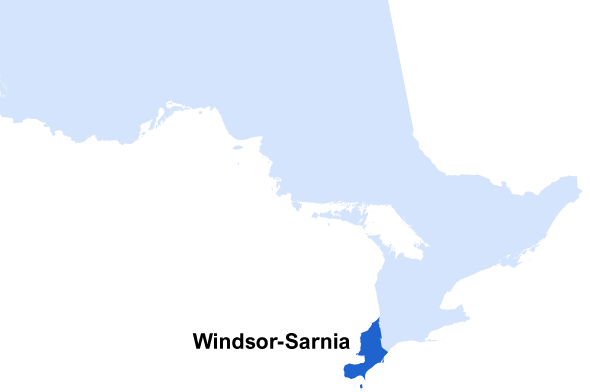
Profile of Provincial Infrastructure: Windsor-Sarnia
Key Facts
| Current Replacement Value (CRV) of assets (billions) | $8.3 |
|---|---|
| CRV of assets share of Ontario | 3.8% |
| Infrastructure backlog (billions) | $0.4 |
| Infrastructure backlog share of Ontario | 3.8% |
| Population | 666,890 |
| Population share of Ontario | 4.6% |
| Land area (square km) | 7,324 |
| Land area share of Ontario | 0.8% |
Note: The regional figures presented in these tables only encompass assets that have geolocations.
Source: Statistics Canada and FAO.
Accessible version
| Economic Region | Budget Sector | Current Replacement Value of Assets ($ Billions) |
Infrastructure Backlog ($ Billions) |
Share of Assets in a State of Good Repair (Per Cent) |
Infrastructure Backlog as a Share of CRV (Per Cent) |
|---|---|---|---|---|---|
| Hamilton–Niagara Peninsula | Highways and Bridges | 7.1 | 0.1 | 82.0 | 1.8 |
| Hamilton–Niagara Peninsula | Hospitals | 5.2 | 0.2 | 50.0 | 4.6 |
| Hamilton–Niagara Peninsula | Schools | 6.8 | 0.3 | 76.9 | 4.6 |
| Hamilton–Niagara Peninsula | Colleges | 1.0 | 0.04 | 52.6 | 3.8 |
| Hamilton–Niagara Peninsula | Other | 1.4 | 0.1 | 54.9 | 7.6 |
| Hamilton–Niagara Peninsula | Total | 21.6 | 0.8 | 69.5 | 3.8 |
| Kingston–Pembroke | Highways and Bridges | 4.8 | 0.1 | 74.4 | 2.5 |
| Kingston–Pembroke | Hospitals | 2.1 | 0.1 | 79.1 | 2.8 |
| Kingston–Pembroke | Schools | 2.5 | 0.2 | 57.7 | 7.2 |
| Kingston–Pembroke | Colleges | 0.5 | 0.02 | 51.5 | 4.5 |
| Kingston–Pembroke | Other | 0.5 | 0.01 | 88.3 | 2.3 |
| Kingston–Pembroke | Total | 10.4 | 0.4 | 70.9 | 3.8 |
| Kitchener–Waterloo–Barrie | Highways and Bridges | 4.7 | 0.04 | 87.2 | 0.8 |
| Kitchener–Waterloo–Barrie | Hospitals | 2.8 | 0.2 | 65.5 | 6.2 |
| Kitchener–Waterloo–Barrie | Schools | 5.9 | 0.1 | 83.9 | 2.5 |
| Kitchener–Waterloo–Barrie | Colleges | 1.0 | 0.00 | 94.9 | 0.4 |
| Kitchener–Waterloo–Barrie | Other | 1.3 | 0.1 | 72.2 | 4.1 |
| Kitchener–Waterloo–Barrie | Total | 15.6 | 0.4 | 81.4 | 2.6 |
| London | Highways and Bridges | 2.6 | 0.03 | 85.1 | 1.2 |
| London | Hospitals | 3.1 | 0.1 | 58.0 | 4.4 |
| London | Schools | 3.2 | 0.2 | 67.7 | 6.3 |
| London | Colleges | 0.6 | 0.0 | 100.0 | 0.0 |
| London | Other | 0.6 | 0.03 | 51.5 | 5.3 |
| London | Total | 10.1 | 0.4 | 70.3 | 3.9 |
| Muskoka–Kawarthas | Highways and Bridges | 4.3 | 0.1 | 74.6 | 2.8 |
| Muskoka–Kawarthas | Hospitals | 0.9 | 0.02 | 87.9 | 2.1 |
| Muskoka–Kawarthas | Schools | 1.7 | 0.1 | 68.9 | 4.6 |
| Muskoka–Kawarthas | Colleges | 0.3 | 0.00 | 99.4 | 0.1 |
| Muskoka–Kawarthas | Other | 0.4 | 0.02 | 62.2 | 4.0 |
| Muskoka–Kawarthas | Total | 7.6 | 0.2 | 75.2 | 3.1 |
| Northeast / Nord-est | Highways and Bridges | 23.1 | 0.7 | 72.9 | 3.1 |
| Northeast / Nord-est | Hospitals | 2.3 | 0.2 | 59.2 | 7.3 |
| Northeast / Nord-est | Schools | 5.1 | 0.3 | 67.2 | 5.5 |
| Northeast / Nord-est | Colleges | 1.0 | 0.1 | 54.9 | 5.7 |
| Northeast / Nord-est | Colleges | 1.0 | 0.1 | 54.9 | 5.7 |
| Northeast / Nord-est | Other | 1.2 | 0.1 | 67.8 | 9.0 |
| Northeast / Nord-est | Total | 32.8 | 1.3 | 70.3 | 4.1 |
| Northwest / Nord-ouest | Highways and Bridges | 15.2 | 0.4 | 74.5 | 2.5 |
| Northwest / Nord-ouest | Hospitals | 1.2 | 0.04 | 79.3 | 3.1 |
| Northwest / Nord-ouest | Schools | 2.0 | 0.1 | 73.2 | 4.1 |
| Northwest / Nord-ouest | Colleges | 0.3 | 0.0 | 100.0 | 0.0 |
| Northwest / Nord-ouest | Other | 0.7 | 0.1 | 66.6 | 7.7 |
| Northwest / Nord-ouest | Total | 19.3 | 0.5 | 74.7 | 2.8 |
| Ottawa | Highways and Bridges | 6.1 | 0.1 | 79.2 | 1.8 |
| Ottawa | Hospitals | 4.6 | 0.1 | 73.2 | 3.2 |
| Ottawa | Schools | 7.0 | 0.3 | 76.6 | 3.8 |
| Ottawa | Colleges | 1.1 | 0.01 | 82.9 | 1.2 |
| Ottawa | Other | 0.7 | 0.02 | 79.5 | 3.3 |
| Ottawa | Total | 19.4 | 0.6 | 77.0 | 2.9 |
| Stratford–Bruce Peninsula | Highways and Bridges | 2.3 | 0.02 | 87.0 | 0.9 |
| Stratford–Bruce Peninsula | Hospitals | 1.0 | 0.04 | 57.4 | 4.0 |
| Stratford–Bruce Peninsula | Schools | 1.5 | 0.1 | 63.7 | 5.8 |
| Stratford–Bruce Peninsula | Colleges | 0.04 | 0.0 | 100.0 | 0.0 |
| Stratford–Bruce Peninsula | Other | 0.1 | 0.00 | 95.6 | 2.8 |
| Stratford–Bruce Peninsula | Total | 4.9 | 0.2 | 74.2 | 3.1 |
| Toronto | Highways and Bridges | 12.0 | 0.2 | 78.8 | 1.3 |
| Toronto | Hospitals | 18.5 | 1.3 | 59.2 | 7.2 |
| Toronto | Schools | 28.2 | 1.8 | 69.8 | 6.5 |
| Toronto | Colleges | 4.2 | 0.3 | 65.9 | 6.7 |
| Toronto | Other | 5.1 | 0.8 | 60.7 | 15.2 |
| Toronto | Total | 68.0 | 4.4 | 67.6 | 6.4 |
| Windsor–Sarnia | Highways and Bridges | 2.4 | 0.04 | 83.4 | 1.6 |
| Windsor–Sarnia | Hospitals | 1.5 | 0.1 | 55.8 | 4.6 |
| Windsor–Sarnia | Schools | 3.5 | 0.2 | 63.3 | 6.1 |
| Windsor–Sarnia | Colleges | 0.6 | 0.04 | 18.7 | 6.8 |
| Windsor–Sarnia | Other | 0.4 | 0.01 | 91.3 | 1.9 |
| Windsor–Sarnia | Total | 8.3 | 0.4 | 65.7 | 4.4 |
| Ontario Average | Highways and Bridges | 77.2 | 2.2 | ||
| Ontario Average | Hospitals | 61.8 | 5.6 | ||
| Ontario Average | Colleges | 68.9 | 4.3 | ||
| Ontario Average | Other | 65.3 | 9.6 | ||
| Ontario Average | Total | 71.3 | 4.4 |
B. State of Repair by Sector
This section provides highlights on the state of repair and infrastructure backlog of Provincial infrastructure by sector and asset-type.
| Sector | Current Replacement Value (CRV) ($ Billions) | CRV of Assets in a State of Good Repair ($ Billions) | Share of Assets in a State of Good Repair (% CRV) | CRV of Assets Not in a State of Good Repair ($ Billions) | Share of Assets Not in a State of Good Repair (% CRV) | Infrastructure Backlog ($ Billions) | Infrastructure Backlog as a Share of CRV (% CRV) | FAO Projected 10-Year Cost to Eliminate Backlog ($ Billions) | 2019 Budget 10-Year Rehab and Renewal Budget ($ Billions) | 2019 Budget Rehab and Renewal Funding Surplus / (Shortfall) ($ Billions) |
|---|---|---|---|---|---|---|---|---|---|---|
| Transit | ||||||||||
| Buildings | 5.2 | N/A | N/A | N/A | N/A | 1.5 | 29.3% | 3.8 | 3.3 | -0.5 |
| Engineering | 13.6 | N/A | N/A | N/A | N/A | 2.3 | 17.0% | 5.6 | 4.5 | -1.1 |
| Machinery & Equipment | 5.3 | N/A | N/A | N/A | N/A | 0.2 | 3.3% | 5.9 | 0.4 | -5.5 |
| 24.2 | N/A | N/A | N/A | N/A | 4.0 | 16.7% | 15.4 | 8.2 | -7.2 | |
| Highways and Bridges | ||||||||||
| Roads and Highways | 56.4 | 42.2 | 74.7% | 14.3 | 25.3% | 1.6 | 2.8% | 10.8 | 11.6 | 0.8 |
| Bridges and Culverts | 28.3 | 23.3 | 82.5% | 5.0 | 17.5% | 0.3 | 1.0% | 3.1 | 3.1 | 0.0 |
| 84.7 | 65.5 | 77.3% | 19.2 | 22.7% | 1.9 | 2.2% | 13.9 | 14.8 | 0.9 | |
| Hospitals | ||||||||||
| Buildings | 44.7 | 28.2 | 63.2% | 16.5 | 36.8% | 2.4 | 5.4% | 8.9 | 7.7 | -1.2 |
| Machinery & Equipment | 13.8 | 3.4 | 24.8% | 10.4 | 75.2% | 2.3 | 17.0% | 2.9 | 1.6 | -1.3 |
| 58.5 | 31.7 | 54.1% | 26.8 | 45.9% | 4.8 | 8.1% | 11.8 | 9.3 | -2.5 | |
| Schools | ||||||||||
| Buildings | 67.4 | 48.1 | 71.3% | 19.3 | 28.7% | 3.7 | 5.5% | 14.4 | 12.5 | -1.9 |
| Machinery & Equipment | 0.7 | 0.7 | 94.3% | 0.0 | 5.7% | 0.0 | 0.6% | 0.0 | 0.0 | -0.0 |
| 68.1 | 48.8 | 71.6% | 19.4 | 28.4% | 3.7 | 5.4% | 14.4 | 12.5 | -1.9 | |
| Colleges | ||||||||||
| Buildings | 10.6 | 7.3 | 68.9% | 3.3 | 31.1% | 0.5 | 4.3% | 2.6 | 0.6 | -2.0 |
| Machinery & Equipment | 1.9 | 0.8 | 43.3% | 1.1 | 56.7% | 0.6 | 31.6% | 1.3 | 0.1 | -1.2 |
| 12.5 | 8.1 | 65.1% | 4.4 | 34.9% | 1.0 | 8.4% | 3.9 | 0.7 | -3.2 | |
| Other Sectors | ||||||||||
| Buildings | 12.9 | 8.4 | 64.7% | 4.6 | 35.3% | 1.3 | 9.7% | 2.7 | 1.9 | -0.7 |
| Engineering | 2.1 | 1.5 | 74.8% | 0.5 | 25.2% | 0.1 | 6.1% | 0.3 | 0.2 | -0.0 |
| Machinery & Equipment | 2.6 | 2.6 | 100.0% | 0.0 | 0.0% | 0.0 | 0.0% | 2.2 | 0.0 | -2.2 |
| 17.6 | 12.5 | 71.1% | 5.1 | 28.9% | 1.4 | 7.8% | 5.1 | 2.2 | -2.9 | |
| Total | ||||||||||
| Buildings | 140.9 | 92.0 | 65.3% | 48.9 | 34.7% | 9.4 | 6.6% | 32.3 | 25.9 | -6.4 |
| Engineering | 100.4 | 69.4 | 69.2% | 31.0 | 30.8% | 4.3 | 4.3% | 19.8 | 19.5 | -0.3 |
| Machinery & Equipment | 24.3 | 12.0 | 49.4% | 12.3 | 50.6% | 3.1 | 12.8% | 12.4 | 2.2 | -10.2 |
| 265.6 | 173.4 | 65.3% | 92.1 | 34.7% | 16.8 | 6.3% | 64.5 | 47.7 | -16.9 |
C. Development of this Report
Authority
The Financial Accountability Officer accepted a request from a member of the Legislative Assembly to undertake the analysis presented in this report under paragraph 10(1)(b) of the Financial Accountability Officer Act, 2013.
Key Questions
The following key questions were used as a guide while undertaking research for this report:
- What assets does the Province “own”?
- By value, both net book value and current replacement value (CRV).
- By detail, such as asset class, ministry or major project.
- What is the value of public assets (i.e., owned by municipalities, universities, etc.) outside of the “control” of the Province?
- What is the current condition of the assets owned by the Province?
- Based on condition indices (i.e., Facility Condition Index, Bridge Condition Index, Pavement Condition Index).
- Age and useful life.
- How does the condition compare to the state of good repair (SOGR) and the infrastructure backlog?
- What is the Province’s 10-year capital plan?
- Spending on assets owned by the Province vs. spending on other public capital assets.
- By detail such as asset class, ministry or major project.
- By rehabilitation and renewal, expansion and functionality improvements.
- How will the Province’s 10-year capital plan impact the condition of the Province’s assets?
- What is the impact on the various condition indices?
- What is the impact on the infrastructure backlog?
- By entity and asset class.
- What would be the cost of a 10-year capital plan that brings all of the Province’s assets to SOGR?
Methodology
This report has been prepared with the benefit of information provided by, and meetings with staff from, the Ministries of Infrastructure, Transportation, Health, Education, Colleges and Universities, Natural Resources and Forestry, and Government and Consumer Services, and Treasury Board Secretariat.
The methodology used in this report is largely based on data that has been collected and, to the extent possible, standardized by the Ministry of Infrastructure (MOI), as well as an infrastructure renewal model that was developed by MOI and reproduced by the FAO.
The FAO used standardized ministry information from MOI’s Provincial Asset Inventory (PAI) database to provide comparable estimates of the state of repair of the Province’s infrastructure across different sectors and asset-types. This standardized data is then input into the FAO’s infrastructure deterioration model which, through a series of simplified asset management decisions, estimates the current and future infrastructure backlog.
The FAO’s estimates of the state of repair and the infrastructure backlog are sensitive to the data and methodology used in the report. Because there is no consensus on the definitions of the infrastructure backlog and the state of good repair, it is necessary to make assumptions while recognizing that the definitions are subject to debate.[51]
Infrastructure Data
Roughly 83 per cent of asset data used in this report were from engineering-based asset-level assessments. This includes:
- Data provided by the Ministry of Infrastructure from its PAI database, which includes asset-level detailed information on condition, age and CRV. The PAI database was used for the analysis of buildings in the schools, colleges[52] and ‘other’ sectors, as well as culverts.
- Data provided by the Ministry of Health, which includes information on the condition, CRV and age of individual hospital building assets.
- Data provided by the Ministry of Transportation, which includes information on pavement by road segments and information on bridges by individual assets. The pavement data includes information on condition and location but excludes each road segment’s CRV.[53] The bridges data includes information on condition, age and CRV for each individual bridge.
Condition information on the remaining 17 per cent of assets was compiled using both accounting-based information and aggregated data which groups large numbers of assets together. Typically, there is greater confidence in engineering-based, asset-level data, so the use of accounting-based data and aggregated data in the FAO’s analysis may result in less accurate estimates for the share of assets in a state of good repair, as well as the infrastructure backlog.
The following provides an overview of the 17 per cent of assets for which only high-level asset information was provided to the FAO:
- Metrolinx: The FAO was provided with a high-level breakdown of Metrolinx’s assets by different asset-types (rail equipment, buses, rail corridor, etc.). The information includes the asset subclass (bi-level coaches, buses, track and signal, etc.), and Facility Condition Indices (FCI) and CRV for each asset-type. However, it does not include information on the average age or number of assets for each asset-type, nor does it include any individual asset-level detail. The aggregated FCI and CRV estimates provided to the FAO allowed the FAO to estimate the infrastructure backlog. However, the information did not allow the FAO to accurately assess the share of transit assets in a state of good repair, nor did it allow the FAO to determine which assets encompassed the infrastructure backlog.
- Ontario Northland Transportation Commission (ONTC): The Ministry of Transportation provided asset-level accounting information for ONTC, which was used with condition curve information provided by MOI to estimate the average condition and age of these assets.
- Ministry of Natural Resources and Forestry (MNRF): MNRF provided the FAO with a high-level breakdown of its assets by asset-type (buildings, engineering, dams, aircraft, etc.). The information contains data on the average condition, average age, number of assets and total CRV of the different asset-types. The information does not contain individual asset-level detail.
- Machinery and Equipment: The FAO estimated the value and condition of machinery and equipment assets for broader public sector (BPS) entities and the government administration sector using tangible capital asset continuity schedules provided by Treasury Board Secretariat and condition curves provided by the Ministry of Infrastructure.
| Sector | Sub-sector | Source | Type and Level of Detail |
|---|---|---|---|
| Transit | Buildings | Metrolinx / Ministry of Transportation | Aggregated by asset-type |
| Machinery & Equipment | Metrolinx / Ministry of Transportation | Aggregated by asset-type | |
| Engineering | Metrolinx / Ministry of Transportation | Aggregated by asset-type | |
| Highways and Bridges | Highways and Roads | Ministry of Transportation | Engineering, individual assets |
| Bridges | Ministry of Transportation | Engineering, individual assets | |
| Culverts | Ministry of Infrastructure | Engineering, individual assets | |
| Hospitals | Buildings | Ministry of Health | Engineering, individual assets |
| Machinery & Equipment | Treasury Board Secretariat | Accounting, hospital level | |
| Schools | Buildings | Ministry of Infrastructure | Engineering, individual assets |
| Machinery & Equipment | Treasury Board Secretariat | Accounting, school board level | |
| Colleges | Buildings | Ministry of Infrastructure | Engineering, campus level |
| Machinery & Equipment | Treasury Board Secretariat | Accounting, campus level | |
| Other | Buildings | Ministry of Infrastructure Ministry of Natural Resources and Forestry | Engineering, individual assets Aggregated by asset-type |
| Engineering | Ministry of Natural Resources and Forestry | Aggregated by asset-type | |
| Machinery & Equipment | Ministry of Natural Resources and Forestry Treasury Board Secretariat | Aggregated by asset-type Accounting, entity-level |
Measuring the State of Repair and Calculating the Infrastructure Backlog
The asset data received from the Province was input into the FAO’s infrastructure deterioration model, in conjunction with historical capital spending, to update all asset data to March 31, 2020.[54]
This standardized 2020 data was then input into the FAO’s infrastructure deterioration model to assess, using MOI performance standards, whether each asset is in a state of good repair or not. If the asset is not in a state of good repair, the FAO then determined if that asset required capital spending, and if so, the type and amount of capital spending needed to bring each asset into a state of good repair (i.e., the infrastructure backlog). The logic is outlined in Table 6‑4 and is based on decision rules provided by MOI.
| If the Asset’s… | Asset’s State of Repair | Capital Spending Required | Type of Capital Spending | Infrastructure Backlog |
|---|---|---|---|---|
|
In a State of Good Repair | No | N/A | Zero |
|
Not in a State of Good Repair | Yes | Rehabilitation | Amount necessary to bring asset’s condition to Repair Target[55] |
|
Not in a State of Good Repair | No | N/A | Zero. These assets will be allowed to deteriorate until Failure Threshold, at which point they will be renewed. |
|
Not in a State of Good Repair | Yes | Renewal | Amount equal to CRV |
The information and performance standards used to determine an asset’s state of good repair and infrastructure backlog are described below.
- Condition – The condition of public infrastructure is typically measured by condition indices, which are based on engineering assessments of individual assets. The use of indices to summarize the overall condition of an asset is standard practice in asset management and useful for comparing assets of different types and values. There are three different types of condition indices that the Province uses to measure the condition of its assets,[56] which the FAO then standardized so that measurements range from 100 to 0, with 100 indicating the highest condition asset and zero the lowest. This standardized condition data is then used in the FAO’s infrastructure deterioration model, which, combined with the logic described in Table 6‑4 and performance standards in Table 6‑5, determine the state of repair and infrastructure backlog. The condition indices are described below:
- Bridge Condition Index (BCI) is used to measure the condition of provincial bridges and culverts in Ontario. BCI is a measure of a bridge’s overall structural condition and its remaining economic value is expressed as a number between 0 to 100, with 100 indicating a perfect condition asset.
- Pavement Condition Index (PCI) is used to measure the general condition of a pavement section. “Pavement” is defined as the integration of all structural layers (e.g., surface, base and sub-base). PCI is widely used by engineers and asset managers to measure the performance of road infrastructure. PCI represents the condition of the entire pavement structure and ranges from 0 to 100, with 100 indicating brand new. Importantly, PCI is an engineering index and is not a direct financial measure of a pavement section’s capital spending need.
- Facility Condition Indices (FCIs) are commonly used in building management to assess the state of repair. Based on the findings of a building’s assessment, a building’s repair and renewal costs can be estimated. FCI is calculated by dividing the cost of an asset’s total three-year repair and renewal need (its current outstanding need plus the estimated need over the next two years)[57] by the building’s current replacement value.[58] FCI ranges from 0 to 1, with 0 indicating an asset that needs no renewal or repair. The FAO converts FCI to a standard condition measurement, where an asset with an FCI of zero would have a standard condition measurement of 100.
- Age – The actual age of an asset.
- Current Replacement Value – The current cost of rebuilding an asset with the equivalent capacity, functionality and performance as the original asset.
- Asset-type – The type of asset, such as school building, transit engineering infrastructure, hospital machinery and equipment, etc.
- Repair Target – The condition which, at or above, an asset does not require any current capital spending and is considered acceptable from both an engineering quality assessment and cost management perspective. Assets with conditions at or above the repair target are considered to be in a state of good repair.
- Failure Threshold – The condition which, at or below, an asset must be replaced with a new asset (i.e., renewal) in order to bring that asset into a state of good repair.
- Useful Life – The useful life is the number of years which an asset typically remains in operation. Once an asset has reached 90 per cent of twice its useful life, if its condition is still above the Failure Threshold, the asset will be left to depreciate until it reaches the Failure Threshold, at which point it will be renewed.
Table 6-5 includes the performance standards used by the FAO to determine whether an asset is in a state of good repair and its respective infrastructure backlog. These standards reflect the assumed performance targets of different ministries as adopted and adjusted by the Ministry of Infrastructure to facilitate cross-sector comparisons. However, ministries may adopt different targets and consider other factors when making their actual capital spending decisions.[59] Importantly, estimates of the share of assets in a state of good repair and the infrastructure backlog will vary depending on the targets used.[60]
| Sector | Asset Class | Asset-Type | Repair Target* | Failure Threshold* | Useful Life (Years) |
|---|---|---|---|---|---|
| Transit | Buildings | 90 | 35 | 17 | |
| Engineering | 90 | 35 | 21 | ||
| Machinery & Equipment | 85 | 35 | 11 | ||
| Highways and Bridges | Roads and Highways | Arterial Roads | 80 | 35 | 31 |
| Collector Roads | 75 | 40 | 31 | ||
| Freeways | 80 | 55 | 32 | ||
| Local Roads | 70 | 35 | 31 | ||
| Bridges and Culverts | New Bridges | 76 | 40 | 52 | |
| Old Bridges, Deprecated | 76 | 45 | 36 | ||
| Hospitals | Buildings | 79 | 20 | 39 | |
| Machinery & Equipment | 30 | 1 | 32 | ||
| Schools | Buildings | 80 | 20 | 39 | |
| Machinery & Equipment | 25 | 2 | 20 | ||
| Colleges | Buildings | 85 | 20 | 39 | |
| Machinery & Equipment | 25 | 2 | 20 | ||
| Other | Buildings | Correctional Facilities | 85 | 20 | 49 |
| Courthouses | 85 | 20 | 56 | ||
| Government Administration and MNRF | 70 | 15 | 67 | ||
| GREP | 80 | 20 | 49 | ||
| Engineering | Government Administration and MNRF | 72 | 20 | 51 | |
| Machinery & Equipment | Government Administration and MNRF | 10 | 2 | 20 |
Footnotes
[1] In other words, assets that are consolidated on the Province’s financial statements.
[2] ‘Other’ sector assets include government owned offices, correctional facilities and courthouses, and assets owned by the Ministry of Natural Resources and Forestry.
[3] See Appendix C for a description of how the infrastructure backlog is calculated in this report.
[4] Based on the FAO’s infrastructure deterioration model, some assets that are not in a state of good repair do not currently require capital spending and are not included in the infrastructure backlog. See Appendix C for more information.
[5] The FAO’s cost estimate only reflects the capital spending required to address the infrastructure backlog for existing assets and does not account for rehabilitation and renewal spending that may be required for new assets that are brought into service over the next 10 years.
[6] Since the time of writing this report, the Province released an updated 10-year capital plan as part of the 2020 Ontario Budget. In the 2020 budget, the overall 10-year capital plan is slightly lower than the 10-year capital plan in the 2019 budget. The FAO has not reviewed the 2020 budget’s capital plan in detail, but it is likely that the conclusions in this report would apply to the 2020 budget capital plan.
[7] Investing in Canada — Canada’s Long-Term Infrastructure Plan, Infrastructure Canada, Government of Canada, 2018.
[8] For a technical discussion on what constitutes public infrastructure see Baldwin, John R. and Dixon, Jay, Infrastructure Capital: What is it? Where is it? How Much of it is There? (March 12, 2008). Canadian Productivity Review Research Paper No. 16.
[9] These estimates include only tangible capital assets that are consolidated on government balance sheets and exclude non-consolidated assets, such as university buildings, and assets owned by government business enterprises, such as Ontario Power Generation.
[10] Statistics Canada, “Table 36-10-0608-01 Infrastructure Economic Accounts, investment and net stock by asset, industry, and asset function (x 1,000,000).”
[11] 2017 Long-term Infrastructure Plan: Technical Appendix, Ministry of Infrastructure, Government of Ontario.
[12] The term “state of good repair” is used by some entities to refer to an asset operating as intended, delivering the services which the asset was placed into operation to provide. In this report, state of good repair depends on performance standards of acceptable asset conditions (i.e., repair targets), which vary across asset-types and are estimated using different methodologies by various ministries. Appendix C provides details on the repair targets used by the FAO in this report.
[13] The condition of the majority of assets examined throughout this report is measured based on ministry-procured engineering assessments of the asset’s capital spending need or engineering performance. See Appendix C.
[14] There is no common definition of the infrastructure backlog. For example, some infrastructure assessments describe the backlog as the capital spending required to address deferred renewal investments, while others consider the costs associated to bring and maintain existing assets to a “perfect” condition over the next three years. Some assessments of the backlog may also include costs to satisfy the future demand for infrastructure capacity and service improvements. See Appendix C for a description of how the infrastructure backlog is calculated in this report.
[15] Rehabilitation is the repair of all or part of an asset, extending its life beyond that of the original asset, without adding to its capacity, functionality or performance. Rehabilitation is different from maintenance, which is the routine activities performed on an asset that maximize service life and minimize service disruptions. Assets are rehabilitated to a state of good repair (the repair target) and not to a new condition.
[16] Renewal is the replacement of an existing asset, resulting in a new or as-new asset with an equivalent capacity, functionality and performance as the original asset. Renewal is different from rehabilitation, as renewal rebuilds the entire asset.
[17] The FAO received asset condition information from several ministries directly as well as standardized versions of this information from the Ministry of Infrastructure. The FAO then used this information to estimate the infrastructure backlog using its infrastructure deterioration model, which was developed by the Ministry of Infrastructure and then reproduced by the FAO. The FAO’s estimates of the state of repair and the infrastructure backlog are sensitive to the data and methodology used in this report. Appendix C includes more information on the sources and quality of data as well as the methodology used in the FAO’s analysis.
[18] Since the writing of this report, the Province released an updated 10-year capital plan as part of the 2020 Ontario Budget. See Chapter 5 for more information.
[19] The FAO’s scope of analysis is limited to tangible capital assets as reported in Note 9 of the Public Accounts of Ontario, 2019-20 (p. 77). However, it excludes land (as this does not require significant rehabilitation and renewal spending), information technology (as these assets have short useful lives) and other assets as described in footnote 25 of this report. Assets currently under construction, such as the Eglinton Crosstown Light Rail Transit, are also excluded. Finally, assets owned by government business enterprises (GBEs), such as Ontario Power Generation, are excluded from the FAO’s analysis because these assets are consolidated (net of liabilities) as financial assets in the Public Accounts of Ontario.
[20] In addition, Ontario’s school boards own roughly 7,000 portables. However, these assets are excluded from the FAO’s analysis.
[21] Public Accounts of Ontario, 2019-20, p. 77.
[22] Since capital assets last several years, the Province amortizes (i.e., spreads) the cost of tangible capital assets over their useful life. By amortizing the expense, costs are better aligned with the years in which capital assets are consumed.
[23] Current replacement value (CRV) also accounts for improvements in construction technology and materials, which would deliver equivalent service capacity for an equal or lesser cost, slightly offsetting increased costs due to inflation.
[24] CRV is estimated based on facility condition assessments conducted by engineers, whereas the Province’s financial statements are prepared in accordance with the accounting standards for governments recommended by the Public Sector Accounting Board (PSAB).
[25] Land, information technology, and other minor tangible capital assets are excluded from the FAO’s analysis. Also, some of the asset inventory information provided to the FAO had not been updated to 2019-20. As a result, some newly built assets (expansion assets) are not reflected in the FAO’s total CRV estimate. Overall, an estimated 80 per cent of the Province’s tangible capital assets have been included in the FAO’s analysis. Appendix B includes the CRV for the Province’s infrastructure by sector and asset-type.
[26] 2017 Long-term Infrastructure Plan: Technical Appendix, Ministry of Infrastructure, Government of Ontario.
[27] The term “state of good repair” is used by some entities to refer to an asset operating as intended, delivering the services that the asset was placed into operation to provide. In this report, state of good repair depends on performance standards of acceptable asset conditions (i.e., repair targets) which vary across asset-types and are estimated using different methodologies by various ministries. Appendix C provides details on the repair targets used by the FAO for this report.
[28] The condition of the majority of assets examined throughout this report is measured based on ministry-procured engineering assessments of the asset’s capital spending need or engineering performance. See Appendix C.
[29] Conditions are measured using condition indices, which are based on engineering assessments of the condition or repair need of infrastructure assets. There are three types of condition indices used for Provincial infrastructure: Bridge Condition Index, Pavement Condition Index and Facility Condition Index. See Appendix C for more information.
[30] Ministries may also use alternative targets to evaluate their infrastructure assets. For example, the Ministry of Transportation targets 67 per cent of pavement segments to have a “Good” condition (see page 21, 2017 Long-term Infrastructure Plan: Technical Appendix, Ministry of Infrastructure, Government of Ontario). For this report, the FAO has applied a standardized methodology to calculate the state of good repair for all Provincial assets based on performance targets provided by the Ministry of Infrastructure.
[31] The repair target is the condition which, at or above, an asset is considered in a state of good repair. The failure threshold is the condition which, at or below, an asset must be replaced with a new asset (i.e., renewal) to bring that asset into a state of good repair. The useful life is the number of years that an asset typically remains in operation. Appendix C provides additional details.
[32] Instead, Metrolinx and ONTC provided the FAO with aggregated, high-level information on their assets. For more information on the data used in this report, see Appendix C.
[33] There is no common definition of the infrastructure backlog. For example, some infrastructure assessments describe the backlog as the capital spending required to address deferred renewal investments, while others consider the costs associated to bring and maintain existing assets to a “perfect” condition over the next three years. Some assessments of the backlog may also include costs to satisfy the future demand for infrastructure capacity and service improvements. See Appendix C for a description of how the infrastructure backlog is calculated in this report.
[34] Rehabilitation is the repair of all or part of an asset, extending its life beyond that of the original asset, without adding to its capacity, functionality, or performance. Rehabilitation is different from maintenance, which comprises the routine activities performed on an asset that maximize service life and minimize service disruptions. Assets are rehabilitated to a state of good repair (the repair target) and not to a new condition.
[35] Renewal is the replacement of an existing asset, resulting in a new or as-new asset with an equivalent capacity, functionality, and performance as the original asset. Renewal is different from rehabilitation, as renewal rebuilds the entire asset.
[36] Not being in a state of good repair does not necessarily mean that the asset is unsafe for use nor does it mean that the asset is not providing the services, or fulfilling the function, it was placed into operation to provide.
[37] The FAO received asset condition information from several ministries directly as well as standardized versions of this information from the Ministry of Infrastructure. The FAO used this information to estimate the infrastructure backlog using its infrastructure deterioration model, which was developed by the Ministry of Infrastructure and then reproduced by the FAO. The FAO’s estimates of the infrastructure backlog are sensitive to the data and methodology used in this report. Ministries manage a diverse portfolio of assets and may use different methodologies to determine the state of repair and infrastructure backlog of their assets, which may not align with the estimates presented in this report. Appendix C includes more information on the sources and quality of data and the methodology used in the FAO’s analysis.
[38] This includes assets that are left to deteriorate until failure, at which point they are renewed. The FAO estimates that more than one-fifth of these assets will have to be replaced over the next nine years (2021-22 to 2029-30). The cost of replacing these assets will be reflected in the infrastructure backlog estimate in future years.
[39] Despite the lack of asset-level detail for transit infrastructure, the FAO did receive aggregated data from Metrolinx, which contained CRV and Facility Condition Index (FCI) estimates by asset-types. FCI data contains the three-year renewal spending need, which combined with the sector’s performance standards, allowed the FAO to calculate Metrolinx’s infrastructure backlog. The backlog of ONTC infrastructure was calculated based on accounting data and other assumptions. For more information, see Appendix C.
[40] The poorer the condition of an asset, the higher the ratio of infrastructure backlog to CRV.
[41] The FAO’s estimate of $64.5 billion in spending over 10 years to address the Province’s infrastructure backlog only reflects the capital spending required to address the infrastructure backlog for existing assets and does not account for rehabilitation and renewal spending that may be required for new assets that are brought into service over the next 10 years.
[42] 2019 Ontario Budget, p. 14. Amount includes third-party investments in hospitals, colleges and schools.
[43] Since the time of the writing of this report, the Province released an updated 10-year capital plan in the 2020 Ontario Budget (p. 23). Projected 10-year infrastructure spending in the 2020 budget is $162.7 billion, which is slightly lower than the 10-year capital plan in the 2019 budget. The FAO has not reviewed the rehabilitation and renewal investments in the 2020 budget’s capital plan, but it is likely that the conclusions in this report would remain largely unchanged.
[44] The FAO’s analysis is based on the capital plan as reflected in the 2019 budget and does not reflect any potential subsequent decisions to reallocate capital plan funding.
[45] See Appendix B for additional information.
[46] The estimated infrastructure backlog in 2029-30 of $22.7 billion is larger than the $16.9 billion funding gap between the FAO scenario to eliminate the backlog and the 2019 budget capital plan. The difference between the funding gap and the backlog can largely be attributed to the capital plan’s allocation of funding between sectors and the yearly profile of capital spending within sectors. To efficiently eliminate the backlog, capital spending needs to be targeted both by sector and by year within sectors. Even if a sector has adequate funding to eliminate its backlog over 10 years, if this spending is not targeted and distributed based on yearly need, a backlog may still result.
[47] Defined by Statistics Canada, Ontario’s economic regions are groupings of census divisions used to create a standard geographical unit for analyzing regional economic activity. For more information, see Statistics Canada’s Standard Geographical Classification – Economic Regions.
[48] This appendix reports on the physical locations of the Province’s assets by economic region. The actual areas served by many assets may extend beyond the boundaries of economic regions. For example, specialty hospitals or colleges serve the entire province.
[49] These assets are for the most part the same assets for which only high-level information is available: machinery and equipment for all sectors, transit assets (Metrolinx and Ontario Northland Transportation Commission) and Ministry of Natural Resources and Forestry (MNRF) assets.
[50] The estimates presented include only those assets which have geographic information.
[51] Ministries manage a diverse portfolio of assets and may use different methodologies to determine the state of repair of their assets and the associated infrastructure backlog, which may not align with the estimates presented in this report. For example, the Ministry of Education measures asset condition based on an asset’s estimated five-year capital spending need (total current need plus forecasted need over the next four years). The Ministry of Transportation uses a different approach when evaluating its assets, with a target of 67 per cent of pavement segments in “good” condition, while considering factors such as engineering inspection data, traffic volume, environment, age, etc.
[52] The FAO received campus-level information for 24 colleges. This information contains the average condition, average age, and total CRV of building assets within a college campus based on facility condition assessments, but does not contain individual asset-level detail.
[53] Instead, MTO has provided the FAO with an estimate of the overall replacement cost of the pavement network reflecting a Tender Price Index estimate that was completed in 2011 and updated to reflect current costs. The FAO has used this high-level estimate and distributed it amongst pavement segments based on kilometre length and number of lanes.
[54] The asset data received from ministries was collected over the 2018 to 2020 period.
[55] To estimate the cost of rehabilitation, the FAO assumes that there is a direct relationship between an asset’s measured condition index and the current replacement value of an asset. For example, if an asset’s condition index is 70 and its Repair Target is 85, rehabilitation costs are calculated by multiplying the asset’s CRV by the difference between the Repair Target and current condition, that is, CRV x [(85-70)/100]. For assets measured with a Facility Condition Index (FCI), this is true based on the definition and calculation of FCI. However, for assets measured
using a Pavement Condition Index (PCI) and a Bridge Condition Index (BCI) this relationship is assumed. Additionally, ministries may use different approaches to address the rehabilitation and renewal needs of their assets, which may not align with the simplified approach taken in this report.
[56] For a discussion on the three condition indices, see Ontario’s Long-term Infrastructure Plan 2017, Technical Appendix, Government of Ontario.
[57] The use of FCI in this report means that the cost required to bring eligible assets up to a state of good repair (i.e., the infrastructure backlog) may include future capital spending over the next two years.
[58] For example, if an asset with a current replacement value of $10 million needed $2 million in capital spending today, and an estimated $500,000 in capital spending over the next two years, the FCI would be 0.25. Other assessments may calculate the infrastructure backlog as the sum of the total capital needed (i.e., $2.5 million over three years). The FAO calculates the backlog as the amount of capital spending currently required to get to the repair target. If the repair target were 0.15, this would mean that $1,000,000 would need to be spent today to get to an FCI of 0.15. If $1 million is spent on this asset, it would be classified as in a state of good repair and would have no infrastructure backlog.
[59] For example, the Ministry of Transportation uses different PCI and BCI targets to assess the state of repair of its pavement and bridge assets. See Ontario’s Long-term Infrastructure Plan 2017, Technical Appendix, Government of Ontario, p. 15.
[60] If the repair targets were higher than those in Table 6‑5, the share of assets in a state of good repair would be lower and the infrastructure backlog would be higher than the estimates presented in this report. In contrast, if the repair targets were lower, the share of assets in a state of good repair would be higher and the backlog would be lower.