

1. Summary
This report examines Ontario municipal and provincial transit agencies’ ridership and finances, including their own-source revenues, operating expenses and operating subsidies. The report also provides an overview and projection of provincial transit operating subsidies through 2028-29, and assesses the fiscal impact of new subsidy programs, including the One Fare program. Finally, this report analyzes the distribution of provincial subsidies across economic regions on a per-resident basis.
Overview of Transit Agencies in Ontario
- In 2022, Ontario’s public transit system was operated by 106 municipal transit agencies and two provincial transit agencies,[1] with funding from federal, provincial and municipal governments.
- Municipal and provincial transit agencies facilitated 590.9 million passenger trips in 2022, of which municipal transit agencies accounted for 556.0 million (94.1 per cent) of total ridership, while the remaining 34.9 million trips (5.9 per cent) were recorded by provincial transit agencies.
- While municipal transit agencies serve more passengers than provincial transit agencies, provincial transit agencies cover larger distances per trip. In 2022, the two provincial agencies, Metrolinx and the Ontario Northland Transportation Commission (ONTC), had average trip lengths of 37 kilometres and 349 kilometres per passenger, respectively, compared to average passenger trip lengths of seven kilometres for municipal agencies.
- The COVID-19 pandemic and subsequent changes to commuting patterns have significantly impacted transit ridership in Ontario. Ridership declined from 953.3 million passenger trips in 2019 to 418.9 million in 2020 and further to 357.7 million in 2021, representing 37.5 per cent of the 2019 pre-pandemic level. In 2022, total ridership partially rebounded to 590.9 million trips, or 62.0 per cent of the 2019 pre-pandemic level, with further recovery expected in 2023.
- The impact on ridership varied by agency with commuter-heavy agencies, such as the Toronto Transit Commission (TTC), OC Transpo and Metrolinx, experiencing significant declines and slower recoveries, while suburban agencies, such as MiWay and Brampton Transit, generally saw milder impacts and stronger rebounds.
Finances of Ontario’s Transit Agencies
- Municipal and provincial transit agencies fund their operating expenses through a combination of own-source revenues, largely generated from passenger fares charged to riders, and operating subsidies provided by governments.
- In 2022, the 108 municipal and provincial transit agencies recorded $6.1 billion in operating expenses. In the same year, these agencies recorded total operating revenues of $6.0 billion, which consisted of $1.9 billion in own-source revenues and $4.1 billion in government operating subsidies.
- From 2018 to 2022, Ontario’s transit agencies saw their total operating expenses increase at an average annual rate of 5.0 per cent, rising from $5.0 billion to $6.1 billion. Over the same period, there was a decline in service levels, with the distance travelled by transit vehicles declining from 593 million kilometres in 2018 to 528 million kilometres in 2022.
- Over the same period, own-source revenues significantly declined due to reductions in ridership and passenger fare revenues during the COVID-19 pandemic. Between 2019 and 2021, transit agencies’ own-source revenues decreased from $2.8 billion to $1.2 billion, a decline of 57.6 per cent. In 2022, own-source revenues recovered to $1.9 billion, or 68.1 per cent of 2019 levels.
- With higher expenses and lower own-source revenues, government operating subsidies to provincial and municipal transit agencies increased from $2.5 billion in 2019 to $4.1 billion in 2022, largely driven by the federal-provincial Safe Restart Agreement, increased provincial funding for Metrolinx and the ONTC, and increased municipal funding to municipal transit agencies.
- In 2019, the $2.5 billion in government operating subsidies was funded by the Government of Ontario (the Province) (27.6 per cent) and municipalities (72.4 per cent). In 2022, the $4.1 billion in government operating subsidies was funded by the Province (38.9 per cent), municipalities (53.6 per cent) and the federal government (7.5 per cent).
- Overall, in 2022, about one-third of transit agencies’ operating expenses were funded by own-source revenues, with the remaining two-thirds supported by government subsidies. This was a significant change from 2019, when 52.4 per cent of transit agencies’ operating expenses were funded by own-source revenues and 47.5 per cent were supported by government subsidies.
- In 2022, of the largest transit agencies, the TTC was near the average, with 35.9 per cent of its operating expenses funded by own-source revenues and 64.1 per cent supported by government subsidies. OC Transpo funded 19.0 per cent of its operating expenses by own-source revenues, with 81.0 per cent supported by government subsidies, while Metrolinx funded approximately 28.1 per cent of its operating expenses by own-source revenues with 67.2 per cent supported by subsidies.[2]
Provincial Transit Operating Subsidies
- The Province provides operating subsidies to provincial and municipal transit agencies through direct subsidies to provincial transit agencies, ongoing funding to municipalities and time-limited programs. In 2024-25, the largest provincial operating subsidy programs are the Metrolinx base operating subsidy, fare integration programs, the Ontario Gas Tax Program and the Ontario-Toronto New Deal Agreement.
- Between 2018-19 and 2022-23, total annual provincial transit operating subsidies increased from $0.8 billion to $1.7 billion, primarily due to a higher Metrolinx base operating subsidy and time-limited funding to municipalities through the Safe Restart Agreement in response to the COVID-19 pandemic. Going forward, the FAO projects that total provincial transit operating subsidies will reach $1.8 billion in 2028-29, as the expiry of time-limited programs is offset by a projected increase to the Metrolinx base operating subsidy.
Metrolinx Base Operating Subsidy
- The Province provides a base operating subsidy to Metrolinx to support its core activities, which include operating GO Transit and UP Express, administering the PRESTO payment card system and coordinating regional transit.
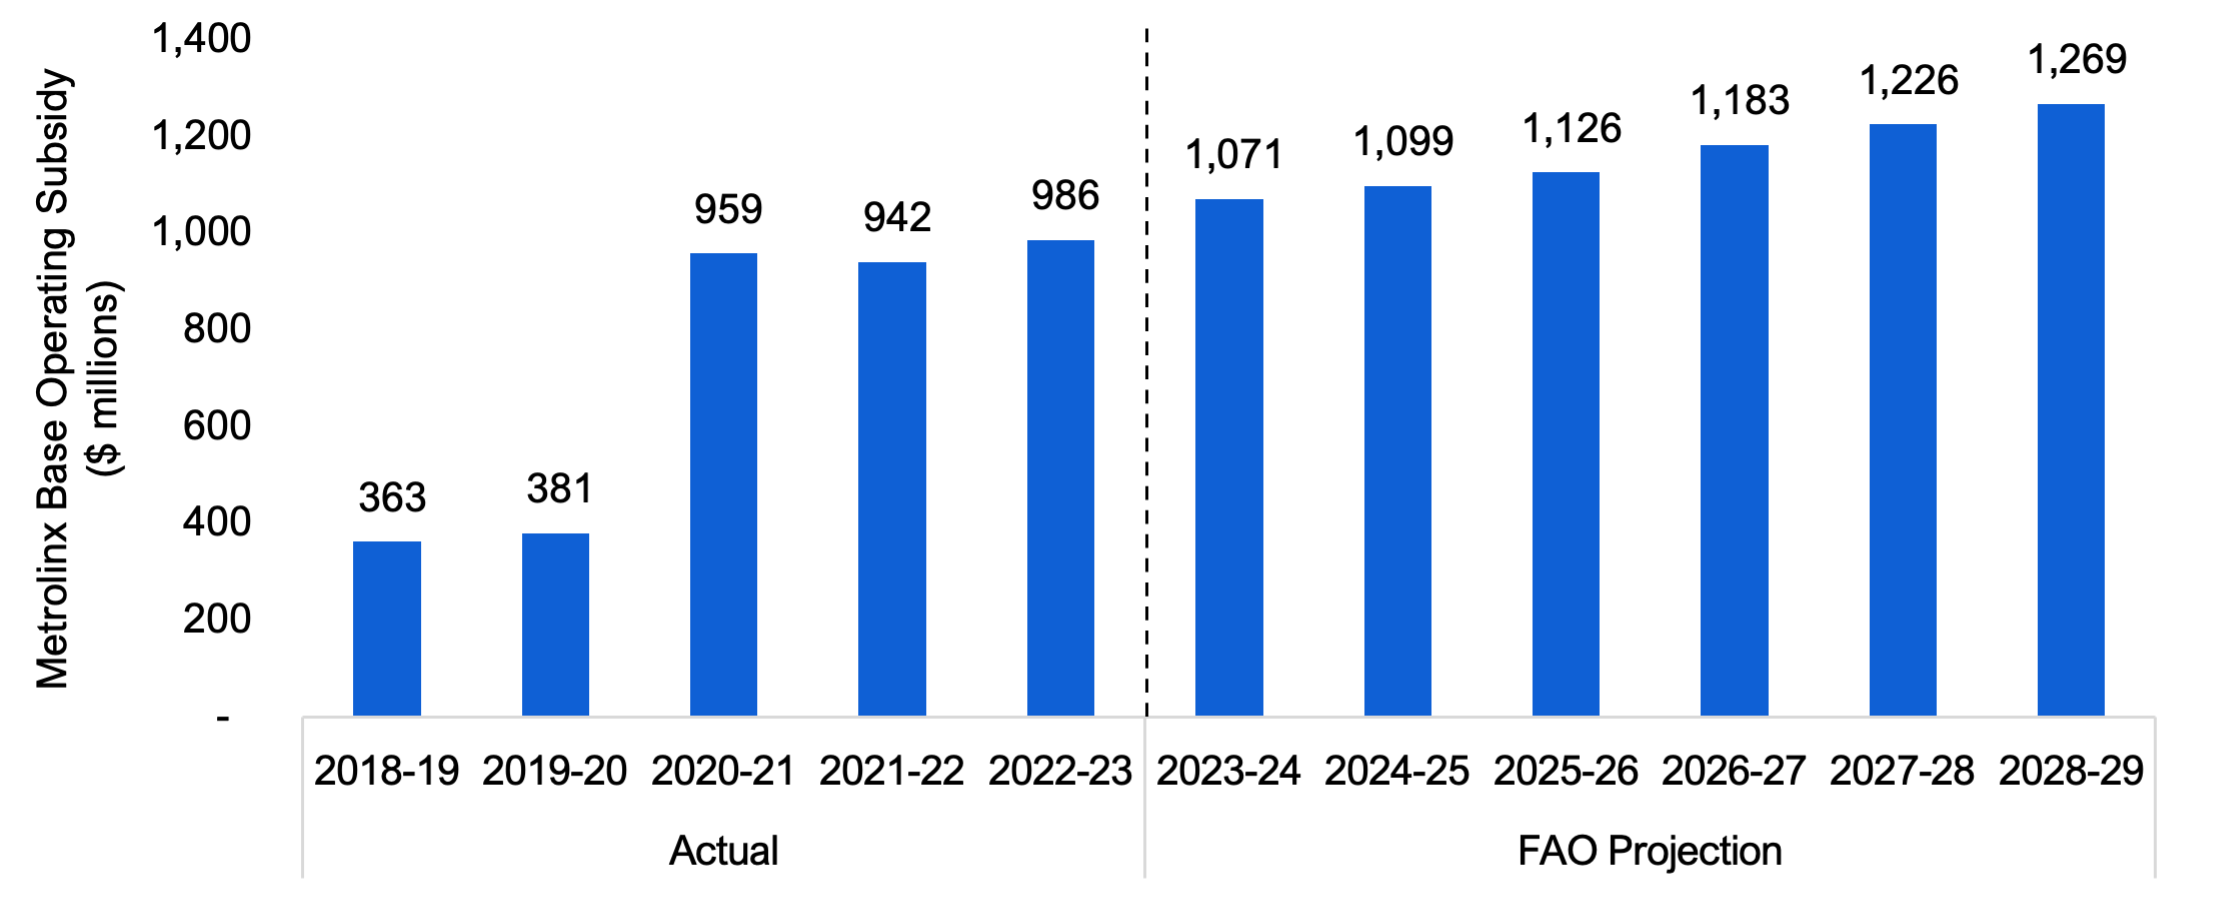
- In 2022-23, Metrolinx received a base operating subsidy of $986 million, an increase from the $381 million recorded in 2019-20. This increase was due to a combination of reduced fare revenue due to the impact of the COVID-19 pandemic on ridership and growth in expenses.
- From 2023-24 to 2028-29, the FAO projects that the Metrolinx base operating subsidy will remain elevated compared to before the COVID-19 pandemic, despite a projected return to pre-pandemic ridership levels by 2025-26. Overall, the FAO projects that the Metrolinx base operating subsidy will increase from $1,071 million in 2023-24 to $1,269 million in 2028-29.
- In general, there has been a significant increase in Metrolinx’s expenses due to increases in GO Transit service levels, the expansion of Metrolinx’s operations related to the delivery and handover of new transit projects such as the Finch West LRT and Eglinton Crosstown LRT, higher wages, and the impact of inflation on expenses, which are expected to more than offset the projected increase in own-source revenues as ridership recovers from the pandemic.
Fare Integration Programs
- The Province funds two fare integration programs that reduce or eliminate the second fare paid by riders when transferring between transit agencies to reduce costs for passengers and increase ridership.
- The GO Transit – Greater Golden Horseshoe (GGH) region fare integration program covers the cost of the municipal transit agency fare paid by passengers transferring between GO Transit and 12 GGH region municipal transit agencies,[3] excluding the TTC. This program cost $15 million in 2022-23 and is projected to increase to an estimated $27 million in 2028-29.
- In 2023, the Province introduced the One Fare program, which eliminated the municipal fare for transfers between the TTC and GO Transit, as well as the second fare for transfers between the TTC and its neighbouring transit agencies. The FAO estimates that the One Fare program will cost the Province $10 million in 2023-24 as the program commenced near the end of the fiscal year, in February 2024. The cost of the program is projected to rise to $121 million in 2024-25, the first full year of the program, and to $128 million in 2025-26, the last year for which the Province has committed funding.
Ontario Gas Tax Program
- The Ontario Gas Tax Program uses revenue generated by Ontario’s gasoline tax to provide ongoing funding for municipal transit operations, service expansion and transit infrastructure. The funding is distributed to municipalities based on ridership and service area population. In 2022-23, the Province provided $378 million in funding to municipalities through the program, which is projected to increase to $391 million in 2028-29.
Ontario-Toronto New Deal Agreement
- In November 2023, the Province and the City of Toronto announced the Ontario-Toronto New Deal Agreement, which included two new time-limited subsidies for transit operations in Toronto.
- The Subway and Transit Safety, Recovery and Sustainable Operations Fund, which provided a one-time $300 million operating subsidy for the TTC in 2023-24.
- The Finch West and Eglinton Crosstown LRT operating support subsidy, which will provide the City of Toronto with $330 million over three years between 2024-25 and 2026-27 to support operations while bringing the Finch West and Eglinton Crosstown LRT lines into service.
Distribution of Provincial Transit Operating Subsidies by Economic Region
- In 2022-23, the Province provided $1.7 billion in operating subsidies to public transit agencies in Ontario. On average, each Ontario resident received $111.16 in public transit operating subsidies; however, per-resident subsidies varied significantly across Ontario’s 11 economic regions.[4]
- In 2022-23, the Toronto economic region[5] received an estimated $1.4 billion in provincial operating subsidies, equivalent to $191.00 per resident. This was the highest among Ontario’s 11 economic regions. The Northeast economic region received the second highest amount in provincial operating subsidies per resident, at $73.02 per resident, followed by the Hamilton – Niagara Peninsula region ($59.82) and the Ottawa region ($59.61). Regions with the lowest per-resident provincial transit subsidies were Stratford – Bruce Peninsula ($12.80), Windsor – Sarnia ($14.60) and London ($18.00).
- Generally, regions served by both municipal and provincial transit agencies receive more provincial operating subsidies than regions with only municipal transit agencies.
- Changes to total provincial transit operating subsidies, combined with population growth, are expected to result in per-resident subsidies increasing from $111.16 per resident in 2022-23 to $112.16 per resident in 2024-25, and then declining to $103.76 per resident in 2028-29.
- The decline in the per resident subsidy in 2028-29 is due to the expiry of time limited funding programs, such as the Safe Restart Agreement, the One Fare program and the Ontario-Toronto New Deal Agreement, partially offset by higher projected subsidies for Metrolinx and the ONTC.
- For information on the per-resident impact by economic region, see Chapter 6.
2. Introduction
Purpose and Structure
At the request of a Member of Provincial Parliament, this report examines Ontario municipal and provincial transit agencies’ ridership and finances, including their own-source revenues, operating expenses and operating subsidies. The report also provides an overview and a projection of provincial operating transit subsidies through 2028-29 and assesses the financial cost of new subsidy programs, including the One Fare program. Finally, this report analyzes the distribution of provincial subsidies across economic regions on a per-resident basis.
The report is divided into the following chapters:
- Chapter 3 provides an overview of Ontario’s 106 municipal transit agencies and two provincial transit agencies,[6] and discusses the impact of the COVID-19 pandemic on transit agency ridership.
- Chapter 4 provides an overview of the finances of Ontario’s public transit agencies. The chapter analyzes public transit agencies’ total operating expenses and total operating revenues, including own-source revenues and operating subsidies, and compares finances across individual transit agencies.
- Chapter 5 explains how the Government of Ontario (the Province) subsidizes the operations of public transit agencies and provides a projection for the cost of provincial subsidies by program to 2028-29. This chapter also provides an overview of new subsidy programs, including the One Fare program and the Ontario-Toronto New Deal Agreement.
- Chapter 6 compares provincial operating subsidies to transit agencies by economic region on a per-resident basis.
Scope
The purpose of this report is to examine the operating revenues, expenses and subsidies of Ontario’s 106 municipal transit agencies and two provincial transit agencies. Transportation services that are not provincially or municipally operated (such as federal transit agencies and private transit agencies), and transportation services that largely focus on seasonal or leisure travel (such as the Owen Sound Transportation Company and Toronto Island Ferry), are outside the scope of this report. This report focuses on operating revenues, expenses and subsidies; therefore capital expenditures and subsidies are also outside of the scope. Finally, this report does not examine transit subsidies that are not provided directly to transit agencies (such as the Ontario Seniors Public Transit Tax Credit) or the economic benefits associated with existing public transit operations, fare integration or other transit programs.
Methodology and Sources
This report primarily uses data provided to the FAO by the Ministry of Transportation and Metrolinx, including data from the Canadian Urban Transit Association. Transit agency financial and ridership data are available up to 2022; however, the FAO estimates ridership and financial data for a small number of agencies that had incomplete information. After 2022, the FAO projects transit agencies’ ridership, revenues, expenses and subsidies using an economic and financial model, which also incorporates actual 2023 ridership information where available. More information on the FAO’s methodology is available in the Appendix.
Additional Information
For additional information on ridership, service area population, revenues, expenses, subsidies and other characteristics of individual municipal and provincial transit agencies, please visit the FAO’s website at: https://tinyurl.com/2cztcjba.
3. Transit Agencies in Ontario
Overview
In 2022, Ontario’s public transit system was operated by 106 municipal transit agencies and two provincial transit agencies, with funding from federal, provincial and municipal governments.[7] Municipal and provincial transit agencies facilitated 590.9 million passenger trips,[8] of which the 106 municipal transit agencies accounted for a combined 556.0 million trips, or 94.1 per cent of total ridership, and the two provincial transit agencies recorded 34.9 million trips, or 5.9 per cent of total ridership.[9]
| Level of Government | Number of Agencies | Ridership (millions) | Share of Total Ridership (%) | ||||
|---|---|---|---|---|---|---|---|
| Municipal Transit Agencies | 106 | 556.0 | 94.1 | ||||
| Provincial Transit Agencies | 2 | 34.9 | 5.9 | ||||
| Total | 108 | 590.9 | 100.0 |
Municipal Transit Agencies
Municipalities across Ontario operate public transit agencies primarily to enhance mobility for residents without vehicles, increase access to public spaces, and reduce congestion and pollution. Of the province’s 106 municipal transit agencies, the Toronto Transit Commission (TTC) is the largest agency, accounting for over half (54.3 per cent) of all transit ridership in 2022. The TTC had ridership of 321.0 million in 2022 and a service area population of 3.0 million. OC Transpo in Ottawa followed, with ridership of 50.8 million and a service area population of 1.1 million. MiWay in Mississauga was the third largest, with 35.7 million trips and a service area population of 0.8 million.
The remaining top 10 largest municipal transit agencies include Brampton Transit, Grand River Transit, York Region Transit, Hamilton Street Railway, the London Transit Commission, Durham Region Transit and Transit Windsor. Combined, the 10 largest municipal transit agencies accounted for 515.2 million trips in 2022, representing 87.2 per cent of all trips and a total service area population of 9.5 million. Outside of the 10 largest municipal transit agencies, the remaining municipal agencies collectively accounted for ridership of 40.8 million, or 6.9 per cent of total ridership.
| Municipal Transit Agencies | Area Served | Ridership (millions) | Share of Total Transit Ridership (%) | Service Area Population (millions) |
|---|---|---|---|---|
| Toronto Transit Commission (TTC) | Toronto | 321.0 | 54.3 | 3.0 |
| OC Transpo | Ottawa | 50.8 | 8.6 | 1.1 |
| MiWay | Mississauga | 35.7 | 6.0 | 0.8 |
| Brampton Transit | Brampton | 31.3 | 5.3 | 0.7 |
| Grand River Transit (GRT) | Waterloo Region | 18.0 | 3.0 | 0.6 |
| York Region Transit (YRT) | York Region | 16.3 | 2.8 | 1.2 |
| Hamilton Street Railway (HSR) | Hamilton | 15.8 | 2.7 | 0.6 |
| London Transit Commission (LTC) | London | 13.6 | 2.3 | 0.4 |
| Durham Region Transit (DRT) | Durham Region | 7.4 | 1.3 | 0.7 |
| Transit Windsor | Windsor | 5.3 | 0.9 | 0.2 |
| All Other Municipal Agencies | - | 40.8 | 6.9 | 4.4* |
| Municipal Transit Agencies Total | - | 556.0 | 94.1 | 13.9* |
Municipal transit agencies serving areas with larger populations tend to have higher relative ridership compared to those serving areas with smaller populations. In 2022, municipal transit agencies that served areas with a large population (exceeding 400,000 residents) had an average of 45.0 transit passenger trips per person. The municipal transit agency with the largest ridership relative to its service area population was the TTC, with an average of 106.1 transit trips per person in 2022. Municipal transit agencies that provided service to areas with a medium-sized population (between 50,000 and 400,000 residents) had an average of 12.7 trips per person in 2022. Municipal transit agencies that served areas with a small population (less than 50,000 residents) had an average of 3.3 trips per person in 2022.
Figure 3.1 Public transit trips per person on municipal transit agencies in Ontario, grouped by agency service area population, 2022
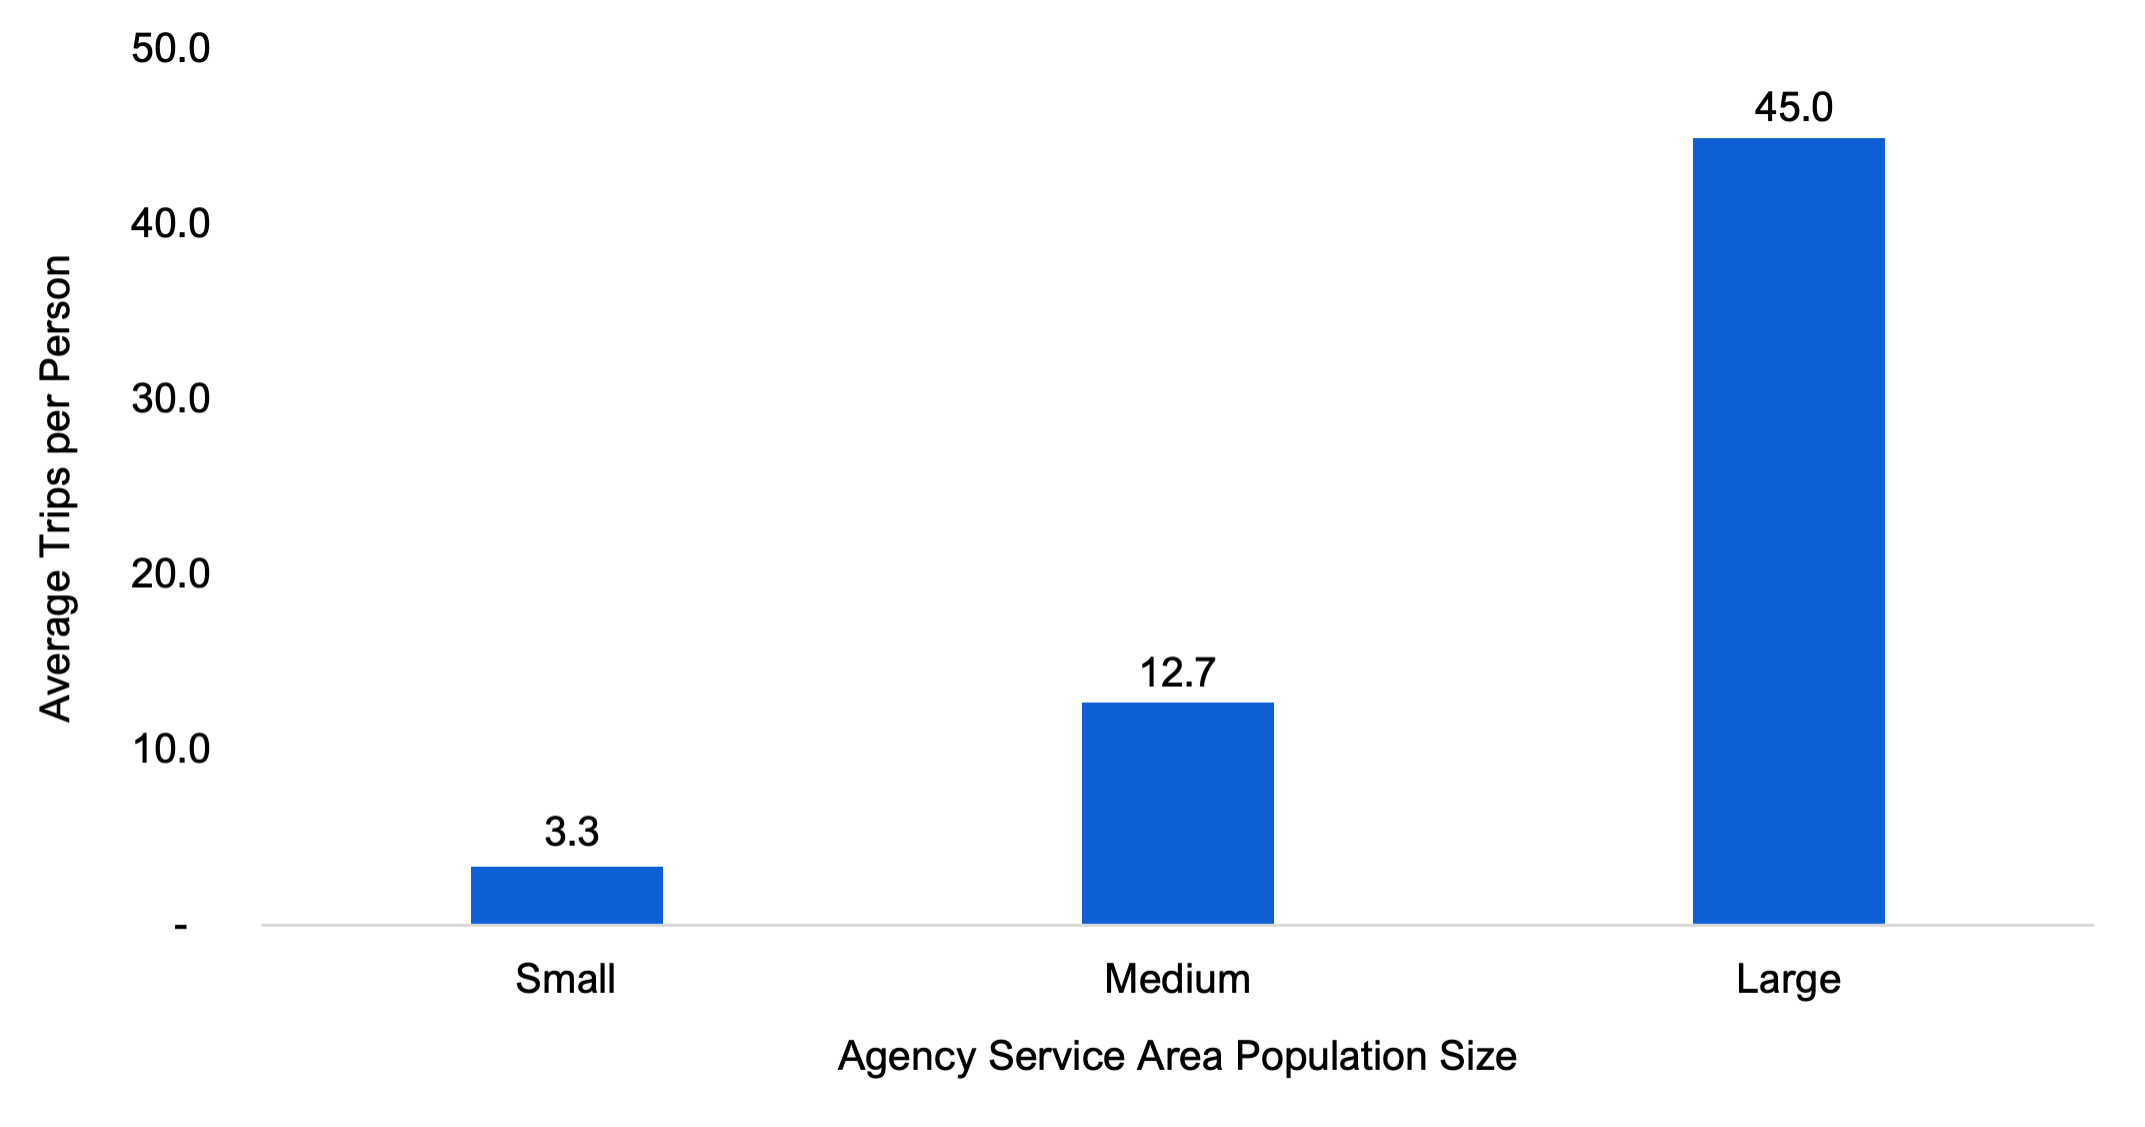
Note: Small transit agency population size refers to agencies serving an area with a population of less than 50,000, medium refers to agencies serving an area with a population of between 50,000 and 400,000, and large refers to agencies serving an area with a population of over 400,000.
Source: FAO analysis of information provided by the Province
Accessible version
| Agency Service Area Population Size | |||
|---|---|---|---|
| Small | Medium | Large | |
| Average Trips per Person | 3.3 | 12.7 | 45.0 |
Provincial Transit Agencies
The Province has two public transit agencies[10] that are responsible for providing broad regional transit coordination, connecting underserved Northern communities and providing essential transportation links to some remote communities. The two provincial transit agencies also provide a variety of other services, such as freight services, payment card administration, and rail repairs and refurbishment.
- Metrolinx is responsible for regional public transit in the Greater Golden Horseshoe (GGH) region.[11] The agency reports to the Ministry of Transportation (MTO) and operates GO Transit and UP Express. Metrolinx also operates the PRESTO electronic payment system in the GGH region and Ottawa. In 2022, Metrolinx recorded 34.6 million trips through GO Transit and UP Express, and served an area with a population of 9.8 million.
- The Ontario Northland Transportation Commission (also known as Ontario Northland or the ONTC) is a provincial agency that reports to MTO and connects Northern Ontario to large urban centres. The agency operates a range of freight and passenger services, including the operation of motor coach buses and the Polar Bear Express (PBX), and provides remanufacturing and repair services for rail equipment. The ONTC also plans to reintroduce the Northlander passenger train, providing service between Toronto and Northern Ontario, by the mid-2020s.[12] In 2022, the ONTC recorded 0.3 million trips and served a population of 0.5 million.
| Provincial Transit Agencies | Areas Served | Ridership (millions) | Share of Total Transit Ridership (%) | Service Area Population (millions) |
|---|---|---|---|---|
| Metrolinx | Greater Golden Horseshoe region | 34.6 | 5.9 | 9.8 |
| Ontario Northland Transportation Commission (ONTC) | Primarily Northern Ontario | 0.3 | 0.0 | 0.5 |
| Provincial Transit Agencies Total | - | 34.9 | 5.9 | 10.3 |
Average Distance Travelled per Passenger
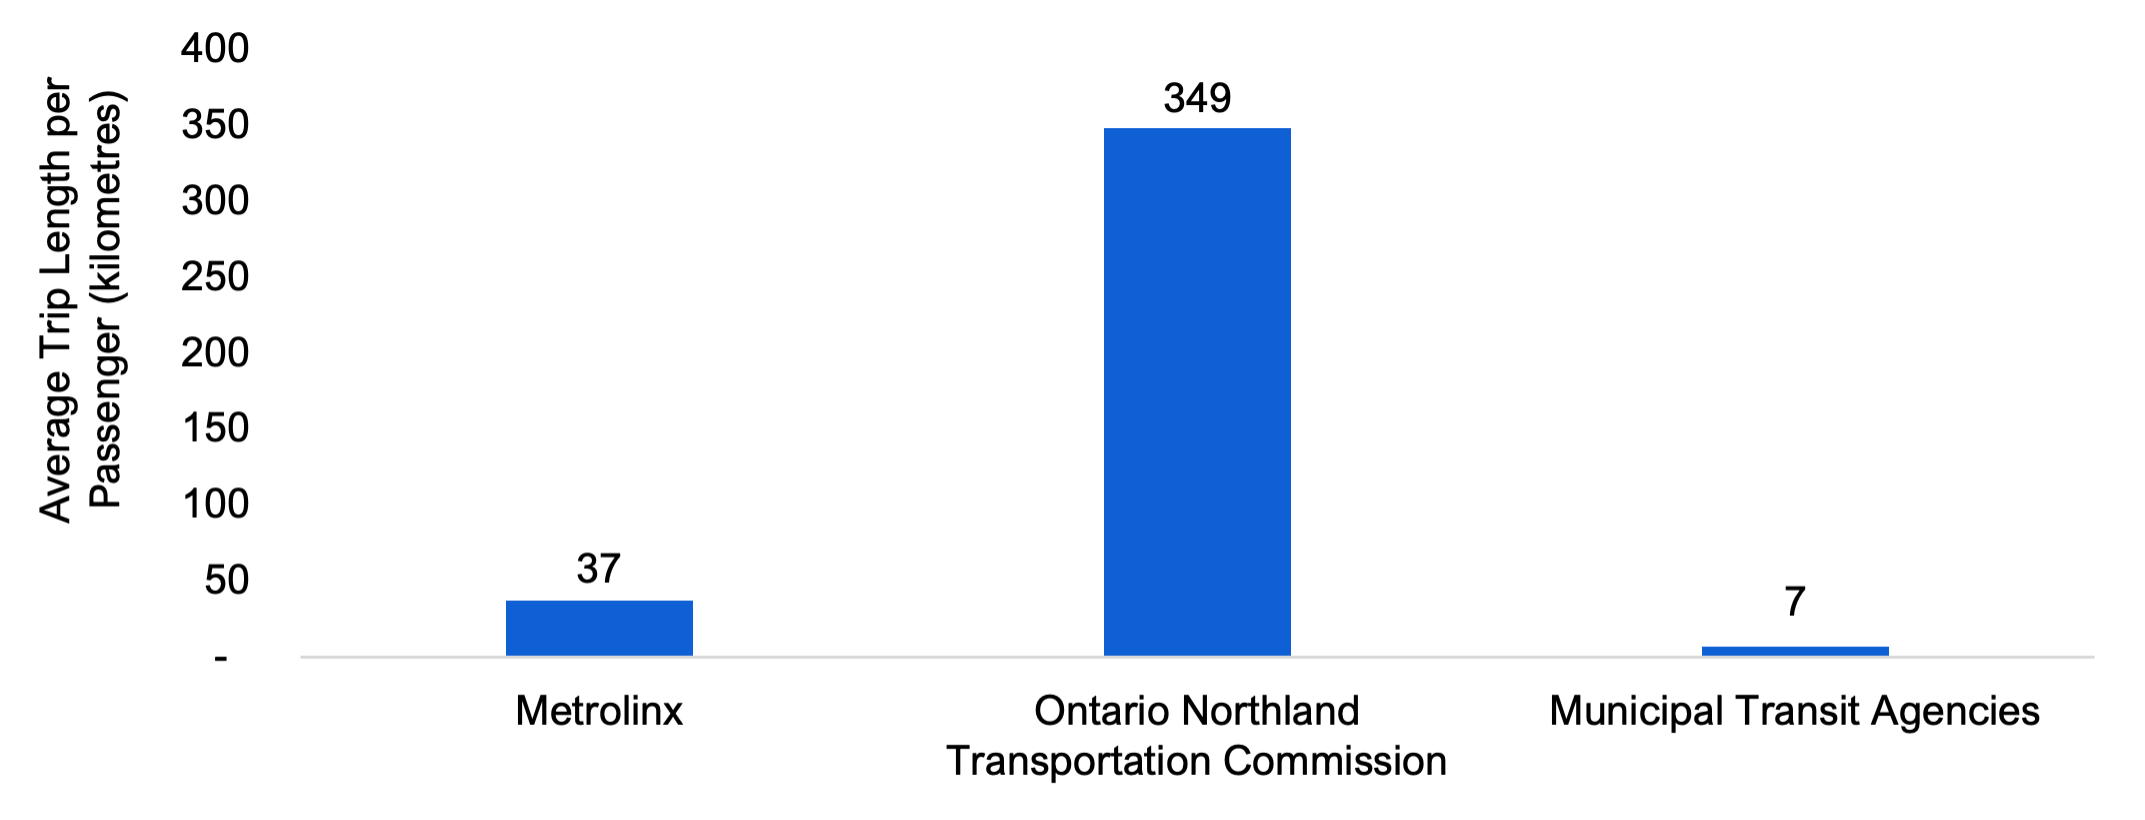
A difference in the scale of municipal and provincial transit agencies’ operations can be observed by comparing the average distance travelled per passenger of provincial transit agencies with that of municipal transit agencies. For Metrolinx, the average trip length was 37 kilometres for each passenger in 2022, as it serves not only urban centres but also surrounding regions. The average passenger trip length for the ONTC was 349 kilometres, reflecting the long distances typically travelled by passengers in Northern Ontario across remote communities as well as to urban centres. By contrast, the average passenger trip length for municipal transit agencies was approximately seven kilometres in 2022.[13] These differences in average trip length contribute to higher per-trip revenues and costs for provincial transit agencies compared to municipal transit agencies, as discussed in Chapter 4.
Figure 3.2 Average trip length per passenger of municipal and provincial transit agencies in Ontario, 2022, kilometres
Source: Canadian Urban Transit Association, Ontario Urban Transit Fact Book 2022 Operating Data, No. RTS 22-20, February 2024; and FAO analysis of information provided by the Province
Accessible version
| Metrolinx | Ontario Northland Transportation Commission | Municipal Transit Agencies | |
|---|---|---|---|
| Average Trip Length per Passenger (kilometres) | 37 | 349 | 7 |
Impact of the COVID-19 Pandemic on Ridership
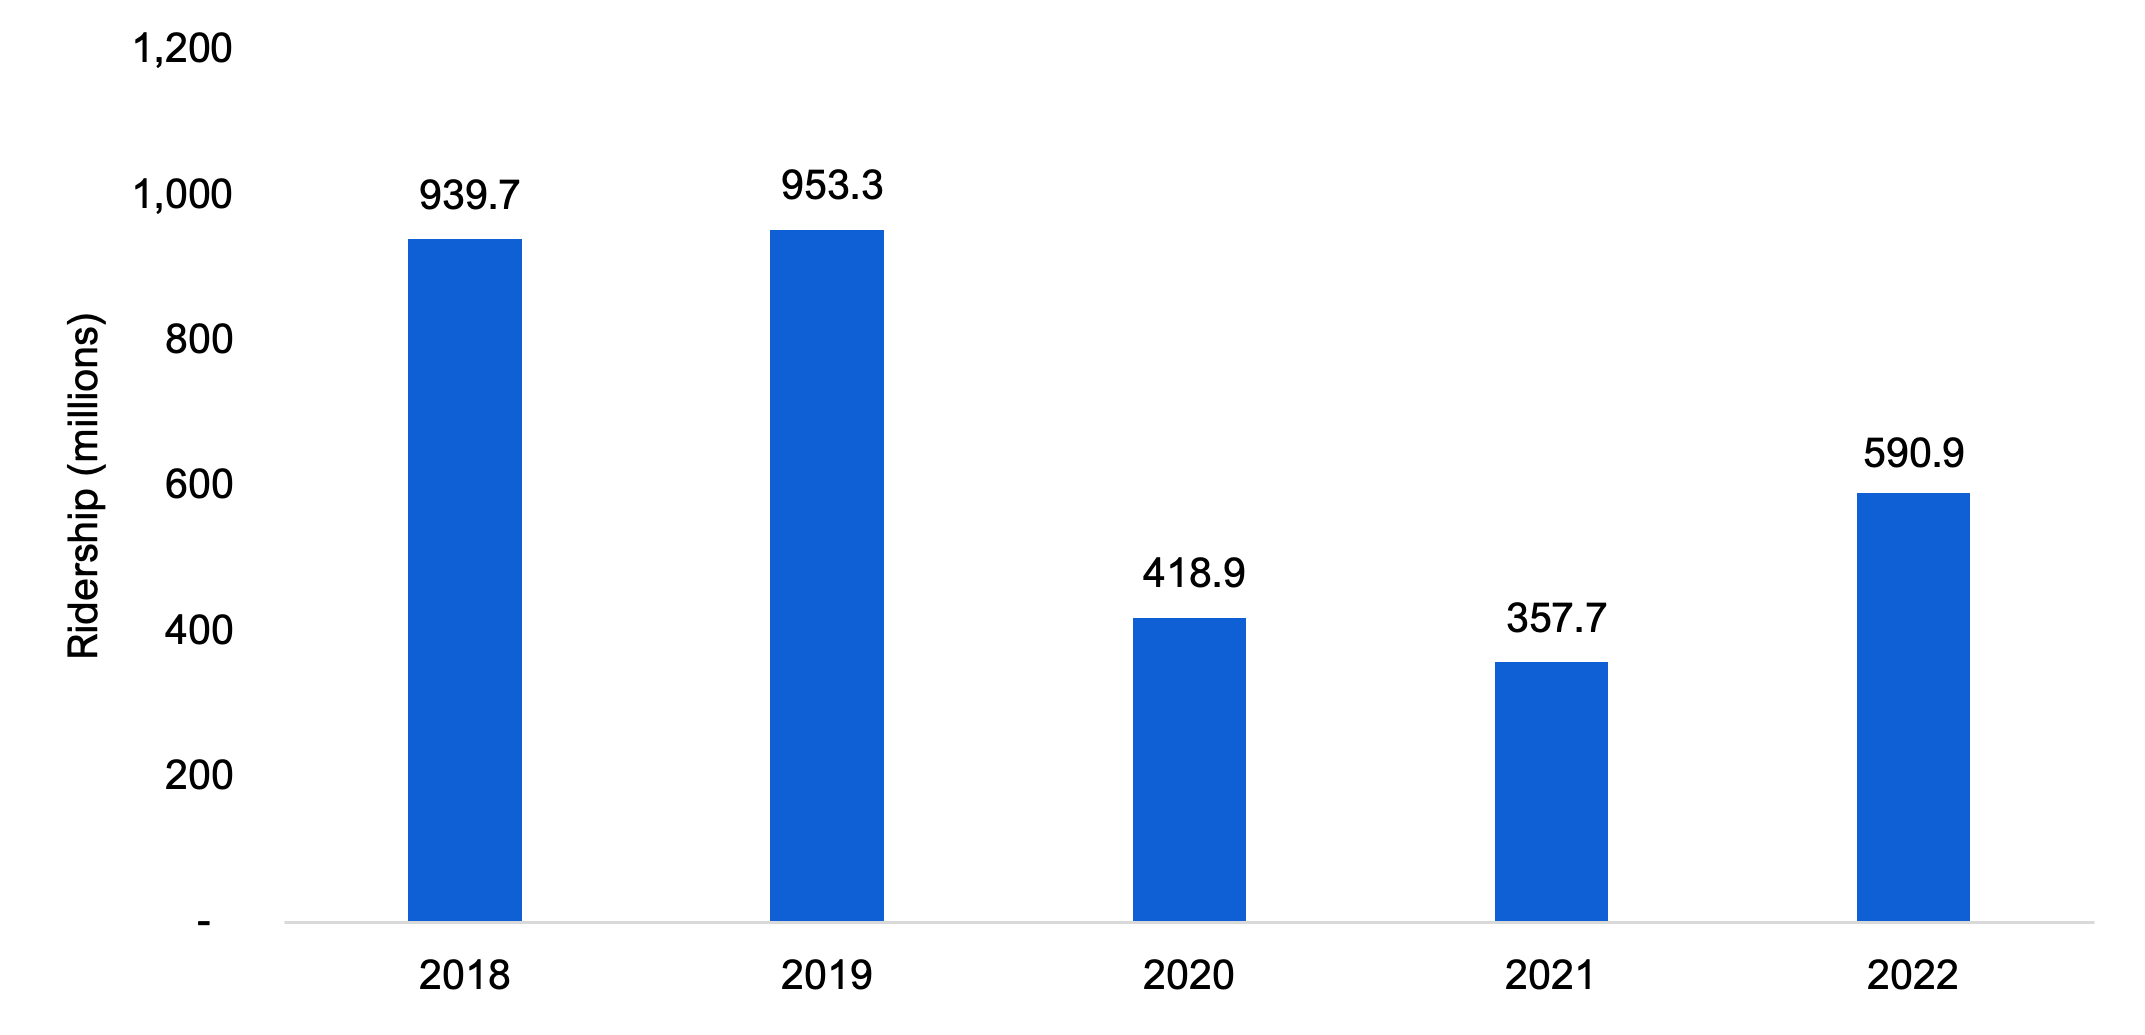
Prior to the COVID-19 pandemic, total ridership of municipal and provincial transit agencies in Ontario was 939.7 million in 2018 and 953.3 million in 2019. In 2020 and 2021, public transit ridership in Ontario significantly declined due to the COVID-19 pandemic and subsequent public health measures implemented by the Province.[14] In 2020, ridership declined to 418.9 million trips and further to 357.7 million trips in 2021, representing 37.5 per cent of the 2019 pre-pandemic level.
In 2022, total ridership partially rebounded to 590.9 million trips, or 62.0 per cent of the 2019 pre-pandemic level. The FAO expects that total ridership further recovered in 2023, in line with trends in ridership across Canada;[15] however, complete 2023 agency ridership data was unavailable as of the writing of this report.
Figure 3.3 Total ridership of municipal and provincial transit agencies in Ontario, 2018 to 2022, millions
Note: Ridership is defined as a linked trip, riding one way from origin to final destination.
Source: Canadian Urban Transit Association, Ontario Urban Transit Fact Book 2022 Operating Data, No. RTS 22-20, February 2024; Ontario Northland, Annual Reports from 2017-18 to 2022-23; and FAO analysis of information provided by the Province
Accessible version
| 2018 | 2019 | 2020 | 2021 | 2022 | |
|---|---|---|---|---|---|
| Ridership (millions) | 939.7 | 953.3 | 418.9 | 357.7 | 590.9 |
The impact of the COVID-19 pandemic on ridership was not evenly distributed across transit agencies. The TTC experienced the most significant absolute ridership loss and a below average recovery. Between 2019 and 2021, TTC ridership decreased from 529.6 million annual trips to 199.4 million annual trips, a decline of 330.2 million trips, or 62.4 per cent. In 2022, TTC ridership recovered to 321.0 million trips, which is 60.6 per cent of 2019 levels.
Similarly, OC Transpo ridership declined by 66.3 million trips between 2019 and 2021, representing a 67.4 per cent decline. In 2022, OC Transpo’s ridership recovered to 50.8 million, or 51.7 per cent of 2019 levels. Both the TTC and OC Transpo were heavily utilized by commuters prior to the COVID-19 pandemic and were significantly impacted by a prominent shift to remote and hybrid work models.[16]
Among the larger provincial and municipal transit agencies, Metrolinx experienced the largest per cent decrease in its ridership between 2019 and 2021, with an 82.8 per cent reduction in ridership, from 76.3 million trips in 2019 to 13.1 million trips in 2021. Metrolinx’s ridership increased to 34.6 million trips in 2022 but remained at 45.4 per cent of its 2019 pre-pandemic level. Metrolinx operates GO Transit, which primarily serves commuters travelling within the GGH region. The widespread shift to remote and hybrid work models significantly impacted ridership as a large portion of GO Transit's pre-pandemic customer base stopped commuting daily.[17]
In comparison, suburban transit agencies generally saw less severe ridership declines, and stronger recoveries. For example, in 2022, ridership for MiWay and Brampton Transit recovered to 86.6 per cent and 98.1 per cent of 2019 levels, respectively. This can be attributed to several factors such as a lower incidence of remote work[18] and faster population growth in some areas.
| Transit Agencies | 2019 | 2020 | 2021 | 2022 | 2022 Ridership as a Share of 2019 Ridership (%) |
|---|---|---|---|---|---|
| Municipal Transit Agencies | |||||
| Toronto Transit Commission (TTC) | 529.6 | 226.7 | 199.4 | 321.0 | 60.6 |
| OC Transpo | 98.4 | 40.9 | 32.1 | 50.8 | 51.7 |
| MiWay | 41.2 | 21.9 | 22.6 | 35.7 | 86.6 |
| Brampton Transit | 31.9 | 18.1 | 19.4 | 31.3 | 98.1 |
| Grand River Transit (GRT) | 22.3 | 11.5 | 9.9 | 18.0 | 80.5 |
| York Region Transit (YRT) | 23.0 | 10.7 | 10.1 | 16.3 | 70.8 |
| Hamilton Street Railway (HSR) | 22.6 | 12.2 | 10.3 | 15.8 | 69.8 |
| London Transit Commission (LTC) | 24.9 | 12.8 | 8.4 | 13.6 | 54.5 |
| Durham Region Transit (DRT) | 11.3 | 5.4 | 4.4 | 7.4 | 66.0 |
| Transit Windsor | 8.5 | 3.6 | 2.5 | 5.3 | 62.3 |
| All Other Municipal Agencies | 63.0 | 30.8 | 25.2 | 40.8 | 64.8 |
| Provincial Transit Agencies | |||||
| Metrolinx | 76.3 | 24.2 | 13.1 | 34.6 | 45.4 |
| Ontario Northland Transportation Commission (ONTC) | 0.4 | 0.2 | 0.2 | 0.3 | 83.2 |
| Ontario Total | 953.3 | 418.9 | 357.7 | 590.9 | 62.0 |
4. Transit Agencies’ Finances
Overview
Municipal and provincial transit agencies fund their operating expenses through a combination of own-source revenues, largely generated from passenger fares charged to riders, and operating subsidies provided by governments.
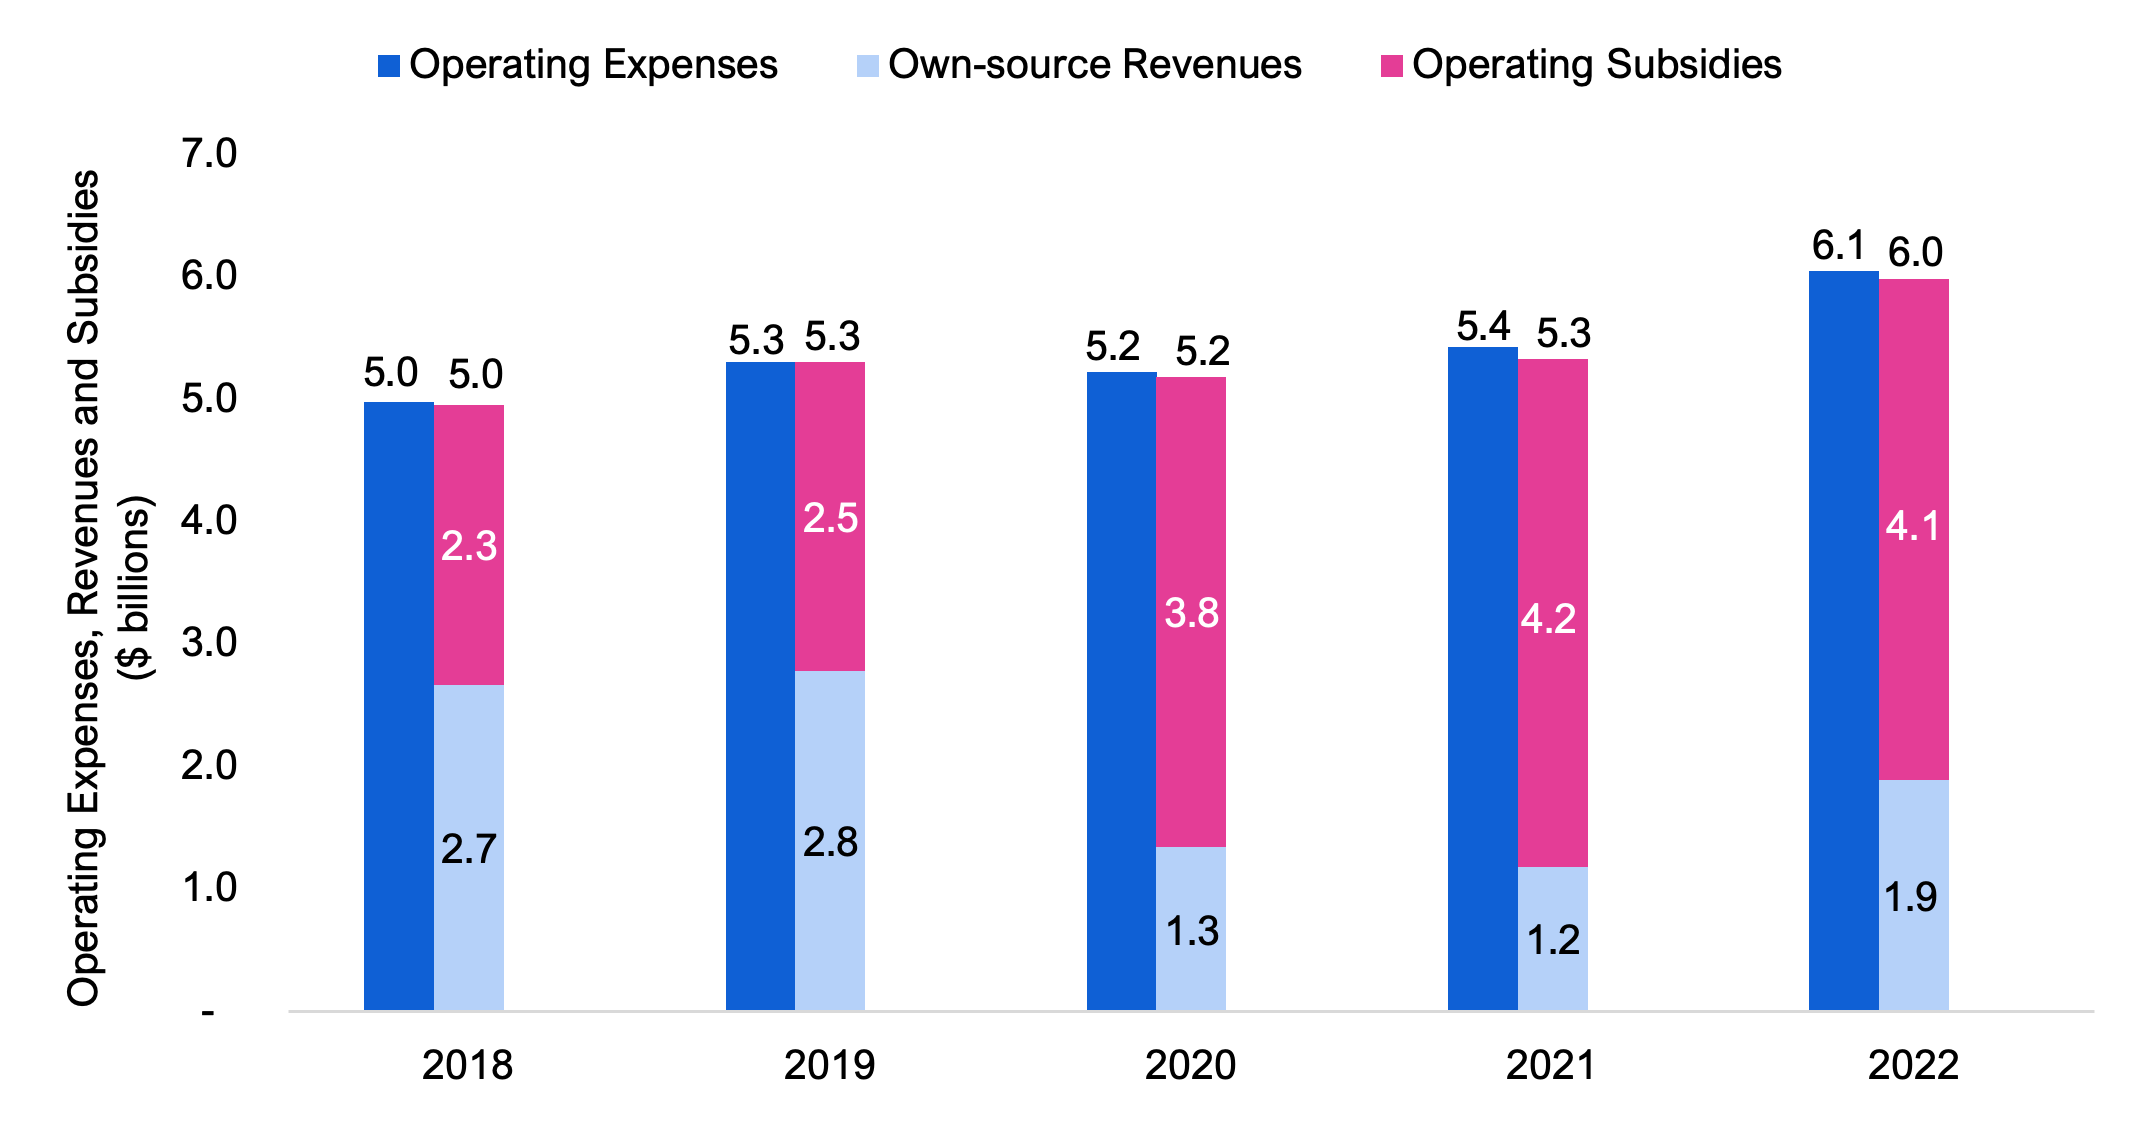
In 2022, the 108 municipal and provincial transit agencies recorded $6.1 billion in operating expenses. In the same year, these agencies recorded total operating revenues of $6.0 billion, which consisted of $1.9 billion in own-source revenues and $4.1 billion in government operating subsidies, accounting for 31.6 per cent and 68.4 per cent of revenues, respectively.
These shares have shifted significantly since 2019 due to the impact of the COVID-19 pandemic. Prior to the pandemic, transit agencies were less reliant on government subsidies to fund their operations, with own-source revenues accounting for 52.5 per cent of total operating revenues in 2019 and subsidies accounting for 47.5 per cent.
Figure 4.1 Total operating expenses, revenues and subsidies of municipal and provincial transit agencies in Ontario, 2018 to 2022, $ billions
Source: Canadian Urban Transit Association, Ontario Urban Transit Fact Book 2022 Operating Data, No. RTS 22-20, February 2024; Ontario Northland, Annual Reports from 2017-18 to 2022-23; and FAO analysis of information provided by the Province.
Accessible version
| 2018 | 2019 | 2020 | 2021 | 2022 | |
|---|---|---|---|---|---|
| Operating Expenses (billions) | 5.0 | 5.3 | 5.2 | 5.4 | 6.1 |
| Own-source Revenues (billions) | 2.7 | 2.8 | 1.3 | 1.2 | 1.9 |
| Operating Subsidies (billions) | 2.3 | 2.5 | 3.8 | 4.2 | 4.1 |
| Operating Revenues | 5.0 | 6.3 | 5.2 | 5.3 | 6.0 |
Operating Expenses
In 2022, municipal and provincial transit agencies recorded $6.1 billion in operating expenses.[19] The largest spending category was transportation operations at $2.6 billion, or 42.8 per cent of total operating expenses. This was followed by vehicle and facility maintenance ($1.7 billion, 28.2 per cent), general and administration ($1.0 billion, 17.0 per cent), fuel and energy ($496 million, 8.2 per cent) and other expenses ($237 million, 3.9 per cent).[20]
| Expense
Category |
Description | Spending ($ millions) | Share of Total (%) |
|---|---|---|---|
| Transportation Operations | Salaries, wages and benefits for operators, inspectors, other operations staff, as well as spending on uniforms, vehicle licences and registration, fleet insurance premiums and purchased services, net of recoveries or rebates. | 2,588 | 42.8 |
| Vehicle and Facility Maintenance | Salaries, wages and benefits for mechanics, forepersons, servicepersons, security, maintenance and other staff, as well as spending on utilities, parts, materials and supplies, and other expenses. | 1,705 | 28.2 |
| General and Administration | Salaries, wages and benefits for marketing, human resources, finance and other administrative staff, as well as spending on advertising, office supplies and other expenses. | 1,027 | 17.0 |
| Fuel and Energy | Gasoline, diesel, propane, natural gas and electric power for revenue vehicles. | 496 | 8.2 |
| Other Expenses | Inter-city charters, cross-boundary services, rental and lease charges, debt service charges and other expenses. | 237 | 3.9 |
| Total Spending | 6,052 | 100.0 |
The total operating expenses for Ontario’s transit agencies increased at an average annual rate of 5.0 per cent, from $5.0 billion in 2018 to $6.1 billion in 2022. By expense category, fuel and energy expenses and other expenses increased the fastest, at an average annual rate of 6.3 per cent between 2018 and 2022. This was followed by vehicle and facility maintenance expenses growing at 5.8 per cent on average per year, general and administration expenses at 5.3 per cent, and transportation operations expenses at 4.0 per cent.
While operating expenses increased between 2018 and 2022, agencies’ overall service levels decreased over the same period. Between 2018 and 2021, the distance travelled by public transit vehicles[21] decreased from 593 million kilometres in 2018 to 509 million kilometres in 2021. In 2022, distance travelled increased to 528 million kilometres but remained lower than pre-pandemic levels. Overall, distance travelled by public transit vehicles decreased at an average annual rate of 2.9 per cent from 2018 to 2022.
Figure 4.2 Total operating expenses and distance travelled by public transit vehicles in Ontario, 2018 to 2022, $ millions and million kilometres
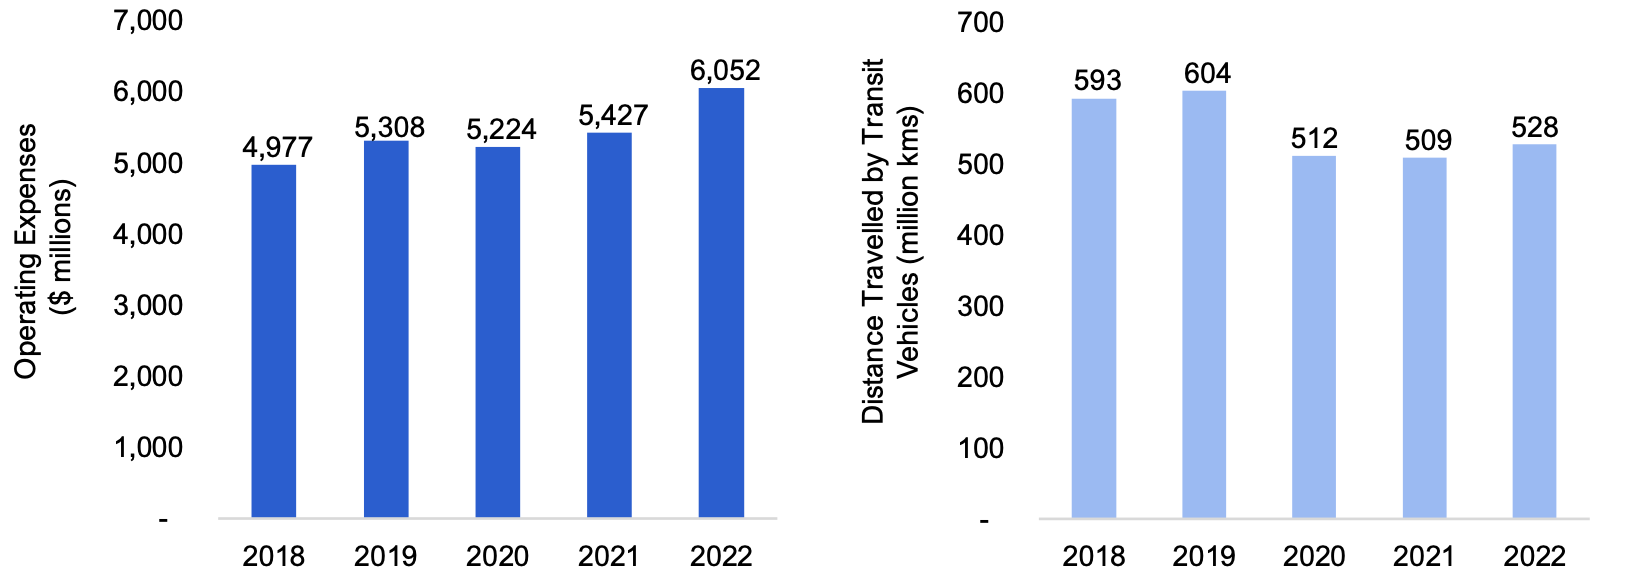
Note: Distance travelled is represented by revenue vehicle kilometres, which refers to the number of kilometres travelled by vehicles providing regular passenger services. It excludes vehicle kilometres related to other services (such as school contracts and charters) as well as training, tests and maintenance. Distance travelled reflects municipal transit agencies and Metrolinx’s GO Transit but excludes the ONTC and Metrolinx’s UP Express.
Source: Canadian Urban Transit Association, Ontario Urban Transit Fact Book 2022 Operating Data, No. RTS 22-20, February 2024; Ontario Northland, Annual Reports from 2017-18 to 2022-23; and FAO analysis of information provided by the Province.
Accessible version
| 2018 | 2019 | 2020 | 2021 | 2022 | |
|---|---|---|---|---|---|
| Operating Expenses ($ millions) | 4,977 | 5,308 | 5,224 | 5,427 | 6,052 |
| Distance Travelled by Transit Vehicles (million kms) | 593 | 604 | 512 | 509 | 528 |
Operating Revenues
In 2022, municipal and provincial transit agencies recorded total operating revenues of $6.0 billion, of which $1.9 billion was from own-source revenues and $4.1 billion was from government operating subsidies.[22]
Own-source Revenues
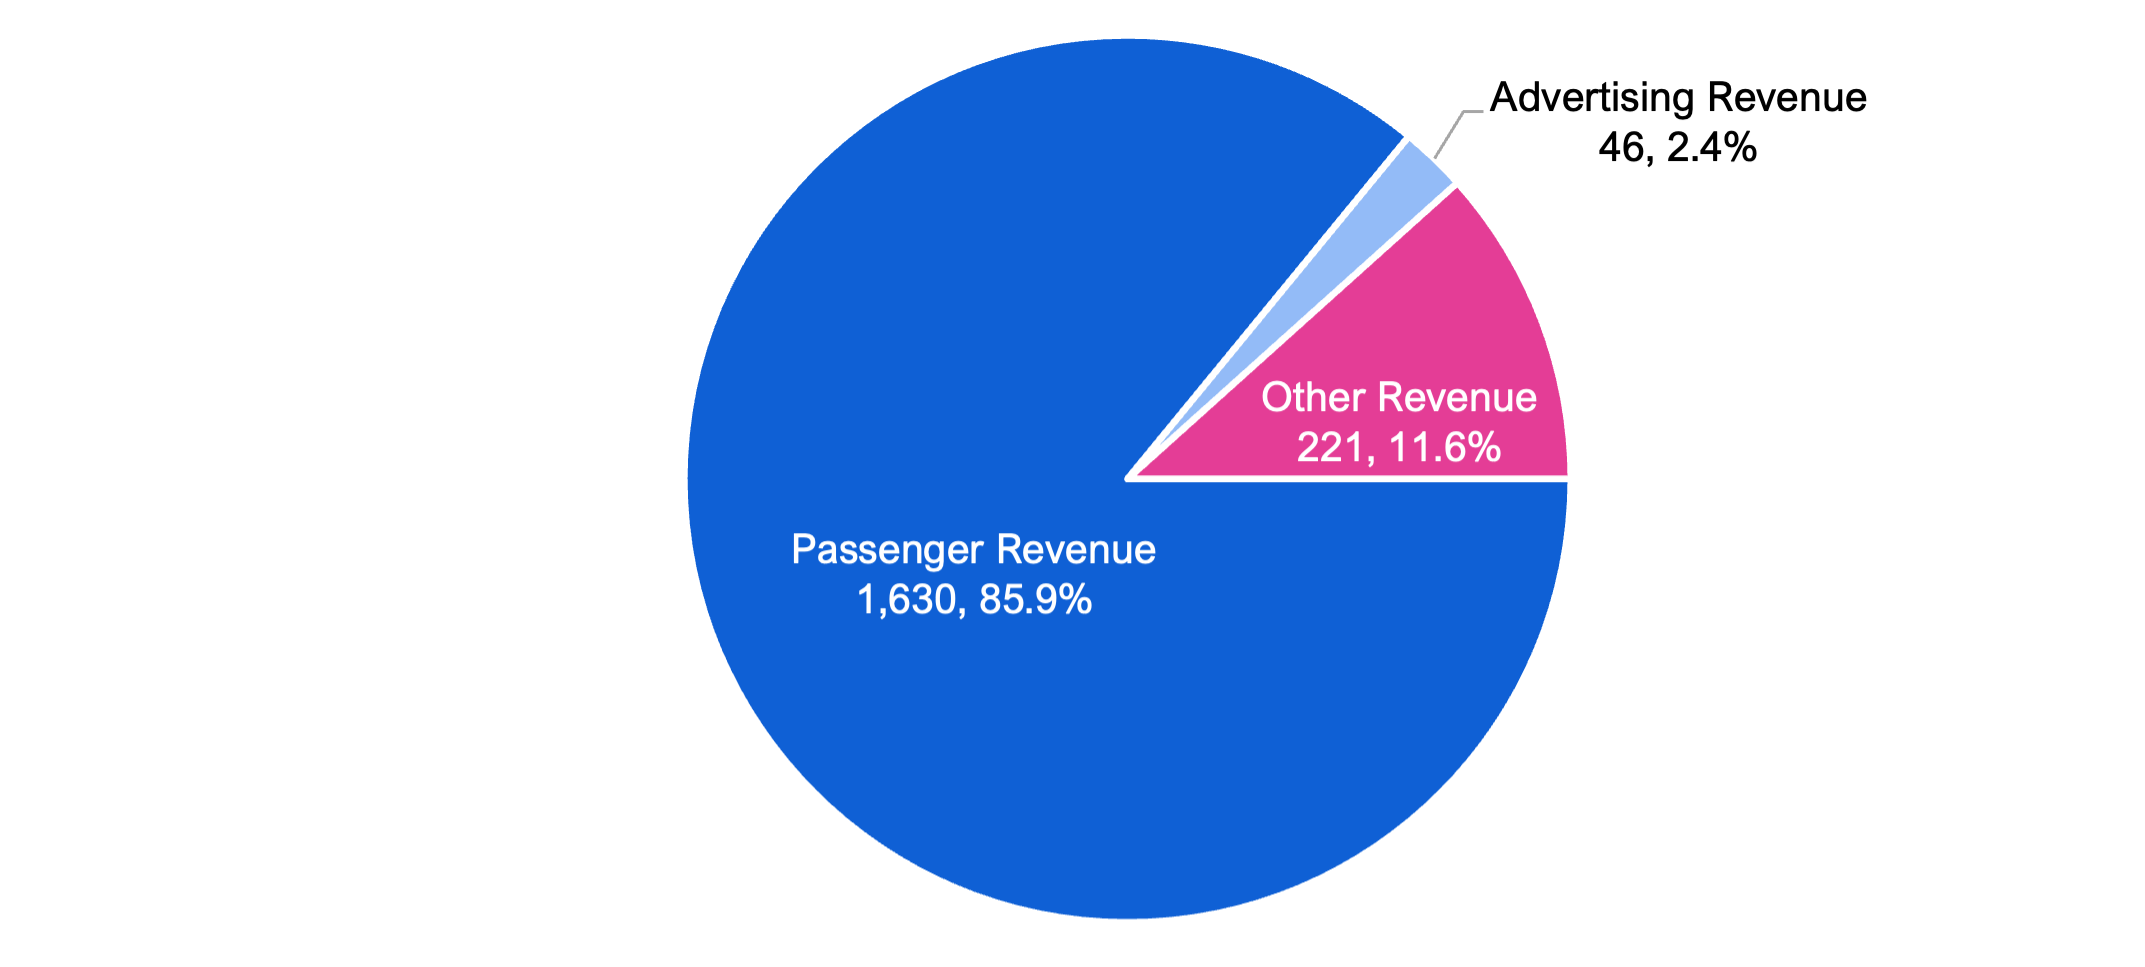
Own-source revenues refer to revenues that are generated by transit agencies, rather than subsidies provided by the government. Most own-source revenues are generated from passenger fares, which accounted for $1.6 billion, or 85.9 per cent of all own-source revenues in 2022. This was followed by $221 million in other revenue sources[23] (11.6 per cent) and $46 million in advertising revenues (2.4 per cent).
Figure 4.3 Own-source revenues of municipal and provincial transit agencies in Ontario, by source, 2022, $ millions and per cent
Source: Canadian Urban Transit Association, Ontario Urban Transit Fact Book 2022 Operating Data, No. RTS 22-20, February 2024; Ontario Northland, Annual Report 2022-23 and FAO analysis of information provided by the Province
Accessible version
| Own-source Revenues ($ million) | Share of Total Own-source Revenues (%) | |
|---|---|---|
| Passenger Revenue | 1,630 | 85.9 |
| Advertising Revenue | 46 | 2.4 |
| Other Revenue | 221 | 11.6 |
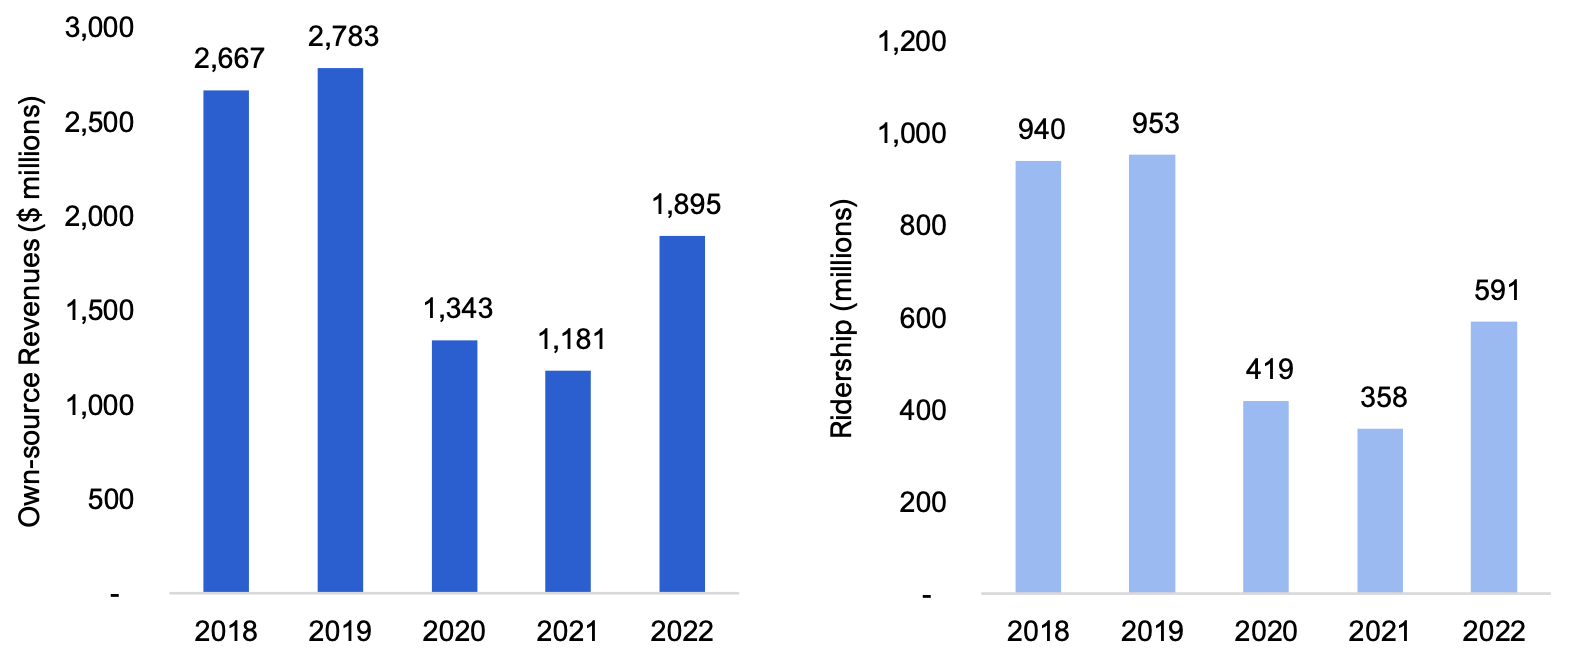
The $1.9 billion in own-source revenues in 2022 was significantly lower than historical levels due to the impact of the COVID-19 pandemic on ridership and passenger fare revenues. Between 2019 and 2021, transit agencies’ own-source revenues decreased from $2.8 billion to $1.2 billion, a decline of 57.6 per cent. In 2022, own-source revenues recovered to $1.9 billion, or 68.1 per cent of the 2019 pre-pandemic peak. This change was driven by ridership, which decreased from 953 million passenger trips in 2019 to 358 million trips in 2021, a decline of 62.5 per cent. In 2022, ridership recovered to 591 million trips, or 62.0 per cent of the 2019 pre-pandemic peak.
Figure 4.4 Total own-source revenues and ridership of municipal and provincial transit agencies in Ontario, 2018 to 2022, $ millions and millions of trips
Source: Canadian Urban Transit Association, Ontario Urban Transit Fact Book 2022 Operating Data, No. RTS 22-20, February 2024; Ontario Northland, Annual Reports from 2017-18 to 2022-23; and FAO analysis of information provided by the Province
Accessible version
| 2018 | 2019 | 2020 | 2021 | 2022 | |
|---|---|---|---|---|---|
| Own-source Revenues ($ millions) | 2,667 | 2,783 | 1,343 | 1,181 | 1,895 |
| Ridership (millions) | 940 | 953 | 419 | 358 | 591 |
Operating Subsidies
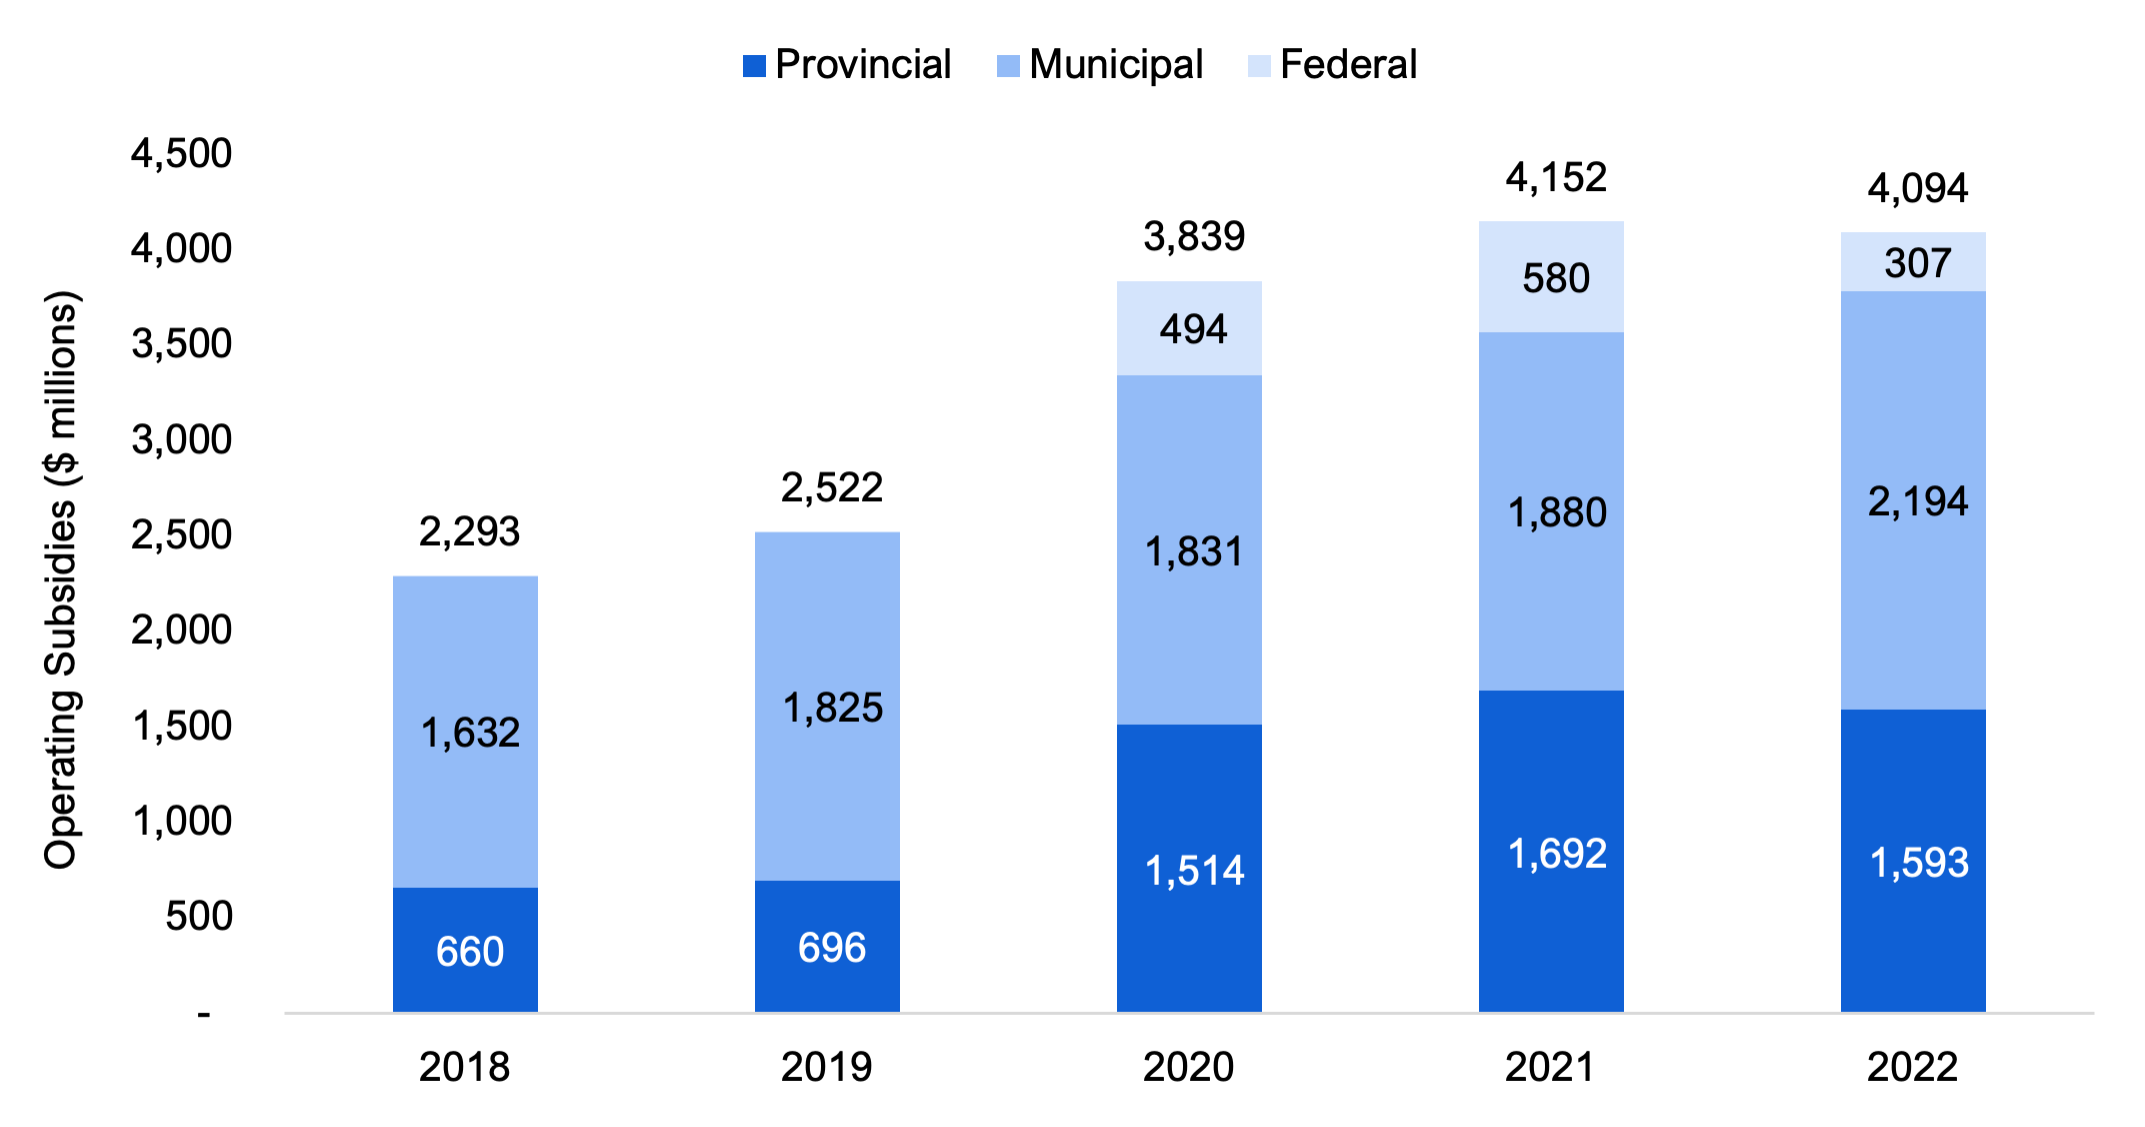
Public transit agencies in Ontario rely on operating subsidies from municipal, provincial and federal governments to cover the gap between their operating expenses and own-source revenues. Prior to the COVID-19 pandemic, transit agencies recorded total operating subsidy revenues of $2.3 billion and $2.5 billion in 2018 and 2019, respectively. In 2019, the Province contributed approximately 27.6 per cent of the total operating subsidies and municipalities financed the remaining 72.4 per cent. The federal government did not contribute materially to transit agency operations prior to the pandemic.
The COVID-19 pandemic severely reduced ridership, leading to significant increases in government subsidies to transit agencies in order to offset declines in passenger revenue. As a result, in 2021 and 2022, total subsidy revenues increased to $4.2 billion and $4.1 billion, respectively. This was driven by time-limited support through the federal-provincial Safe Restart Agreement (SRA), an increase in provincial support through Metrolinx’s and ONTC’s operating subsidy, and higher municipal funding to the municipal transit agencies. In 2022, the $4.1 billion in government operating subsidies were funded by the Province (38.9 per cent), municipalities (53.6 per cent) and the federal government (7.5 per cent).
Figure 4.5 Operating subsidy revenues of municipal and provincial transit agencies in Ontario, by source, $ millions
Source: FAO estimates based on information from Canadian Urban Transit Association, Ontario Urban Transit Fact Book 2022 Operating Data, No. RTS 22-20, February 2024; Ontario Northland, Annual reports from 2017-18 to 2022-23; Government of Ontario, 2018-2022 Financial Information Returns; and the Province
Accessible version
| Operating Subsidies ($ millions) | |||||
|---|---|---|---|---|---|
| 2018 | 2019 | 2020 | 2021 | 2022 | |
| Provincial | 660 | 696 | 1,514 | 1,692 | 1,593 |
| Municipal | 1,632 | 1,825 | 1,831 | 1,880 | 2,194 |
| Federal | 1 | - | 494 | 580 | 307 |
| Total | 2,293 | 2,522 | 3,839 | 4,152 | 4,094 |
Comparing Municipal and Provincial Transit Agencies
On aggregate, the financial scale of municipal transit agencies substantially exceeds that of provincial agencies. In 2022, municipal transit agencies generated a combined $1.4 billion in own-source revenues, recorded $3.1 billion in operating subsidies and incurred $4.5 billion in operating expenses. By contrast, provincial transit agencies generated $0.5 billion in own-source revenues, recorded $1.0 billion in operating subsidies and incurred $1.6 billion in operating expenses.
| Level of Government | Own-source Revenues ($ millions) |
Operating Subsidies ($ millions) |
Operating Expenses ($ millions) |
Own-source Revenues per Trip ($) | Operating Subsidies per Trip ($) | Operating Expenses per Trip ($) |
|---|---|---|---|---|---|---|
| Municipal | 1,394 | 3,054 | 4,455 | 2.51 | 5.49 | 8.01 |
| Provincial | 502 | 1,039 | 1,597 | 14.36 | 29.77 | 45.73 |
| Ontario Total | 1,895 | 4,094 | 6,052 | 3.21 | 6.93 | 10.24 |
However, on a per-passenger trip basis, the average own-source revenues, operating subsidies and operating expenses recorded by provincial agencies were significantly higher than those of municipal agencies. For municipal transit agencies, average own-source revenues were $2.51 per trip, subsidies were $5.49 per trip and expenses were $8.01 per trip. By comparison, provincial transit agencies recorded $14.36 in own-source revenues per trip, $29.77 in operating subsidies per trip and $45.73 in operating expenses per trip.[24]
Provincial transit agencies incur higher costs per trip than municipal agencies, largely due to the greater geographical areas they cover and their greater use of larger, capital-intensive modes of transportation, such as regional trains, as discussed in Chapter 3. In addition, the ONTC’s mandate includes freight transportation, and remanufacturing and repair services for rail equipment.[25]
Financial Analysis by Transit Agency
Among Ontario’s 106 municipal transit agencies, the Toronto Transit Commission (TTC), the largest transit agency by ridership, recorded own-source revenues of $795 million, subsidies of $1,421 million and operating expenses of $2,216 million in 2022. The second largest agency was OC Transpo in Ottawa, with own-source revenues, subsidies and operating expenses of $114 million, $487 million and $601 million, respectively. This was followed by MiWay, Brampton Transit, Grand River Transit, York Region Transit, Hamilton Street Railway, London Transit Commission, Durham Region Transit and Transit Windsor. Combined, the 10 largest municipal transit agencies recorded $1,282 million in own-source revenues, $2,728 million in operating subsidies and $4,013 million in operating expenses in 2022. Outside of the 10 largest municipal transit agencies, other municipal transit agencies collectively accounted for $111 million in own-source revenues, $327 million in operating subsidies and $442 million in operating expenses in 2022.
Of the two provincial transit agencies in Ontario, Metrolinx recorded $413 million in own-source revenues, $988 million in subsidies and $1,470 million in operating expenses in 2022. The ONTC recorded $89 million own-source revenues, $52 million in subsidies and $127 million in operating expenses.
| Transit Agencies | Own-source Revenues ($ millions) |
Operating Subsidies ($ millions) |
Operating Expenses ($ millions) |
Own-source Revenues as Share of Expenses (%) | Operating Subsidies as Share of Expenses (%) |
|---|---|---|---|---|---|
| Municipal Transit Agencies | |||||
| Toronto Transit Commission (TTC) | 795 | 1,421 | 2,216 | 35.9 | 64.1 |
| OC Transpo | 114 | 487 | 601 | 19.0 | 81.0 |
| MiWay | 78 | 137 | 215 | 36.2 | 63.8 |
| Brampton Transit | 81 | 109 | 190 | 42.8 | 57.2 |
| Grand River Transit (GRT) | 43 | 137 | 180 | 24.0 | 76.0 |
| York Region Transit (YRT) | 64 | 157 | 221 | 29.1 | 70.9 |
| Hamilton Street Railway (HSR) | 38 | 109 | 147 | 26.0 | 74.6 |
| London Transit Commission (LTC) | 34 | 56 | 90 | 38.1 | 61.9 |
| Durham Region Transit (DRT) | 24 | 88 | 111 | 21.1 | 78.9 |
| Transit Windsor | 10 | 26 | 41 | 25.2 | 63.8 |
| All Other Municipal Agencies | 111 | 327 | 442 | 25.2 | 73.9 |
| Provincial Transit Agencies | |||||
| Metrolinx | 413 | 988 | 1,470 | 28.1 | 67.2 |
| Ontario Northland Transportation Commission (ONTC) | 89 | 52 | 127 | 69.9 | 40.5 |
| Ontario Total | 1,895 | 4,094 | 6,052 | 31.3 | 67.6 |
Given the large differences in the size of transit agencies, analyzing own-source revenues and subsidies as a share of operating expenses provides insight into transit agencies’ relative dependency on government subsidies to support their operations. Overall, in 2022, almost one-third of Ontario transit agencies’ operating expenses were funded by own-source revenues while the remaining two-thirds were supported by government subsidies.[26] The TTC was near the average, with 35.9 per cent of its operating expenses funded through own-source revenues and the remaining 64.1 per cent of operating expenses supported by government subsidies. OC Transpo funded 19.0 per cent of its operating expenses by own-source revenues, with 81.0 per cent supported by government subsidies. The remaining larger municipal agencies funded between 21.1 per cent and 42.8 per cent of their expenses from own-source revenues.
For Metrolinx, approximately 28.1 per cent of its operating expenses were funded by own-source revenues, with 67.2 per cent of its operating expenses supported by subsidies. For the ONTC, own-source revenues supported 69.9 per cent of its operating expenses and subsidies supported 40.5 per cent.[27]
5. Provincial Transit Operating Subsidies
Overview
The Province provides operating subsidies to provincial and municipal transit agencies through direct subsidies to provincial transit agencies, ongoing funding to municipalities and time-limited programs. The subsidy programs include Metrolinx’s base operating subsidy, the fare integration programs, the Ontario Gas Tax program, the now-expired Safe Restart Agreement (SRA), the Ontario-Toronto New Deal Agreement, operating subsidies for the Ontario Northland Transportation Commission (ONTC) and other subsidies.
| Subsidy | Actual | FAO Projection | |||||||||
|---|---|---|---|---|---|---|---|---|---|---|---|
| 2018-19 | 2019-20 | 2020-21 | 2021-22 | 2022-23 | 2023-24 | 2024-25 | 2025-26 | 2026-27 | 2027-28 | 2028-29 | |
| Metrolinx Base Operating Subsidy | 363 | 381 | 959 | 942 | 986 | 1,071 | 1,099 | 1,126 | 1,183 | 1,226 | 1,269 |
| Fare Integration Programs | 37 | 40 | 2 | 4 | 15 | 32 | 144 | 152 | 25 | 26 | 27 |
| Ontario Gas Tax Program | 364 | 365 | 375 | 376 | 378 | 377 | 370 | 375 | 380 | 385 | 391 |
| Safe Restart Agreement | - | - | 575 | 381 | 252 | - | - | - | - | - | - |
| Ontario-Toronto New Deal Agreement | - | - | - | - | - | 300 | 110 | 110 | 110 | - | - |
| ONTC Operating Subsidy | 46 | 41 | 45 | 43 | 54 | 65 | 74 | 74 | 85 | 86 | 88 |
| Other Operating Subsidies | <1 | 6 | 6 | 19 | 7 | 5 | 9 | 5 | 5 | 5 | 5 |
| Total | 809 | 833 | 1,962 | 1,765 | 1,693 | 1,850 | 1,806 | 1,843 | 1,788 | 1,728 | 1,779 |
In 2018-19 and 2019-20, total provincial transit operating subsidies were $809 million and $833 million, respectively, before increasing to $1,962 million in 2020-21 due to the COVID-19 pandemic. The increase in funding was primarily through the Metrolinx base operating subsidy and the Safe Restart Agreement. By 2022-23, total subsidies had decreased to $1,693 million, largely due to lower Safe Restart Agreement spending in the last year of the agreement.
The FAO estimates that provincial transit operating subsidies increased from $1,693 million in 2022-23 to $1,850 million in 2023-24 due to higher Metrolinx base operating subsidy costs and the Ontario-Toronto New Deal Agreement, partially offset by the expiry of the Safe Restart Agreement. By 2028-29, the FAO estimates that total subsidies will decline to $1,779 million, as the Ontario-Toronto New Deal Agreement expires in 2026-27. However, total subsidies will remain significantly higher than pre-pandemic levels in 2018-19 and 2019-20, largely due to the Metrolinx base operating subsidy, which is projected to be $1,269 million in 2028-29, compared to $363 million in 2018-19.
Metrolinx Base Operating Subsidy
The Province provides operating subsidies to Metrolinx to support its main activities, which include operating GO Transit and UP Express, administering the PRESTO payment card system and coordinating regional transit.[28]
In 2018-19 and 2019-20, Metrolinx received base operating subsidies of $363 million and $381 million, respectively. In 2020-21, the Metrolinx base operating subsidy increased to $959 million due to the COVID-19 impact on ridership. By 2022-23, the Metrolinx base operating subsidy reached $986 million, an increase of 158.9 per cent from the $381 million subsidy received in 2019-20. This increase was due to a combination of reduced fare revenue and growth in expenses. Compared to 2019-20, in 2022-23, fare revenue declined by 46.0 per cent while operating expenses increased by 34.5 per cent.
Figure 5.1 Actual and FAO projected Metrolinx base operating subsidy, 2018-19 to 2028-29, $ millions
Source: FAO analysis of information provided by the Province
Accessible version
| Fiscal Year | Metrolinx Base Operating Subsidy ($ millions) | |
|---|---|---|
| Actual | 2018-19 | 363 |
| 2019-20 | 381 | |
| 2020-21 | 959 | |
| 2021-22 | 942 | |
| 2022-23 | 986 | |
| FAO Projection | 2023-24 | 1,071 |
| 2024-25 | 1,099 | |
| 2025-26 | 1,126 | |
| 2026-27 | 1,183 | |
| 2027-28 | 1,226 | |
| 2028-29 | 1,269 |
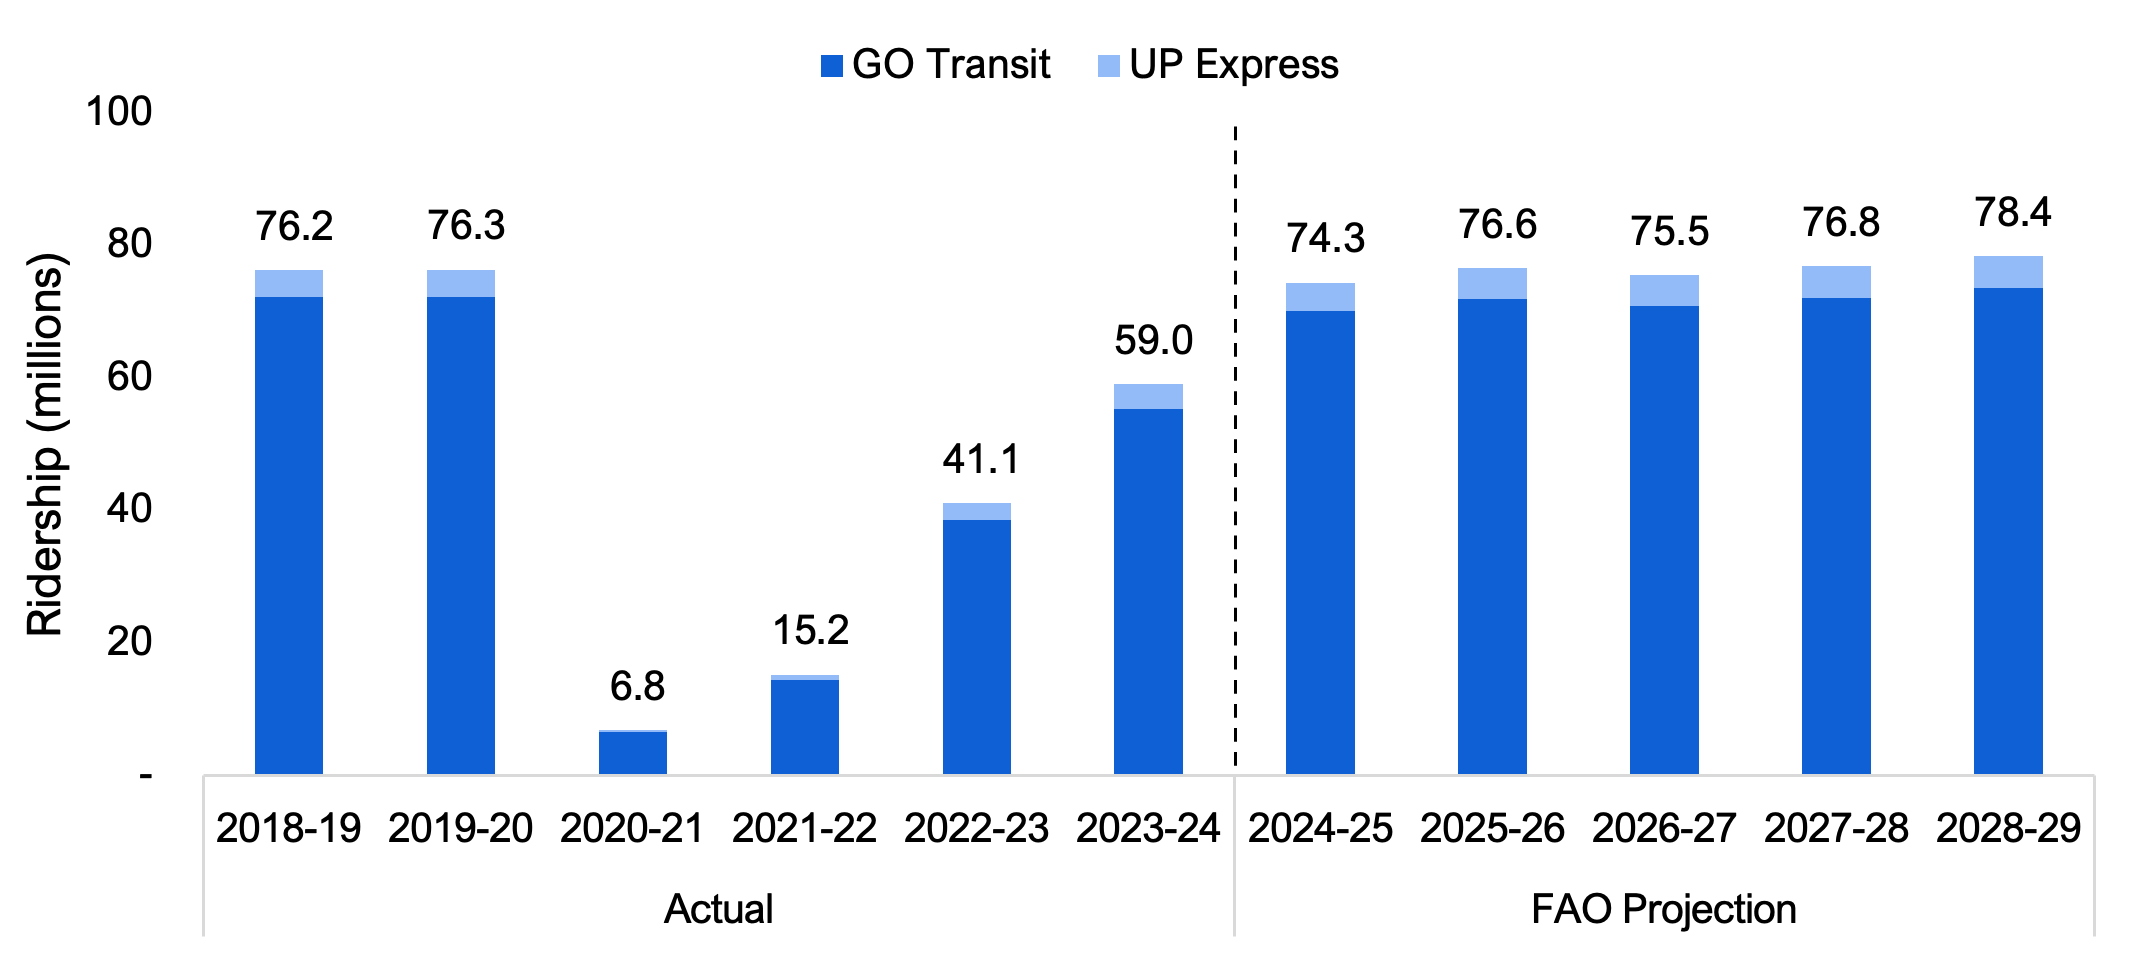
Over the forecast period, from 2023-24 to 2028-29, the FAO projects that the Metrolinx base operating subsidy will remain elevated compared to before the COVID-19 pandemic, despite a projected return to pre-pandemic ridership levels by 2025-26 (see Figure 5.2 below). Overall, the FAO projects that the Metrolinx base operating subsidy will increase from $1,071 million in 2023-24 to $1,269 million in 2028-29.
In general, the Metrolinx base operating subsidy is not expected to return to pre-pandemic levels as there has been a significant increase in Metrolinx’s expenses. As noted above, from 2019-20 to 2022-23, expenses increased by 34.5 per cent while fare revenue declined by 46.0 per cent. From 2022-23 to 2024-25, own-source revenues are projected to increase by 62.7 per cent as ridership continues to recover from the pandemic. However, expenses are projected to increase by 27.6 per cent due to increases in GO Transit service levels,[29] the expansion of Metrolinx’s operations related to the delivery and handover of new transit projects such as the Finch West LRT and Eglinton Crosstown LRT, higher wages and the impact of inflation on expenses. Consequently, the FAO projects that the Metrolinx base operating subsidy will increase by 11.4 per cent, from $986 million in 2022-23 to $1,099 million in 2024-25.
Beyond 2024-25, the Metrolinx base operating subsidy is expected to increase by an average annual rate of 3.7 per cent to 2028-29. This includes a projected increase in Metrolinx expenses of 3.3 per cent per year, while revenue is projected to grow by an average annual rate of 2.9 per cent, led by a projected growth in ridership of 1.3 per cent per year.
Figure 5.2 Actual and FAO projected Metrolinx ridership, 2018-19 to 2028-29, millions
Source: FAO analysis of information provided by the Province
Accessible version
| Fiscal Year | GO Transit Ridership | UP Express Ridership | Total Metrolinx Ridership | |
|---|---|---|---|---|
| Actual | 2018-19 | 72.2 | 4.0 | 76.2 |
| 2019-20 | 72.2 | 4.2 | 76.3 | |
| 2020-21 | 6.5 | 0.3 | 6.8 | |
| 2021-22 | 14.4 | 0.8 | 15.2 | |
| 2022-23 | 38.5 | 2.6 | 41.1 | |
| 2023-24 | 55.4 | 3.6 | 59.0 | |
| FAO Projection | 2024-25 | 70.0 | 4.3 | 74.3 |
| 2025-26 | 72.0 | 4.6 | 76.6 | |
| 2026-27 | 70.9 | 4.6 | 75.5 | |
| 2027-28 | 72.1 | 4.7 | 76.8 | |
| 2028-29 | 73.6 | 4.8 | 78.4 |
Three notable risks that could impact the FAO’s projection for Metrolinx’s base operating subsidy are lower than forecasted ridership,[30] unexpected changes to fare rates[31] and the timing of service expansions, particularly from the GO Expansion plan.[32] If the assumptions upon which the FAO’s ridership, fare revenue and expense forecast are based do not hold, then Metrolinx’s base operating subsidy will be affected.
Fare Integration Programs
The Province’s fare integration programs reduce or eliminate the second fare paid by passengers when transferring between transit agencies to reduce costs for passengers and increase ridership. In Ontario, there are three fare integration programs:
- municipally organized and funded free transfer agreements across many Greater Golden Horseshoe (GGH) region municipal transit agencies;[33]
- provincially funded fare integration between GO Transit and GGH region municipal transit agencies, excluding the Toronto Transit Commission (TTC); and
- the provincially funded One Fare program between the TTC and its neighbouring transit agencies as well as with GO Transit.[34]
Figure 5.3 Fare integration programs in the Greater Golden Horseshoe (GGH) region
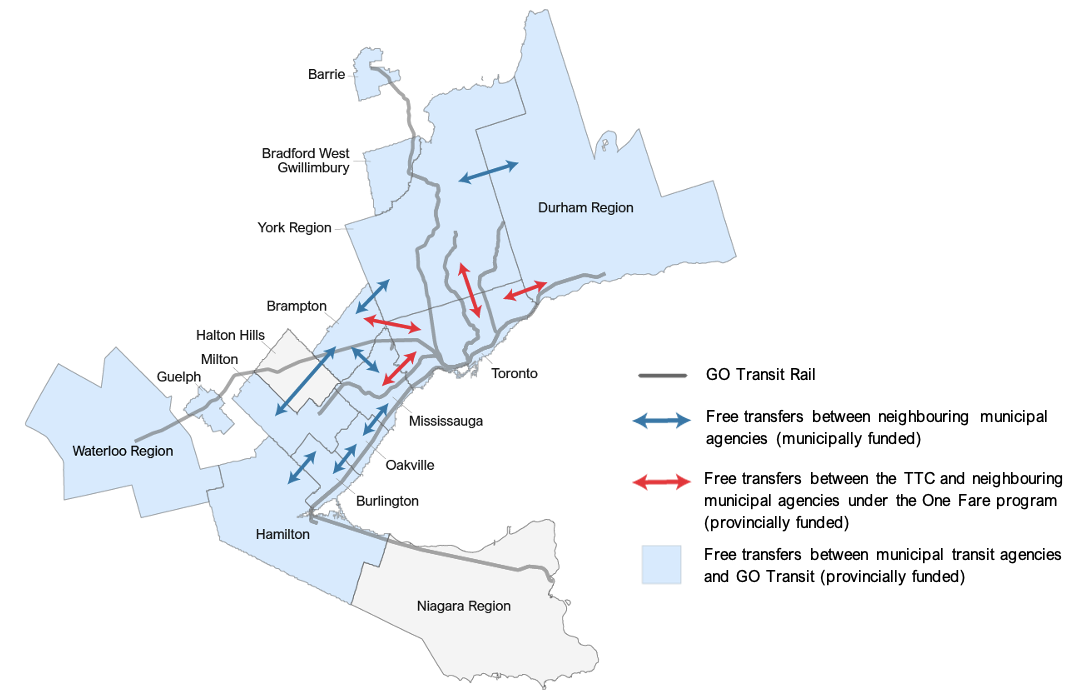
Note: For transfers between neighbouring municipal agencies, the second fare is eliminated. For transfers to and from GO Transit, the municipal fare is eliminated. Peel Region TransHelp is also a participant in the One Fare program. Greater Golden Horseshoe region includes the Greater Toronto and Hamilton Area, Brantford, Brant County, Peterborough, Niagara Region, Simcoe County, Wellington County and Waterloo Region.
Source: FAO analysis of information provided by the Province.
Accessible version
In Ontario, there are three fare integration programs:
- Municipally organized and funded free transfer agreements across many Greater Golden Horseshoe (GGH) region municipal transit agencies.
- Provincially funded fare integration between GO Transit and 12 GGH region municipal transit agencies, excluding the Toronto Transit Commission (TTC). These agencies are: Barrie Transit, Bradford-West Gwillimbury Transit, Brampton Transit, Burlington Transit, Durham Region Transit, Grand River Transit, Guelph Transit, Hamilton Street Railway, Milton Transit, MiWay, Oakville Transit and York Region Transit
- The provincially funded One Fare program between the TTC and its neighbouring transit agencies (MiWay, Brampton Transit, York Region Transit and Durham Region Transit) as well as with GO Transit.
This section discusses the two provincially funded fare integration programs: the GO Transit – GGH region fare integration program and the One Fare program.
| Actual | FAO Projection | ||||||
|---|---|---|---|---|---|---|---|
| 2022-23 | 2023-24 | 2024-25 | 2025-26 | 2026-27 | 2027-28 | 2028-29 | |
| GO Transit – GGH Region Fare Integration Program | 15 | 21 | 23 | 24 | 25 | 26 | 27 |
| One Fare Program | - | 10 | 121 | 128 | - | - | - |
| Total Fare Integration Programs | 15 | 32 | 144 | 152 | 25 | 26 | 27 |
GO Transit - GGH Region Fare Integration Program
Prior to 2022, 12 GGH region municipal transit agencies,[35] excluding the TTC,[36] had a co-fare agreement with GO Transit where the Province would provide a 75 per cent discount on the municipal transit agency fare paid by passengers when transferring to or from GO Transit. In 2022, the Province expanded the program to cover 100 per cent of the municipal transit agency fare for transfers between GO Transit and the 12 municipal transit agencies. This program is funded by the Province, at a cost of $15 million in 2022-23, and is projected to cost $27 million in 2028-29.
One Fare Program
In 2023, the Province announced the One Fare program, which eliminated the municipal fare for transfers between the TTC and GO Transit, as well as the second fare for transfers between the TTC and its neighbouring municipal transit agencies, MiWay, Brampton Transit, YRT, DRT and Peel Region TransHelp. The program launched in February 2024, with funding committed by the Province until March 2026.[37]
The introduction of the One Fare program brings the TTC in line with other GGH region municipal transit agencies that already have free transfers with GO Transit (through the GO Transit – GGH Region Fare Integration Program) as well as free inter-city transfers (through municipally funded agreements).
The FAO estimates that the One Fare program cost the Province $10 million in 2023-24 as the program commenced near the end of the fiscal year in February 2024. The cost is projected to rise to $121 million in 2024-25, with the first full year of the program, and to $128 million in 2025-26.
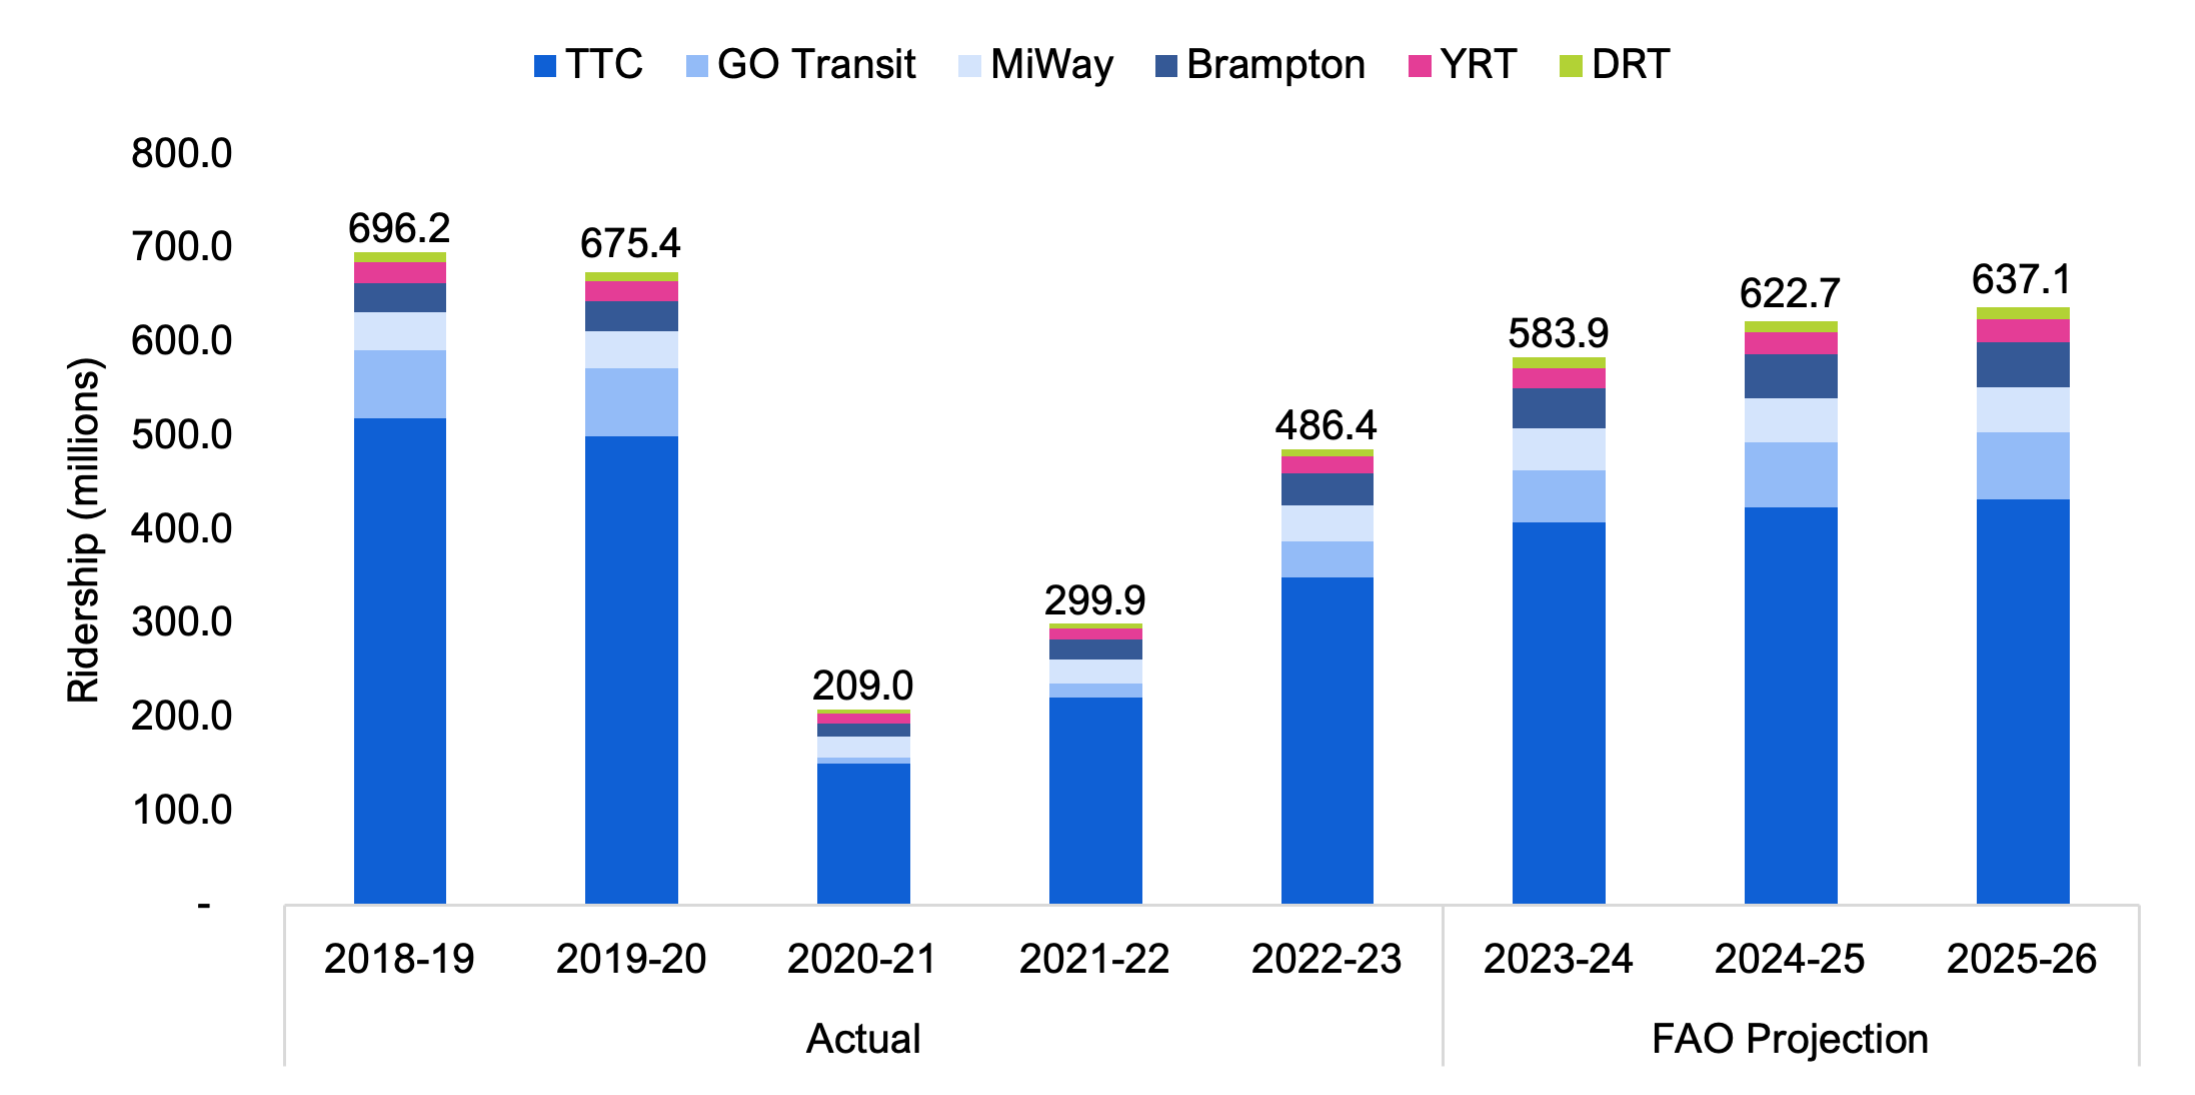
The FAO’s One Fare program cost estimate is based on the projected ridership of the participating agencies and the projected number of transfers. In 2022-23, the FAO estimates that total ridership for the transit agencies in the One Fare program was 486.4 million.[38] Ridership for these agencies is projected to increase to 622.7 million in 2024-25 and 637.1 million by 2025-26.[39] The FAO projects that One Fare program-related transfers as a share of total ridership will increase from an estimated 3.3 per cent in 2022- 23 to 6.0 per cent in 2025-26.
Figure 5.4 Actual and FAO projected ridership by transit agency participating in the One Fare program, 2018-19 to 2025-26, millions
Note: Actual and projected ridership reflects conventional transit services and does not include specialized transit services such as Peel Region TransHelp. Specialized transit refers to transit services that are operated for persons with disabilities.
Source: FAO analysis of information provided by the Province and ridership projections based on municipal reports
Accessible version
| Actual | FAO Projection | |||||||
|---|---|---|---|---|---|---|---|---|
| Fiscal Year | 2018-19 | 2019-20 | 2020-21 | 2021-22 | 2022-23 | 2023-24 | 2024-25 | 2025-26 |
| TTC | 519.2 | 500.1 | 150.7 | 221.4 | 349.6 | 407.8 | 423.7 | 432.4 |
| GO Transit | 72.2 | 72.2 | 6.5 | 14.4 | 38.5 | 55.4 | 70.0 | 72.0 |
| MiWay | 40.6 | 40.0 | 22.1 | 25.9 | 38.0 | 45.3 | 46.6 | 47.5 |
| Brampton Transit | 31.4 | 32.1 | 14.3 | 21.6 | 34.8 | 42.3 | 47.0 | 48.6 |
| YRT | 21.9 | 21.5 | 10.4 | 11.5 | 17.3 | 22.2 | 23.9 | 24.1 |
| DRT | 10.8 | 9.6 | 5.1 | 5.1 | 8.2 | 10.9 | 11.3 | 12.1 |
| Total | 696.2 | 675.4 | 209.0 | 299.9 | 486.4 | 583.9 | 622.7 | 637.1 |
The FAO’s projection for One Fare program costs ends in 2025-26, the last year of the program based on current agreements. However, if the program is renewed in its current form, the FAO projects that costs for the One Fare program would rise to $140 million in 2028-29.
Ontario Gas Tax Program
The Ontario Gas Tax Program aims to increase municipal transit ridership by using revenue generated by Ontario’s gasoline tax to provide ongoing funding for municipal transit operations, service expansion and transit infrastructure.[40] The Ontario Gas Tax Program total funding envelope is based on the value of two cents per litre of gas sold, using gasoline sales from the prior year.
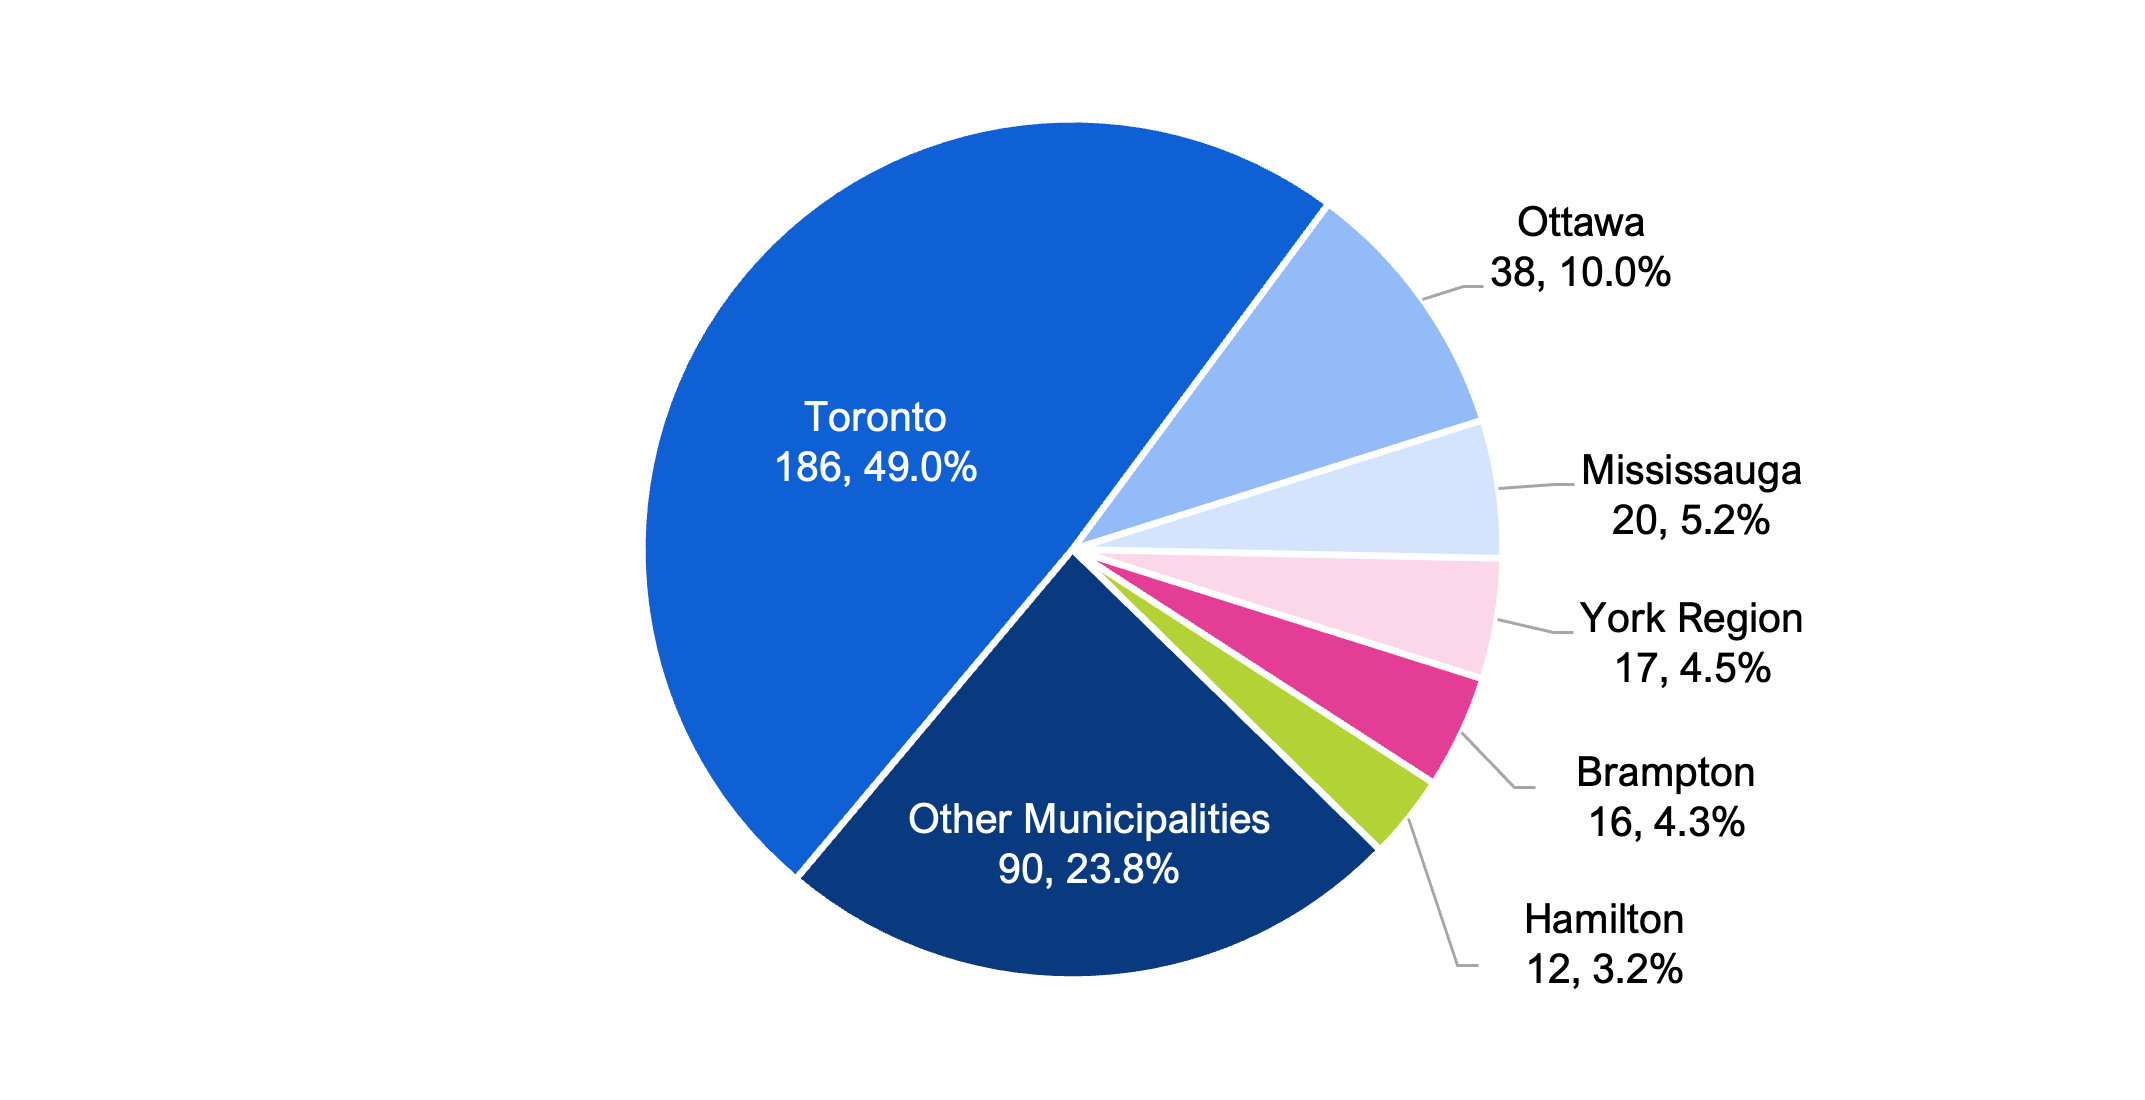
In 2022-23, the Province provided $378 million in subsidies to municipalities. The funding is distributed to municipalities based on ridership and service area population.[41] Toronto received the largest allocation, at $186 million, or 49.0 per cent of the entire envelope. The next largest recipients were Ottawa ($38 million), Mississauga ($20 million), York Region ($17 million), Brampton ($16 million) and Hamilton ($12 million). All other municipalities received a combined allocation of $90 million.
Figure 5.5 Ontario Gas Tax Program funding allocations by municipality, 2022-23, $ millions and per cent
Source: FAO analysis of information provided by the Province
Accessible version
| Municipality | Gas Tax Subsidy Allocation | Share of Gas Tax Subsidy Allocation (%) |
|---|---|---|
| Toronto | 186 | 49.0 |
| Ottawa | 38 | 10.0 |
| Mississauga | 20 | 5.2 |
| York Region | 17 | 4.5 |
| Brampton | 16 | 4.3 |
| Hamilton | 12 | 3.2 |
| Other Municipalities | 90 | 23.8 |
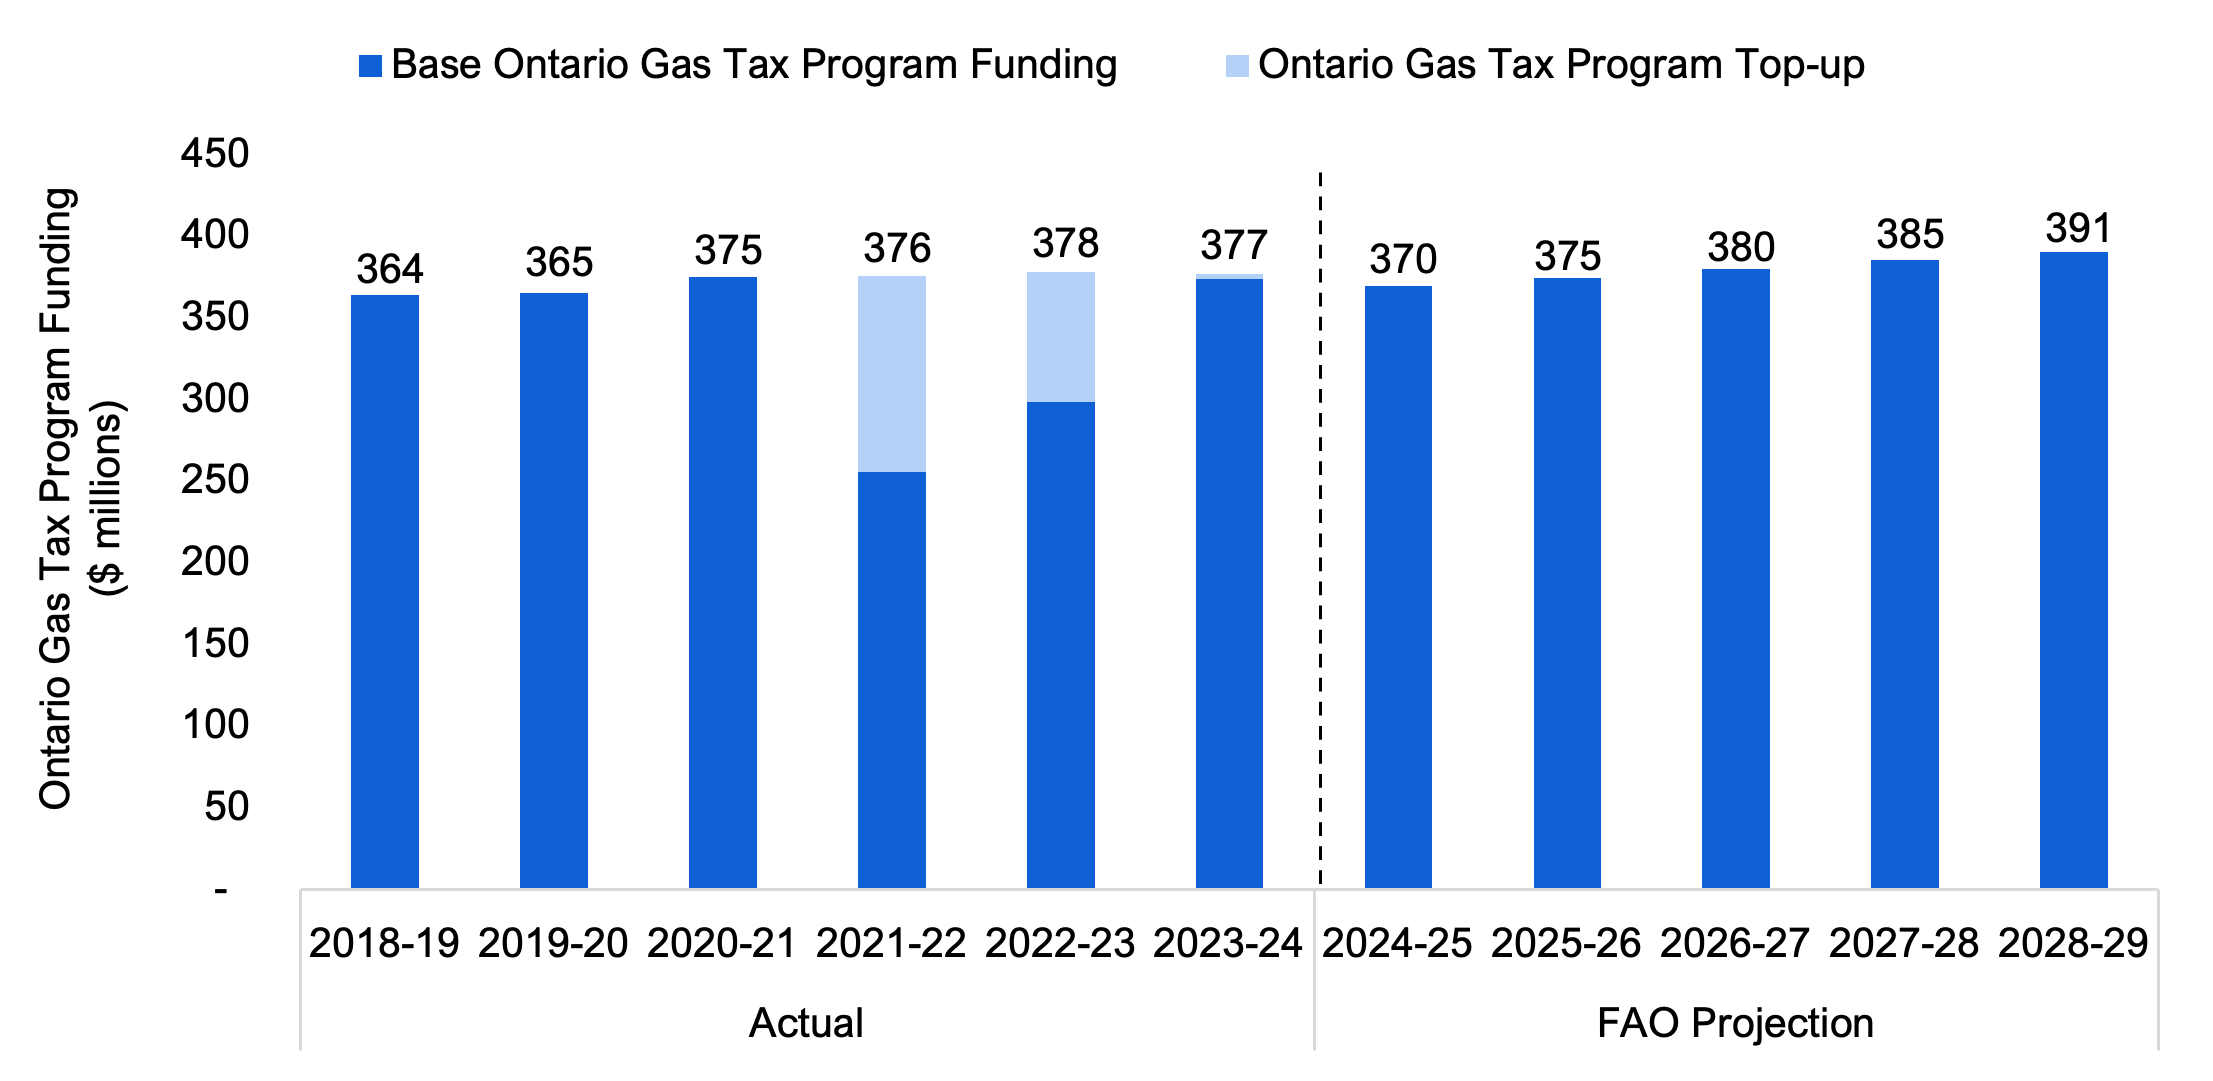
Due to a decline in gasoline sales during the COVID-19 pandemic, the Province provided top-ups to the Ontario Gas Tax Program subsidy of $120 million in 2021-22, $80 million in 2022-23 and $3 million in 2023-24. These top-ups maintained total Ontario Gas Tax Program funding at approximately pre-pandemic levels. Going forward, the FAO projects Ontario Gas Tax Program funding will increase to $391 million in 2028-29, in line with projected gasoline sales.
Figure 5.6 Actual and FAO projected Ontario Gas Tax Program funding, 2018-19 to 2028-29, $ millions
Source: 2022-23 Public Accounts of Ontario, 2024 Ontario Budget and FAO analysis of information provided by the Province
Accessible version
| Fiscal Year | Base Ontario Gas Tax Program Funding ($ millions) | Ontario Gas Tax Program top-up ($ millions) | |
|---|---|---|---|
| Actual | 2018-19 | 364 | - |
| 2019-20 | 365 | - | |
| 2020-21 | 375 | - | |
| 2021-22 | 256 | 120 | |
| 2022-23 | 298 | 80 | |
| 2023-24 | 374 | 3 | |
| FAO Projection | 2024-25 | 370 | - |
| 2025-26 | 375 | - | |
| 2026-27 | 380 | - | |
| 2027-28 | 385 | - | |
| 2028-29 | 391 | - |
Safe Restart Agreement
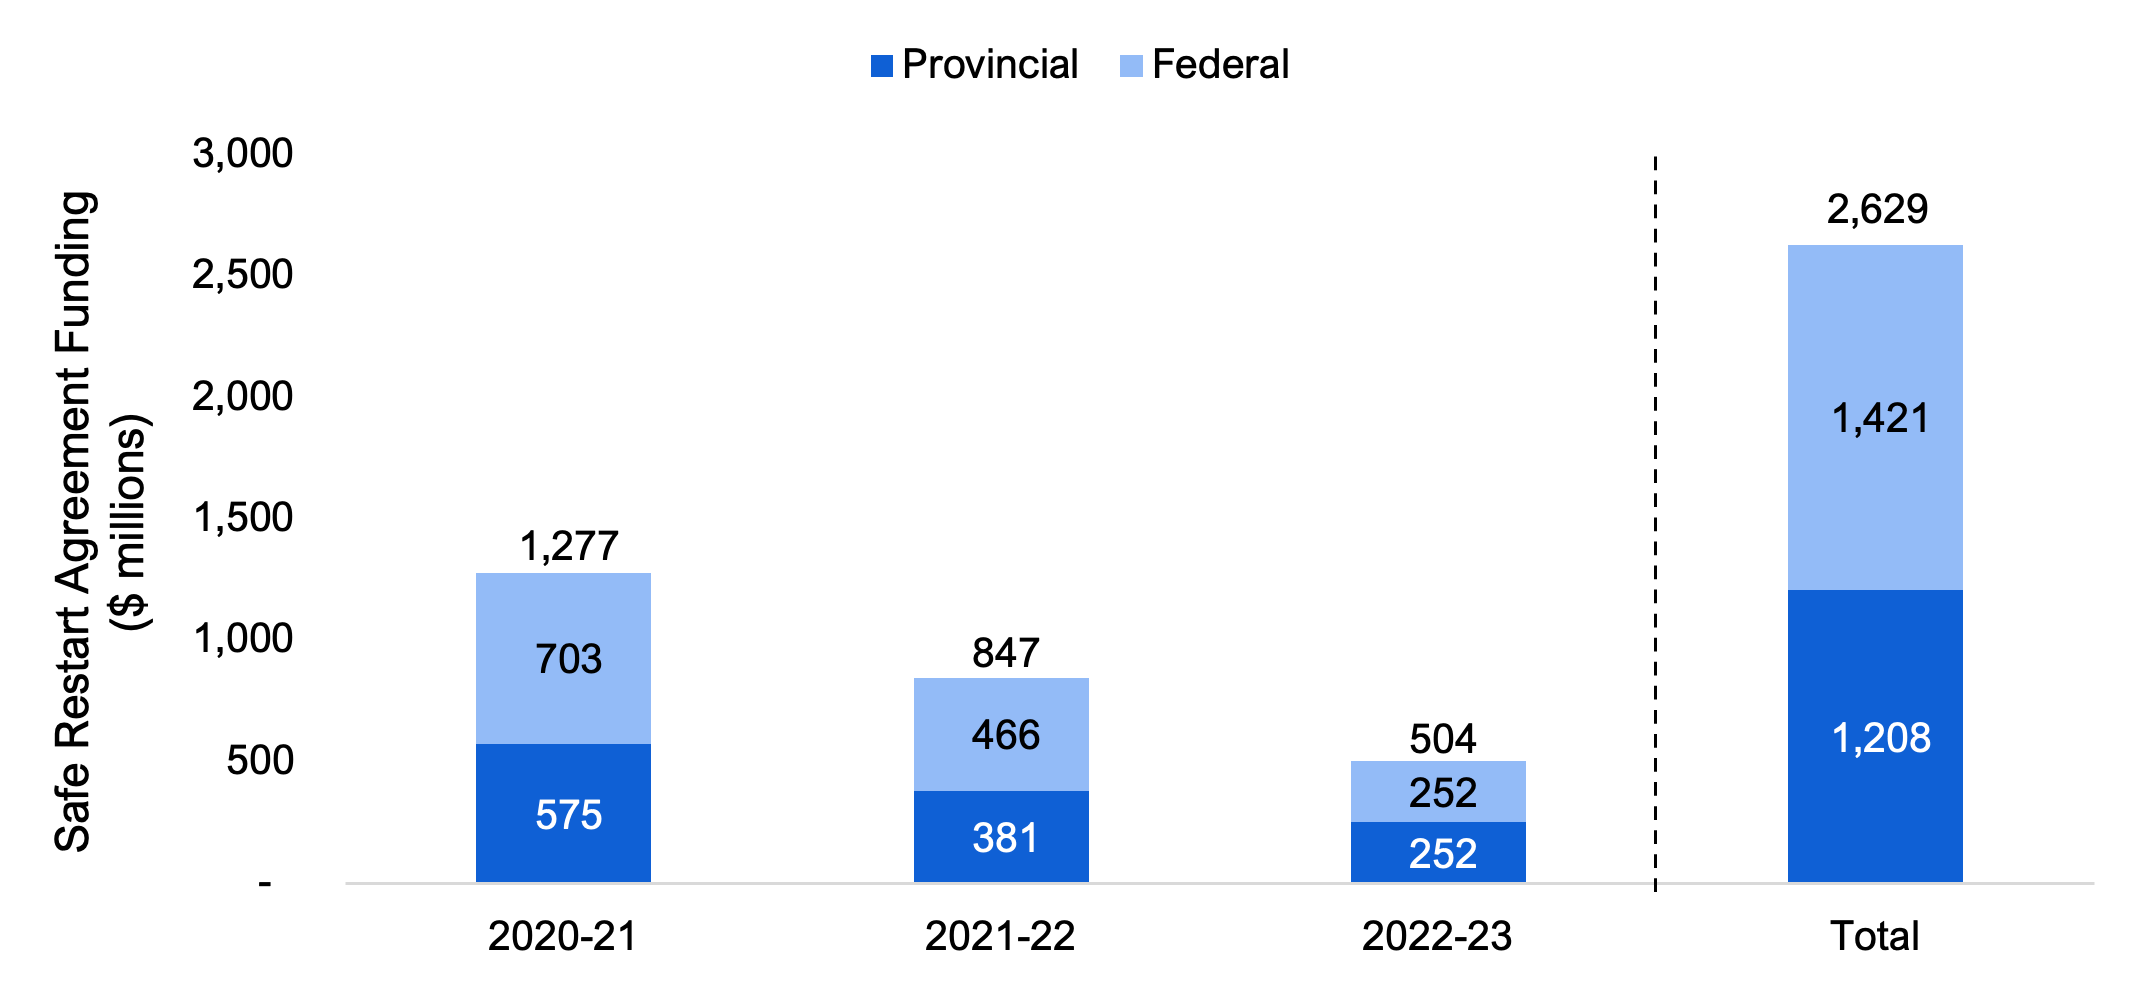
In August 2020, the federal government announced the Safe Restart Agreement (SRA), which, in partnership with provincial governments, provided municipal transit agencies with funding to help address financial pressures related to the decrease in ridership and loss of revenues during the COVID-19 pandemic.[42] The SRA provided a total of $2.6 billion in transit-related funding across four phases between 2020-21 and 2022-23.[43] For the first three phases, the Province contributed approximately 45.0 per cent of the funding and the federal government contributed approximately 55.0 per cent. The fourth phase of funding was evenly cost-split between the Province and the federal government.
Figure 5.7 Safe Restart Agreement transit subsidy funding in Ontario by source, 2020-21 to 2022-23, $ millions
Source: FAO analysis of information provided by the Province
Accessible version
| 2020-21 | 2021-22 | 2022-23 | Total | |
|---|---|---|---|---|
| Provincial | 575 | 381 | 252 | 1,208 |
| Federal | 703 | 466 | 252 | 1,421 |
| Total | 1,277 | 847 | 504 | 2,629 |
For the first three phases of the SRA, funding was distributed to municipalities based on 2018 transit ridership levels, with each municipality receiving a base amount of $40,000. For phase four, municipalities received base funding of $5,000 and additional funding based on their actual expenditures during the first three rounds of funding.
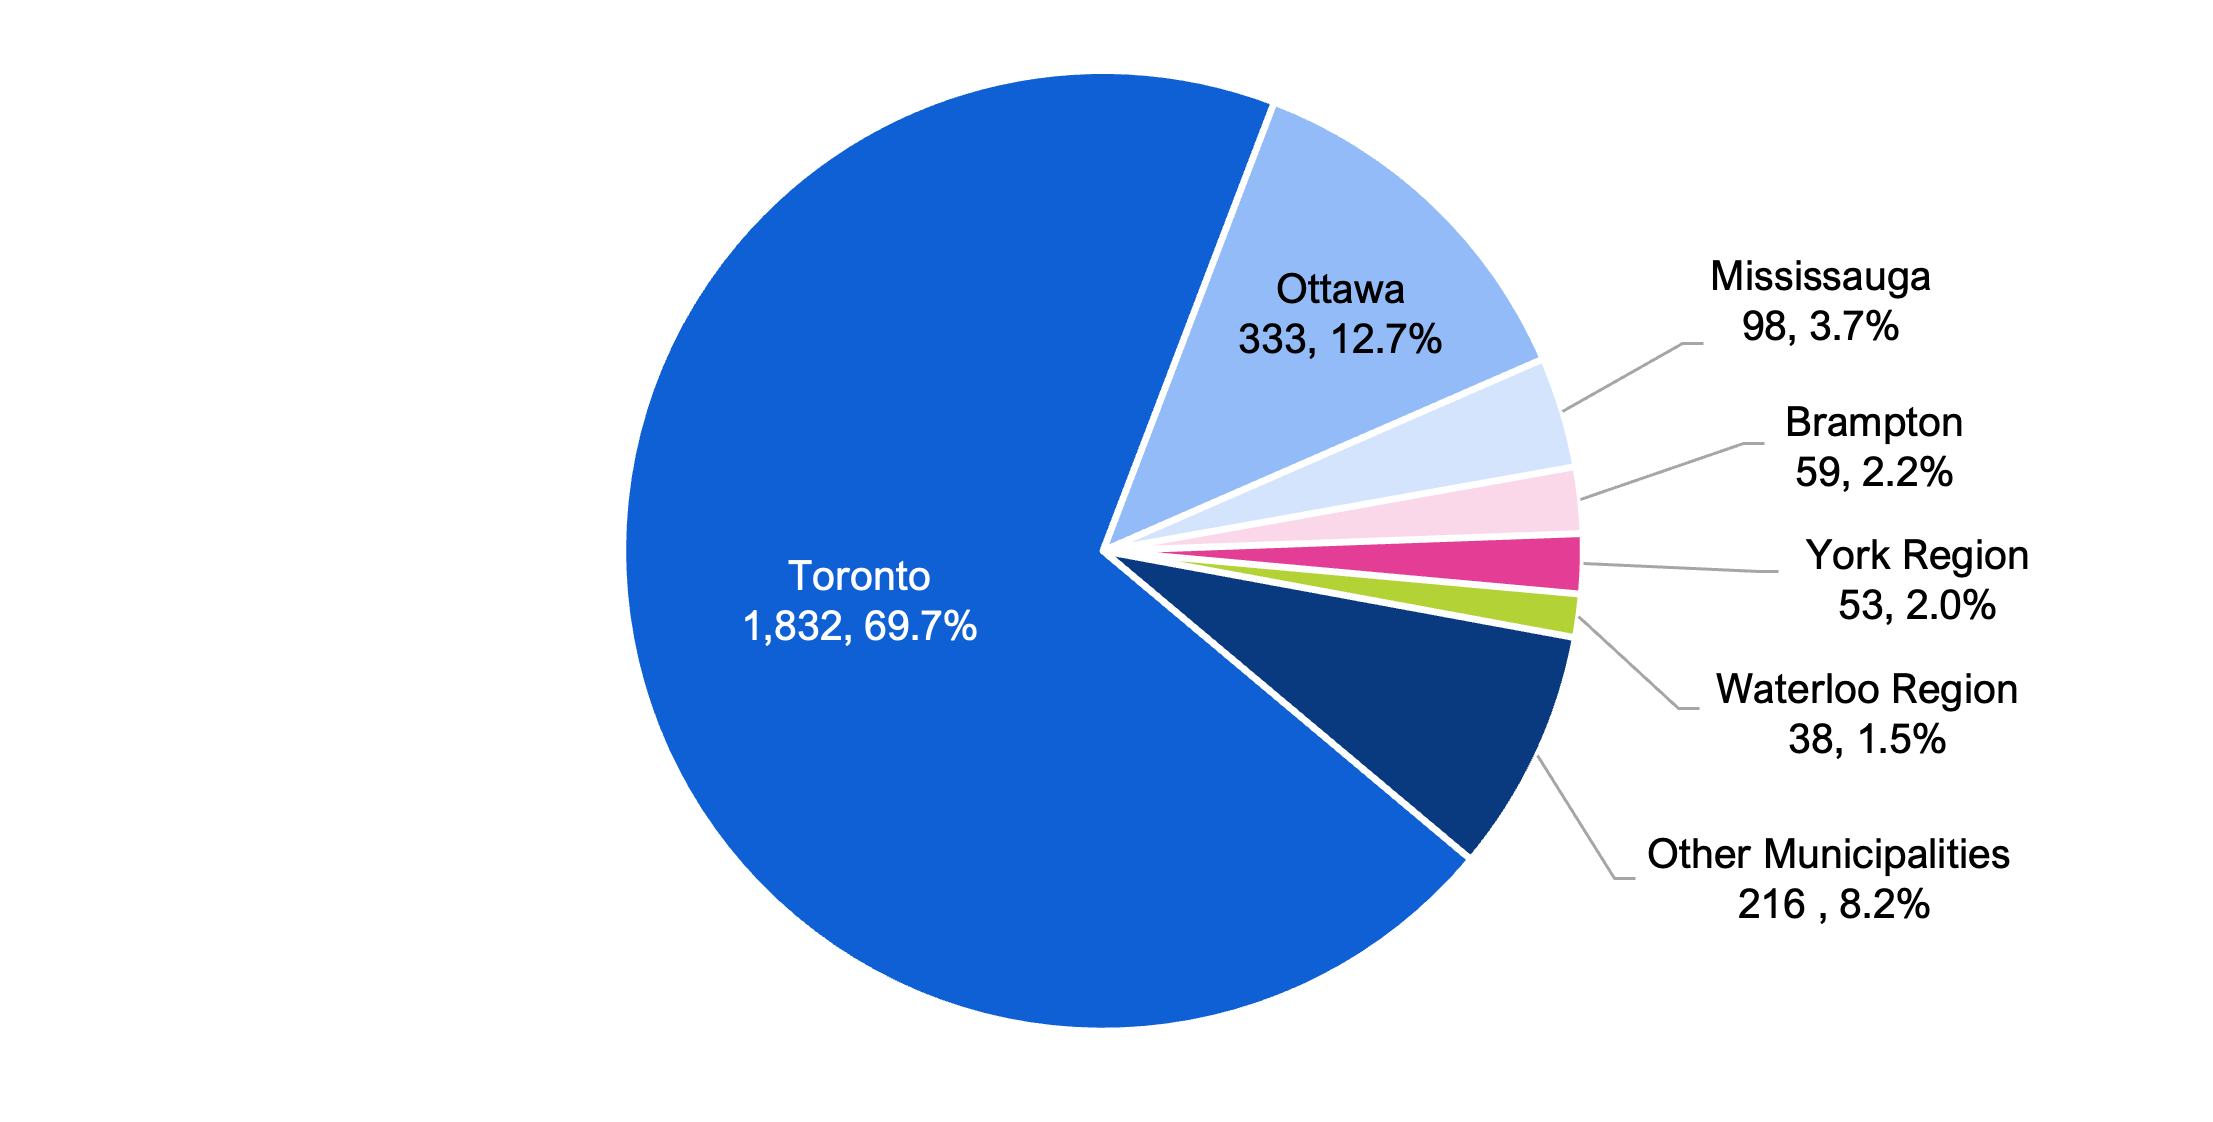
Toronto received the largest portion of the total SRA funding envelope, at $1.8 billion, or 69.7 per cent of all funding. The next largest recipient was Ottawa ($333 million, or 12.7 per cent of all funding), followed by Mississauga ($98 million), Brampton ($59 million), York Region ($53 million) and Waterloo ($38 million). All other municipalities had combined SRA allocations of $216 million.
Figure 5.8 Total Safe Restart Agreement transit subsidy allocations in Ontario by municipality, 2020-21 to 2022-23, $ millions and per cent
Source: FAO analysis of information provided by the Province
Accessible version
| Municipality | Safe Restart Agreement Subsidy Allocation ($ millions) | Share of Total Safe Restart Agreement Subsidy Allocation (%) |
|---|---|---|
| Toronto | 1,832 | 69.7 |
| Ottawa | 333 | 12.7 |
| Mississauga | 98 | 3.7 |
| Brampton | 59 | 2.2 |
| York Region | 53 | 2.0 |
| Waterloo Region | 38 | 1.5 |
| Other Municipalities | 216 | 8.2 |
Ontario-Toronto New Deal Agreement
In November 2023, the Province and the City of Toronto announced the Ontario-Toronto New Deal Agreement, which included two new time-limited subsidies for transit operations in Toronto: the Subway and Transit Safety, Recovery and Sustainable Operations Fund and the Finch West and Eglinton Crosstown LRT operating support.[44] These subsidies are intended to support the City in its transit operations as SRA funding ends and the TTC continues to recover from the downturn in ridership due to the COVID-19 pandemic.
Subway and Transit Safety, Recovery and Sustainable Operations Fund
Through the Ontario-Toronto New Deal Agreement, the Province provided a one-time $300 million operating subsidy for the TTC in 2023-24, the Subway and Transit Safety, Recovery and Sustainable Operations Fund. Included in this subsidy are commitments made by the City of Toronto and the TTC to increase police presence, expand cellular and data services throughout stations and subway lines, and improve options for reporting emergencies and response times to reports.
Finch West and Eglinton Crosstown LRT Operating Support
The second time-limited operating subsidy provides the City of Toronto with $330 million over three years between 2024-25 and 2026-27 to support operations while bringing the Finch West and Eglinton Crosstown LRT lines into service.
Beyond 2026-27, the FAO assumes that provincial operating support for the Finch West and Eglinton Crosstown LRT expires. This reflects the Finch West and Eglinton LRT agreements between the Province and the City of Toronto, whereby the City of Toronto will be responsible for funding the operations and day-to-day maintenance of the LRT lines while the Province will be responsible for major maintenance.[45] However, as part of the Ontario-Toronto New Deal Agreement, the Province will conduct a review in 2026 to determine the need to extend funding beyond 2026-27.
Ontario Northland Transportation Commission Operating Subsidy
The Ontario Northland Transportation Commission (ONTC) is a provincial transit agency that provides freight and passenger transportation, and remanufacturing and repair services, primarily in Northern Ontario. The ONTC receives an annual subsidy from the Province to support its operations, which totalled $54 million in 2022-23. The FAO forecasts that the ONTC operating subsidy will increase to $88 million by 2028-29, based on inflation and planned increases in service levels. This includes the reintroduction of the Northlander, a passenger train that will provide rail service from Toronto to Timmins, with 16 stops in total plus a connection to Cochrane.[46]
Other Operating Subsidies
Spending on other operating subsidies is expected to decrease from $7 million in 2022-23 to $5 million in 2028-29. Other operating subsidies include:
- The Community Transportation Grant (CTG) Program, which provided $7 million to municipalities in 2022-23. The CTG Program aims to help municipalities improve mobility options and transit service capacity in areas with smaller population sizes and lower population density, where providing traditional transit services is challenging or not feasible.[47] For example, the program supports the operation of an inter-regional transit service between rural Perth County, London, St. Marys, Stratford and Waterloo Region. The CTG Program, which began as a two-year pilot in 2015, is concluding in 2024-25. It will be replaced by the Ontario Transit Investment Fund (OTIF) in 2025-26. The OTIF will provide $5 million in annual subsidies, beginning in 2025-26, based on the Province’s announced commitments.[48]
- The Municipal Transit Enhanced Cleaning Program (MTEC) was a time-limited program in 2021-22 that provided $14 million to municipalities across Ontario to support the enhanced cleaning costs of municipal public transit agencies during the COVID-19 pandemic.[49] This included covering costs for cleaning materials, contracted cleaning services, hand sanitizer and safety wear such as gloves and goggles.[50]
6. Distribution of Provincial Transit Operating Subsidies by Economic Region
Overview
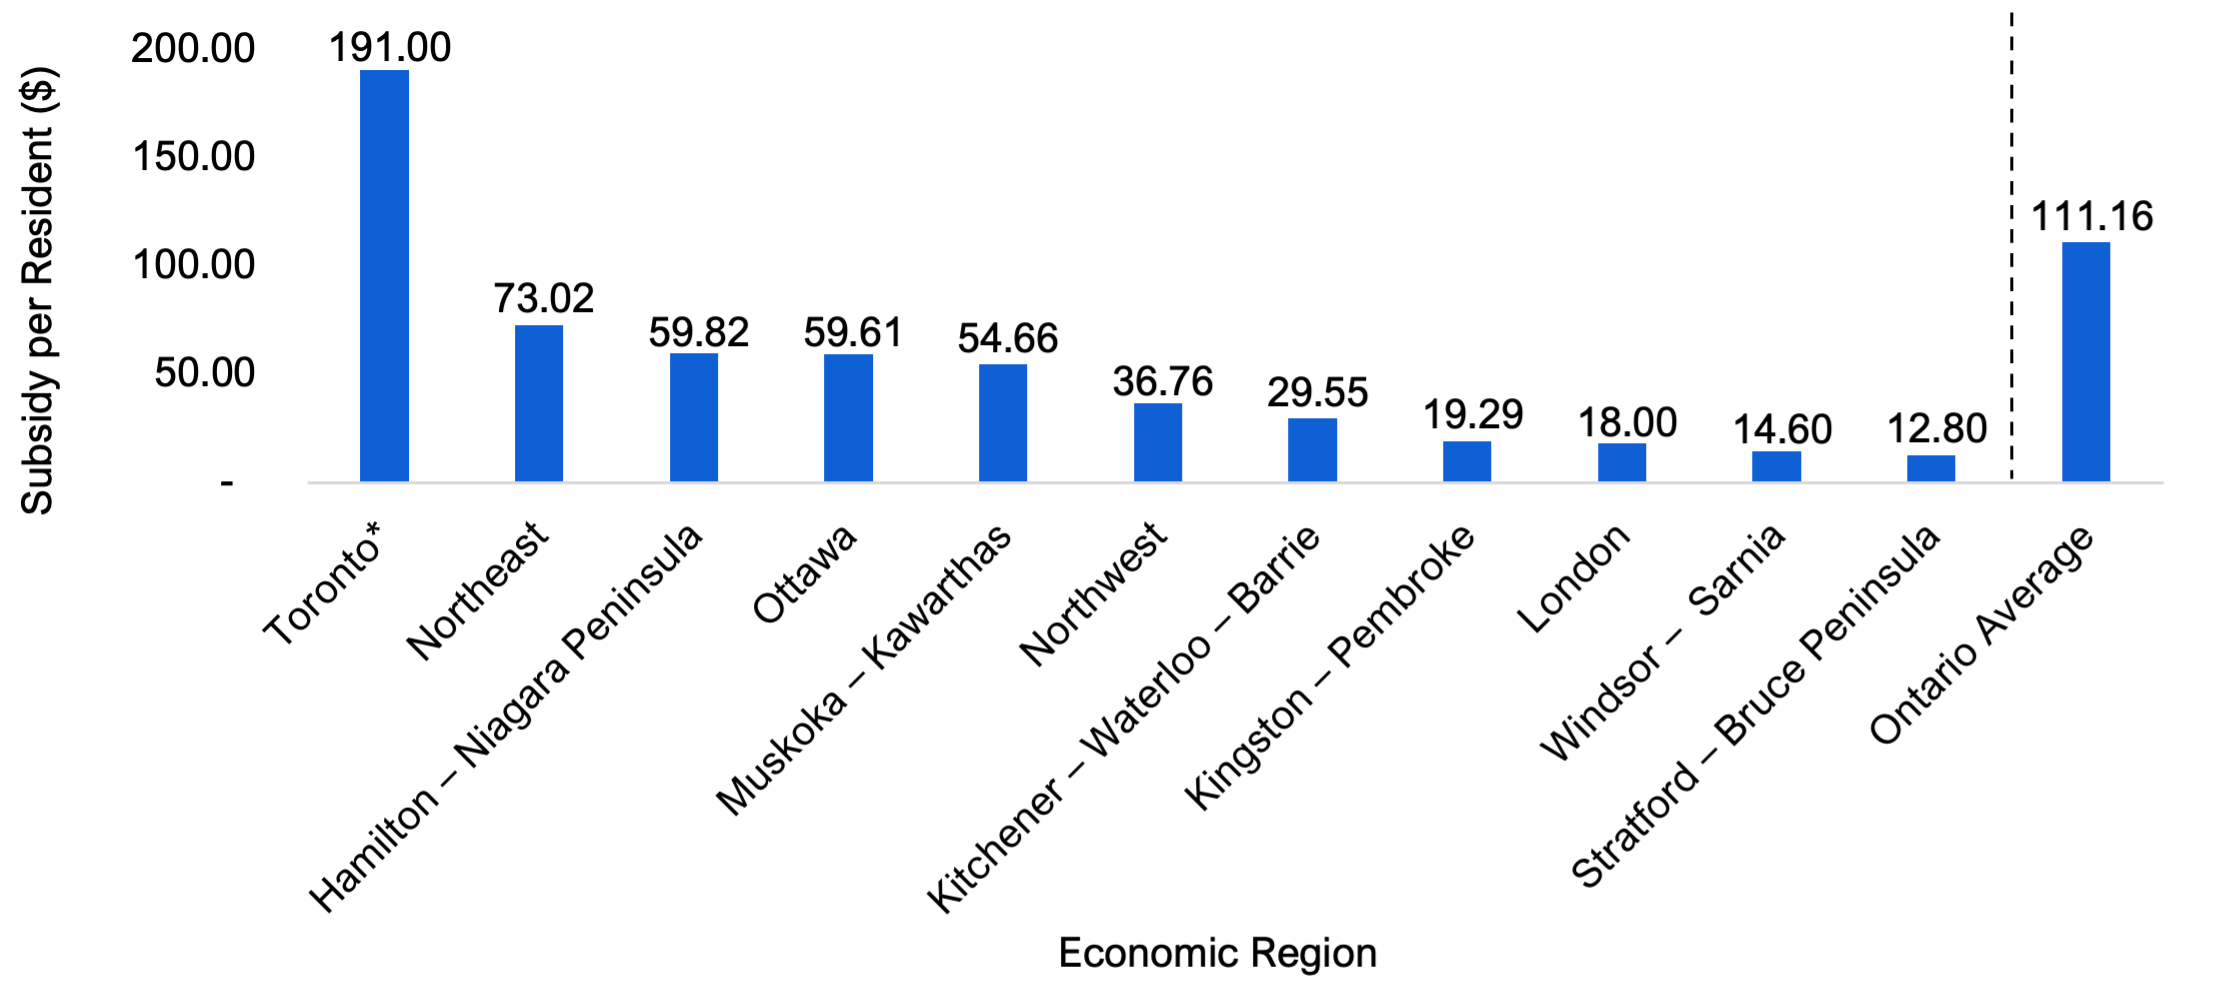
In 2022-23, the Province provided $1.7 billion in operating subsidies to provincial and municipal transit agencies in Ontario. On average, each Ontario resident received $111.16 in provincial transit operating subsidies; however, per-resident subsidies varied significantly across Ontario’s 11 economic regions.[51]
In 2022-23, the Toronto economic region, which includes Durham Region, York Region, Peel Region, Oakville, Milton, Halton Hills and the City of Toronto, received an estimated $1.4 billion in provincial operating subsidies, equivalent to $191.00 per resident. This was the highest among Ontario’s 11 economic regions. The Northeast economic region received the second highest amount of provincial operating subsidies per resident, at an estimated $73.02, followed by the Hamilton – Niagara Peninsula region at $59.82 and the Ottawa region at $59.61. Regions with the lowest per-resident provincial transit subsidies were Stratford – Bruce Peninsula at $12.80 per resident, Windsor – Sarnia at $14.60 per resident and London at $18.00 per resident.
Figure 6.1 Provincial transit operating subsidies per resident, by economic region, 2022-23, $
Note: An economic region refers to a grouping of census divisions, as defined by Statistics Canada.
* The Toronto economic region includes Durham Region, York Region, the City of Toronto, Peel Region, Oakville, Milton and Halton Hills.
Source: Canadian Urban Transit Association, Ontario Urban Transit Fact Book 2022 Operating Data, No. RTS 22-20, February 2024; Ontario Northland, Annual Report 2022-23; and FAO analysis of information provided by the Province
Accessible version
| Economic Region | Subsidy per Resident ($) |
|---|---|
| Toronto* | 191.00 |
| Northeast | 73.02 |
| Hamilton – Niagara Peninsula | 59.82 |
| Ottawa | 59.61 |
| Muskoka – Kawarthas | 54.66 |
| Northwest | 36.76 |
| Kitchener – Waterloo – Barrie | 29.55 |
| Kingston – Pembroke | 19.29 |
| London | 18.00 |
| Windsor – Sarnia | 14.60 |
| Stratford – Bruce Peninsula | 12.80 |
| Ontario Average | 111.16 |
Regional Distribution by Municipal and Provincial Transit Agencies in 2022-23
Generally, regions served by both municipal and provincial transit agencies receive more provincial operating subsidies than regions with only municipal transit agencies. In 2022-23, of the $1.7 billion in provincial transit operating subsidies:
- an estimated $645 million was allocated to municipal transit agencies through the Ontario Gas Tax Program, the Safe Restart Agreement, the Community Transportation Grant and the fare integration programs; and
- an estimated $1.0 billion was allocated to the provincial transit agencies: Metrolinx and the Ontario Northland Transportation Commission (ONTC).
Province-wide, this was equivalent to an average subsidy of $42.36 per resident to municipal agencies and $68.81 per resident to provincial agencies.
Figure 6.2 Provincial transit operating subsidies per resident, by economic region and level of transit agency, 2022-23, $

Note: An economic region refers to a grouping of census divisions, as defined by Statistics Canada. * The Toronto economic region includes Durham Region, York Region, the City of Toronto, Peel Region, Oakville, Milton and Halton Hills.
Source: Canadian Urban Transit Association, Ontario Urban Transit Fact Book 2022 Operating Data, No. RTS 22-20, February 2024; Ontario Northland, Annual Report 2022-23; and FAO analysis of information provided by the Province
Accessible version
| Economic Region | Subsidies to Municipal Agencies | Subsidies to Provincial Agencies | Total Subsidy per Resident ($) |
|---|---|---|---|
| Toronto* | 66.02 | 124.98 | 191.00 |
| Northeast | 13.27 | 59.75 | 73.02 |
| Hamilton – Niagara Peninsula | 17.36 | 42.46 | 59.82 |
| Ottawa | 50.73 | 8.88 | 59.61 |
| Muskoka – Kawarthas | 12.66 | 41.99 | 54.66 |
| Northwest | 11.92 | 24.84 | 36.76 |
| Kitchener – Waterloo – Barrie | 15.30 | 14.26 | 29.55 |
| Kingston – Pembroke | 15.29 | 4.00 | 19.29 |
| London | 17.56 | 0.44 | 18.00 |
| Windsor – Sarnia | 14.60 | - | 14.60 |
| Stratford – Bruce Peninsula | 12.80 | - | 12.80 |
| Ontario Average | 42.36 | 68.81 | 111.16 |
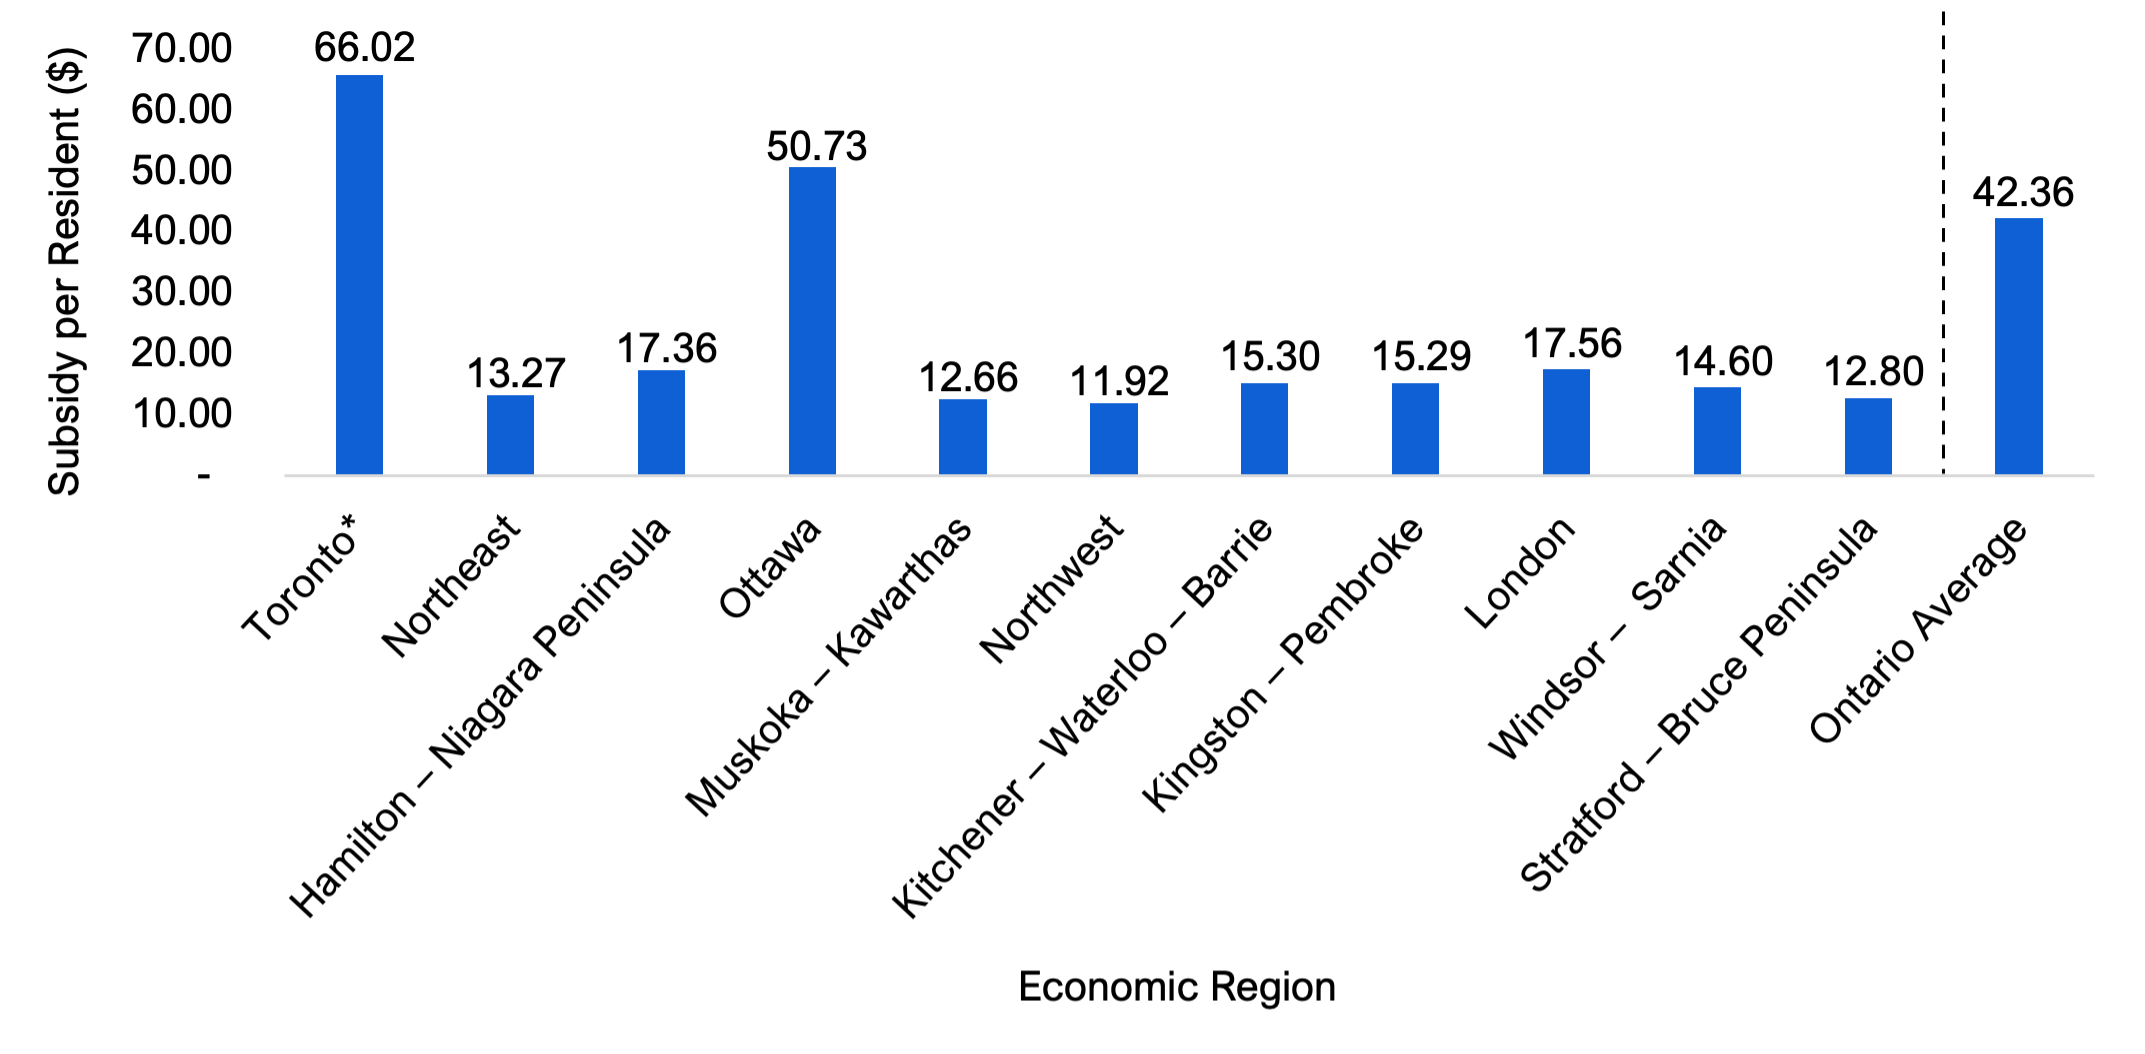
Subsidies to Municipal Transit Agencies
In 2022-23, provincial operating subsidies to municipal transit agencies on a per-resident basis were the highest in the Toronto economic region, at $66.02 per resident, followed by Ottawa at $50.73 per resident. This was due to the Ontario Gas Tax Program and the Safe Restart Agreement (SRA), both of which allocate funding primarily based on agency ridership. The Toronto and Ottawa economic regions have the two highest rates of passenger trips per resident in Ontario. Other municipalities received relatively less Ontario Gas Tax Program and SRA funding, resulting in per-resident subsidies ranging between $11.92 per person for the Northwest to $17.56 per resident for London.
Figure 6.3 Provincial operating subsidies to municipal transit agencies per resident, by economic region, 2022-23, $
Note: An economic region refers to a grouping of census divisions, as defined by Statistics Canada.
* The Toronto economic region includes Durham Region, York Region, the City of Toronto, Peel Region, Oakville, Milton and Halton Hills.
Source: Canadian Urban Transit Association, Ontario Urban Transit Fact Book 2022 Operating Data, No. RTS 22-20, February 2024; Ontario Northland, Annual Report 2022-23; and FAO analysis of information provided by the Province
Accessible version
| Economic Region | Subsidy per Resident ($) |
|---|---|
| Toronto* | 66.02 |
| Northeast | 13.27 |
| Hamilton – Niagara Peninsula | 17.36 |
| Ottawa | 50.73 |
| Muskoka – Kawarthas | 12.66 |
| Northwest | 11.92 |
| Kitchener – Waterloo – Barrie | 15.30 |
| Kingston – Pembroke | 15.29 |
| London | 17.56 |
| Windsor – Sarnia | 14.60 |
| Stratford – Bruce Peninsula | 12.80 |
| Ontario Average | 42.36 |
Subsidies to Provincial Transit Agencies
Provincial agencies primarily have a presence in the Greater Golden Horseshoe region and Ontario’s North. The Toronto economic region received the highest subsidy per resident for provincial transit agencies, at an estimated $124.98 in 2022-23, due to base operating subsidies to Metrolinx.[52] Subsidies to Metrolinx also accounted for Hamilton – Niagara Peninsula region’s $42.46 per-resident subsidy and most of Kitchener – Waterloo – Barrie’s $14.26 per-resident subsidy. The Ottawa region, which is outside Metrolinx’s service area but uses Metrolinx’s PRESTO payment system, received $8.88 per resident in subsidies.
Subsidies to the ONTC, which mainly serves Northern Ontario,[53] resulted in $59.75 in subsidies per resident for the Northeast region, $24.84 in subsidies per resident for the Northwest region, and $4.00 per resident in the Kingston – Pembroke region. The Muskoka – Kawarthas region’s $41.99 in per-resident subsidies was due to both Metrolinx and the ONTC subsidies. There are no provincial transit agencies serving the Windsor-Sarnia, Stratford – Bruce Peninsula and London[54] regions.
Figure 6.4 Provincial operating subsidies to provincial transit agencies per resident, by economic region, 2022-23, $

Note: An economic region refers to a grouping of census divisions, as defined by Statistics Canada.
* The Toronto economic region includes Durham Region, York Region, the City of Toronto, Peel Region, Oakville, Milton and Halton Hills.
Source: Canadian Urban Transit Association, Ontario Urban Transit Fact Book 2022 Operating Data, No. RTS 22-20, February 2024; Ontario Northland, Annual Report 2022-23; and FAO analysis of information provided by the Province
Accessible version
| Economic Region | Subsidy per Resident ($) |
|---|---|
| Toronto* | 124.98 |
| Northeast | 59.75 |
| Hamilton – Niagara Peninsula | 42.46 |
| Ottawa | 8.88 |
| Muskoka – Kawarthas | 41.99 |
| Northwest | 24.84 |
| Kitchener – Waterloo – Barrie | 14.26 |
| Kingston – Pembroke | 4.00 |
| London | 0.44 |
| Windsor – Sarnia | - |
| Stratford – Bruce Peninsula | - |
| Ontario Average | 68.81 |
Projected Distribution of Provincial Transit Operating Subsidies in 2024-25 and 2028-29
The FAO projects that provincial operating subsidies to public transit agencies will increase from $1.69 billion in 2022-23 to $1.81 billion in 2024-25, and then decrease to $1.78 billion in 2028-29. Changes to overall subsidies combined with population growth are expected to result in per-resident subsidies increasing from $111.16 per resident in 2022-23 to $112.16 per resident in 2024-25, and then declining to $103.76 per resident in 2028-29.
Figure 6.5 FAO estimate of provincial transit operating subsidies per resident, by economic region in 2022-23, 2024-25 and 2028-29, $

Note: An economic region refers to a grouping of census divisions, as defined by Statistics Canada. For specific data points, please see the accessible text available on the FAO website. * The Toronto economic region includes Durham Region, York Region, the City of Toronto, Peel Region, Oakville, Milton and Halton Hills.
Source: Canadian Urban Transit Association, Ontario Urban Transit Fact Book 2022 Operating Data, No. RTS 22-20, February 2024; Ontario Northland, Annual Report 2022-23; and FAO analysis of information provided by the Province
Accessible version
| Subsidy per Resident ($) | |||
|---|---|---|---|
| Economic Region | 2022-23 | 2024-25 | 2028-29 |
| Toronto* | 191.00 | 196.49 | 175.90 |
| Northeast | 73.02 | 90.01 | 103.83 |
| Hamilton – Niagara Peninsula | 59.82 | 61.87 | 65.96 |
| Ottawa | 59.61 | 31.91 | 31.60 |
| Muskoka – Kawarthas | 54.66 | 58.03 | 66.07 |
| Northwest | 36.76 | 45.67 | 46.78 |
| Kitchener – Waterloo – Barrie | 29.55 | 29.70 | 30.28 |
| Kingston – Pembroke | 19.29 | 18.22 | 17.74 |
| London | 18.00 | 15.33 | 14.10 |
| Windsor – Sarnia | 14.60 | 11.40 | 10.89 |
| Stratford – Bruce Peninsula | 12.80 | 11.70 | 8.57 |
| Ontario Average | 111.16 | 112.16 | 103.76 |
Regional Distribution in 2024-25
In 2024-25, the FAO projects that six economic regions will experience an increase in per-resident subsidies, driven by higher subsidies for the ONTC, Metrolinx, the introduction of the One Fare program, and the Finch West and Eglinton Crosstown LRT operating support under the Ontario-Toronto New Deal Agreement.
- The Northeast region is projected to experience the largest growth in per-resident subsidies, increasing from $73.02 in 2022-23 to an estimated $90.01 in 2024-25 due to a projected increase in subsidies for the ONTC.
- The Northwest region is also expected to benefit from the increase in subsidies for the ONTC, increasing per-resident subsidies from $36.76 in 2022-23 to $45.67 in 2024-25.
- The third largest projected increase in per-resident subsidies is for the Toronto economic region, due to a projected increase in Metrolinx’s base operating subsidy, the introduction of the One Fare program, and the Finch West and Eglinton Crosstown LRT operating support through the Ontario-Toronto New Deal Agreement, which is projected to more than offset the conclusion of Safe Restart Agreement funding. Together, these changes to subsidies are expected to increase the Toronto economic region’s per-resident subsidies from $191.00 in 2022-23 to $196.49 in 2024-25.
- Other regions experiencing projected increases in per-resident subsidies are Hamilton – Niagara Peninsula, Muskoka – Kawarthas, and Kitchener – Waterloo – Barrie, due to the increase in subsidies for Metrolinx and the ONTC.
The remaining five economic regions will experience a decline in per-resident subsidies compared to 2022-23 largely driven by the conclusion of the Safe Restart Agreement and a small projected decrease in the total Ontario Gas Tax Program funding envelope.
- The FAO projects that the Ottawa economic region will experience the largest reduction in per-resident subsidies, from $59.61 in 2022-23 to $31.91 in 2024-25, primarily due to the conclusion of the Safe Restart Agreement.
- The other economic regions that are projected to experience a decline in per-resident subsidies are Windsor – Sarnia, London, Stratford – Bruce Peninsula, and Kingston – Pembroke.
Regional Distribution in 2028-29
In 2028-29, the FAO projects that five economic regions will experience an increase in per-resident subsidies compared to 2024-25. Increases in per-resident subsidies are largely due to higher projected subsidies for Metrolinx and the ONTC.
- The Northeast region is projected to experience the largest growth in per-resident subsidies, increasing from $90.01 in 2024-25 to $103.83 in 2028-29, due to an increase in subsidies for the ONTC, including for the assumed reintroduction of the Northlander passenger train by that year.
- The Muskoka – Kawarthas region is projected to experience an increase in subsidies from $58.03 to $66.07, largely due to increased subsidies for both provincial transit agencies, Metrolinx and the ONTC.
- Per-resident subsidies to the Hamilton – Niagara Peninsula region are projected to increase from $61.87 in 2024-25 to $65.96 in 2028-29, largely due to higher subsidies for Metrolinx.
- The Northwest and Kitchener – Waterloo – Barrie regions are projected to experience a small increase of less than $1.11 per resident.
The remaining six economic regions are projected to experience a decline in per-resident subsidies, largely driven by the expiry of time-limited programs.
- The Toronto economic region is projected to experience a decrease in per-resident subsidies, from $196.49 in 2024-25 to $175.90 in 2028-29, due to the expiry of the One Fare program and the Finch West and Eglinton Crosstown LRT operating support, partially offset by an expected increase in Metrolinx’s base operating subsidy.
- The Stratford – Bruce Peninsula region is projected to experience a decrease in per-resident subsidies, from $11.70 in 2024-25 to $8.57 in 2028-29, largely due to lower projected subsidies under the Ontario Transit Investment Fund than its predecessor, the Community Transportation Grant Program.
- The London, Windsor – Sarnia, Kingston – Pembroke and Ottawa regions are expected to experience declines of less than $1.23 per resident.
7. Appendix: Methodology Overview
This report primarily uses data provided to the FAO by the Ministry of Transportation and Metrolinx, including information from the Canadian Urban Transit Association. Historical transit agency financial and ridership data are drawn from these sources from 2018 to 2022. The FAO estimates ridership and financial data for a small number of agencies that had incomplete information. In Chapters 3 and 4, figures are presented on a calendar year basis. For provincial agencies, the FAO estimates calendar year values based on actual values reported on a fiscal year basis. Except where otherwise stated, ridership refers to the combined conventional and specialized transit ridership for each agency.
Beyond 2022, the FAO projected provincial subsidies using an economic and financial model. For the Metrolinx base operating subsidy, the FAO projects Metrolinx’s revenues based on ridership and assumes that fares will increase with inflation. Operating expenses grow in line with service levels, inflation and collective agreements. The base operating subsidy is calculated by subtracting total estimated operating revenues and proceeds from asset sales from total estimated operating expenses, excluding fare integration costs.
For the One Fare program, the FAO’s cost projection is based on the projected number of transfers and the fare prices of transit agencies participating in the program. The number of transfers increases in line with the FAO’s ridership projection, which is based on municipalities’ own ridership forecasts and the FAO's economic model, which incorporates work-from-home trends, and local ridership and population growth in each municipality. The projection also incorporates a small positive impact from the reduction in fare costs on transfers between agencies and overall ridership.
The FAO forecasts the Ontario Gas Tax Program subsidy based on projected gasoline sales and population growth.
For the ONTC, the FAO’s projection for revenue, using the population growth of the agency’s service area, assumes that fares will increase with inflation, and incorporates the agency’s contracts for repair and rail services to 2025-26. The FAO’s projection for expenses incorporates planned increases in service levels and the impact of inflation.
For other provincial transit operating subsidies, projected amounts are based on existing agreements or legislation, as discussed in their respective sections in Chapter 5.
The FAO estimates subsidies per resident by economic region using different approaches, as appropriate for each subsidy. For Metrolinx and the ONTC, the FAO allocates subsidies to regions based primarily on estimated ridership of their respective stations and route stops.[55] For the Ontario Gas Tax Program and Safe Restart Agreement, the regional distribution is based on actual municipal allocations provided by the Province or estimated by the FAO using population and ridership shares. Finally, the subsidies for the Ontario-Toronto New Deal Agreement are allocated entirely to the Toronto economic region.
Footnotes
- [1] Transportation services that are not provincially or municipally operated (such as federal transit agencies and private transit agencies), and transportation services that largely focus on seasonal or leisure travel (such as the Owen Sound Transportation Company and Toronto Island Ferry), are outside the scope of this report.
- [2] The sum of own-source revenues and operating subsidies as a percentage of operating expenses may not equal 100 per cent due to agencies possibly recording an operating budget surplus or deficit, or due to other adjustments.
- [3] The 12 municipal transit agencies are Barrie Transit, Bradford-West Gwillimbury Transit, Brampton Transit, Burlington Transit, Durham Region Transit, Grand River Transit, Guelph Transit, Hamilton Street Railway, Milton Transit, MiWay, Oakville Transit and York Region Transit.
- [4] An economic region refers to a grouping of census divisions, as defined by Statistics Canada.
- [5] The Toronto economic region includes Durham Region, York Region, the City of Toronto, Peel Region, Oakville, Milton and Halton Hills.
- [6] Reflects the number of municipal and provincial agencies in 2022.
- [7] Transportation services that are not provincially or municipally operated (such as federal transit agencies and private transit agencies), and transportation services that largely focus on seasonal or leisure travel (such as the Owen Sound Transportation Company and Toronto Island Ferry), are outside the scope of this report.
- [8] Ridership is defined as a linked trip, riding one way from origin to final destination.
- [9] Ridership figures are presented on a calendar year basis. For provincial agencies, the FAO estimates calendar year values based on actual values reported on a fiscal year basis.
- [10] The Owen Sound Transportation Company is a provincial agency that is outside the scope of this report as it primarily provides seasonal transportation services to support local tourism.
- [11] The Greater Golden Horseshoe region includes the Greater Toronto and Hamilton Area, Brantford, Brant County, Peterborough, Niagara Region, Simcoe County, Wellington County and Waterloo Region.
- [12] See Northeastern Passenger Rail Service Updated Initial Business Case for more information.
- [13] Average passenger trip length for municipal transit agencies reflects conventional transit services and does not include specialized transit services. Specialized transit refers to transit services that are operated for persons with disabilities.
- [14] These measures included stay-at-home orders limiting non-essential travel, closures of non-essential businesses and workplaces, which reduced the number of people making daily commutes, and social distancing guidelines that decreased public transit capacity.
- [15] According to Statistics Canada, urban transit ridership across Canada was higher in 2023 than in 2022, although it remained below the 2019 pre-pandemic level. Statistics Canada, Urban public transit, December 2023, February 20, 2024.
- [16] See TTC’s May 2024 CEO Report for more information on ridership trends.
- [17] Metrolinx, Survey: work no longer primary reason riders use GO Transit, July 6, 2021.
- [18] Statistics Canada, 2021 Census of Population.
- [19] Public transit agencies also recorded $7.6 billion in capital expenditures in 2022, which are excluded from the scope of this report.
- [20] The figures reflect actual spending by category for municipal transit agencies and FAO estimates of spending by category for Metrolinx and the ONTC, based on information provided by the Province and the ONTC.
- [21] This is represented by revenue vehicle kilometres, which refers to the number of kilometres travelled by vehicles providing regular passenger services. It excludes travel for other services (such as school contracts and charters) as well as training, tests and maintenance. Total distance travelled reflects municipal transit agencies and Metrolinx’s GO Transit but excludes the ONTC and Metrolinx’s UP Express
- [22] Total operating revenues exclude government subsidies for capital investments, which are outside the scope of this report. Based on data from the Canadian Urban Transit Association, capital subsidies totaled $7.7 billion in 2022.
- [23] Other revenue sources include revenues from parking lot charges, school contracts, local and inter-city charters, investment income and other sources.
- [24] Metrolinx’s average own-source revenues were $11.92 per passenger trip in 2022, subsidies were $28.53 per trip and expenses were $42.45 per trip. The ONTC’s own-source revenues were $301.73 per passenger trip in 2022, subsidies were $174.95 per trip and expenses were $431.75 per trip.
- [25] Excluding these services, the FAO estimates that the ONTC’s own-source revenues were $74.95 per passenger trip, subsidies were $93.76 per trip and expenses were $168.72 per trip in 2022.
- [26] This was a significant change from 2019, when 52.4 per cent of transit agencies’ operating expenses were funded by own-source revenues and 47.5 per cent were supported by subsidies. This shift is primarily due to the sharp decline in transit ridership and passenger fare revenue between 2019 and 2022 caused by the COVID-19 pandemic, which led to transit agencies relying more heavily on government operating subsidies.
- [27] ONTC own-source revenues and operating subsidies as a share of expense sum to greater than 100 per cent because the ONTC recorded an operating surplus in 2022-23. In addition, the ONTC’s relatively high own-source revenues as a share of operating expenses is due to its freight and repair services, which operate on a full cost recovery basis. See Ontario Northland, Annual Report 2022-23.
- [28] The Metrolinx base operating subsidy differs from the Metrolinx Operating Subsidies transfer payment expense reported in the Public Accounts of Ontario as the FAO’s calculation for the Metrolinx base operating subsidy excludes additional subsidies that flow through the Metrolinx Operating Subsidies transfer payment, such as the Province’s fare integration programs and one-time expenses associated with the Ontario-Toronto New Deal Agreement. These additional subsidies are discussed separately in this chapter.
- [29] In April 2024, Metrolinx increased weekly service trips for GO Transit by 15.4 per cent to 2,307 trips. Government of Ontario, Ontario Expanding GO Train Service Across the Greater Toronto Area, April 15, 2024.
- [30] A reduction in estimated GO Transit ridership by 10 million (13.6 per cent) in 2028-29 would result in an $80 million increase to the projected Metrolinx base operating subsidy.
- [31] The FAO forecast assumes that fare rates increase with inflation. However, as of the writing of this report, GO Transit and UP Express fares have not changed since April 2019. If fare rates continue to remain unchanged, the FAO estimates that Metrolinx’s base operating subsidy would increase by $68 million in 2028-29.
- [32] The GO Expansion plan aims to increase weekly rail trips from 2,307 trips in 2024 to 6,000 trips by electrifying and expanding some GO Transit lines, building and upgrading stations, and implementing new train control systems. However, as of the writing of this report, the timing of the expansion plan is unclear as Metrolinx is currently updating its 2041 Regional Transportation Plan. As a result, the FAO assumes that service levels will remain unchanged through 2028-29. For more information, see Metrolinx 2023-24 Annual Report, p. 30.
- [33] The Greater Golden Horseshoe region includes the Greater Toronto and Hamilton Area, Brantford, Brant County, Peterborough, Niagara Region, Simcoe County, Wellington County and Waterloo Region.
- [34] Metrolinx, Ontario’s One Fare Program, 2024.
- [35] The 12 municipal transit agencies are Barrie Transit, Bradford-West Gwillimbury Transit, Brampton Transit, Burlington Transit, Durham Region Transit, Grand River Transit, Guelph Transit, Hamilton Street Railway, Milton Transit, MiWay, Oakville Transit and York Region Transit.
- [36] In 2018, the Province introduced the Discounted Double Fare pilot program between Metrolinx (GO Transit and UP Express) and the TTC where transfer fares were discounted by 50 per cent of TTC fares. This program ended in March 2020.
- [37] TTC, Status Update – Fare Integration, November 22, 2023.
- [38] Actual and projected ridership reflects conventional transit services and does not include specialized transit services such as Peel Region TransHelp. Specialized transit refers to transit services that are operated for persons with disabilities.
- [39] Despite this growth, the total ridership for agencies participating in the One Fare program is expected to remain below the pre-pandemic peak of 696.2 million in 2018-19, largely due to the FAO’s projection for TTC ridership.
- [40] The FAO estimates approximately 70 per cent of Ontario Gas Tax Program funding is used for transit operations, while the remaining 30 per cent is used for transit capital expenses, based on an analysis of municipalities’ Financial Information Returns.
- [41] Municipalities’ shares of the total envelope are determined by a funding formula of 70 per cent ridership and 30 per cent population.
- [42] In addition to funding for municipal transit agencies, the Safe Restart Agreement included a second stream of funding for municipal government operating pressures, which is outside the scope of this report. For more information, see Safe Restart Agreement Response Letter: Premier of Ontario, October 7, 2020.
- [43] Phases 1 and 2 occurred in 2020-21, phase 3 occurred in 2021-22 and phase 4 occurred in 2022-23.
- [44] The Ontario-Toronto New Deal Agreement contains other funding commitments that are not directly related to transit operations. For more information, see Government of Ontario, Terms of the New Deal Between Ontario and Toronto, February 8, 2024. As part of the agreement, the Province, on behalf of Metrolinx, agreed to write off certain receivables due from the City of Toronto. This resulted in Metrolinx recording an operating expense of $118.1 million in 2023-24.
- [45] City of Toronto, Eglinton Crosstown Light Rail Transit: Train Operating & Funding Term Sheet, June 29, 2022; and City of Toronto, Finch West Light Rail Transit: Train Operating & Services Term Sheet, January 16, 2024.
- [46] ONTC, Northeastern Passenger Rail Service – Updated Initial Business Case, April 2022. The Northlander previously provided service along this route before closing in 2012.
- [47] Grey County, Community Transportation Grant Program FAQs Page. Accessed on June 1, 2024.
- [48] See 2024 Ontario Budget, p. 68.
- [49] Allocation of the MTEC subsidy to municipalities was calculated by using a modified version of the Ontario Gas Tax Program funding formula and included a $500 base funding amount per municipality.
- [50] City of Mississauga, Municipal Transit Enhanced Cleaning Program (MTEC) Funding Agreement, February 10, 2021.
- [51] An economic region refers to a grouping of census divisions, as defined by Statistics Canada.
- [52] Metrolinx’s base operating subsidy is distributed among the economic regions based on its regional ridership levels.
- [53] The ONTC’s subsidy is distributed among the economic regions based on its route stops and service levels. However, while ONTC bus routes include stops within the Toronto and Ottawa economic regions, these regions are excluded from the regional ONTC subsidy allocations to reflect that the ONTC operates primarily to serve Ontario’s Northern residents.
- [54] The FAO estimates London received $0.44 in subsidies per resident in 2022-23 due to Metrolinx’s London-GO pilot project that concluded in 2023.
- [55] The operating subsidy provided to Metrolinx associated with the administration of the PRESTO program is allocated based on the ridership of participating PRESTO agencies.