


1 | Introduction
On April 21, 2021, the Government of Ontario (the Province) tabled in the Legislative Assembly volume 1 of the 2021-22 Expenditure Estimates [1]. The 2021-22 Expenditure Estimates (or Estimates) sets out the fiscal year’s spending requirements for ministries and constitutes the government’s formal request to the legislature for approval to spend the amounts as detailed in the Estimates.
After tabling in the legislature, the Estimates were referred to the Standing Committee on Estimates (SCE). The SCE is mandated to consider the Estimates of between six and 12 ministries. For 2021-22, the SCE has selected the Estimates of the following ministries for review:
- Health
- Natural Resources and Forestry
- Long-Term Care
- Education
- Infrastructure
- Agriculture, Food and Rural Affairs
- Children, Community and Social Services
- Energy, Northern Development and Mines
- Indigenous Affairs
After the SCE completes its review of a ministry, the committee votes on the ministry’s Estimates. Once the review and voting process is completed for all selected ministries, the SCE must deliver a report to the legislature by the third Thursday in November [2]. The legislature then votes its agreement of the Estimates passed by the SCE, after which the Supply Bill is formally introduced. Passage of the Supply Bill provides the legislature’s approval to spend the amounts as detailed in the Estimates.
The purpose of this report is to support the SCE’s review of the Ministry of Education’s (EDU’s) 2021-22 Expenditure Estimates. The report begins with a financial overview of the ministry, focusing on education spending by Estimates categories and major program area. Next, the report reviews EDU’s spending plan in the 2021 Ontario Budget. In this chapter, the FAO:
- compares the ministry’s spending plan against the FAO’s projection;
- reviews the FAO’s spending assumptions by program area; and
- identifies time-limited spending related to the COVID-19 pandemic.
Lastly, the report reviews proposed 2021-22 spending by program and identifies spending trends and program changes.
2 | Ministry Overview
In the 2021-22 Expenditure Estimates, the Ministry of Education (EDU) is projected to spend $33.0 billion in the 2021-22 fiscal year. This is a decrease of $0.8 billion (2.3 per cent) from 2020-21 interim results reported in the 2021 Ontario Budget.
Figure 2-1 Projected Ministry of Education spending in 2020-21 and 2021-22, $ billions
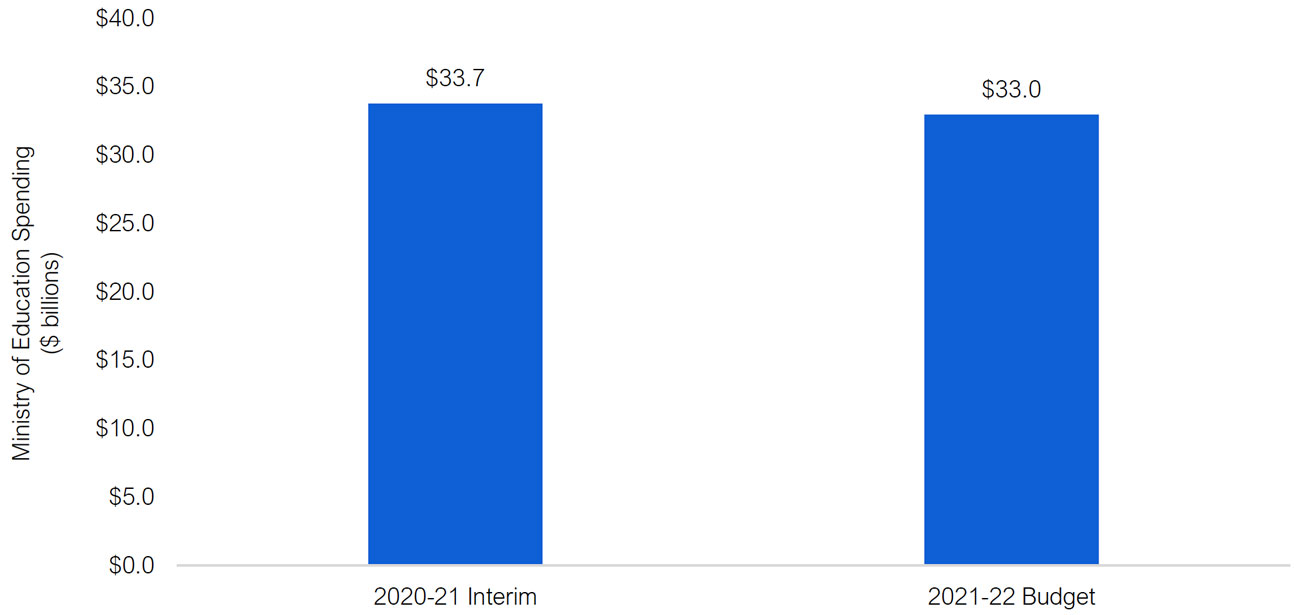
Note: Ministry of Education spending includes spending related to the Ontario Teachers’ Pension Plan (OTPP).
Source: 2021-22 Expenditure Estimates and the 2021 Ontario Budget.
Education Spending by Estimates Categories
The Ministry of Education’s 2021-22 spending plan of $33.0 billion is grouped into three broad categories in the Expenditure Estimates:
- $31.2 billion in ‘Supply Bill spending’ that is authorized annually by the legislature (known as spending ‘to be voted’);
- $1.6 billion in spending that is authorized by standalone legislation (known as ‘statutory spending’); and
- $0.1 billion in ‘other spending’, which mainly consists of spending related to revenues that are independently raised by school boards and other adjustments.
Supply Bill spending is divided into programs called votes, sub-programs called items, and then accounts. EDU has four votes, with the Elementary and Secondary Education Program being the largest at $28.9 billion or 88 per cent of total EDU spending. The next largest vote is the Child Care and Early Years Programs at $2.3 billion (seven per cent), while the remaining two program votes, the Community Services Information and Information Technology Cluster and the Ministry Administration Program, together comprise just 0.2 per cent of all EDU spending.
Statutory spending mainly consists of expenses related to the Ontario Teachers’ Pension Plan (OTPP), which accounts for $1.6 billion, or five per cent, of planned EDU spending in 2021-22. A small portion of statutory spending is for capital expenses, such as the amortization of EDU’s non-school board capital assets.
Other spending includes $1.1 billion for planned operating spending by school boards from non-provincial revenue sources (such as international student fees, donations and cafeteria income) and other adjustments. There is also a negative $0.9 billion other spending adjustment for school board capital. Investments in school board infrastructure assets, such as school buildings, are expensed over the life of the asset. This adjustment represents the change required to ensure that 2021-22 Ministry of Education spending reflects the amortization expense of school board infrastructure assets, rather than the investment in assets. [3]
| Vote | Program Name | 2021-22 Estimates ($ millions) |
Share of Total (%) |
| 1001 | Ministry Administration Program | 17 | < 1 |
| 1002 | Elementary and Secondary Education Program | 28,858 | 88 |
| 1003 | Community Services Information and Information Technology Cluster | 50 | < 1 |
| 1004 | Child Care and Early Years Programs | 2,288 | 7 |
| Total Supply Bill (Voted) Spending* | 31,212 | 95 | |
| Standalone legislation (statutory) expense – OTPP | 1,631 | 5 | |
| Standalone legislation (statutory) expense – other | 4 | < 1 | |
| Total Standalone Legislation (Statutory) Spending | 1,634 | 5 | |
| Other spending – school boards (operating)** | 1,064 | 3 | |
| Other spending – school boards (capital) | -929 | -3 | |
| Other spending – other agencies and consolidations | -28 | < -1 | |
| Total Other Spending | 106 | < 1 | |
| Total Ministry of Education Spending Plan | 32,953 | 100 |
Education Spending by Program Area
An alternative way to examine education spending is by program area, which aggregates different Estimates spending categories by spending purpose.
The chart below shows planned EDU spending in 2021-22 of $33.0 billion by major program area. The largest program area is school boards ($28.6 billion), which accounts for 87 per cent of planned EDU spending in 2021-22. The next largest program areas are child care ($2.3 billion) and the Ontario Teachers’ Pension Plan (OTPP) ($1.6 billion), which combined account for an additional 12 per cent of planned EDU spending in 2021- 22. The remaining program areas are ministry operations ($0.3 billion, one per cent) and other education programs ($0.2 billion, one per cent).
Figure 2-2 2021-22 Ministry of Education spending plan by program area, $ billions
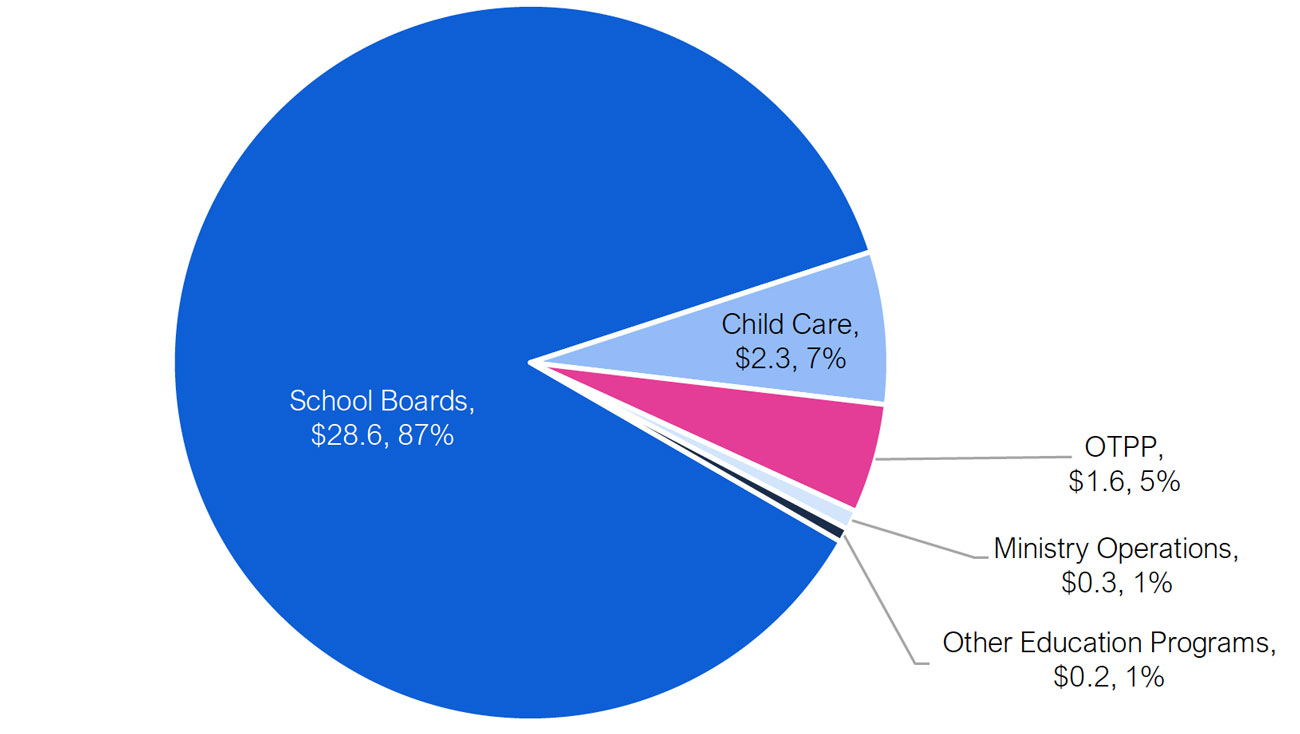
Source: FAO analysis of the 2021-22 Expenditure Estimates and information provided by the Ministry of Education.
Table 2-2 provides a description of each program area.
| Program Area | Description |
| School Boards | The school boards program area represents total spending by the Province’s 72 school boards to administer elementary and secondary education.* The primary funding source for school boards is the Grants for Student Needs program, which includes funding for teachers, classroom supplies, school administration and specific priorities such as special education, student transportation, mental health and Indigenous education. The school boards program area also includes the net amortization expense for school board infrastructure assets.** |
| Child Care | The child care program area includes transfer payments to Consolidated Municipal Service Managers (CMSMs) and District Social Services Administration Boards (DSSABs) for the administration of child care. It also includes funding for the Childcare Access and Relief from Expenses (CARE) tax credit, and spending on other programs, including First Nations child care and EarlyON Child and Family Centres. |
| Ontario Teachers’ Pension Plan | The Province and the Ontario Teachers’ Federation (OTF) are joint sponsors of the Ontario Teachers’ Pension Plan (OTPP). OTPP spending represents the projected change in the provincial share of the OTPP liability for the year, net of returns on the plan’s assets. |
| Ministry Operations | Ministry operations includes spending to support the administration of the ministry, such as financial and administrative services, human resources, and communications and legal services. It also includes spending on salaries, wages and benefits for ministry staff and services to develop and provide operational support for education and child care programs, as well as information technology services. |
| Other Education Programs | Other education programs includes spending on non-school board education agencies and other third parties including TVOntario (TVO), Télévision française de l’Ontario (TFO) and the Education Quality and Accountability Office (EQAO). It also includes negative adjustments for education spending connected to colleges and hospitals. Corresponding positive adjustments are included with the Ministry of Colleges and Universities and the Ministry of Health. |
Comparing Education Spending by Program Area and Estimates Source
Table 2-3 identifies the Estimates funding source for each program area.
| Program Area | Projected Spending | Estimates Source |
| School Boards | $28.6 billion | Vote-Item 1002-1: $25.9 billion |
| Vote-Item 1002-3: $2.5 billion | ||
| Other Spending: $0.1 billion | ||
| Child Care | $2.3 billion | Vote-Item 1004-1: $2.3 billion |
| Vote-Item 1004-2: < $0.1 billion | ||
| Statutory: < $0.1 billion | ||
| Ontario Teachers’ Pension Plan | $1.6 billion | Statutory: $1.6 billion |
| Ministry Operations | $0.3 billion | Vote-Item 1001-1: < $0.1 billion |
| Vote-Item 1002-1: $0.1 billion | ||
| Vote-Item 1002-2: $0.1 billion | ||
| Vote-Item 1003-1: < $0.1 billion | ||
| Vote-Item 1004-1: < $0.1 billion | ||
| Statutory: < $0.1 billion | ||
| Other Education Programs | $0.2 billion | Vote-Item 1002-1: $0.2 billion |
| Vote-Item 1002-2: $0.1 billion | ||
| Vote-Item 1002-3: < $0.1 billion | ||
| Statutory: < $0.1 billion | ||
| Other Spending: < -$0.1 billion |
3 | Spending Plan Analysis
This chapter reviews the 2021 Ontario Budget’s spending plan for the Ministry of Education.[4] The chapter begins with a comparison of the ministry’s spending plan against the FAO’s projection. Next, the FAO explains its spending outlook by program area. Finally, the FAO identifies time-limited spending related to the COVID-19 pandemic that is included in EDU’s spending plan.
Education Spending Outlook
In the 2021 Ontario Budget, the Province projects that Ministry of Education spending will grow at an average annual rate of 1.2 per cent from 2019-20 to 2029-30, reaching $35.7 billion in 2029-30. In contrast, based on current program design and commitments, the FAO projects that EDU spending will grow by an average annual rate of 2.0 per cent, reaching $38.6 billion by 2029-30.[5] There is a spending gap between the FAO’s projection and the ministry’s spending plan of $0.2 billion in 2021-22 and $0.6 billion in 2023-24. Over the recovery period,[6] the spending gap increases each year, reaching $2.9 billion in 2029-30. Overall, the cumulative Ministry of Education spending gap from 2021-22 to 2029-30 between the FAO’s forecast and the Province’s 2021 budget spending plan is $12.3 billion.
Figure 3-1 Ministry of Education spending, FAO projection vs. 2021 Ontario Budget projection, $ billions
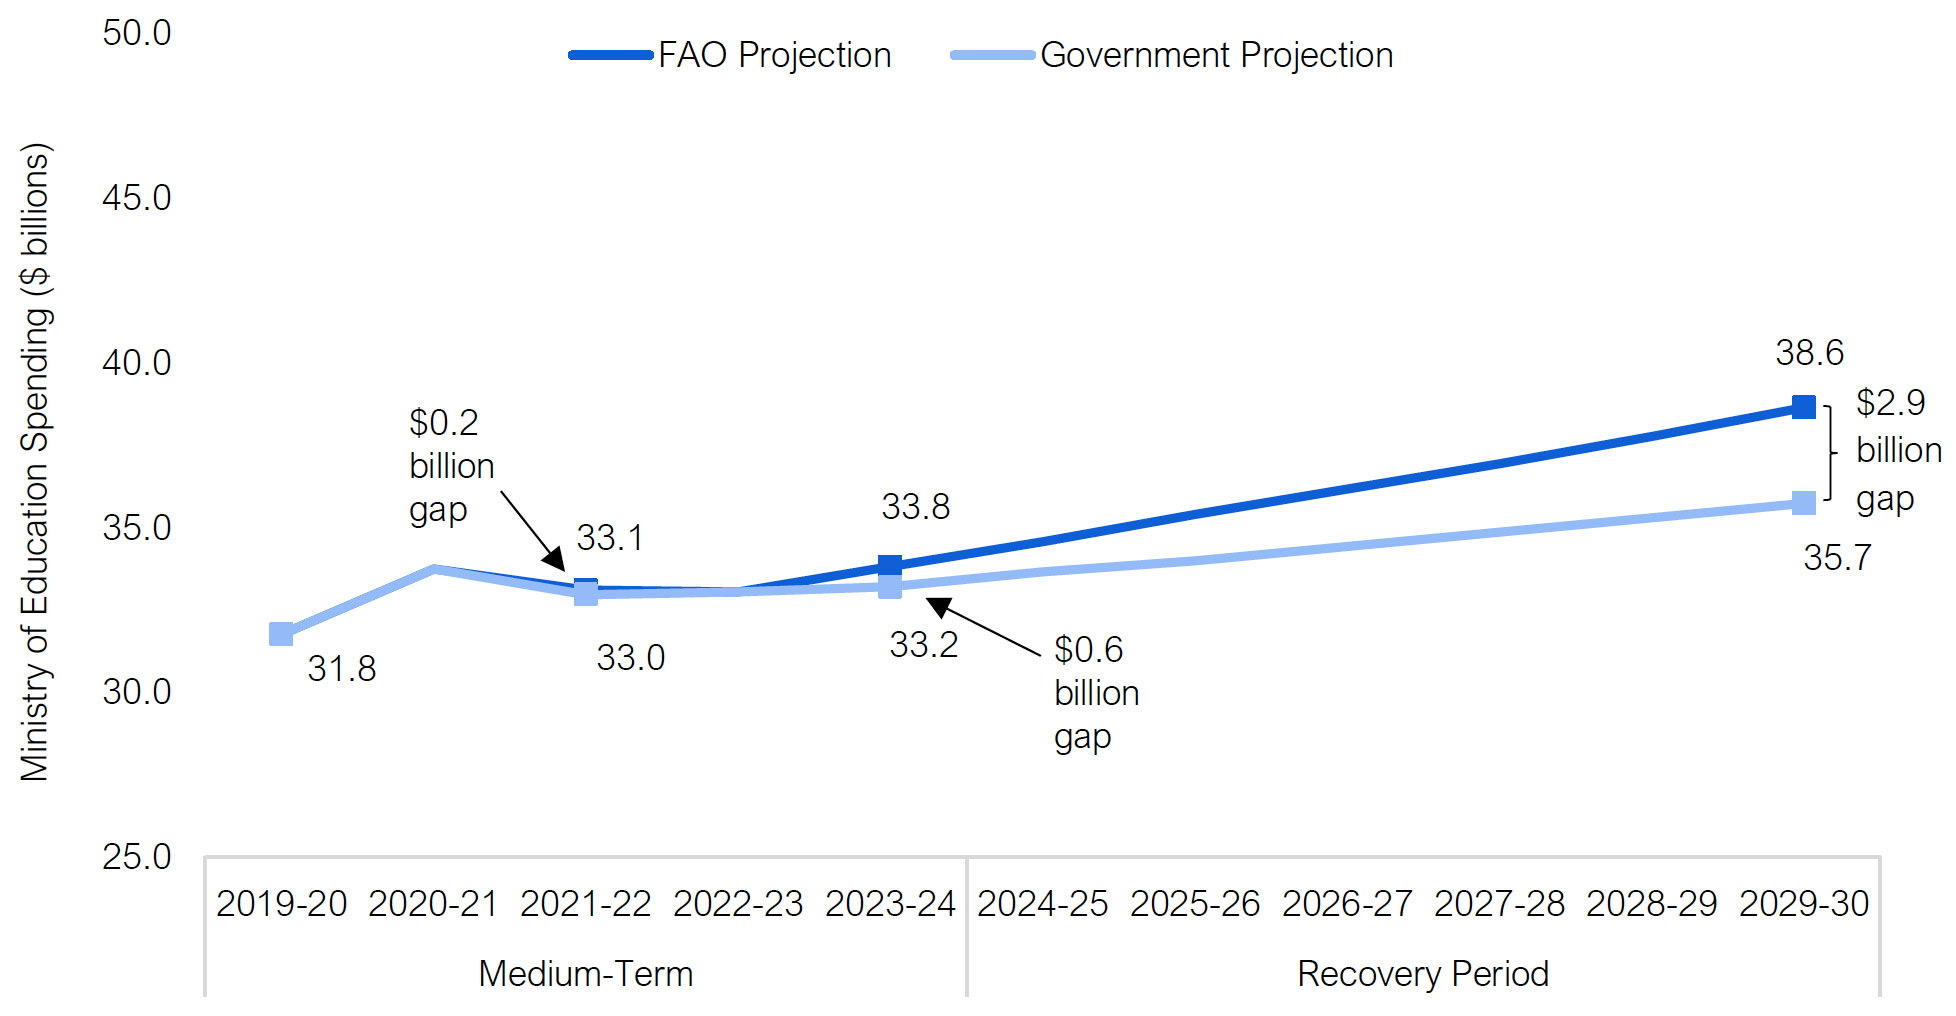
Note: The ‘recovery period’ represents the period in the 2021 Ontario Budget during which the government plans to achieve a balanced budget. The FAO and 2021 Ontario Budget projections include projected spending for the Ontario Teachers’ Pension Plan (OTPP).
Source: 2019-20 Public Accounts of Ontario, 2021 Ontario Budget and FAO analysis of provincial information.
Medium term: In 2021-22, the FAO’s projection for Ministry of Education spending is $0.2 billion higher than the 2021 budget spending plan, mainly due to new COVID-19-related spending for school boards that was announced in May 2021, after the 2021 budget was released.[7] The FAO expects that the ministry will be able to fund a portion of this new spending from its existing allocation, leaving a pressure of $0.2 billion that will likely require a spending plan increase during the 2021-22 fiscal year.
In 2022-23, the FAO’s projection for ministry spending is consistent with the 2021 budget spending plan; however, there is a gap of $0.6 billion in 2023-24. In 2023-24, the Province plans to increase education spending by 0.5 per cent, while the FAO projects education spending will increase by 2.3 per cent. As noted in the previous chapter, 94 per cent of ministry spending is for school boards and child care. Given annual projected increases in school enrolment and compensation costs, and the Province’s commitment to add up to 30,000 new child care spaces by 2023-24, it will not be possible to increase education spending in 2023-24 by only 0.5 per cent, unless the Province introduces program changes that reduce costs.
Recovery period: The Province plans to grow education spending by an average annual rate of 1.2 per cent from 2023-24 to 2029-30. In contrast, based on the FAO’s review of ministry programs and commitments, the FAO projects education spending will grow by 2.3 per cent, which is almost double the government’s planned growth rate. As a result, the FAO estimates that the Province’s spending plan has a $2.9 billion shortfall by 2029-30. This means that the Province will need to increase funding to the education sector or new spending restraint measures will need to be introduced.
Education Spending Outlook by Program Area
From 2019-20 to 2029-30, the FAO projects Ministry of Education spending will grow at an average annual rate of 2.0 per cent. Projected spending growth varies by program area. School board spending is projected to increase at an average annual rate of 2.3 per cent, while spending on the Ontario Teachers’ Pension Plan and ministry operations is projected to grow by 2.1 per cent and 1.9 per cent, respectively. Over the 10-year period, child care spending is projected to grow by an average of 0.8 per cent each year, while the other education programs category is projected to decline by an average annual rate of 12.1 per cent, largely due to the end of time-limited spending in 2019-20.
| Program Area | Average Annual Growth Rate (%) 2019-20 to 2029-30 |
| School Boards | 2.3 |
| Child Care | 0.8 |
| Ontario Teachers’ Pension Plan | 2.1 |
| Ministry Operations | 1.9 |
| Other Education Programs | -12.1 |
| Total Ministry of Education | 2.0 |
The following sections identify key FAO education spending growth assumptions by program area.
School Boards
Spending by school boards, which comprises approximately 87 per cent of total ministry spending, is projected to grow by an average annual rate of 2.3 per cent from 2019-20 to 2029-30.
The largest component of school boards spending is compensation, which comprises about 82 per cent of all school boards operating spending. Growth in compensation is driven by enrolment levels, which impact the overall number of teachers and other employees, and wage increases, which are largely negotiated through collective bargaining agreements. The FAO projects enrolment will increase at an average annual rate of approximately 0.6 per cent between 2019-20 and 2029-30. Assuming that current class size ratios are maintained to 2029-30, the FAO projects that staff levels will increase by a similar 0.6 per cent per year over the 10 years.[8]
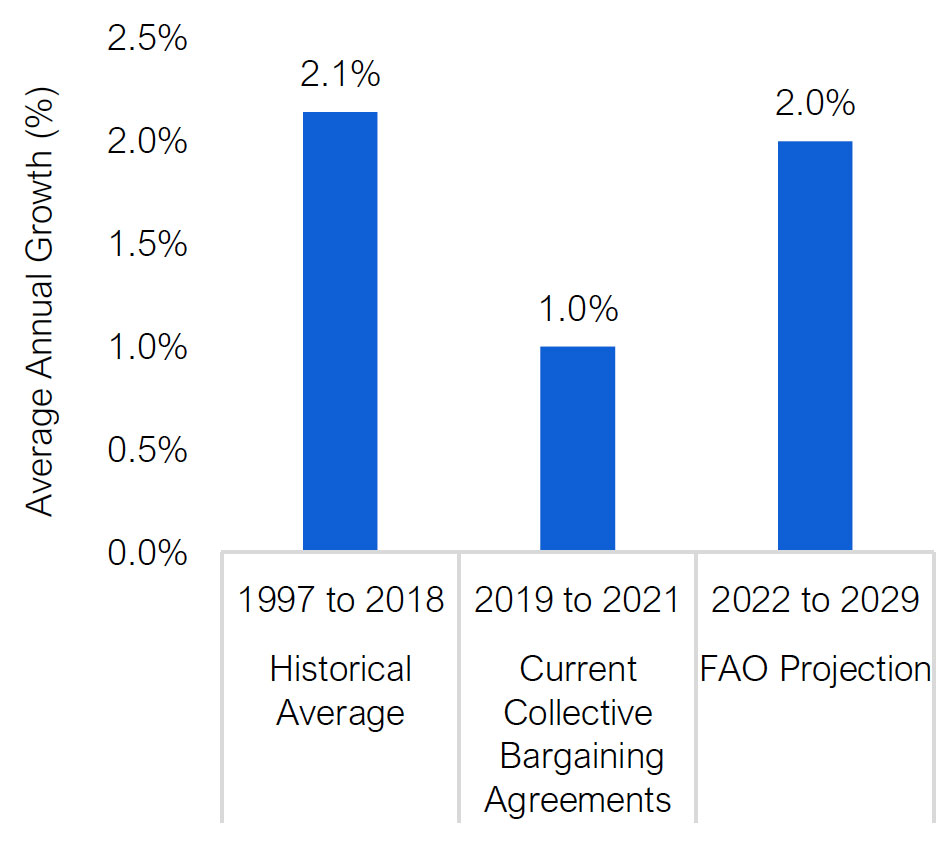
Under provincial legislation,[9] annual wage increases for public sector employees are capped at one per cent for a three-year period. This cap is reflected in the collective agreements of nearly 280,000 teachers and other educational staff, which are scheduled to expire on August 31, 2022.[10] The FAO’s projection assumes 2.0 per cent wage increases after the current collective agreements expire, which is in line with historical wage growth for education sector workers and projected inflation.[11]
Figure 3-2 Annual school-aged population growth, historical and projected
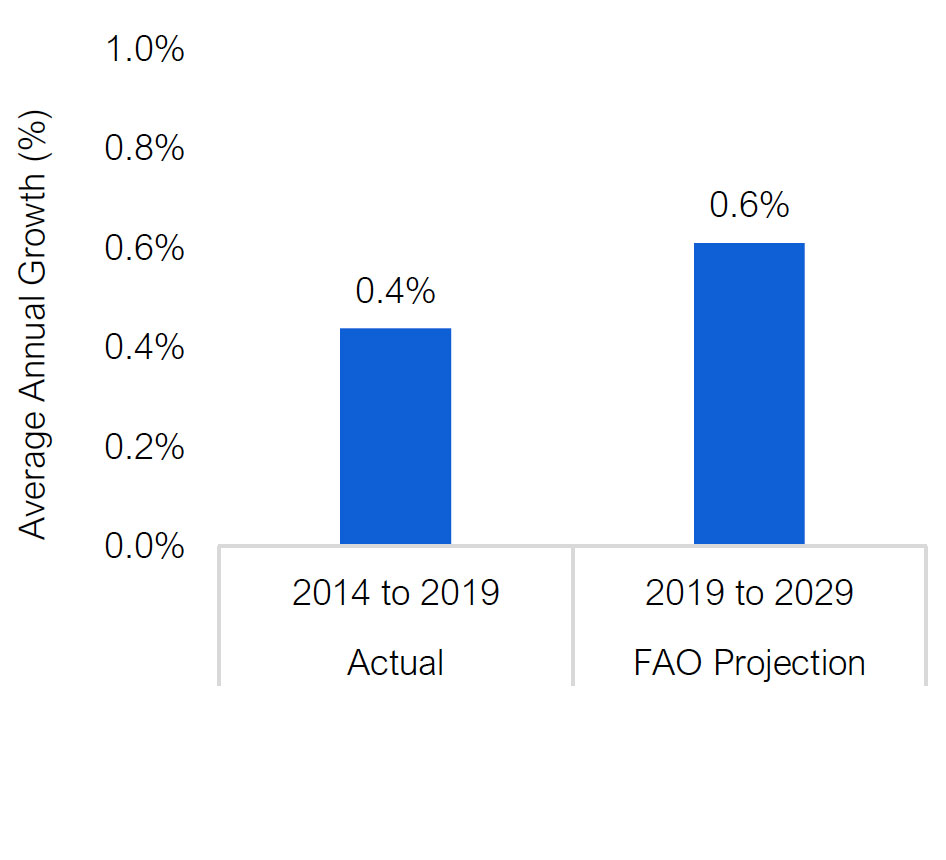
Source: FAO analysis of information provided by the Ministry of Finance and Statistics Canada.
Figure 3-3 Education workers’ annual wage growth, historical and projected
Source: FAO analysis of information provided by the Province and Statistics Canada’s Labour Force Survey.
For non-compensation operating expenses, the FAO assumes 1.5 per cent average annual growth, which is below projected inflation. The FAO’s assumption reflects historical spending growth on classroom supplies and school facilities services.
The FAO’s forecast also includes announced policy changes, including the introduction of the Supports for Students Fund in 2020-21[12] and a reduction to the funding formula for secondary education teachers as the Province phases in two mandatory online learning courses for secondary students.[13]
Finally, the FAO expects that school boards capital spending, or the amortization expense for school board infrastructure assets, will increase at an average annual rate of 3.0 per cent. This is based on the amortization profile of school boards’ infrastructure assets and the Province’s 10-year infrastructure plan in the 2021 Ontario Budget of $21.2 billion for education.[14]
Child Care
The FAO projects child care spending will grow at an average annual rate of 0.8 per cent from 2019-20 to 2029-30. The child care program area consists of two main components: transfer payments to municipal service managers to support subsidized child care spaces and the Childcare Access and Relief from Expenses (CARE) tax credit.
Transfer Payments to Municipal Service Managers
In 2019-20, the Province transferred $1.6 billion to Consolidated Municipal Service Managers and District Social Services Administration Boards (collectively, municipal service managers), to support child care operators and subsidize child care spaces for parents. In 2019-20, the FAO estimates that there were 86,800 fully subsidized and 59,200 partially subsidized child care spaces, which represents a combined 30 per cent of all spaces in licensed child care centres and homes.[15]
Overall, from 2019-20 to 2029-30, the FAO projects that child care transfer payments to municipal service managers will increase by an average annual rate of 1.2 per cent. However, from 2019-20 to 2023-24, transfers to municipal service managers will decline by an average of 0.5 per cent each year, as previously announced changes to cost sharing agreements with municipalities are implemented.[16] After 2023-24, the FAO projects child care transfer payments will increase by 2.4 per cent each year, which reflects the ministry’s base child care funding policies and the Province’s plan to create up to 30,000 new child care spaces.
Figure 3-4Child care transfer payments to municipal service managers, $ millions
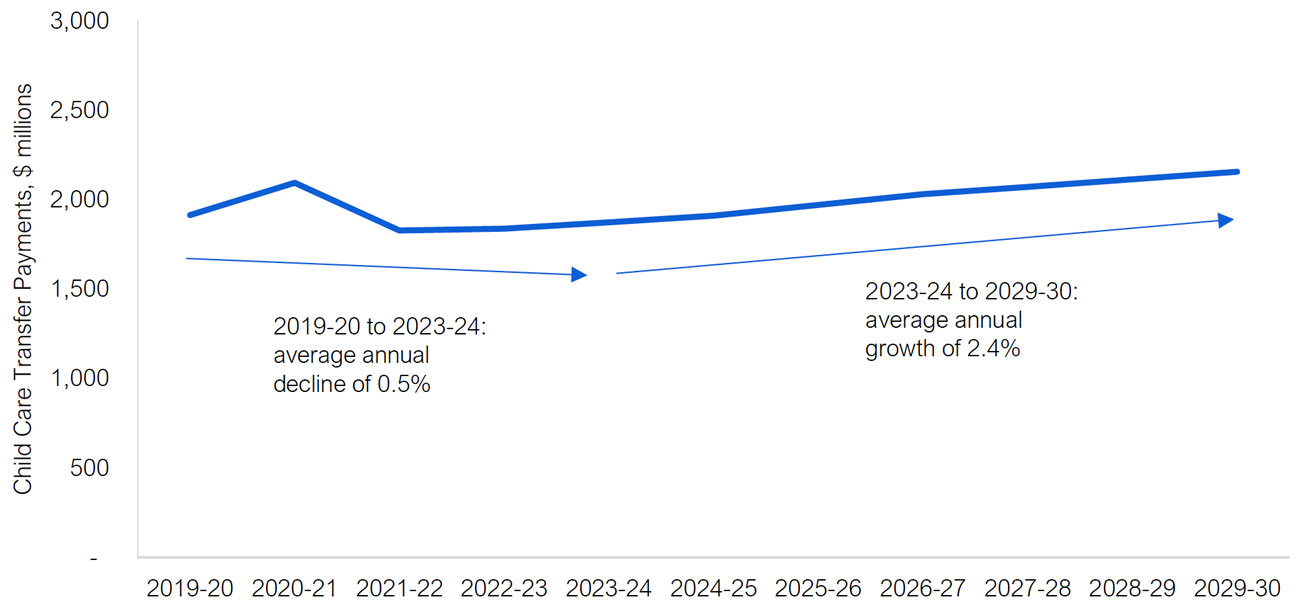
Source: 2019-20 Public Accounts of Ontario and FAO analysis of provincial information.
The following reviews the three main components of the FAO’s forecast:
Base child care transfer payment: The Province has discretion over annual changes to base child care transfer payment spending and, every year, it provides municipal service managers with funding envelopes and publishes child care funding guidelines. The FAO estimates that the Province’s base child care transfer payment has grown at an average annual rate of 1.2 per cent from 2010-11 to 2019-20, below the rate of inflation and growth in the child-age population. Given this trend, the FAO projects that base child care transfer payment spending will grow at 1.1 per cent a year, continuing the trend of below cost-driver growth.
Expansion plan for 30,000 new child care spaces: In the 2019 Ontario Budget, the Province committed to create up to 30,000 new child care spaces in schools by 2023-24.[17] As of 2021, the ministry reports that 20,807 spaces are approved or constructed, leaving 9,200 spaces remaining to be allocated for the government to meet its target by 2023-24. However, since the FAO’s last report in 2019,[18] progress has been limited, with only 800 additional spaces being approved or constructed. Given that it takes an average of three to five years from the date of approval to complete new child care spaces in schools,[19] the FAO assumes that the full 30,000 spaces will not be completed until 2026-27. At full implementation, the FAO estimates that the ministry’s annual spending to support the 30,000 new child care spaces will be $283 million.
Funding cuts to child care spending: Finally, in 2019, the Province announced a number of funding cuts to child care program spending. The first change, which was implemented on January 1, 2020, required that municipalities fund 20 per cent of the operating costs for the new child care spaces, compared to the previous commitment that the Province would fund 100 per cent of the costs. The second change, effective January 1, 2021, reduced the Province’s contribution to municipal child care administration spending, including wage enhancement administration, to 50 per cent.[20] Finally, the Province plans to reduce the amount of child care program funding that municipal service managers can allocate to administration costs from 10 per cent to five per cent, effective January 1, 2022. In total, the FAO estimates that these changes will save the Province nearly $134 million annually by 2022-23, growing to $160 million by 2026-27.
Childcare Access and Relief from Expenses (CARE) Tax Credit
The CARE tax credit is a refundable tax credit designed to offset a portion of the cost of child care for “working families, particularly families with low and moderate incomes.”[21] In 2019-20, CARE tax credit spending was $488 million.[22] However, in 2020-21, child care utilization is estimated to have declined by about 40 per cent,[23] resulting in CARE tax credit spending dropping to $303 million.
Over the medium term, the FAO estimates that child care utilization will recover to pre-pandemic levels by 2022-23, consistent with the FAO’s projection for employment growth,[24] resulting in CARE tax credit spending of $470 million in 2022-23. However, over the long term, the FAO estimates that CARE tax credit spending will decline by an average annual rate of 1.0 per cent from 2023-24 to 2029-30. The gradual decline in the cost of the CARE tax credit is due to its design. The calculation of the CARE tax credit benefit is income tested based on family income, which is not indexed to inflation. Consequently, as family incomes increase with inflation, the overall number of families that are eligible to receive the CARE tax credit will decline, as will the average benefit amount that eligible families receive. Overall, the FAO estimates that the number of families that receive the CARE tax credit will decrease from about 310,000 in 2019-20 to 280,000 in 2029-30.
All Other Programs
For the remaining three program areas, the FAO projects that from 2019-20 to 2029-30:
- Ontario Teachers’ Pension Plan (OTPP) spending will grow at an average annual rate of 2.1 per cent, based on FAO calculations from information provided by EDU as well as historic trends.
- Ministry operations spending will increase at an average annual rate of 1.9 per cent, in line with the FAO’s inflation projection.
- Other education programs spending will decline at an average annual rate of 12.1 per cent, largely due to the elimination of two time-limited programs that provided direct payments to families in 2019-20:
- The Support for Parents program, which provided payments to address school closures related to teacher strikes.
- The Support for Families program, which provided payments in response to COVID-19-related school closures.
Time-Limited COVID-19 Spending
The FAO estimates that from 2019-20 to 2022-23, the Ministry of Education’s spending plan includes a total of $4.8 billion for time-limited measures in response to the COVID-19 pandemic. The majority of the COVID-19-related spending, $3.4 billion, occurred in 2020-21. The ministry also spent $0.4 billion in 2019-20 and is projected to spend $0.9 billion in 2021-22 and $46 million in 2022-23. In contrast, the 2021 budget reported Ministry of Education time-limited spending related to the COVID-19 pandemic of zero in 2019-20, $1.6 billion in 2020-21 and $59 million in 2021-22, which is significantly less than the FAO’s estimates.
Figure 3-5Ministry of Education spending related to the COVID-19 pandemic, 2019-20 to 2022-23, $ millions
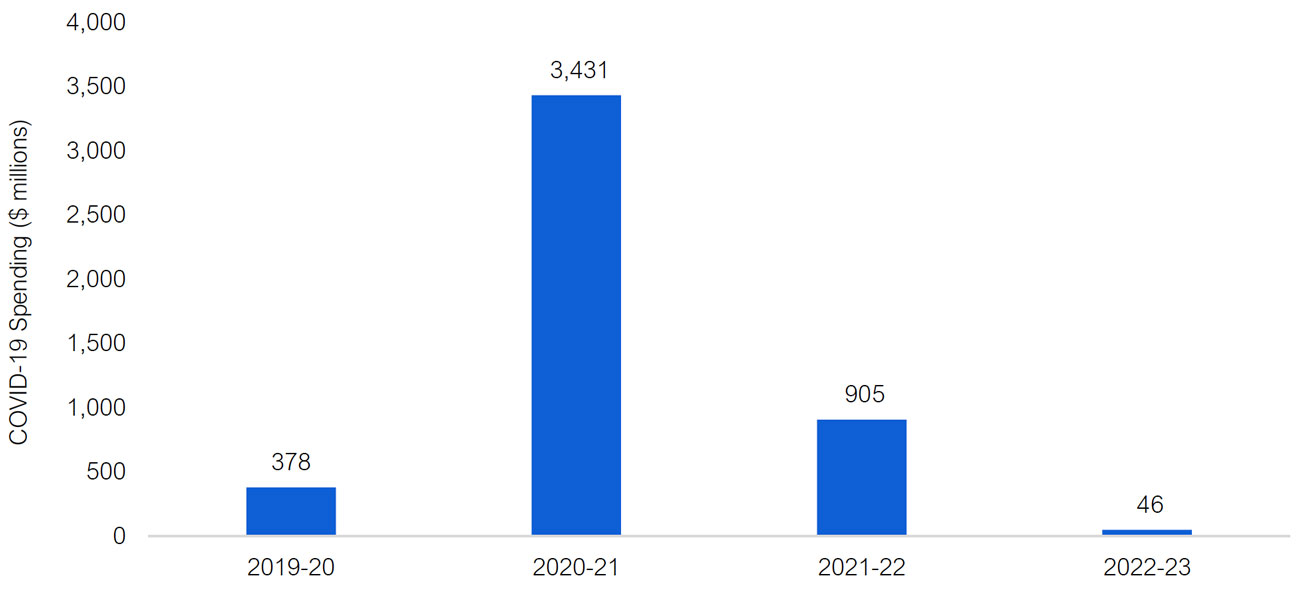
Source: FAO calculations based on information provided by the Ministry of Education, Treasury Board Secretariat and other publicly available information, including the 2021 Ontario Budget.
On May 4, 2021, the Province announced that the government is “making more than $1.6 billion available” in COVID-19-related funds for the 2021-22 school year.[25] Of the $1.6 billion in COVID-19-related supports, the FAO estimates that only $623 million will be spent by the Ministry of Education, with $576 million in 2021-22 and $46 million in 2022-23. The $1.6 billion commitment also includes up to $536 million for PPE procurement and school-focused nurses that will be funded by other ministries. The remaining $478 million in announced funding will only be committed in the second half of the 2021-22 school year, if necessary, depending on the status of the COVID-19 pandemic. Given that the remaining $478 million has not yet been committed, the FAO has excluded this funding from its total estimate of Ministry of Education COVID-19-related spending.
Table 3-2 shows the $4.8 billion in COVID-19-related spending from 2019-20 to 2022-23 by the recipient of support and provides further information.
| Recipients | Description | FAO Estimated Total COVID-19 Spending ($ millions) |
| School Boards |
|
1,602 |
| School Boards – Reserve Funds |
|
659 |
| Transfers to Parents |
|
1,848 |
| Child Care |
|
463 |
| Other Organizations |
|
189 |
| Total | 4,760 |
4 | Program Review
This chapter reviews requested and projected spending for the Ministry of Education’s 2021-22 Expenditure Estimates by program vote (Supply Bill spending), standalone legislation (statutory) spending, and other spending (consolidation and other adjustments).
Note: “2020-21 Projected Spending” represents the interim spending forecast for 2020-21 from the 2021 Ontario Budget. The FAO will provide updated 2020-21 spending results in its upcoming Expenditure Monitor report for the fourth quarter of 2020-21.
Vote 1001 – Ministry Administration Program
The Ministry Administration Program supports the delivery of all programs and services offered by EDU. The total spending request for Vote 1001 is down $5 million, or 23 per cent, versus 2020-21 projected spending. The decrease this year is mostly attributed to lower services spending.[26]
| Item | Ministry Administration Program (Vote 1001) |
2020-21 Projected Spending ($ millions) |
2021-22 Estimates ($ millions) |
1 Year Change ($ millions) |
1 Year Growth (%) |
| 1 | Ministry Administration | ||||
| Salaries, Wages and Employee Benefits | 16 | 15 | -1 | -4.3 | |
| Services | 11 | 5 | -6 | -56.3 | |
| Other Spending | -5 | -3 | 2 | 34.3 | |
| Total Supply Vote | 22 | 17 | -5 | -23.0 |
Vote 1002 – Elementary and Secondary Education Program
The Elementary and Secondary Education Program provides financial support to school boards, schools and agencies in Ontario. At $28.9 billion, Vote 1002 accounts for 88 per cent of planned EDU spending in 2021-22. The overall spending request for Vote 1002 is down by $1.0 billion, or 3.4 per cent, compared to 2020-21 projected spending. There are three main sub-programs (items) in Vote 1002:
- Policy and Program Delivery ($26.2 billion), which funds school boards, largely through the School Board Operating Grants and the Education Property Tax Non-Cash Expense (combined, known as Grants for Student Needs), as well as third party organizations.
- Educational Operations ($0.1 billion), which primarily provides transfer payments to agencies, including Office des télécommunications éducatives de langue française de l’Ontario (TFO) ($25 million) and the Ontario Education Communications Authority (TVO) ($43 million).
- Support for Elementary and Secondary Education ($2.5 billion), which provides funding for school board capital projects including rehabilitation, repairs, new buildings and child care spaces.
Significant changes in the 2021-22 spending plan under Vote 1002 include:
- A combined $465 million increase in planned spending for School Board Operating Grants and Education Property Tax Non-Cash Expense, which together fund the Grants for Students Needs. This represents a 1.8 per cent increase from last year’s projected spending, which reflects negotiated salary increases and higher elementary and secondary school enrolment.
- A combined $2.5 billion decrease in planned funding for school boards and third parties under the Priorities and Partnership Fund (PPF):
- $909 million (83.6 per cent) decrease in Priorities and Partnerships Funding – School Boards, as a result of time-limited COVID-19-related spending in 2020-21 (includes $650 million in federal Safe Return to Class funding).
- $1,606 million (93.5 per cent) decrease in Priorities and Partnerships Funding – Third Parties, as a result of time-limited COVID-19-related spending in 2020-21 (includes the Support for Learners program and the Ontario COVID-19 Child Benefit).
- A combined $1.0 billion increase in planned spending on school board infrastructure through the Support for Elementary and Secondary Education sub-program:
- $348 million (25.9 per cent) increase in the School Board Capital Grants transfer payment.
- $657 million in new funding for the Investing in Canada Infrastructure Program (ICIP) transfer payment. This program is intended to fund ventilation projects that improve air quality in classrooms, water bottle refilling stations to improve access to safe drinking water, broadband infrastructure to facilitate remote learning, and space reconfigurations to increase physical distancing.[27] Of this funding, $525 million will be provided by the federal government through the COVID-19 Resilience stream of the ICIP.
| Item | Elementary and Secondary Education Program Vote 1002 |
2020-21 Projected Spending ($ millions) |
2021-22 Estimates ($ millions) |
1 Year Change ($ millions) |
1 Year Growth (%) |
| 1 | Policy and Program Delivery | ||||
| Priorities and Partnerships Funding – School Boards | 1,088 | 178 | -909 | -83.6 | |
| Priorities and Partnerships Funding – Third Parties | 1,717 | 111 | -1,606 | -93.5 | |
| School Board Operating Grants | 17,897 | 18,199 | 302 | 1.7 | |
| Education Property Tax Non-Cash Expense | 7,333 | 7,497 | 164 | 2.2 | |
| Provincial Benefits Trusts | < 1 | < 1 | 0 | 0.0 | |
| Official Languages Projects | 52 | 42 | -10 | -18.5 | |
| Education Quality and Accountability Office | 32 | 28 | -3 | -10.5 | |
| Partner Sustainability Grants | 2 | 3 | 1 | 60.2 | |
| Salaries, Wages and Employee Benefits | 77 | 84 | 7 | 8.7 | |
| Services | 32 | 24 | -8 | -25.2 | |
| Other Spending | 20 | 18 | -2 | -9.5 | |
| Total Item | 28,250 | 26,185 | -2,066 | -7.3 | |
| 2 | Educational Operations | ||||
| Payments in lieu of municipal taxation | < 1 | < 1 | 0 | 0.0 | |
| Provincial Schools Student Enhancement Program | < 1 | < 1 | 0 | 0.0 | |
| Office des télécommunications éducatives de langue française de l’Ontario (TFO) | 25 | 25 | 0 | 0.0 | |
| Ontario Education Communications Authority (TVO) | 43 | 43 | 0 | 0.0 | |
| Salaries, Wages and Employee Benefits | 48 | 52 | 4 | 9.0 | |
| Services | 15 | 16 | 1 | 6.1 | |
| Other Spending | 5 | 5 | 0 | 0.0 | |
| Total Item | 136 | 141 | 5 | 3.9 | |
| 3 | Support for Elementary and Secondary Education | ||||
| Climate Action Incentive Fund (CAIF) | 27 | 14 | -12 | -46.2 | |
| Investing in Canada Infrastructure Program (ICIP) | 0 | 657 | 657 | ||
| Priorities and Partnerships Funding – School Boards | 0 | 20 | 20 | ||
| School Board Capital Grants | 1,344 | 1,692 | 348 | 25.9 | |
| Early Learning Program | 14 | 22 | 8 | 56.3 | |
| School Board – Capital Funding for Child Care | 106 | 117 | 11 | 10.5 | |
| Office des télécommunications éducatives de langue française de l’Ontario (TFO) | 1 | 1 | 0 | 0.0 | |
| Ontario Education Communications Authority (TVO) | 2 | 2 | 0 | 0.0 | |
| Other Spending | 2 | 9 | 7 | 330.6 | |
| Total Item | 1,494 | 2,532 | 1,038 | 69.5 | |
| Total Supply Vote | 29,880 | 28,858 | -1,022 | -3.4 |
Vote 1003 – Community Services Information and Information Technology Cluster
The Community Services Information and Information Technology Cluster supports four ministries[28] in digital asset management and services. Overall, the $50 million spending request for Vote 1003 is down $3 million, or 5.5 per cent, versus last year’s projected spending. The $16 million (30.4 per cent) increase in planned services spending is offset by a decrease of $18 million (51.4 per cent) in other spending, which includes recoveries from other ministries.[29] Planned salaries, wages and employee benefits spending is down $1 million or 2.5 per cent.
| Item | Community Services Information and Information Technology Cluster (Vote 1003) |
2020-21 Projected Spending ($ millions) |
2021-22 Estimates ($ millions) |
1 Year Change ($ millions) |
1 Year Growth (%) |
| 1 | Community Services Information and Information Technology Cluster | ||||
| Salaries, Wages and Employee Benefits | 35 | 34 | -1 | -2.5 | |
| Services | 51 | 67 | 16 | 30.4 | |
| Other Spending | -34 | -52 | -18 | -51.4 | |
| Total Supply Vote | 52 | 50 | -3 | -5.5 |
Vote 1004 – Child Care and Early Years Programs
The Child Care and Early Years Programs provides funding for child care programs and services, including the Childcare Access and Relief from Expenses (CARE) tax credit.[30] At $2.3 billion, Vote 1004 accounts for 6.9 per cent of total Ministry of Education planned spending in 2021-22. Compared to 2020-21 projected spending, the overall spending request for Vote 1004 is down by $129 million, or 5.3 per cent. There are two main sub-programs (items) in Vote 1004:
- Policy Development and Program Delivery ($2.3 billion)
- Child Care Capital ($10 million)
Significant changes in the 2021-22 spending plan under Vote 1004 include:
- A $127 million (42.0 per cent) increase for the CARE tax credit, which is estimated by the Province to cost $430 million in 2021-22. The increase is the result of lower spending in 2020-21 from a decline in child care utilization during the COVID-19 pandemic and a temporary 20 per cent enhancement to the tax credit for 2021.
- A $267 million (12.8 per cent) decrease in the Child Care and Early Years transfer payment. The decrease is largely due to time-limited spending related to the COVID-19 pandemic in 2020-21 (includes federal funding under the Safe Restart Agreement and provincial spending on child care for essential workers).
- A $10 million increase in the Child Care and Early Years Capital transfer payment. This program had a $10 million budget in 2020-21 that was not spent, resulting in the year-over-year change.
| Item | Child Care and Early Years Programs (Vote 1004) |
2020-21 Projected Spending ($ millions) |
2021-22 Estimates ($ millions) |
1 Year Change ($ millions) |
1 Year Growth (%) |
| 1 | Policy Development and Program Delivery | ||||
| Ontario Child Care Tax Credit | 303 | 430 | 127 | 42.0 | |
| Child Care and Early Years | 2,094 | 1,827 | -267 | -12.8 | |
| Salaries, Wages and Employee Benefits | 16 | 15 | -2 | -10.8 | |
| Services | 3 | 6 | 3 | 92.3 | |
| Other Spending | < 1 | < 1 | 0 | 0.0 | |
| Total Item | 2,417 | 2,278 | -139 | -5.7 | |
| 2 | Child Care Capital | ||||
| Child Care and Early Years Capital | 0 | 10 | 10 | ||
| Total Item | 0 | 10 | 10 | ||
| Total Supply Vote | 2,417 | 2,288 | -129 | -5.3 |
Standalone Legislation (Statutory) Spending
Standalone legislation (i.e., spending authorized by legislation other than the Supply Bill) primarily consists of $1.6 billion in planned spending for the Ontario Teachers’ Pension Plan (OTPP), which is $23 million (1.4 per cent) higher than 2020-21 projected spending. A small portion of statutory spending is for capital expenses, such as the amortization of EDU’s non-school board capital assets.
| Statutory Spending | 2020-21 Projected Spending ($ millions) |
2021-22 Estimates ($ millions) |
1 Year Change ($ millions) |
1 Year Growth (%) |
| Ontario Teachers’ Pension Plan | 1,608 | 1,631 | 23 | 1.4 |
| Amortization | 3 | 4 | 1 | 39.2 |
| Bad Debt Expense | < 1 | < 1 | < -1 | -96.1 |
| Salaries | < 1 | < 1 | 0 | 0.0 |
| Total Statutory Spending | 1,610 | 1,634 | 24 | 1.5 |
Other Spending
The financial results of government organizations controlled by the Province, including school boards and certain provincial agencies, are consolidated into the financial results of the Province. Adjustments are made through ‘other spending’ to account for spending by school boards from sources other than transfer payments from the Province. Net capital adjustments are also made to reflect amortization expenses, largely for school board infrastructure. Total ‘other spending’ is projected to increase by $346 million versus last year.
Other spending (operating), at $1.0 billion, is up $1.3 billion (523.0 per cent) compared to projected spending in 2020-21. The large year-over-year change is due to the Schools adjustment, which reflects spending by school boards.[31] The $1.3 billion (845.1 per cent) increase in the school boards spending adjustment reflects:
- A $547 million increase due to a timing difference between when COVID-19-related funding was received and spent. This includes $345 million in COVID-19-related funds received by school boards in the 2020-21 fiscal year but not spent and $202 million in additional spending in 2021-22.
- School board spending of own-source revenues is expected to increase by $451 million in 2021-22.
- The ministry informed the FAO that there are a greater number of teaching days in the 2021-22 fiscal year compared to 2020-21, leading to an increase of $200 million in 2021-22.
- School boards’ deficits are expected to increase by $149 million in 2021-22 due to COVID-19-related costs.
- A net $66 million decrease due to other adjustments.
Other spending (capital) is projected to decrease by $0.9 billion compared to 2020-21 projected spending. This largely reflects higher planned spending on school board infrastructure in 2021-22.[32] Spending on school board infrastructure is expensed (amortized) over the life of the asset. These adjustments ensure that the annual amortization expense of school boards’ infrastructure assets is reflected on the financial statements of the Province.
| Other Spending | 2020-21 Projected Spending ($ millions) |
2021-22 Estimates ($ millions) |
1 Year Change ($ millions) |
1 Year Growth (%) |
| Operating | ||||
| Office des télécommunications éducatives de langue française de l’Ontario (TFO) | 9 | 2 | -6 | -74.0 |
| Education Quality and Accountability Office | -11 | 1 | 12 | 109.1 |
| Ontario Educational Communications Authority (TVO) | 11 | 12 | < 1 | 4.2 |
| School Board Trust Debt Repayment Reclassification | -66 | -66 | 0 | 0.0 |
| Schools | -152 | 1,129 | 1,281 | 845.1 |
| Colleges | -26 | -26 | 0 | 0.0 |
| Hospitals | -8 | -8 | 0 | 0.0 |
| General Real Estate Portfolio | -4 | -5 | -1 | -18.8 |
| Total Operating | -246 | 1,041 | 1,287 | 523.0 |
| Capital | ||||
| Office des télécommunications éducatives de langue française de l’Ontario (TFO) | 1 | 1 | < 1 | 7.8 |
| Ontario Educational Communications Authority (TVO) | 2 | 2 | < -1 | -13.1 |
| Education Quality and Accountability Office | < 1 | < 1 | < 1 | 7.0 |
| Schools | 31 | -390 | -421 | |
| Federal – Flowthrough Expense Reversal | -27 | -540 | -513 | |
| General Real Estate Portfolio | -2 | -9 | -7 | -330.6 |
| Total Capital | 6 | -934 | -940 | |
| Total Other Spending | -240 | 106 | 346 | 144.3 |
Graphical Descriptions
| Ministry of Education Spending ($ billions) |
|
| 2020-21 Interim | 33.7 |
| 2021-22 Budget | 33.0 |
| Program Area | Ministry of Education Spending ($ billions) |
Share of Total Spending (%) |
| School Boards | 28.6 | 87 |
| Child Care | 2.3 | 7 |
| Ontario Teachers’ Pension Plan (OTPP) | 1.6 | 5 |
| Ministry Operations | 0.3 | 1 |
| Other Education Programs | 0.2 | 1 |
| Fiscal Year | Education Sector Spending ($ billions) | |
| Government Projection | FAO Projection | |
| 2019-20 | 31.8 | 31.8 |
| 2020-21 | 33.7 | 33.7 |
| 2021-22 | 33.0 | 33.1 |
| 2022-23 | 33.0 | 33.0 |
| 2023-24 | 33.2 | 33.8 |
| 2024-25 | 33.6 | 34.6 |
| 2025-26 | 34.0 | 35.4 |
| 2026-27 | 34.4 | 36.2 |
| 2027-28 | 34.9 | 36.9 |
| 2028-29 | 35.3 | 37.8 |
| 2029-30 | 35.7 | 38.6 |
| Actual: 2014 to 2019 | FAO Projection: 2019 to 2029 | |
| Average annual school-aged population growth | 0.4% | 0.6% |
| Historical Average: 1997 to 2018 | Current Collective Bargaining Agreements: 2019 to 2021 | FAO Projection: 2022 to 2029 | |
| Average annual wage growth | 2.1% | 1.0% | 2.0% |
| Fiscal Year | Child Care Transfer Payments, $ millions |
| 2019-20 | 1,913 |
| 2020-21 | 2,094 |
| 2021-22 | 1,827 |
| 2022-23 | 1,837 |
| 2023-24 | 1,872 |
| 2024-25 | 1,911 |
| 2025-26 | 2,030 |
| 2027-28 | 2,071 |
| 2028-29 | 2,113 |
| 2029-30 | 2,155 |
| Fiscal Year | COVID-19-Related Education Sector Spending ($ millions) |
| 2019-20 | 378 |
| 2020-21 | 3,431 |
| 2021-22 | 905 |
| 2022-23 | 46 |
Footnotes
[1] Volume 1 of the 2021-22 Expenditure Estimates is available here: https://www.ontario.ca/page/expenditure-estimates-volume-1-table-contents-2021-22.
[2] If the SCE does not deliver a report to the legislature by the third Thursday in November, then the Estimates are deemed to be passed by the SCE. Standing Orders of the Legislative Assembly of Ontario (SO 66(b)).
[3] For 2021-22, the other spending – school boards (capital) negative adjustment of $0.9 billion includes a negative adjustment of $390 million for schools and a negative adjustment of $540 million for Federal – Flowthrough Expense Reversal, which accounts for planned infrastructure investments in schools under the Investing in Canada Infrastructure Program (ICIP).
[4] Includes projected spending for the Ontario Teachers’ Pension Plan (OTPP).
[5] Growth rate calculations include time-limited spending, largely related to the COVID-19 pandemic. Excluding time-limited spending, the FAO projects EDU spending will grow by an average annual rate of 2.2 per cent from 2019-20 to 2029-30.
[6] The ‘recovery period’ represents the period in the 2021 Ontario Budget during which the government plans to achieve a balanced budget.
[7] On May 4, 2021, the Province announced $1.6 billion in new funding for schools in response to the COVID-19 pandemic. The FAO estimates that $576 million of this new funding will flow through the Ministry of Education in the 2021-22 fiscal year.
[8] Current funded student-teacher class size ratios are 25.57:2 for kindergarten (a teacher and an early childhood educator), 19.8:1 for primary education, 24.5:1 for intermediate education, and 23:1 for secondary education. Additionally, the FAO projection assumes a ratio of 30:1 for online learning courses for secondary students.
[9] Protecting a Sustainable Public Sector for Future Generations Act, 2019.
[10] Ministry of Labour, Training and Skills Development, Ontario Collective Bargaining Expiries.
[11] From 1997 to 2018, hourly wage growth for educational workers averaged 2.1 per cent per year. See Statistics Canada Table 14-10-0064-01.
[12] The Supports for Students Fund replaces the Local Priorities Fund, which expired in 2018-19.
[13] The Province is phasing in the requirement that secondary students take two mandatory online learning courses to graduate. Online courses will have an average class size of 30 students, and students can apply for an exemption from the mandatory requirement. The FAO’s projection does not assume any other changes to online learning policies.
[14] 2021 Ontario Budget, p. 21.
[15] The FAO estimated the number of subsidized spaces using data from the Ministry of Education’s Early Years and Child Care Annual Report 2020.
[16] There is also time-limited spending in 2020-21 and 2021-22 related to the COVID-19 pandemic.
[17] 2019 Ontario Budget, p. 99.
[18] FAO, “Expenditure Estimates 2019-20: Ministry of Education,” 2019. EDU reported 20,000 spaces under construction and 10,000 spaces to be created.
[19] City of Toronto, Update on Provincial Funding Changes and Previously-Approved Child Care Capital Projects, 2019.
[20] A one-time transitional grant was provided to assist municipalities with the change.
[21] 2019 Ontario Budget, p. 100. For analysis on the CARE tax credit, see FAO, “Child Care In Ontario: A Review of Ontario’s New Child Care Tax Credit,” 2019.
[22] Due to the timing of the introduction of the CARE tax credit, spending of $488 million in 2019-20 included $98 million in spending from the fourth quarter of 2018-19.
[23] Represents a weighted average of the impact to child care enrolment in select Ontario cities. See page 40, “Sounding the Alarm: COVID-19’s impact on Canada’s precarious child care sector,” Canadian Centre for Policy Alternatives, March 2021.
[24] FAO’s 2021 Spring Economic and Budget Outlook. Forthcoming.
[25] Government of Ontario, “Ontario Unveils $2 Billion Plan to Keep Schools Safe and Support Learning Recovery and Renewal,” May 2021. https://news.ontario.ca/en/release/1000064/ontario-unveils-2-billion-plan-to-keep-schools-safe-and-support-learning-recovery-and-renewal.
[26] ‘Services’ include advertising, communications, machine repairs and other items.
[27] Government of Ontario, “Canada and Ontario Invest in School Infrastructure to Respond to the Impacts of COVID-19,” April 14, 2021. https://news.ontario.ca/en/release/61133/canada-and-ontario-invest-in-school-infrastructure-to-respond-to-the-impacts-of-covid-19.
[28] The Ministries of Education; Colleges and Universities; Municipal Affairs and Housing; and Heritage, Sport, Tourism and Culture Industries.
[29] The cost of services provided to other ministries is recorded as a ’recovery’ by the Ministry of Education and as spending by the other ministries. The net impact is to decrease Ministry of Education spending and increase spending in the other ministries.
[30] Listed in the Expenditure Estimates as the Ontario Child Care Tax Credit.
[31] The Schools spending adjustment for 2020-21 is negative $152 million, a decline of $872 million from the planned Schools spending adjustment in the 2020-21 Expenditure Estimates. This indicates that school boards spent significantly less own-source revenues than planned in 2020-21 and also that school boards did not spend all of the funds that were provided by the Province in 2020-21, particularly for COVID-19 response measures, resulting in a negative adjustment.
[32] For a discussion on the state of repair of school board infrastructure, see FAO, “Provincial Infrastructure,” 2020.