


1 | Introduction
On April 21, 2021, the Government of Ontario (the Province) tabled in the Legislative Assembly volume 1 of the 2021-22 Expenditure Estimates.[1] The 2021-22 Expenditure Estimates (or Estimates) sets out the fiscal year’s spending requirements for ministries and constitutes the government’s formal request to the legislature for approval to spend the amounts as detailed in the Estimates.
After tabling in the legislature, the Estimates were referred to the Standing Committee on Estimates (SCE). The SCE is mandated to consider the Estimates of between six and 12 ministries. For 2021-22, the SCE has selected the Estimates of the following ministries for review:
- Health
- Natural Resources and Forestry
- Long-Term Care
- Education
- Infrastructure
- Agriculture, Food and Rural Affairs
- Children, Community and Social Services
- Energy, Northern Development and Mines
- Indigenous Affairs
After the SCE completes its review of a ministry, the committee votes on the ministry’s Estimates. Once the review and voting process is completed for all selected ministries, the SCE must deliver a report to the legislature by the third Thursday in November.[2] The Supply Bill is then formally introduced in the legislature for approval by all Members of Provincial Parliament (MPPs). Passage of the Supply Bill provides the legislature’s approval to spend the amounts as detailed in the Estimates.
The purpose of this report is to support the SCE’s review of the Ministry of Health’s (MOH’s) 2021-22 Expenditure Estimates. The report begins with a financial overview of the ministry, focusing on health spending by Estimates categories and major program areas. Next, the report identifies key financial issues for the ministry. For this year, the FAO:
- reviews the health sector spending plan in the 2021 Ontario Budget, including the base spending plan through 2029-30 and time-limited spending related to the COVID-19 pandemic;
- provides a forecast of the elective surgery and non-emergent diagnostic procedure backlog and an estimate of the cost and time to clear the backlog;
- discusses hospital capacity and the hospital capacity outlook through 2029-30; and
- reviews federal transfers to support provincial health sector spending.
Lastly, the report reviews proposed 2021-22 spending by program and identifies spending trends and program changes.
2 | Ministry Overview
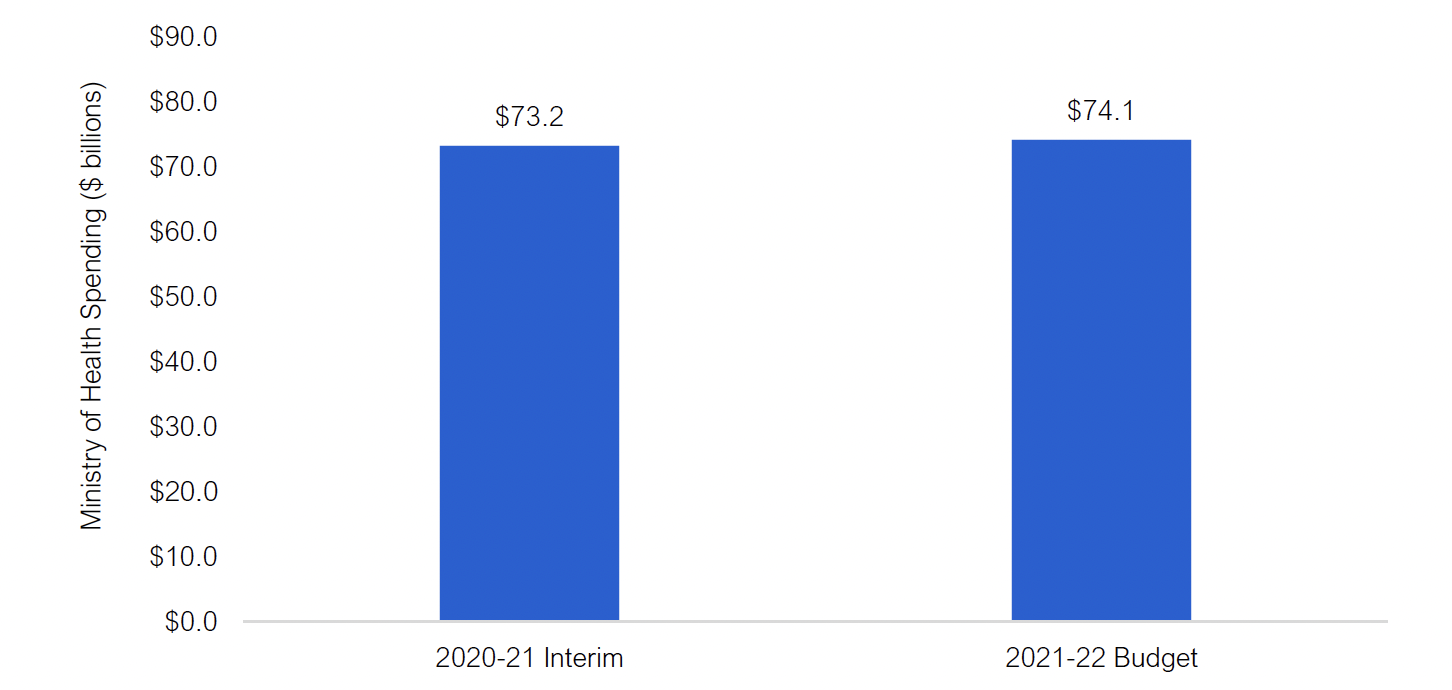
In the 2021-22 Expenditure Estimates, the Ministry of Health (MOH) is projected to spend $74.1 billion in the 2021-22 fiscal year. This is an increase of $0.9 billion (1.3 per cent) from 2020-21 interim results reported in the 2021 Ontario Budget.
Figure 2‑1 Projected Ministry of Health spending in 2020-21 and 2021-22, $ billions
Source: 2021-22 Expenditure Estimates, 2021 Ontario Budget and FAO analysis of information provided by the Ministry of Health.
Accessible version
| Ministry of Health Spending ($ billions) |
|
|---|---|
| 2020-21 Interim | 73.2 |
| 2021-22 Budget | 74.1 |
Health Spending by Expenditure Estimates Categories
The Ministry of Health’s 2021-22 spending plan of $74.1 billion is grouped into three broad categories in the Expenditure Estimates:
- $64.2 billion in ‘Supply Bill spending’ that is authorized annually by the legislature (known as spending ‘to be voted’);
- $9.9 billion in ‘other spending’, which mainly consists of spending related to revenues that are independently raised by hospitals and spending by the Ministry of Long-Term Care that is recorded as an expense on the financial statements of Ontario Health;[3] and
- $16 million in spending that is authorized by standalone legislation (known as ‘statutory spending’).
Supply Bill spending is divided into programs called votes, sub-programs called items, and then accounts. MOH has nine votes, with Health Services and Programs being the largest at $30.6 billion, or 41 per cent of MOH spending. The next largest vote is the Ontario Health Insurance Program at $23.5 billion (32 per cent), while the remaining seven program votes together comprise 14 per cent of planned MOH spending in 2021-22.
Other spending includes $4.2 billion (six per cent of MOH spending) for planned operating spending by hospitals from non-provincial revenue sources (such as donations or parking fees). There is also a $0.4 billion capital adjustment to reflect the net amortization of hospital infrastructure projects. Finally, other spending includes a $5.3 billion (seven per cent of MOH spending) expense adjustment for Ontario Health. This adjustment largely represents planned payments from the Ministry of Long-Term Care to long-term care home operators that will be recorded as an expense on the financial statements of Ontario Health. A corresponding negative adjustment is included as ‘other spending’ in the Ministry of Long-Term Care’s Expenditure Estimates.
Standalone legislation (i.e., spending authorized by legislation other than the Supply Bill) accounts for $16 million or less than 0.1 per cent of planned MOH spending. This spending is largely for the amortization expense of ministry IT equipment.
| Vote | Program Name | 2021-22 Estimates ($ millions) |
Share of Total (%) |
|---|---|---|---|
| 1401 | Ministry Administration Program | 99 | < 1 |
| 1402 | Health Policy and Research Program | 797 | 1 |
| 1403 | Digital Health and Information Management Program | 324 | < 1 |
| 1405 | Ontario Health Insurance Program | 23,465 | 32 |
| 1406 | Population and Public Health Program | 4,548 | 6 |
| 1407 | Health Capital Program | 1,604 | 2 |
| 1412 | Provincial Programs and Stewardship | 2,579 | 3 |
| 1413 | Information Systems | 174 | < 1 |
| 1416 | Health Services and Programs | 30,644 | 41 |
| Total Supply Bill (Voted) Spending | 64,233 | 87 | |
| Other spending – Ontario Health | 5,304 | 7 | |
| Other spending – hospitals (operating) | 4,236 | 6 | |
| Other spending – hospitals (capital) | 357 | < 1 | |
| Other spending – agencies and other adjustments | -9 | < -1 | |
| Total Other Spending | 9,887 | 13 | |
| Standalone Legislation (Statutory) Spending | 16 | < 1 | |
| Total Ministry of Health Spending Plan | 74,136 | 100 |
For additional information on planned spending by Estimates categories, see chapter 4.
Health Spending by Program Area
An alternative way to examine MOH spending is by program area, which aggregates different Estimates spending categories by spending purpose.
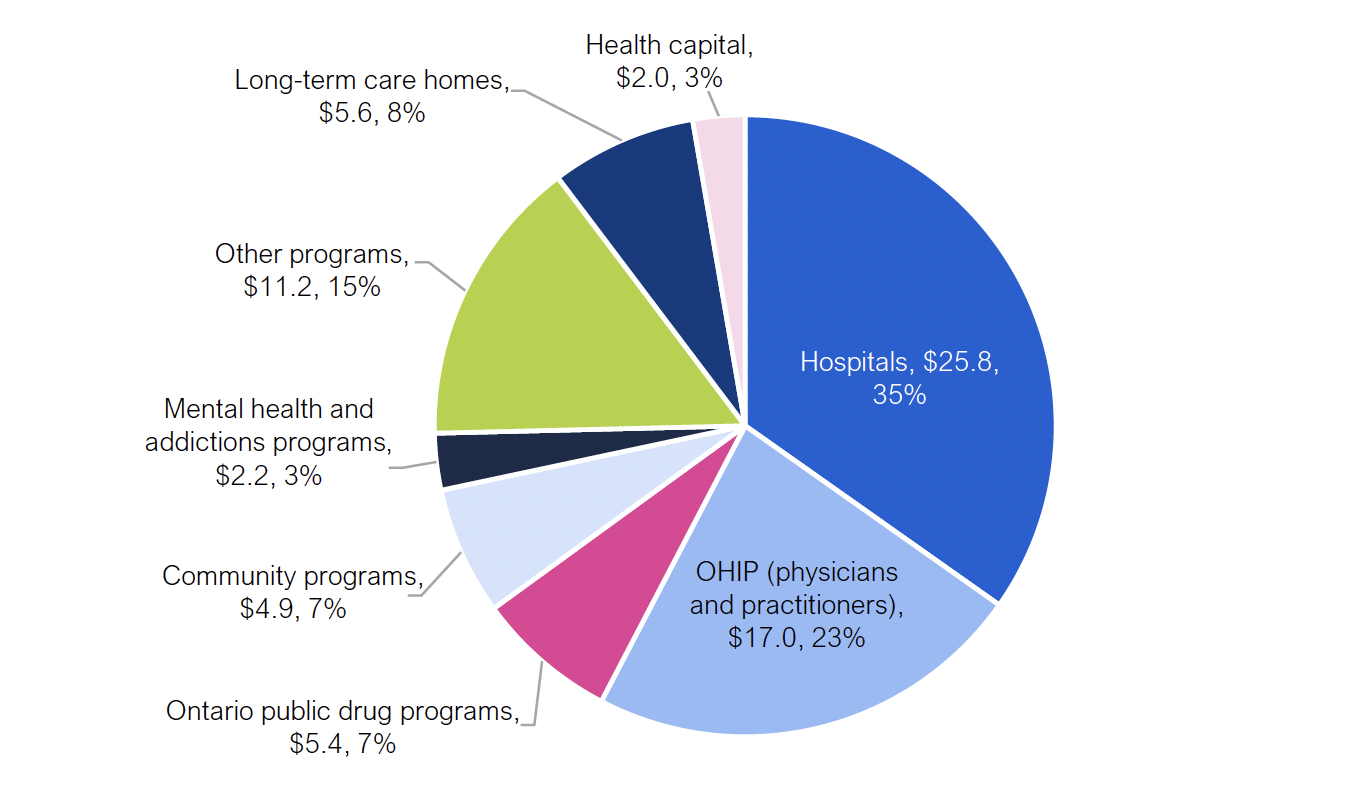
The chart below shows planned MOH spending in 2021-22 of $74.1 billion by major program area. The largest program areas are hospitals ($25.8 billion) and the Ontario Health Insurance Plan (OHIP, physicians and practitioners) ($17.0 billion), which combined account for 58 per cent of planned health ministry spending in 2021-22. Of the remaining major program areas, the next largest is other programs ($11.2 billion, 15 per cent), followed by long-term care homes ($5.6 billion, eight per cent), Ontario public drug programs ($5.4 billion, seven per cent), and community programs ($4.9 billion, seven per cent). The remaining two program areas, mental health and addictions programs and health capital, account for $2.2 billion (three per cent) and $2.0 billion (three per cent), respectively, of planned MOH spending in 2021-22.
Figure 2‑2 2021-22 Ministry of Health spending plan by program area, $ billions
Source: FAO analysis of information provided by the Ministry of Health.
Accessible version
| Program Area | Ministry of Health Spending ($ billions) |
Share of Total Spending (%) |
|---|---|---|
| Hospitals | 25.8 | 35 |
| OHIP (physicians and practitioners) | 17.0 | 23 |
| Other programs | 11.2 | 15 |
| Long-term care homes | 5.6 | 8 |
| Ontario public drug programs | 5.4 | 7 |
| Community programs | 4.9 | 7 |
| Mental health and addictions programs | 2.2 | 3 |
| Health capital | 2.0 | 3 |
Table 2-2 provides a description of each program area.
| Program Area | Description |
|---|---|
| Hospitals | The hospitals program area includes provincial funding to support the operation of 141 hospital corporations, funding for specialty psychiatric hospital services, and an adjustment to account for hospitals’ total spending from provincial and all other sources. |
| OHIP (Physicians and Practitioners) | OHIP provides funding for more than 6,000 insured services to eligible Ontario residents from various providers including physicians, hospitals, community laboratories, independent health facilities and other clinics. |
| Ontario public drug programs | Ontario public drug programs provides funding for the cost of about 5,000 drug products through six different programs, the largest of which is the Ontario Drug Benefit program. |
| Community programs | The community programs area provides community and home-based supports through five programs, the largest of which is funding for home care. |
| Mental health and addictions programs | Mental health and addictions includes three programs: Community Mental Health, Child and Youth Mental Health, and the Addiction Program. |
| Other programs | Other programs includes public health programs, such as transfer payments for Official Local Health Agencies and the Outbreaks of Diseases program; emergency health services, such as transfer payments for ambulances; payments to provincial agencies, such as Ontario Health; as well as ministry administration, information technology and other expenses. |
| Long-term care (LTC) homes program | The LTC homes program area provides funding to support residents in 626 LTC homes in Ontario. Funding for this program is with the Ministry of Long-Term Care (MLTC). In 2021-22, $5.6 billion in planned payments from MLTC to long-term care home operators will be recorded as an expense on the financial statements of Ontario Health. |
| Health capital | Health capital spending includes the net amortization expense for hospital infrastructure* and information & information technology (I&IT) projects, as well as community health programs, public health laboratories and MOH agencies. |
Comparing Health Spending by Program Area and Estimates Source
Table 2-3 identifies the Estimates funding source for each program area.
| Program Area | Projected Spending | Estimates Source |
|---|---|---|
| Hospitals | $25.8 billion | Vote-Item 1416-1: $21.2 billion |
| Vote-Item 1412-1: $0.4 billion | ||
| Other Spending: $4.2 billion | ||
| OHIP (Physicians and Practitioners) | $17.0 billion | Vote-Item 1405-1: $17.0 billion |
| Ontario public drug programs | $5.4 billion | Vote-Item 1405-2: $5.4 billion |
| Community programs | $4.9 billion | Vote-Item 1416-1: $4.8 billion |
| Vote-Item 1412-1: $0.1 billion | ||
| Mental health and addictions programs | $2.2 billion | Vote-Item 1416-1: $2.0 billion |
| Vote-Item 1412-1: $0.2 billion | ||
| Other programs | $11.2 billion | Vote-Item 1406-4: $4.5 billion |
| Vote-Item 1416-2: $2.6 billion | ||
| Vote-Item 1412-2: $1.2 billion | ||
| Vote 1405: $1.1 billion | ||
| Vote-Item 1402-1: $0.8 billion | ||
| Vote-Item 1412-1: $0.7 billion | ||
| Vote-Item 1403-1: $0.3 billion | ||
| Vote-Item 1413-1: $0.2 billion | ||
| Vote-Item 1401-1: $0.1 billion | ||
| Other spending: – $0.3 billion | ||
| Long-term care homes program | $5.6 billion | Other Spending: $5.6 billion |
| Health capital | $2.0 billion | Vote-Item 1407-1: $1.6 billion |
| Other spending: $0.4 billion | ||
| Statutory spending: < $0.1 billion | ||
| Vote-Item 1416-3: < $0.1 billion |
3 | Key Issues for 2021-22
Spending Plan Analysis
This section examines projected health sector spending over the medium term to 2023-24 and the long-term through 2029-30. Note that in this section the FAO analyzes projected spending for the entire health sector, including both the Ministry of Health (MOH) and the Ministry of Long-Term Care (MLTC).[4] The FAO has included MLTC spending in its review because a significant portion of planned spending for long-term care homes is now recorded as spending by MOH through Ontario Health. This section begins with an analysis of the Province’s base health sector spending plan. It then provides information on time-limited spending related to the COVID-19 pandemic.
Base Health Sector Spending Outlook
In the 2021 Ontario Budget, the Province projects that base health sector spending, which excludes time-limited spending related to the COVID-19 pandemic, will grow at an annual average of 3.1 per cent over the medium-term outlook, increasing from $63.7 billion in 2019-20 to $72.0 billion in 2023-24. Over the full 2021 budget forecast, including the recovery plan,[5] the Province projects average annual health sector spending growth of 2.6 per cent, reaching $82.0 billion in 2029-30.
The FAO reviewed the ministry’s programs and concluded that the Province’s health sector spending plan will not be achieved unless significant new program changes are introduced. Based on current program design and commitments, the FAO projects that health sector spending will increase from $63.7 billion in 2019-20 to $75.8 billion in 2023-24, which represents an average annual growth rate of 4.4 per cent. By 2029-30, the FAO projects health sector spending will reach $94.4 billion, representing an average annual growth rate from 2019-20 of 4.0 per cent.
Overall, the FAO estimates that the Province’s health sector programs will cost $3.7 billion more in 2023-24, and $12.4 billion more in 2029-30, than projected in the 2021 budget. In other words, if the Province is to meet its health sector spending targets, then it will need to make program changes that result in annual savings of $3.7 billion by 2023-24 and $12.4 billion by 2029-30.
Figure 3‑1 Base health sector spending, FAO projection vs. 2021 Ontario Budget projection, $ billions
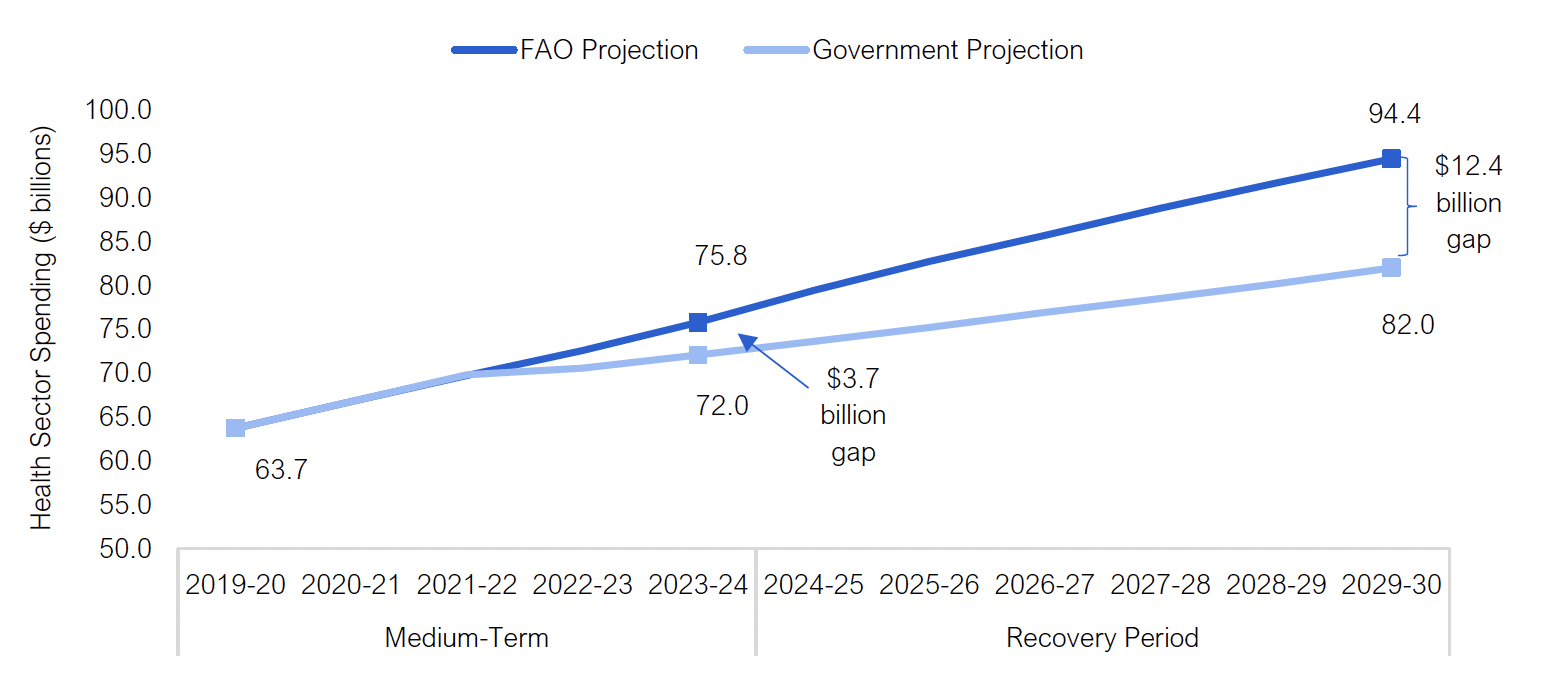
Note: Base health sector spending excludes time-limited spending related to the COVID-19 pandemic. The ‘recovery period’ represents the time period in the 2021 Ontario Budget during which the government plans to achieve a balanced budget.
Source: 2019-20 Public Accounts of Ontario, 2021 Ontario Budget and FAO analysis of provincial information.
Accessible version
| Fiscal Year | Health Sector Spending ($ billions) |
|
|---|---|---|
| Government Projection | FAO Projection | |
| 2019-20 | 63.7 | 63.7 |
| 2020-21 | 66.7 | 66.7 |
| 2021-22 | 69.8 | 69.7 |
| 2022-23 | 70.6 | 72.5 |
| 2023-24 | 72.0 | 75.8 |
| 2024-25 | 73.6 | 79.4 |
| 2025-26 | 75.2 | 82.7 |
| 2026-27 | 76.9 | 85.7 |
| 2027-28 | 78.5 | 88.8 |
| 2028-29 | 80.2 | 91.7 |
| 2029-30 | 82.0 | 94.4 |
For perspective, in the nine-year period from 2010-11 to 2019-20, health sector spending grew at an annual average rate of 3.2 per cent. This was a relatively slow[6] health sector spending growth rate, which the Province was able to achieve through a number of significant spending restraint measures, including:
- freezing base operating funding for hospitals from 2012-13 to 2015-16;[7]
- reducing physician payment rates in 2013 and 2015;[8] and
- limiting investments in new long-term care beds, with only 611 new beds created between 2011 and 2018.[9]
In the 2021 budget, the Province projects that health sector spending will grow by an average annual rate of only 2.6 per cent over the 10-year period from 2019-20 to 2029-30, well below the previous nine-year period, while implementing several key government policy commitments and plans which will require significant new health sector spending. This includes:
- Creating 30,000 new and redeveloped long-term care beds,[10] and increasing average daily direct care to four hours per day for long-term care residents.[11]
- Increasing hospital capacity, including the addition of an estimated 3,069 new hospital beds by 2029-30, as part of the government’s 10-year $30 billion hospital infrastructure plan.
- A plan to revise and expand home and community care services, including removing limits to the number of hours of service provided.
- Providing subsidized or free training for almost 9,000 additional personal support workers for long-term care, home care and community care expansion plans.
- Investing $3.8 billion in mental health and addiction services over 10 years, ending in 2026-27.
Overall, based on the FAO’s analysis of these policy commitments, as well as existing health sector programs, the FAO estimates that the health sector spending plan in the 2021 budget has a $3.7 billion shortfall in 2023-24, rising to $12.4 billion in 2029-30. This means that either the Province will need to increase funding to the health sector or new spending restraint measures will need to be introduced.
Medium-Term Outlook: Spending Gap by Program Area
Over the medium term, from 2019-20 to 2023-24, the FAO projects health sector spending will grow at an annual average rate of 4.4 per cent. This is higher than the Province’s annual growth rate of 3.1 per cent in the 2021 budget and results in a three-year spending gap between the FAO’s and Province’s forecasts of $5.7 billion from 2021-22 to 2023-24. This suggests that if the Province is to achieve its 2021 budget health sector spending plan, then new program changes that result in savings of $5.7 billion over three years are required.
The $5.7 billion cumulative spending gap is not distributed evenly among health sector program areas. The FAO estimates that a majority of the spending gap is in the hospitals program area, while there are significant spending gaps in Ontario public drug programs and community programs. Conversely, the FAO projects that the long-term care homes program will cost less from 2021-22 to 2023-24 than allocated in the 2021 budget plan.
| Average Annual Growth 2019-20 to 2023-24 (%) | Cumulative Spending Gap from 2021-22 to 2023-24 ($ millions)* |
||
|---|---|---|---|
| Program Area | FAO | Province* | |
| Hospitals | 3.6 | ||
| OHIP | 3.2 | ||
| Ontario public drug programs | 4.6 | ||
| Community programs | 4.6 | ||
| Mental health and addictions programs | 5.1 | ||
| Other programs | 3.0 | ||
| Health capital | 3.9 | ||
| Sub-total | 3.6 | ||
| Long-term care homes | 13.8 | ||
| Total health sector | 4.4 | 3.1 | 5,670 |
The following sections identify key FAO base health sector spending growth assumptions by program area.
Hospitals
The FAO projects that hospitals base spending will increase at an average annual rate of 3.6 per cent between 2019-20 and 2023-24. In contrast, the spending plan in the 2021 budget calls for significantly lower growth over the same period.
The largest component of hospital budgets is compensation, which comprises 60 per cent of all hospital spending. The FAO projects compensation spending will increase at an average rate of 3.1 per cent per year to 2023-24. This reflects the expectation that after current collective agreements expire by 2022, increases to compensation rates will reflect long-term trends. The compensation spending forecast also includes the Province’s plan to increase hospital capacity, which will require higher staffing levels.[12] Non-compensation expenses, which include the cost of drugs, supplies, equipment and other spending, are expected to increase by an average of 4.3 per cent per year through 2023-24, reflecting the government’s capital plan, projected demand and historic trends.
OHIP
The FAO projects 3.2 per cent average annual growth in the OHIP program area. The FAO’s projection incorporates the gradual resumption of normal volumes of physician services following decreased spending in 2020-21 due to the COVID-19 pandemic. From March to June of 2020, Ontario physicians performed 31 per cent fewer services than over the same period in 2019. This will result in a decline in OHIP program area spending from 2019-20 to 2020-21.[13]
The FAO projects OHIP program spending will increase significantly in 2021-22 as physician billing returns to more normalized levels and physicians continue to be able to bill for virtual consultations. The FAO projection incorporates the full resumption of normal physician services and program spending growth in 2022-23 and 2023-24. Finally, with the expiry of the current Physician Services Agreement on March 31, 2021, the FAO assumes that going forward, physician fees will increase at a rate of 1.0 per cent annually.
Ontario Public Drug Programs
The FAO projects Ontario public drug programs spending will grow at an average annual rate of 4.6 per cent from 2019-20 to 2023-24. The FAO’s forecast incorporates projected reductions in certain drug prices as well as trends in the substitution of brand name drugs with generic versions, which will place downward pressure on spending growth. However, these factors will be more than offset by projected increased use of higher cost drugs and demographic changes, particularly growth in Ontarians aged 65 and over, which drives demand for the Ontario Drug Benefit program.
The FAO’s projection for Ontario public drug programs spending, at 4.6 per cent annual growth, is higher than the Province’s projection. In the 2021 budget, the Province noted that it was investing an additional $602 million in 2021-22 to support higher utilization, drug costs and increases in the number of eligible recipients. This implies that either additional funding will need to be added to Ontario public drug programs to meet increased utilization in 2022-23 and 2023-24, or the Province must introduce program changes that result in significant savings.
Community Programs
The FAO projects community programs spending will grow at an annual average rate of 4.6 per cent from 2019-20 to 2023-24, which is higher than the Province’s projection.
The 2021 budget outlined the Province’s plan to modernize community care through Bill 175, the Connecting People to Home and Community Care Act, 2020.This legislation transfers oversight of home and community care from Local Health Integration Networks (LHINs) to Ontario Health Teams and removes service maximums for home and community care services. To support this service expansion, the Province announced $121 million to help train almost 9,000 personal support workers for both home and community care programs and long-term care homes. The FAO estimates that the expanded service levels will require 35.9 million hours of personal support services and 9.6 million nursing and therapy visits in 2023-24.
Mental Health and Addictions Programs
The FAO projects mental health and addictions programs spending will grow at an annual average rate of 5.1 per cent from 2019-20 to 2023-24. The FAO’s projection incorporates the Province’s commitment in the 2021 budget to invest an additional $183 million in mental health over three years, as well as annual increases in spending under the Canada-Ontario Home and Community Care and Mental Health and Addictions Services Funding Agreement.
Other Programs
The FAO projects 3.0 per cent average annual growth in other programs spending from 2019-20 to 2023-24. The FAO’s growth projection is driven primarily by increased projected demand for cancer care and public health services.
In the 2019 Ontario Budget, the Province announced a plan to slow health sector spending growth by achieving significant savings through reduced administrative expenses and health sector transformation. The Province projected annual administrative savings of $350 million by 2021-22 through the creation of Ontario Health, which consolidated the operations of the Province’s 14 LHINs and six provincial agencies. This savings projection is incorporated into the FAO’s spending forecast.
Health Capital
The FAO projects 3.9 per cent average annual growth in health capital spending which is in line with historical average annual growth of 3.9 per cent over the past 10 years. The FAO’s projection is based on the Province’s 10-year infrastructure plan in the 2021 Ontario Budget of $33.6 billion in total health capital investments.[14]
Long-Term Care Homes
The FAO projects long-term care homes spending will grow at an average annual rate of 13.8 per cent, which is lower than the Province’s projection. The high growth in long-term care homes spending reflects the Province’s commitment to add 30,000 new and redeveloped long-term care beds, and increase daily direct care for long-term care residents to four hours per day. Overall, the FAO projection for long-term care homes spending from 2021-22 to 2023-24 is lower than the Province’s forecast. The Ministry of Long-Term Care was unable to provide the FAO with a detailed spending forecast to 2023-24 so the FAO cannot determine the reason for the projected difference in long-term care homes spending. More detailed analysis of the long-term care homes spending plan and commitments will be provided in an upcoming FAO report.
Long-Term Outlook to 2029-30
Over the 2021 budget’s recovery plan, from 2024-25 to 2029-30, the spending gap between the FAO’s health sector spending forecast and the Province’s spending plan reaches $12.4 billion by 2029-30.[15] The Ministry of Health noted to the FAO that starting in 2024-25, the health sector spending plan in the 2021 budget is not allocated by program area. Therefore, the FAO cannot provide a comparison between the FAO’s forecast and the 2021 budget spending plan by program. Overall, the FAO projects that health sector spending will grow by an annual average of 3.7 per cent from 2023-24 to 2029-30, compared to the 2021 budget projection of 2.2 per cent.
| Average Annual Growth 2023-24 to 2029-30 (%) |
Spending Gap in 2029-30 ($ millions) |
||
|---|---|---|---|
| Program Area | FAO | Province | |
| Hospitals | 3.5 | N/A | N/A |
| OHIP | 2.8 | N/A | N/A |
| Ontario public drug programs | 4.6 | N/A | N/A |
| Community programs | 4.5 | N/A | N/A |
| Mental health and addictions programs | 3.6 | N/A | N/A |
| Other programs | 3.0 | N/A | N/A |
| Health capital | 3.5 | N/A | N/A |
| Sub-total | 3.4 | N/A | N/A |
| Long-term care homes | 6.5 | N/A | N/A |
| Total health sector | 3.7 | 2.2 | 12,430 |
The FAO’s long-term health sector spending projection reflects ongoing provincial commitments for long-term care homes, forecasts for hospital capacity expansion and compensation levels, increased utilization of entitlement-based[16] programs, such as OHIP, Ontario public drug programs and community programs, the assumption that the Province will maintain funding for mental health and addictions services after the provincial-federal funding commitment ends in 2026-27, and the Province’s 10-year health infrastructure investment plan.
In 2011-12, real per capita health sector spending, which accounts for population levels and inflation, was $4,780. Real per capita spending reached a low of $4,411 in 2016-17 and gradually increased to $4,510 by 2019-20. Looking forward, the FAO projects that real per capita base health sector spending will grow at an average annual rate of 0.9 per cent from 2019-20 to 2029-30, reaching $4,941 by 2029-30. In comparison, the base health sector spending plan in the 2021 budget calls for real per capita spending to decline by an annual average of 0.5 per cent over the 10-year period, dropping to $4,290 by 2029-30. If this spending level is achieved, then annual real per capita health sector spending will have declined by $490 per person (or 10.2 per cent) since 2011-12.
Figure 3‑2 Real per capita base health sector spending, 2011-12 to 2029-30
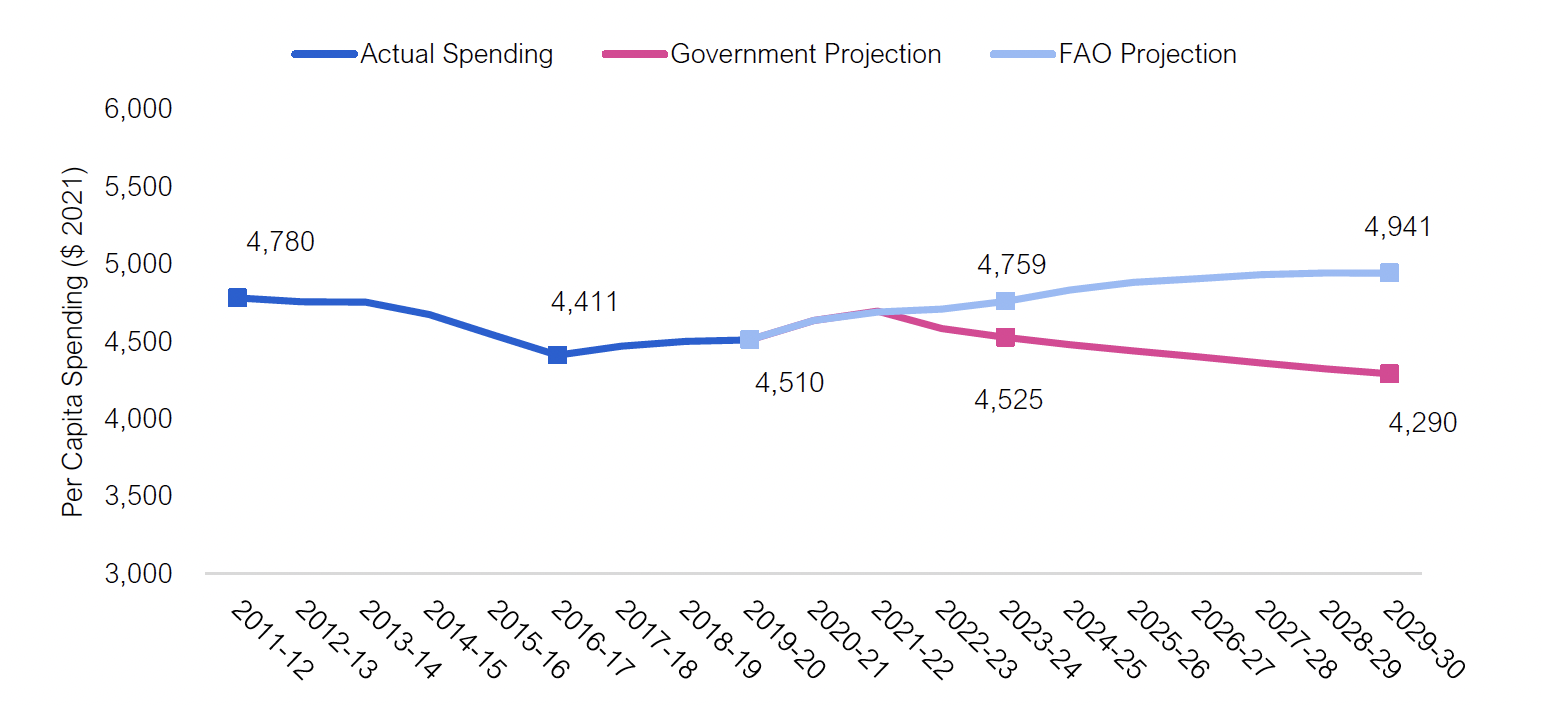
Source: FAO analysis of provincial information
Accessible version
| Fiscal Year | Per Capita Spending ($ 2021) |
||
|---|---|---|---|
| Actual Spending | FAO Projection | Government Projection | |
| 2011-12 | 4,780 | ||
| 2012-13 | 4,756 | ||
| 2013-14 | 4,753 | ||
| 2014-15 | 4,673 | ||
| 2015-16 | 4,540 | ||
| 2016-17 | 4,411 | ||
| 2017-18 | 4,469 | ||
| 2018-19 | 4,501 | ||
| 2019-20 | 4,510 | 4,510 | 4,510 |
| 2020-21 | 4,634 | 4,634 | |
| 2021-22 | 4,688 | 4,695 | |
| 2022-23 | 4,709 | 4,581 | |
| 2023-24 | 4,759 | 4,525 | |
| 2024-25 | 4,832 | 4,478 | |
| 2025-26 | 4,880 | 4,437 | |
| 2026-27 | 4,905 | 4,401 | |
| 2027-28 | 4,931 | 4,359 | |
| 2028-29 | 4,941 | 4,323 | |
| 2029-30 | 4,941 | 4,290 | |
Time-Limited COVID-19 Spending
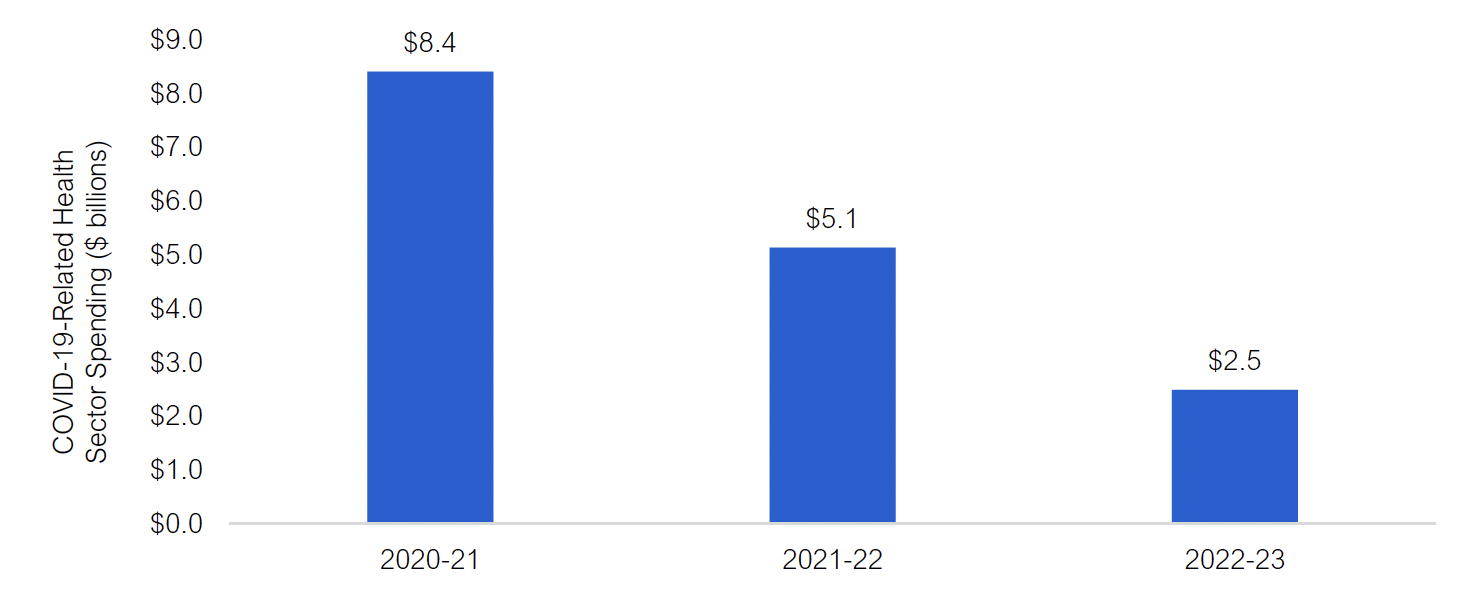
The FAO estimates that from 2020-21 to 2022-23, the Province’s health sector spending plan includes a total of $16.0 billion for measures in response to the COVID-19 pandemic. This amount is largely consistent with the total reported in the 2021 Ontario Budget.[17] Over half of this COVID-19-related spending is estimated to have occurred in 2020-21, with the remainder ($7.6 billion) planned for 2021-22 and 2022-23.
Figure 3‑3 Time-limited health sector spending related to the COVID-19 pandemic, 2020-21 to 2022-23, $ billions
Source: FAO calculations based on information provided by the Ministries of Health, Long-Term Care and Finance, Treasury Board Secretariat, and other publicly available information, including the 2021 Ontario Budget.
Accessible version
| Fiscal Year | COVID-19-Related Health Sector Spending ($ billions) |
|---|---|
| 2020-21 | 8.4 |
| 2021-22 | 5.1 |
| 2022-23 | 2.5 |
Table 3-3 shows the $16.0 billion in COVID-19-related spending by categories of support from 2020-21 to 2022-23 and provides further information on each category.
| Spending Category | Description | FAO Estimated Total COVID-19 Spending |
|---|---|---|
| Testing / Contact Tracing |
|
3,785 |
| Operations |
|
2,419 |
| Long-Term Care Homes |
|
1,997 |
| Hospital Capacity |
|
1,536 |
| Pandemic Pay |
|
1,330 |
| PPE |
|
1,273 |
| Vaccination |
|
1,087 |
| Surgery and Diagnostic Procedures Backlog |
|
610 |
| Pandemic Fund |
|
2,000 |
| Total | 16,039 |
Surgery and Diagnostic Procedures Backlog
Procedure Backlog Estimate
On March 15, 2020, as the first wave of the COVID-19 pandemic hit the province, hospitals ramped down elective surgeries[18] and non-emergent diagnostic procedures[19] to preserve capacity for COVID-19 patients. This directive lasted for nine weeks and resulted in an estimated 121,600 backlogged surgeries and 727,000 backlogged diagnostic procedures by the end of May 2020. While hospitals began to resume elective surgeries and non-emergent diagnostic procedures in late May 2020, procedure volume never reached pre-pandemic levels, and the backlog continued to accumulate. By the end of March 2021, the Ontario COVID-19 Science Advisory Table estimated that the surgery backlog reached 245,400 procedures,[20] while the FAO estimates that the diagnostic backlog reached 1.6 million procedures.
In response to record and growing hospitalization rates in the third wave of the pandemic, Ontario Health directed hospitals in southern Ontario to ramp down elective procedures, effective April 12, 2021. On April 20, 2021, a directive was issued to all hospitals to immediately cease all non-emergent surgeries and procedures.[21] The FAO estimates that this postponement of elective surgeries and diagnostic procedures will increase the surgical backlog by 11,152 procedures per week and the diagnostic backlog by 51,990 procedures per week.
At the time of the writing of this report, it is not clear how long elective surgeries and non-emergent diagnostic procedures will continue to be on hold. Therefore, for the purposes of this analysis, the FAO assumes that the duration of the new directive will last nine weeks, similar to the initial directive during the first wave of the pandemic, followed by a gradual resumption in volumes. As a result, the FAO projects that the surgery backlog will reach 419,200 procedures and the diagnostic backlog will reach nearly 2.5 million procedures by the end of September 2021. For context, in 2019, Ontario hospitals completed 649,300 elective surgeries and 4.3 million non-emergent diagnostic procedures.[22] This means that the surgical and diagnostic backlog is expected to reach nearly two-thirds of total annual volume for all elective surgeries and non-emergent diagnostic procedures in a normal year.
Figure 3‑4 Estimated cumulative backlog of elective surgical procedures
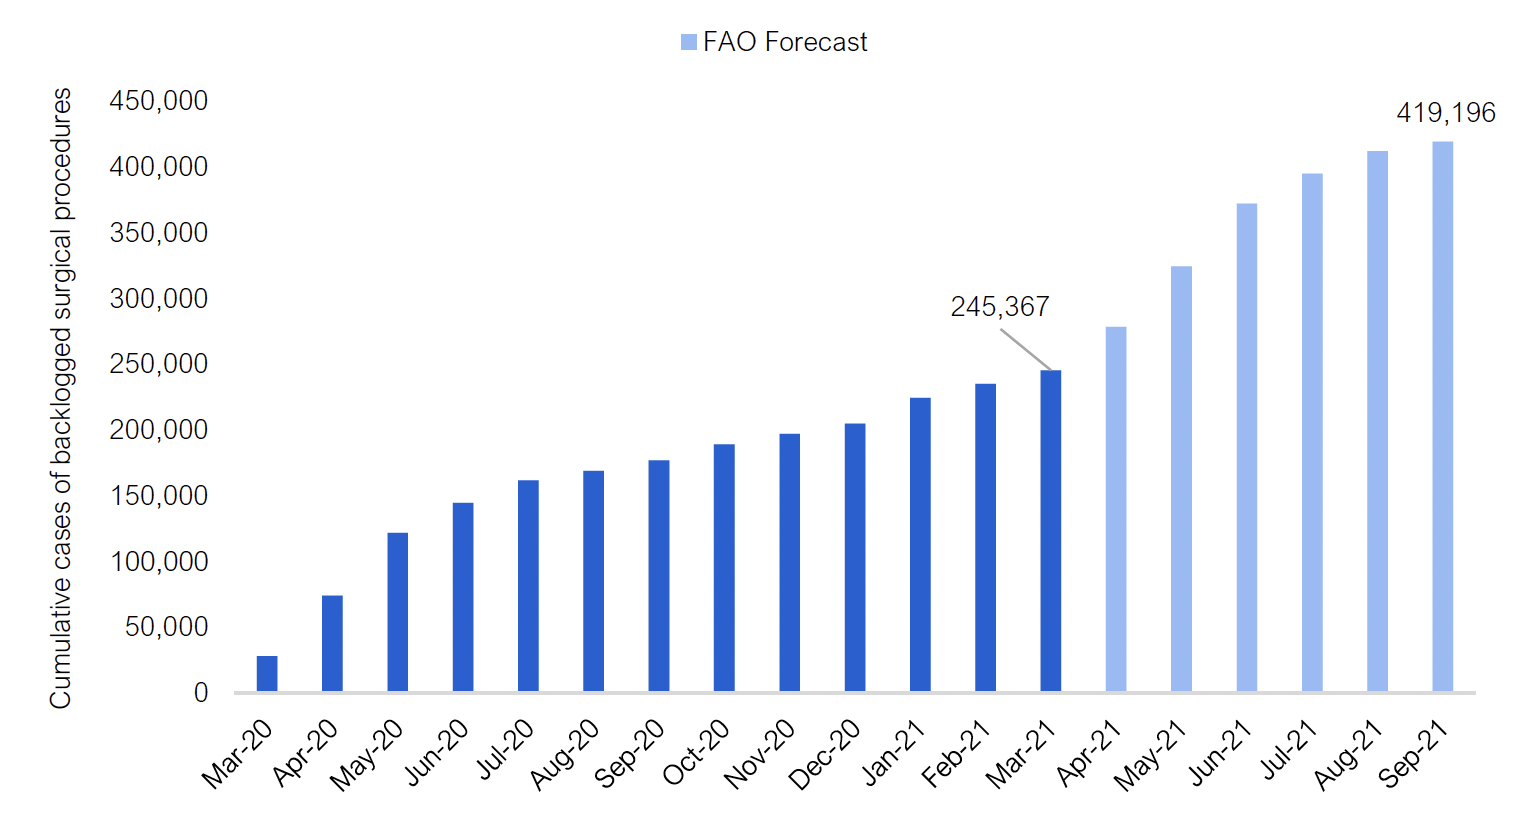
Note: Elective surgeries refer to surgeries that do not involve a medical emergency and therefore do not need to be performed immediately. These include procedures such as cataract, hip replacement, knee replacement, gallbladder and select cancer surgeries. Source: Ontario COVID-19 Science Advisory Table, “Update on COVID-19 Projections,” April 16, 2021, Ministry of Health and FAO projection.
Note: Diagnostic procedures included in this analysis are adult and pediatric CT scans, MRI scans and cancer screening tests, such as fecal tests, screening mammograms, pap tests and screening MRIs.
Source: Ontario COVID-19 Science Advisory Table, “Update on COVID-19 Projections,” April 16, 2021, Ministry of Health, Health Quality Ontario and FAO projection.
Accessible version
| Year | Month | Cumulative Cases of Backlogged Surgical Procedures |
|---|---|---|
| 2020 | March | 28,031 |
| 2020 | April | 73,947 |
| 2020 | May | 121,620 |
| 2020 | June | 144,557 |
| 2020 | July | 161,513 |
| 2020 | August | 168,750 |
| 2020 | September | 176,944 |
| 2020 | October | 189,052 |
| 2020 | November | 197,158 |
| 2020 | December | 204,851 |
| 2021 | January | 224,327 |
| 2021 | February | 234,847 |
| 2021 | March | 245,367 |
| 2021 | April | 278,477 |
| 2021 | May | 324,393 |
| 2021 | June | 372,066 |
| 2021 | July | 395,003 |
| 2021 | August | 411,959 |
| 2021 | September | 419,196 |
Figure 3‑5 Estimated cumulative backlog of non-emergent diagnostic procedures
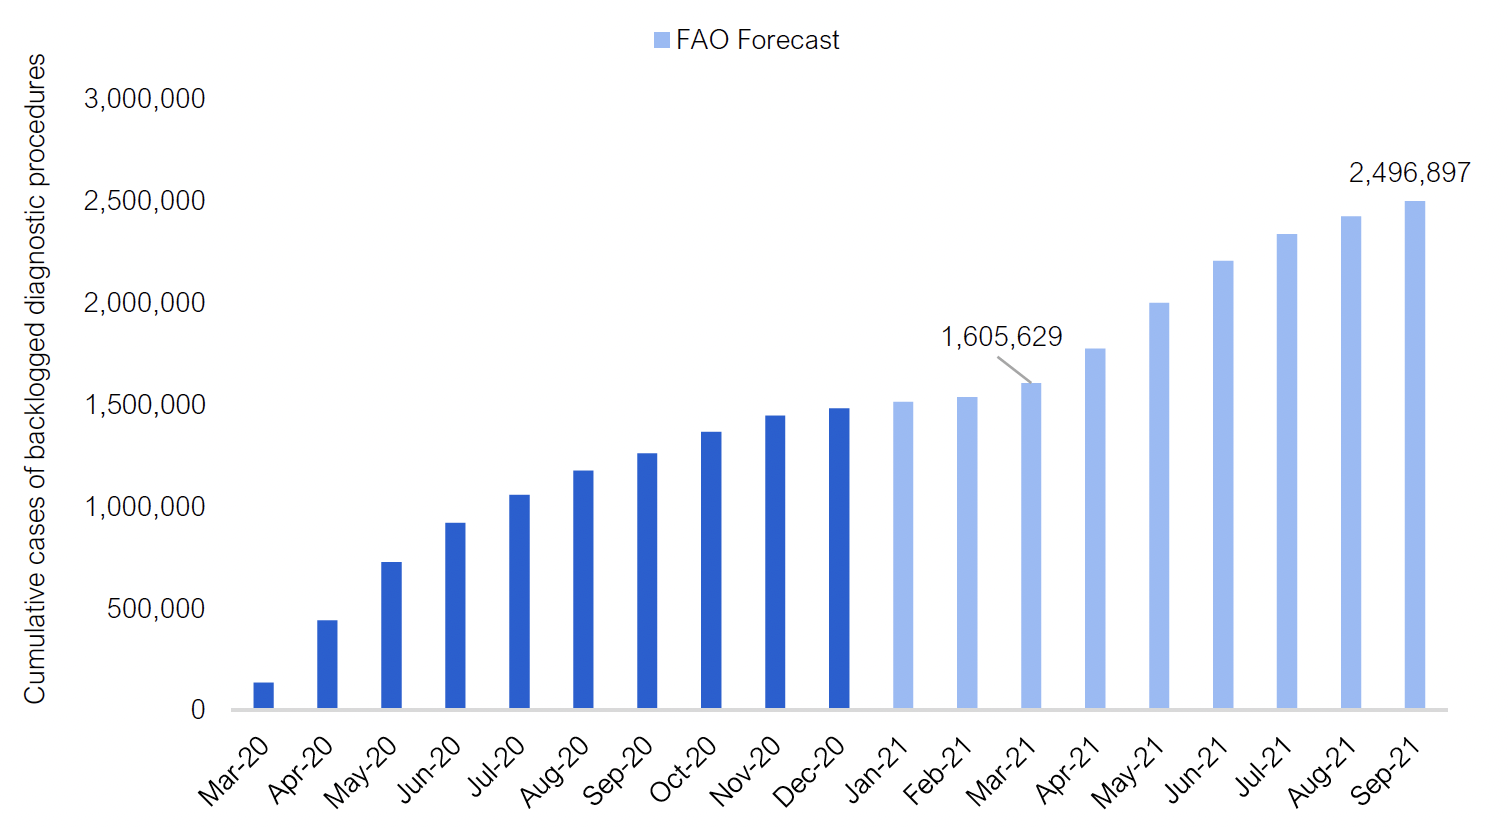
Note: Diagnostic procedures included in this analysis are adult and pediatric CT scans, MRI scans and cancer screening tests, such as fecal tests, screening mammograms, pap tests and screening MRIs.
Source: Ontario COVID-19 Science Advisory Table, “Update on COVID-19 Projections,” April 16, 2021, Ministry of Health, Health Quality Ontario and FAO projection.
Accessible version
| Year | Month | Cumulative Cases of Backlogged Diagnostic Procedures |
|---|---|---|
| 2020 | March | 134,196 |
| 2020 | April | 440,533 |
| 2020 | May | 727,044 |
| 2020 | June | 918,866 |
| 2020 | July | 1,056,493 |
| 2020 | August | 1,175,452 |
| 2020 | September | 1,259,650 |
| 2020 | October | 1,366,297 |
| 2020 | November | 1,445,489 |
| 2020 | December | 1,480,428 |
| 2021 | January | 1,513,017 |
| 2021 | February | 1,536,788 |
| 2021 | March | 1,605,629 |
| 2021 | April | 1,774,292 |
| 2021 | May | 1,998,962 |
| 2021 | June | 2,203,891 |
| 2021 | July | 2,336,242 |
| 2021 | August | 2,424,429 |
| 2021 | September | 2,496,897 |
The Cost to Clear the Procedure Backlog
The FAO estimates that it will cost the Province $1.3 billion to clear the projected backlog of 419,200 surgeries ($1.1 billion) and 2.5 million diagnostic procedures ($241 million). The FAO’s cost estimate is based on provincial funding rates and does not reflect any additional costs that may be associated with hospitals operating above normal procedure volumes for a long duration. Overall, although the diagnostic procedure backlog is much higher than the surgical backlog, it will cost less to address because the average funding rate per diagnostic procedure, at $96, is significantly lower than the average funding rate per surgery of $2,527.
In the 2021 Ontario Budget, the Province allocated $610 million to address the surgery and diagnostic procedures backlog. This represents a funding shortfall of approximately $700 million and is largely due to the timing of the writing of the 2021 budget, which occurred before the directive in April 2021 to halt elective surgeries and non-emergent diagnostic procedures.
| Type of Procedure | Average Funding Rate per Procedure ($) |
Cumulative Backlog | FAO Estimate of Cost to Clear the Backlog ($ millions) |
|---|---|---|---|
| Surgery | |||
| Orthopedic Surgery (including Knee and Hip Replacement) | 4,528 | 76,994 | 349 |
| General Surgery | 3,124 | 46,271 | 145 |
| Gynecologic Surgery | 2,319 | 38,526 | 89 |
| Pediatric Surgery | 1,856 | 45,528 | 85 |
| Eye Surgery (including Cataract) | 717 | 114,490 | 82 |
| Cancer Surgery | 4,228 | 13,560 | 57 |
| Plastic and Reconstructive Surgery | 2,558 | 20,484 | 52 |
| Other Surgeries | 3,163 | 63,344 | 200 |
| Total Surgery | 2,527 | 419,196 | 1,059 |
| Diagnostic Procedure | |||
| CT Scan | 233 | 436,822 | 102 |
| MRI Scan (excluding screening MRI) | 197 | 461,067 | 91 |
| Cancer Screening (including Fecal Test, Screening Mammogram, Pap Test and Screening MRI) | 30 | 1,599,007 | 48 |
| Total Diagnostic Procedure | 96 | 2,496,897 | 241 |
| Total Surgery and Diagnostic Procedure | 446 | 2,916,093 | 1,300 |
How Long to Clear the Procedure Backlog?
The FAO estimates that it will take 3.5 years to clear the surgery backlog of 419,200 procedures and over three years to clear the diagnostic backlog of 2.5 million procedures. This estimate is based on the 2021 budget’s plan to clear the backlog and assumes hospitals operate at 11 per cent above pre-pandemic volumes for all surgeries and 18 per cent above pre-pandemic volumes for non-emergent diagnostic procedures.[23] Alternatively, if the Province were to clear the projected backlog in 24 months, hospitals would need to operate at 20 per cent above the pre-pandemic volumes for all surgeries and 29 per cent above pre-pandemic volumes for non-emergent diagnostic procedures.
Importantly, the FAO has not reviewed the Ministry of Health’s plan to clear the surgical and diagnostic procedure backlog in relation to required staffing levels, the required physical capacity in hospitals (e.g., operating room space) and other operating constraints.[24] Members of the Standing Committee on Estimates may wish to ask the ministry about its plan to clear the elective surgery and non-emergent diagnostic procedure backlog, including any revised cost estimates, new timing estimates and operational plans.
Hospital Capacity Outlook
In 1990, Ontario had nearly 50,000 hospital beds, which dropped to a low of 31,500 by 1999, following a period of spending restraint and hospital consolidations. The number of hospital beds in Ontario remained at approximately this level for 19 years before the number of hospital beds started to increase in 2018.
From 2018-19 to 2021-22, the Province added a total of 2,524 new permanent beds. In addition, in response to the COVID-19 pandemic, the Province added 2,259 temporary beds in 2019-20, 4,510 beds in 2020-21 and 3,522 in 2021-22, non-cumulatively. As a result, the FAO estimates that Ontario has 38,416 hospital beds in 2021-22, of which 34,894 are permanent beds and 3,522 are surge beds. This represents an increase of 6,964 hospital beds from 2017-18 levels.
Looking forward, the ministry’s spending plan for the hospitals sector implies that the 3,522 surge hospital beds will not be maintained after the pandemic ends. As a result, the FAO assumes that surge beds will be withdrawn after 2021-22 and forecasts that the number of hospital beds in Ontario will drop to 35,134 in 2022-23. After 2022-23, based on information provided by the ministry and a review of the 10-year infrastructure plan for hospital projects, the FAO estimates that the Province will add an average of 324 hospital beds annually, reaching 37,321 beds by 2029-30.
Figure 3‑6 Ontario total hospital beds by type, 1990 to 2029
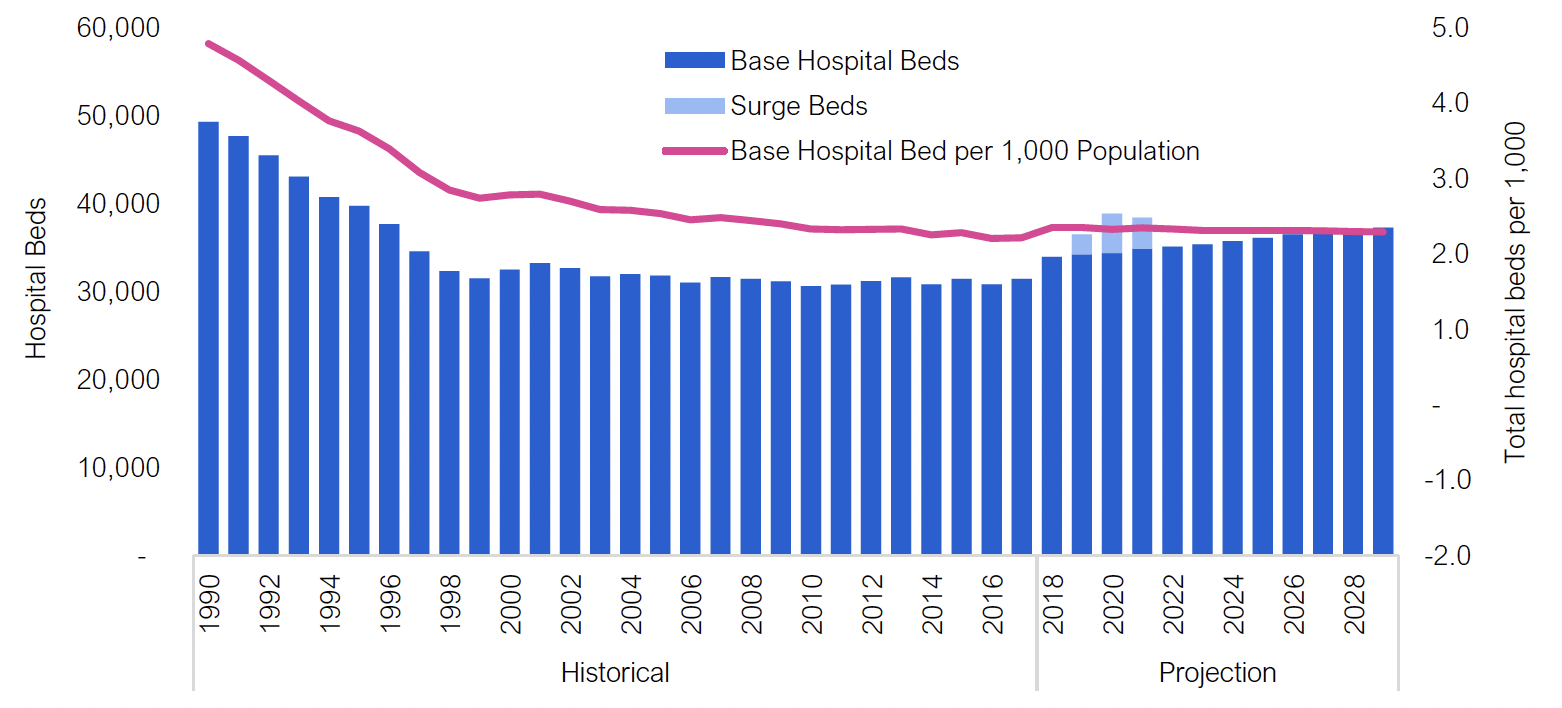
Source: Ontario Hospital Association, Ministry of Health and FAO.
Accessible version
| Year | Base Hospital Beds | Surge Beds | Base Hospital Bed per 1,000 Population |
|---|---|---|---|
| 1990 | 49,300 | 4.8 | |
| 1991 | 47,700 | 4.6 | |
| 1992 | 45,500 | 4.3 | |
| 1993 | 43,100 | 4.0 | |
| 1994 | 40,800 | 3.8 | |
| 1995 | 39,800 | 3.6 | |
| 1996 | 37,700 | 3.4 | |
| 1997 | 34,600 | 3.1 | |
| 1998 | 32,400 | 2.8 | |
| 1999 | 31,500 | 2.7 | |
| 2000 | 32,500 | 2.8 | |
| 2001 | 33,300 | 2.8 | |
| 2002 | 32,700 | 2.7 | |
| 2003 | 31,800 | 2.6 | |
| 2004 | 32,000 | 2.6 | |
| 2005 | 31,900 | 2.5 | |
| 2006 | 31,100 | 2.5 | |
| 2007 | 31,700 | 2.5 | |
| 2008 | 31,500 | 2.4 | |
| 2009 | 31,200 | 2.4 | |
| 2010 | 30,600 | 2.3 | |
| 2011 | 30,800 | 2.3 | |
| 2012 | 31,200 | 2.3 | |
| 2013 | 31,700 | 2.3 | |
| 2014 | 30,900 | 2.3 | |
| 2015 | 31,500 | 2.3 | |
| 2016 | 30,900 | 2.2 | |
| 2017 | 31,500 | 2.2 | |
| 2018 | 34,000 | 2.4 | |
| 2019 | 34,300 | 2,300 | 2.4 |
| 2020 | 34,400 | 4,500 | 2.3 |
| 2021 | 34,900 | 3,500 | 2.3 |
| 2022 | 35,100 | 2.3 | |
| 2023 | 35,400 | 2.3 | |
| 2024 | 35,800 | 2.3 | |
| 2025 | 36,100 | 2.3 | |
| 2026 | 36,500 | 2.3 | |
| 2027 | 36,800 | 2.3 | |
| 2028 | 37,100 | 2.3 | |
| 2029 | 37,300 | 2.3 |
From 1990 to 1999, the total number of hospital beds per 1,000 Ontarians decreased by 43 per cent, from 4.8 beds per 1,000 people to 2.7 beds per 1,000 people.[25] Since the total number of hospital beds remained flat from 1999 to 2017, while Ontario’s population increased, the number of hospital beds per 1,000 people continued to decline, from 2.7 per 1,000 people in 1999 to 2.2 per 1,000 in 2017. This represents a further 19 per cent decline. Going forward, the projected increase in the number of hospital beds by 2029 is expected to keep pace with population growth. The FAO estimates that by 2029, the number of hospital beds will be 2.3 per 1,000 people, up from 2.2 per 1,000 in 2017.
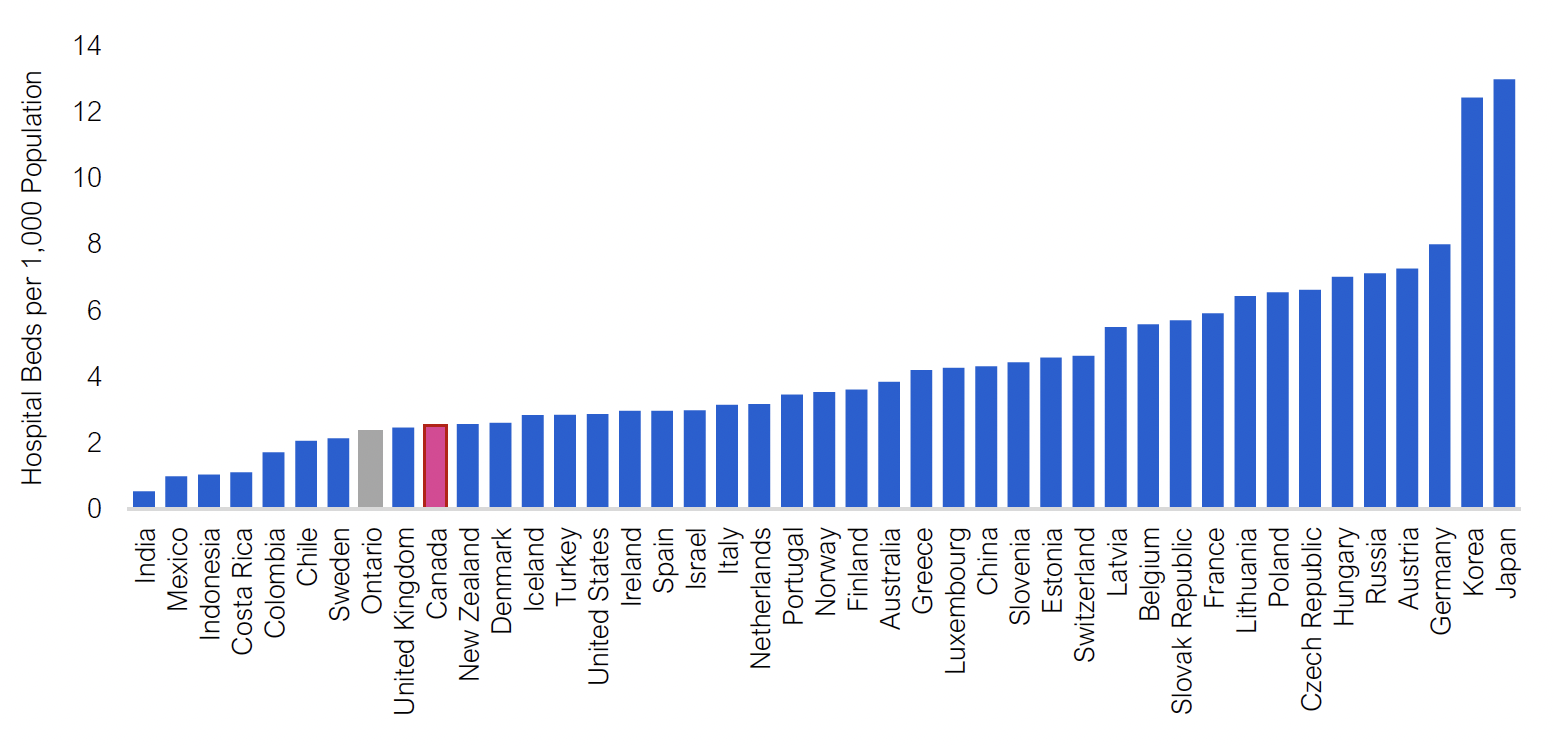
Finally, compared to other OECD countries, Ontario has one of the lowest number of hospital beds as a share of the population and is below the Canadian average.
Figure 3‑7 Ontario hospital beds compared to other OECD countries
Source: Organisation for Economic Co-operation and Development (OECD) and FAO.
Accessible version
| Country | Hospital Beds per 1,000 People |
|---|---|
| India | 0.53 |
| Mexico | 0.98 |
| Indonesia | 1.04 |
| Costa Rica | 1.10 |
| Colombia | 1.71 |
| Chile | 2.06 |
| Sweden | 2.14 |
| Ontario | 2.35 |
| United Kingdom | 2.46 |
| Canada | 2.52 |
| New Zealand | 2.57 |
| Denmark | 2.60 |
| Iceland | 2.83 |
| Turkey | 2.85 |
| United States | 2.87 |
| Ireland | 2.97 |
| Spain | 2.97 |
| Israel | 2.98 |
| Italy | 3.14 |
| Netherlands | 3.17 |
| Portugal | 3.45 |
| Norway | 3.53 |
| Finland | 3.61 |
| Australia | 3.84 |
| Greece | 4.20 |
| Luxembourg | 4.26 |
| China | 4.31 |
| Slovenia | 4.43 |
| Estonia | 4.57 |
| Switzerland | 4.63 |
| Latvia | 5.49 |
| Belgium | 5.58 |
| Slovak Republic | 5.70 |
| France | 5.91 |
| Lithuania | 6.43 |
| Poland | 6.54 |
| Czech Republic | 6.62 |
| Hungary | 7.01 |
| Russia | 7.12 |
| Austria | 7.27 |
| Germany | 8.00 |
| Korea | 12.43 |
| Japan | 12.98 |
Federal Funding for Provincial Health Spending
Federal Transfers to Support Base Health Sector Spending
The federal government supports a portion of provincial health sector spending, largely through the Canada Health Transfer (CHT). The CHT provides funding for the purposes of maintaining the national criteria for publicly provided health care in Canada.[26] The CHT is an important source of provincial revenue, with Ontario’s CHT transfer in 2021-22, based on its population share, expected to reach $16.7 billion. The annual growth rate of the CHT is based on a three-year moving average of Canada’s nominal GDP growth with a floor of three per cent. This reflects the current CHT agreement, which is scheduled to last until 2024-25. However, the federal government has indicated that the CHT funding formula will be increased “once the pandemic is over.”[27]
In addition to the CHT, there are time-limited federal transfer agreements related to mental health and home care that support base health sector spending. In 2021-22, the Province will receive $580 million from the Home and Community Care and Mental Health and Addictions Services Funding Agreement, a 10-year program that will provide the Province with a total of $4.2 billion through 2026-27.
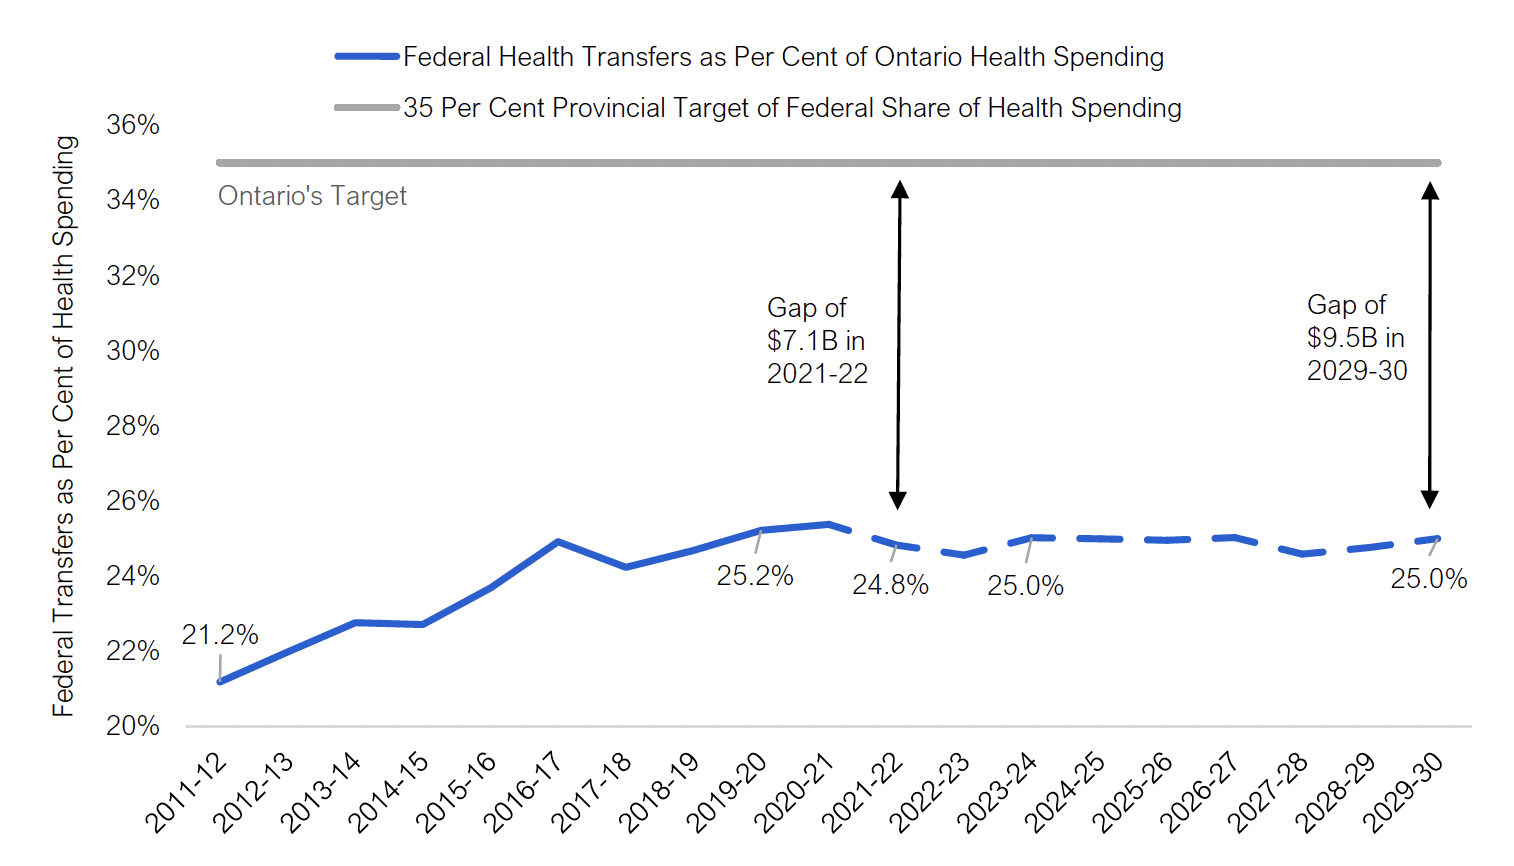
Since 2011-12, federal health transfers as a share of Ontario base health sector spending have increased from 21.2 per cent to 25.2 per cent in 2019-20, as the annual growth rate of the CHT has significantly outpaced the growth rate of Ontario’s health sector spending.[28] Looking forward, assuming that the CHT will continue to grow based on nominal GDP to 2029-30 and that the mental health and home care agreement will not be renewed, the FAO projects that growth in federal health transfers will average 3.9 per cent from 2019-20 to 2029-30, similar to the growth rate of Ontario’s health spending. As a result, the federal share of Ontario’s health sector spending is expected to remain stable at approximately 25 per cent to 2029-30.
The Ontario government, through the Council of the Federation, has requested an increase in the CHT so that 35 per cent of all annual provincial-territorial health spending would be supported by federal health transfers.[29] The FAO estimates that, in 2021-22, an additional $7.1 billion in CHT funding would be required to meet the 35 per cent target specifically for Ontario, which would grow to $9.5 billion in 2029-30. In other words, this is the amount of new CHT funding that would be required if the federal government were to support 35 per cent of projected provincial health sector spending.
Figure 3‑8 Federal cash transfers as a share of Ontario base health sector spending, 2011-12 to 2029-30
Note: Excludes all COVID-19 related spending and transfers.
Source: FAO calculations.
Accessible version
| Fiscal Year | Federal Health Transfers as Per Cent of Ontario Health Spending | 35 Per Cent Provincial Target of Federal Share of Health Spending |
|---|---|---|
| 2011-12 | 21.2% | 35% |
| 2012-13 | 22.0% | 35% |
| 2013-14 | 22.8% | 35% |
| 2014-15 | 22.7% | 35% |
| 2015-16 | 23.7% | 35% |
| 2016-17 | 24.9% | 35% |
| 2017-18 | 24.2% | 35% |
| 2018-19 | 24.7% | 35% |
| 2019-20 | 25.2% | 35% |
| 2020-21 | 25.4% | 35% |
| 2021-22 | 24.8% | 35% |
| 2022-23 | 24.6% | 35% |
| 2023-24 | 25.0% | 35% |
| 2024-25 | 25.0% | 35% |
| 2025-26 | 24.9% | 35% |
| 2026-27 | 25.0% | 35% |
| 2027-28 | 24.6% | 35% |
| 2028-29 | 24.8% | 35% |
| 2029-30 | 25.0% | 35% |
In contrast, in the 2021 Ontario Budget, the Province estimated that, to support 35 per cent of Ontario’s health sector spending, an additional $10 billion in CHT funding would be required in 2021-22, rising to approximately $13.6 billion by 2029-30.[30] The difference between the FAO’s estimate and the Province’s estimate of $3.0 billion in 2021-22 rising to $4.1 billion in 2029-30 is due to two main reasons:[31]
- The Province’s estimate includes time-limited COVID-19 health spending, increasing the gap in the short term. The FAO’s gap estimate excludes temporary COVID-19 spending as the federal government provides separate cash transfers to support this spending (see below for more details).
- The Province’s estimate, which is based on the Council of the Federation’s analysis, assumes 4.6 per cent annual growth in provincial-territorial health sector spending between 2019-20 and 2029-30. This is higher than both the base health sector spending plan in the 2021 Ontario Budget and the FAO’s projection. From 2019-20 to 2029-30, the government’s planned base health sector spending growth is 2.6 per cent per year, while the FAO forecast is 4.0 per cent.
Federal Transfers to Support COVID-19-Related Health Sector Spending
In addition to base federal health transfers, the federal government is providing time-limited cash transfers to the provinces to support spending in response to the COVID-19 pandemic. In total, Ontario will receive $6.2 billion in cash transfers from the federal government from 2019-20 to 2021-22 through six federal streams to support provincial health sector COVID-19 pandemic response measures:
- Safe Restart Agreement: $3.1 billion of the $5.1 billion will be allocated to provincial health sector spending;
- Canada Health Transfer: a one-time top-up of $1.6 billion to address COVID-19-related health sector spending pressures, including surgery backlogs;
- Essential Workers Wage Top-up: $1.1 billion transfer of which $0.9 billion will go to wages for essential workers in the health sector;
- Vaccine Roll-Out Support: $0.4 billion to support the provincial roll-out of vaccines;
- COVID-19 Response Fund for Provinces and Territories: $194 million; and
- Virtual Care Agreement: $46 million.
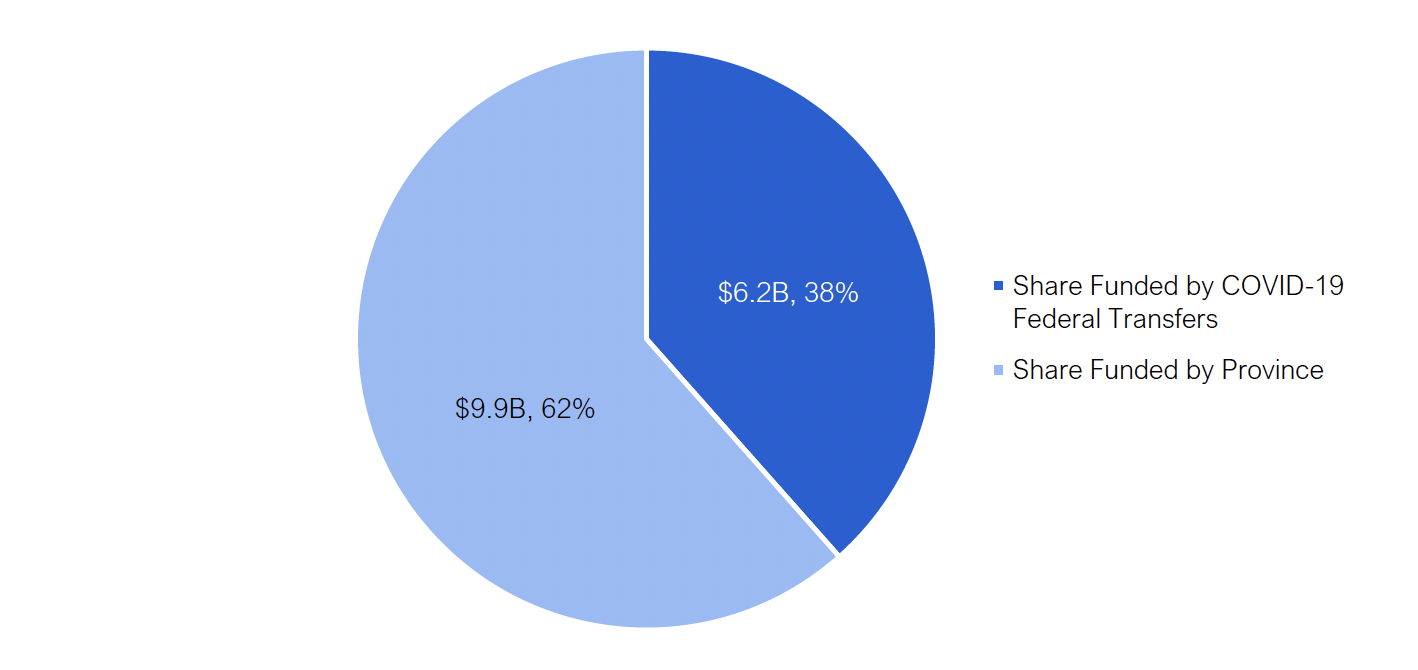
In total, temporary federal transfers will cover 38 per cent of the $16.0 billion in time-limited provincial COVID-19-related health sector spending from 2020-21 to 2022-23. This figure excludes $1.9 billion in federal health sector spending in Ontario for in-kind donations of supplies, as well as any other federal direct spending on health expenses, such as the purchasing of vaccines, support for contact tracing and health personnel.
Figure 3‑9 Share of time-limited COVID-19-related Ontario health sector spending funded by federal cash transfers, $ billions
Source: FAO calculations based on provincial information.
Accessible version
| Source of Fund | COVID-19-related Health Sector Spending ($ billions) |
Share of COVID-19-related Health Sector Spending (%) |
|---|---|---|
| Province | 9.9 | 62 |
| COVID-19 Federal Transfers | 6.2 | 38 |
4 | Program Review
This chapter reviews requested and projected spending for the Ministry of Health’s 2021-22 Expenditure Estimates by program vote (Supply Bill spending), standalone legislation (statutory) spending, and other spending (consolidation and other adjustments).
Note: “2020-21 Projected Spending” represents the interim spending forecast for 2020-21 from the 2021 Ontario Budget. The FAO will provide updated 2020-21 spending results in its upcoming Expenditure Monitor report for the fourth quarter of 2020-21.
Vote 1401 – Ministry Administration Program
The Ministry Administration Program supports the delivery of all programs and services offered by MOH. There are two sub-program (items) in this vote, with most of the spending contained in Item 1, Ministry Administration. Spending in Vote 1401 is largely for salaries, wages and employee benefits and services,[32] and does not include any transfer payment programs.
Overall, the spending request for Vote 1401 is up $3 million, or 3.3 per cent from 2020-21 projected spending. Salaries, wages and employee benefits accounts for most of the spending request increase. This is partially offset by lower planned services spending.
| Item | Ministry Administration Program (Vote 1401) |
2020-21 Projected Spending ($ millions) |
2021-22 Estimates ($ millions) |
1 Year Change ($ millions) |
1 Year Growth (%) |
|---|---|---|---|---|---|
| 1 | Ministry Administration | ||||
| Salaries, Wages and Employee Benefits | 53 | 57 | 4 | 8.0 | |
| Services | 33 | 31 | -2 | -5.9 | |
| Other Spending | 4 | 4 | < 1 | 2.1 | |
| Total Item | 90 | 92 | 2 | 2.6 | |
| 2 | Ontario Review Board | ||||
| Salaries, Wages and Employee Benefits | 1 | 1 | < 1 | 0.8 | |
| Services | 4 | 5 | 1 | 18.1 | |
| Other Spending | 1 | 1 | < 1 | 18.6 | |
| Total Item | 6 | 7 | 1 | 14.0 | |
| Total Supply Vote | 96 | 99 | 3 | 3.3 |
Vote 1402 – Health Policy and Research Program
The Health Policy and Research Program integrates research across the ministry to support legislation and policy development. This program vote includes only one sub-program (item), Health Policy and Research, which mostly consists of a transfer payment to support Clinical Education.
Overall, the 2021-22 spending request for vote 1402 is unchanged from 2020-21 projected spending. The funding increases for salaries, wages and employee benefits and services are offset by funding decreases for Clinical Education and the Applied Health Evidence Program.
| Item | Health Policy and Research Program (Vote 1402) |
2020-21 Projected Spending ($ millions) |
2021-22 Estimates ($ millions) |
1 Year Change ($ millions) |
1 Year Growth (%) |
|---|---|---|---|---|---|
| 1 | Health Policy and Research | ||||
| Clinical Education | 742 | 741 | -1 | -0.2 | |
| Applied Health Evidence Program | 34 | 28 | -6 | -18.1 | |
| Salaries, Wages and Employee Benefits | 15 | 18 | 3 | 22.5 | |
| Services | 6 | 9 | 3 | 58.2 | |
| Other Spending | 0 | 1 | < 1 | 79.7 | |
| Total Supply Vote | 797 | 797 | -0 | -0.0 |
Vote 1403 – Digital Health and Information Management Program
The Digital Health and Information Management Program supports the management of the Province’s health system information and technology, as well as data on health patients and providers. This program vote contains only one sub-program (item), Digital Health and Information Management. The sub-program includes two transfer payments, the largest of which is $264 million for Digital Health Strategy and Programs, which is up $32 million, or 14.0 per cent, from 2020-21 projected spending.
| Item | Digital Health and Information Management Program (Vote 1403) |
2020-21 Projected Spending ($ millions) |
2021-22 Estimates ($ millions) |
1 Year Change ($ millions) |
1 Year Growth (%) |
|---|---|---|---|---|---|
| 1 | Digital Health and Information Management | ||||
| Digital Health Strategy and Programs | 231 | 264 | 32 | 14.0 | |
| Health System Information Management | 26 | 27 | 1 | 5.5 | |
| Salaries, Wages and Employee Benefits | 20 | 20 | < 1 | 0.6 | |
| Services | 9 | 12 | 3 | 30.0 | |
| Other Spending | 0 | 1 | < 1 | 308.9 | |
| Total Supply Vote | 286 | 324 | 37 | 13.0 |
Vote 1405 – Ontario Health Insurance Program
The Ontario Health Insurance Program includes three sub-programs (items): Ontario Health Insurance ($17.5 billion), Drug Programs ($5.5 billion) and the Assistive Devices Program ($0.5 billion).
- Ontario Health Insurance (Item 1) funds coverage for over 6,000 health care services provided by physicians, optometrists, dental surgeons and podiatrists.[33]
- Drug Programs (Item 2) provides funding for Ontario’s six drug benefit programs and covers about 5,000 products, including prescription drugs, diabetic test strips and nutrition products.
- The Assistive Devices Program (Item 4) provides funding for people with long-term physical disabilities to pay for equipment such as wheelchairs and hearing aids.
In total, the Vote 1405 spending request is up $1.8 billion, or 8.2 per cent, from 2020-21 projected spending. Significant changes include:
- The Payments made for services and for care provided by physicians and practitionerstransfer payment is up 8.4 per cent, or $1.3 billion, in 2021-22. The increase represents the gradual resumption of normal volumes of physician services in 2021-22 following lower utilization in 2020-21 due to the COVID-19 pandemic.
- The Ontario Drug Programs transfer payment is up by 7.2 percent, or $367 million, in 2021-22. The increase is due to expected higher program utilization and drug costs.
- Quality Health Initiatives is up 308.3 per cent, or $45 million, in 2021-22.
- The Assistive Devices and Supplies Program is up 25.7 per cent, or $108 million, in 2021-22.
| Item | Ontario Health Insurance Program (Vote 1405) |
2020-21 Projected Spending ($ millions) |
2021-22 Estimates ($ millions) |
1 Year Change ($ millions) |
1 Year Growth (%) |
|---|---|---|---|---|---|
| 1 | Ontario Health Insurance | ||||
| Payments made for services and for care provided by physicians and practitioners | 15,649 | 16,962 | 1,313 | 8.4 | |
| Independent Health Facilities | 58 | 52 | -6 | -9.5 | |
| Underserviced Area Plan | 34 | 31 | -4 | -10.2 | |
| Northern Travel Program | 43 | 48 | 5 | 11.9 | |
| Teletriage Services | 66 | 25 | -41 | -62.3 | |
| Quality Management Program – Laboratory Services | 6 | 5 | -1 | -16.5 | |
| Midwifery Services | 216 | 204 | -13 | -5.9 | |
| Disease Prevention Strategy | 3 | 3 | < -1 | -6.8 | |
| Quality Health Initiatives | 15 | 60 | 45 | 308.3 | |
| Salaries, Wages and Employee Benefits | 50 | 53 | 3 | 6.2 | |
| Services | 20 | 17 | -3 | -14.3 | |
| Other Spending | 2 | 4 | 2 | 82.1 | |
| Total Item | 16,162 | 17,464 | 1,301 | 8.1 | |
| 2 | Drug Programs | ||||
| Ontario Drug Programs | 5,075 | 5,442 | 367 | 7.2 | |
| Salaries, Wages and Employee Benefits | 15 | 10 | -4 | -28.1 | |
| Services | 8 | 16 | 8 | 94.6 | |
| Other Spending | 1 | 1 | < -1 | -17.1 | |
| Total Item | 5,099 | 5,469 | 371 | 7.3 | |
| 4 | Assistive Devices Program | ||||
| Assistive Devices and Supplies Program | 419 | 526 | 108 | 25.7 | |
| Salaries, Wages and Employee Benefits | 4 | 4 | < -1 | -0.1 | |
| Services | 2 | 1 | -1 | -56.9 | |
| Other Spending | 0 | 1 | < 1 | 128.8 | |
| Total Item | 425 | 531 | 107 | 25.2 | |
| Total Supply Vote | 21,686 | 23,465 | 1,779 | 8.2 |
Vote 1406 – Population and Public Health Program
The Population and Public Health Program includes eight transfer payments under one item to support various health initiatives and programs. For 2021-22, the Province has created a new COVID-19 Response transfer payment program of $2.7 billion, which is intended to support testing, contact tracing and vaccination.[34] This program accounts for 58.3 per cent of the vote’s planned spending in 2021-22. The second largest transfer payment is $1.1 billion for Official Local Health Agencies (largely for Public Health Units), which is $92 million, or 9.2 per cent, higher than last year’s projected spending. In addition, planned spending for the Ontario Agency for Health Protection and Promotion transfer payment, which funds Public Health Ontario, is up $43 million, or 12.2 per cent, to $393 million.
Overall, the spending request for Vote 1406 is $2.6 billion, or 128.3 per cent, higher than 2020-21 projected spending, due to the creation of the COVID-19 Response transfer payment. Excluding this transfer payment, the spending request for Vote 1406 is down 4.9 per cent versus 2020-21 projected spending.
| Item | Population and Public Health Program (Vote 1406) |
2020-21 Projected Spending ($ millions) |
2021-22 Estimates ($ millions) |
1 Year Change ($ millions) |
1 Year Growth (%) |
|---|---|---|---|---|---|
| 4 | Population and Public Health | ||||
| Official Local Health Agencies | 992 | 1,084 | 92 | 9.2 | |
| Outbreaks of Diseases | 348 | 273 | -75 | -21.6 | |
| Tuberculosis Prevention | 9 | 9 | 0 | 0.0 | |
| Sexually Transmitted Disease Control | 4 | 2 | -2 | -53.1 | |
| Ontario Agency for Health Protection and Promotion | 351 | 393 | 43 | 12.2 | |
| Prevent Disease, Injury and Addiction | 63 | 68 | 6 | 9.0 | |
| Smoke-Free Ontario | 16 | 19 | 3 | 16.0 | |
| COVID-19 Response | 0 | 2,653 | 2,653 | ||
| Salaries, Wages and Employee Benefits | 17 | 19 | 2 | 11.8 | |
| Services | 185 | 26 | -159 | -85.8 | |
| Other Spending | 7 | 2 | -5 | -73.8 | |
| Total Supply Vote | 1,992 | 4,548 | 2,555 | 128.3 |
Vote 1407 – Health Capital Program
The Health Capital Program provides capital funding to health care facilities, including public hospitals, integrated health facilities and community sector health service providers. This vote includes seven transfer payments, the largest of which is $1.3 billion for Major Hospital Projects.
Overall, the spending request for Vote 1407 is $198 million, or 11.0 per cent, lower than 2020-21 projected spending. The spending request for Major Hospital Projects is $223 million, or 21.3 per cent, higher than 2020-21 projected spending. However, this request is more than offset by reduced funding for Small Hospital Projects, which is down $312 million, or 88.6 per cent, and Integrated Health Facility Programs, which is down $82 million, or 80.3 per cent. Small Hospital Projects had a one-time funding increase in 2020-21 due to spending on COVID-19 response measures.
| Item | Health Capital Program (Vote 1407) |
2020-21 Projected Spending ($ millions) |
2021-22 Estimates ($ millions) |
1 Year Change ($ millions) |
1 Year Growth (%) |
|---|---|---|---|---|---|
| 1 | Health Capital | ||||
| Major Hospital Projects | 1,047 | 1,270 | 223 | 21.3 | |
| Health Infrastructure Renewal Fund | 176 | 175 | -1 | -0.3 | |
| Small Hospital Projects | 352 | 40 | -312 | -88.6 | |
| Medical and Diagnostic Equipment Fund | 35 | 35 | 0 | 0.0 | |
| Community Health Programs | 68 | 45 | -24 | -35.0 | |
| Public Health Laboratories | 19 | 16 | -2 | -13.1 | |
| Integrated Health Facility Programs | 102 | 20 | -82 | -80.3 | |
| Other Spending | 4 | 4 | < 1 | 0.5 | |
| Total Supply Vote | 1,802 | 1,604 | -198 | -11.0 |
Vote 1412 – Provincial Programs and Stewardship
The Provincial Programs and Stewardship program includes three sub-programs (items): Provincial Programs ($1.3 billion), Emergency Health Services ($1.2 billion) and Stewardship (less than $0.1 billion). Provincial Programs includes four transfer payments that support various initiatives, the largest of which is $707 million for Canadian Blood Services. Emergency Health Services includes three transfer payments that support ambulance services. Stewardship does not include any transfer payments.
Overall, the spending request for Vote 1412 is $34 million, or 1.3 per cent, lower than 2020-21 projected spending. While the Canadian Blood Services transfer payment is $103 million, or 17.1 per cent, higher than 2020-21 projected spending, it is more than offset by decreases of $82 million for payments for municipal ambulance services, $25 million for Community and Priority Services, and $21 million for Air Ambulance.
| Item | Provincial Programs and Stewardship (Vote 1412) |
2020-21 Projected Spending ($ millions) |
2021-22 Estimates ($ millions) |
1 Year Change ($ millions) |
1 Year Growth (%) |
|---|---|---|---|---|---|
| 1 | Provincial Programs | ||||
| Operation of Related Facilities | 27 | 27 | 1 | 3.5 | |
| Canadian Blood Services | 603 | 707 | 103 | 17.1 | |
| HIV/AIDS and Hepatitis C Programs | 103 | 103 | -1 | -0.6 | |
| Community and Priority Services | 501 | 476 | -25 | -5.0 | |
| Total Item | 1,235 | 1,313 | 79 | 6.4 | |
| 2 | Emergency Health Services | ||||
| Payments for Ambulance and related Emergency Services: Municipal Ambulance | 956 | 874 | -82 | -8.6 | |
| Payments for Ambulance and related Emergency Services: Other Ambulance Operations and Related Emergency Services | 79 | 74 | -5 | -6.2 | |
| Air Ambulance | 222 | 200 | -21 | -9.6 | |
| Salaries, Wages and Employee Benefits | 62 | 55 | -7 | -11.9 | |
| Services | 10 | 10 | 1 | 8.2 | |
| Other Spending | 4 | 3 | -1 | -15.0 | |
| Total Item | 1,333 | 1,218 | -115 | -8.7 | |
| 4 | Stewardship | ||||
| Salaries, Wages and Employee Benefits | 37 | 38 | 1 | 3.3 | |
| Services | 6 | 7 | 1 | 12.3 | |
| Other Spending | 2 | 3 | < 1 | 11.4 | |
| Total Item | 46 | 48 | 2 | 4.9 | |
| Total Supply Vote | 2,613 | 2,579 | -34 | -1.3 |
Vote 1413 – Information Systems
The Information Systems program provides digital services to support MOH and MLTC programs. There are no transfer payments in this vote.
Overall, the spending request for Vote 1413 is $7 million, or 3.9 per cent higher than 2020-21 projected spending. The only material change in this vote from 2020-21 projected spending is a $5 million, or 4.7 per cent, increase in planned services spending.
| Item | Information Systems (Vote 1413) |
2020-21 Projected Spending ($ millions) |
2021-22 Estimates ($ millions) |
1 Year Change ($ millions) |
1 Year Growth (%) |
|---|---|---|---|---|---|
| 1 | Information Technology Services – Health Cluster | ||||
| Salaries, Wages and Employee Benefits | 55 | 55 | -0 | -0.0 | |
| Services | 108 | 113 | 5 | 4.7 | |
| Other Spending | 4 | 5 | 1 | 37.1 | |
| Total Supply Vote | 168 | 174 | 7 | 3.9 |
Vote 1416 – Health Services and Programs
Health Services and Programs includes three sub-programs (items): Health Services ($28.0 billion), Programs and Administration ($2.6 billion) and Digital Health Capital (less than $0.1 billion). The Health Services item includes three sub-items: Hospitals ($21.2 billion), which consists mostly of a transfer payment to fund hospital operations; Community ($4.8 billion), which includes five transfer payments that support home and community care programs; and Mental Health and Addictions ($2.0 billion).
Overall, the spending request for Vote 1416 is down $5.8 billion, or 16.0 per cent, from 2020-21 projected spending. The following transfer payments from Vote 1416 have the largest planned spending decreases in 2021-22 compared to 2020-21:
- Operation of Hospitals – down $4.8 billion, or 19.1 per cent;[35]
- Regional Coordination Operations Support – down $676 million, or 69.4 per cent;
- Digital Health – down $142 million, or 41.1 per cent;
- Home Care – down $102 million, or 3.0 per cent;
- Child and Youth Mental Health – down $71 million, or 14.0 per cent; and
- Cancer Treatment Services – down $55 million, or 2.8 per cent.
The following transfer payments from Vote 1416 have the largest planned spending increases in 2021-22 compared to 2020-21:
- Community Mental Health – up $241 million, or 22.8 per cent; and
- Digital Health Capital – up $8 million, or 78.9 per cent.
| Item | Health Services and Programs (Vote 1416) |
2020-21 Projected Spending ($ millions) |
2021-22 Estimates ($ millions) |
1 Year Change ($ millions) |
1 Year Growth (%) |
|---|---|---|---|---|---|
| 1 | Health Services | ||||
| Sub-Item: Hospitals | |||||
| Operation of Hospitals | 25,287 | 20,452 | -4,835 | -19.1 | |
| Grants to Compensate for Municipal Taxation – Hospitals | 4 | 4 | 0 | 0.0 | |
| Specialty Psychiatric Hospitals | 783 | 733 | -50 | -6.4 | |
| Grants to Compensate for Municipal Taxation – Specialty Psychiatric Hospitals | < 1 | < 1 | 0 | 0.0 | |
| Sub-Item: Community | |||||
| Home Care | 3,398 | 3,296 | -102 | -3.0 | |
| Community Support Services | 704 | 653 | -51 | -7.3 | |
| Assistive Living Services in Supportive Housing | 360 | 341 | -19 | -5.4 | |
| Community Health Centres | 515 | 483 | -32 | -6.2 | |
| Acquired Brain Injury | 67 | 65 | -2 | -3.2 | |
| Sub-Item: Mental Health and Addictions | |||||
| Community Mental Health | 1,060 | 1,302 | 241 | 22.8 | |
| Addiction Program | 283 | 254 | -28 | -9.9 | |
| Child and Youth Mental Health | 505 | 435 | -71 | -14.0 | |
| Total Item | 32,967 | 28,018 | -4,949 | -15.0 | |
| 2 | Programs and Administration | ||||
| Digital Health | 345 | 203 | -142 | -41.1 | |
| Health Quality Programs | 36 | 32 | -4 | -11.6 | |
| Regional Coordination Operations Support | 975 | 298 | -676 | -69.4 | |
| Cancer Treatment Services | 1,971 | 1,916 | -55 | -2.8 | |
| Organ and Tissue Donation and Transplantation Services | 59 | 59 | 0 | 0.0 | |
| Cancer Screening Programs | 93 | 93 | -0 | -0.0 | |
| Health Workforce Programs | 20 | 6 | -14 | -71.3 | |
| Total Item | 3,499 | 2,607 | -892 | -25.5 | |
| 3 | Digital Health Capital | ||||
| Digital Health Capital | 11 | 19 | 8 | 78.9 | |
| Total Supply Vote | 36,476 | 30,644 | -5,832 | -16.0 |
Standalone Legislation (Statutory) Spending
Standalone legislation (i.e., spending authorized by legislation other than the Supply Bill) primarily consists of $16 million in amortization expenses for ministry administration and information technology assets, which is 3.1 per cent higher than 2020-21 projected spending.
| Standalone Legislation (Statutory) Spending | 2020-21 Projected Spending ($ millions) |
2021-22 Estimates ($ millions) |
1 Year Change ($ millions) |
1 Year Growth (%) |
|---|---|---|---|---|
| Amortization | 15 | 16 | < 1 | 3.1 |
| Bad Debt Expense | < 1 | < 1 | < 1 | 50.0 |
| Salaries | < 1 | < 1 | 0 | 0.0 |
| Total Statutory Spending | 15 | 16 | 0 | 3.1 |
Other Spending
The financial results of organizations controlled by the Province, including hospitals and certain provincial agencies, are consolidated into the financial results of the Province. Adjustments are made through ‘other spending’ to account for spending by hospitals and agencies from sources other than transfer payments from the Province. Net capital adjustments are also made to reflect amortization expense, largely for hospital infrastructure.
Other spending (operating) is projected to increase by $2.4 billion, or 32.9 per cent versus 2020-21 projected spending. Other spending for hospital operations is up $1.0 billion, or 31.4 per cent, compared to 2020-21 projected spending. This indicates that the Province expects that there will be a significant increase in spending by hospitals from either third-party revenues or from hospital savings. Planned other spending by Ontario Health is up $1.3 billion, or 31.8 per cent. This planned spending largely reflects payments to long-term care home operators made by the Ministry of Long-Term Care that are recorded on the financial statements of Ontario Health and consolidated by the Ministry of Health.
Other spending (capital) is projected to increase by $0.2 billion, or 164.1 per cent, compared to 2020-21 projected spending, largely because of an increase in the hospitals capital consolidation adjustment.
| Other Spending | 2020-21 Projected Spending ($ millions) |
2021-22 Estimates ($ millions) |
1 Year Change ($ millions) |
1 Year Growth (%) |
|---|---|---|---|---|
| Operating | ||||
| Hospitals | 3,222 | 4,236 | 1,013 | 31.4 |
| Home and Community Care Support Services | -29 | 26 | 55 | 187.4 |
| ORNGE | -21 | -23 | -2 | -7.7 |
| Funding to Colleges | -6 | -3 | 3 | 51.1 |
| Ontario Agency for Health Protection and Promotion | -18 | -13 | 5 | 27.0 |
| Ontario Health | 4,024 | 5,304 | 1,280 | 31.8 |
| General Real Estate Portfolio | -7 | -7 | < 1 | 2.1 |
| Total Operating | 7,163 | 9,518 | 2,355 | 32.9 |
| Capital | ||||
| Hospitals | 122 | 357 | 235 | 191.9 |
| Home and Community Care Support Services | 3 | 3 | < -1 | -7.3 |
| ORNGE | 12 | 16 | 4 | 35.3 |
| Ontario Agency for Health Protection and Promotion | -13 | -6 | 7 | 52.2 |
| Ontario Health | 18 | 2 | -16 | -87.4 |
| General Real Estate Portfolio | -3 | -3 | < -1 | -0.9 |
| Total Capital | 140 | 369 | 229 | 164.1 |
| Total Other Spending | 7,303 | 9,887 | 2,584 | 35.4 |
Footnotes
[1] Volume 1 of the 2021-22 Expenditure Estimates is available here: https://www.ontario.ca/page/expenditure-estimates-volume-1-table-contents-2021-22.
[2] If the SCE does not deliver a report to the legislature by the third Thursday in November, then the Estimates are deemed to be passed by the SCE. Standing Orders of the Legislative Assembly of Ontario (SO 66(b)).
[3] For more information on Ontario Health, see FAO, “Expenditure Estimates 2019-20: Ministry of Health and Long-Term Care,” 2019.
[4] Total projected health sector spending in the 2021-22 Expenditure Estimates is $74.9 billion, which consists of $74.1 billion for the Ministry of Health and $0.8 billion for the Ministry of Long-Term Care.
[5] The ‘recovery plan’ in the 2021 budget is from 2024-25 to 2029-30 and provides details on the government’s plan to achieve a balanced budget.
[6] See FAO, “Expenditure Estimates 2019-20: Ministry of Health and Long-Term Care,” 2019, p. 8.
[7] Fore more information, see FAO, “Ontario Health Sector: Expense Trends and Medium-Term Outlook Analysis,” 2017.
[8] Ibid. See also, “Ontario Health Sector: 2019 Updated Assessment of Ontario Health Spending,” 2019, p. 12.
[9] FAO, “Long-Term Care Homes Program: A Review of the Plan to Create 15,000 New Long-Term Care Beds in Ontario,” 2019.
[10] Presentation to Ontario’s Long-Term Care COVID-19 Commission, slide 19. http://www.ltccommission-commissionsld.ca/presentations/pdf/Long-Term_Care_Home_Development_Foundational_Redacted_September_21_2020.pdf.
[11] The FAO will provide analysis of these commitments in an upcoming report.
[12] See below for more analysis on the outlook for hospital capacity.
[13] In response to the COVID-19 pandemic, the Province implemented physician fee codes that allow physicians to bill for virtual consultations. By June 2020, over 30 per cent of physician services were being performed via virtual care compared to none in 2019.
[14] 2021 Ontario Budget, p. 21.
[15] The cumulative health sector spending gap from 2021-22 to 2029-30 between the FAO’s forecast and the Province’s 2021 budget health sector spending plan is $61.9 billion.
[16] Between 2023 and 2029, Ontario’s population is projected to grow by 6.6 per cent. Over the same period, the number of Ontarians over the age of 65 is projected to increase much more rapidly, by 22 per cent.
[17] In the 2021 Ontario Budget, the Province reported total COVID-19 Health Response spending of $13.6 billion in 2020-21 and 2021-22 (p. 175). In addition, the FAO estimates that the $2.0 billion remaining in the Pandemic Fund in 2022-23 is available for health sector COVID-19-response spending and that there is an additional $0.5 billion in health sector COVID-19-response spending in 2022-23.
[18] Elective surgeries refer to surgeries that do not involve a medical emergency and therefore do not need to be performed immediately. These include procedures such as cataract, hip replacement, knee replacement, gallbladder and select cancer surgeries.
[19] Diagnostic procedures included in this analysis are adult and pediatric CT scans, MRI scans and cancer screening tests, such as fecal tests, screening mammograms, pap tests and screening MRIs.
[20] Ontario COVID-19 Science Advisory Table, “Update on COVID-19 Projections,” April 16, 2021.
[21] Ontario Ministry of Health. Directive #2 for Health Care Providers (Regulated Health Professionals or Persons who operate a Group Practice of Regulated Health Professionals).
[22] Total volumes of elective surgeries and diagnostic procedures completed in 2019 were calculated using information provided by the Ontario Ministry of Health and system performance data from Health Quality Ontario.
[23] The percentage over pre-pandemic volume was calculated based on procedure volume and does not reflect differences in operating time across different procedures.
[24] For context, results from a survey of 25 U.S. hospitals indicated that many hospitals are anticipating significant challenges in returning to pre-pandemic levels of surgical volumes. Hospitals indicated that the most significant challenges to increasing elective surgeries are workforce shortages, followed by limited inpatient bed availability and limited operating room capacity. Workforce shortages are related to postponed paid time off, child care requirements, staff illness and burnout. To increase surgical volume, U.S. hospitals are exploring options to extend hours of operation, hire additional staff, taking steps to limit patient cancellations, increasing use of virtual care, scheduling elective surgeries on weekends and reducing length of stay for inpatients. See McKinsey, Cutting through the COVID-19 surgical backlog, October 2020.
[25] Ontario Hospital Association, Ontario Hospitals – Leaders in Efficiency, December 2019.
[26] Specifically, the CHT supports the principles of the Canada Health Act, which are universality, comprehensiveness, portability, accessibility and public administration. While the CHT is notionally allocated to fund health spending, provinces may direct federal CHT funding to any area of provincial spending.
[27] https://www.theglobeandmail.com/politics/article-ottawa-will-increase-health-transfers-to-the-provinces-after-the/?utm_medium=Referrer:+Social+Network+/+Media&utm_campaign=Shared+Web+Article+Links.
[28] From 2010-11 to 2016-17, CHT funding to Ontario, under the previous funding agreement, grew by 5.3 per cent per year while Ontario’s health sector spending grew by an average annual rate of 2.6 per cent. As a result, the federal funding share of Ontario’s health sector spending increased from 21.2 per cent in 2011-12 to 24.9 per cent 2016-17. From 2016-17 to 2019-20, federal health transfers grew by 4.9 per cent per year while health sector spending grew by an average annual rate of 4.5 per cent, leading to a smaller increase in the federal government’s funding share of Ontario’s health sector spending over this period.
[29] PT Finance Ministers report to Council of the Federation (COF), The Canada Health Transfer will Help Make Provinces and Territories More Financially Sustainable Over the Long Term (March 4, 2021).
[30] 2021 Ontario Budget, pp. 58-59. The Province’s estimate is based on projections by the Council of the Federation, which estimated the 35 per cent funding gap between the CHT and all provincial-territorial health spending.
[31] Methodological differences also account for a portion of the difference in estimates. Specifically, the Province estimates its CHT funding gap as Ontario’s per capita share of the national CHT funding gap, estimated by the Council of the Federation. In contrast, the FAO estimates the CHT funding gap using projected Ontario health sector spending.
[32] ‘Services’ include advertising, communication, machine repairs and other items.
[33] Ministry of Health and Long-Term Care, “Schedule of Benefits for Physician Services,” June 2015.
[34] The FAO estimates that there is additional time-limited spending of about $1.8 billion related to the COVID-19 pandemic in the Ministry of Health’s 2021-22 Expenditure Estimates in the following vote-items: 1416-1, 1405-1, 1403-1 and 1412-2.
[35] The planned decrease of $4.8 billion in the Operation of Hospitals transfer payment is partially offset by a planned increase of $1.0 billion in other spending for hospital operations.