


1. Summary
This report reviews the Government of Ontario’s (the Province’s) 10-year infrastructure spending plan (the capital plan) in the 2025 Ontario Budget.
2025 Capital Plan
- The capital plan in the 2025 Ontario Budget is a 10-year spending projection for infrastructure that is owned and controlled by the Province, and for other entities that receive funding from the Province.
- The capital plan represents the outcome of an annual planning and budgeting process between ministries and Treasury Board Secretariat, in which ministries first identify their infrastructure funding needs and then obtain spending approval from Treasury Board Secretariat.
- The capital plan contains discrete costs for specific projects but also more general funding envelopes. When ministries identify a new project, funding may be allocated from existing general funding envelopes, so the amounts budgeted in the capital plan may not change. However, for other types of projects, funding may be added to future capital plans as the project progresses through various stages. This means that the full cost for some projects may not be included in the 2025 capital plan.
- The 2025 capital plan totals $223.1 billion over the 10-year period from 2025-26 to 2034-35. Of the $223.1 billion capital plan:
- $191.1 billion (86 per cent) is for investments in capital assets (infrastructure that is owned or controlled by the Province, such as hospitals, colleges, schools and highways) and $31.9 billion (14 per cent) is for capital expenses (mostly transfer payments to outside entities that are not owned or controlled by the Province, such as municipalities, long-term care homes and universities).
- The Province plans to contribute $184.6 billion (83 per cent) of the total cost of the capital plan, the federal and municipal governments are expected to contribute $16.3 billion (seven per cent), and third parties (primarily colleges, hospitals and schools) are expected to contribute $22.2 billion (10 per cent) from their own sources, such as fees and donations.
- The FAO estimates that $128.2 billion (57 per cent) of the capital plan is allocated for expansion (building new assets or expanding existing ones) and $94.9 billion (43 per cent) is allocated for the renewal and modernization of existing assets.
- By sector, health accounts for the largest share of the capital plan at $61.1 billion (27 per cent), followed by transit ($60.7 billion, 27 per cent), provincial highways and other transportation ($31.3 billion, 14 per cent), education ($30.1 billion, 13 per cent), ‘other’ ($28.2 billion, 13 per cent), postsecondary education ($5.1 billion, two per cent), justice ($4.3 billion, two per cent) and social ($2.4 billion, one per cent).
- See Chapter 3 and the Appendix for more details by sector.
Capital Plan Trends
- In order to better compare capital plan trends over time, the FAO adjusted planned and actual capital spending from nominal to real dollars.[1]
- After adjusting for inflation, the FAO estimates that the Province’s 10-year capital plan of $223.1 billion in nominal terms becomes $203.4 billion in real 2025 dollars.
- Looking at the 10-year $203.4 billion capital plan in real dollars, $93.2 billion (46 per cent) is expected to be spent over the first three years, with the remaining $110.1 billion (54 per cent) expected to be spent over the last seven years.
- On an average annual basis, spending is expected to average $31.1 billion per year over the first three years and $15.7 billion per year over the last seven years.
- By sector, average annual spending is projected to be higher for every sector over the first three years compared to the last seven years.
- Average annual spending declines relatively less in the second period for the health and education sectors, as although some projects have yet to be identified for those years, general funding envelopes are included in the capital plan.
- Average annual spending declines relatively more in the transit, justice, social and ‘other’ sectors, as the capital plan in these sectors includes more items on a project-centric or initiative basis, and these projects have either yet to be identified, or have yet to be included at their full estimated costs given that they are in the early stages of planning and development.
- Compared to the 10-year 2019 capital plan, the 2025 capital plan is $30.9 billion (17.9 per cent) higher in real dollars.
- As noted, changes in infrastructure spending across capital plans may occur due to either the progression and completion of a project, the addition of a new project, updated cost estimates or timing for existing projects, or changes in general funding envelopes.
- By sector, real planned 10-year spending in the 2025 capital plan compared to the 2019 capital plan is higher in health ($23.6 billion, 75 per cent), ‘other’ ($12.1 billion, 87 per cent), education ($6.3 billion, 31 per cent), provincial highways and other transportation ($2.9 billion, 11 per cent) and postsecondary education ($1.2 billion, 35 per cent). Conversely, real planned 10-year spending in the 2025 capital plan compared to the 2019 capital plan is lower for transit (-$13.5 billion, -20 per cent), justice (-$1.3 billion, -25 per cent) and social (-$0.4 billion, -15 per cent).
- The FAO estimates that the 2025 budget 10-year capital plan of $203.4 billion (in real dollars) from 2025-26 to 2034-35 is a total of $1.6 billion (-0.8 per cent) lower than the $205.0 billion in actual real capital spending over the last 10 years, from 2015-16 to 2024-25.
- By sector, health ($17.7 billion, 47 per cent), ‘other’ ($7.1 billion, 37 per cent) and justice ($0.8 billion, 25 per cent) are projected to have higher real spending over the next 10 years compared to actual spending over the last 10 years, while transit (-$11.4 billion, -17 per cent), provincial highways and other transportation (-$6.0 billion, -18 per cent), postsecondary education (-$5.0 billion, -52 per cent), social (-$3.4 billion, -60 per cent) and education (-$1.4 billion, -5 per cent), are projected to have lower spending.
2. Introduction
At the request of a Member of Provincial Parliament, this report reviews the Government of Ontario’s (the Province’s) 10-year infrastructure spending plan (the capital plan) in the 2025 Ontario Budget. The report examines Ontario’s capital plan by analyzing how planned infrastructure spending is allocated across sectors, funding sources and types of projects, and compares the 2025 capital plan to previous budget capital plans and to actual infrastructure spending over the past 10 years. This report is part of a series on provincial infrastructure planning; a subsequent report will analyze major projects within the capital plan.
The report is organized as follows:
- Chapter 3 provides an overview of the 10-year capital plan in the 2025 Ontario Budget, including a breakdown of total planned infrastructure expenditures by type of spending (investments in capital assets versus capital expenses), funding source (provincial, federal, municipal and third-party), function (expansion versus renewal and modernization) and sector.
- Chapter 4 provides an overview of capital plan trends, including a breakdown of the 2025 capital plan by time period (the first three years versus the remaining seven years of the plan), a comparison of the 2025 capital plan to capital plans in recent Ontario budgets, and a comparison to actual infrastructure spending over the previous 10 years, in inflation-adjusted (real) terms.
- The Appendix provides additional details on the capital plan by sector: health, transit, provincial highways and other transportation, education, postsecondary education, justice, social, and ‘other’.
Scope
This report reviews the Province’s 10-year capital plan in the 2025 Ontario Budget, covering total planned infrastructure expenditures of $223.1 billion from 2025-26 to 2034-35. The analysis includes both investments in capital assets owned or controlled by the Province and capital expenses, primarily transfer payments to non-consolidated entities and certain maintenance-related expenses. The report does not assess the adequacy of the capital plan relative to infrastructure needs or provide project-level value-for-money or economic impact analysis.
Methodology and Sources
The analysis is based on information provided by Treasury Board Secretariat and the Ministry of Infrastructure, which includes detailed breakdowns of the 10-year capital plan, supplemented with information provided by various ministries and agencies,[2] and publicly available budget documents. Planned expenditures are presented in nominal dollars unless otherwise noted; where capital plan trends are presented, the FAO converts values to constant 2025 dollars using the price index for ‘general governments gross fixed capital formation’ from Statistics Canada.[3] Where necessary, the FAO applies classification assumptions (e.g., between expansion and renewal and modernization) based on program descriptions and ministry-level information. As with all long-term capital plans, these estimates are subject to future changes in project scope, timing and cost.
3. 2025 Capital Plan
Overview
The capital plan in the 2025 Ontario Budget is a 10-year projection of funding for infrastructure that is owned and consolidated by the Province, as well as for non-consolidated entities. It represents the outcome of an annual planning and budgeting process between ministries and Treasury Board Secretariat, in which ministries first identify their infrastructure funding needs and then obtain spending approval from Treasury Board Secretariat. The capital plan contains discrete costs for specific projects but also more general funding envelopes. When ministries identify a new project, funding may be allocated from existing general funding envelopes, so the amounts budgeted in the capital plan may not change. However, for other types of projects, funding may be added to future capital plans as the project progresses through various stages. This means that the full cost for some projects may not be included in the 2025 capital plan.
The following sections analyze total planned infrastructure expenditures in the 2025 Ontario Budget by type of spending, source of funding, function (i.e., expansion versus renewal) and sector.
Breakdown by Type of Spending
The capital plan in the 2025 budget includes total planned infrastructure expenditures of $223.1 billion over the 10-year period from 2025-26 to 2034-35. This includes $191.1 billion (86 per cent) for investments in capital assets and $31.9 billion (14 per cent) in capital expenses, which are mostly for transfer payments to non-consolidated entities.
| $ billions | Share (%) | |
|---|---|---|
| Investment in Capital Assets | 191.1 | 86 |
| Capital Expenses | 31.9 | 14 |
| Total Infrastructure Expenditures (Capital Plan) | 223.1 | 100 |
The $191.1 billion in investments in capital assets is for constructing and rehabilitating tangible infrastructure that is owned or controlled by the Province, such as building or renovating hospitals, colleges, schools and highways.[4] These investments are not expensed and do not immediately impact the budget balance.[5] However, the cost of these capital investments will increase the Province’s net debt position.[6]
The $31.9 billion in capital expenses is mostly for transfer payments to outside entities that are not owned or controlled by the Province, such as municipalities, long-term care homes and universities. Also included are some expenses related to the maintenance of government assets, such as for minor capital repairs.[7] All capital expenses are immediately expensed and impact both net debt and the budget balance.
Breakdown by Funding Source
The capital plan in the 2025 budget is funded not only by the Province but also by other levels of government and third parties, which mostly include hospitals, school boards and colleges. Of the $223.1 billion in total infrastructure expenditures, the provincial government plans to contribute $184.6 billion (83 per cent) of the total cost, and the federal and municipal governments are expected to contribute $16.3 billion (seven per cent) of the total cost. Lastly, third parties (primarily colleges, hospitals and schools) are expected to contribute $22.2 billion (10 per cent) of the total cost of the capital plan in the 2025 Ontario Budget.[8]
| $ billions | Share (%) | |
|---|---|---|
| Province | 184.6 | 83 |
| Federal & Municipal Contributions | 16.3 | 7 |
| Third-Party Contributions | 22.2 | 10 |
| Total Infrastructure Expenditures (Capital Plan) | 223.1 | 100 |
Breakdown by Function
Of the $223.1 billion in total planned infrastructure expenditures, the FAO estimates that $128.2 billion (57 per cent) is allocated for expansion (building new assets or expanding existing ones) and $94.9 billion (43 per cent) is allocated for the renewal and modernization of existing assets. This includes replacing an asset with a brand new one or making improvements to an existing asset without increasing its capacity.[9]
| $ billions | Share (%) | |
|---|---|---|
| Expansion | 128.2 | 57 |
| Renewal & Modernization | 94.9 | 43 |
| Total Infrastructure Expenditures (Capital Plan) | 223.1 | 100 |
Breakdown by Sector
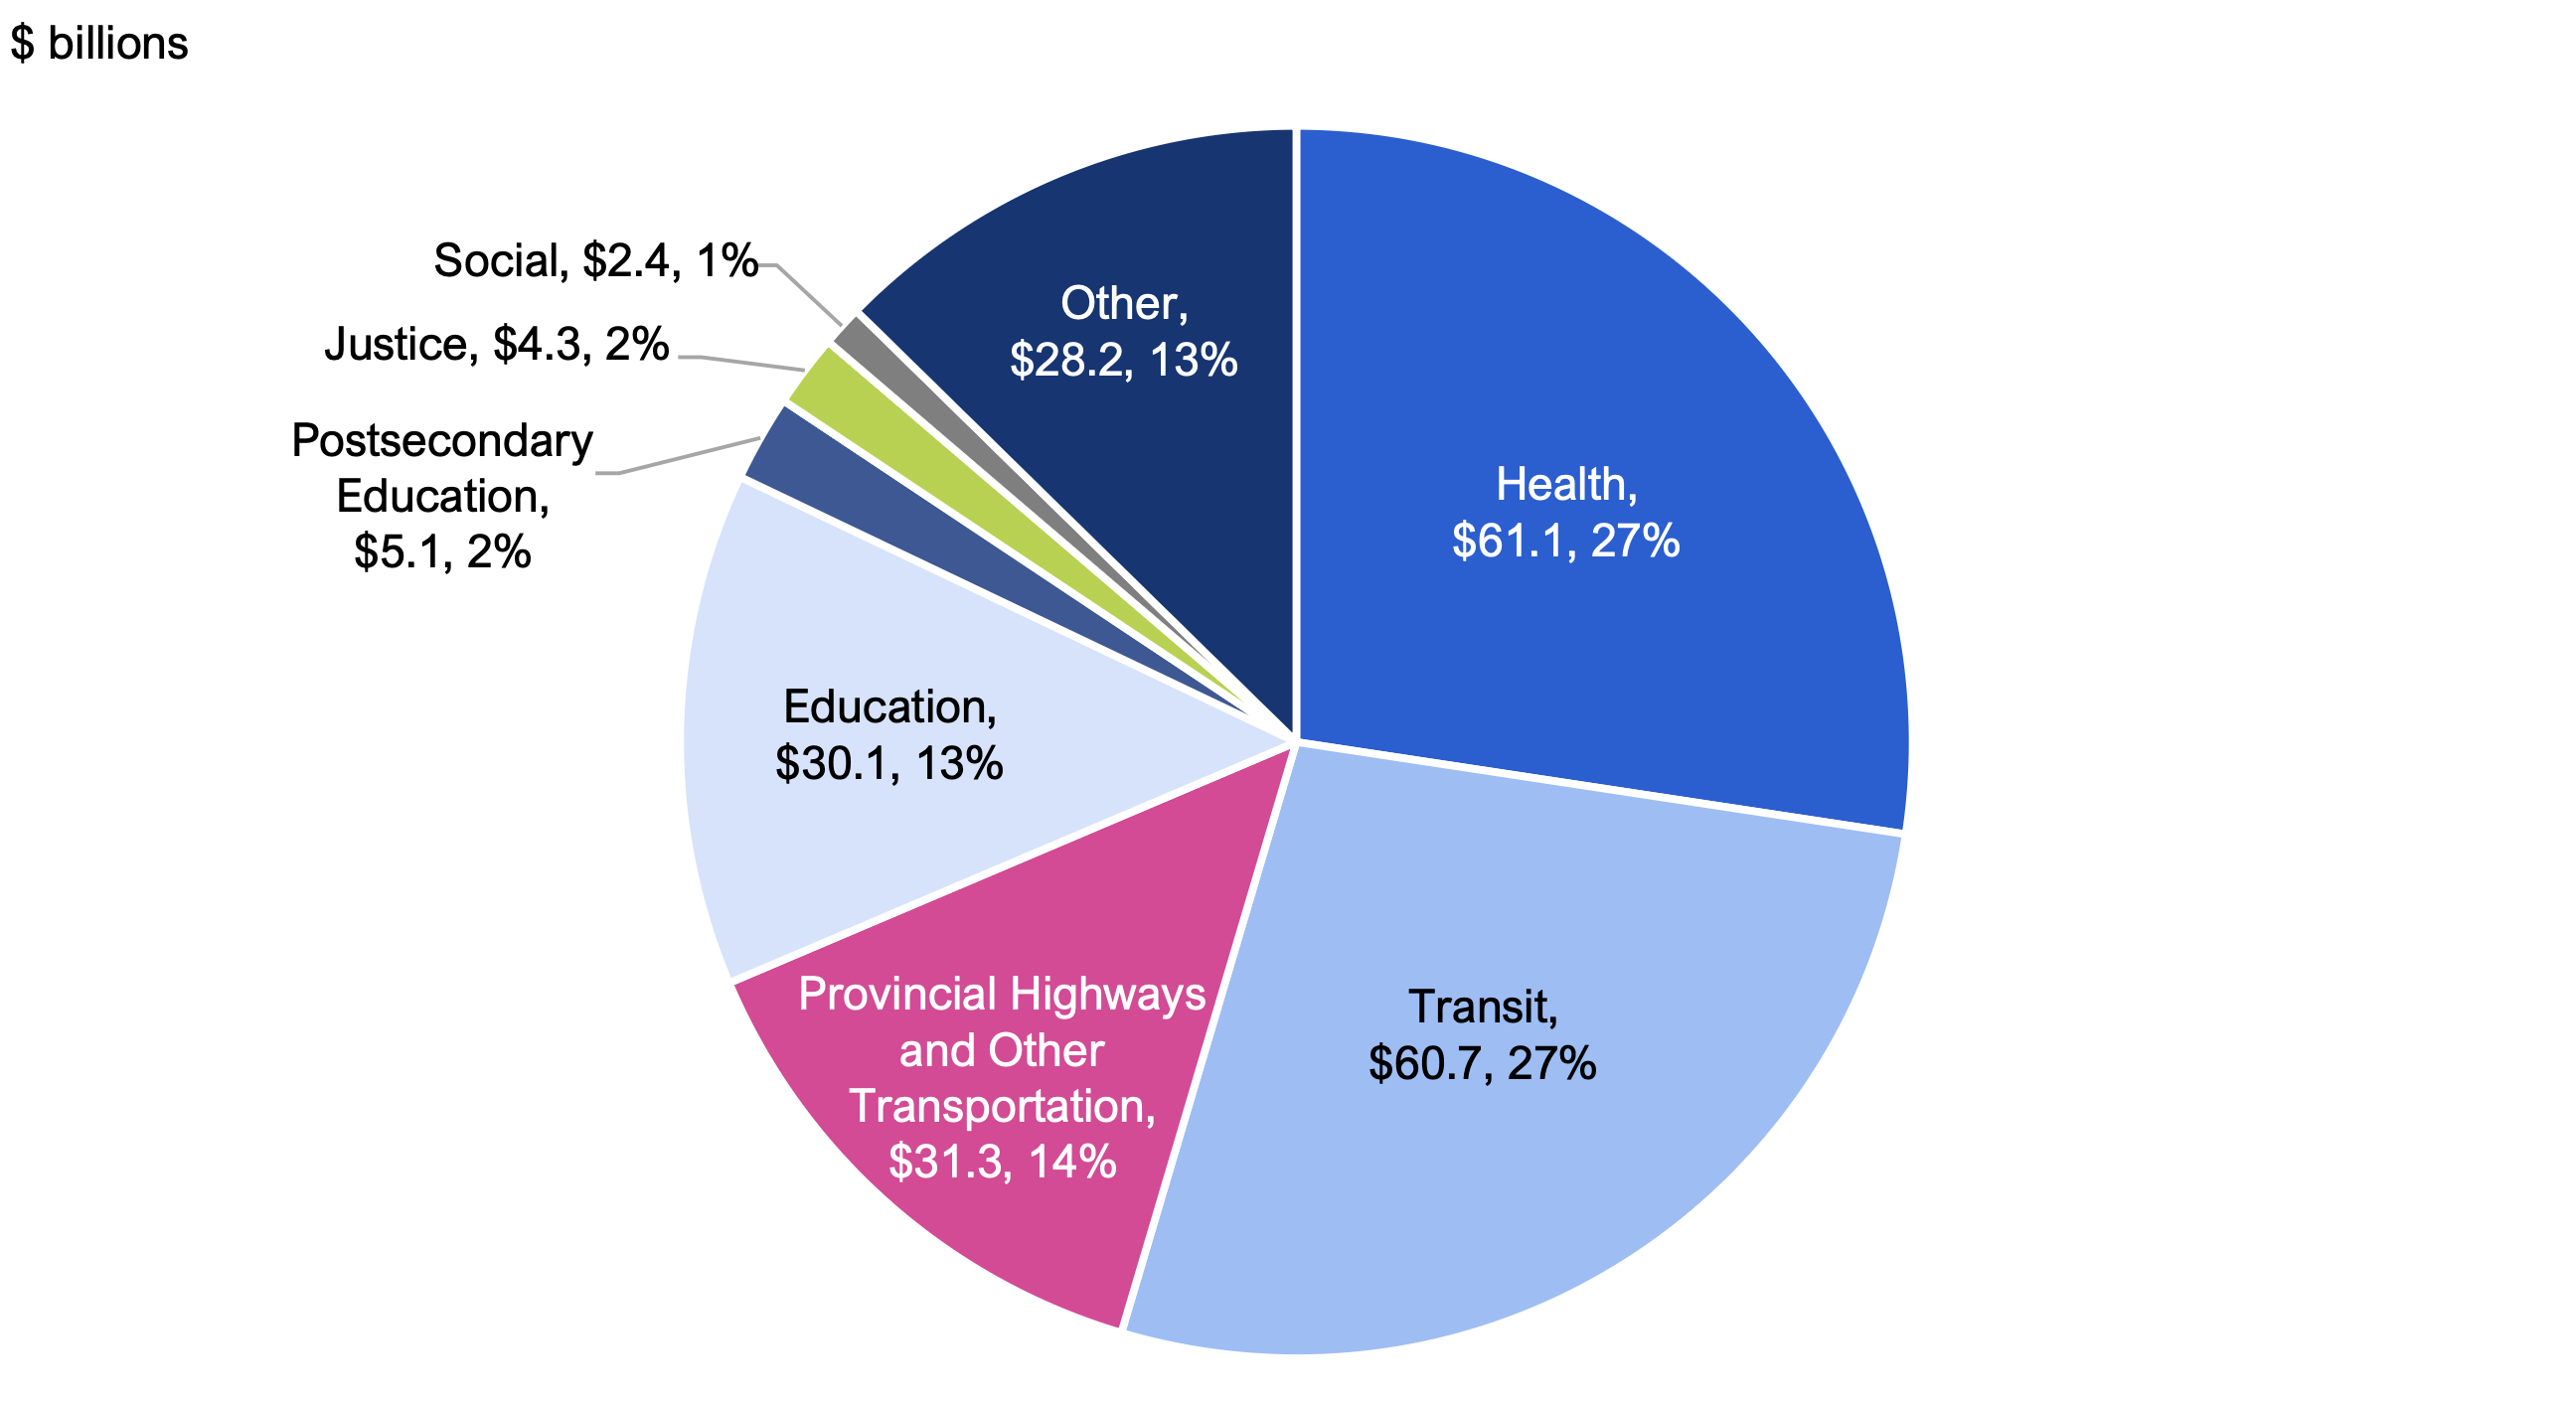
Of the $223.1 billion in total planned infrastructure expenditures in the 2025 budget 10-year capital plan, the health sector accounts for the largest share at $61.1 billion (27 per cent). The next largest sector is transit at $60.7 billion (27 per cent), followed by provincial highways and other transportation at $31.3 billion (14 per cent). The education sector accounts for $30.1 billion (13 per cent), the postsecondary education sector accounts for $5.1 billion (two per cent), the justice sector accounts for $4.3 billion (two per cent) and the social sector accounts for $2.4 billion (one per cent). Lastly, a variety of other programs combine to make the ‘other’ sector at $28.2 billion, or 13 per cent of the total capital plan.
Figure 3.1 2025 Ontario Budget 10-year capital plan by sector
Source: FAO analysis of information provided by the Province.
Accessible version
| $ billions | Share (Per Cent) | |
|---|---|---|
| Health | $61.1 | 27% |
| Transit | $60.7 | 27% |
| Provincial Highways and Other Transportation | $31.3 | 14% |
| Education | $30.1 | 13% |
| Postsecondary Education | $5.1 | 2% |
| Justice | $4.3 | 2% |
| Social | $2.4 | 1% |
| Other | $28.2 | 13% |
By sector:
- Health infrastructure spending of $61.1 billion is mostly for the expansion, renewal and modernization of hospital infrastructure ($54.1 billion), with the remaining $7.0 billion mostly for transfer payments to long-term care home operators and community health centres. The FAO estimates that of the total $54.1 billion hospital budget, 60 per cent has been allocated to specific projects, with the remainder in a general funding envelope.[10] In addition, the FAO estimates that 55 per cent of the total $54.1 billion hospital budget has been allocated for expansion projects, with the remainder allocated for renewal and modernization.
- Transit infrastructure spending of $60.7 billion is mostly for provincially owned projects through Metrolinx and the Ontario Northland Transportation Commission ($34.6 billon), as well as funding for the expansion, renewal and modernization of GO Transit infrastructure ($19.6 billon). There is also $6.4 billion in other spending, which includes funding through the Gas Tax program and other transfers to municipalities. Overall, the FAO estimates that about 90 per cent of the transit budget is for expansion, with the remaining 10 per cent allocated for renewal and modernization.
- Provincial highways and other transportation infrastructure spending of $31.3 billion is for provincially owned highways, bridges and other related structures ($28.2 billion), and ‘other’ spending ($3.1 billion), which includes funding for other types of infrastructure owned by the Province and transfer payments to municipalities. Overall, the FAO estimates that about 56 per cent of the sector’s budget is for renewal and modernization, with 44 per cent allocated for expansion. There are specific budget items for major projects, such as the Bradford Bypass, as well as general funding envelopes. The FAO estimates that about 31 per cent of the sector’s budget has been allocated to specific projects.
- Education infrastructure spending of $30.1 billion includes $26.4 billion for school buildings[11] and $3.7 billion in ‘other’ spending. The $3.7 billion in ‘other’ spending is largely for non-buildings infrastructure at schools and child care transfer payments. The FAO estimates that of the total $26.4 billion budget for school buildings, 22 per cent has been allocated to specific projects, with the remainder in a general funding envelope. Overall, the FAO estimates that about 60 per cent of the school building budget has been allocated for renewal and modernization.
- Postsecondary education infrastructure spending of $5.1 billion is for colleges ($3.6 billion), transfer payments to universities ($1.4 billion) and a small amount of other spending. The FAO estimates that about two-thirds of the colleges budget is for expansion, with one-third for renewal and modernization, and that transfers to universities are mostly for renewal and modernization.
- Justice infrastructure spending of $4.3 billion is mostly for the renewal and modernization of correctional facilities, courthouses and infrastructure for the Ontario Provincial Police (OPP). Overall, about two-thirds of the sector’s renewal budget has been allocated to specific projects, with the remainder in a general funding envelope. Nearly all of the expansion budget has been allocated to specific projects, such as the Quinte Detention Centre expansion project.
- Social infrastructure spending of $2.4 billion is mostly for transfer payments related to housing programs ($1.9 billion), which includes the National Housing Strategy (NHS) and other provincial supports. Other social capital spending of $0.5 billion includes spending for Children’s Aid Societies and expenses for asset renewal and modernization.
- ‘Other’ infrastructure spending of $28.2 billion includes a variety of investments for provincially owned infrastructure, as well as transfer payments to non-consolidated entities. The FAO estimates that $9.9 billion is allocated for the Province’s General Real Estate Portfolio (GREP) and $5.9 billion is allocated for other consolidated infrastructure, mostly in the tourism, parks and natural resources areas. The FAO estimates $12.5 billion in capital expenses, which includes funding for municipalities, broadband internet and other infrastructure, expenses related to the maintenance of provincial infrastructure, and contingency items.
See the Appendix for more details by sector.
4. Capital Plan Trends
This chapter provides an overview of capital plan trends, including a breakdown of the capital plan in the 2025 Ontario Budget by time period (the first three years versus the remaining seven years of the plan), a comparison of the 2025 capital plan to capital plans in recent Ontario budgets and a comparison to actual infrastructure spending over the previous 10 years. In this chapter, infrastructure expenditures are adjusted for inflation (i.e., presented in real 2025 dollars).[12] After adjusting for inflation, the Province’s 10-year infrastructure plan of $223.1 billion in nominal terms becomes $203.4 billion in real terms.
Breakdown by Period
Table 4.1 shows the Province’s 10-year capital plan of $203.4 billion (in real 2025 dollars) broken into two periods: total planned spending over the first three years from 2025-26 to 2027-28, which represents the Province’s medium-term outlook in the 2025 budget, and over the last seven years from 2028-29 to 2034-35. Overall, the 2025 budget expects 46 per cent of the total capital plan to be spent over the first three years, at $93.2 billion, with the remaining $110.1 billion (54 per cent) to be spent over the last seven years. On an average annual basis, spending is planned to average $31.1 billion per year over the first three years and $15.7 billion per year over the last seven years.
| Total Real Planned Spending ($ billions) | Average Annual Real Planned Spending ($ billions) | |||
|---|---|---|---|---|
| Sector | 2025-26 to 2027-28 | 2028-29 to 2034-35 | 2025-26 to 2027-28 | 2028-29 to 2034-35 |
| Health | 20.3 | 35.0 | 6.8 | 5.0 |
| Transit | 28.8 | 26.9 | 9.6 | 3.8 |
| Provincial Highways and Other Transportation | 12.2 | 16.2 | 4.1 | 2.3 |
| Education | 10.2 | 16.9 | 3.4 | 2.4 |
| Postsecondary Education | 2.1 | 2.5 | 0.7 | 0.4 |
| Justice | 2.5 | 1.5 | 0.8 | 0.2 |
| Social | 1.7 | 0.5 | 0.6 | 0.1 |
| Other | 15.4 | 10.7 | 5.1 | 1.5 |
| Total | 93.2 | 110.1 | 31.1 | 15.7 |
Total spending is projected to be higher over the last seven years compared to the first three years for the health, provincial highways and other transportation, education and postsecondary education sectors. However, for the transit, justice, social and ‘other’ sectors, total spending is projected to be lower over the last seven years compared to the first three years.
On an average annual basis, spending is projected to be higher for every sector over the first three years compared to the last seven years. Average annual spending declines relatively less in the second period for the health and education sectors, as although some projects have yet to be identified for those years, general funding envelopes are included in the capital plan. Conversely, average annual spending declines relatively more in the transit, justice, social and ‘other’ sectors, as the capital plan in these sectors includes more items on a project-centric or initiative basis, and these projects have either yet to be identified, or have yet to be included at their full estimated costs given that they are in the early stages of planning and development.
Comparison to Previous Capital Plans
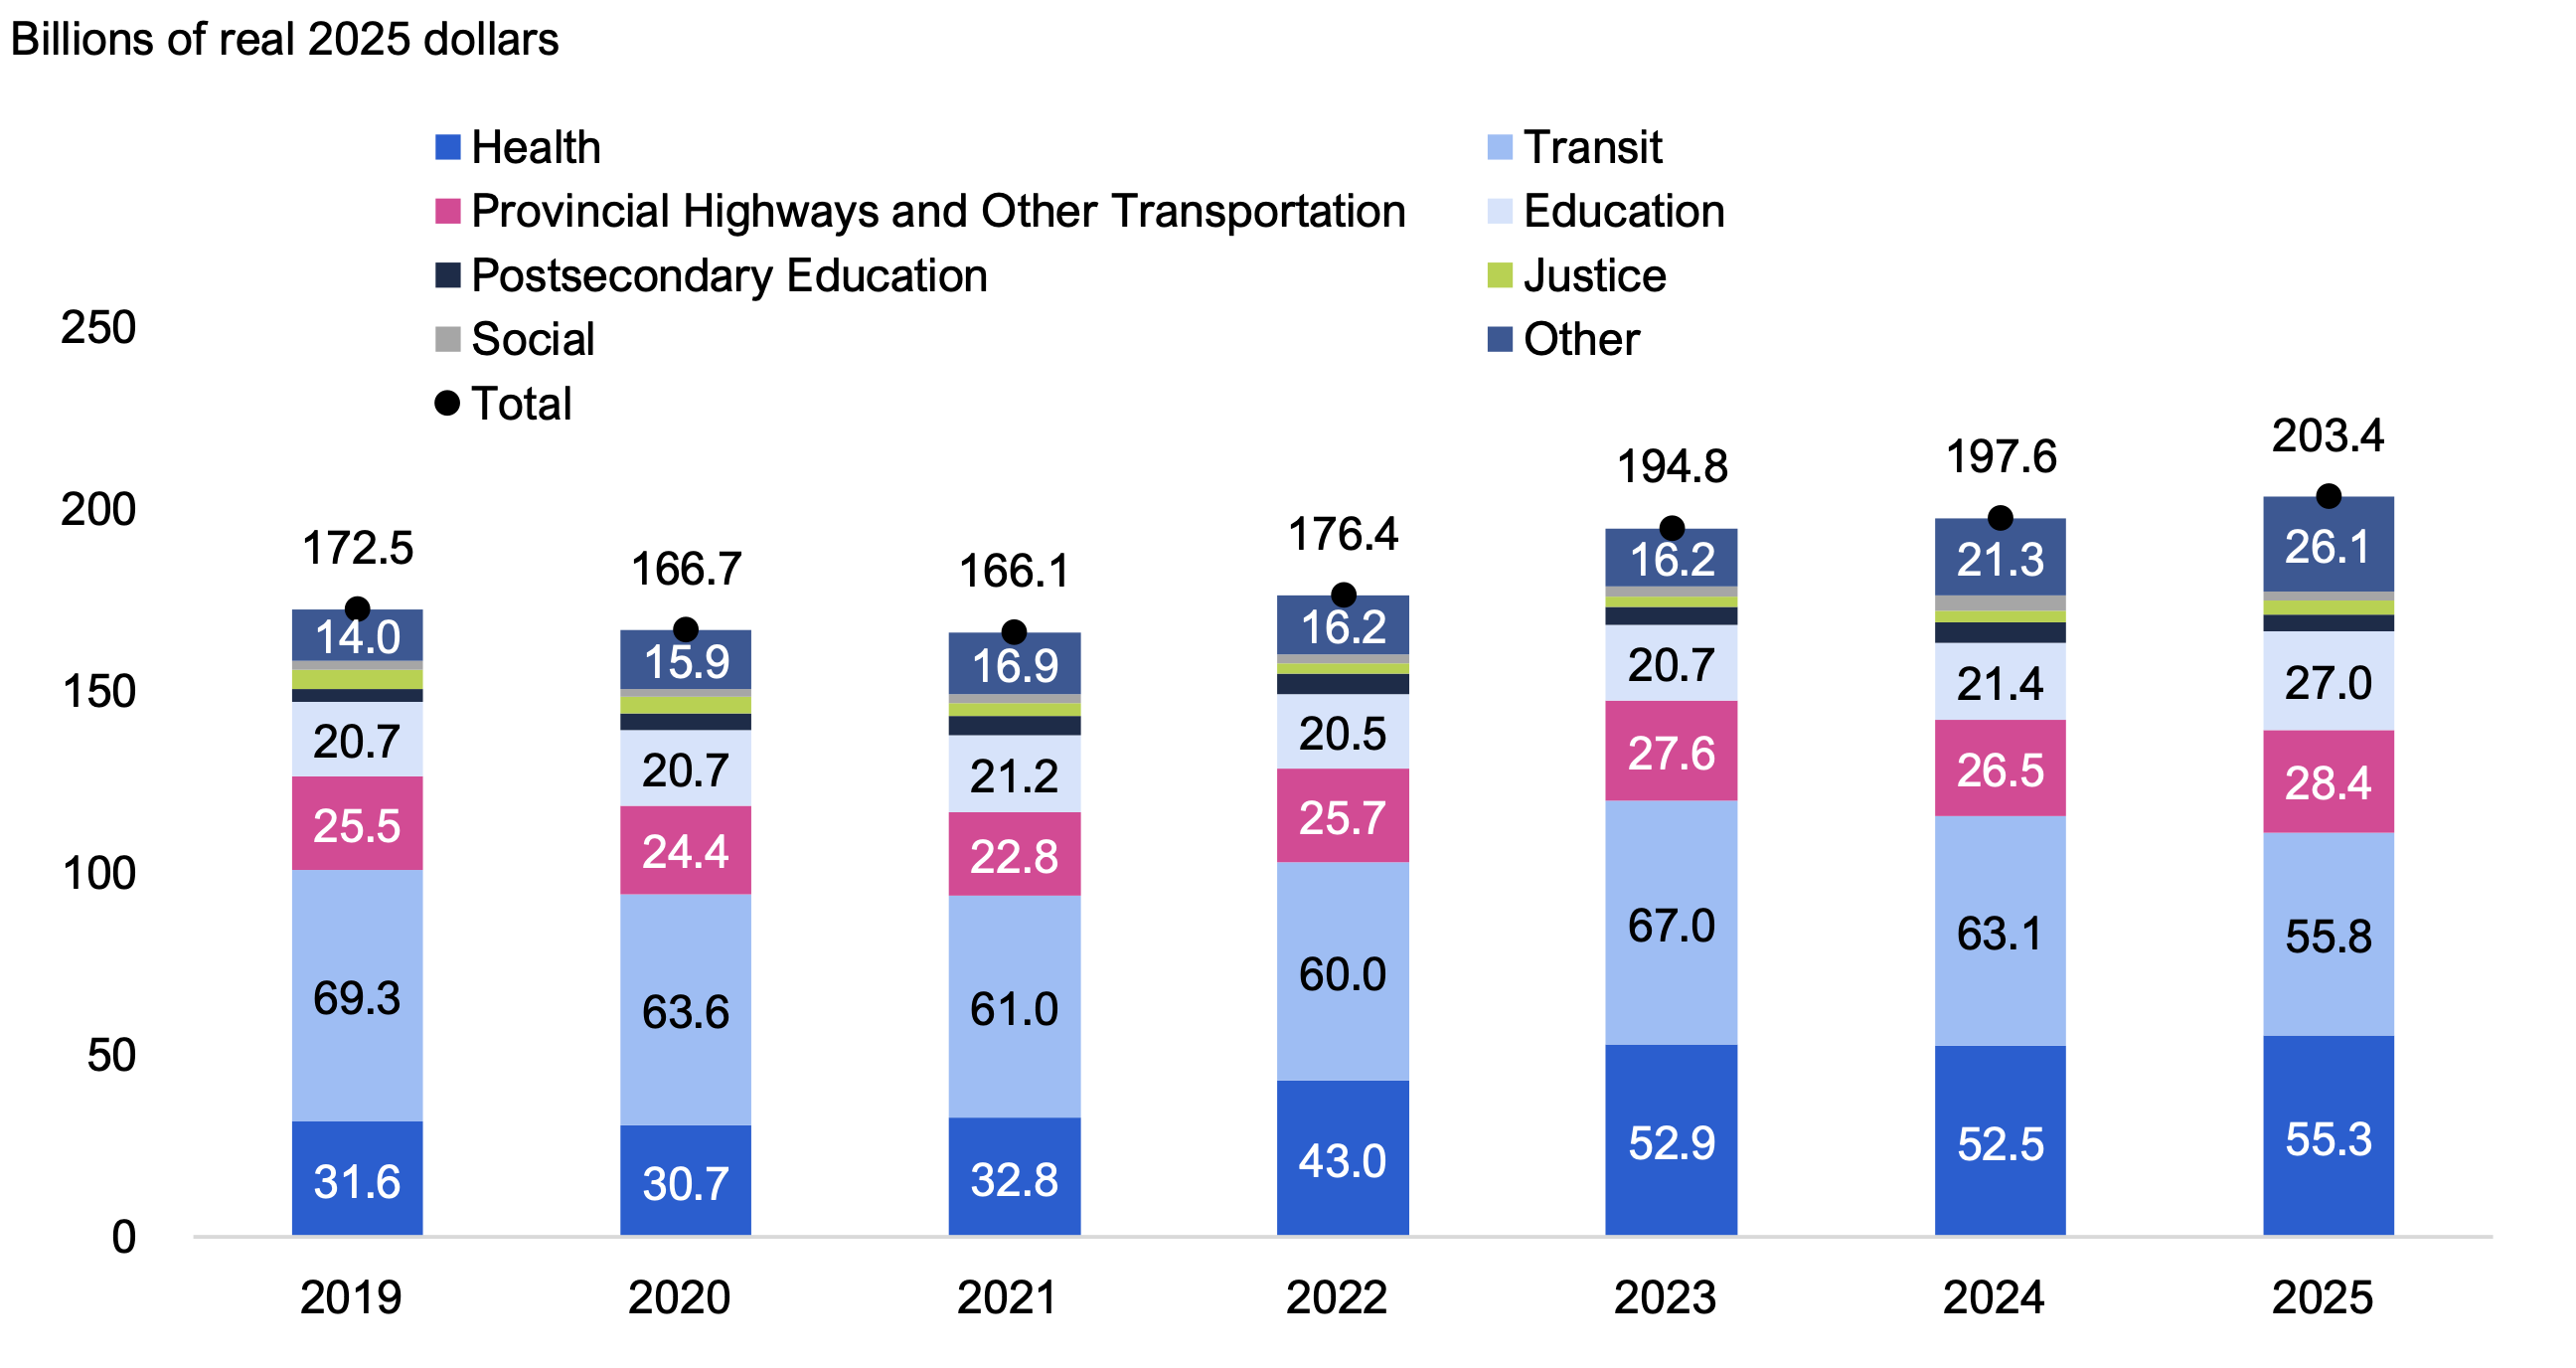
Figure 4.1 shows the 10-year capital plans from each of the last seven Ontario budgets,[13] presented in real 2025 dollars. In the 2025 Ontario Budget, the 10-year capital plan consists of $203.4 billion in real planned spending. This is $30.9 billion (17.9 per cent) higher than the 10-year capital plan in the 2019 Ontario Budget of $172.5 billion. As previously noted, changes in infrastructure spending across capital plans may occur due to either the progression and completion of a project, the addition of a new project, updated cost estimates or timing for existing projects, or changes in general funding envelopes.
Figure 4.1 10-year capital plans from the last seven Ontario budgets
Source: FAO analysis of information provided by the Province.
Accessible version
| 2019 | 2020 | 2021 | 2022 | 2023 | 2024 | 2025 | |
|---|---|---|---|---|---|---|---|
| Health | 31.6 | 30.7 | 32.8 | 43.0 | 52.9 | 52.5 | 55.3 |
| Transit | 69.3 | 63.6 | 61.0 | 60.0 | 67.0 | 63.1 | 55.8 |
| Provincial Highways and Other Transportation | 25.5 | 24.4 | 22.8 | 25.7 | 27.6 | 26.5 | 28.4 |
| Education | 20.7 | 20.7 | 21.2 | 20.5 | 20.7 | 21.4 | 27.0 |
| Postsecondary Education | 3.4 | 4.4 | 5.3 | 5.6 | 5.1 | 5.6 | 4.6 |
| Justice | 5.3 | 4.6 | 3.7 | 2.7 | 2.9 | 3.2 | 4.0 |
| Social | 2.6 | 2.4 | 2.4 | 2.8 | 2.5 | 3.9 | 2.2 |
| Other | 14.0 | 15.9 | 16.9 | 16.2 | 16.2 | 21.3 | 26.1 |
| Total | 172.5 | 166.7 | 166.1 | 176.4 | 194.8 | 197.6 | 203.4 |
- Real planned health infrastructure spending of $55.3 billion in the 2025 Ontario Budget is $23.6 billion (75 per cent) higher than real planned spending of $31.6 billion in the 2019 Ontario Budget. Most of this increase occurred in the 2022 and 2023 budgets (totalling $20.0 billion), due in part to costs added for major new projects, which included the new South Niagara Hospital, as well as the Trillium Health Partners and West Lincoln South Memorial redevelopment projects.
- Real planned transit infrastructure spending of $55.8 billion in the 2025 Ontario Budget is $13.5 billion (20 per cent) lower than real planned spending of $69.3 billion in the 2019 Ontario Budget. Most of this decrease occurred in the 2024 and 2025 budgets (totalling $11.2 billion), due in part to spending on major projects that was incurred during this period.
- Real planned provincial highways and other transportation infrastructure spending of $28.4 billion in the 2025 Ontario Budget is $2.9 billion (11 per cent) higher than real planned spending of $25.5 billion in the 2019 Ontario Budget. The largest increase was in 2022, which added $2.9 billion to the spending plan, due in part to costs added for new projects, which included the new Highway 413.
- Real planned education infrastructure spending of $27.0 billion in the 2025 Ontario Budget is $6.3 billion (31 per cent) higher than real planned spending of $20.7 billion in the 2019 Ontario Budget. Most of this increase occurred in 2025, which added $5.7 billion to the spending plan.
- Combined, real planned postsecondary education, justice and social infrastructure spending of $10.8 billion in the 2025 Ontario Budget is $0.5 billion (five per cent) lower than real planned spending of $11.4 billion in the 2019 Ontario Budget. Planned spending increases in the postsecondary education sector of $1.2 billion were largely offset by decreases in the justice sector of $1.3 billion.
- Real planned ‘other’ infrastructure spending of $26.1 billion in the 2025 Ontario Budget is $12.1 billion (87 per cent) higher than real planned spending of $14.0 billion in the 2019 Ontario Budget. Most of this increase occurred in the 2024 and 2025 budgets (totalling $9.9 billion), due in part to increased transfer payments to municipalities, which include the Housing-Enabling Water Systems Fund (HEWSF), Building Faster Fund, and New Deal funding for Toronto and Ottawa.
Comparison to Historical Spending
After accounting for inflation, the FAO estimates that the 2025 budget 10-year capital plan of $203.4 billion is a total of $1.6 billion (-0.8 per cent) lower than the $205.0 billion in actual capital spending over the last 10 years, from 2015-16 to 2024-25. By sector, health, justice and ‘other’ are projected to have higher spending over the next 10 years compared to actual spending over the last 10 years, while transit, provincial highways and other transportation, education, postsecondary education and social are projected to have lower spending.
| Total Real Spending ($ billions) | Real Planned versus Real Historical | |||
|---|---|---|---|---|
| Sector | Historical 2015-16 to 2024-25 | Planned 2025-26 to 2034-35 | $ billions | Per Cent (%) |
| Health | 37.6 | 55.3 | 17.7 | 47.0 |
| Transit | 67.1 | 55.8 | -11.4 | -16.9 |
| Provincial Highways and Other Transportation | 34.4 | 28.4 | -6.0 | -17.5 |
| Education | 28.4 | 27.0 | -1.4 | -4.9 |
| Postsecondary Education | 9.6 | 4.6 | -5.0 | -52.3 |
| Justice | 3.2 | 4.0 | 0.8 | 25.1 |
| Social | 5.6 | 2.2 | -3.4 | -60.0 |
| Other | 19.0 | 26.1 | 7.1 | 37.3 |
| Total | 205.0 | 203.4 | -1.6 | -0.8 |
- Real planned health infrastructure spending of $55.3 billion in the 2025 Ontario Budget is $17.7 billion (47 per cent) higher than actual spending over the past 10 years. This is largely due to the additions of major projects and funding that occurred in the 2022 and 2023 budgets, with planned completion dates and construction payments that are in the capital plan but have not yet occurred.
- Real planned transit infrastructure spending of $55.8 billion in the 2025 Ontario Budget is $11.4 billion (17 per cent) lower than actual spending over the past 10 years. The decline reflects the elevated level of transit spending in recent years, driven by the construction of multiple large transit projects. As these projects are completed, the capital plan contains fewer large, ongoing transit projects, resulting in lower planned spending.
- Real planned provincial highways and other transportation infrastructure spending of $28.4 billion in the 2025 Ontario Budget is $6.0 billion (18 per cent) lower than actual spending over the past 10 years. This is partially because, while the Province has major infrastructure projects planned in the sector, the FAO estimates that not all of these projects have been fully costed and included in the 2025 budget capital plan but rather have only preliminary costs associated with design and procurement.
- Real planned education infrastructure spending of $27.0 billion in the 2025 Ontario Budget is $1.4 billion (five per cent) lower than actual spending over the past 10 years. Real infrastructure spending in the sector has been relatively consistent over the past 10 years, which is projected to continue based on the capital plan in the 2025 budget.
- Real planned postsecondary education infrastructure spending of $4.6 billion in the 2025 Ontario Budget is $5.0 billion (52 per cent) lower than actual spending over the past 10 years, due in part to elevated historical spending from 2016 to 2018, which was supported by the federal government’s Post-Secondary Institutions Strategic Investment Fund, and lower projected spending on infrastructure at colleges that is funded by colleges’ own sources.
- Real planned justice infrastructure spending of $4.0 billion in the 2025 Ontario Budget is $0.8 billion (25 per cent) higher than actual spending over the past 10 years, due in part to asset disposals in 2022-23 which reduced spending, and higher planned spending for projects that include the OPP Modernization Initiative and Quinte Detention Centre expansion.
- Real planned social infrastructure spending of $2.2 billion in the 2025 Ontario Budget is $3.4 billion (60 per cent) lower than actual spending over the past 10 years. This is largely because the capital plan includes spending related to the National Housing Strategy only until 2027-28, when the agreement with the federal government expires.
- Real planned ‘other’ infrastructure spending of $26.1 billion in the 2025 Ontario Budget is $7.1 billion (37 per cent) higher than actual spending over the past 10 years. This is largely driven by increased planned transfer payment funding for broadband internet and municipal infrastructure, which includes planned spending on the Housing-Enabling Water Systems Fund (HEWSF).
Appendix: Additional Information by Sector
This Appendix reviews the capital plan in the 2025 budget by each sector in further detail (in nominal terms), primarily based on information provided by Treasury Board Secretariat and the Ministry of Infrastructure. The FAO also received additional information at the ministry and provincial agency level for the health, transit, provincial highways and other transportation, and education sectors.[14]
Health
Planned health capital spending of $61.1 billion includes $54.1 billion for hospitals and $7.0 billion in ‘other’ spending.
- Of the $54.1 billion hospitals budget, the FAO estimates that $29.8 billion is for expansion and $24.4 billion is for renewal and modernization.
- The $7.0 billion in ‘other’ spending is mostly transfer payments for long-term care home operators and community health. Also included in ‘other’ spending is funding for capital assets at ORNGE and Public Health Ontario.
| Program Area / Type of Spending | ($ billions) |
|---|---|
| Hospitals – Expansion | 29.8 |
| Hospitals – Renewal & Modernization | 24.4 |
| Other | 7.0 |
| Total Planned Health Infrastructure Expenditures (Capital Plan) | 61.1 |
Hospital Projects
Of the $54.1 billion hospitals capital plan, the FAO received information on 77 hospital projects, with planned spending of $32.5 billion over the 10-year outlook in the 2025 budget. Table A.2 lists the 10 largest projects by allocated funding.
| Project Name | |||
|---|---|---|---|
| 1. | Trillium Mississauga – Broader Redevelopment | 6. | Peel Memorial – Wellness Phase 2 |
| 2. | North York General – Inpatient Redevelopment | 7. | Trillium Queensway – Broader Redevelopment |
| 3. | Windsor Regional – New Hospital | 8. | CAMH – Phase 1D – Redevelopment |
| 4. | Ottawa Hospital – Civic Campus Redevelopment | 9. | St. Joseph’s Toronto – Redevelopment |
| 5. | Niagara Health – New Hospital | 10. | Hospital for Sick Children – Project Horizon |
Transit
Planned transit capital spending of $60.7 billion includes $54.2 billion for provincially owned transit projects and $6.4 billion in ‘other’ spending.
The capital budget for provincially owned transit projects of $54.2 billion includes $25.4 billion for subways, $19.6 billion for GO Transit, and $9.2 billion for light rail, rapid transit and the Ontario Northland Transportation Commission (ONTC).
- The $25.4 billion budget for subways consists of discrete budget items for three projects: the Ontario Line, the Yonge North Subway Extension and the Scarborough Subway Extension. The entire budget for subways is for expansion.
- The $19.6 billion budget for GO Transit includes two major funding envelopes for rail expansion and renewal, discrete items for a few specific rail expansion projects (such as the Bowmanville extension), and funding for other items, which include SmartTrack and PRESTO. Overall, the FAO estimates that 85 per cent of the GO Transit budget is for expansion.
- The $9.2 billion budget for light rail, rapid transit and the ONTC mostly includes discrete budget items for specific projects, the largest of which are the Hamilton LRT and Eglinton West LRT.
The $6.4 billion in ‘other’ spending is mostly planned transfers to municipalities related to the Gas Tax program and the Investing in Canada Infrastructure Program (ICIP).[15]
| Program Area / Type of Spending | ($ billions) |
|---|---|
| Subways | 25.4 |
| GO Transit | 19.6 |
| Light Rail, Rapid Transit and the Ontario Northland Transportation Commission | 9.2 |
| Other | 6.4 |
| Total Planned Transit Infrastructure Expenditures (Capital Plan) | 60.7 |
Transit Projects
Table A.4 shows the 10 largest transit projects in terms of allocated funding in the 10-year capital plan in the 2025 budget, which accounts for $31.4 billion (52 per cent) of the total transit capital plan. Note that for some of these projects spending has already occurred, estimated by the FAO at about $26.7 billion through to 2024-25.
| Project Name | |||
|---|---|---|---|
| 1. | Ontario Line | 6. | Bowmanville GO Rail Extension |
| 2. | Yonge North Subway Extension | 7. | Hazel McCallion Light Rail Transit |
| 3. | Scarborough Subway Extension | 8. | Kitchener GO Rail Extension |
| 4. | Hamilton Light Rail Transit | 9. | Eglinton Crosstown Light Rail Transit |
| 5. | Eglinton Crosstown West | 10. | Finch West Light Rail Transit |
Provincial Highways and Other Transportation
Planned provincial highways and other transportation capital spending of $31.3 billion is for provincially owned highways[16] ($28.2 billion) and ‘other’ spending ($3.1 billion), which includes other types of infrastructure owned by the Province, such as vehicles, remote air and ferries, as well as capital expenses for a variety of items (such as transfers to municipalities for the Connecting Links program).
The capital budget for highways is divided into two major program areas (southern highways and northern highways), and within these program areas, there are two major funding envelopes: one for expansion and one for rehabilitation and renewal.
- The FAO estimates the total southern highways capital budget at $22.4 billion over 10 years, which includes $12.6 billion for renewal and modernization, and $9.9 billion for expansion.
- The FAO estimates the total northern highways capital budget at $5.8 billion over 10 years, which includes $4.4 billion for renewal and modernization, and $1.3 billion for expansion.
| Program Area / Type of Spending | ($ billions) |
|---|---|
| Southern Highways – Renewal & Modernization | 12.6 |
| Southern Highways – Expansion | 9.9 |
| Northern Highways – Renewal & Modernization | 4.4 |
| Northern Highways – Expansion | 1.3 |
| Other | 3.1 |
| Total Planned Provincial Highways and Other Transportation Infrastructure Expenditures (Capital Plan) | 31.3 |
Provincial Highways and Other Transportation Projects
The FAO received information on 51 provincial highways and other transportation projects with planned spending of $9.8 billion over the 10-year outlook in the 2025 budget.[17] Table A.6 shows the 10 largest projects in terms of allocated funding included in the capital plan, which accounts for $7.5 billion (27 per cent) of the total highways budget.
| Project Name | |||
|---|---|---|---|
| 1. | Bradford Bypass | 6. | Highway 401 – Tilbury to London |
| 2. | Garden City Skyway | 7. | Highway 69 – North of the north junction of Highway 529 |
| 3. | Highway 413 | 8. | Highway 6 – Little Current Swing Bridge |
| 4. | Highway 17 – Arnprior from Scheel Drive | 9. | Highway 7 – Kitchener to Guelph |
| 5. | Highway 401 – Victoria Park Ave to Neilson Rd | 10. | Highway 17 – Kenora to Manitoba Border |
Education
Planned education capital spending of $30.1 billion is mostly related to school buildings ($26.4 billion), with $3.7 billion in other spending. Of the $26.4 billion school buildings budget, the FAO estimates that $15.8 billion is for renewal and modernization, and $10.6 billion is for expansion. The $3.7 billion in ‘other’ spending is mostly related to non-buildings infrastructure at schools. It also includes child care transfer payments, and a small amount for consolidated entities like TVO, TFO and EQAO.
| Program Area / Type of Spending | ($ billions) |
|---|---|
| School Buildings – Renewal & Modernization | 15.8 |
| School Buildings – Expansion | 10.6 |
| Other | 3.7 |
| Total Planned Education Infrastructure Expenditures (Capital Plan) | 30.1 |
School Projects
The FAO received information on 237 school capital projects that totalled $5.7 billion over the 10-year plan in the 2025 budget, which represents about 22 per cent of the total school buildings budget. Table A.8 shows the 10 largest projects in terms of allocated funding included in the 2025 capital plan, which accounts for $0.8 billion, or about 3 per cent of the total school buildings capital budget.
| Project Name | |||
|---|---|---|---|
| 1. | Blessed Cardinal | 6. | North Oshawa |
| 2. | New North London | 7. | Oakville NE 1 |
| 3. | Mount Pleasant | 8. | SW Brantford |
| 4. | East Kitchener | 9. | West Whitby |
| 5. | Foster Northwest | 10. | Dr. G.W. Williams |
Postsecondary Education
Planned postsecondary education capital spending of $5.1 billion is mostly related to colleges ($3.6 billion) and universities ($1.4 billion), with a small amount in ‘other’ spending. Most of the colleges spending is funded by colleges’ own sources for expansion projects. The $1.4 billion in universities spending consists entirely of transfer payments to universities, mostly for renewal and modernization.
| Program Area / Type of Spending | ($ billions) |
|---|---|
| Colleges | 3.6 |
| Universities | 1.4 |
| Other | <0.1 |
| Total Planned Postsecondary Education Infrastructure Expenditures (Capital Plan) | 5.1 |
Justice
Planned justice capital spending of $4.3 billion is mostly for renewal and modernization ($3.0 billion), with $1.3 billion allocated for expansion projects. The capital plan in the justice sector includes spending for detention centres, courthouses, Ontario Provincial Police (OPP) buildings and other items. Most of the budget includes discrete items for specific projects, as well as other more general funding envelopes.
- About two-thirds of the $3.0 billion renewal and modernization budget has been allocated to specific projects, of which the OPP Modernization project accounts for the largest share. The remaining third of the budget has been allocated to various renewal and modernization funding envelopes.
- Nearly all of the $1.3 billion expansion budget has been allocated to specific projects, of which the OPP Modernization project accounts for the largest share. Other major projects include the Quinte Detention Centre, the Eastern Ontario Correctional Centre and the Brockville Correctional Complex.
| Program Area / Type of Spending | ($ billions) |
|---|---|
| Renewal and Modernization | 3.0 |
| Expansion Projects | 1.3 |
| Total Planned Justice Infrastructure Expenditures (Capital Plan) | 4.3 |
Social
Planned social capital spending of $2.4 billion is mostly for transfer payments related to housing programs ($1.9 billion), which includes the National Housing Strategy (NHS) and other provincial supports. ‘Other’ social capital spending of $0.5 billion includes spending for Children’s Aid Societies and expenses for asset renewal and modernization.
| Program Area / Type of Spending | ($ billions) |
|---|---|
| Housing Programs | 1.9 |
| Other | 0.5 |
| Total Planned Social Infrastructure Expenditures (Capital Plan) | 2.4 |
‘Other’
Planned capital spending in the ‘other’ sector of $28.2 billion includes $15.7 billion for capital investments, which is for infrastructure that is amortized over time, and $12.5 billion for capital expenses, which is for infrastructure spending that is immediately expensed and not amortized.
- The $15.7 billion budget for capital investments includes the Province’s General Real Estate Portfolio (GREP), which includes various administration and office buildings across a variety of ministries, and spending for other consolidated infrastructure, mostly in the tourism, parks and natural resources areas.
- The $12.5 billion budget for capital expenses includes transfers to municipalities, which includes funding for items such as the Housing-Enabling Water Systems Fund (HEWSF), and various general funding envelopes for maintenance, renewal and modernization.
| Program Area / Type of Spending | ($ billions) |
|---|---|
| Capital Investments | 15.7 |
| Capital Expenses | 12.5 |
| Total Planned ‘Other’ Infrastructure Expenditures (Capital Plan) | 28.2 |
Footnotes
[1] The FAO adjusted nominal spending to a real basis using the price index for ‘general governments gross fixed capital formation’ from Statistics Canada table 36-10-0223-01 (data available to 2024) and the FAO’s forecast for this price index to 2035.
[2] The FAO received information on planned and actual capital costs for infrastructure projects from the Ministries of Health, Transportation and Education, and two provincial agencies: Metrolinx and Infrastructure Ontario.
[3] Statistics Canada table 36-10-0223-01.
[4] Capital assets also include ‘capitalized interest’, which refers to interest on debt expenses related to any debt that was used to finance the investment in the asset. The FAO estimates total capitalized interest of $8.2 billion in the 2025 budget’s 10-year capital plan.
[5] The investment is amortized on a straight line over its estimated useful life. For example, if a project costs $100 million to build, and is expected to last 10 years, a $10 million amortization expense will be recorded each year, which will impact the budget balance.
[6] Since net debt is Ontario’s total liabilities less financial assets, provincial borrowing for investments in capital assets would increase Ontario’s net debt. However, another measure of financial position is the accumulated deficit, which is Ontario’s total liabilities less total assets (including physical assets). Under this measure, provincial borrowing for investment in capital assets would be offset by the value of those assets, resulting in no change in the accumulated deficit.
[7] Includes two operating expense items, which are a transfer payment to long-term care home operators and a transfer payment to municipalities (the Gas Tax program).
[8] This funding is from revenues and financing independently generated by primarily hospitals, colleges and schools, such as from parking fees or donations. Both the revenue and financing from third parties are consolidated in the Province’s finances.
[9] The renewal of an asset extends its useful life, whereas the modernization of an asset may involve upgrades to meet new standards.
[10] The FAO received information on planned project costs from the Ministry of Health, Ministry of Transportation, Ministry of Education and Metrolinx. There are some smaller projects with capital costs that were not provided to the FAO due to materiality. These projects are included in the FAO’s estimate of the general funding envelope.
[11] For more information on the condition and capacity of Ontario’s school buildings, see FAO, Ontario School Boards: School Building Condition, Student Capacity and Capital Budgeting, 2024.
[12] In this chapter, the FAO adjusts nominal spending to a real basis using the price index for ‘general governments gross fixed capital formation’ from Statistics Canada table 36-10-0223-01. From 2014 to 2024, the average annual growth in the ‘general governments gross fixed capital formation’ price index was 3.2 per cent. Over the projection period to 2035, the FAO estimates the average annual growth in the ‘general governments gross fixed capital formation’ price index at 2.2 per cent. Ultimately, the price impacts to infrastructure spending depend on many factors, which include the specific type of asset (i.e., a building, road or rail network), and related input costs for construction materials and labour, as well as the location and geography of the project.
[13] The FAO’s analysis begins with the 2019 Ontario Budget, as capital plans since the 2019 budget have all consisted of 10-year spending projections. Prior to the 2019 budget, capital plans varied in terms of number of years of projected spending.
[14] The FAO received information on planned and actual capital costs for infrastructure projects from the Ministries of Health, Transportation and Education, and two provincial agencies: Metrolinx and Infrastructure Ontario.
[15] The Investing in Canada Infrastructure Program (ICIP) is part of the federal government’s Investing in Canada Plan, which includes a target to provide $180 billion in infrastructure funding over 12 years to provinces, territories, municipalities and Indigenous Peoples. In the transit sector, the FAO estimates that the federal government will contribute about 55 per cent of the spending related to the ICIP program, with the provincial government contributing about 45 per cent.
[16] Includes bridges and related structures.
[17] The Ministry of Transportation provided the FAO with information on projects with estimated costs above $50 million for rehabilitation and renewal projects, and above $20 million for expansion projects.