


Summary
The purpose of this report is to support Members of Provincial Parliament in their debate of the government’s 2025 Ontario Budget.[1] The report provides an overview and analysis of the 2025 budget, including the outlook for the economy, budget balance, debt burden, revenues and spending.
The Province’s economic outlook has deteriorated
- The government’s economic outlook in the 2025 Ontario Budget is lower than the outlook in the 2024 Ontario Economic Outlook and Fiscal Review (FES), largely due to the impact of US tariffs and elevated geopolitical uncertainty.
- Real GDP, the broadest measure of economic activity, is projected to grow by an average annual rate of 1.2 per cent from 2025 to 2027, 0.9 percentage points lower than the government’s outlook in the 2024 FES.
- The 2025 budget’s outlook for real GDP growth is broadly in line with the FAO’s “tariff scenario” outlook,[2] with average annual growth of 1.4 per cent and 1.3 per cent, respectively, over the 2025 to 2028 period. However, both economic outlooks are subject to significant tariff-related uncertainty.
Ontario delays balanced budget until 2027-28
- Following a budget deficit of $0.6 billion in 2023-24, the budget is projected to deteriorate to a deficit of $14.6 billion in 2025-26, before returning to balance in 2027-28. This is one year later than projected in the 2024 FES.
- The 2025 budget’s path to balance in 2027-28 relies on revenue growth averaging 4.0 per cent in 2026-27 and 2027-28, with tax revenue growth higher than has been observed historically given the budget’s economic projection. At the same time, spending growth slows to an average of 0.7 per cent per year, well below projected growth in population and inflation.
- The 2025 budget projects that net debt will increase by $93.8 billion over the outlook, reaching $501.7 billion in 2027-28. Accumulated budget deficits account for 30 per cent of the additional net debt, while 70 per cent is due to an increase in non-financial assets, largely capital assets owned by the Province and the broader public sector (hospitals, colleges, school boards and children’s aid societies).
- By 2026-27, all three of the government’s fiscal sustainability indicators in the 2025 budget will have deteriorated compared to the outlook in the 2024 FES. Two of these indicators (the net debt-to-GDP and net interest-to-operating revenue ratios) are projected to worsen but remain below the government’s targets. In contrast, the net debt-to-operating revenue ratio is projected to exceed the government’s target starting in 2025-26.
Revenue and spending changes since the FES
- Compared to the FES, revenues are $1.0 billion lower over the 2024-25 to 2026-27 period. This results from less tax revenue due to weaker economic growth, the reversal of the planned increase in the federal capital gains inclusion rate, and measures such as permanently reducing the gas tax. Lower revenues are largely offset by temporarily higher non-tax revenues and higher tax return assessments from prior years.
- Compared to the FES, planned spending has increased by a total of $20.6 billion over the 2024-25 to 2026-27 period. This includes $10.0 billion in new health sector spending, $4.5 billion in the education sector, $2.5 billion in the postsecondary education sector, $2.9 billion in the justice sector, $1.3 billion in the children, community and social services sector, and $0.9 billion in higher projected interest on debt spending, partially offset by $1.4 billion in lower spending in the ‘other programs’ sector.
Economic Outlook
The Province’s economic outlook has deteriorated
The government’s economic outlook presented in the 2025 Ontario Budget is lower than the outlook in the 2024 Ontario Economic Outlook and Fiscal Review (FES), largely due to the impact of US tariffs and elevated geopolitical uncertainty. Table 1 presents the government’s average outlook over the 2025 to 2027 period for key economic indicators from the 2025 budget and 2024 FES.
| 2024 FES Average (2025-2027) |
2025 Budget Average (2025-2027) |
Change | |
|---|---|---|---|
| Real GDP growth (%) | 2.1 | 1.2 | -0.9 |
| Nominal GDP growth (%) | 4.2 | 3.4 | -0.9 |
| Labour Income* growth (%) | 4.4 | 3.5 | -0.9 |
| Corporate Profits** growth (%) | 4.9 | 3.5 | -1.3 |
| Nominal Household Consumption growth (%) | 4.3 | 3.4 | -0.9 |
| CPI Inflation (%) | 2.0 | 2.1 | 0.1 |
| Unemployment Rate (%) | 6.4 | 7.2 | 0.8 |
| Annual Housing Starts (000s) | 91.7 | 76.4 | -15.3 |
- Real GDP, the broadest measure of economic activity, is projected to grow by an average annual rate of 1.2 per cent during 2025 to 2027, 0.9 percentage points lower than the government’s outlook in the 2024 FES.
- Nominal GDP growth, the broadest measure of Ontario’s tax base, is expected to average 3.4 per cent per year, 0.9 percentage points lower than the government’s outlook in the 2024 FES. The 2025 budget expects similar declines in labour income, corporate profits and nominal household consumption, which are components of nominal GDP and key drivers of taxation revenue.
- CPI inflation is projected to be 0.1 percentage points higher on average from 2025 to 2027, compared to the outlook in the 2024 FES, as US tariffs and Canadian retaliatory tariffs raise the price of imported goods.
- The unemployment rate is projected to be 0.8 percentage points higher on average over the outlook compared to the 2024 FES, as trade tensions and weaker business activity slow the pace of hiring.
- Annual housing starts are projected to be 15,300 units lower per year compared to the outlook in the 2024 FES. Projected average housing starts of 76,400 per year in the 2025 budget are well below the 150,000 annual housing starts that were initially required to reach the government’s target of building 1.5 million homes by 2031.
The government’s economic outlook is subject to significant uncertainty
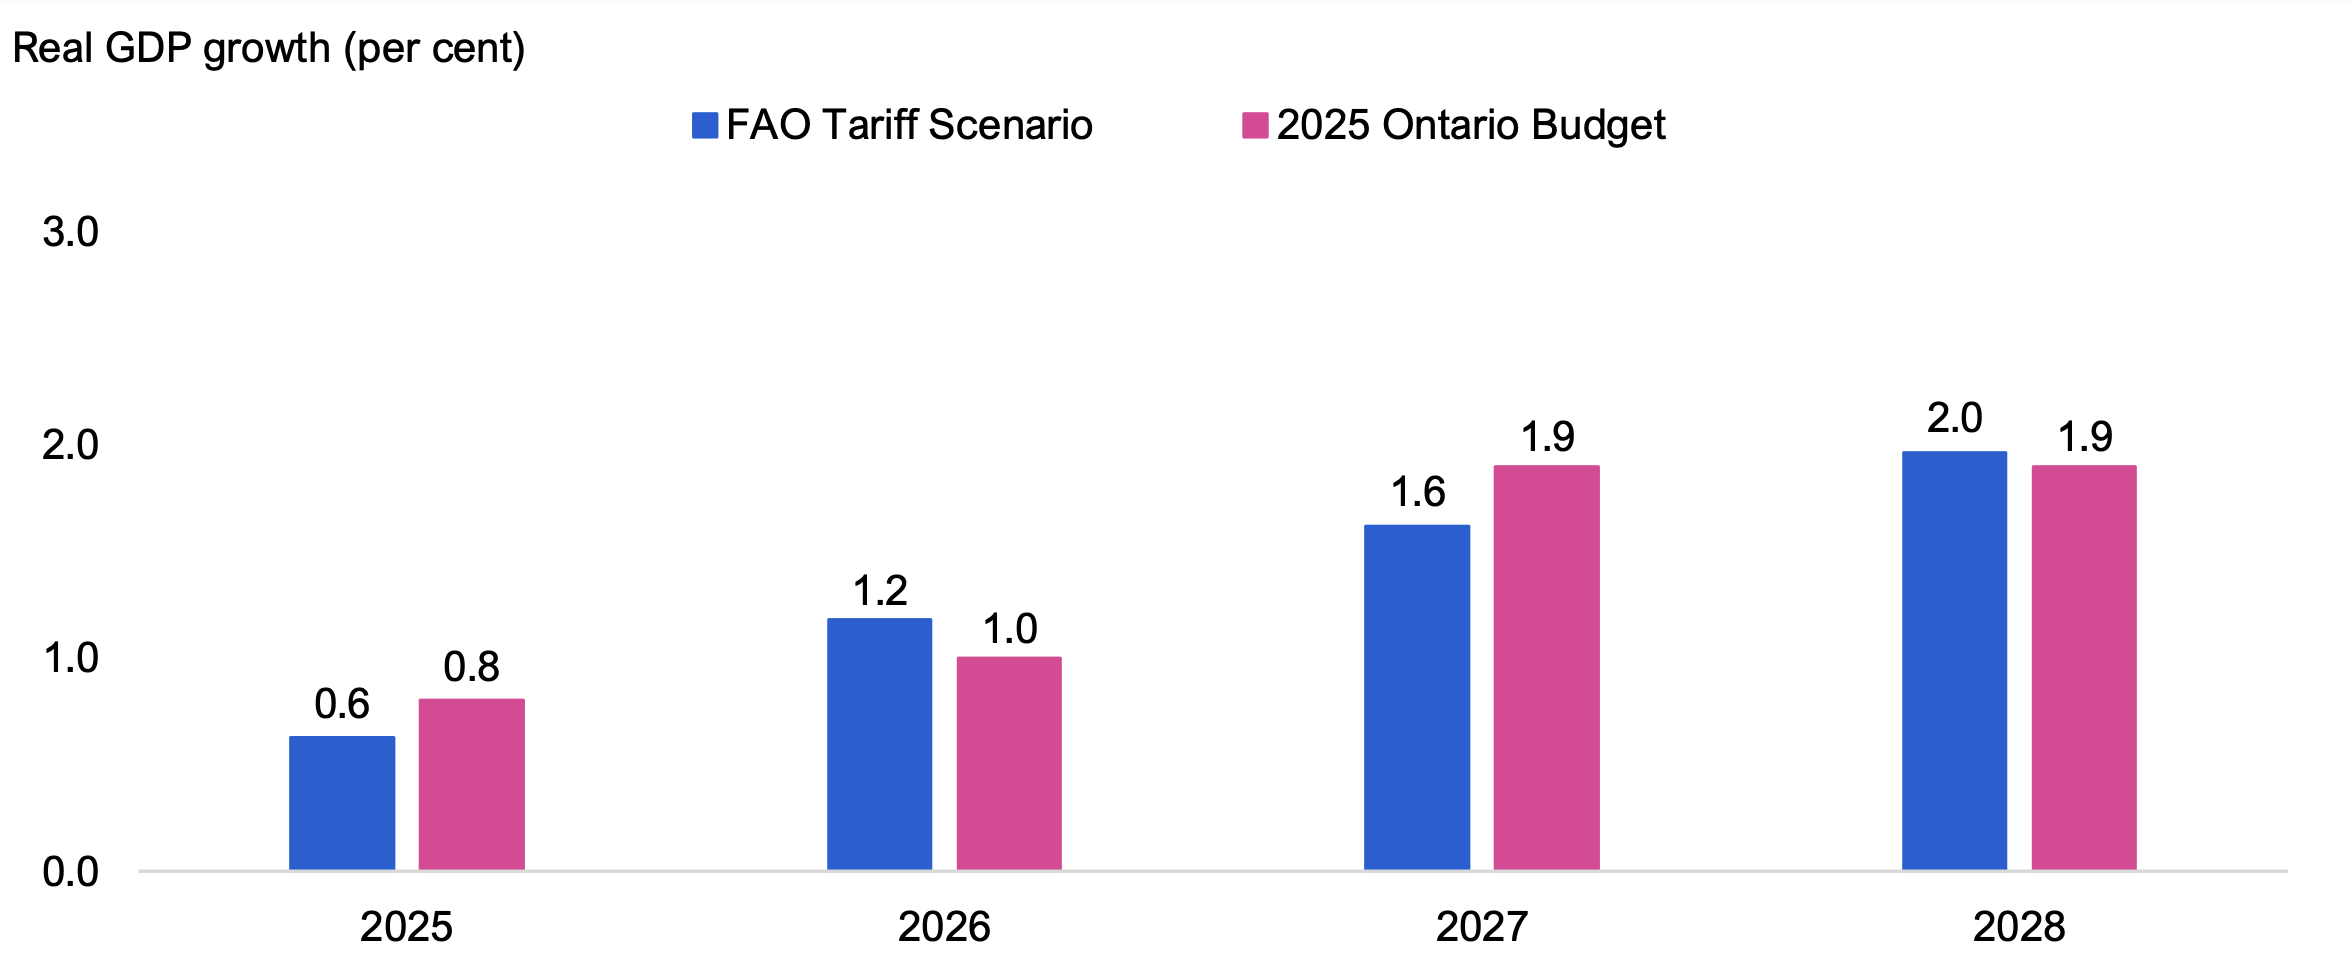
The government’s real GDP outlook in the 2025 Ontario Budget is broadly in line with the FAO’s “tariff scenario” economic outlook,[3] with average annual growth of 1.4 per cent and 1.3 per cent, respectively, over the 2025 to 2028 period. However, both the government and the FAO outlooks are subject to significant uncertainty and will depend on the magnitude, breadth and duration of tariff coverage, as well as how businesses, households and economies respond.
Figure 1 The government’s real GDP outlook is broadly in line with the FAO’s “tariff scenario” outlook
Note: The FAO tariff scenario is based on trade actions announced by the US and Canada as of April 17, 2025. For more information, see the FAO’s The Potential Impacts of US Tariffs on the Ontario Economy.
Source: 2025 Ontario Budget and FAO.
Accessible version
| Real GDP Growth (Per Cent) |
||||
|---|---|---|---|---|
| 2025 | 2026 | 2027 | 2028 | |
| 2025 Ontario Budget | 0.8 | 1.0 | 1.9 | 1.9 |
| FAO Tariff Scenario | 0.6 | 1.2 | 1.6 | 2.0 |
Budget and Debt Outlook
Ontario delays balanced budget until 2027-28
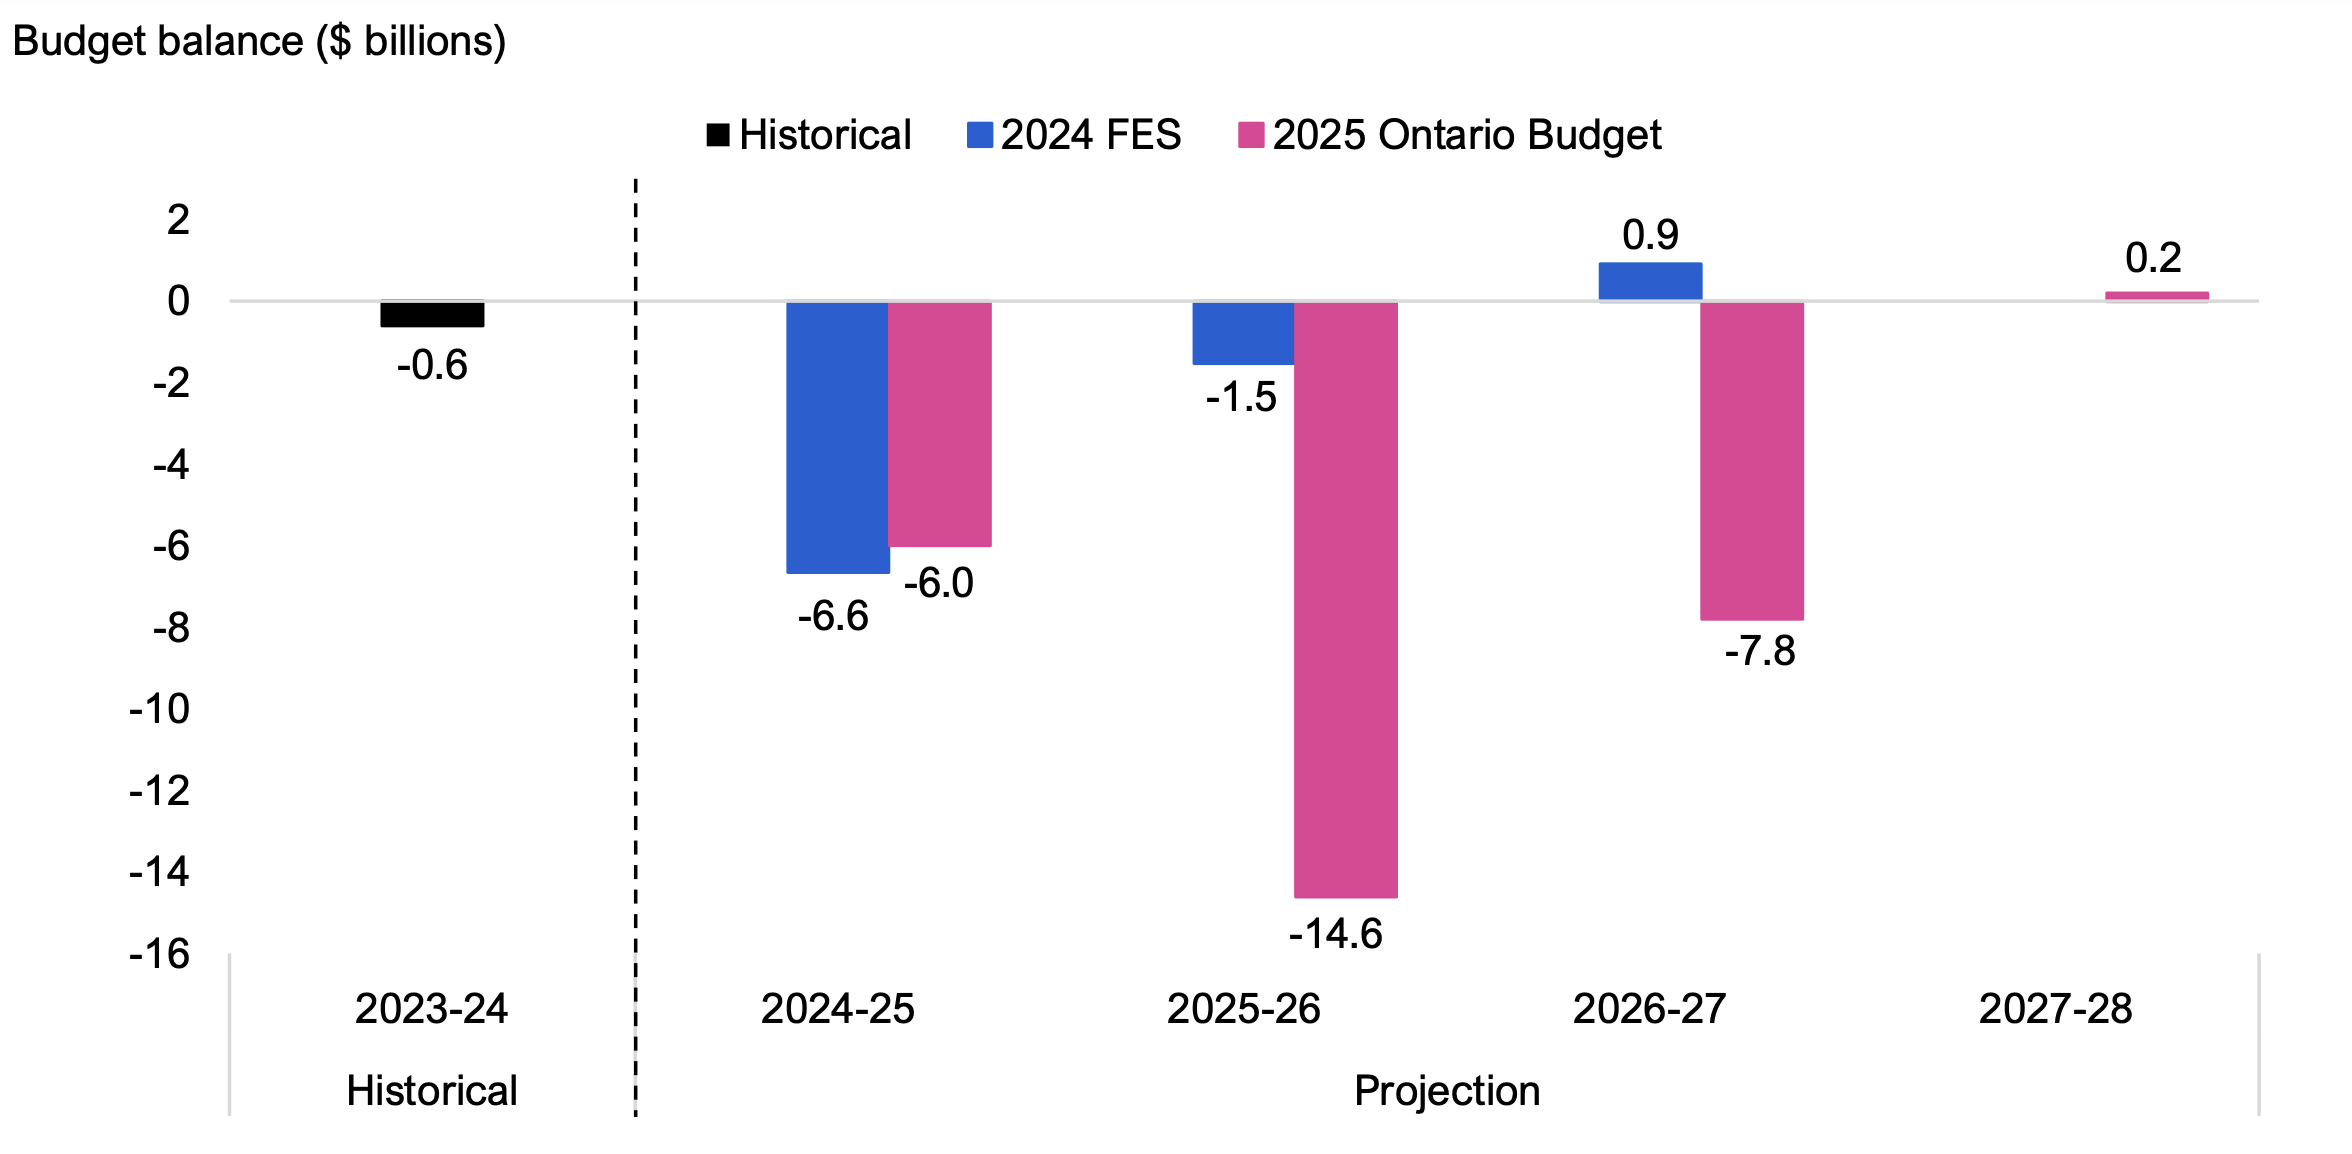
Following a budget deficit of $0.6 billion in 2023-24, the 2025 Ontario Budget projects a deficit of $6.0 billion in 2024-25, with a further deterioration to a deficit of $14.6 billion in 2025-26. In contrast, the 2024 FES expected a deficit of $1.5 billion in 2025-26. This worsening in the 2025-26 budget deficit, relative to the outlook in the FES, is due to a $2.8 billion decline in revenue, a $9.8 billion increase in spending and a $0.5 billion increase in the reserve.
Over the following two years of the budget outlook, revenue growth is projected to outpace the growth in spending, and the government projects that the deficit will improve rapidly to $7.8 billion in 2026-27 and reach a balanced budget in 2027-28, one year later than projected in the 2024 FES. The government’s path to a balanced budget relies on average annual revenue growth of 4.0 per cent over these two years, while spending growth averages 0.7 per cent per year – see the Revenue and Spending Outlook section for more details.
Figure 2 Government projects a balanced budget in 2027-28
Source: 2025 Ontario Budget and 2024 Ontario Economic Outlook and Fiscal Review.
Accessible version
| Historical | Projection | ||||
|---|---|---|---|---|---|
| 2023-24 | 2024-25 | 2025-26 | 2026-27 | 2027-28 | |
| 2024 FES | -0.6 | -6.6 | -1.5 | -0.9 | |
| 2025 Ontario Budget | -0.6 | -6.0 | -14.6 | -7.8 | 0.2 |
Ontario’s net debt and fiscal sustainability indicators
The 2025 Ontario Budget projects that the Province’s net debt will rise from $408.0 billion in 2023-24 to $501.7 billion in 2027-28, an increase of $93.8 billion. This increase is due to $28.2 billion (30 per cent) in accumulated budget deficits over the period and a $65.6 billion (70 per cent) increase in non-financial assets, largely capital assets owned by the Province and the broader public sector (hospitals, colleges, school boards and children’s aid societies).
The Fiscal Sustainability, Transparency and Accountability Act, 2019[4] mandates that each Ontario budget include a debt burden reduction strategy that outlines specific objectives for the projected net debt-to-GDP ratio and a progress report on supporting actions and implementation of the debt burden reduction strategy from the last budget.
In the 2025 budget, the government’s debt burden reduction strategy contained three specific targets, which are unchanged from the 2023 and 2024 budgets:
- net debt-to-GDP to stay below 40 per cent;
- net debt-to-operating revenue to be below 200 per cent; and
- net interest-to-operating revenue to stay below 7.5 per cent.
In the 2025 budget, the net debt-to-GDP and net interest-to-operating revenue ratios are projected to deteriorate but remain below the government’s targets. In contrast, the net debt-to-operating revenue ratio exceeds the government’s target starting in 2025-26. As well, by 2026-27, all three of the government’s fiscal sustainability indicators will have deteriorated compared to the 2024 FES.
| Indicator | Government Target (per cent) |
2023-24 Actual (per cent) |
2027-28 Forecast (per cent) |
Change (ppt) |
|---|---|---|---|---|
| Net debt-to-GDP | < 40.0 | 36.4 | 38.6 | 2.2 |
| Net debt-to-operating revenue | < 200.0 | 198.1 | 212.4 | 14.3 |
| Net interest-to-operating revenue | < 7.5 | 5.5 | 6.8 | 1.3 |
Revenue and Spending Outlook
Revenue Outlook
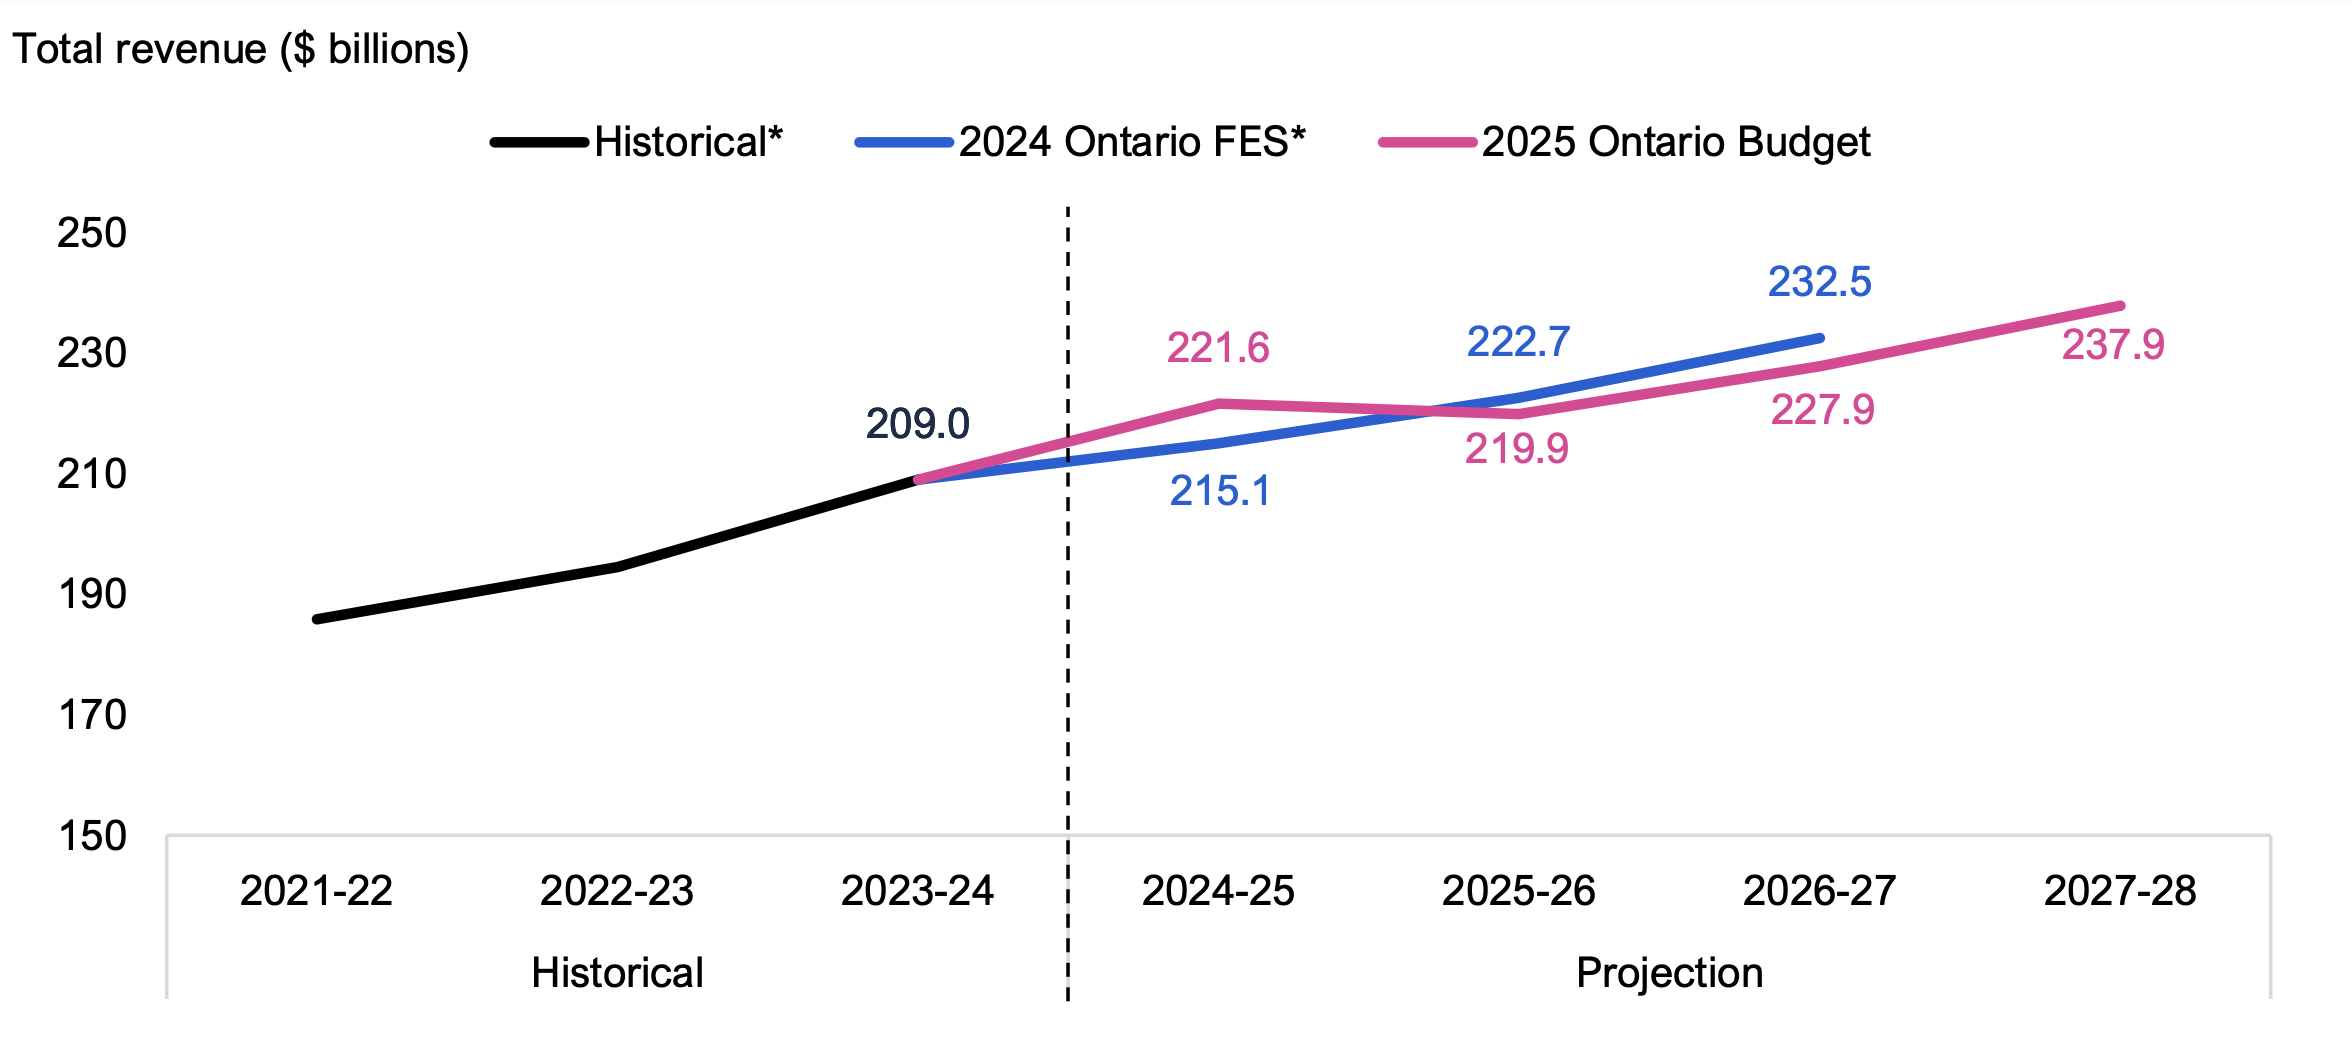
The 2025 Ontario Budget projects total revenues of $221.6 billion in 2024-25, declining to $219.9 billion in 2025-26, and then growing to $237.9 billion in 2027-28. Compared to the 2024 FES, revenues are expected to be $1.0 billion lower over the 2024-25 to 2026-27 period. The difference results from $6.5 billion in higher revenues in 2024-25, which is outweighed by a combined $7.5 billion in lower revenues in 2025-26 and 2026-27.
Figure 3 2025 Ontario Budget and 2024 Fall Economic Statement revenue projections
* Historical and 2024 Ontario FES revenues are adjusted to include interest and investment income to align with the fiscally neutral accounting change introduced in the 2025 Ontario Budget.
Source: 2025 Ontario Budget, 2024 Ontario Economic Outlook and Fiscal Review, Ontario Public Accounts and FAO.
Accessible version
| Historical* | Projection | ||||||
|---|---|---|---|---|---|---|---|
| 2021-22 | 2022-23 | 2023-24 | 2024-25 | 2025-26 | 2026-27 | 2027-28 | |
| 2024 Ontario FES* | 185.8 | 194.4 | 209.0 | 215.1 | 222.7 | 232.5 | |
| 2025 Ontario Budget | 185.8 | 194.4 | 209.0 | 221.6 | 219.9 | 227.9 | 237.9 |
The 2025 budget projects $6.5 billion in higher revenues in 2024-25 compared to the FES due to:
- $2.4 billion in higher fees, donations and third-party revenues, largely due to higher-than-expected revenue from colleges and school boards.
- $1.9 billion in higher miscellaneous non-tax revenue, primarily from a court approved settlement between tobacco companies and their creditors, which includes compensation to provincial and territorial governments for smoking-related health care costs.
- $1.2 billion in higher tax revenue, composed of higher revenues from the processing of previous years’ tax returns and stronger economic performance, offset by lower revenues from the temporary sales tax holiday and the removal of the planned increase in the federal capital gains inclusion rate.
- $0.7 billion in higher government business enterprises (GBE) income, primarily reflecting a large nuclear funds consolidation adjustment for Ontario Power Generation.
- $0.2 billion in higher other non-tax revenues and federal transfers.
In contrast, the 2025 budget expects a combined $7.5 billion in lower revenues in 2025-26 and 2026-27 compared to the FES, which results from:
- $4.3 billion in lower personal income tax, sales tax and corporations tax revenues from weaker-than- expected economic activity, the reversal of the planned increase in the federal capital gains inclusion rate, and the expansion of the Ontario Made Manufacturing Investment Tax Credit.
- $2.2 billion lower gas and fuel tax revenue from permanently reducing the gas and fuel tax.
- $1.3 billion in lower other taxes from weaker housing market and economic activity.
- $1.7 billion lower GBE revenue due to an Ontario Power Generation (OPG) accounting adjustment; lower LCBO net income, reflecting changes to LCBO pricing; and lower Ontario Lottery and Gaming net income.
- $1.8 billion in higher transfers from the federal government.
- $0.2 billion in higher other non-tax revenue.
The budget’s revenue projection relies on strong tax revenue growth in 2026 and 2027
The 2025 budget’s revenue projection relies on revenue growth increasing from an average of 2.6 per cent per year over the first two years of the projection (2024-25 and 2025-26) to 4.0 per cent per year over the last two years (2026-27 and 2027-28).
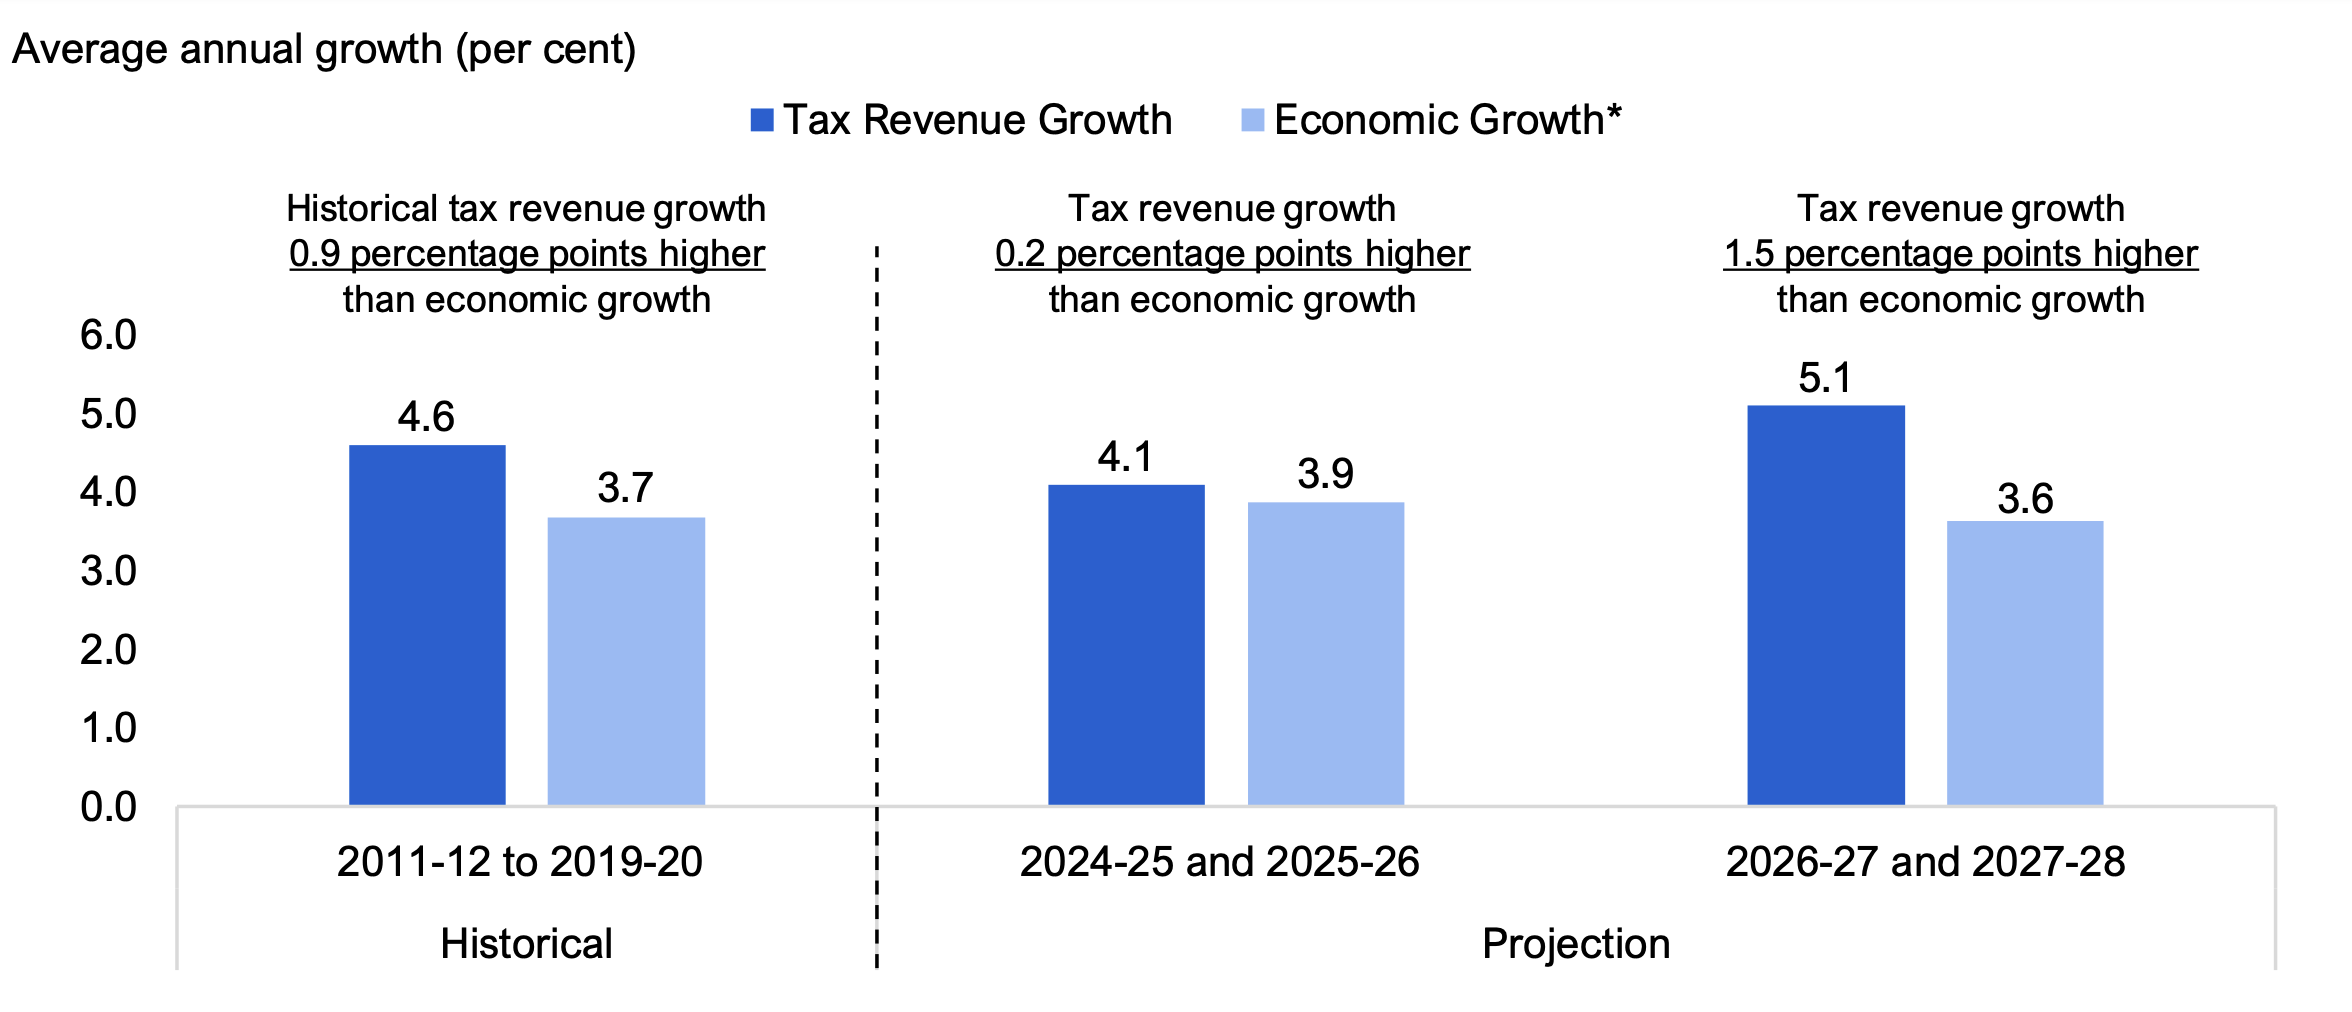
The increase in total revenue growth in the last two years (2026-27 and 2027-28) is driven primarily by taxation revenues growing at 5.1 per cent per year, 1.5 percentage points higher than the projected growth of nominal GDP, the broadest measure of the tax base. The pace of tax revenue generation above underlying economic activity in the last two years of the budget projection is higher than has been observed historically (an average of 0.9 percentage points higher than economic growth), and well above the first two years of the budget projection (0.2 percentage points higher).[5] If tax revenues were to grow in line with their historical experience, the 2025 budget’s revenue projection would be lower.
Figure 4 2025 Ontario Budget projects strong tax revenue growth in 2026-27 and 2027-28 compared to economic growth
* Economic growth is measured by nominal GDP and is calculated on a fiscal year basis.
Source: 2025 Ontario Budget, Ontario Public Accounts, Ontario Economic Accounts and FAO.
Accessible version
| Tax Revenue Growth | Economic Growth* | |||
|---|---|---|---|---|
| Historical | 2011-12 to 2019-20 | 4.6 | 3.7 | Historical tax revenue growth 0.9 percentage points higher than economic growth |
| Projection | 2024-25 and 2025-26 | 4.1 | 3.9 | Tax revenue growth 0.2 percentage points higher than economic growth |
| 2026-27 and 2027-28 | 5.1 | 3.6 | Tax revenue growth 1.5 percentage points higher than economic growth |
Spending Outlook
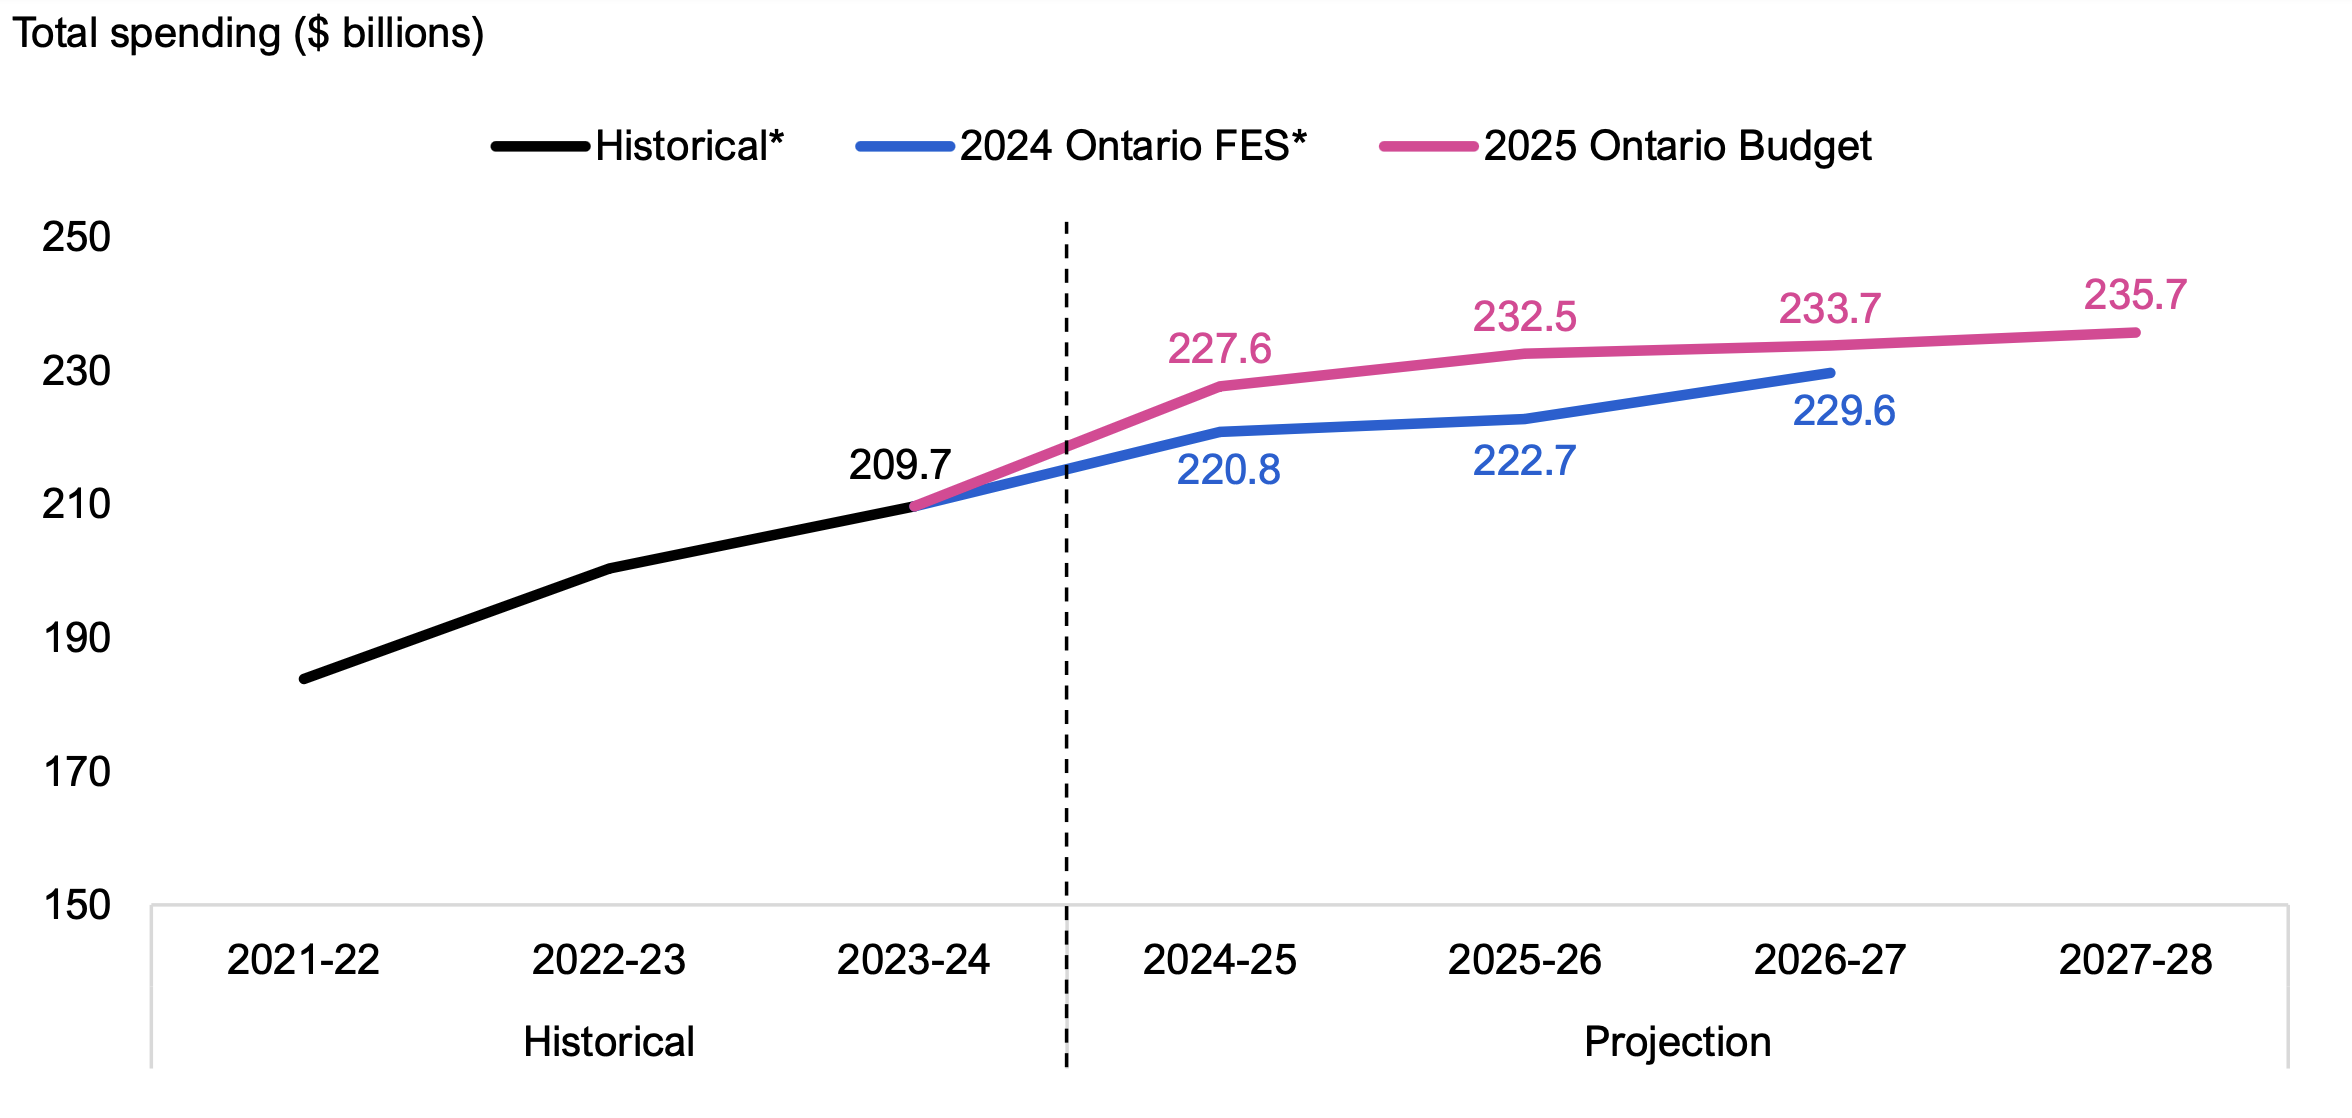
The 2025 Ontario Budget projects total spending of $227.6 billion in 2024-25, increasing to $232.5 billion in 2025-26 and reaching $235.7 billion in 2027-28. Compared to the 2024 FES, the government’s spending forecast has increased by a total of $20.6 billion from 2024-25 to 2026-27. This includes $6.8 billion in 2024-25, $9.8 billion in 2025-26 and $4.0 billion in 2026-27.
Figure 5 2025 Ontario Budget and 2024 Fall Economic Statement spending projections
* Historical and 2024 Ontario FES spending are adjusted to exclude interest and investment income to align with the fiscally neutral accounting change introduced in the 2025 Ontario Budget.
Source: 2025 Ontario Budget, 2024 Ontario Economic Outlook and Fiscal Review, Ontario Public Accounts and FAO.
Accessible version
| Historical* | Projection | ||||||
|---|---|---|---|---|---|---|---|
| 2021-22 | 2022-23 | 2023-24 | 2024-25 | 2025-26 | 2026-27 | 2027-28 | |
| 2024 Ontario FES* | 183.8 | 200.3 | 209.7 | 220.8 | 222.76 | 229.6 | |
| 2025 Ontario Budget | 183.8 | 200.3 | 209.7 | 227.6 | 232.5 | 233.7 | 235.7 |
The $20.6 billion in new spending in the 2025 budget from 2024-25 to 2026-27 consists of:
- $10.0 billion in new health sector spending, driven by increased compensation for physicians, investments in primary care and higher projected utilization of health care services.
- $4.5 billion in new education sector spending, mainly due to costs related to labour agreements and updated enrolment projections.
- $2.5 billion in new postsecondary education sector spending, which includes $2.0 billion in new spending for 2024-25, primarily due to higher-than-expected colleges spending financed by third-party revenues as well as higher-than-expected spending on student financial assistance.
- $1.3 billion in new children, community and social services sector spending, largely due to higher spending for Ontario Works and the Ontario Autism Program.
- $2.9 billion in new justice sector spending, partly driven by increased spending for the Ontario Provincial Police and correctional institutions, and a $0.6 billion one-time expense in 2024-25 for legal settlement costs.
- -$1.4 billion decrease in ‘other programs’ spending, due to lower contingency fund amounts, partially offset by new spending which includes $0.9 billion in one-time 2024-25 spending for settlements related to land and other claims by Indigenous communities, $1.0 billion for the Skills Development Fund, $0.4 billion to enhance the Ontario Made Manufacturing Investment Tax Credit and $0.4 billion for the Municipal Housing Infrastructure Program and the Housing-Enabling Water Systems Fund.
- $0.9 billion in higher interest on debt spending, reflecting the additional borrowing requirements to finance higher deficits and increased infrastructure spending.
The 2025 Ontario Budget also announced a number of significant measures that are not expected to materially impact the Province’s budget balance, including the $5 billion Protecting Ontario Account, $2 billion in additional employer rebates through the Workplace Safety and Insurance Board (WSIB), increasing the Indigenous Opportunities Financing Program to $3 billion, and a six month deferral of an estimated $9 billion in provincially administered taxes for businesses in 2025-26.
The budget’s spending projection calls for a slowdown in growth in 2026 and 2027
From 2023-24 to 2027-28, the 2025 Ontario Budget projects spending to grow at an average annual rate of 3.0 per cent, which would be the lowest spending growth over a four-year period since 2012-13 to 2016-17. Furthermore, spending growth is expected to be concentrated in 2024-25 and 2025-26, with average annual growth of 5.3 per cent, before slowing to an average annual rate of 0.7 per cent in 2026-27 and 2027-28.
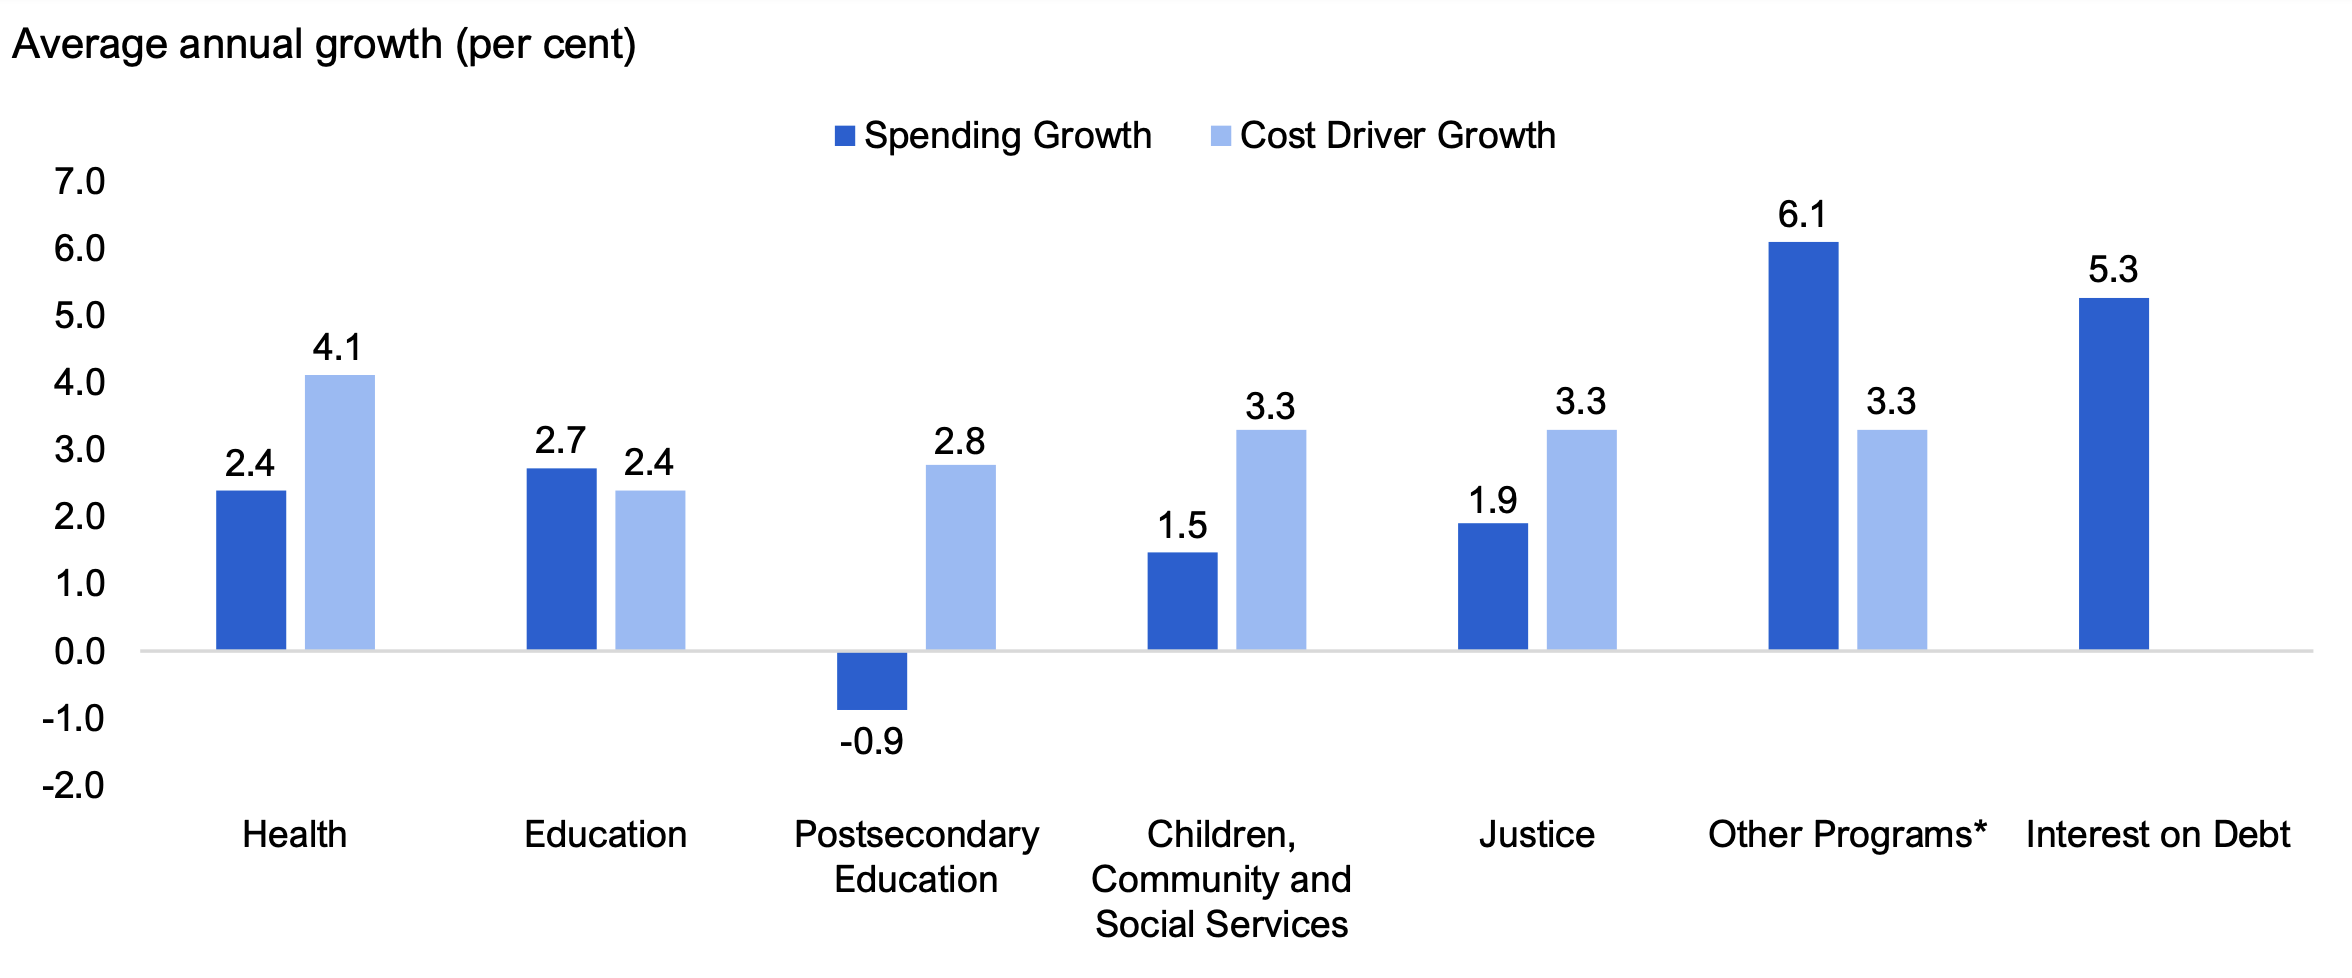
The 3.0 per cent planned spending growth in the 2025 budget is less than the estimated 3.3 per cent growth in inflation and population,[6] which are broad cost drivers of government spending, and would result in an overall decline in real per capita spending. Additionally, at the sector level, the government’s planned program spending growth would not keep pace with cost drivers, except for in the education and ‘other programs’ sectors.
- Health sector spending is projected to grow at an average annual rate of 2.4 per cent from 2023-24 to 2027-28. This is below the projected 4.1 per cent growth in health care cost drivers of population growth, aging and inflation.
- Education sector spending is projected to grow at an average annual rate of 2.7 per cent. This exceeds the 2.4 per cent projected growth in education cost drivers of inflation and the school and child care aged population.
- Postsecondary Education sector spending is projected to decline at an average annual rate of -0.9 per cent. This is below the 2.8 per cent projected growth in postsecondary education cost drivers of inflation and projected enrolment[7] in postsecondary education programs.
- Children, Community and Social Services sector spending is projected to grow at an average annual rate of 1.5 per cent. This is below the 3.3 per cent projected growth in children, community and social services cost drivers of inflation and population growth.
- Justice sector spending is projected to grow at an average annual rate of 1.9 per cent. This is below the 3.3 per cent projected growth in justice sector cost drivers of inflation and population growth.
- Other Programs sector spending, including contingency funds, is projected to grow at an average annual rate of 6.1 per cent. This is above the 3.3 per cent projected growth in ‘other programs’ cost drivers of inflation and population growth.
- Interest on debt spending is projected to grow at an average annual rate of 5.3 per cent from 2023-24 to 2027-28, which is higher than the 1.8 per cent average annual growth from 2019-20 to 2023-24.
Figure 6 2025 Ontario Budget projected spending growth compared to cost drivers by sector (2023-24 to 2027-28)
* The ‘other programs’ spending growth rate includes the Contingency Fund. Ontario Teachers’ Pension Plan expense is included in the education sector.
Source: 2025 Ontario Budget and FAO.
Accessible version
| Health | Education | Postsecondary Education | Children, Community and Social Services | Justice | Other Programs* | Interest on Debt | |
|---|---|---|---|---|---|---|---|
| Spending Growth | 2.4 | 2.7 | -0.9 | 1.5 | 1.9 | 6.1 | 5.3 |
| Cost Driver Growth | 4.1 | 2.4 | 2.8 | 3.3 | 3.3 | 3.3 |
Infrastructure spending
The 2025 Ontario Budget projects total infrastructure spending over the next 10 years of $223.1 billion. Compared to the 2024 FES, the government’s 10-year infrastructure spending forecast has increased by a total of $9.2 billion.
| 2024 FES | 2025 Budget | Difference | |
|---|---|---|---|
| Transit | 68.2 | 60.7 | -7.5 |
| Provincial Highways | 27.8 | 29.9 | 2.0 |
| Hospitals | 48.6 | 54.1 | 5.6 |
| Education | 23.1 | 30.1 | 7.0 |
| Other* | 46.2 | 48.4 | 2.1 |
| Total | 213.9 | 223.1 | 9.2 |
By sector, 10-year spending on transit infrastructure is projected to decrease by a total of $7.5 billion. All other sectors had increases to spending projections, with education having the largest increase at $7.0 billion, followed by hospitals at $5.6 billion, ‘other’ at $2.1 billion, and provincial highways at $2.0 billion.
Footnotes
[1] Government motion 2, “That this House approves in general the Budgetary Policy of the Government,” was moved on May 15, 2025.
[2] See the FAO’s The Potential Impacts of US Tariffs on the Ontario Economy.
[3] See the FAO’s The Potential Impacts of US Tariffs on the Ontario Economy.
[4] Fiscal Sustainability, Transparency and Accountability Act, 2019.
[5] In 2024-25 and 2025-26, the lower relative taxation revenue growth compared to projected economic growth reflects temporarily higher revenues from prior year tax assessments, more cautious assumptions on the relationship between economic activity and tax revenue generation, and tax changes, such as the expansion of the Ontario Made Manufacturing Investment Tax Credit.
[6] Inflation as projected in the 2025 Ontario Budget and population as projected by the Ministry of Finance in its May 2025 Interim Update.
[7] FAO estimate based on the Ministry of Finance, Ontario population projections, May 2025 Interim Update.