


1. Summary
The purpose of this report is to support Members of Provincial Parliament in their debate of the government’s 2026 Ontario Budget.[1] The report provides an overview and analysis of the 2026 budget, including the outlook for the economy, budget balance, net debt, revenue and spending.
The 2026 budget’s economic outlook is similar to the 2025 Fall Economic Statement, but significant downside risks have emerged
- The government’s economic outlook in the 2026 Ontario Budget is similar to the outlook in the 2025 Ontario Economic Outlook and Fiscal Review (Fall Economic Statement or FES).
- Real GDP, the broadest measure of economic activity, is projected to grow by an average annual rate of 1.4 per cent from 2025 to 2028, the same pace as the government’s outlook in the 2025 FES.
- Nominal GDP, the broadest measure of Ontario’s tax base, is expected to grow by an average of 3.8 per cent per year, 0.3 percentage points higher than projected in the 2025 FES.
- While the 2026 budget’s outlook for economic growth is lower than the FAO’s outlook in the Economic and Budget Outlook (EBO) released in February 2026,[2] both economic forecasts are subject to significant downside risks. Recent data indicate that Ontario’s population growth and economic activity were weaker than anticipated in late 2025 and early 2026. Furthermore, the war in Iran has disrupted global supply chains and raised oil prices dramatically, which will lift inflation and could slow household and business spending.
Province delays balanced budget until 2028-29
- The 2026 budget projects a deficit of $12.3 billion in 2025-26, further deteriorating to a deficit of $13.8 billion in 2026-27. In contrast, the 2025 FES expected a deficit of $13.5 billion in 2025-26 and a deficit of $7.8 billion in 2026-27.
- For 2026-27, the $6.0 billion increase in the budget deficit projection, relative to the outlook in the 2025 FES, is comprised of an $8.9 billion increase in spending, partially offset by a $2.3 billion increase in revenue and a $0.5 billion decrease in the reserve.
- Over the following two years of the 2026 budget outlook, revenue gains are expected to outpace the growth in spending, and the deficit is projected to improve rapidly to $6.1 billion in 2027-28, reaching a balanced budget in 2028-29, one year later than projected in the 2025 FES.
- The government’s path to a balanced budget relies on average annual revenue growth of 4.7 per cent over these two years, while spending growth averages 1.4 per cent per year.
- Following the post-pandemic 2023 budget, which projected a balanced budget in the 2024-25 fiscal year, this is the third consecutive budget to extend the projected balanced budget date. These delays were due to significant upward revisions to the government’s spending projections, which were revised up by an average of $8.4 billion per year across comparable years in each budget.
Accumulated deficit and net debt
- The accumulated deficit is a measure of the Province’s total liabilities minus total assets. It represents the total of all past annual deficits minus all past annual surpluses. The 2026 budget projects that Ontario’s accumulated deficit will increase from $247.1 billion in 2024-25 to $278.8 billion in 2028-29, an increase of $31.7 billion (12.8 per cent), driven by budget deficits through 2027-28.
- The 2026 budget introduced a change to the calculation of net debt to comply with updated public sector accounting standards for the presentation of financial statements. Prior to 2026-27, net debt was calculated as the Province’s total liabilities less financial assets, and excluded non-financial assets (largely infrastructure assets owned by the Province and the broader public sector). Starting in 2026-27, net debt also excludes non-financial liabilities, which the FAO estimates reduces net debt by approximately $11 billion.
- The 2026 budget projects that net debt will rise from $427.1 billion in 2024-25 to $529.3 billion in 2028-29, an increase of $102.2 billion (23.9 per cent). This increase is due to $31.7 billion in accumulated budget deficits and borrowing to finance an $82.0 billion increase in non-financial assets (largely capital assets), offset by an $11.5 billion adjustment to remove non-financial liabilities from the calculation of net debt.
Fiscal sustainability indicators
- In the 2026 budget, the government identified targets for three fiscal sustainability indicators, two related to the debt burden (a net debt-to-GDP ratio below 40.0 per cent and a net debt-to-revenue ratio below 200 per cent) and one related to budgetary flexibility (the share of revenue dedicated to debt interest payments below 7.5 per cent). These targets have remained unchanged since the 2023 budget.
- The 2026 budget projects that all three fiscal sustainability indicators will deteriorate from 2024-25 to 2028-29. However, the net debt-to-GDP and net interest-to-revenue ratios are projected to remain below the government’s targets and the ratios’ 10-year historical averages, while the net debt-to-revenue ratio is projected to exceed the government’s target but stay below its 10-year average.
The 2026 budget revenue projection relies on strong growth in personal income tax
- The 2026 budget projects that total revenue will grow at an average annual rate of 3.0 per cent, from $226.2 billion in 2024-25 to $254.1 billion in 2028-29. This is a slower pace than the 8.1 per cent average annual revenue growth from 2020-21 to 2024‑25, and reflects in part the loss of one-time tobacco settlement revenues and lower fees from the broader public sector.
- Compared to the 2025 FES, the 2026 budget’s revenue projection has increased by $9.2 billion over the comparable projection period (2025-26 to 2027-28). The increase is driven primarily by $8.3 billion in higher projected personal income tax (PIT) revenue, which the government notes is due to stronger 2025 economic growth and equity market performance than previously forecast.
- Compared to the FAO’s Winter 2026 EBO, the 2026 budget’s revenue projection is $19.3 billion higher over the 2025-26 to 2028-29 period, largely the result of the 2026 budget’s stronger forecast for PIT growth compared to the FAO.
The 2026 budget significantly increased planned spending
- The 2026 budget projects that spending will grow at an average annual rate of 2.5 per cent from $227.3 billion in 2024-25 to $251.1 billion in 2028-29. This is a slower pace than the 5.7 per cent average annual growth from 2020-21 to 2024-25. Moreover, spending growth is expected to be concentrated in 2025-26 and 2026-27, with average annual growth of 3.7 per cent in those two years before slowing to an average annual growth rate of 1.4 per cent in 2027-28 and 2028-29.
- Compared to the 2025 FES, the 2026 budget’s spending projection has increased by a total of $22.4 billion from 2025-26 to 2027-28. This difference is driven primarily by a $24.2 billion increase in projected health sector spending.
- Total projected spending in the 2026 budget is higher than the FAO’s Winter 2026 EBO forecast by a cumulative $6.5 billion. The 2026 budget projects higher spending of $3.8 billion in 2025-26, $3.6 billion in 2026‑27 and $1.5 billion in 2027-28, partially offset by lower projected spending of $2.5 billion in 2028‑29.
Infrastructure plan
- The 2026 budget projects total infrastructure spending of $111.3 billion from 2025-26 to 2027-28, an increase of $13.6 billion compared to projected infrastructure spending in the 2025 FES. This increase is largely due to an additional $11.0 billion in planned spending on transit infrastructure.
2. Economic Outlook
The 2026 budget’s economic outlook is similar to the 2025 Fall Economic Statement
The government’s outlook for economic growth presented in the 2026 Ontario Budget is similar to the outlook in the 2025 Ontario Economic Outlook and Fiscal Review (Fall Economic Statement or FES). The 2026 budget estimates real GDP growth of 1.2 per cent in 2025, up from a projection of 0.8 per cent in the 2025 FES, with modest revisions to the remainder of the outlook. For nominal GDP, the 2026 budget estimates growth of 4.2 per cent in 2025, up from a projection of 3.2 per cent in the 2025 FES. For Ontario’s housing market, actual housing starts in 2025 were slightly higher than projected in the 2025 FES, but the 2026 budget expects fewer housing starts each year from 2026 to 2028 compared to the outlook in the 2025 FES.
Importantly, the economic forecast in the 2026 budget was prepared before the start of the war in Iran and the sharp rise in global oil prices, which is likely to contribute to reduced growth expectations for 2026. Since the 2026 budget was released, several private-sector forecasters have lowered their projections for Ontario’s real GDP growth in 2026 by an average of 0.3 percentage points (see below for a discussion of risks facing Ontario’s economy).
Figure 2.1 Real GDP growth outlook, 2026 Ontario Budget and 2025 Fall Economic Statement

Source: 2026 Ontario Budget and 2025 Ontario Economic Outlook and Fiscal Review.
Accessible version
| 2025 Ontario FES | 2026 Ontario Budget | |
|---|---|---|
| 2025 | 0.8 | 1.2 |
| 2026 | 0.9 | 1.0 |
| 2027 | 1.8 | 1.7 |
| 2028 | 1.9 | 1.8 |
Table 2.1 presents the government’s average outlook over the 2025 to 2028 period for key economic indicators from the 2026 budget and 2025 FES.
| 2025 Ontario FES Average (2025‑2028) | 2026 Ontario Budget Average (2025‑2028) | Change | |
|---|---|---|---|
| Real GDP growth (%) | 1.4 | 1.4 | 0.0 |
| Nominal GDP growth (%) | 3.5 | 3.8 | 0.3 |
| Labour Income* growth (%) | 3.4 | 3.5 | 0.1 |
| Corporate Profits** growth (%) | 5.4 | 5.6 | 0.2 |
| Nominal Household Consumption growth (%) | 3.5 | 3.6 | 0.1 |
| CPI Inflation (%) | 2.0 | 2.0 | 0.0 |
| Unemployment Rate (%) | 7.2 | 7.1 | -0.1 |
| Annual Housing Starts (000s) | 74.5 | 69.3 | -5.2 |
- Real GDP, the broadest measure of economic activity, is projected to grow by an average annual rate of 1.4 per cent from 2025 to 2028, the same pace as the government’s outlook in the 2025 FES.
- Nominal GDP, the broadest measure of Ontario’s tax base, is expected to grow by an average of 3.8 per cent per year, 0.3 percentage points higher than the government’s outlook in the 2025 FES. The 2026 budget expects higher average growth in labour income, corporate profits and nominal household consumption, which are major components of nominal GDP and key drivers of taxation revenue.
- CPI inflation is projected to average 2.0 per cent from 2025 to 2028, the same as the 2025 FES outlook.
- The unemployment rate is projected to be 0.1 percentage points lower on average over the outlook compared to the 2025 FES.
- Annual housing starts are projected to be 5,200 units lower per year compared to the 2025 FES outlook. Projected average housing starts of 69,300 per year in the 2026 budget are well below the 150,000 annual housing starts that were initially required to reach the government’s target of building 1.5 million homes by 2031.
The 2026 budget’s outlook for real GDP growth is lower than the FAO’s
The government’s outlook for real GDP growth in the 2026 budget is modestly lower than the FAO’s projection in the Economic and Budget Outlook (EBO) released in February 2026.[3] The 2026 budget projects 0.1 percentage points weaker growth in 2025, 0.4 percentage points weaker growth in 2026 and 0.1 percentage points weaker growth in 2027 and 2028 compared to the FAO’s outlook in the 2026 Winter EBO. As a result, the 2026 budget expects average annual real GDP growth of 1.5 per cent during the 2025 to 2029 period, compared to the FAO’s 1.7 per cent annual average. The government’s nominal GDP outlook in the 2026 budget is marginally lower than the FAO’s outlook, with average annual growth of 3.8 per cent and 3.9 per cent, respectively.
Figure 2.2 The government’s real GDP outlook is lower than the FAO’s outlook
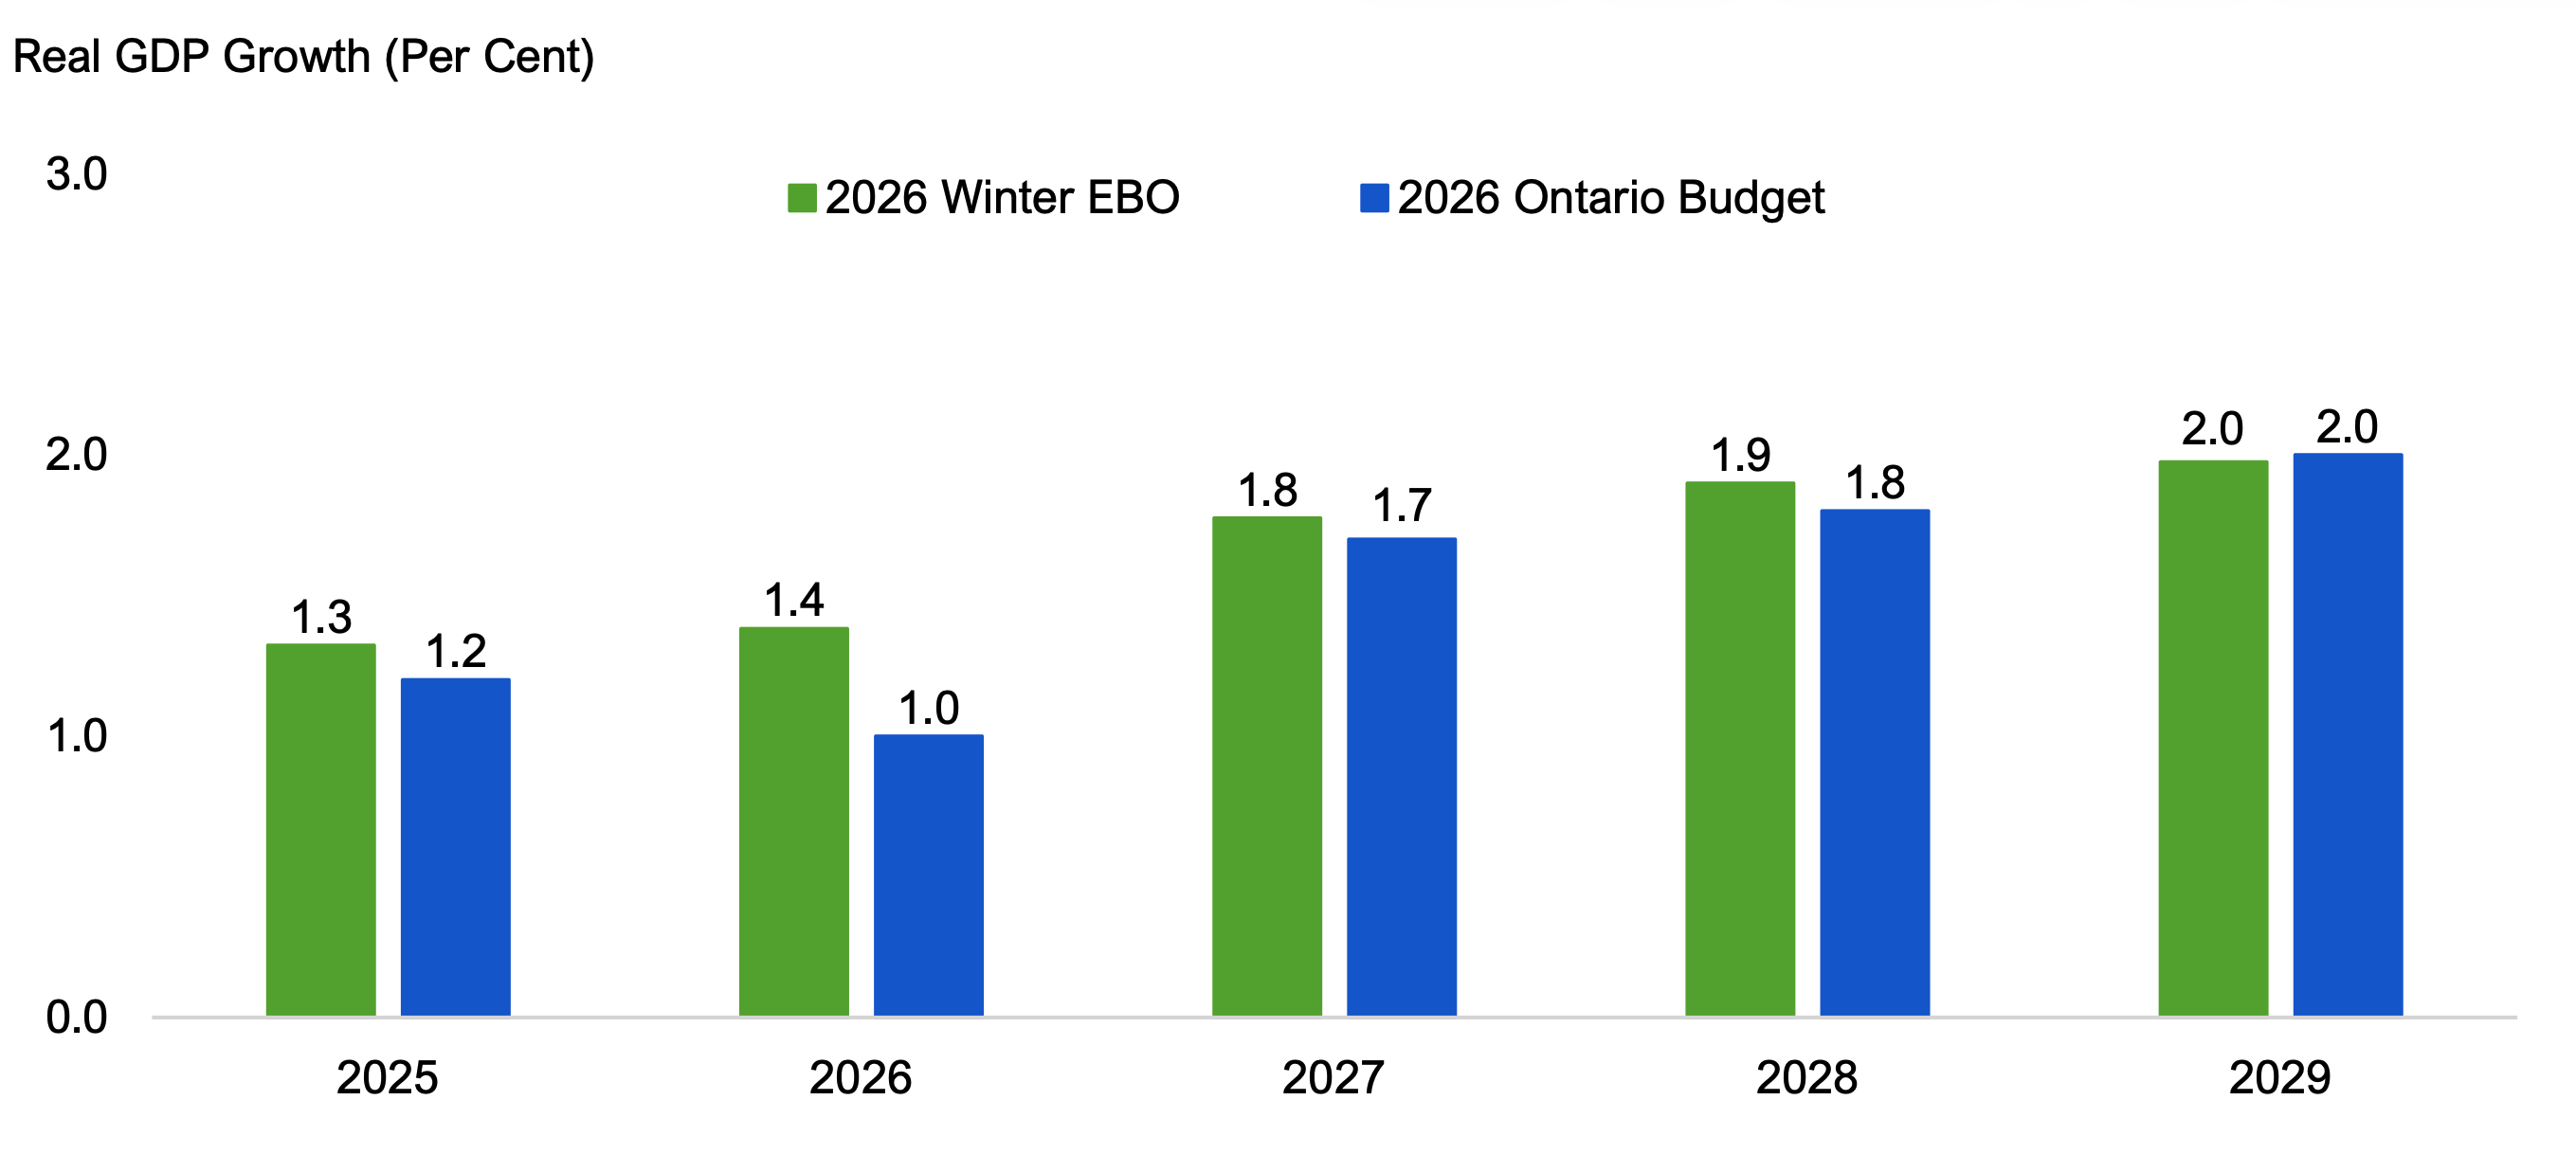
Source: 2026 Ontario Budget and FAO.
Accessible version
| 2026 Winter EBO | 2026 Ontario Budget | |
|---|---|---|
| 2025 | 1.3 | 1.2 |
| 2026 | 1.4 | 1.0 |
| 2027 | 1.8 | 1.7 |
| 2028 | 1.9 | 1.8 |
| 2029 | 2.0 | 2.0 |
The 2026 budget and FAO economic outlooks are subject to significant downside risks
Since the release of the 2026 budget and the FAO’s Winter 2026 EBO, several significant downside risks have emerged. Recent data indicate that Ontario’s population growth and economic activity were weaker than anticipated in late 2025 and early 2026. Furthermore, the war in Iran has disrupted supply chains and raised oil prices dramatically, which will lift inflation and could slow household discretionary spending and business activity. Notably, the average price of West Texas Intermediate crude oil in March 2026 was $91 US per barrel, 41 per cent higher than the February 2026 average of $65 US. According to the 2025 Ontario Budget, a sustained increase in crude oil prices of $10 US per barrel would lower Ontario real GDP growth in 2026 by 0.1 to 0.3 percentage points.[4] Consequently, if oil prices remain elevated, Ontario’s GDP growth in 2026 could be significantly weaker than projected by both the government and the FAO.
Figure 2.3 Oil prices increased significantly since the government and FAO economic outlooks were finalized
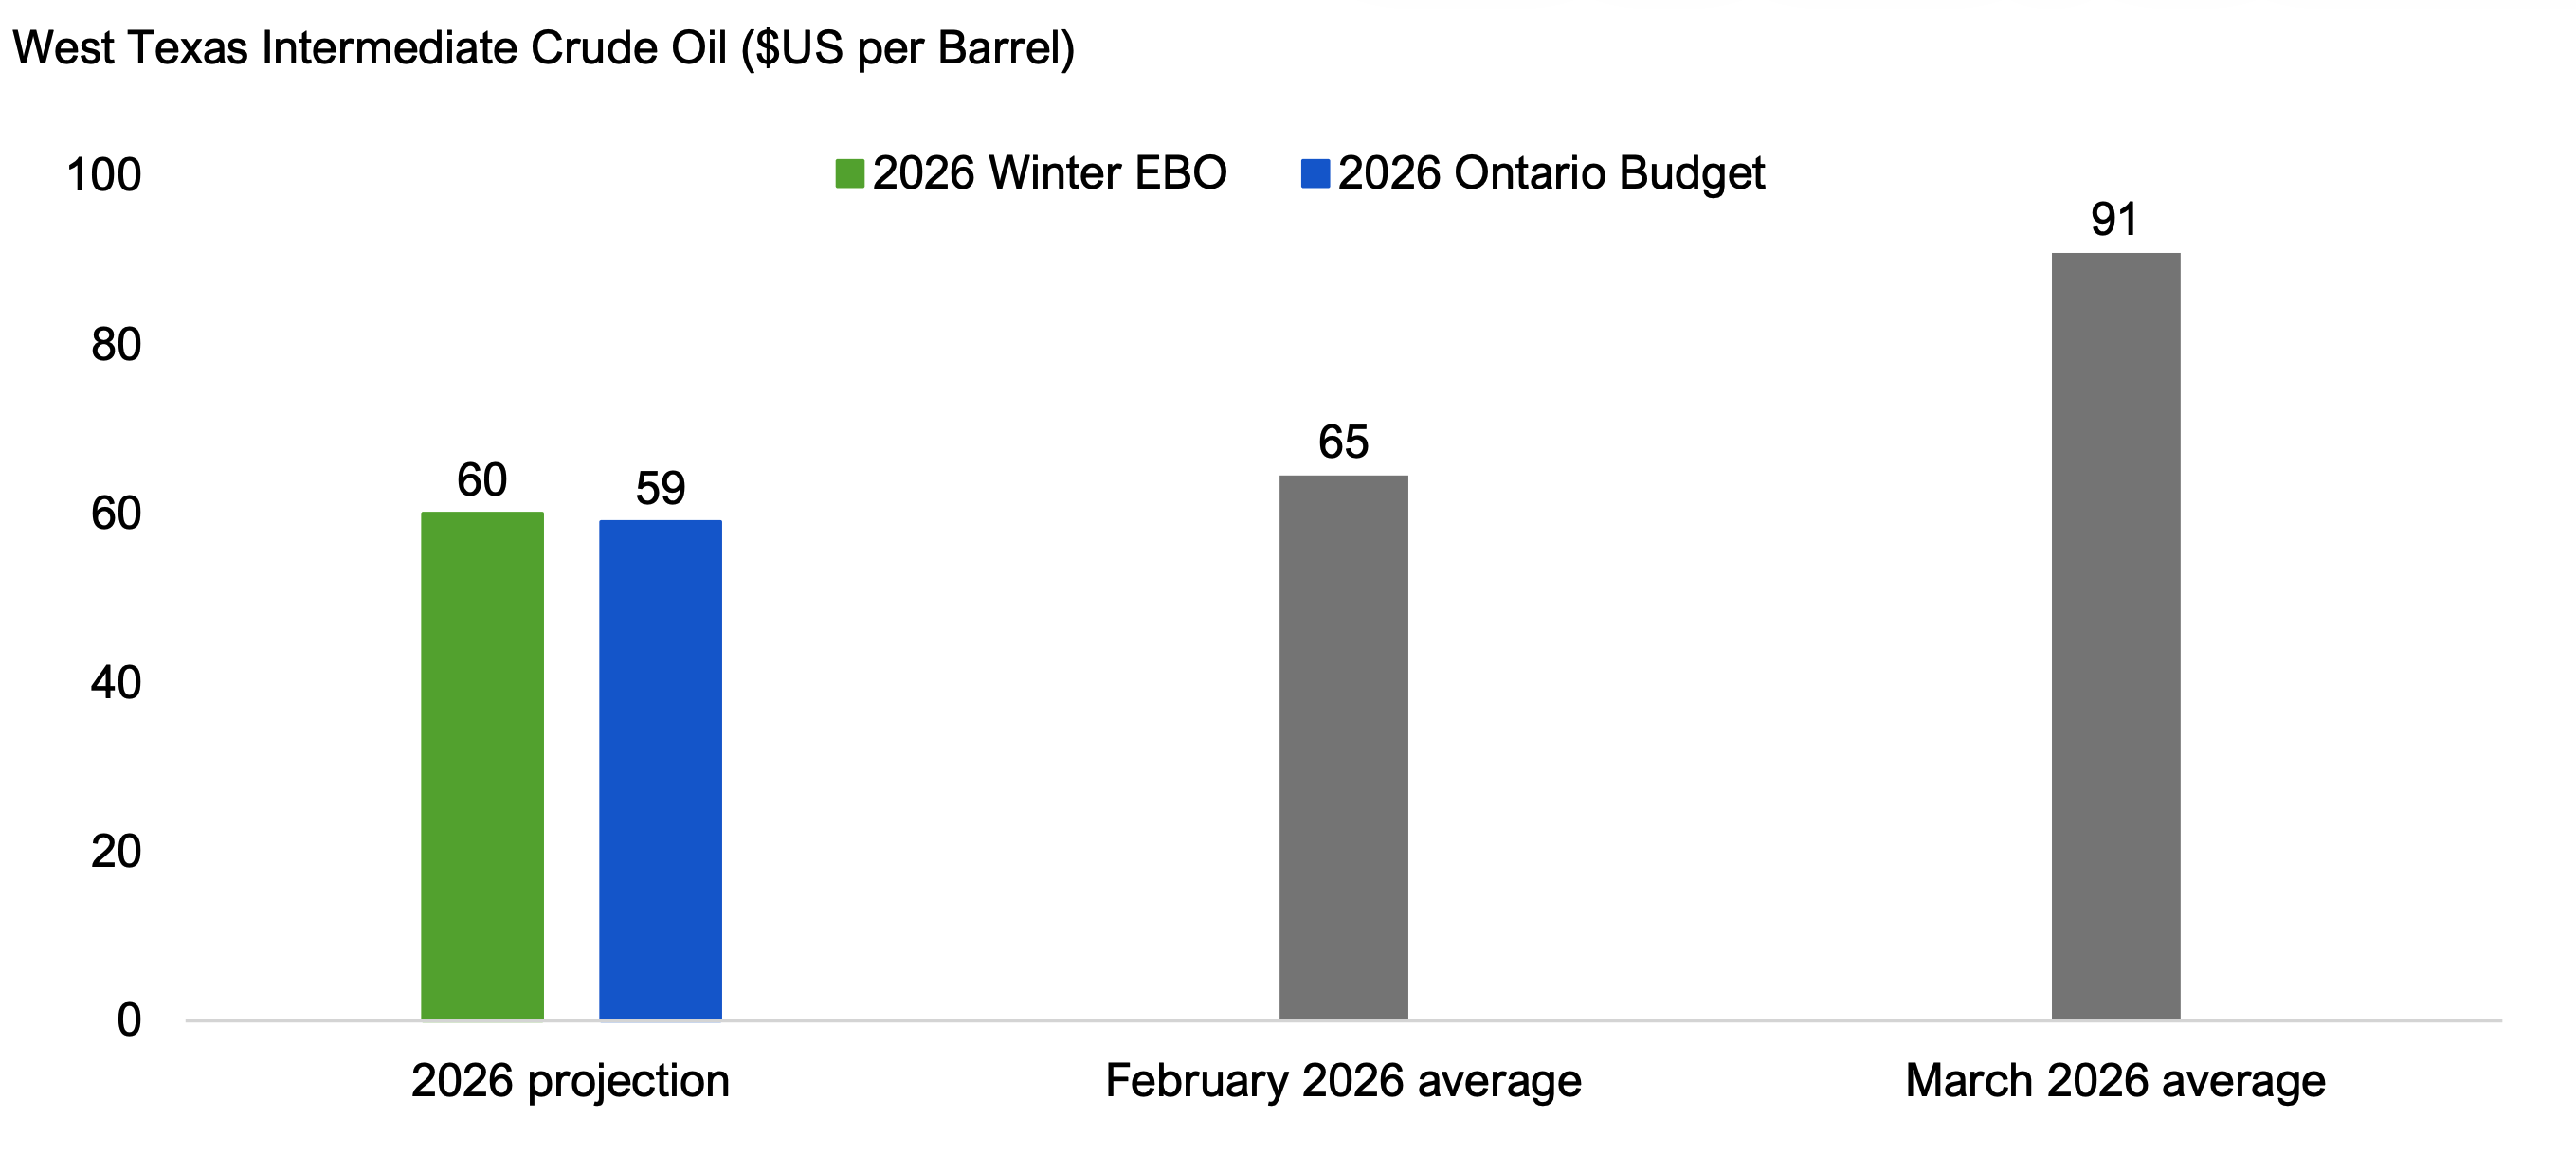
Source: 2026 Ontario Budget, FAO and Federal Reserve Economic Data.
Accessible version
| 2026 Winter EBO | 2026 Ontario Budget | Average | |
|---|---|---|---|
| 2026 Projection | 60 | 59 | |
| February 2026 | 65 | ||
| March 2026 | 91 |
3. Budget and Net Debt Outlook
Province delays balanced budget until 2028-29
Following a budget deficit of $1.1 billion in 2024-25, the 2026 Ontario Budget projects a deficit of $12.3 billion in 2025-26, further deteriorating to a deficit of $13.8 billion in 2026-27. In contrast, the 2025 FES expected a deficit of $13.5 billion in 2025-26 and a deficit of $7.8 billion in 2026-27. For 2026-27, the $6.0 billion increase in the budget deficit projection, relative to the outlook in the 2025 FES, is comprised of an $8.9 billion increase in spending, partially offset by a $2.3 billion increase in revenue and a $0.5 billion decrease in the reserve.
Over the following two years of the 2026 budget outlook, revenue gains are expected to outpace the growth in spending, and the deficit is projected to improve rapidly to $6.1 billion in 2027-28, reaching a balanced budget in 2028-29, one year later than projected in the 2025 FES. The government’s path to a balanced budget relies on average annual revenue growth of 4.7 per cent over these two years, while spending growth averages 1.4 per cent per year. See Chapter 4 – Revenue Outlook and Chapter 5 – Spending Outlook for more details.
Figure 3.1 The 2026 Ontario Budget projects a balanced budget in 2028-29

Source: 2026 Ontario Budget and 2025 Ontario Economic Outlook and Fiscal Review.
Accessible version
| Historical | 2025 Ontario FES | 2026 Ontario Budget | ||
|---|---|---|---|---|
| Historical | 2024-25 | -1.1 | ||
| Projection | 2025-26 | -13.5 | -12.3 | |
| Projection | 2026-27 | -7.8 | -13.8 | |
| Projection | 2027-28 | 0.2 | -6.1 | |
| Projection | 2028-29 | 0.6 |
Significant upward spending revisions have repeatedly delayed the Province’s balanced budget plan
The Fiscal Sustainability, Transparency and Accountability Act, 2019 (FSTAA)[5] mandates that the Province plan for a balanced budget in each fiscal year, unless the government determines that extraordinary circumstances require the Province to have a budget deficit for one or more years.
After the pandemic, the 2023 budget projected a balanced budget in the 2024-25 fiscal year. The next three Ontario budgets extended the target year for a balanced budget, with the 2026 budget projecting a balanced budget in the 2028-29 fiscal year. These delays in achieving a balanced budget were due to significant upward revisions to the government’s spending projections, which were revised up by an average of $8.4 billion per year across comparable years in each budget.
Figure 3.2 After the pandemic, the government delayed its target for a balanced budget three times
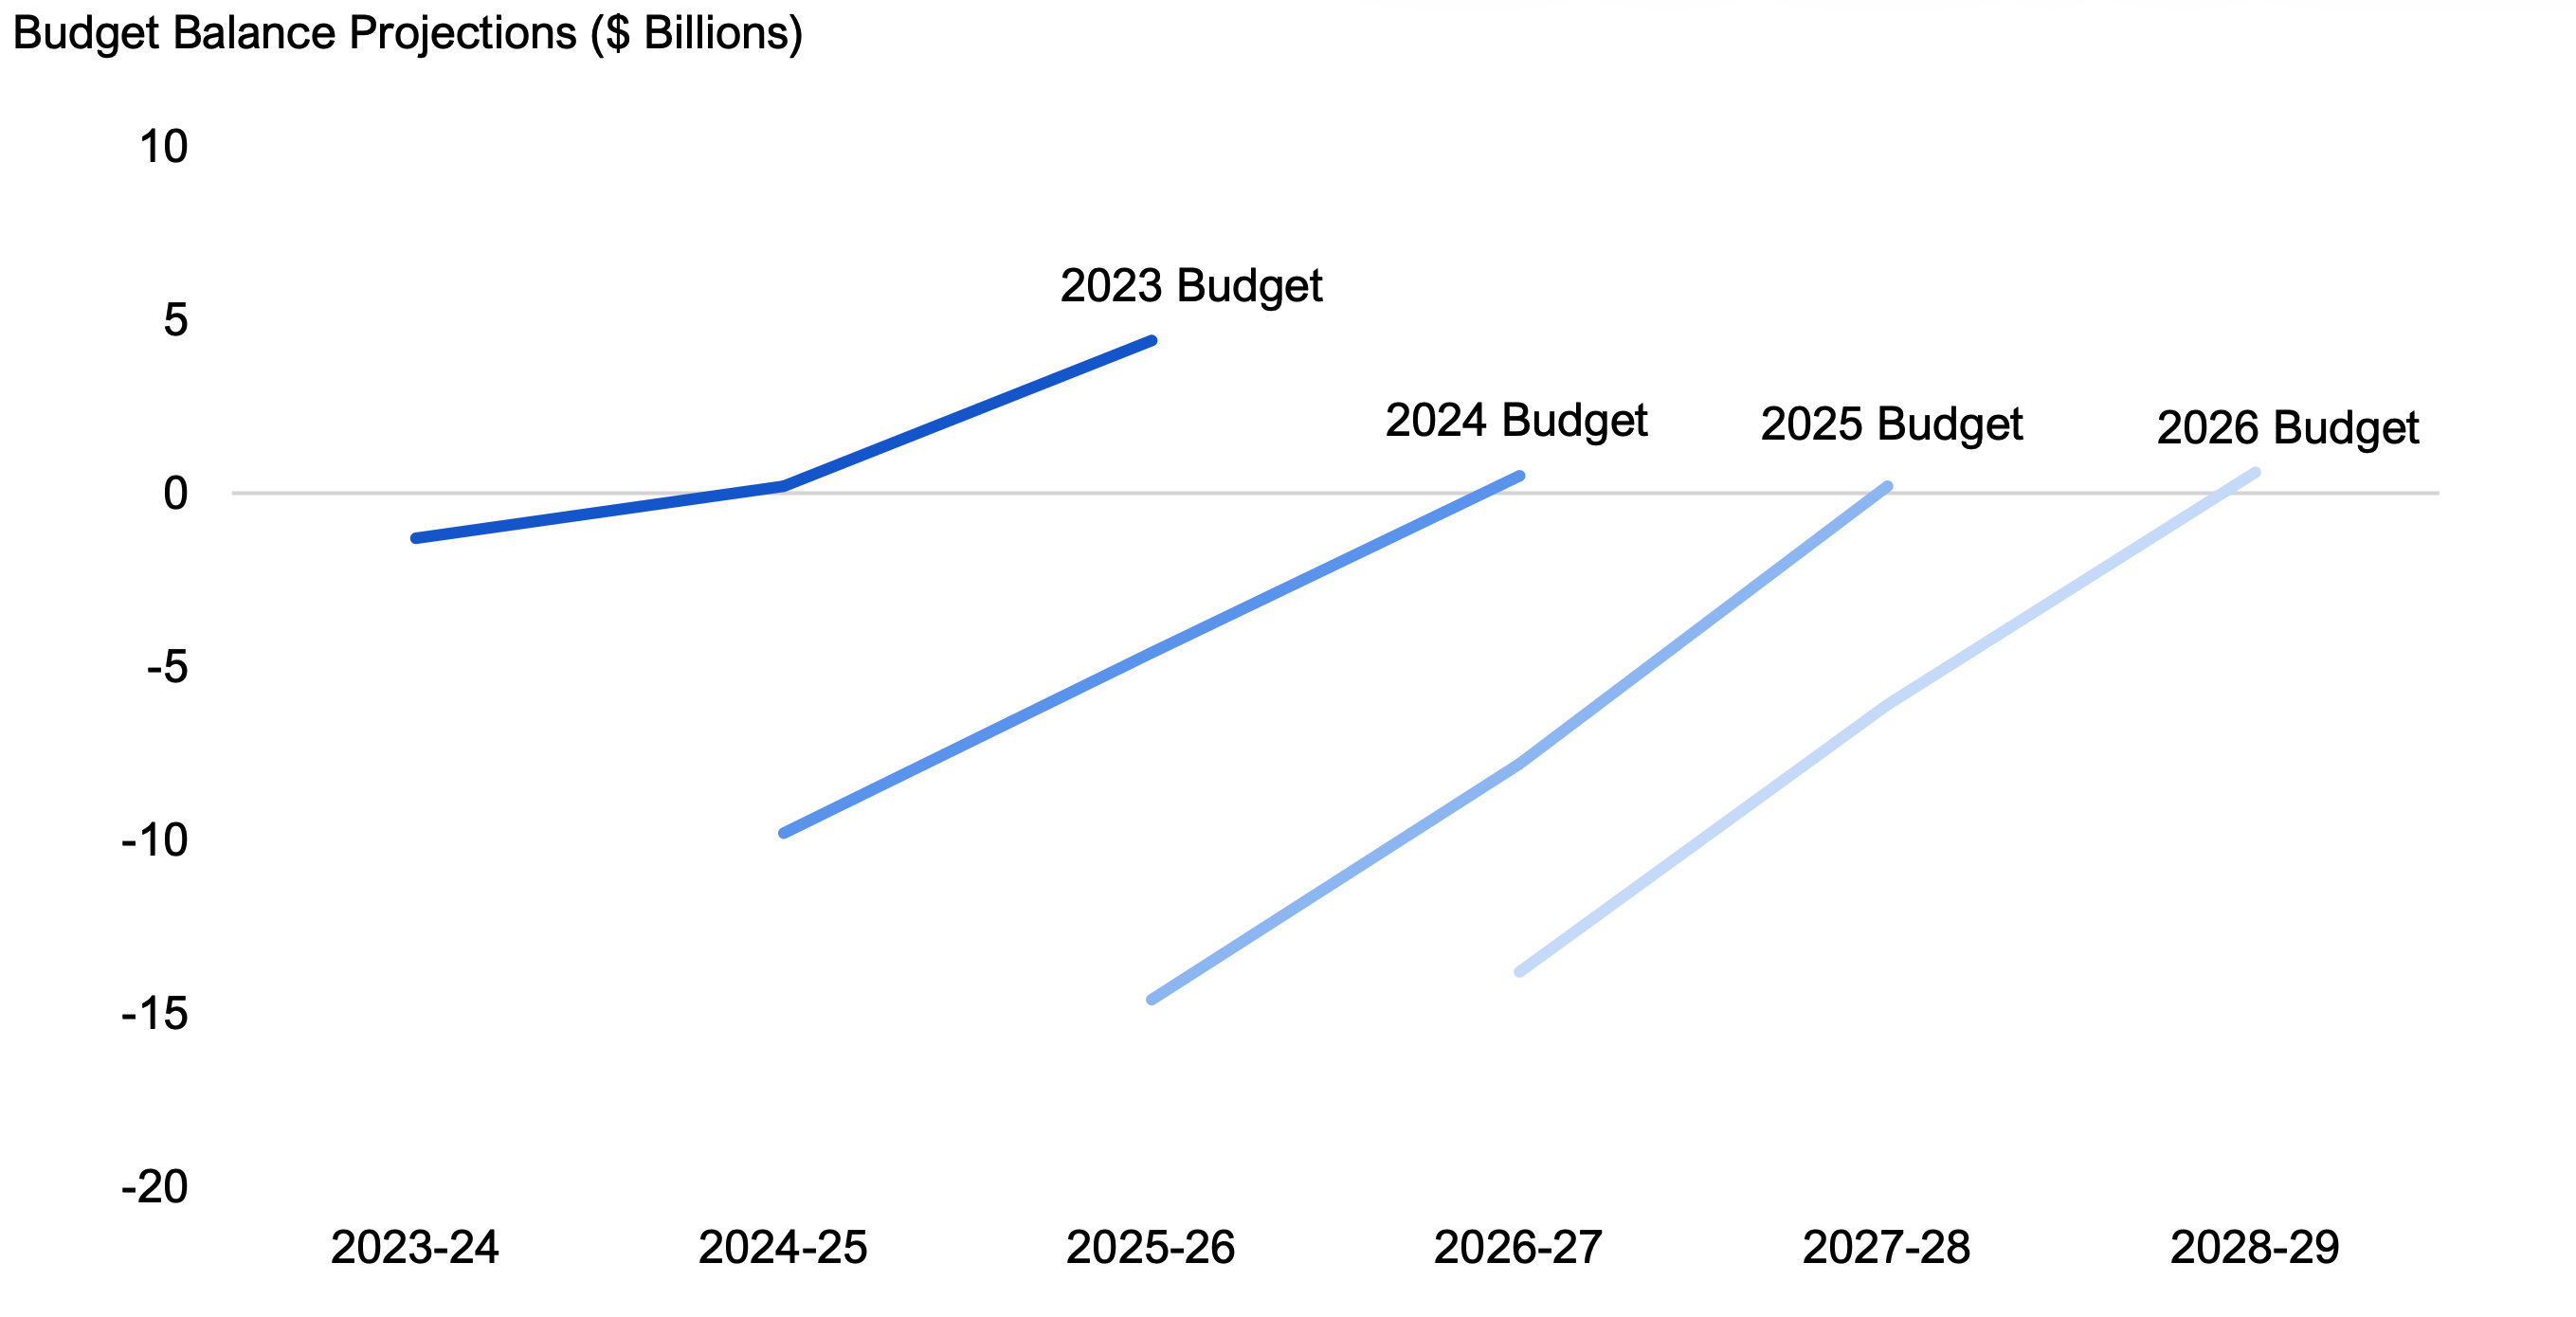
Source: 2023, 2024, 2025 and 2026 Ontario Budgets.
Accessible version
| 2023 Budget | 2024 Budget | 2025 Budget | 2026 Budget | |
|---|---|---|---|---|
| 2023-24 | -1.3 | |||
| 2024-25 | 0.2 | -9.8 | ||
| 2025-26 | 4.4 | -4.6 | -14.6 | |
| 2026-27 | 0.5 | -7.8 | -13.8 | |
| 2027-28 | 0.2 | -6.1 | ||
| 2028-29 | 0.6 |
2026 budget’s path to balance is more optimistic than the FAO’s outlook
Compared to the FAO’s budget outlook released in February 2026,[6] the 2026 budget projects larger deficits in 2025-26 and 2026-27. However, the 2026 budget projects a rapid return to balance in the last two years of the outlook, while the FAO projects ongoing deficits to 2028-29. The FAO’s projection did not expect that the Province would return to a balanced budget by 2028-29 without additional measures to reduce spending and/or increase revenue.
Figure 3.3 The 2026 budget’s path to balance is more optimistic than the FAO’s outlook
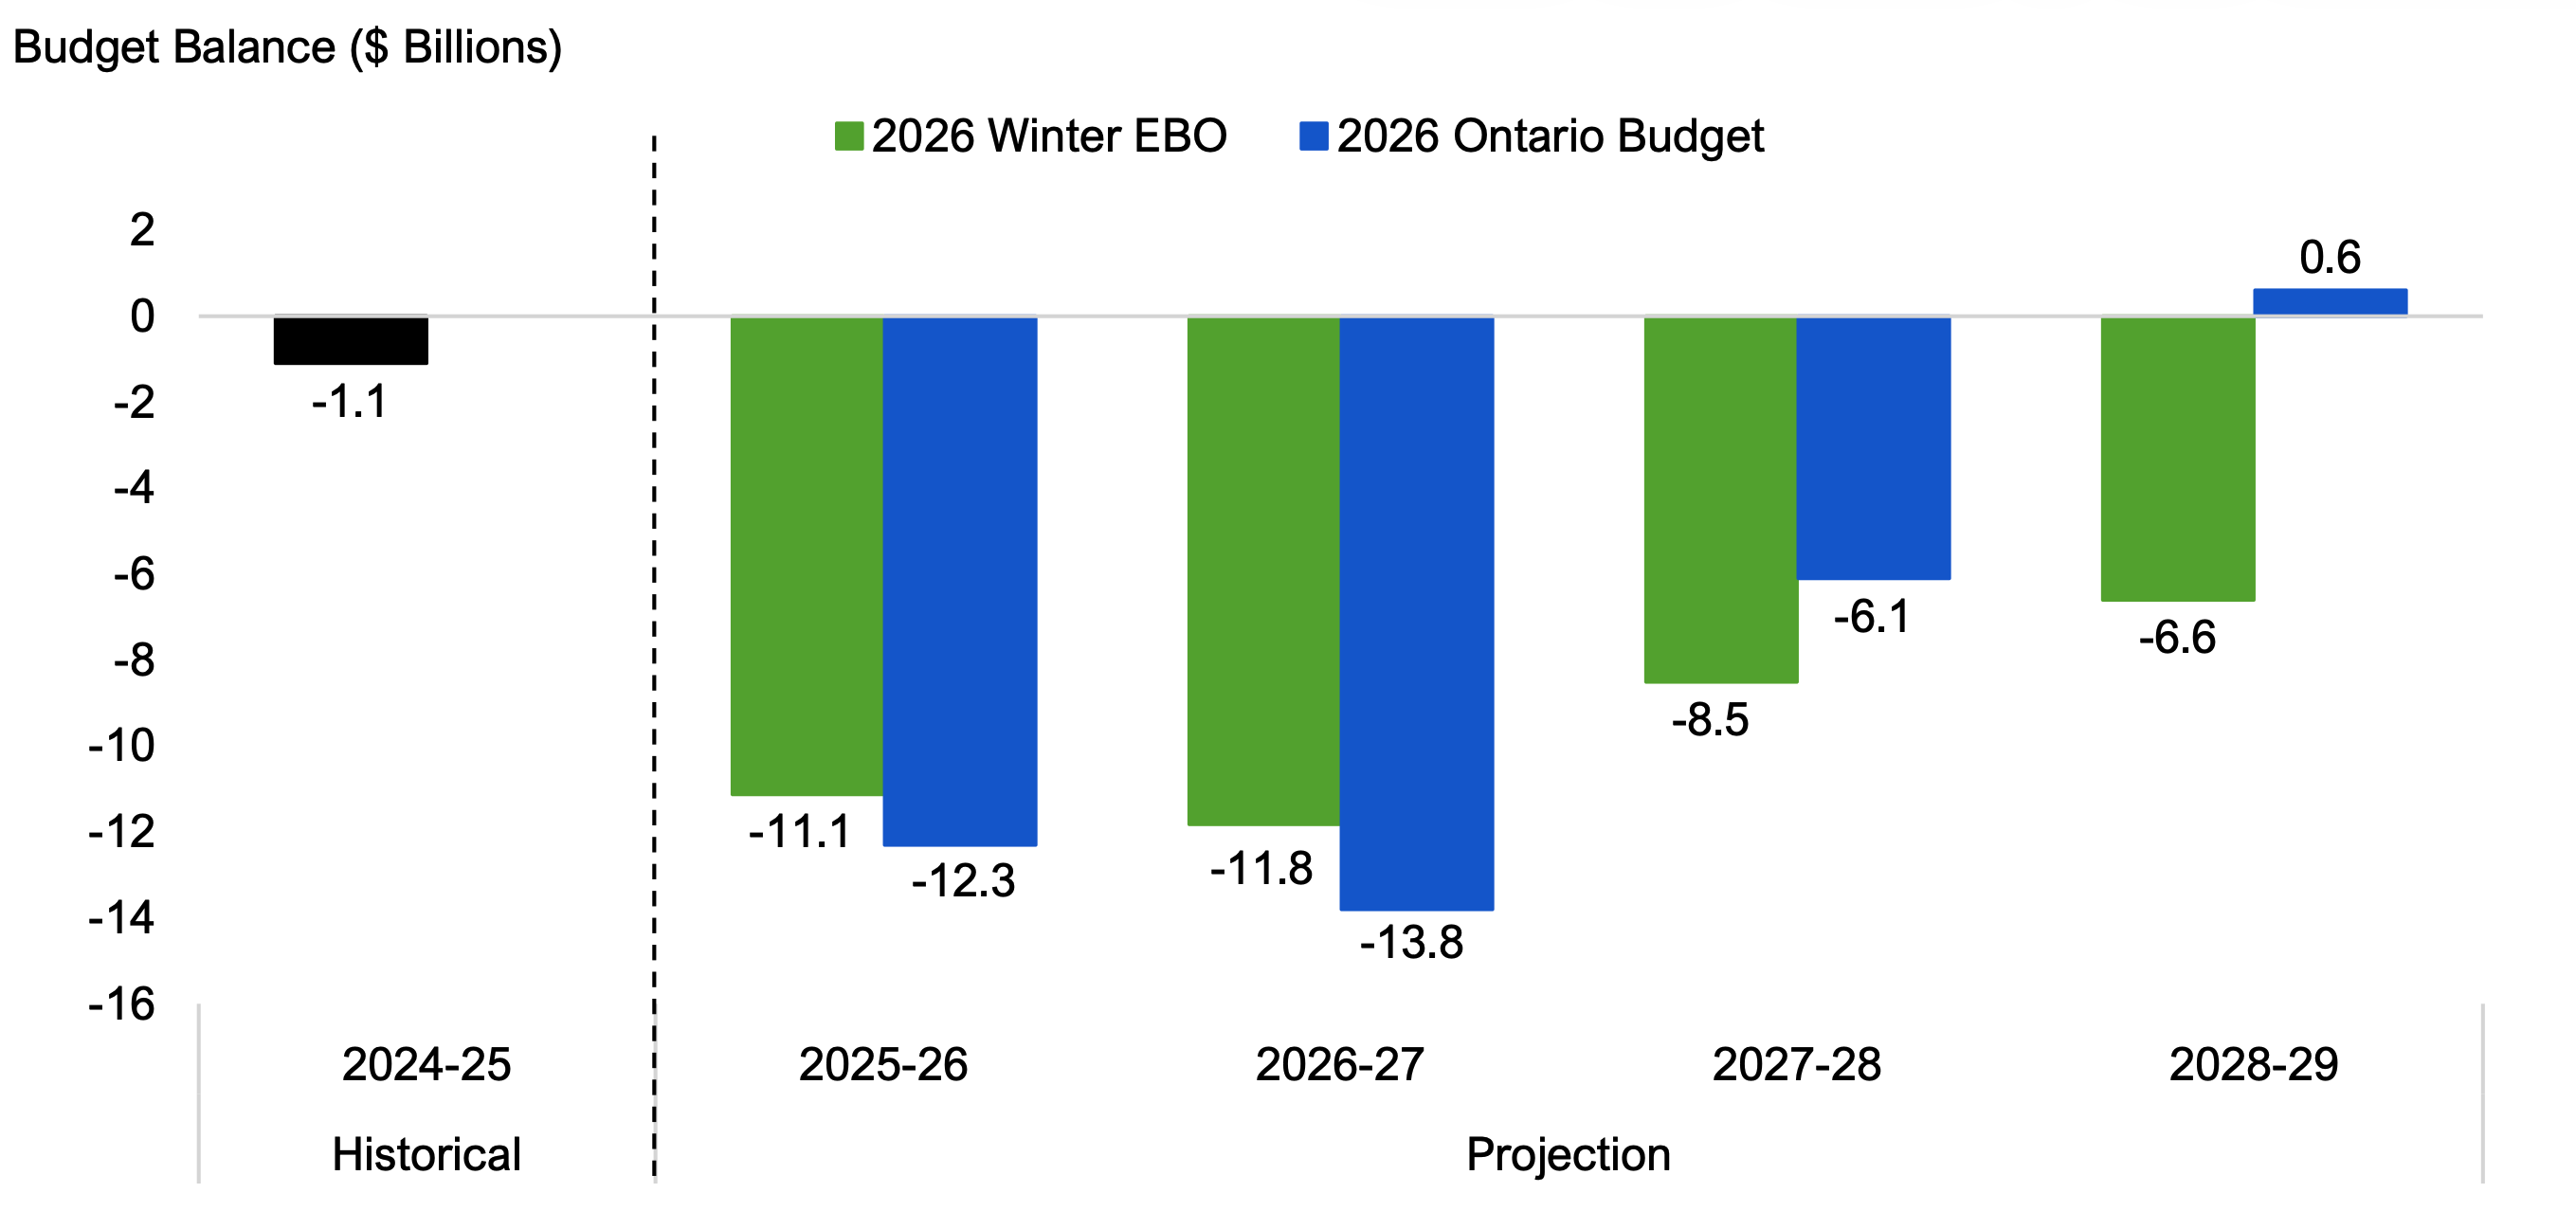
Source: 2026 Ontario Budget and FAO.
Accessible version
| Historical | 2026 Winter EBO | 2026 Ontario Budget | ||
|---|---|---|---|---|
| Historical | 2024-25 | -1.1 | ||
| Projection | 2025-26 | -11.1 | -12.3 | |
| Projection | 2026-27 | -11.8 | -13.8 | |
| Projection | 2027-28 | -8.5 | -6.1 | |
| Projection | 2028-29 | -6.6 | 0.6 |
Accumulated deficit and net debt
The accumulated deficit is a measure of the Province’s total liabilities minus total assets. It represents the total of all past annual deficits minus all past annual surpluses. The 2026 budget projects that Ontario’s accumulated deficit will increase from $247.1 billion in 2024-25 to $278.8 billion in 2028-29, an increase of $31.7 billion (12.8 per cent), driven by budget deficits through 2027-28.
The 2026 Ontario Budget introduced a change to the calculation of net debt to comply with updated public sector accounting standards for the presentation of financial statements.[7] Prior to 2026-27, net debt was calculated as the Province’s total liabilities less financial assets, and excluded non-financial assets (largely infrastructure assets owned by the Province and the broader public sector). Starting in 2026-27, net debt also excludes non-financial liabilities, which the FAO estimates reduces net debt by approximately $11 billion.
With the new net debt calculation starting in 2026-27, the 2026 Ontario Budget projects that the Province’s net debt will rise from $427.1 billion in 2024-25 to $529.3 billion in 2028-29, an increase of $102.2 billion (23.9 per cent). This increase is due to $31.7 billion in accumulated budget deficits over the outlook and borrowing to finance an $82.0 billion increase in non-financial assets (largely capital assets owned by the Province and the broader public sector – hospitals, colleges, school boards and children’s aid societies), offset by an $11.5 billion adjustment to remove non-financial liabilities from the calculation of net debt.
Using the new calculation for net debt, the FAO estimates that the 2026 budget’s projection for net debt is $25.4 billion higher in 2027-28 compared to the 2025 FES projection. The increase is due to $11.1 billion in higher projected deficits through 2027-28 and $14.8 billion in higher projected non-financial assets (largely capital assets owned by the Province and the broader public sector),[8] offset by an estimated $0.6 billion increase in non-financial liabilities.
Fiscal sustainability indicators
FSTAA mandates that each Ontario budget include a debt burden reduction strategy that outlines specific objectives for the projected net debt-to-GDP ratio and a progress report on supporting actions and implementation of the debt burden reduction strategy from the last budget.[9]
In the 2026 budget, the government’s debt burden reduction strategy contained three specific targets, which are unchanged since the 2023 budget:
- net debt-to-GDP[10] below 40 per cent;
- net debt-to-revenue[11] below 200 per cent; and
- net interest-to-revenue[12] below 7.5 per cent.
The 2026 budget projects the following:
- net debt-to-GDP will rise from 35.7 per cent in 2024-25 to 38.2 per cent in 2028-29, staying below the government’s target and the 10-year historical average;
- net debt-to-revenue will rise from 191.2 per cent in 2024-25 to 209.8 per cent in 2028-29, rising above the government’s target but remaining below the 10-year historical average; and
- net interest-to-revenue will rise from 5.5 per cent in 2024-25 to 7.1 per cent in 2028-29, staying below the government’s target and the 10-year historical average.
| Indicator | 2024-25 Actual (%) | 2028-29 Forecast (%) | Change (ppt**) | Government Target (%) | Over / Under Target in 2028-29 | 10-Year Historical Average (%) | Over / Under 10-Year Average in 2028-29 |
|---|---|---|---|---|---|---|---|
| Net Debt-to-GDP* | 35.7 | 38.2 | 2.5 | < 40.0 | Under | 38.9 | Under |
| Net Debt-to-Revenue* | 191.2 | 209.8 | 18.6 | < 200.0 | Over | 213.8 | Under |
| Net Interest-to-Revenue* | 5.5 | 7.1 | 1.6 | < 7.5 | Under | 7.3 | Under |
Notably, the change to the calculation for net debt noted above affects the net debt-to-GDP and net debt-to-revenue ratios for fiscal years 2026-27 and later. Under the old calculation for net debt, the FAO estimates that the 2026 budget’s projected net debt-to-GDP ratio would be approximately 0.8 percentage points higher or 39.0 per cent in 2028-29, still below the government’s 40 per cent target but above the 10-year historical average. Under the old calculation for the net debt-to-revenue ratio, the FAO estimates that the 2026 budget’s projection would be approximately 4.5 percentage points higher at 214.3 per cent in 2028-29, above the government’s 200 per cent target and the 10-year historical average.
Relative to the FES, the 2026 budget’s projections for all three fiscal sustainability indicators are higher by 2027-28, in both the old and new calculations for net debt.
4. Revenue Outlook
2026 budget projects revenue growth to moderate
The 2026 Ontario Budget projects that total revenue will grow at an average annual rate of 3.0 per cent, from $226.2 billion in 2024-25 to $254.1 billion in 2028-29. This is a slower pace than the 8.1 per cent average annual revenue growth from 2020-21 to 2024-25.
In the 2026 budget projection, slower revenue growth is expected in 2025-26 and 2026-27, with average annual growth of 1.3 per cent, largely reflecting declines in other non-tax revenue due to the loss of one-time tobacco settlement revenues and lower fees from the broader public sector.[13] Revenue gains accelerate in the last two years of the forecast, with average annual growth of 4.7 per cent in 2027-28 and 2028-29, driven by strong increases in tax revenues that exceed the growth in nominal GDP, the broadest measure of the tax base.
Figure 4.1 2026 Ontario Budget projects revenue growth to moderate

Note: Historical revenue has been restated to include revenue from interest and investment income.
Source: 2026 Ontario Budget, Ontario Public Accounts and FAO.
Accessible version
| Historical 2020-21 to 2024-25 |
Projection 2024-25 to 2028-29 |
|
|---|---|---|
| Average Annual Revenue Growth (Per Cent) | 8.1 | 3.0 |
| Total Revenue ($ Billions) | Historical | Projection | |
|---|---|---|---|
| Historical | 2020-21 | 165.7 | |
| Historical | 2021-22 | 185.8 | |
| Historical | 2022-23 | 194.4 | |
| Historical | 2023-24 | 209.0 | |
| Historical | 2024-25 | 226.2 | |
| Projection | 2025-26 | 226.6 | |
| Projection | 2026-27 | 231.9 | |
| Projection | 2027-28 | 243.4 | |
| Projection | 2028-29 | 254.1 |
The 3.0 per cent average annual growth in total revenue over the 2026 budget projection is driven primarily by strong growth in personal income tax (PIT) revenue, which is expected to grow at an average rate of 7.4 per cent per year, accounting for two-thirds of total revenue growth. The growth in PIT revenue is well above the 2026 budget’s projection for labour income growth, which is the primary driver of PIT revenue and is expected to grow at an average annual rate of 3.5 per cent.[14]
Total revenue growth also reflects projected increases in corporations tax, sales tax, all other taxes and federal transfers. The overall gains in tax revenues and federal transfers are expected to more than offset projected revenue declines in income from government business enterprises and other non-tax revenue over the outlook.
Figure 4.2 2026 Ontario Budget projected revenue growth by category, 2024-25 to 2028-29

Source: 2026 Ontario Budget, Ontario Public Accounts and FAO.
Accessible version
| Sector | Average Annual Spending Growth (Per Cent) |
|---|---|
| Total Revenue | 3.0 |
| Personal Income Tax | 7.4 |
| Corporations Tax | 4.0 |
| Sales Tax | 3.5 |
| All Other Tax | 2.9 |
| Federal Transfers | 2.5 |
| Government Business Enterprises | -0.5 |
| Other Non-Tax Revenues | -7.3 |
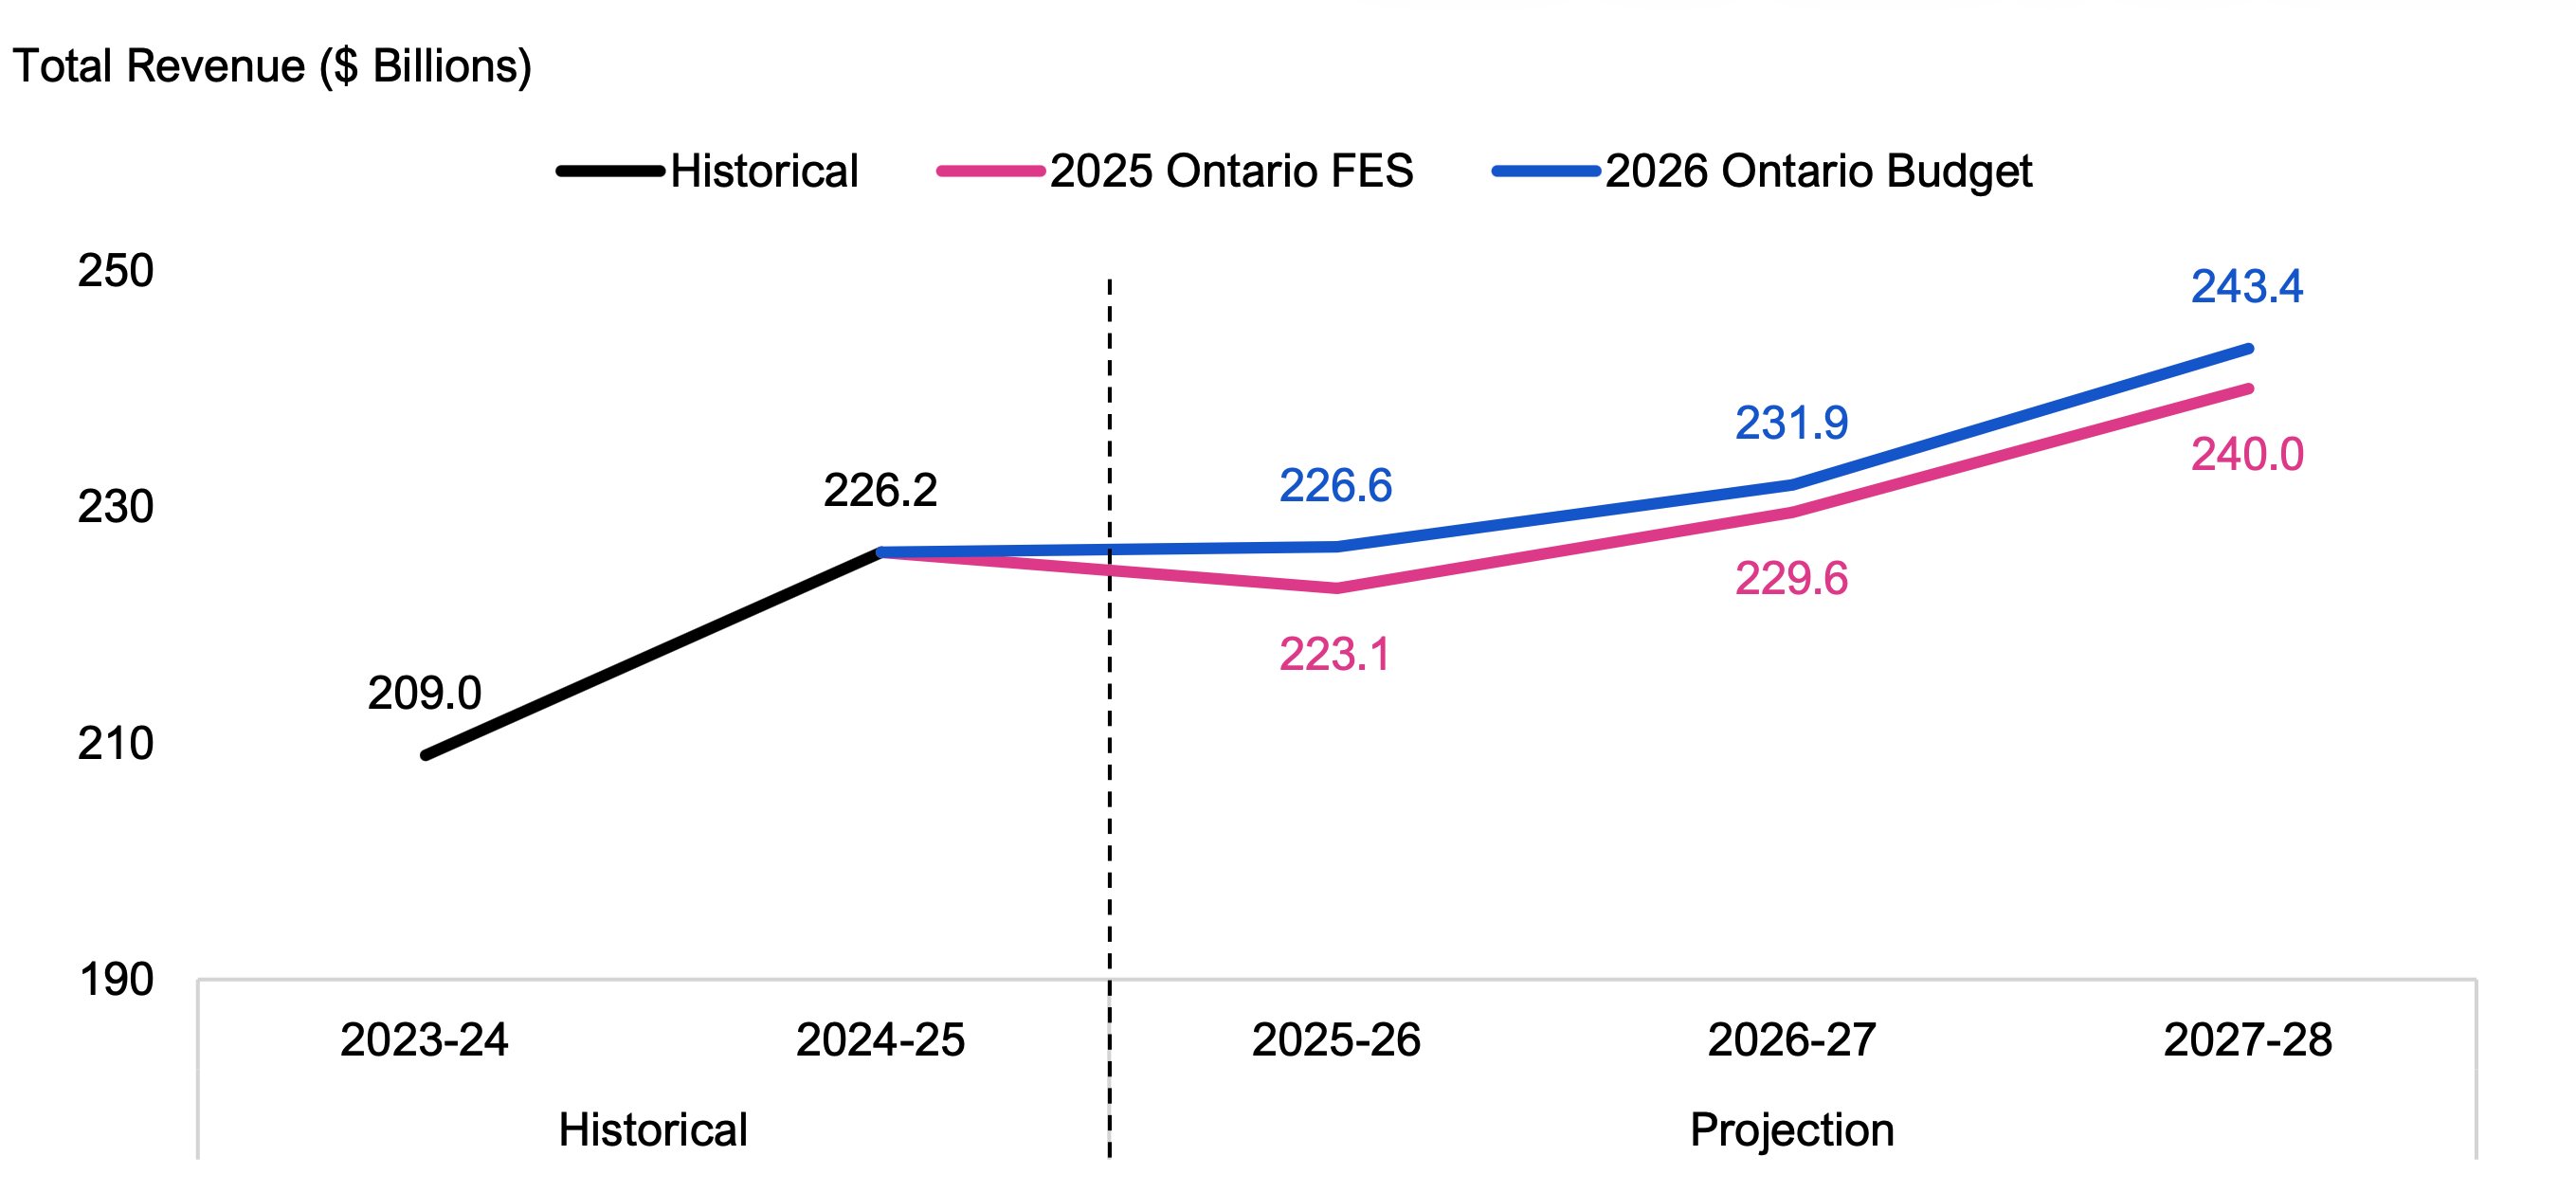
2026 budget projects higher revenue compared to the 2025 FES
Relative to the 2025 FES, the 2026 budget’s projected revenues are higher in each year of the comparable projection period (2025-26 to 2027-28), for a cumulative increase of $9.2 billion. The difference is driven primarily by $8.3 billion in higher projected PIT revenue. The government notes that 2025 economic growth and equity market performance were stronger than forecast, leading to a higher projected PIT revenue base in 2025-26. This higher 2025-26 PIT revenue base accounts for the increase in projected PIT revenue over the rest of the 2026 budget outlook.
Figure 4.3 2026 Ontario Budget and 2025 Fall Economic Statement revenue projections
Note: Historical revenue has been restated to include revenue from interest and investment income.
Source: 2026 Ontario Budget, 2025 Ontario Economic Outlook and Fiscal Review, Ontario Public Accounts and FAO.
Accessible version
| Historical | 2025 Ontario FES | 2026 Ontario Budget | ||
|---|---|---|---|---|
| Historical | 2023-24 | 209.0 | ||
| Historical | 2024-25 | 226.2 | ||
| Projection | 2025-26 | 223.1 | 226.6 | |
| Projection | 2026-27 | 229.6 | 231.9 | |
| Projection | 2027-28 | 240.0 | 243.4 |
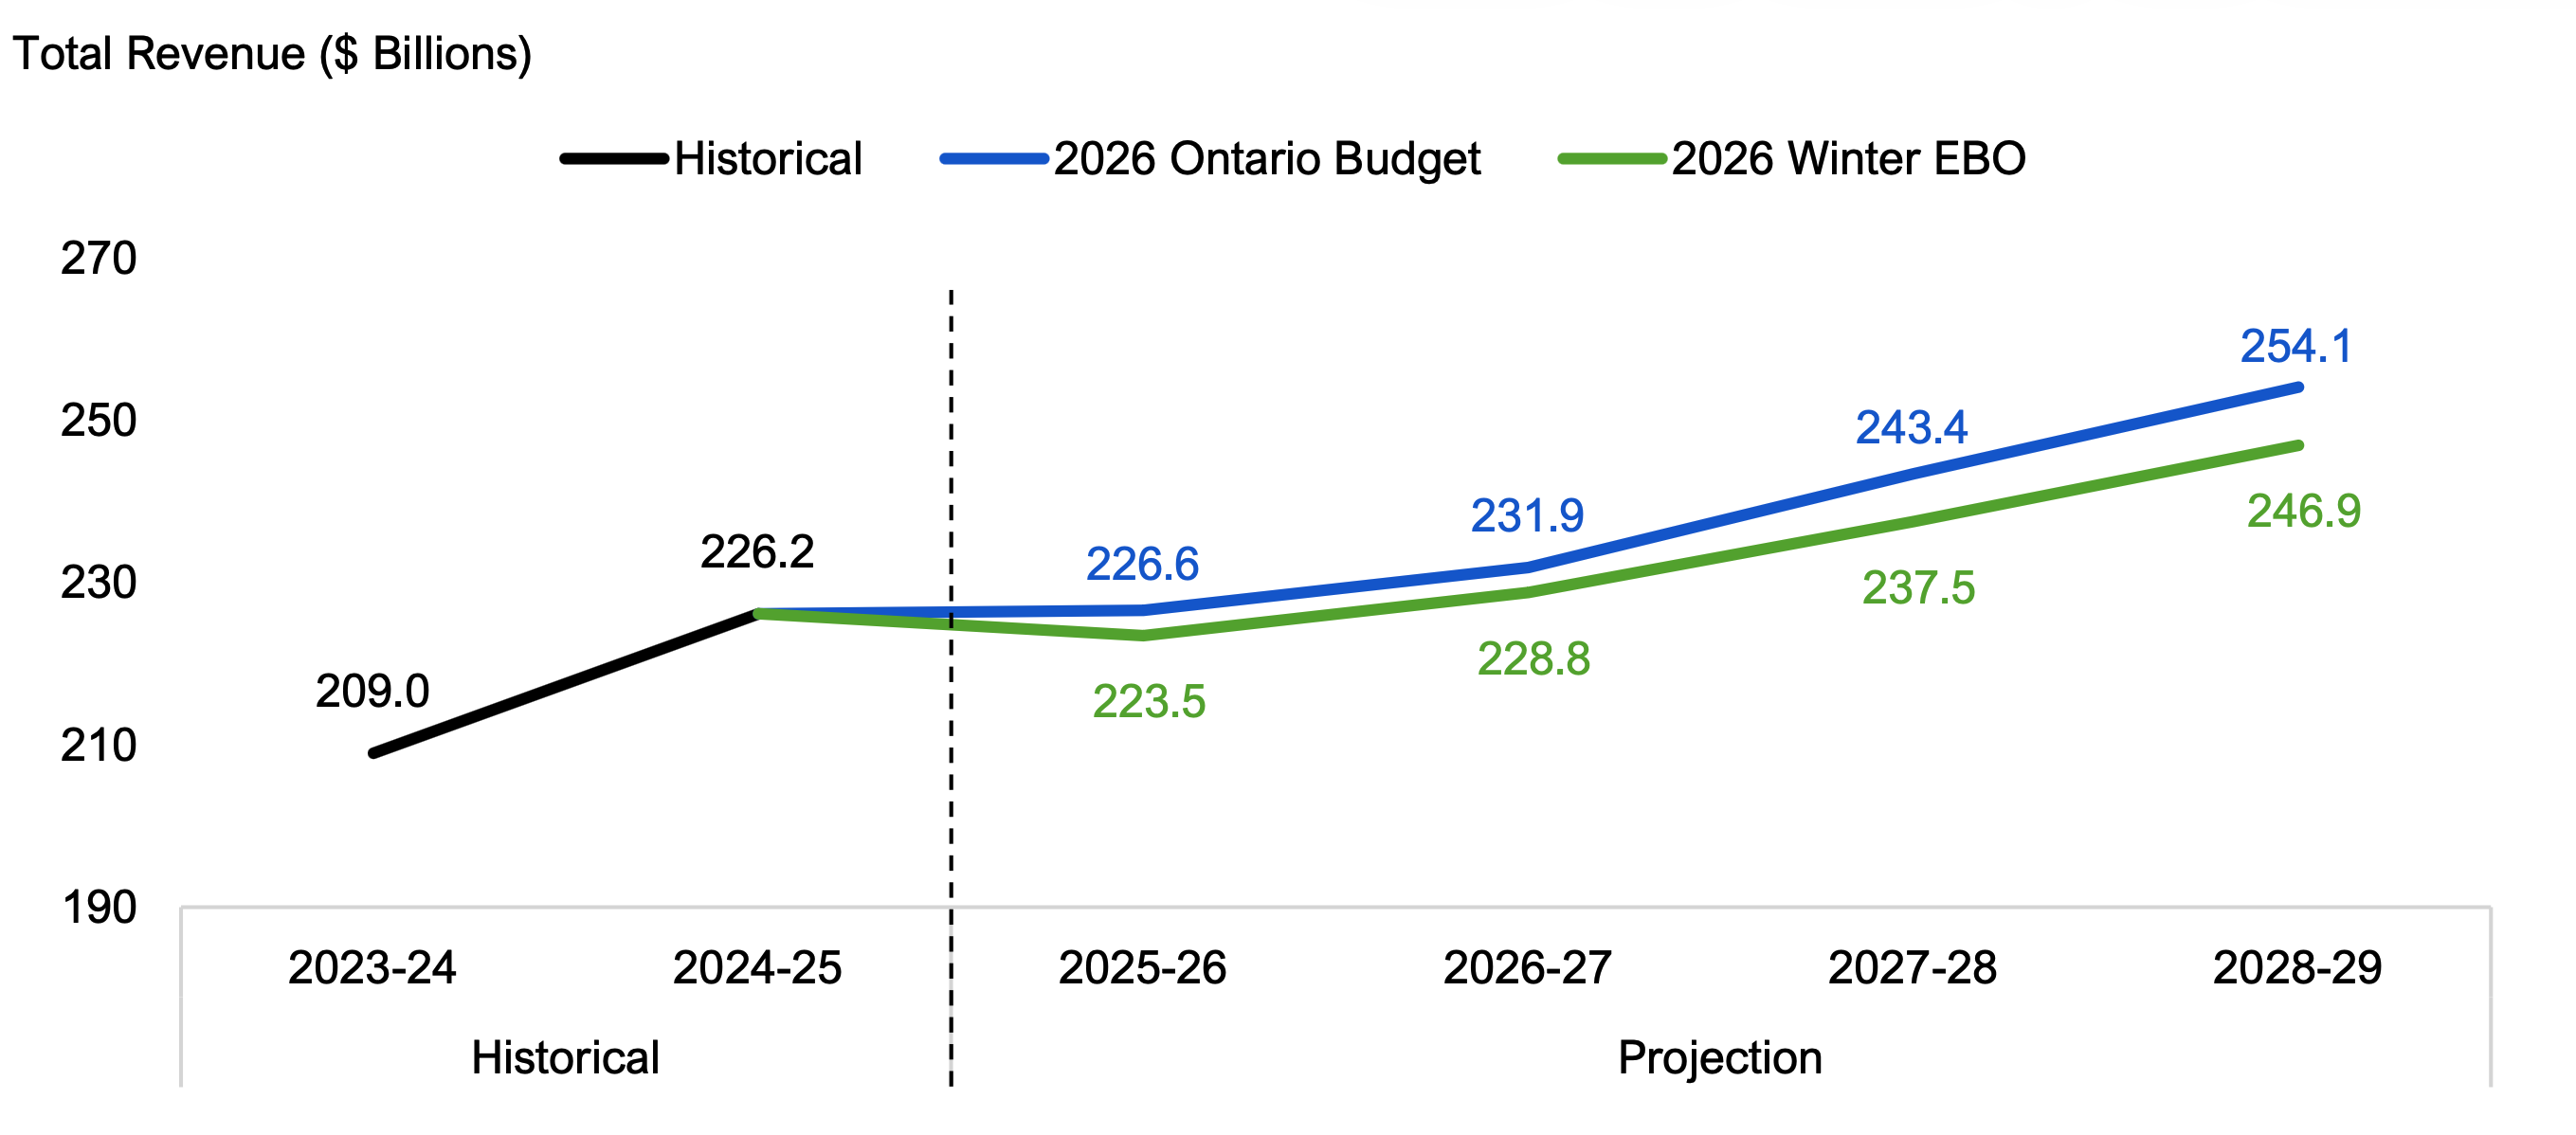
2026 budget’s revenue projection is higher than the FAO’s outlook
The revenue projection in the 2026 budget is a cumulative $19.3 billion higher than the FAO’s Winter 2026 EBO projection over the comparable forecast period (2025-26 to 2028-29), despite the government’s modestly weaker economic growth forecast (see Chapter 2).
Figure 4.4 2026 Ontario Budget and FAO Winter 2026 Economic and Budget Outlook revenue projections
Note: Historical revenue has been restated to include revenue from interest and investment income.
Source: 2026 Ontario Budget, Ontario Public Accounts and FAO.
Accessible version
| Historical | 2026 Ontario Budget | 2026 Winter EBO | ||
|---|---|---|---|---|
| Historical | 2023-24 | 209.0 | ||
| Historical | 2024-25 | 226.2 | ||
| Projection | 2025-26 | 226.6 | 223.5 | |
| Projection | 2026-27 | 231.9 | 228.8 | |
| Projection | 2027-28 | 243.4 | 237.5 | |
| Projection | 2028-29 | 254.1 | 246.9 |
The $19.3 billion difference largely results from the 2026 budget’s cumulative $25.7 billion higher PIT revenue projection compared to the FAO’s forecast (7.4 per cent average annual growth vs. 4.1 per cent). The 2026 budget’s higher PIT forecast is somewhat offset by a lower sales tax revenue projection (-$4.7 billion) compared to the FAO, which reflects the new HST rebate on the purchase of new homes announced in the 2026 budget as well as updated information on HST revenue collection from the federal government.
| Difference ($ Billions) | 2025-26 | 2026-27 | 2027-28 | 2028-29 | Total |
|---|---|---|---|---|---|
| Personal Income Tax | 4.5 | 5.4 | 7.2 | 8.7 | 25.7 |
| Corporations Tax | -0.7 | -0.2 | 0.5 | 1.1 | 0.6 |
| Sales Tax | -1.5 | -2.3 | -0.6 | -0.3 | -4.7 |
| All Other Taxes | -0.5 | -0.5 | -0.6 | -0.4 | -2.0 |
| Taxation Revenue | 1.7 | 2.4 | 6.5 | 9.1 | 19.7 |
| Federal Transfers | 0.6 | 0.7 | 0.2 | -0.8 | 0.7 |
| Government Business Enterprises | 0.8 | -0.3 | -0.8 | -0.5 | -0.8 |
| Other Non-Tax Revenues | 0.0 | 0.3 | 0.0 | -0.6 | -0.3 |
| Total Revenue | 3.1 | 3.1 | 5.9 | 7.2 | 19.3 |
5. Spending Outlook
2026 budget projects spending growth to moderate
The 2026 Ontario Budget projects that spending will grow at an average annual rate of 2.5 per cent from $227.3 billion in 2024-25 to $251.1 billion in 2028-29. This is a slower pace than the 5.7 per cent average annual growth from 2020-21 to 2024-25. Moreover, spending growth is expected to be concentrated in 2025‑26 and 2026-27, with average annual growth of 3.7 per cent in those two years before slowing to an average annual growth rate of 1.4 per cent in 2027-28 and 2028-29.
Figure 5.1 2026 Ontario Budget projects spending growth to moderate

Note: Historical spending has been restated to exclude revenue from interest and investment income.
Source: 2026 Ontario Budget, Ontario Public Accounts and FAO.
Accessible version
| Historical 2020-21 to 2024-25 |
Projection 2024-25 to 2028-29 |
|
|---|---|---|
| Average Annual Revenue Growth (Per Cent) | 5.7 | 2.5 |
| Total Spending ($ Billions) | Historical | Projection | |
|---|---|---|---|
| Historical | 2020-21 | 182.0 | |
| Historical | 2021-22 | 183.8 | |
| Historical | 2022-23 | 200.3 | |
| Historical | 2023-24 | 209.7 | |
| Historical | 2024-25 | 227.3 | |
| Projection | 2025-26 | 238.4 | |
| Projection | 2026-27 | 244.2 | |
| Projection | 2027-28 | 247.5 | |
| Projection | 2028-29 | 251.1 |
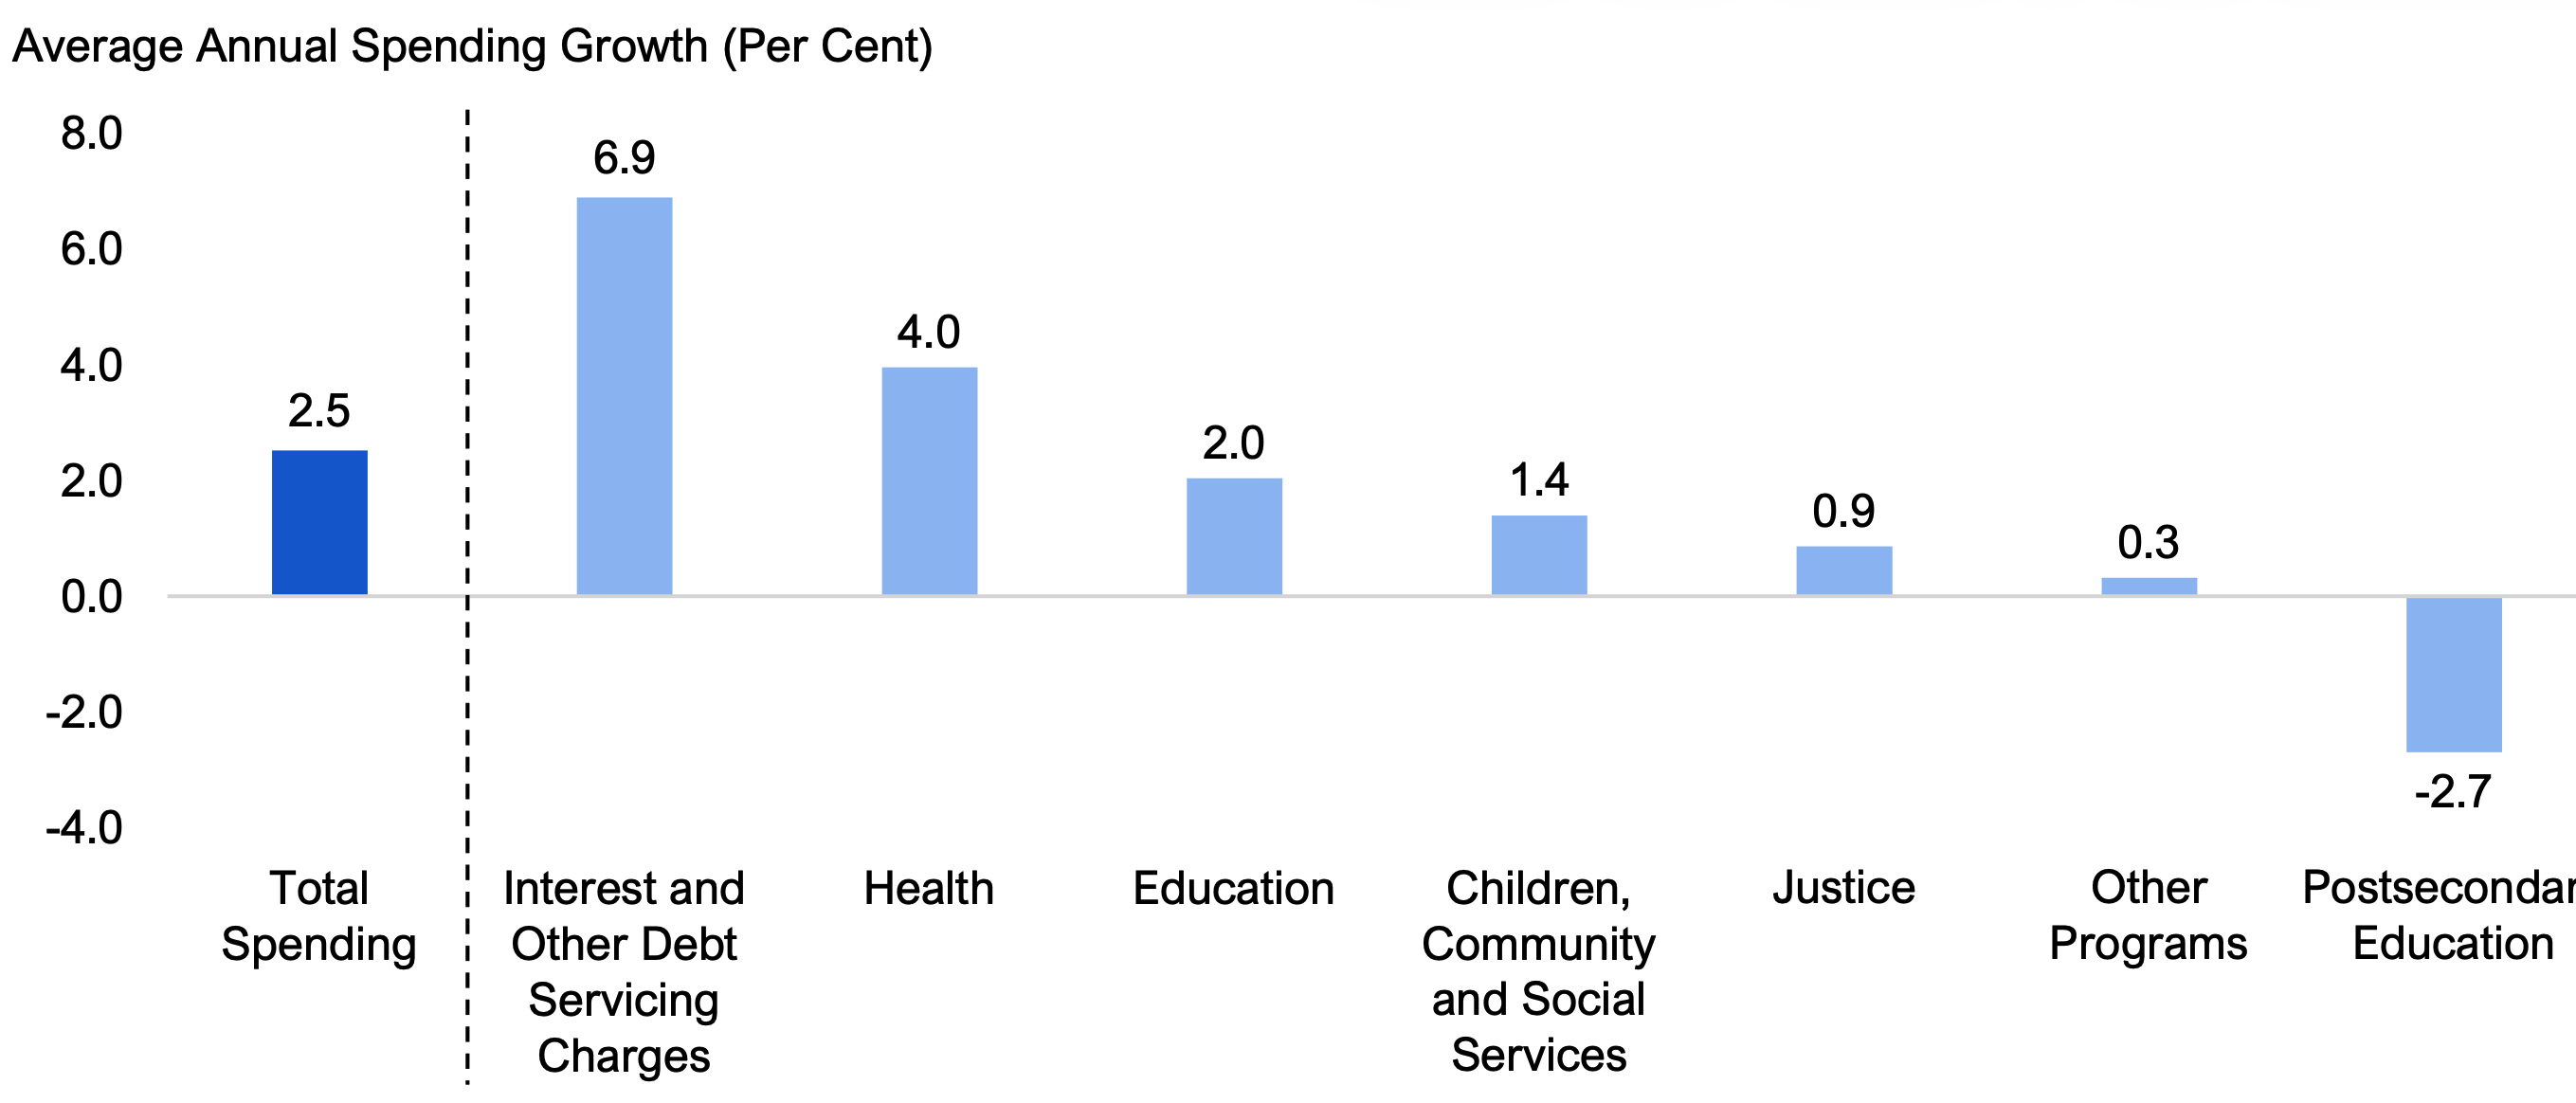
Over the 2024-25 to 2028-29 period, the average annual growth for interest and other debt servicing charges (6.9 per cent) and for the health sector (4.0 per cent), is expected to be faster than the average annual growth rate for total spending (2.5 per cent). All other sectors are projected to grow more slowly than total spending, including education (2.0 per cent),[15] children, community and social services (1.4 per cent), justice (0.9 per cent) and ‘other programs’ (0.3 per cent). Postsecondary education spending is projected to decline at an average annual rate of 2.7 per cent.
Figure 5.2 2026 Ontario Budget spending growth by sector from 2024-25 to 2028-29
Note: Ontario Teachers’ Pension Plan expense is included in the education sector.
Source: 2026 Ontario Budget and FAO.
Accessible version
| Sector | Average Annual Spending Growth (Per Cent) |
|---|---|
| Total Spending | 2.5 |
| Interest and Other Debt Servicing Charges | 6.9 |
| Health | 4.0 |
| Education | 2.0 |
| Children, Community and Social Services | 1.4 |
| Justice | 0.9 |
| Other Programs | 0.3 |
| Postsecondary Education | -2.7 |
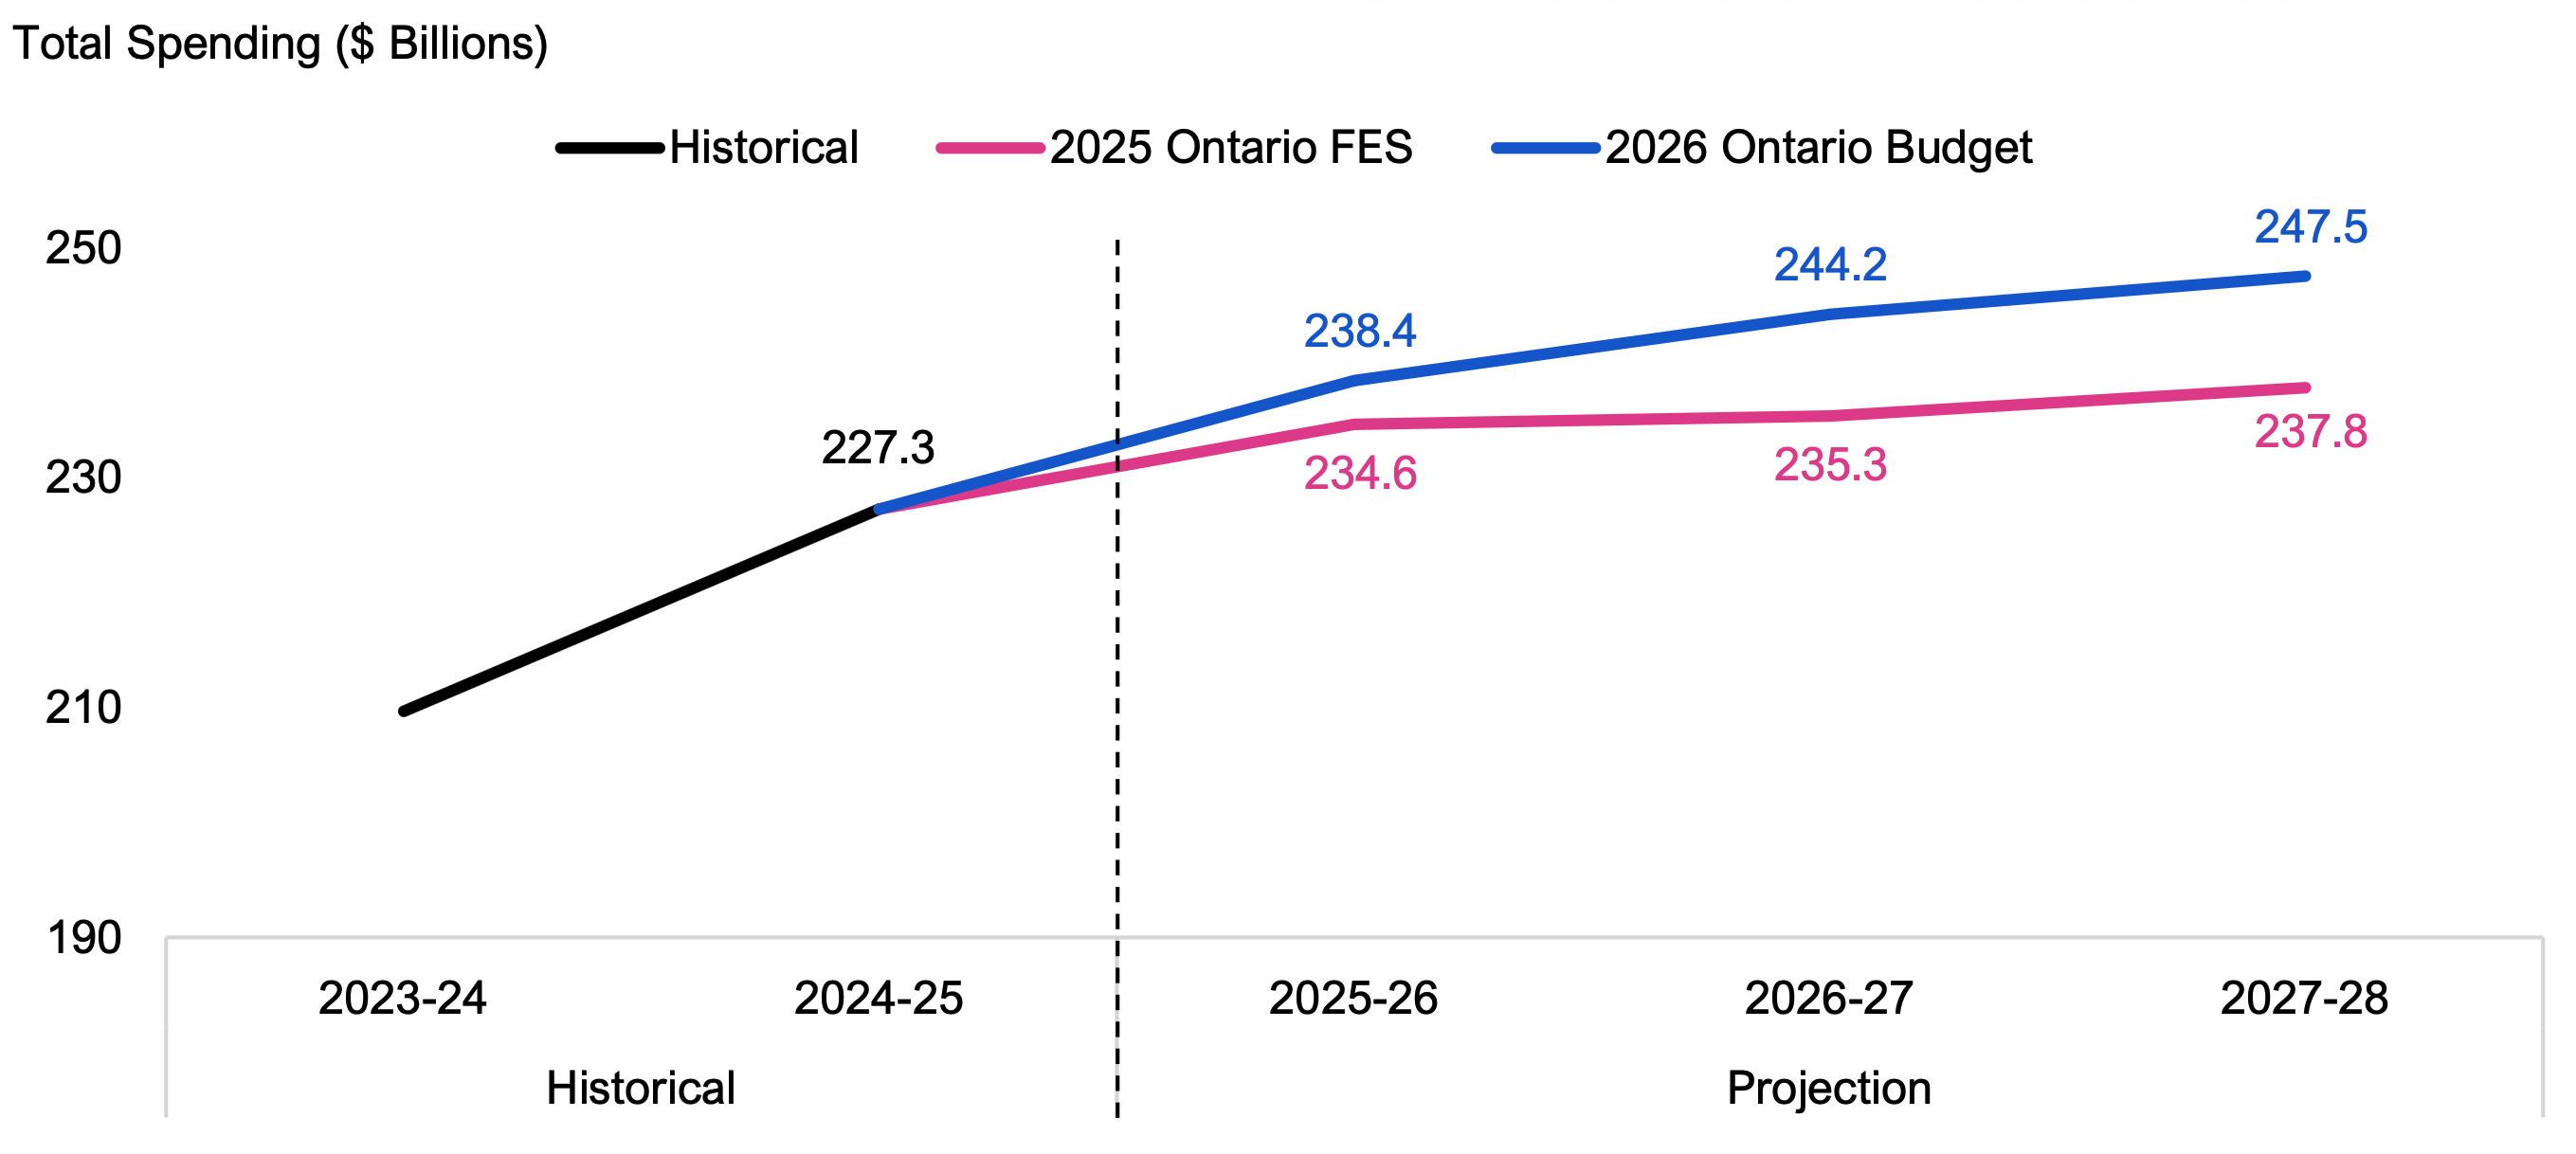
2026 budget added $22.4 billion in new spending
Compared to the 2025 FES, the government’s spending forecast in the 2026 budget has increased by a total of $22.4 billion from 2025-26 to 2027-28. This includes $3.8 billion in 2025-26, $8.9 billion in 2026-27 and $9.7 billion in 2027-28.
Figure 5.3 2026 Ontario Budget and 2025 Fall Economic Statement spending projections
Note: Historical spending has been restated to exclude revenue from interest and investment income.
Source: 2026 Ontario Budget, 2025 Ontario Economic Outlook and Fiscal Review, Ontario Public Accounts and FAO.
Accessible version
| Historical | 2025 Ontario FES | 2026 Ontario Budget | ||
|---|---|---|---|---|
| Historical | 2023-24 | 209.7 | ||
| Historical | 2024-25 | 227.3 | ||
| Projection | 2025-26 | 234.6 | 238.4 | |
| Projection | 2026-27 | 235.3 | 244.2 | |
| Projection | 2027-28 | 237.8 | 247.5 |
The majority of new spending in the 2026 budget was allocated to the health sector, with a total of $24.2 billion in new spending. Other sectors with spending increases include children, community and social services ($3.3 billion), justice ($2.2 billion), postsecondary education ($1.9 billion) and interest and other debt servicing charges ($1.1 billion). Two sectors had reductions in planned spending: ‘other programs’ decreased by $9.9 billion and education by $0.5 billion.
| Difference ($ Billions) | 2025-26 | 2026-27 | 2027-28 | Total |
|---|---|---|---|---|
| Health | 6.3 | 8.4 | 9.5 | 24.2 |
| Education | 0.0 | -0.3 | -0.1 | -0.5 |
| Postsecondary Education | 1.0 | 0.9 | 0.0 | 1.9 |
| Children, Community, Social Services | 1.1 | 1.0 | 1.2 | 3.3 |
| Justice | 0.6 | 0.7 | 0.9 | 2.2 |
| Other Programs | -5.1 | -2.2 | -2.6 | -9.9 |
| Interest and Other Debt Servicing Charges | -0.1 | 0.4 | 0.8 | 1.1 |
| Total Spending | 3.8 | 8.9 | 9.7 | 22.4 |
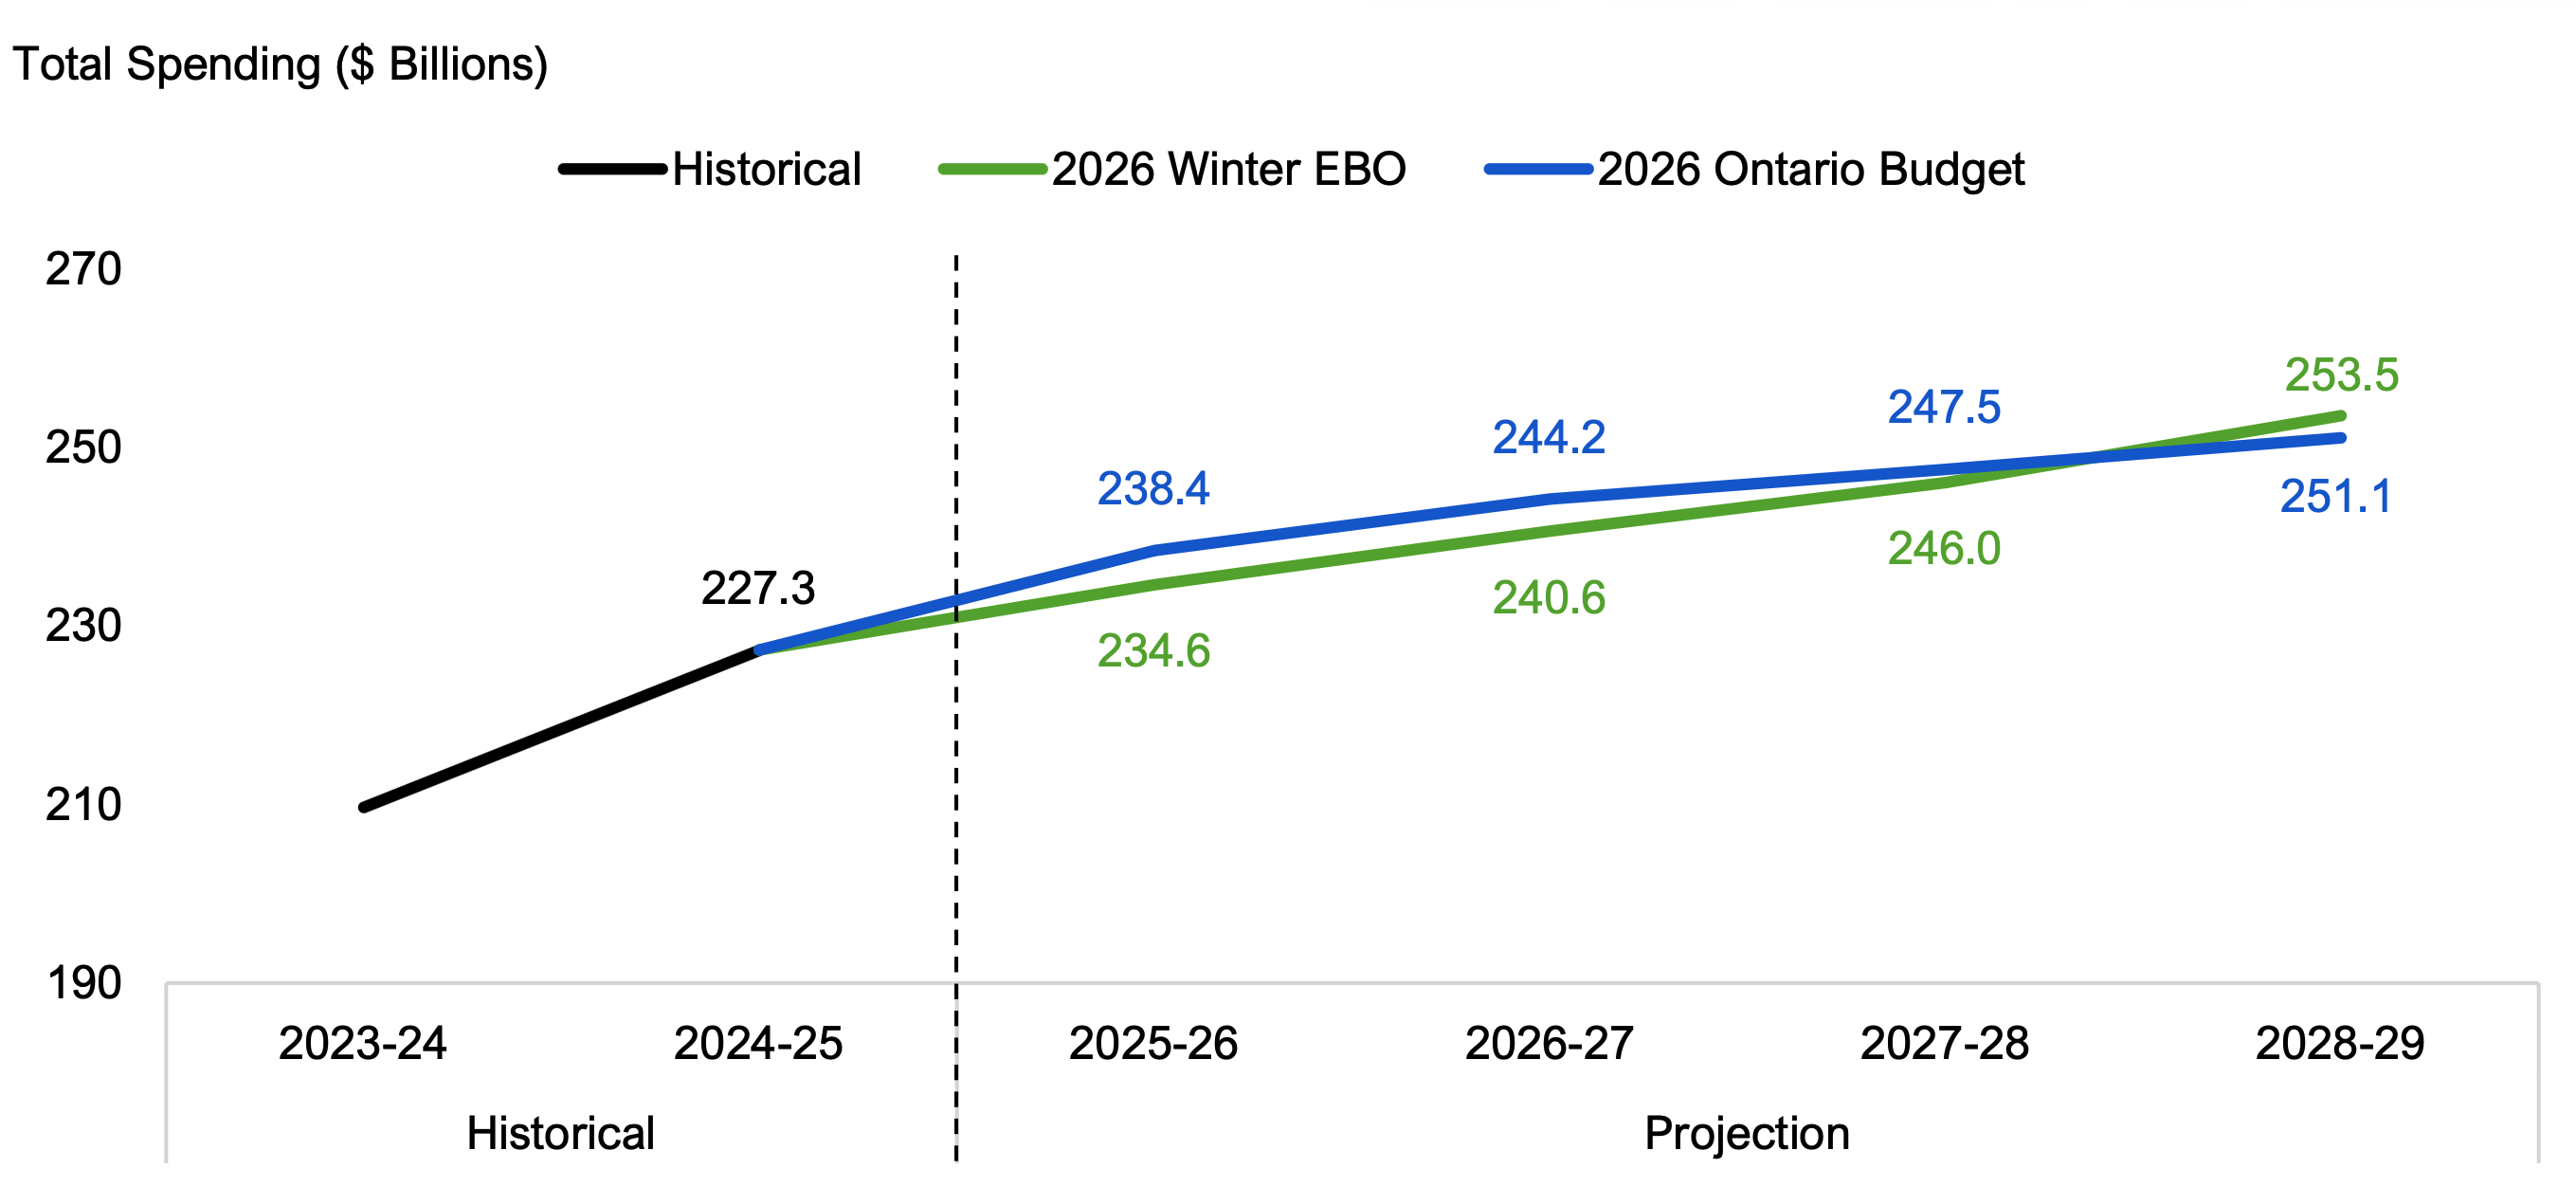
2026 budget projects higher spending than the FAO’s projection
Over the four-year projection from 2025-26 to 2028-29, total projected spending in the 2026 budget is higher than the FAO’s forecast in the Winter 2026 EBO by a cumulative $6.5 billion. The 2026 budget projects $3.8 billion in higher spending than the FAO in 2025-26, $3.6 billion in 2026-27 and $1.5 billion in 2027-28, which is partially offset by $2.5 billion in lower projected spending in 2028-29.
Figure 5.4 2026 Ontario Budget and FAO Winter 2026 Economic and Budget Outlook spending projections
Note: Historical spending has been restated to exclude revenue from interest and investment income.
Source: 2026 Ontario Budget, Ontario Public Accounts and FAO.
Accessible version
| Historical | 2026 Winter EBO | 2026 Ontario Budget | ||
|---|---|---|---|---|
| Historical | 2023-24 | 209.7 | ||
| Historical | 2024-25 | 227.3 | ||
| Projection | 2025-26 | 234.6 | 238.4 | |
| Projection | 2026-27 | 240.6 | 244.2 | |
| Projection | 2027-28 | 246.0 | 247.5 | |
| Projection | 2028-29 | 253.5 | 251.1 |
By sector, the 2026 budget projects higher total spending over four years compared to the FAO in ‘other programs’ ($12.8 billion), interest and other debt servicing charges ($1.3 billion) and justice ($0.9 billion). The 2026 budget projects lower total spending over four years compared to the FAO in health (-$3.1 billion), children, community and social services (-$3.1 billion), education (-$2.1 billion) and postsecondary education (-$0.3 billion).
| Difference ($ Billions) | 2025‑26 | 2026‑27 | 2027‑28 | 2028‑29 | Total |
|---|---|---|---|---|---|
| Health | 1.6 | 0.3 | -1.2 | -3.8 | -3.1 |
| Education | 0.7 | -0.4 | -0.8 | -1.6 | -2.1 |
| Postsecondary Education | 0.8 | 0.8 | -0.7 | -1.1 | -0.3 |
| Children, Community, Social Services | 0.0 | -0.6 | -1.0 | -1.5 | -3.1 |
| Justice | 0.5 | 0.2 | 0.2 | 0.0 | 0.9 |
| Other Programs* | 0.2 | 3.0 | 4.7 | 4.9 | 12.8 |
| Interest and Other Debt Servicing Charges | 0.0 | 0.3 | 0.4 | 0.6 | 1.3 |
| Total Spending | 3.8 | 3.6 | 1.5 | -2.5 | 6.5 |
6. Infrastructure Plan
Over the comparable three-year period from 2025-26 to 2027-28, the 2026 Ontario Budget projects total infrastructure spending of $111.3 billion, an increase of $13.6 billion from projected infrastructure spending in the 2025 FES.[16]
| ($ Billions) | 2025 FES (2025‑26 to 2027‑28) |
2026 Budget (2025‑26 to 2027‑28) |
Difference |
|---|---|---|---|
| Health | 21.5 | 21.8 | 0.3 |
| Transit | 30.2 | 41.1 | 11.0 |
| Provincial Highways and Other Transportation | 12.8 | 14.3 | 1.5 |
| Education | 10.6 | 12.7 | 2.1 |
| Postsecondary Education | 2.1 | 2.7 | 0.6 |
| Justice | 2.6 | 2.4 | -0.2 |
| Social | 1.8 | 1.7 | -0.1 |
| Other | 16.1 | 14.6 | -1.4 |
| Total Infrastructure Spending | 97.7 | 111.3 | 13.6 |
By sector, three-year infrastructure spending from 2025-26 to 2027-28 in the 2026 budget compared to the 2025 FES is projected to increase the most in transit ($11.0 billion), followed by education ($2.1 billion), provincial highways and other transportation ($1.5 billion), postsecondary education ($0.6 billion) and health ($0.3 billion). Sectors with lower projected three-year infrastructure spending in the 2026 budget compared to the 2025 FES include ‘other’ (-$1.4 billion), justice (-$0.2 billion) and social (-$0.1 billion).
The FAO estimates that, of the $111.3 billion in total projected infrastructure spending from 2025-26 to 2027‑28 in the 2026 Ontario Budget, $93.9 billion (84 per cent) is for investments in capital assets and $17.4 billion (16 per cent) is for capital expenses, which are mostly for transfer payments to non-consolidated entities.
| $ Billions | Share (%) | |
|---|---|---|
| Investment in Capital Assets | 93.9 | 84 |
| Capital Expenses | 17.4 | 16 |
| Total Infrastructure Spending | 111.3 | 100 |
The estimated $93.9 billion in investments in capital assets is for constructing and rehabilitating tangible infrastructure that is owned or controlled by the Province, such as building or renovating hospitals, colleges, schools and highways.[17] These investments do not immediately impact the budget balance but are expensed (amortized) over the useful life of the asset. However, borrowing for these capital investments will immediately increase the Province’s net debt.
The estimated $17.4 billion in capital expenses is mostly for transfer payments to outside entities that are not owned or controlled by the Province, such as municipalities, long-term care homes and universities. Also included are some expenses related to the maintenance of government assets, such as for minor capital repairs. All capital expenses are immediately expensed and impact both net debt and the budget balance.
Footnotes
[1] Government motion 14, “That this House approves in general the Budgetary Policy of the Government,” was moved on March 26, 2026.
[2] See the FAO’s Economic and Budget Outlook, Winter 2026.
[3] See the FAO’s Economic and Budget Outlook, Winter 2026.
[4] 2025 Ontario Budget, Table 2.7. The 2026 Ontario Budget did not include estimates of the impact of changes in key external factors on the province’s economic growth.
[5] Fiscal Sustainability, Transparency and Accountability Act, 2019.
[6] See the FAO’s Economic and Budget Outlook, Winter 2026.
[7] Public Sector Accounting Board, Conceptual Framework for Financial Reporting in the Public Sector and Section PS 1202 Financial Statement Presentation (Conceptual Framework and Reporting Model).
[8] See Chapter 6 for more information.
[9] Bill 97, Plan to Protect Ontario (Budget Measures), 2026, would adjust the required content of the debt burden reduction strategy to include “A progress update, including metrics, respecting the debt burden reduction strategy that was included in the previous budget.”
[10] Net debt as a share of GDP is a measure of the debt burden relative to the size of the economy and provides information on a government’s ability to raise funds to manage its debt obligations.
[11] Net debt-to-revenue is a measure of the debt burden and indicates the number of years it would take to eliminate a government’s net debt if all operating revenues (total revenue less interest and investment income) were used for debt repayment. For example, a net debt-to-revenue ratio of 200 per cent means it would take two years to pay off a government’s net debt if all operating revenues were dedicated to debt repayment.
[12] The ratio of net interest-to-revenue is an indicator of budgetary flexibility – a higher ratio indicates that a government has a smaller share of operating revenue (total revenue less interest and investment income) available to spend on programs.
[13] The decline in other non-tax revenues reflects the loss of a one-time $3.4 billion revenue gain from a tobacco company settlement in 2024‑25, as well as declines in revenues from the broader public sector, recoveries of prior-year expenditures, and interest and investment income.
[14] Historically (from 2020-21 to 2024-25), personal income tax revenue grew 1.1 times faster than labour income, after adjusting for tax measures and prior year adjustments. However, over the 2024-25 to 2028-29 outlook, the 2026 budget projects PIT revenue will grow at more than twice the rate (2.2 times) of projected growth in labour income.
[15] Ontario Teachers’ Pension Plan expense is included in the education sector.
[16] For more information on the 2025 Ontario Budget infrastructure plan, see FAO, 2025 Capital Plan: Spending Plan Review.
[17] Investment in capital assets also includes ‘capitalized interest’, which refers to interest on debt spending related to any debt used to finance capital asset investments.