


Summary
- The Government of Ontario’s (the Province’s) debt is rated by four principal international credit rating agencies, based on their assessments of Ontario’s economic and financial outlook, and future risks. These credit ratings represent the credit rating agencies’ opinions on the Province’s ability to meet its debt-related financial obligations.[1]
- Ontario is rated AA by DBRS, and AA- by S&P, Moody’s and Fitch.[2] Additionally, all four credit rating agencies currently have a stable outlook for Ontario, which suggests that they do not expect to change their credit ratings in the next two years.
- Since the FAO’s last credit rating report, released in October 2024, S&P upgraded Ontario’s credit rating from A+ to AA-, while Moody’s revised Ontario’s outlook down from positive to stable.
- All credit rating agencies rate the Province as an extremely strong, investment-grade borrower. According to the credit rating agencies, the Province’s credit rating benefits from Ontario’s large and diversified economy, high liquidity, prudent debt management program, stable federal transfers and its flexibility to adjust both tax policy and program spending. Credit rating agencies also identified challenges that negatively impact Ontario’s credit rating, including weak macroeconomic conditions from ongoing trade tensions with the United States and broader global uncertainties, the Province’s elevated debt burden, and spending pressures.
- Ontario’s average credit rating was the fourth highest among the provinces, behind British Columbia, Saskatchewan and Alberta, an improvement from the fifth highest credit rating a year earlier.
- As of October 16, 2025, Ontario had the third lowest borrowing rate among the provinces, behind Alberta and Saskatchewan. In the FAO’s last credit rating report, released in October 2024, Ontario had the lowest borrowing rate among the provinces, tied with Alberta.
Introduction
The Government of Ontario’s (the Province’s) debt is rated by four principal international credit rating agencies: Fitch Ratings (Fitch), Moody’s Ratings (Moody’s), Morningstar DBRS (DBRS) and S&P Global Ratings (S&P). These agencies issue credit ratings that reflect their assessments of the Province’s ability to meet its debt-related financial obligations, Ontario’s economic and financial outlook, and future risks. In addition to credit ratings, credit rating agencies issue outlooks, which indicate the potential direction of a borrower’s credit rating within the next two years.[3] Credit rating agencies typically update their assessments each year.
Investors use credit ratings to assess risks related to the Province’s debt obligations. This risk is reflected in the interest rate paid by the Province. Generally, higher credit ratings are associated with lower borrowing costs, while lower ratings are associated with higher borrowing costs.[4]
The FAO’s credit rating report provides an overview of Ontario’s current credit rating and outlook, and summarizes common themes that the four credit rating agencies have highlighted which positively and negatively contribute to Ontario’s credit rating. The report also examines how Ontario’s credit rating and borrowing rates compare to other Canadian provinces.
Ontario’s credit rating and outlook
Ontario is rated at AA by DBRS, and AA- by S&P, Moody’s and Fitch – the third and fourth highest credit ratings, respectively.[5] These credit ratings indicate that the credit rating agencies view the Province as an extremely strong, investment-grade borrower. All credit rating agencies currently have a stable outlook for Ontario, which suggests that they do not expect to change their credit ratings in the next two years.
Figure 1 Ontario is rated as an extremely strong, investment-grade borrower
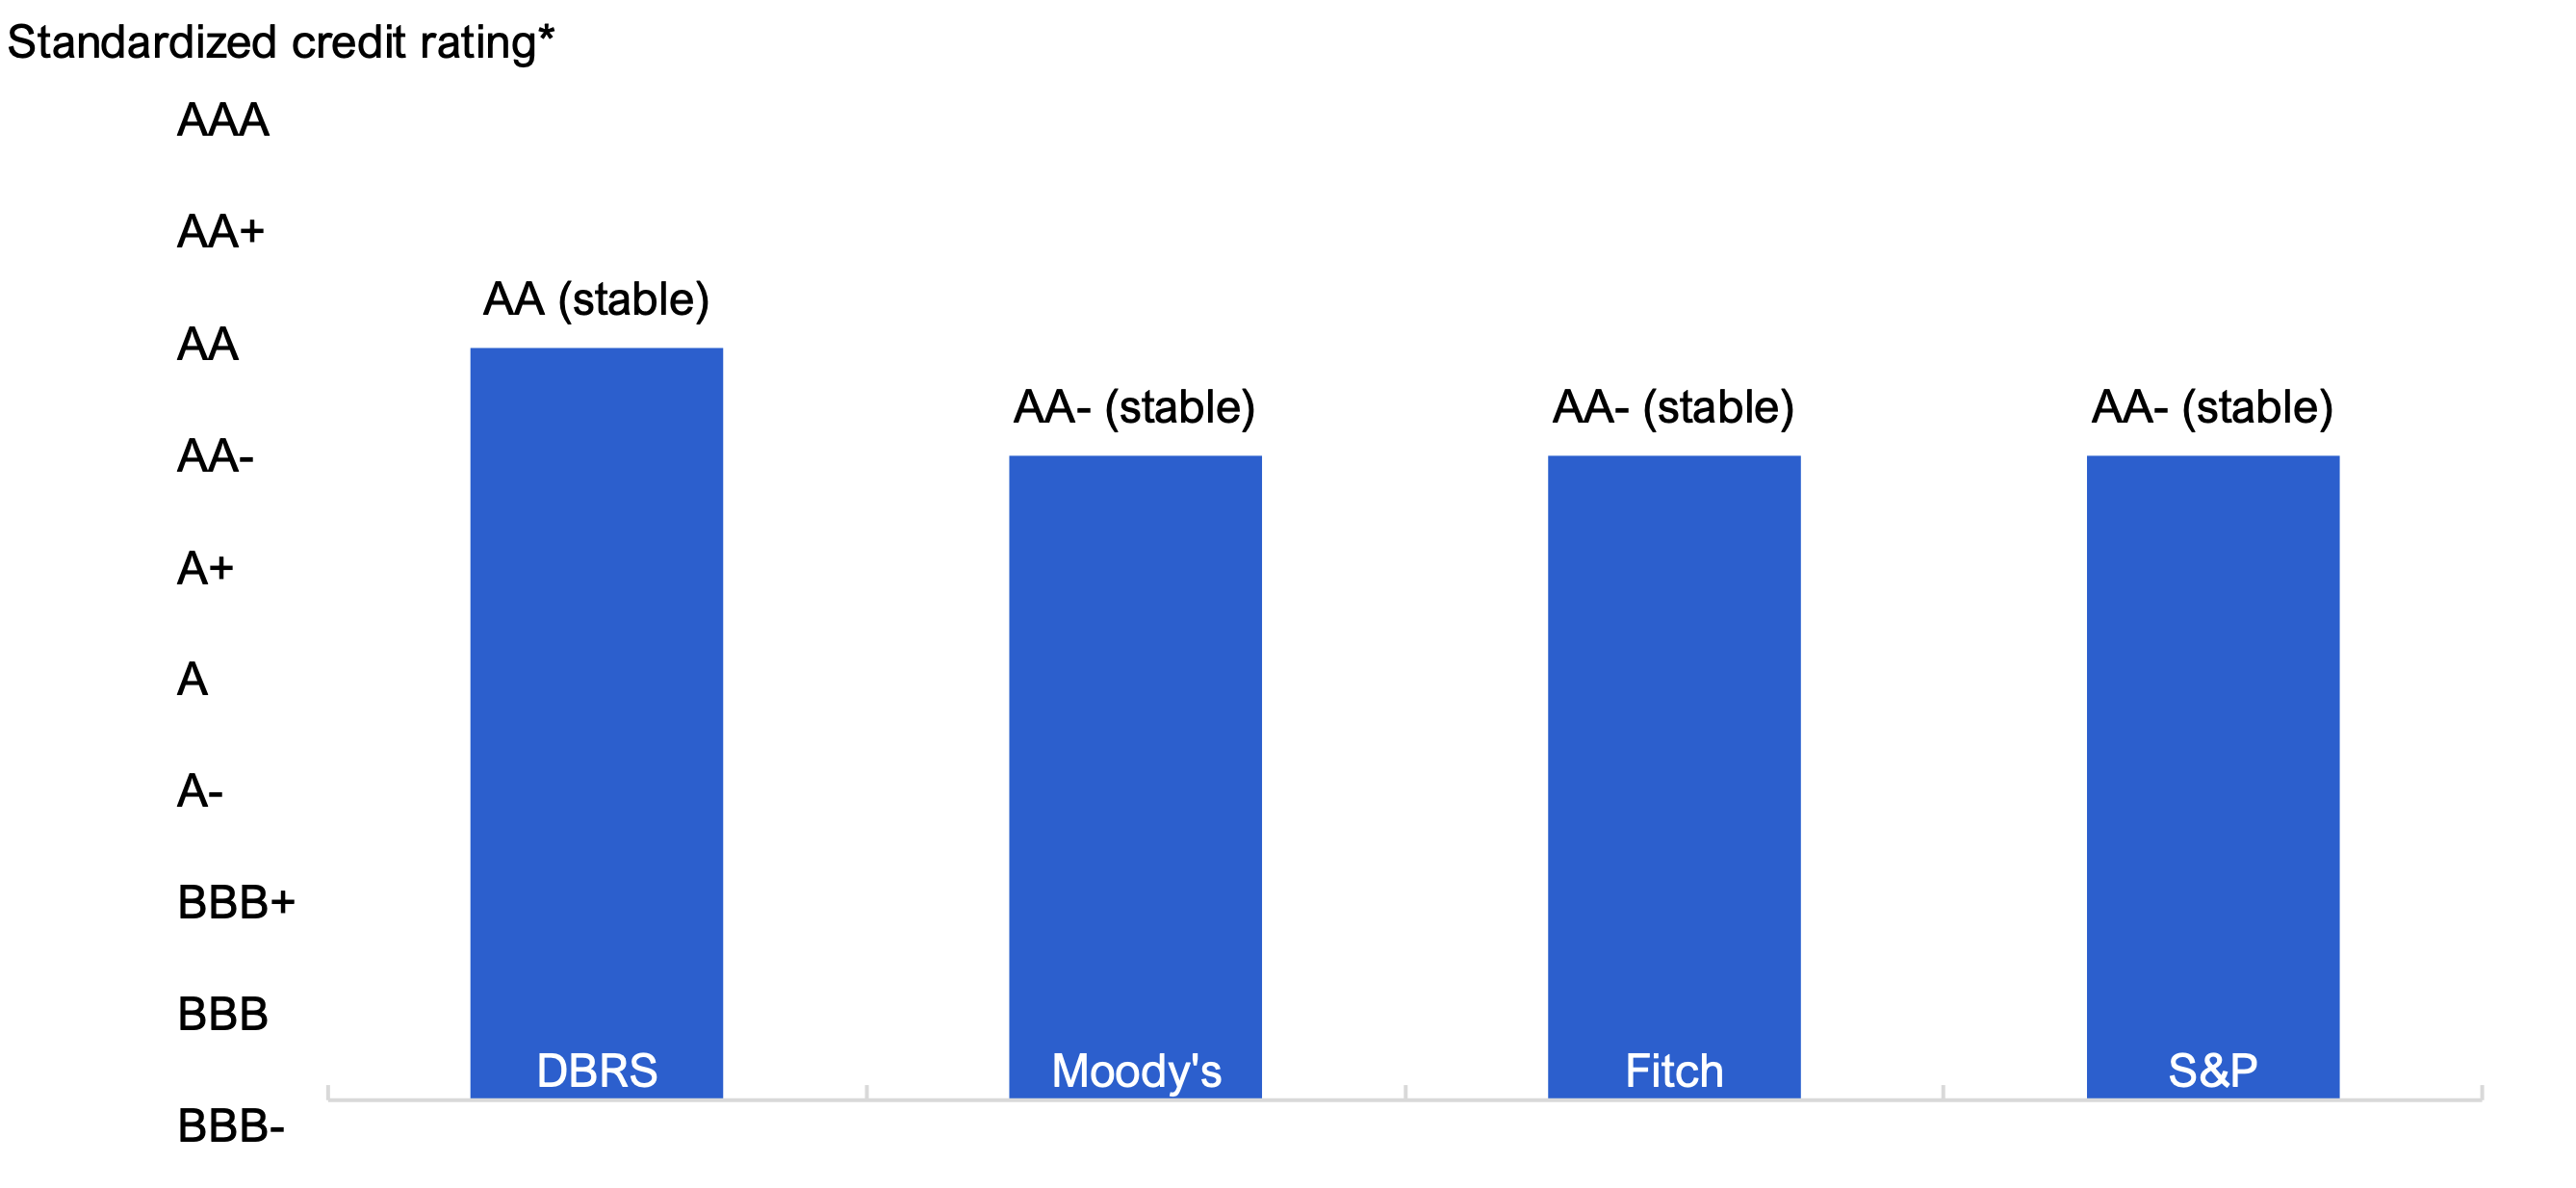
* See Table 1 for the credit ratings and Table 2 for the FAO’s credit rating conversion table. The credit rating agencies’ outlooks are shown in brackets.
Source: Fitch, Moody’s, DBRS, S&P and FAO.
Accessible version
| Credit rating agency | Standardized credit rating* |
|---|---|
| DBRS | AA (stable) |
| Moody’s | AA- (stable) |
| Fitch | AA- (stable) |
| S&P | AA- (stable) |
Recent changes to Ontario’s credit rating and outlook
In December 2024, S&P upgraded Ontario’s credit rating from A+ to AA-. S&P cited Ontario’s previous two years of strong economic performance, which boosted tax revenues and strengthened fiscal results, and achievements on fiscal targets with a commitment to debt sustainability. S&P noted that these factors have enabled Ontario to strengthen its finances in the face of growing economic uncertainty.[6]
In May 2025, Moody’s revised its outlook for Ontario down from positive to stable. The revision resulted from its expectation that Ontario’s slower economic growth due to US tariff uncertainty would lower revenue growth, which, combined with ongoing public sector spending needs, would lead to a larger deficit and a rising debt burden.[7]
Factors impacting Ontario’s credit rating
The credit rating agencies highlighted both positive and negative factors that contributed to Ontario’s credit rating.
Positive factors contributing to Ontario’s credit rating
Credit rating agencies indicated that Ontario’s strong credit rating is supported by its large and diversified economy, high liquidity and prudent debt management program. As well, Canada’s federal-provincial framework provides provinces with the flexibility to adjust both tax policy and program spending, in addition to continued and predictable revenue from federal transfers.
Large, diversified economy
Ontario’s economy continues to be a key strength due to its large size and high degree of diversification, including its well-developed services sector and substantial manufacturing sector. The Province benefits from favourable demographics and wealth factors, with ongoing population growth and high Gross Domestic Product (GDP) per capita in line with the national average. These factors contribute to reliable and robust revenue generation for the Province.
Liquidity and debt management
The Province maintains large liquidity reserves to ensure it can meet its short-term obligations in periods of financial market stress. The Province also has strong access to both domestic and international borrowing markets, and a prudent debt management program, which aims to limit the impact of risks related to refinancing, changes in interest rates and exchange rate fluctuations on its debt.[8]
Federal-provincial framework
Under Canada’s federal-provincial framework, Ontario has considerable fiscal flexibility to adjust both tax policy and program spending, giving it the ability to raise revenues or decrease spending to meet fiscal challenges. The Province also receives continued and predictable federal transfers, which supplement own-source revenues (i.e., tax revenues, net income from government business enterprises and other non-tax revenues[9]). Additionally, credit rating agencies regard the high likelihood of extraordinary support from the federal government in the event of a crisis as having a positive impact on the Province’s credit rating.
Negative factors contributing to Ontario’s credit rating
Credit rating agencies also identified challenges that negatively impact Ontario’s credit rating, including weak macroeconomic conditions, the Province’s elevated debt burden and spending pressures.
Macroeconomic conditions
The Province faces significant challenges from ongoing trade tensions with the US and broader global macroeconomic uncertainties. All credit rating agencies highlighted Ontario’s high exposure to US trade policy, with the automotive and manufacturing sectors identified as the most at risk. Additionally, slower population growth due to updated federal immigration targets for non-permanent residents is expected to further weigh on economic growth. Together, these factors present downward risks to the Province’s fiscal projections that may result in weaker revenue growth, higher spending and an increasing debt burden.
Debt burden
Ontario’s debt burden, measured by net debt as a share of GDP or operating revenues, is high relative to other regional governments of comparable credit ratings. Credit rating agencies highlighted the Province’s capital expenditure plan as a factor contributing to Ontario’s high debt burden, which is expected to remain elevated. The high debt burden means that if interest rates remain higher for longer than expected, the Province may face greater budgetary pressure from increased interest on debt expense.
Spending pressures
The government faces spending pressures from affordability challenges, demands for public services and support for businesses affected by US tariffs. Affordability concerns, particularly housing affordability, remain key social risks that increase demand for social support programs and place pressure on government policy options, including the ability to raise taxes or adjust program spending. Measures introduced over time to address affordability concerns, including electricity subsidies, the removal of tolls on provincially owned highways, and making the gas tax cut permanent, have added pressure to public finances.
Ontario’s credit rating relative to other provinces
Ontario’s average credit rating was the fourth highest among the provinces, behind those of British Columbia, Saskatchewan and Alberta. As a result of S&P’s upgrade of Ontario’s credit rating, the Province’s relative ranking improved from the fifth highest in the FAO’s previous credit rating report released in October 2024.
Figure 2 Ontario has the fourth highest average credit rating
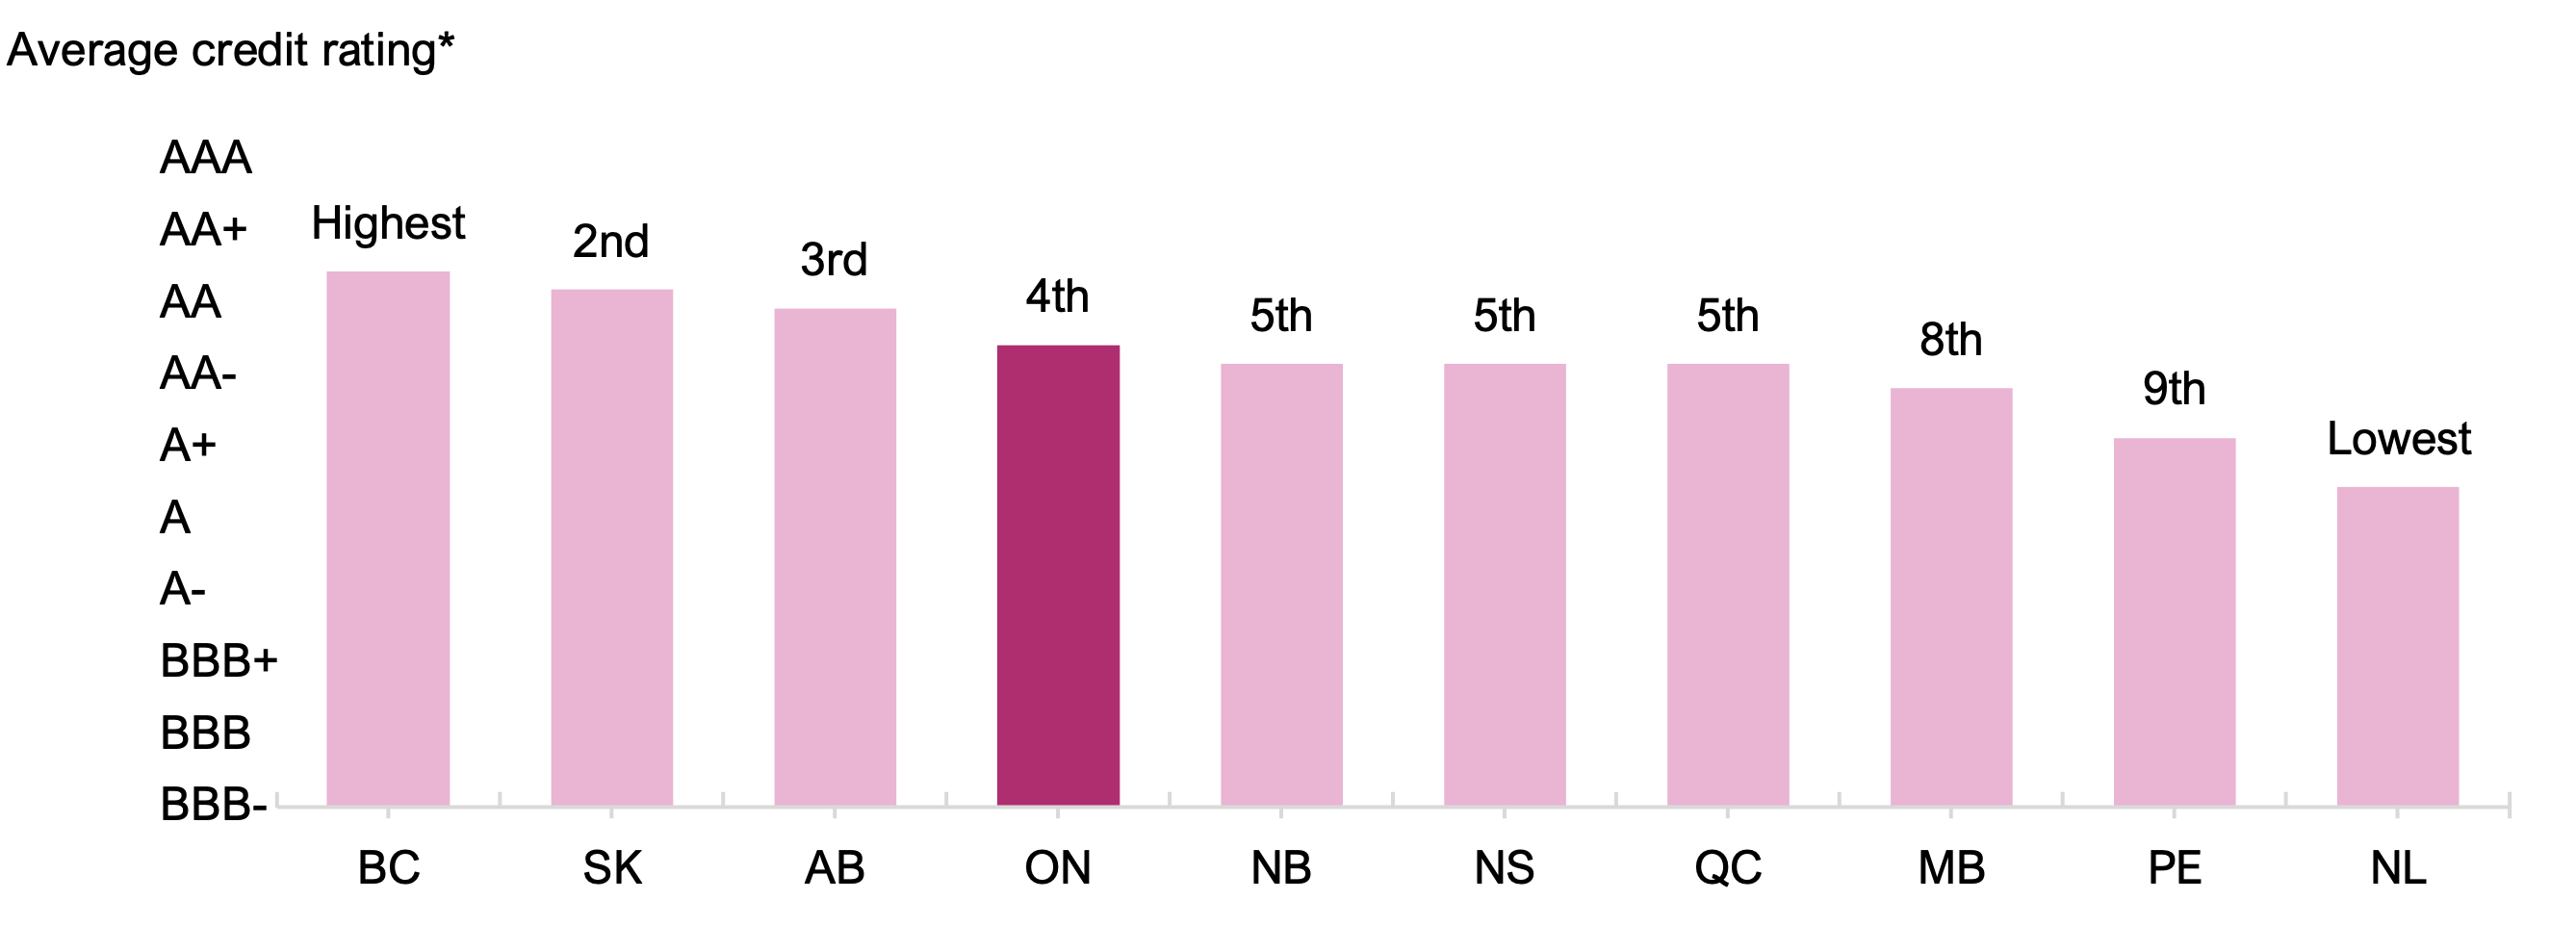
* See Table 1 for the credit ratings and Table 2 for the FAO’s credit rating conversion.
Source: Fitch, Moody’s, DBRS, S&P and FAO.
Accessible version
| Province | Average credit rating* |
|---|---|
| BC | 2.75 |
| SK | 3.00 |
| AB | 3.25 |
| ON | 3.75 |
| NB | 4.00 |
| NS | 4.00 |
| QC | 4.00 |
| MB | 4.33 |
| PE | 5.00 |
| NL | 5.67 |
In addition to Ontario, several other provinces received credit rating or outlook changes since the FAO’s October 2024 report.
Provinces with credit rating changes
- British Columbia was downgraded by S&P[10] and Moody’s.[11] S&P’s downgrade reflected expectations of a worsening fiscal position due to the economic impacts of federal immigration policy changes and trade uncertainty, alongside large and persistent budget deficits. Moody’s cited larger deficits and higher debt driven by substantial increases in both operating and capital spending, indicating weakened fiscal governance and debt management. Despite these credit rating downgrades, British Columbia maintained the highest average credit rating among the provinces.
- Quebec was downgraded by S&P,[12] reflecting the expectation that slower economic growth due to federal immigration policy changes and trade uncertainty, combined with higher operating costs from collective bargaining negotiations, will prolong deficits and lead to a rising debt burden.
Provinces with outlook changes
- Alberta’s outlook was revised down from positive to stable by Moody’s,[13] reflecting weaker oil price expectations and a downward revision of Moody’s fiscal forecast for Alberta.
- British Columbia’s outlook was revised down from stable to negative by DBRS[14] and Fitch,[15] reflecting spending demands, ongoing deficits and rising debt. All four credit rating agencies have a negative outlook for British Columbia.
- New Brunswick’s outlook was revised down from positive to stable by S&P,[16] on the expectation of weaker budgetary performance and higher borrowing needs due to increased spending on core services and capital investment amidst federal immigration policy changes and trade uncertainty.
- Nova Scotia’s outlook was revised down from stable to negative by S&P[17] based on higher projected deficits due to policy decisions to increase spending during a period of slower population growth and heightened economic uncertainties.
- Prince Edward Island’s outlook was revised down from positive to stable by S&P,[18] reflecting the expectation of weaker economic and revenue growth due to federal immigration policy changes and trade uncertainty, alongside elevated program spending and capital investment.
Credit ratings and provincial borrowing costs
Investors use credit ratings to assess the creditworthiness of a borrower, with higher credit ratings typically reflected in lower borrowing costs.[19] As of October 16, 2025, Ontario had the third lowest borrowing rate[20] among the provinces, while having the fourth highest average credit rating. In the FAO’s previous credit rating report, released in October 2024, Ontario had the lowest borrowing rate among the provinces, tied with Alberta.[21]
Figure 3 Ontario’s borrowing rate third lowest behind Alberta and Saskatchewan
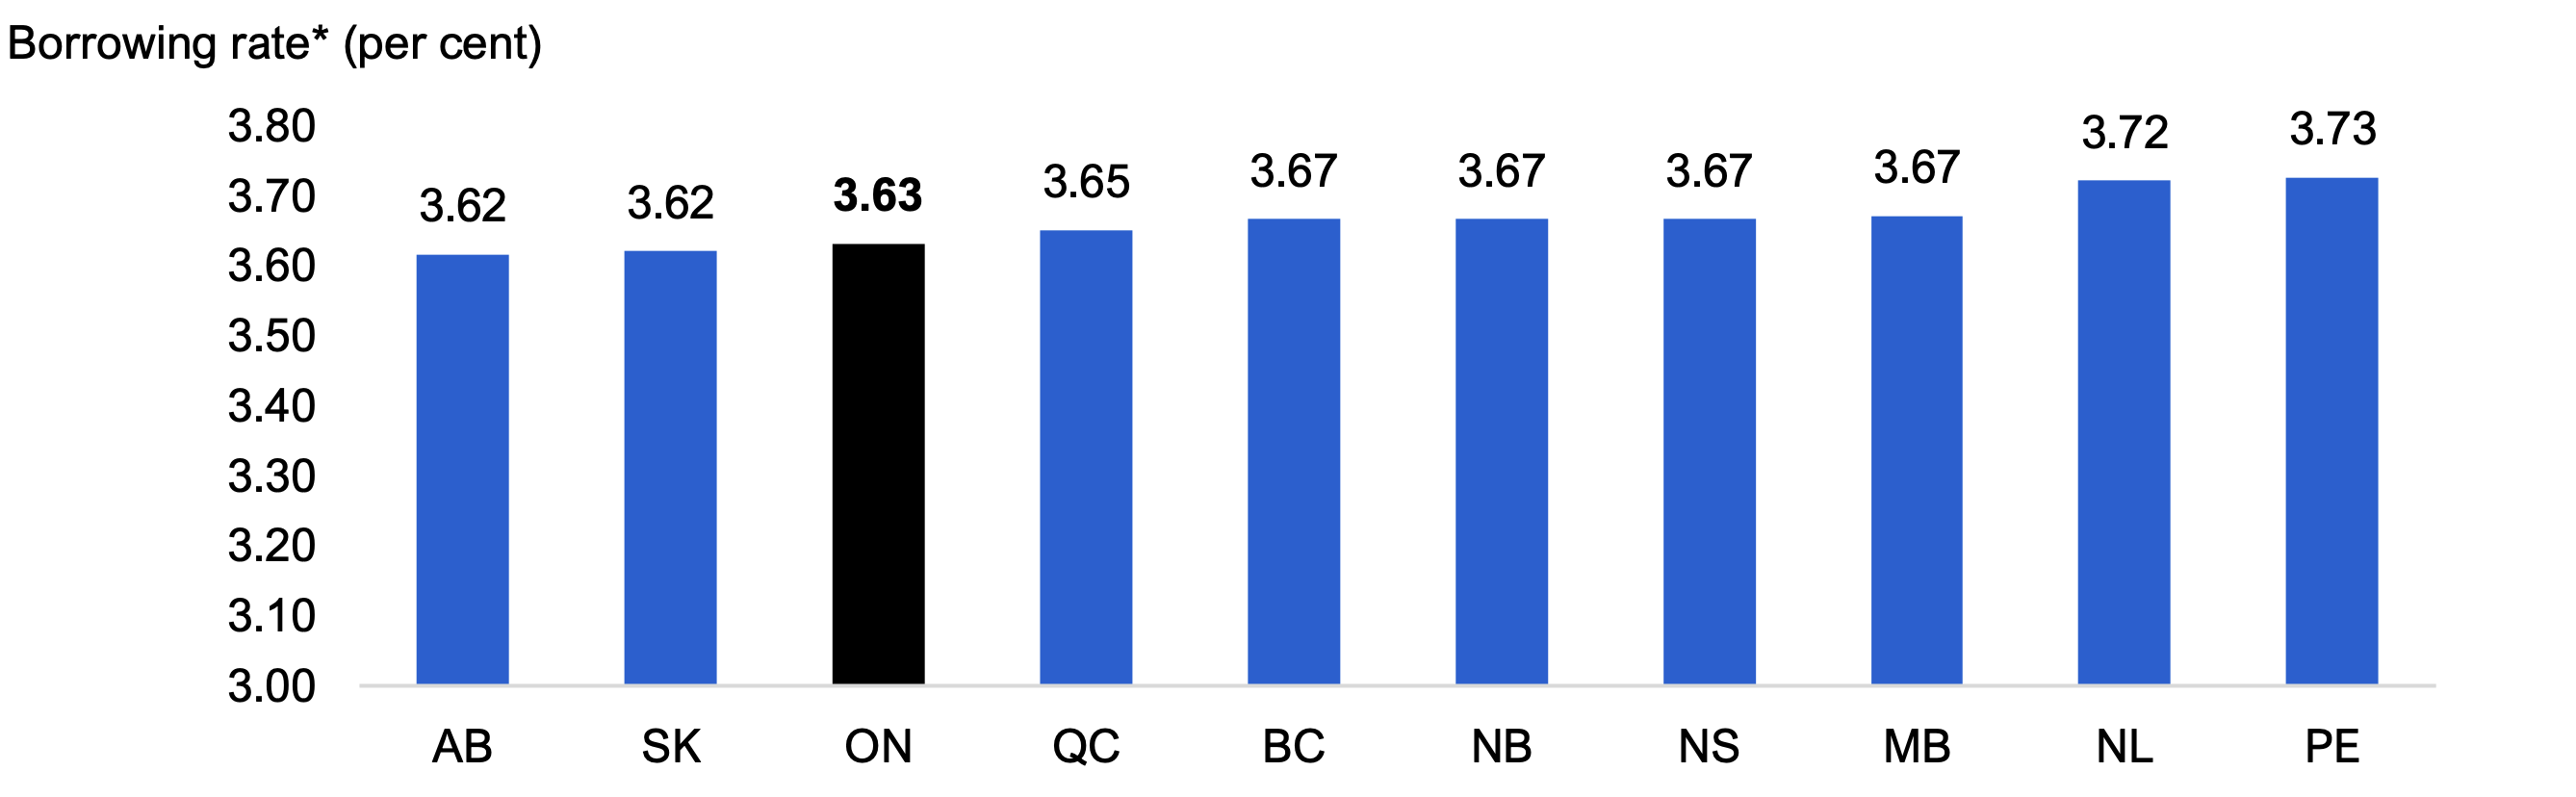
* Borrowing rates are shown as the yields on 10-year bonds, as of October 16, 2025.
Source: Information provided by the Province and FAO.
Accessible version
| Province | Borrowing rate* (per cent) |
|---|---|
| AB | 3.62 |
| SK | 3.62 |
| ON | 3.63 |
| QC | 3.65 |
| BC | 3.67 |
| NB | 3.67 |
| NS | 3.67 |
| MB | 3.67 |
| NL | 3.72 |
| PE | 3.73 |
Appendix
| Province | S&P | DBRS | Moody’s | Fitch | Average Rating* (1 = highest rating) |
|---|---|---|---|---|---|
| British Columbia | A+ (negative) | AA high (negative) | Aa1 (negative) | AA+ (negative) | 2.75 |
| Alberta | AA- (stable) | AA (stable) | Aa2 (stable) | AA (stable) | 3.25 |
| Saskatchewan | AA (stable) | AA low (stable) | Aa1 (stable) | AA (stable) | 3.00 |
| Manitoba | A+ (stable) | A high (stable) | Aa2 (stable) | 4.33 | |
| Ontario | AA- (stable) | AA (stable) | Aa3 (stable) | AA- (stable) | 3.75 |
| Quebec | A+ (stable) | AA low (stable) | Aa2 (stable) | AA- (stable) | 4.00 |
| New Brunswick | A+ (stable) | A high (stable) | Aa1 (stable) | 4.00 | |
| Nova Scotia | AA- (negative) | A high (stable) | Aa2 (stable) | 4.00 | |
| Newfoundland & Labrador | A (stable) | A (stable) | A1 (stable) | 5.67 | |
| Prince Edward Island | A (stable) | A (stable) | Aa2 (stable) | 5.00 |
| Rating Description | Credit Quality | S&P | DBRS | Moody’s | Fitch | FAO | |
|---|---|---|---|---|---|---|---|
| Long Term | Long Term | Long Term | Long Term | Standardized Rating scale* | Ranking | ||
| Investment-grade | Extremely Strong | AAA | AAA | Aaa | AAA | AAA | 1 |
| AA+ | AA high | Aa1 | AA+ | AA+ | 2 | ||
| AA | AA | Aa2 | AA | AA | 3 | ||
| AA- | AA low | Aa3 | AA- | AA- | 4 | ||
| Very Strong | A+ | A high | A1 | A+ | A+ | 5 | |
| A | A | A2 | A | A | 6 | ||
| A- | A low | A3 | A- | A- | 7 | ||
| Strong | BBB+ | BBB high | Baa1 | BBB+ | BBB+ | 8 | |
| BBB | BBB | Baa2 | BBB | BBB | 9 | ||
| BBB- | BBB low | Baa3 | BBB- | BBB- | 10 | ||
| Non-investment-grade | Speculative | BB+ | BB high | Ba1 | BB+ | BB+ | 11 |
| BB | BB | Ba2 | BB | BB | 12 | ||
| BB- | BB low | Ba3 | BB- | BB- | 13 | ||
| B+ | B high | B1 | B+ | B+ | 14 | ||
| B | B | B2 | B | B | 15 | ||
| B- | B low | B3 | B- | B- | 16 | ||
| CCC | CCC | Caa | CCC | CCC | 17 |
Figure 4 Ontario’s average credit rating and 10-year borrowing rate since 2016
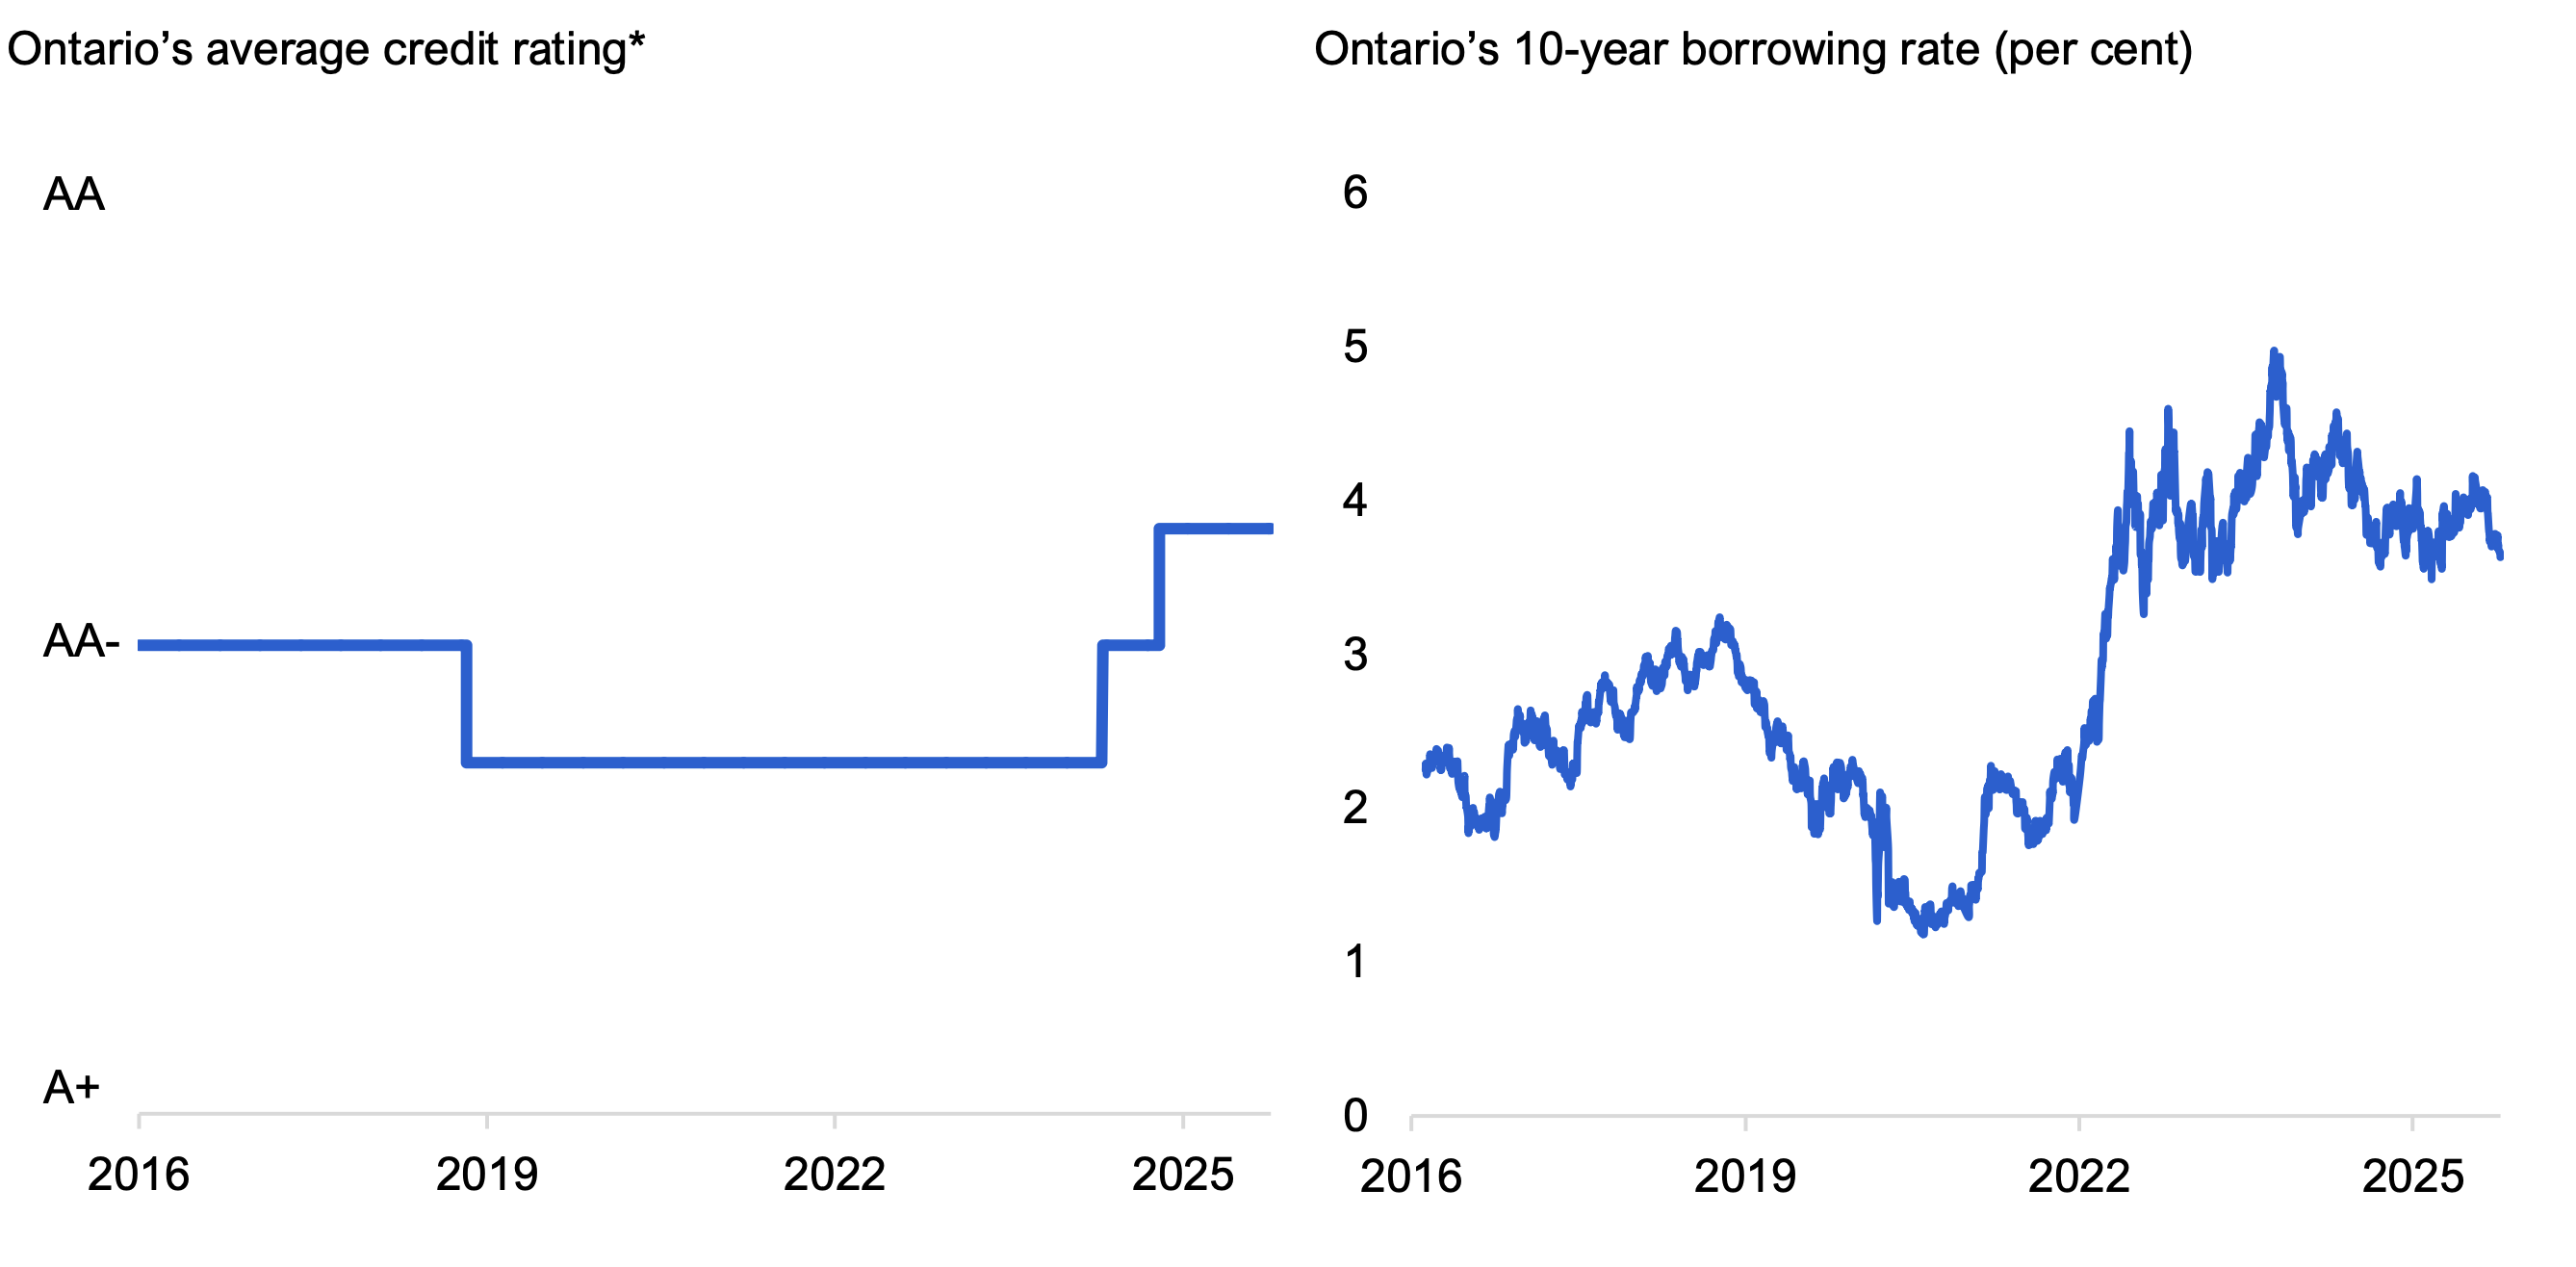
* See Table 2 for the FAO’s credit rating conversion.
Note: Ontario’s average credit rating from February 16, 2016 to November 18, 2025; Ontario’s 10-year borrowing rate from February 16, 2016 to October 16, 2025.
Source: Fitch, Moody’s, DBRS, S&P, information provided by the Province and FAO.
Accessible version
| From | To | Ontario’s average credit rating* |
|---|---|---|
| 2016-02-16 | 2018-12-12 | 4.00 |
| 2018-12-13 | 2024-06-05 | 4.25 |
| 2024-06-06 | 2024-12-02 | 4.00 |
| 2024-12-03 | 2025-11-18 | 3.75 |
Ontario’s 10-year borrowing rate (per cent)
This chart shows Ontario’s 10-year borrowing rate (in per cent) from February 16, 2016 to October 16, 2025. The bond rate increased from 2.25% in February 2016 to 3.24% in October 2018, before declining to 1.18% in August 2020. It then rose to 3.94% in May 2022, and has fluctuated between 3.26% and 4.97% from May 2022 to October 2025.
Figure 5 Provinces with higher credit ratings tend to have lower borrowing rates
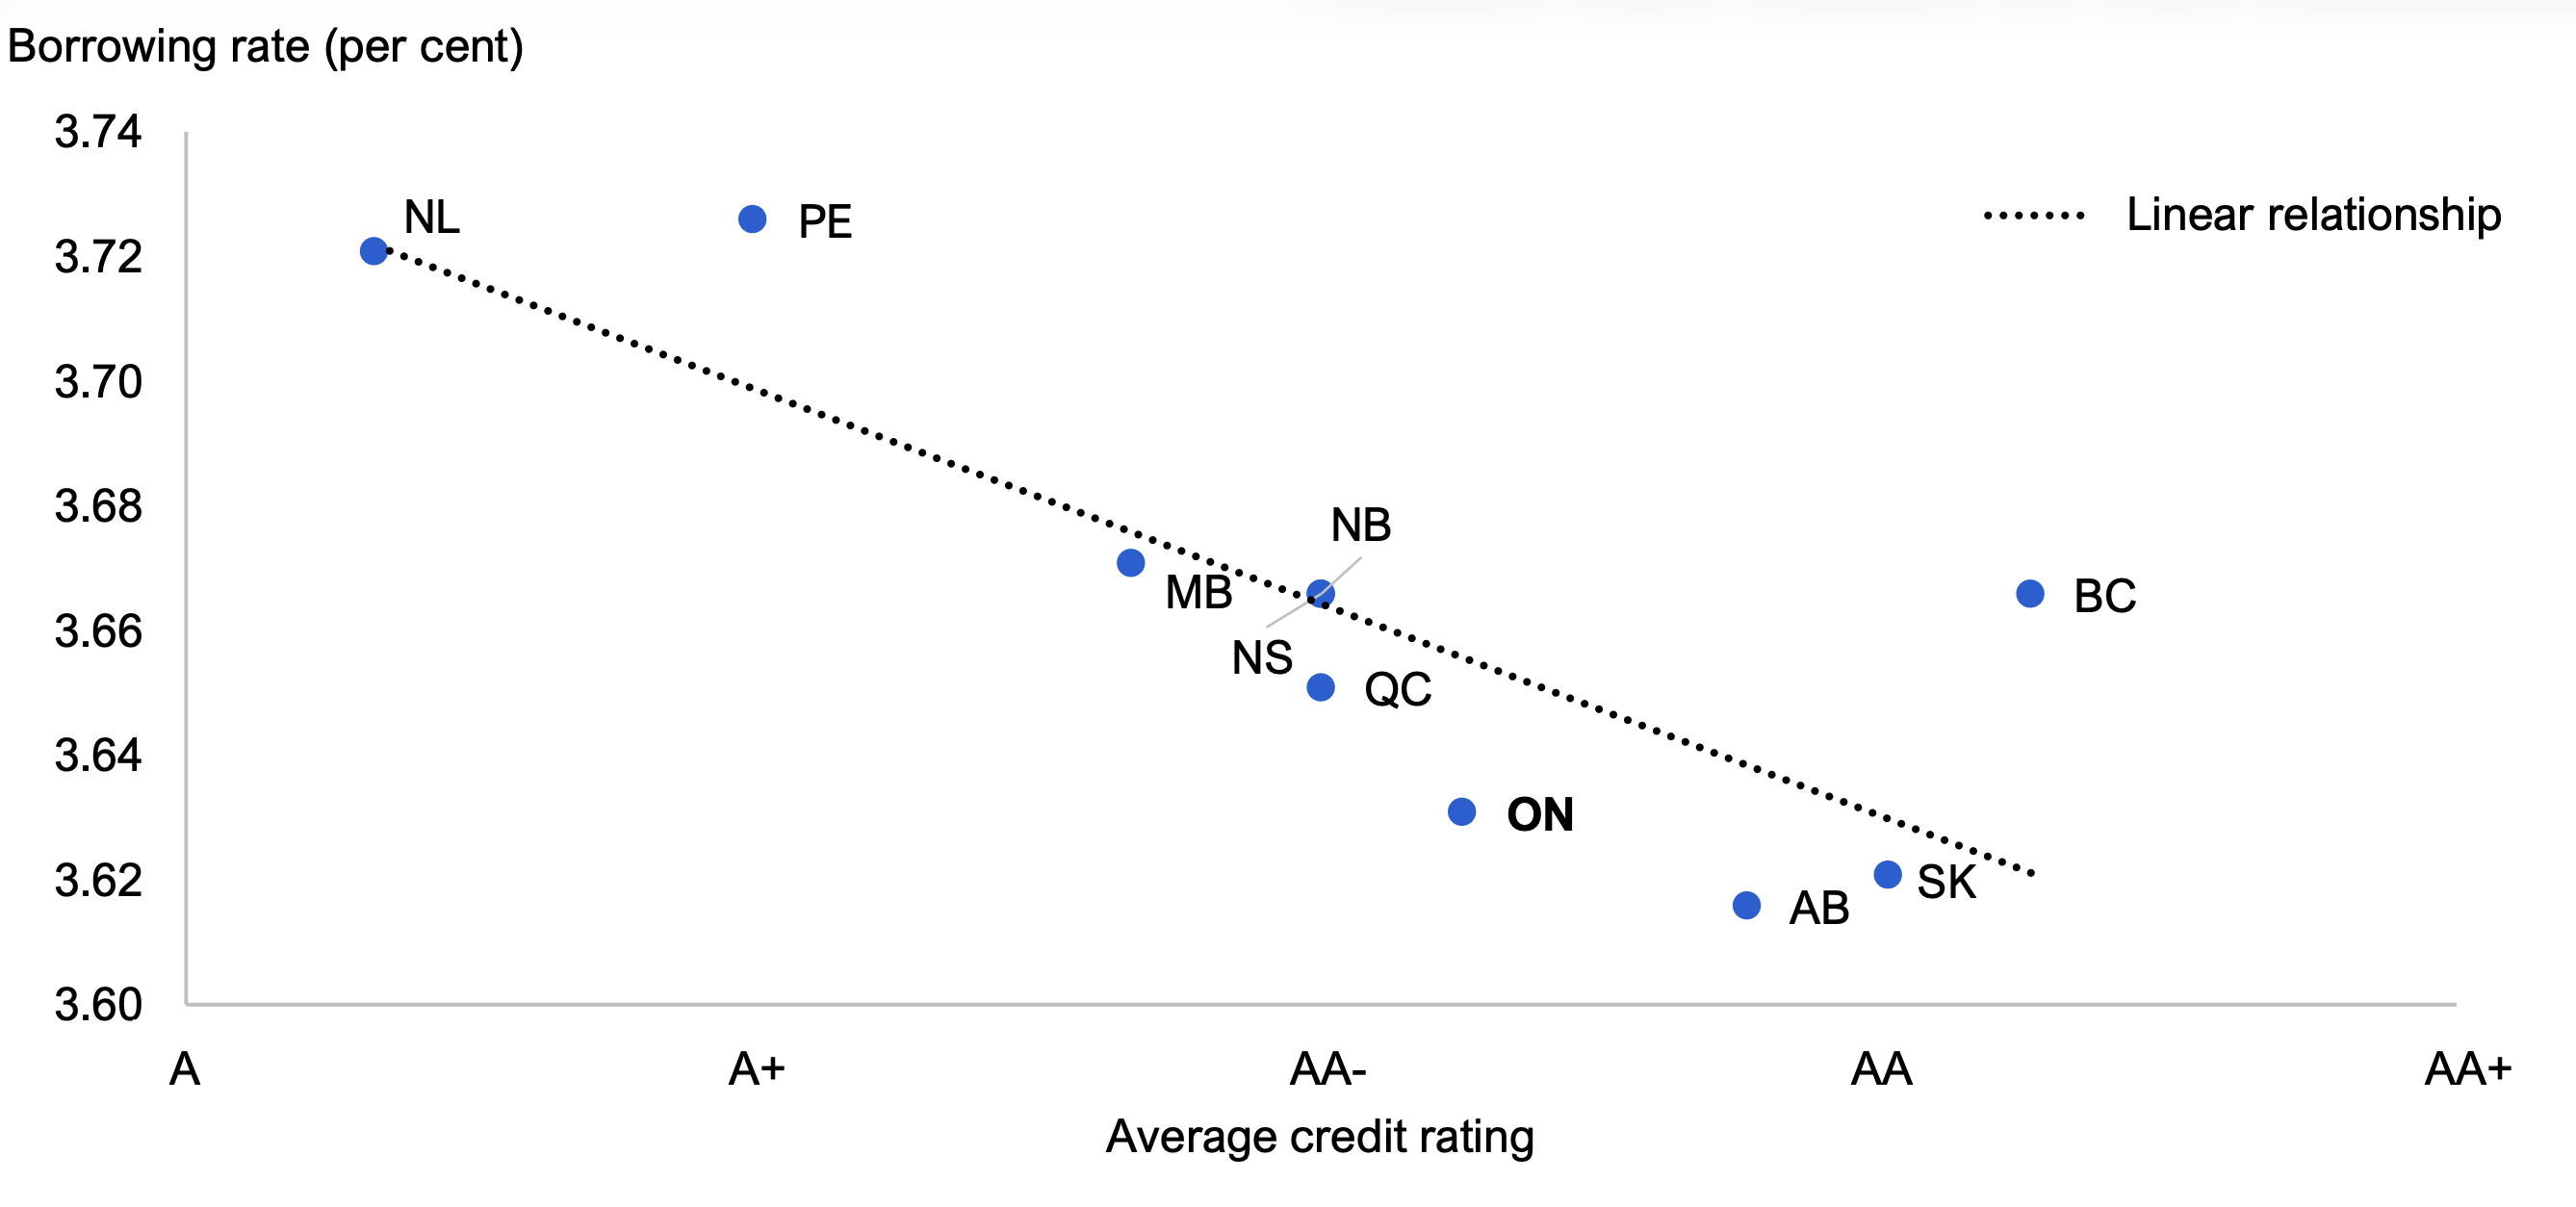
* See Table 1 for the credit ratings and Table 2 for the FAO’s credit rating conversion.
Note: Borrowing rates are for 10-year bonds as of October 16, 2025.
Source: Information provided by the Province, Fitch, Moody’s, DBRS, S&P and FAO.
Accessible version
| Province | Average credit rating* | Borrowing rate (per cent) | Linear relationship |
|---|---|---|---|
| BC | 2.75 | 3.67 | |
| SK | 3.00 | 3.62 | |
| AB | 3.25 | 3.62 | |
| ON | 3.75 | 3.63 | |
| NB | 4.00 | 3.67 | |
| NS | 4.00 | 3.67 | |
| QC | 4.00 | 3.65 | |
| MB | 4.33 | 3.67 | |
| PE | 5.00 | 3.73 | |
| NL | 5.67 | 3.72 |
Footnotes
[1] This report reflects available information as of November 18, 2025 unless otherwise noted.
[2] Based on a standardized scale. See Table 2 for the FAO’s credit rating conversion.
[3] An outlook can be stable, negative or positive. A stable outlook indicates a low likelihood of a credit rating change, a negative outlook indicates that the credit rating is likely to be lowered, and a positive outlook indicates that the credit rating is likely to be raised. While a positive or negative outlook indicates the direction of a potential credit rating change, it does not guarantee a change.
[5] Based on a standardized scale. See Table 2 for the FAO’s credit rating conversion. See Figure 4 for Ontario’s average credit rating history.
[6] See S&P’s Province of Ontario Upgraded To ‘AA-‘ From ‘A+’ On Solid Foundation; Outlook Stable for more details.
[7] See Moody’s Ratings affirms Ontario’s ratings, changes outlook to stable from positive for more details.
[8] Refinancing risk is the risk that a borrower will not be able to borrow to repay existing debt. Interest rate risk is the risk that movements in interest rates will increase debt servicing costs. Exchange rate risk is the risk that movements in exchange rates of foreign-denominated debt will increase debt servicing costs. For details on how Ontario manages these risks, see Ontario Financing Authority’s Risk Management.
[9] Examples of other non-tax revenues include own-source revenues raised by hospitals, colleges and school boards; fees and licences; and interest and investment income.
[10] See S&P’s Province of British Columbia Downgraded To ‘A+’ From ‘AA-‘ On Continued Record Deficits; Outlook Negative for more details.
[11] See Moody’s British Columbia Rating Action for more details.
[12] See S&P’s Province of Quebec Downgraded To ‘A+’ From ‘AA-‘ On Persistent Operating Deficits for more details.
[13] See Moody’s Alberta Rating Action for more details.
[14] See DBRS’ British Columbia Rating Action Press Release for more details.
[15] See Fitch’s British Columbia Rating Action Commentary for more details.
[16] See S&P’s Province of New Brunswick Outlook Revised To Stable From Positive On Weaker Fiscal Trajectory for more details.
[17] See S&P’s Province of Nova Scotia Outlook Revised To Negative From Stable On Higher Projected Deficits for more details.
[18] See S&P’s Province of Prince Edward Island Outlook Revised To Stable From Positive On Forecast Operating Deficits for more details.
[19] See Figure 5. Investors also consider other factors, including the liquidity of a province’s debt. For further information, see Cantor and Packer (1996), Determinants and Impacts of Sovereign Credit Ratings, Federal Reserve Bank of New York Economic Policy Review, 37-54, and Cantor, Packer and Cole (1997), Split Ratings and the Pricing of Credit Risk, Federal Reserve Bank of New York, Research Paper No. 9711.
[20] Borrowing rate is represented by the yield on a 10-year bond.
[21] See Figure 4 right chart for Ontario’s 10-year borrowing rate since 2016.