


1. Summary
This Economic and Budget Outlook (EBO) report provides the FAO’s projection for Ontario’s economy and the Government of Ontario’s (the Province’s) finances over the 2024-25 to 2029-30 period. The report also compares the FAO’s budget outlook to the Province’s plan presented in the 2025 Ontario Budget.
US tariffs projected to lower Ontario’s economic growth
Based on trade policies as of August 5, 2025, Ontario real GDP growth, the broadest measure of economic activity, is projected to slow to 0.9 per cent in 2025 and 1.0 per cent in 2026 as US tariffs reduce demand for Ontario’s exports, and businesses cut back on investment and hiring. Over the 2027 to 2029 period, real GDP growth is projected to return to its long-term average trend of 1.9 per cent, as Ontario’s economy adjusts to the impact of US tariffs. However, this implies that the level of Ontario’s real GDP would be 1.7 per cent lower than in a no tariff scenario in 2029.
Canada’s real GDP growth is projected to slow to 1.4 per cent in both 2025 and 2026 as US tariffs reduce trade activity between the two countries. Uncertainty in trade relations is expected to disproportionately impact Ontario, where sectors subject to US tariffs make up a larger share of the economy than in most other provinces. Ontario’s housing market also continues to face significant challenges in new home construction and affordability.
The FAO projects budget deficits over the outlook
Based on the FAO’s outlook for the Ontario economy, and current government policies and announced commitments, the FAO projects that the budget balance will deteriorate from a deficit of $1.3 billion in 2024-25 to a deficit of $12.0 billion in 2025-26. The significant increase in the budget deficit results from a projected 1.7 per cent decline in revenue, due to a loss of one-time revenue and a slowing economic outlook, combined with a 3.1 per cent increase in spending.
The budget balance is projected to improve gradually over the following three years to a deficit of $7.9 billion in 2028-29. However, the FAO projects that the budget will not balance over the outlook, deteriorating to a deficit of $9.0 billion in 2029-30, as spending growth, led by the health sector and interest on debt, is expected to exceed revenue growth.
Compared to the Province’s outlook in the 2025 Ontario Budget, the FAO projects smaller budget deficits in 2024-25 and 2025-26 and larger deficits in 2026-27 and 2027-28 (the last year of the Province’s outlook). In contrast to the FAO’s outlook, the Province projects a balanced budget in 2027-28. In order to achieve a balanced budget in 2027-28, the Province expects stronger taxation revenue gains and significantly lower program spending growth in both 2026-27 and 2027-28 than projected by the FAO.
Ontario’s net debt and fiscal sustainability indicators
The FAO projects that the Province’s net debt will rise from $408.0 billion in 2023-24 to $549.3 billion in 2029-30, an increase of $141.4 billion (34.7 per cent). This increase is due to $52.2 billion in accumulated budget deficits over the period and an $89.2 billion increase in non-financial assets, largely infrastructure assets owned by the Province and the broader public sector.
In the 2025 Ontario Budget, the government identified targets for three fiscal sustainability indicators, two related to the debt burden (a net debt-to-GDP ratio below 40.0 per cent and a net debt-to-operating revenue ratio below 200 per cent) and one related to budgetary flexibility (the share of revenue dedicated to debt interest payments below 7.5 per cent). Looking forward, the FAO expects that all three fiscal sustainability indicators will deteriorate over the outlook. However, the net debt-to-GDP and the net interest-to-operating revenue ratios are projected to remain below the government’s targets, while the net debt-to-operating revenue ratio is expected to exceed the government’s target.
Revenue growth expected to moderate
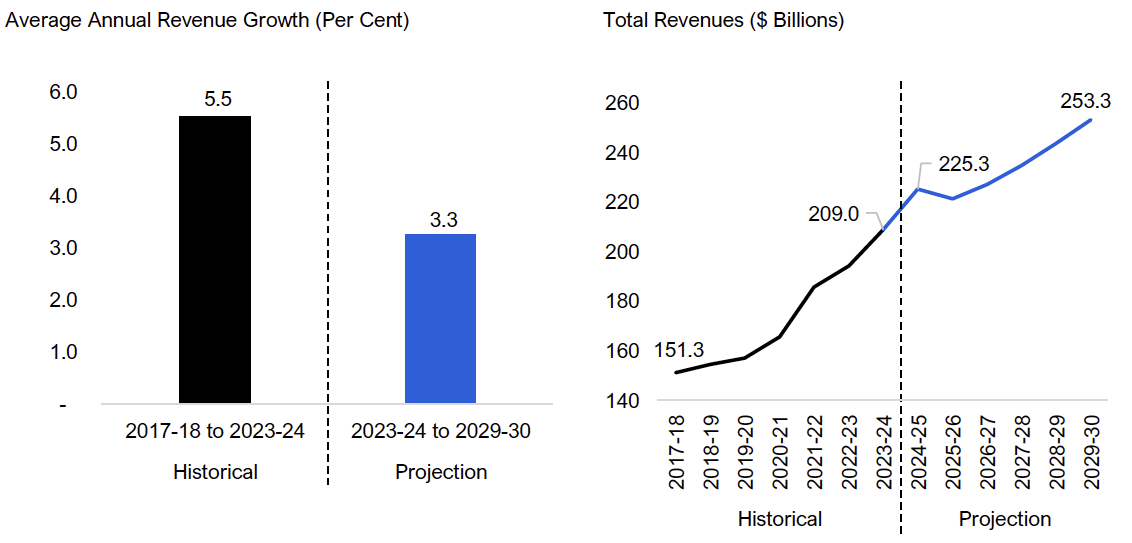
Over the 2024-25 to 2029-30 projection, revenue growth is expected to average 3.3 per cent per year, slower than the 5.5 per cent average annual increase recorded during the 2017-18 to 2023-24 period. The moderation in revenue growth reflects the FAO’s expectation that nominal GDP growth will slow compared to the previous six years, in part due to the impact of US tariffs on Ontario’s economy.
Compared to the 2025 budget, the FAO’s revenue projection is $3.7 billion above the Province’s outlook in 2024-25 and $1.6 billion above in 2025-26, mainly due to higher expected personal income tax and corporations tax revenue based on tax assessment information not available at the time of the 2025 budget. The FAO expects $0.8 billion lower revenues in 2026-27 and $3.1 billion lower in 2027-28 due to slower projected growth in taxation revenue.
Spending growth expected to moderate
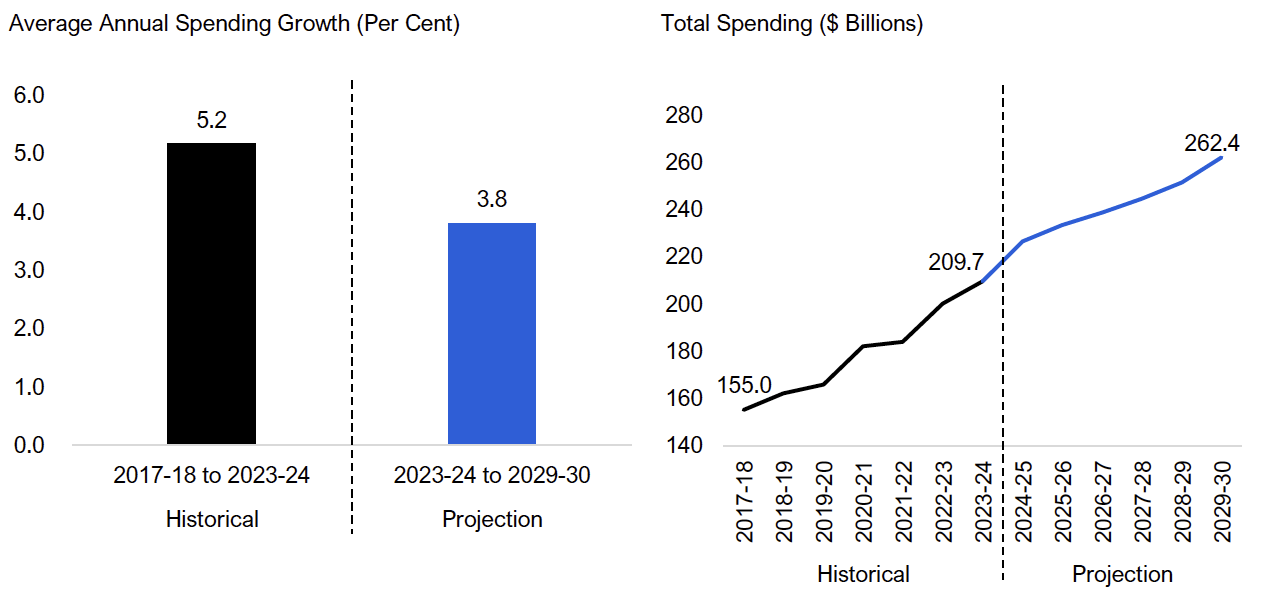
Over the 2024-25 to 2029-30 projection, spending growth is expected to average 3.8 per cent per year, slower than the 5.2 per cent average annual increase recorded during the 2017-18 to 2023-24 period. Spending growth is expected to moderate due to slower projected inflation, slower wage and population growth, and the FAO’s analysis of current government policies and announced commitments.
Starting in 2025-26, the FAO’s spending projection exceeds the Province’s forecast, with the spending gap increasing from $1.0 billion in 2025-26 to $9.2 billion in 2027-28. The gap between the spending forecasts is largely driven by the FAO’s higher health sector spending forecast. The FAO projects health sector spending will grow at an average of 4.9 per cent annually over the outlook, consistent with the estimated 4.7 per cent combined growth of the health sector’s key cost drivers: population growth, population aging and health sector inflation. By comparison, the 2025 budget forecasts a 2.4 per cent average annual spending increase in the health sector, over the same period, significantly below the health sector cost drivers. Across all other sectors combined, the FAO’s spending forecast is consistent with both the Province’s forecast and estimated cost drivers.
US trade policy remains the most significant risk
The FAO’s economic and budget outlook was finalized based on existing trade policies as of August 5, 2025. As US trade policy continues to shift, the actual impact of tariffs on Ontario’s economy is highly uncertain and will depend on the magnitude, breadth and duration of tariff coverage, as well as how businesses, households and economies respond.
Given this uncertainty, the FAO has developed two additional scenarios, based on potential changes in US and Canadian tariff policies, to estimate a range of potential economic and budget impacts to Ontario. In the FAO’s “low impact” scenario, US tariff policies are assumed to be more favourable compared to the tariff policies as of August 5, and Ontario’s budget deficit improves to $3.9 billion in 2029-30. In contrast, the FAO’s “high impact” scenario assumes US tariffs are more severe, and Ontario’s budget deficit reaches $13.4 billion by 2029-30.
2. Economic Outlook
Ontario’s economic growth slowed modestly in 2024
Ontario’s economic growth slowed modestly in 2024, with real GDP, the broadest measure of economic activity, expanding by 1.4 per cent, down from 1.7 per cent in 2023. Elevated interest rates weighed on the province’s highly indebted households, prompting spending restraint, while business activity remained subdued. Residential investment declined for the third consecutive year as high borrowing costs discouraged new home construction and housing sales activity. Temporary auto plant shutdowns for retooling and soft demand for motor vehicles in the United States weakened Ontario’s exports in 2024.
Ontario’s nominal GDP, which provides a broad measure of the tax base, expanded by 5.3 per cent in 2024, similar to the pace in 2023 and moderating from exceptionally strong increases in 2021 and 2022.[1] Labour income growth was resilient in 2024, reflecting solid gains in employment and strong growth in hourly wages. Corporate profits declined for the third consecutive year in 2024.
US tariffs projected to lower Ontario’s real GDP over the outlook
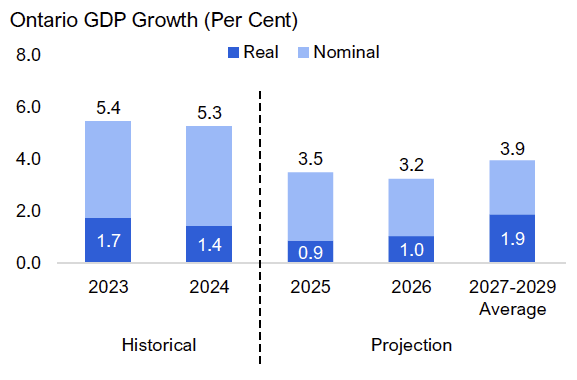
Figure 2.1 Ontario’s economic growth projected to slow in 2025 and 2026
Source: Ontario Economic Accounts and FAO.
Accessible version
| Historical | Projection | ||||
|---|---|---|---|---|---|
| Ontario GDP Growth (Per Cent) |
2023 | 2024 | 2025 | 2026 | 2027-2029 Average |
| Real | 1.7 | 1.4 | 0.9 | 1.0 | 1.9 |
| Nominal | 5.4 | 5.3 | 3.5 | 3.2 | 3.9 |
Real GDP growth is projected to slow to 0.9 per cent in 2025 and 1.0 per cent in 2026 as US tariffs reduce demand for Ontario’s exports and businesses cut back on investment and hiring. Lower interest rates are assumed to provide some relief to households and residential investment.
Nominal GDP growth is projected to moderate to 3.5 per cent in 2025 and 3.2 per cent in 2026 as the impact of US tariffs on the labour market and businesses lead to slower labour income growth and weak corporate profits.
Over the 2027 to 2029 period, real and nominal GDP growth are projected to average 1.9 per cent and 3.9 per cent, respectively, close to their long-term growth trends.
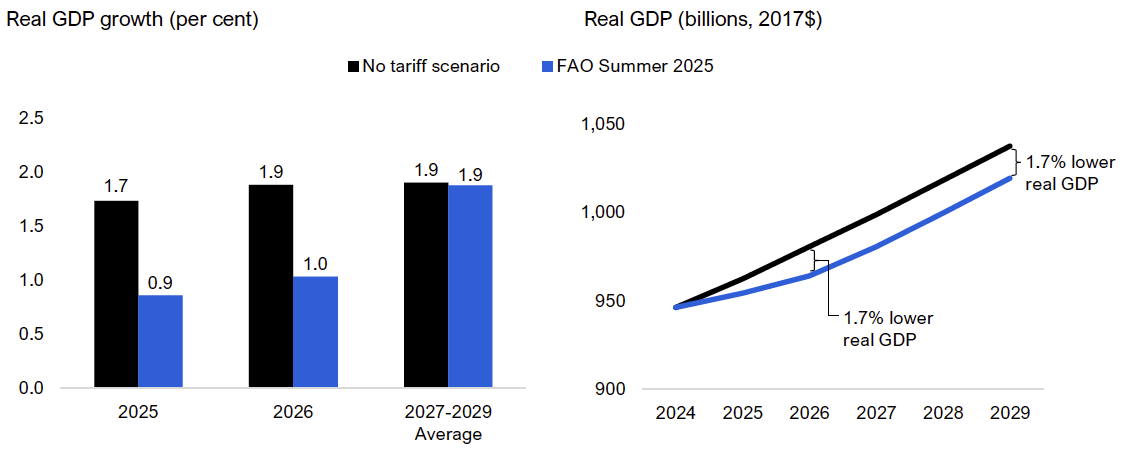
The FAO’s economic outlook includes existing trade policies as of August 5 (see Appendix for detailed assumptions). When compared to a no tariff scenario, Ontario’s projected real GDP growth is 0.8 percentage points lower in 2025 (0.9 per cent vs. 1.7 per cent) and 0.9 percentage points lower in 2026 (1.0 per cent vs. 1.9 per cent). Over time, Ontario’s economy is expected to adjust to the impact of US tariffs, and real GDP growth would improve to the same rate as in the no tariff scenario. However, this implies that the level of Ontario’s real GDP would be 1.7 per cent lower than in a no tariff scenario in 2029.
Figure 2.2 Impact of US tariffs on Ontario real GDP relative to a no tariff scenario
Source: Ontario Economic Accounts and FAO.
Accessible version
| Real GDP Growth (Per Cent) |
2025 | 2026 | 2027-2029 Average |
|---|---|---|---|
| No tariff scenario | 1.7 | 1.9 | 1.9 |
| FAO Summer 2025 | 0.9 | 1.0 | 1.9 |
| Real GDP (Billions, 2017$) |
2024 | 2025 | 2026 | 2027 | 2028 | 2029 |
|---|---|---|---|---|---|---|
| No tariff scenario | 946 | 963 | 981 | 999 | 1,018 | 1,038 |
| FAO Summer 2025 | 946 | 955 | 964 | 981 | 1,000 | 1,020 |
| 1.7% lower real GDP | 1.7% lower real GDP |
There is significant uncertainty in the economic outlook stemming largely from US tariffs on Canadian exports, and changes to these policies could have a broad range of impacts on Ontario’s economic growth. For a discussion of the current risks to the economic outlook, see Chapter 6.
Tariffs to impact provincial economies unevenly
Canada’s real GDP growth is projected to slow to 1.4 per cent in both 2025 and 2026 as US tariffs reduce trade activity between the two countries. Uncertainty in trade relations is expected to disproportionately impact Ontario, where sectors subject to US tariffs make up a larger share of the economy than in most other provinces. Ontario’s housing market also continues to face significant challenges in new home construction and affordability, and Ontario’s home resales and prices are expected to decline the most out of all provinces in 2025.[2] As a result, Canada’s real GDP growth is expected to outpace Ontario’s real GDP growth over the next two years.
US tariffs projected to raise Ontario’s unemployment rate in 2025 and 2026
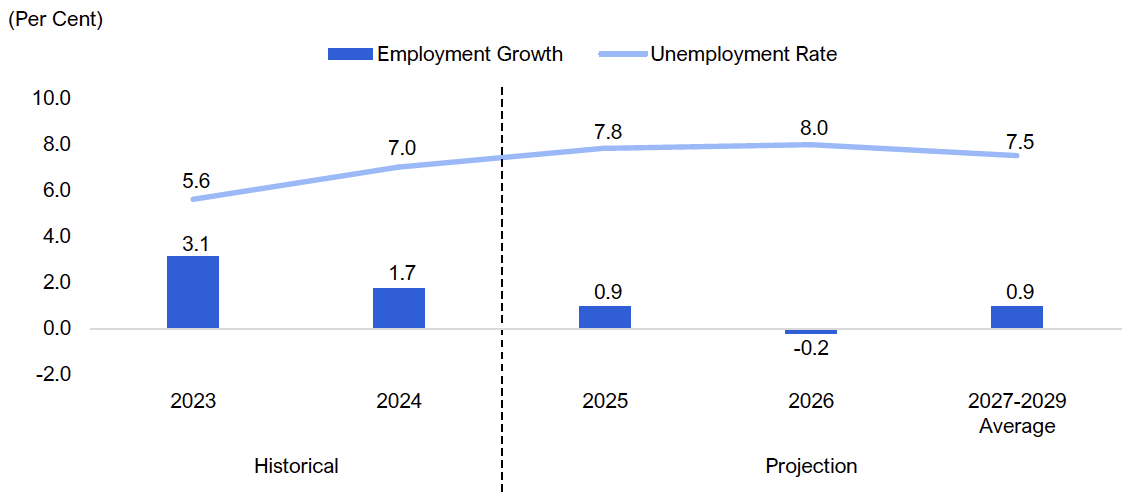
Ontario’s job creation continued to moderate in 2024 as employment increased by 140,000 jobs (1.7 per cent) compared to 242,000 jobs (3.1 per cent) created in 2023.[3] With more people entering the labour market (270,900 or 3.2 per cent) than were hired, the annual unemployment rate increased to 7.0 per cent in 2024, up from 5.6 per cent in 2023 and the highest since 2014 excluding the COVID-19 pandemic.
Annual employment growth is projected to slow to 0.9 per cent in 2025, followed by a decline of 0.2 per cent in 2026 as US tariffs result in job losses, especially in manufacturing and labour-intensive services industries. As a result, the annual unemployment rate is projected to increase to 7.8 per cent in 2025 and 8.0 per cent in 2026. The unemployment rate is expected to improve over the 2027 to 2029 period as Ontario’s economy adjusts to the impact of tariffs.
Figure 2.3 Unemployment rate expected to increase in 2025 and 2026
Source: Statistics Canada and FAO.
Accessible version
| History | Projection | ||||
|---|---|---|---|---|---|
| Per Cent | 2023 | 2024 | 2025 | 2026 | 2027-2029 Average |
| Employment Growth | 3.1 | 1.7 | 0.9 | – 0.2 | 0.9 |
| Unemployment Rate | 5.6 | 7.0 | 7.8 | 8.0 | 7.5 |
Tariffs are expected to push inflation slightly above the Bank of Canada’s target
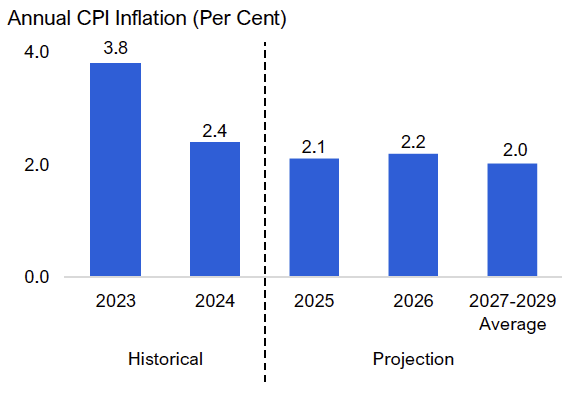
Figure 2.4 Ontario’s inflation rate expected to stabilize
Source: Statistics Canada and FAO.
Accessible version
| Historical | Projection | ||||
|---|---|---|---|---|---|
| 2023 | 2024 | 2025 | 2026 | 2027-2029 Average | |
| Annual CPI Inflation (Per Cent) |
3.8 | 2.4 | 2.1 | 2.2 | 2.0 |
Ontario’s average annual inflation rate fell from 3.8 per cent in 2023 to 2.4 per cent in 2024 as high interest rates continued to slow demand. Shelter price inflation was the fastest growing component of Ontario’s consumer price index (CPI) in 2024 at 5.2 per cent as mortgage interest and rental costs remained elevated.
Ontario’s average annual inflation rate is projected to ease to 2.1 per cent in 2025 and rise modestly to 2.2 per cent in 2026 as higher US inflation raises Ontario’s import prices. This expected increase is partially offset by the impact of weaker economic activity and lower oil prices.
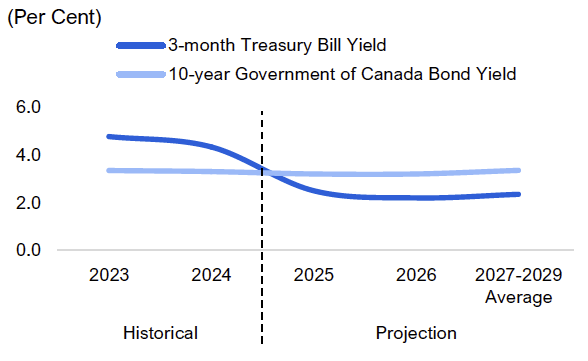
Figure 2.5 Short-term interest rates to continue falling in 2025
Source: Statistics Canada and FAO.
Accessible version
| (Per Cent) | Historical | Projection | |||
|---|---|---|---|---|---|
| 2023 | 2024 | 2025 | 2026 | 2027-2029 Average | |
| 3-month Treasury Bill Yield | 4.8 | 4.3 | 2.6 | 2.4 | 2.4 |
| 10-year Government of Canada Bond Yield | 3.3 | 3.3 | 3.2 | 3.4 | 3.4 |
Since April 2024, the Bank of Canada has lowered its policy interest rate by a total of 225 basis points to 2.75 per cent in March 2025. Financial market participants anticipate the Bank of Canada will lower its policy interest rate by an additional 50 basis points by the end of 2025.[4]
The FAO projects that short-term interest rates will continue to trend down in 2025 and fall below long-term rates. The Bank of Canada is expected to leave its policy interest rate unchanged in 2026, and short-term interest rates are projected to average 2.4 per cent over the 2025 to 2029 period.
The FAO’s economic outlook is similar to the government’s projection in the 2025 budget
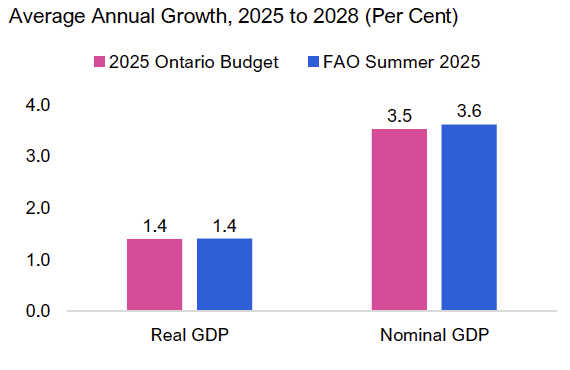
Figure 2.6 The FAO’s GDP outlook is broadly in line with the government’s projection
Source: 2025 Ontario Budget and FAO.
Accessible version
| Average Annual Growth, 2025 to 2028 (Per Cent) | Real GDP | Nominal GDP |
|---|---|---|
| 2025 Ontario Budget | 1.4 | 3.5 |
| FAO Summer 2025 | 1.4 | 3.6 |
The FAO’s real GDP outlook is broadly in line with the government’s projection in the 2025 Ontario Budget, with average annual growth of 1.4 per cent over the 2025 to 2028 period. The FAO projects average annual nominal GDP growth of 3.6 per cent, slightly higher than the government’s 3.5 per cent outlook.
Compared to the government’s outlook, the FAO’s projection for nominal GDP growth is higher in 2025 and 2026 and lower in 2027 and 2028 based on different outlooks for labour income, corporate profits and nominal household consumption.
For a comparison of the FAO’s and the government’s outlook for key revenue drivers and select economic indicators, see Appendix tables 7.1 and 7.2.
3. Budget Outlook
The FAO projects budget deficits over the outlook
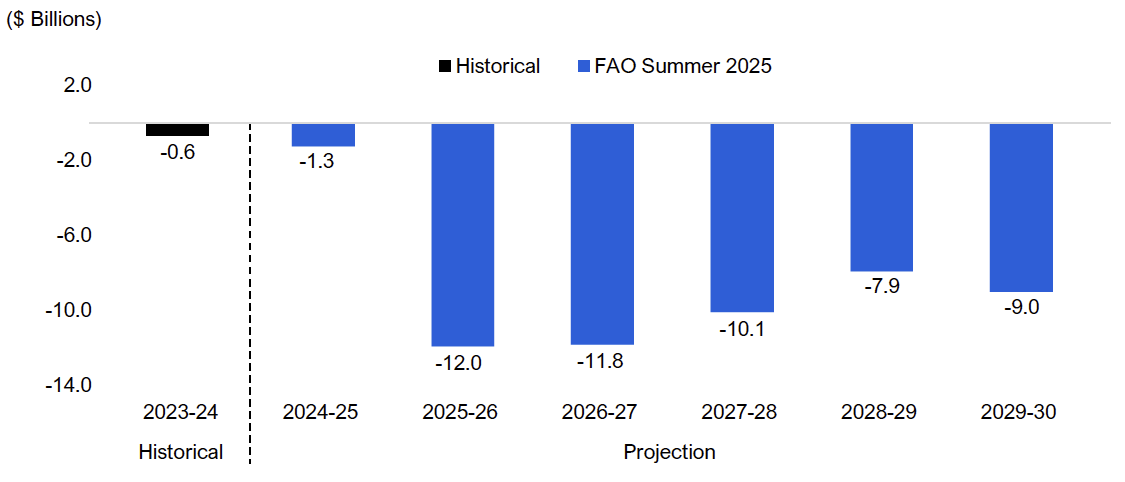
Following a budget deficit of $0.6 billion in 2023-24, the FAO projects that Ontario’s budget deficit deteriorated modestly to $1.3 billion in 2024-25, as spending growth of 8.1 per cent outpaced revenue gains of 7.8 per cent.
Based on the FAO’s outlook for the Ontario economy, and current government policies and announced commitments, the FAO projects that the budget deficit will deteriorate to $12.0 billion in 2025-26. The significant increase in the budget deficit results from a projected 1.7 per cent decline in revenue, due to a loss of one-time revenue and a slowing economic outlook, combined with a 3.1 per cent increase in spending (see Chapters 4 and 5 for details).
The budget balance is projected to improve gradually over the following three years to a deficit of $7.9 billion in 2028-29, as average annual revenue growth of 3.3 per cent is projected to exceed average spending growth of 2.6 per cent per year. However, the FAO projects that the budget will not balance over the outlook, deteriorating to a deficit of $9.0 billion in 2029-30, as spending growth, led by the health sector and interest on debt,[5] is expected to exceed revenue growth.
The FAO’s budget outlook is subject to significant risks, notably US trade policy (see Chapter 6 for more details).
Figure 3.1 FAO projects budget deficits over the outlook
Source: Ontario Public Accounts and FAO.
Accessible version
| ($ Billions) | Historical | FAO Summer 2025 |
|---|---|---|
| 2023-24 | -0.6 | |
| 2024-25 | -1.3 | |
| 2025-26 | -12.0 | |
| 2026-27 | -11.8 | |
| 2027-28 | -10.1 | |
| 2028-29 | -7.9 | |
| 2029-30 | -9.0 |
Comparison to the outlook in the 2025 Ontario Budget
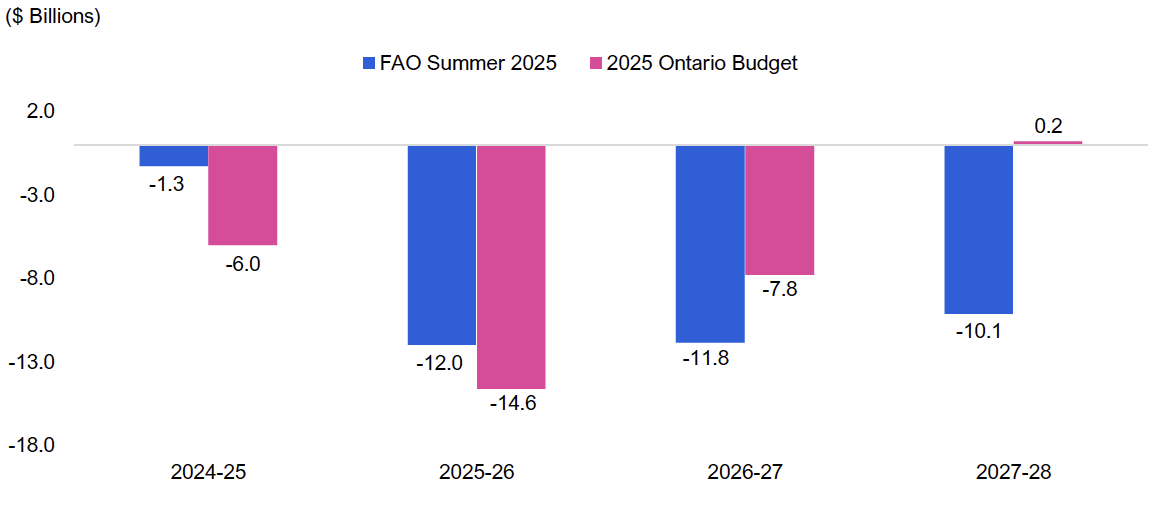
The FAO’s budget deficit projection is lower compared to the government’s deficit forecast in the 2025 Ontario Budget in the first two years of the outlook and higher in the last two years (the Province’s forecast ends in 2027-28). The FAO does not project a balanced budget over the outlook, while in the 2025 budget the Province projected a balanced budget in 2027-28.
Figure 3.2 FAO does not expect a balanced budget by 2027-28
Source: FAO and 2025 Ontario Budget.
Accessible version
| ($ Billions) | FAO Summer 2025 | 2025 Ontario Budget |
|---|---|---|
| 2024-25 | -1.3 | -6.0 |
| 2025-26 | -12.0 | -14.6 |
| 2026-27 | -11.8 | -7.8 |
| 2027-28 | -10.1 | 0.2 |
In 2024-25, the FAO’s budget deficit projection is $4.7 billion smaller than the government’s deficit forecast, as the FAO expects higher revenues and lower spending. For 2025-26, the FAO’s budget deficit outlook is $2.7 billion smaller than the government’s, largely due to the $2.0 billion reserve in the Province’s forecast, which is not included in the FAO’s outlook.
In contrast, the FAO’s budget deficit projection is $4.1 billion larger than the government’s in 2026-27 and $10.3 billion larger in 2027-28, the year in which the government expects to achieve balance. The 2025 budget expects stronger taxation revenue gains and significantly lower program spending growth compared to the FAO’s outlook in 2026-27 and 2027-28. (See Chapters 4 and 5 for additional details.)
The Fiscal Sustainability, Transparency and Accountability Act, 2019 (FSTAA) mandates that the Province plan for a balanced budget in each fiscal year, unless the government determines that extraordinary circumstances require the Province to have a budget deficit for one or more years. In the case of the 2025 Ontario Budget, the Province determined that a budget deficit was necessary in 2025-26 and 2026-27, with a plan to return to balance in 2027-28. Based on the FAO’s outlook for the Ontario economy, and current government policies and announced commitments, the FAO does not expect that the Province will return to a balanced budget by 2027-28 without additional measures to reduce spending and/or increase revenue.
Ontario’s net debt and fiscal sustainability indicators
The FAO projects that the Province’s net debt will rise from $408.0 billion in 2023-24 to $549.3 billion in 2029-30, an increase of $141.4 billion (34.7 per cent). This increase is due to $52.2 billion in accumulated budget deficits over the period and an $89.2 billion increase in non-financial assets, largely infrastructure assets owned by the Province and the broader public sector.
FSTAA mandates that each Ontario budget include a debt burden reduction strategy that outlines specific objectives for the projected net debt-to-GDP ratio and a progress report on supporting actions and implementation of the debt burden reduction strategy from the last budget.
In the 2025 budget, the government’s debt burden reduction strategy contained targets for three fiscal sustainability indicators, which were unchanged from the 2023 and 2024 budgets:
- net debt-to-GDP[6] to stay below 40.0 per cent;
- net debt-to-operating revenue[7] to be below 200 per cent; and
- net interest-to-operating revenue[8] to stay below 7.5 per cent.
In 2023-24, all three of the government’s fiscal sustainability indicators were below their 10-year historical average and the government’s 2025 budget targets. Looking forward, the FAO expects that the fiscal sustainability indicators will deteriorate over the outlook. The net debt-to-GDP ratio is expected to increase from 36.4 per cent in 2023-24 to 38.9 per cent in 2029-30 but remain below the government’s target and the ratio’s 10-year historical average. The net debt-to-operating revenue ratio is expected to increase from 198.1 per cent in 2023-24 to 218.4 per cent in 2029-30, ending the outlook period over the government’s target and over its 10-year historical average. Finally, the net interest-to-operating revenue ratio is projected to increase from 5.5 per cent in 2023-24 to 7.49 per cent in 2029-30, remaining below the government’s target and its 10-year historical average.
| Indicator | 10-Year Historical Average (%) |
Government Target (%) | 2023-24 Actual |
(%) 2029-30 Forecast |
(%) Change |
(ppt) Over / Under Target in 2029-30 |
|
|---|---|---|---|---|---|---|
| Net debt-to-GDP | 39.5 | < 40.0 | 36.4 | 38.9 | up 2.5 ppt | Under |
| Net debt-to-operating revenue | 217.9 | < 200.0 | 198.1 | 218.4 | up 20.3 ppt | Over |
| Net interest-to-operating revenue | 7.6 | < 7.5 | 5.5 | 7.49 | up 2.0 ppt | Under |
4. Revenue Outlook
Revenue growth expected to moderate
From 2023-24 to 2029-30, revenue growth is expected to average 3.3 per cent per year, slower than the 5.5 per cent average annual increase recorded during the 2017-18 to 2023-24 period. The moderation in revenue growth reflects the FAO’s forecast that nominal GDP growth, the broadest measure of the tax base, will slow compared to the previous six years. Revenue growth is also constrained by a projected decline in other non-tax revenue, including international student tuition revenue in the colleges sector and interest and investment income.
Revenue is projected to increase from $209.0 billion in 2023-24 to $225.3 billion in 2024-25 (+7.8 per cent). This $16.3 billion increase results from the combined impact of higher tax revenue growth, particularly in personal income tax and corporations tax revenue, as well as other significant temporary revenues.[9] In 2025-26, revenues decline by $3.8 billion (-1.7 per cent), due to the combined impact of moderating economic activity and the loss of the temporary revenues. By 2029-30, revenue reaches $253.3 billion driven by underlying economic activity.
Figure 4.1 Ontario’s revenue growth to moderate over the projection
Note: Historical revenue has been restated to include revenue from interest and investment income.
Source: Ontario Public Accounts and FAO.
Accessible version
| Historical | Projection | |
|---|---|---|
| 2017-18 to 2023-24 | 2023-24 to 2029-30 | |
| Average Annual Revenue Growth (Per Cent) | 5.5 | 3.3 |
| Total Revenues ($ Billions) | Historical | FAO Summer 2025 |
|---|---|---|
| 2017-18 | 151.3 | |
| 2018-19 | 154.8 | |
| 2019-20 | 157.1 | |
| 2020-21 | 165.7 | |
| 2021-22 | 185.8 | |
| 2022-23 | 194.4 | |
| 2023-24 | 209.0 | |
| 2024-25 | 225.3 | |
| 2025-26 | 221.5 | |
| 2026-27 | 227.1 | |
| 2027-28 | 234.8 | |
| 2028-29 | 243.9 | |
| 2029-30 | 253.3 |
US tariffs projected to lower Provincial revenue
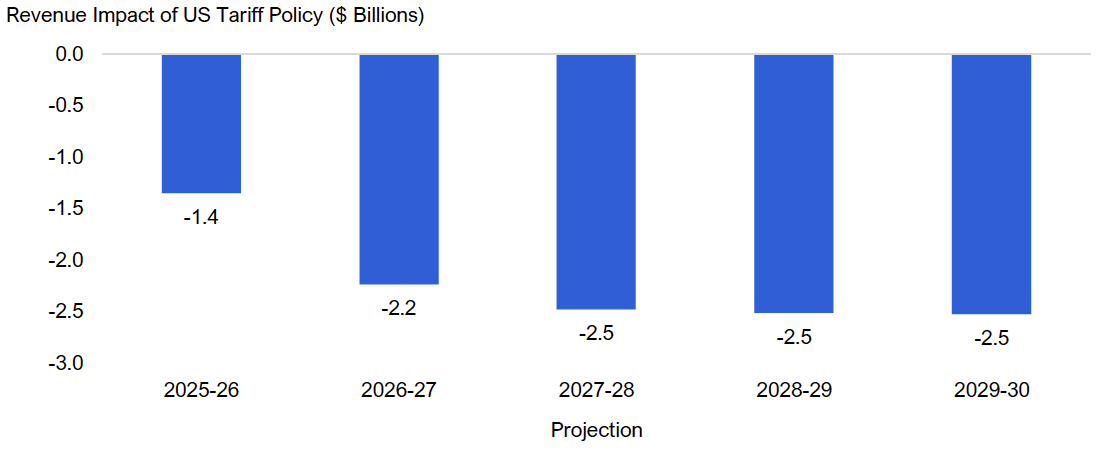
As discussed in Chapter 2, US tariff policy is projected to lower Ontario’s nominal GDP growth rate. Based on US tariff policy as of August 5, 2025, the FAO estimates that in 2026-27 revenues will be $2.2 billion lower than in the absence of tariffs. Over the outlook, US tariffs are expected to lower revenues by a cumulative $11.1 billion from 2025-26 to 2029-30.
Figure 4.2 $2.2 billion in lower Provincial revenue in 2026-27 due to the impact of US tariffs on Ontario’s economy
Source: FAO.
Accessible version
| 2025-26 | 2026-27 | 2027-28 | 2028-29 | 2029-30 | |
|---|---|---|---|---|---|
| Revenue Impact of US Tariff Policy ($ Billions) | -1.4 | -2.2 | -2.5 | -2.5 | -2.5 |
Comparison to revenue projection in the 2025 budget
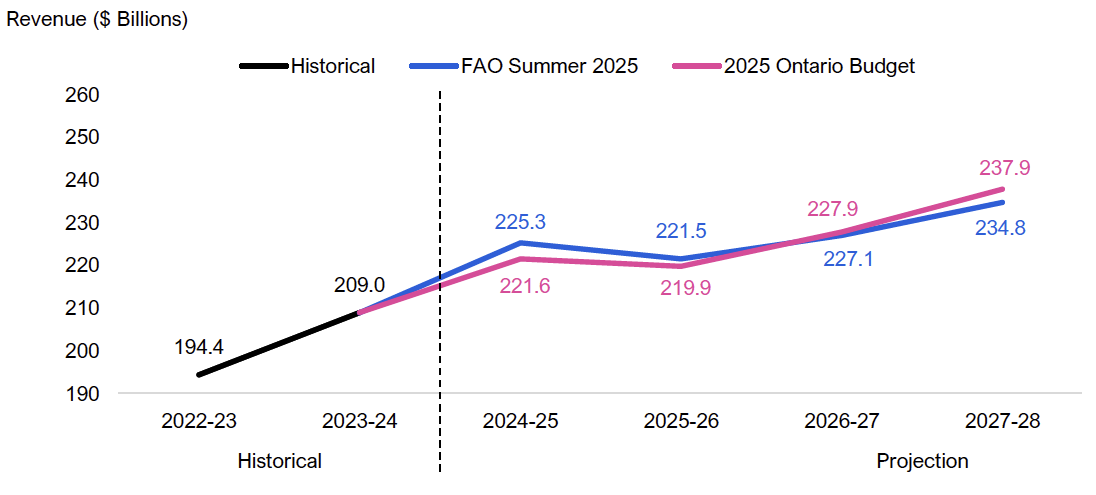
Over the comparable outlook (2024-25 to 2027-28), the FAO projects a cumulative $1.5 billion in higher revenue than the government. While the FAO’s cumulative revenue outlook over the projection is broadly in-line with the government’s, there are differences in individual years.
The FAO’s revenue projection is above the government’s outlook in 2024-25 (+$3.7 billion) and 2025-26 (+$1.6 billion), mainly due to higher personal income tax and corporations tax revenue based on tax assessment information not available at the time of the 2025 budget. Compared to the government, the FAO expects lower revenues in 2026-27 (-$0.8 billion) and 2027-28 (-$3.1 billion), due to slower projected growth in taxation revenue.[10]
Figure 4.3 Comparison to 2025 Ontario Budget revenue projection
Note: Historical revenue has been restated to include revenue from interest and investment income.
Source: Ontario Public Accounts, 2025 Ontario Budget and FAO.
Accessible version
| Revenue ($ Billions) | Historical | FAO Summer 2025 | 2025 Ontario Budget | |
|---|---|---|---|---|
| Historical | 2022-23 | 194.4 | ||
| 2023-24 | 209.0 | |||
| Projection | 2024-25 | 225.3 | 221.6 | |
| 2025-26 | 221.5 | 219.9 | ||
| 2026-27 | 227.1 | 227.9 | ||
| 2027-28 | 234.8 | 237.9 |
5. Spending Outlook
Spending growth expected to moderate
The FAO projects that spending will grow at an average annual rate of 3.8 per cent from $209.7 billion in 2023-24 to $262.4 billion in 2029-30. This is a slower pace than the 5.2 per cent average annual growth from 2017-18 to 2023-24, a period that included the introduction of new government programs,[11] the expansion of existing programs,[12] and higher spending in response to the COVID-19 pandemic, inflationary pressures and high population growth. The FAO expects spending growth to moderate over the forecast period based on slower projected inflation, slower wage and population growth, and the FAO’s analysis of current government policies and announced commitments.
Figure 5.1 Ontario’s spending growth to moderate over the projection
Note: Historical spending has been restated to exclude revenue from interest and investment income.
Source: 2025 Ontario Budget and FAO analysis of information provided by the Province.
Accessible version
| Historical | Projection | |
|---|---|---|
| 2017-18 to 2023-24 | 2023-24 to 2029-30 | |
| Average Annual Spending Growth (Per Cent) | 5.2 | 3.8 |
| Total Sending ($ Billions) | Historical | Projection |
|---|---|---|
| 2017-18 | 155.0 | |
| 2018-19 | 162.1 | |
| 2019-20 | 165.7 | |
| 2020-21 | 182.0 | |
| 2021-22 | 183.8 | |
| 2022-23 | 200.3 | |
| 2023-24 | 209.7 | |
| 2024-25 | 226.5 | |
| 2025-26 | 233.5 | |
| 2026-27 | 239.0 | |
| 2027-28 | 244.9 | |
| 2028-29 | 251.8 | |
| 2029-30 | 262.4 |
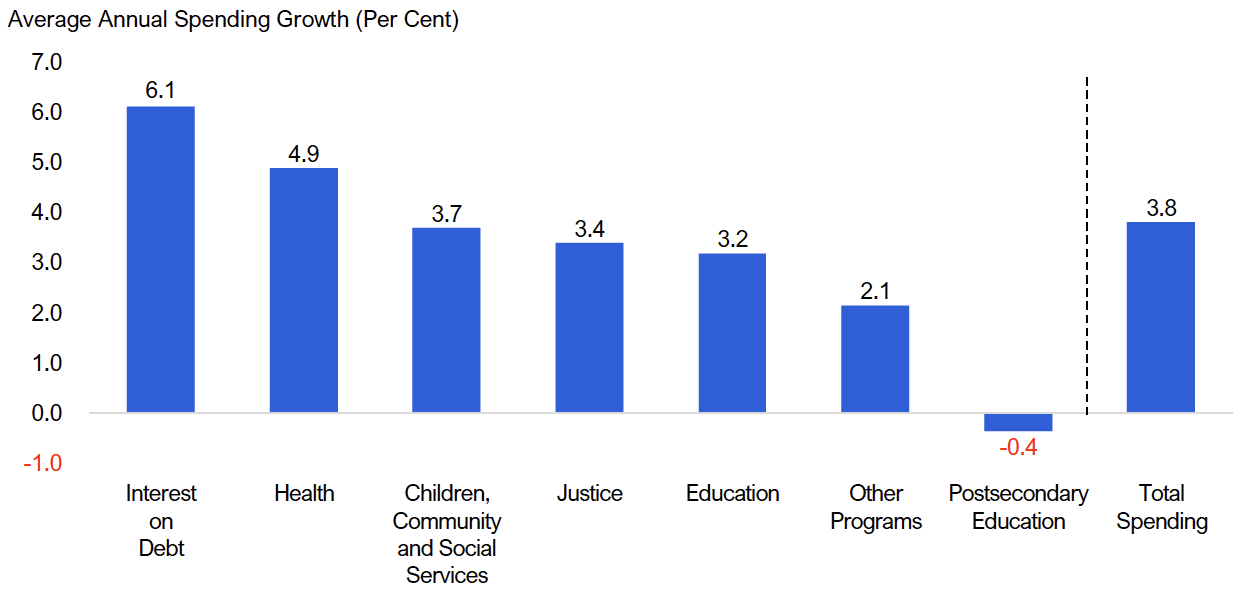
Spending growth led by interest on debt and health sector
By sector, interest on debt and health are expected to grow faster than the average total spending growth of 3.8 per cent. Spending on interest on debt is projected to grow by an average of 6.1 per cent per year, driven by borrowing for the Province’s accumulated budget deficits and non-financial assets, largely infrastructure assets owned by the Province and the broader public sector. Health sector spending is projected to increase by an average of 4.9 per cent per year, driven by strong spending in long-term care, drug programs, community care and payments to physicians and practitioners.
In contrast, all other sectors are expected to grow slower than the 3.8 per cent average over the 2023-24 to 2029-30 period. Spending in the children, community and social services sector is projected to grow at 3.7 per cent per year on average, based on the FAO’s projection for social assistance caseloads and the legislated benefit rates for the Ontario Disability Support Program and the Ontario Works program.[13] Justice sector spending follows at an average of 3.4 per cent per year, driven by the FAO’s forecast for increases in corrections capacity and employee compensation. Education sector spending is projected to grow at 3.2 per cent per year on average, due to moderating elementary and secondary school enrolment growth. ‘Other programs’ sector spending is projected to grow at 2.1 per cent per year, on average, due to the scheduled expiry of time-limited spending programs, mostly related to municipal supports, which include Toronto and Ottawa ‘New Deal’ funding,[14] the Housing-Enabling Water Systems Fund, and the Building Faster Fund. Lastly, postsecondary education spending is projected to decline by an average of -0.4 per cent per year due to the ongoing impact of lower international student enrolment on colleges spending.
Figure 5.2 FAO’s spending projection by sector from 2023-24 to 2029-30, average annual growth (per cent)
Note: Historical spending has been restated to exclude revenue from interest and investment income.
Source: 2025 Ontario Budget and FAO analysis of information provided by the Province.
Accessible version
| Sector | Average Annual Spending Growth (Per Cent) |
|---|---|
| Interest on Debt | 6.1 |
| Health | 4.9 |
| Children, Community and Social Services | 3.7 |
| Justice | 3.4 |
| Education | 3.2 |
| Other Programs | 2.1 |
| Postsecondary Education | -0.4 |
| Total Spending | 3.8 |
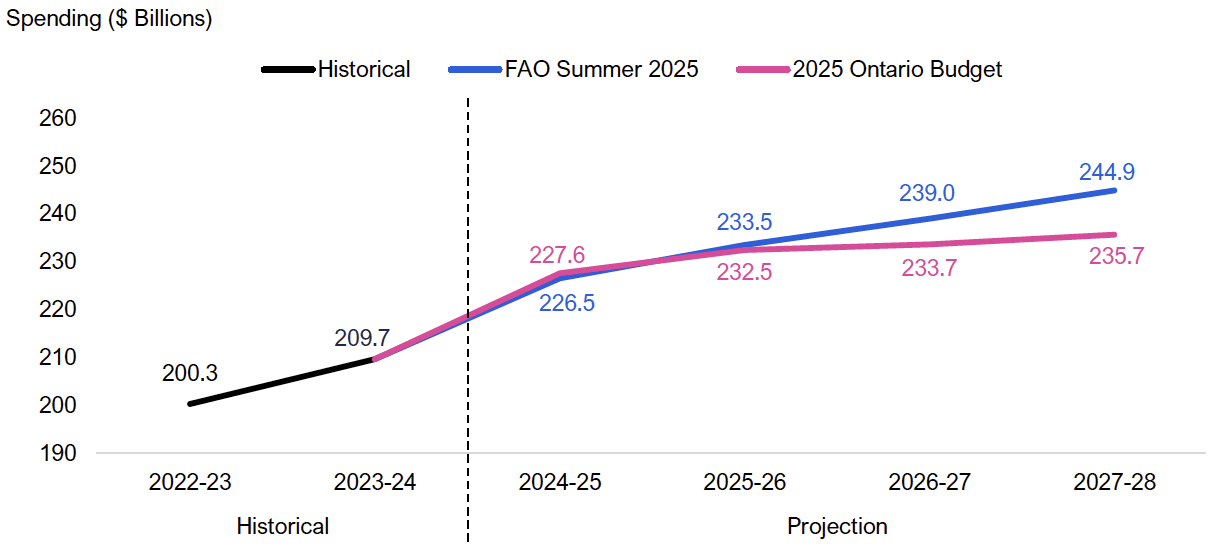
Comparison to spending projection in the 2025 budget
Over the 2025 Ontario Budget outlook period, from 2024-25 to 2027-28, the FAO projects a cumulative $14.5 billion in higher spending than the government’s projection in the 2025 budget. In 2024-25, the first year of the outlook period, the FAO’s spending projection is $1.1 billion below the government’s projection. However, over the next three years, the FAO’s spending forecast exceeds the government’s forecast by a cumulative $15.5 billion, with the spending gap increasing from $1.0 billion in 2025-26 to $9.2 billion in 2027-28.
Figure 5.3 Comparison to 2025 Ontario Budget spending projection
Note: Historical spending has been restated to exclude revenue from interest and investment income.
Source: Ontario Public Accounts, 2025 Ontario Budget and FAO.
Accessible version
| Spending ($ Billions) | Historical | FAO Summer 2025 | 2025 Ontario Budget | |
|---|---|---|---|---|
| Historical | 2022-23 | 200.3 | ||
| 2023-24 | 209.7 | |||
| Projection | 2024-25 | 226.5 | 227.6 | |
| 2025-26 | 233.5 | 232.5 | ||
| 2026-27 | 239.0 | 233.7 | ||
| 2027-28 | 244.9 | 235.7 |
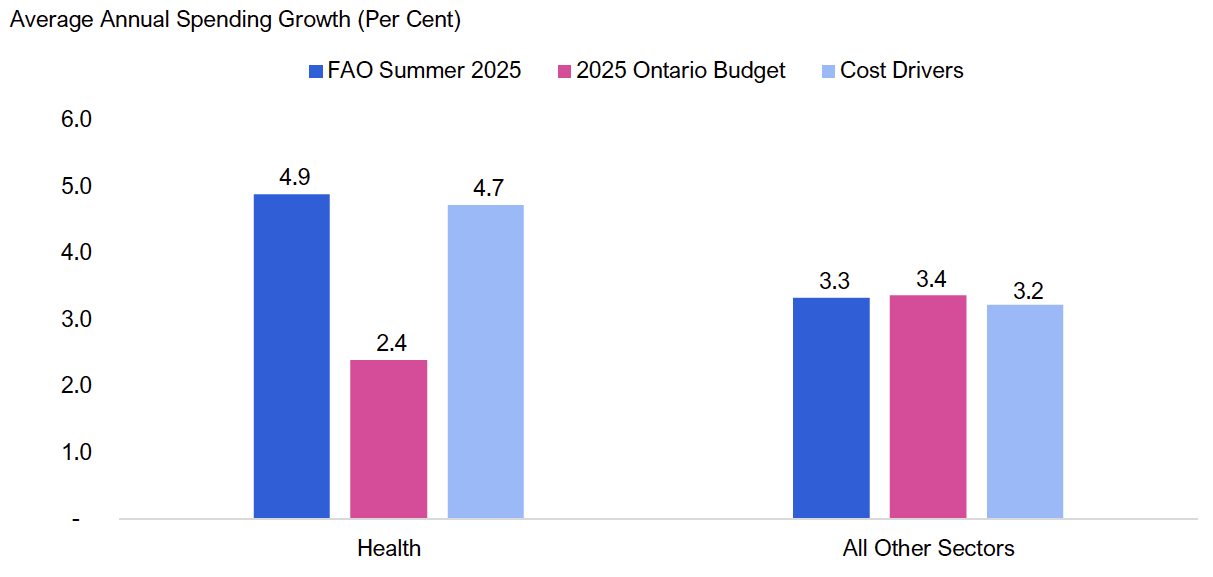
The gap between the spending forecasts is largely driven by the FAO’s higher health sector spending forecast. From 2023-24 to 2027-28, the FAO projects health sector spending will grow at an average of 4.9 per cent annually, consistent with the estimated 4.7 per cent combined growth of the health sector’s key cost drivers: population growth, population aging and health sector inflation. By comparison, the 2025 budget forecasts a 2.4 per cent average annual spending increase in the health sector over the same period, significantly below the health sector cost drivers.
Across all other sectors combined, the FAO’s spending forecast is consistent with the Province’s forecast.[15] The Province projects spending to grow at 3.4 per cent annually, between 2023-24 and 2027-28, similar to both the FAO’s projection of 3.3 per cent average annual growth and estimated cost driver growth of 3.2 per cent.
Figure 5.4 Comparison to 2025 Ontario Budget spending growth projection, 2023-24 to 2027-28
Note: Historical spending has been restated to exclude revenue from interest and investment income.
Source: Ontario Public Accounts, 2025 Ontario Budget and FAO.
Accessible version
| Average Annual Spending Growth (Per Cent) | FAO Summer 2025 | 2025 Ontario Budget | Cost Drivers |
|---|---|---|---|
| Health | 4.9 | 2.4 | 4.7 |
| All Other Sectors | 3.3 | 3.4 | 3.2 |
6. Risks to the Economic and Budget Outlook
US trade policy remains the most significant risk
There are numerous risks that could materially impact the FAO’s economic and budget outlook over the projection, mainly related to US trade policy.[16]
The FAO’s economic and budget outlook was finalized based on existing trade policies as of August 5, 2025 (see Appendix for detailed assumptions). As of the writing of this report, Canada and the United States have not reached a trade agreement, while the Canada-United States-Mexico Agreement (CUSMA) will undergo a review process in 2026. The United States has reached trade frameworks with several countries in recent months, all of which have involved a base tariff rate for US imports. The United States has also suggested that it may impose future tariffs on semiconductors and pharmaceuticals. Overall, ongoing uncertainty surrounding trade policy remains a significant risk to Ontario’s exports, business investment and labour market.
The potential economic and budget impacts of alternative tariff scenarios
As US trade policy continues to shift, the actual impact of tariffs on Ontario’s economy is highly uncertain and will depend on the magnitude, breadth and duration of tariff coverage, as well as how businesses, households and economies respond. Given this uncertainty, the FAO has developed two additional scenarios, a “low impact” and a “high impact” scenario, to account for potential changes in US and Canadian tariff policies. These scenarios produce a potential range of economic and budget impacts to Ontario.[17]
The FAO’s low impact scenario assumes:
- Changes to US tariffs on the following Canadian exports:
- 12.5 per cent on steel, aluminum and copper products (lowered from 50 per cent).
- For non-CUSMA compliant exports to the United States, 15 per cent on all goods (lowered from 35 per cent) except energy and critical minerals, which remain at 10 per cent.
- Removal of all countermeasures by the Canadian government on imports from the United States.
The FAO’s high impact scenario assumes:
- Additional US tariffs on the following Canadian exports:
- 50 per cent on lumber, semiconductors, pharmaceuticals (increased from 0 per cent).
- 15 per cent on all other CUSMA-compliant goods (increased from 0 per cent).
- 25 per cent tariff by the Canadian government on approximately $120 billion of US goods (increased from $59.8 billion).
Under the low impact scenario, Ontario’s nominal GDP growth averages 0.2 percentage points higher and Ontario’s unemployment rate averages 0.6 percentage points lower compared to the FAO’s EBO base case projection over the 2025 to 2029 period. Under the high impact scenario, Ontario’s nominal GDP growth averages 0.2 percentage points lower and Ontario’s unemployment rate averages 0.8 percentage points higher compared to the FAO’s EBO base case projection over the 2025 to 2029 period.
| 2025-2029 Average | Low Impact Scenario | FAO EBO Summer 2025 | High Impact Scenario |
|---|---|---|---|
| Real GDP growth (per cent) | 1.8 | 1.5 | 1.2 |
| Nominal GDP growth (per cent) | 3.9 | 3.7 | 3.5 |
| Unemployment rate (per cent) | 7.0 | 7.7 | 8.4 |
| CPI growth (per cent) | 1.9 | 2.0 | 2.3 |
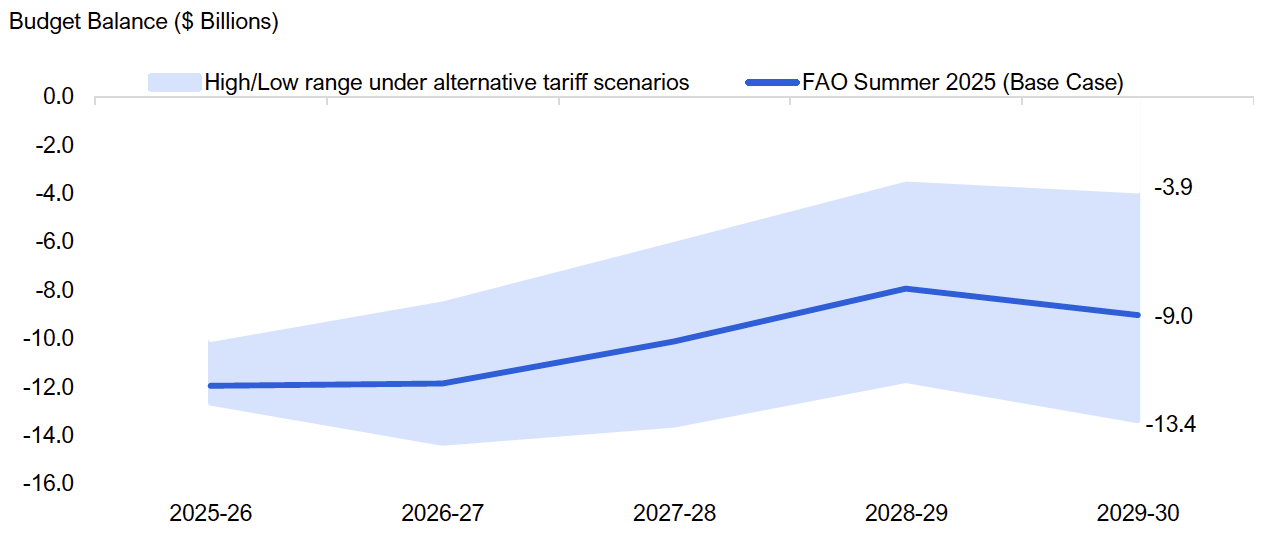
Under the low impact scenario, the FAO projects a budget deficit of $3.9 billion by 2029-30, a $5.1 billion improvement compared to the FAO’s EBO base case projection. The province’s net debt-to-GDP ratio is also projected to reach 37.2 per cent in 2029-30, compared to 38.9 per cent in the base case.
Under the high impact scenario, the budget deficit reaches $13.4 billion in 2029-30, a $4.3 billion deterioration from the FAO’s EBO base case. Ontario’s net debt-to-GDP ratio is also projected to rise to 40.4 per cent in 2029-30, surpassing the government’s target of 40.0 per cent.
Budget balance projections could fall outside of this range if tariffs or the economic outlook differ from the scenarios described above or if the government makes future policy changes.
Figure 6.1 The impacts of alternative tariff scenarios on Ontario’s budget balance
Source: FAO.
Accessible version
| Budget Balance ($ Billions) | 2025-26 | 2026-27 | 2027-28 | 2028-29 | 2029-30 |
|---|---|---|---|---|---|
| FAO Low Tariff Impact | -10.0 | -8.4 | -5.9 | -3.4 | -3.9 |
| FAO Summer 2025 (Base Case) | -12.0 | -11.8 | -10.1 | -7.9 | -9.0 |
| FAO High Tariff Impact | -12.7 | -14.3 | -13.6 | -11.7 | -13.4 |
Budget balance and net debt sensitivities
To illustrate the impact of potential policy changes on Ontario’s budget position, the FAO estimated the sensitivity of key budget indicators to select revenue and spending changes. For each policy item, the FAO provides an estimate of the 2025-26 and 2029-30 change in the budget balance, the total change in net debt by 2029-30, and the change in the net debt-to-GDP ratio in 2029-30.
| Change in Budget Balance in: | Change in Net Debt by 2029-30 |
Change in Net Debt-to-GDP Ratio by 2029-30 | ||
|---|---|---|---|---|
| 2025–26 | 2029–30 | |||
| Revenue | ||||
| Increase/decrease in annual personal income taxes payable by $500 per taxpayer | +/-$4.9 billion | +/-$6.0 billion | -/+$27.0 billion | -/+1.9 ppt |
| A one percentage point increase/decrease to the 11.5 per cent provincial general corporate tax rate | +/-$2.1 billion | +/-$2.8 billion | -/+$12.1 billion | -/+0.9 ppt |
| A one percentage point increase/decrease to the 8 per cent provincial HST rate | +/-$4.7 billion | +/-$6.4 billion | -/+$27.7 billion | -/+2.0 ppt |
| Spending | ||||
| A sustained one percentage point increase/decrease in the growth rate of health sector spending | -/+$1.0 billion | -/+$6.2 billion | +/-$17.1 billion | +/-1.2 ppt |
| A sustained one percentage point increase/decrease in the growth rate of education sector spending | -/+$0.4 billion | -/+$2.6 billion | +/-$7.3 billion | +/-0.5 ppt |
| A one percentage point increase/decrease in the cost of Provincial borrowing | -/+$0.7 billion | -/+$2.6 billion | +/-$8.4 billion | +/-0.6 ppt |
7. Appendix
Tariff Assumptions
The FAO’s economic outlook is based on existing trade policies as of August 5, 2025, including:
- US tariffs on the following Canadian exports:
- 50 per cent on steel, aluminum and copper products, regardless of CUSMA-compliance.
- 25 per cent on motor vehicles with an exemption for United States content of vehicles that are CUSMA-compliant.
- 25 per cent on motor vehicle parts that are not CUSMA-compliant, with a remission through April 2027 for a specified value of motor vehicle parts imports, if final assembly is in the United States.
- No tariffs on all other CUSMA-compliant goods.
- For non-CUSMA-compliant exports to the United States, 35 per cent on all goods except energy and critical minerals, which are tariffed at 10 per cent.
- Countermeasures by the Canadian government on the following imports from the United States:[18]
- 25 per cent on $59.8 billion in imports from the United States.
- 25 per cent tariffs on non-CUSMA compliant motor vehicles and non-Canadian and non-Mexican content of CUSMA-compliant automobiles imported from the United States, with temporary remissions for companies that manufacture motor vehicles in Canada and import motor vehicles for sale in Canada.
- Temporary remissions for imports from the United States used in manufacturing, health and defence.
The FAO’s economic outlook also incorporates methodological assumptions from the “FAO tariff scenario” in the FAO’s report, The Potential Impacts of US Tariffs on the Ontario Economy.
Data Tables
| (% Change) | 2023a | 2024a | 2025f | 2026f | 2027f-2029f Average* |
|---|---|---|---|---|---|
| Nominal GDP | |||||
| FAO | 5.4 | 5.3 | 3.5 | 3.2 | 3.9 |
| 2025 Ontario Budget** | 5.4 | 5.3 | 3.1 | 3.0 | 4.0 |
| Labour Income | |||||
| FAO | 6.7 | 6.2 | 3.5 | 3.0 | 3.9 |
| 2025 Ontario Budget | 6.7 | 6.2 | 3.7 | 3.2 | 3.7 |
| Corporate Profits | |||||
| FAO | -4.2 | -0.9 | 0.4 | 3.1 | 4.2 |
| 2025 Ontario Budget | -4.2 | -0.9 | -3.0 | 6.4 | 6.2 |
| Household Consumption | |||||
| FAO | 5.1 | 5.0 | 4.4 | 3.2 | 3.9 |
| 2025 Ontario Budget | 5.1 | 5.0 | 3.5 | 3.1 | 3.8 |
| 2023a | 2024a | 2025f | 2026f | 2027f-2029f Average* | |
|---|---|---|---|---|---|
| Real GDP (% Change) | |||||
| FAO | 1.7 | 1.4 | 0.9 | 1.0 | 1.9 |
| 2025 Ontario Budget** | 1.7 | 1.4 | 0.8 | 1.0 | 1.9 |
| Employment (% Change) | |||||
| FAO | 3.1 | 1.7 | 0.9 | -0.2 | 0.9 |
| 2025 Ontario Budget | 3.1 | 1.7 | 0.9 | 0.4 | 0.9 |
| Unemployment Rate (%) | |||||
| FAO | 5.6 | 7.0 | 7.8 | 8.0 | 7.5 |
| 2025 Ontario Budget | 5.6 | 7.0 | 7.6 | 7.3 | 6.4 |
| CPI Inflation (% Change) | |||||
| FAO | 3.8 | 2.4 | 2.1 | 2.2 | 2.0 |
| 2025 Ontario Budget | 3.8 | 2.4 | 2.3 | 2.0 | 2.0 |
| 3-month Treasury Bill Rate (%) | |||||
| FAO | 4.8 | 4.3 | 2.6 | 2.4 | 2.4 |
| 2025 Ontario Budget | 4.8 | 4.3 | 2.4 | 2.3 | 2.5 |
| 10-year Government Bond Rate (%) | |||||
| FAO | 3.3 | 3.4 | 3.2 | 3.4 | 3.4 |
| 2025 Ontario Budget | 3.3 | 3.4 | 3.1 | 3.2 | 3.5 |
| ($ Billions) | 2023-24a | 2024-25f | 2025-26f | 2026-27f | 2027-28f | 2028-29f | 2029-30f |
|---|---|---|---|---|---|---|---|
| Revenue | |||||||
| Personal Income Tax | 50.8 | 57.2 | 57.0 | 59.4 | 62.2 | 65.1 | 68.0 |
| Annual Growth (%) | 14.8 | 12.6 | -0.4 | 4.2 | 4.7 | 4.6 | 4.5 |
| Sales Tax | 39.9 | 39.8 | 40.6 | 42.0 | 43.7 | 45.4 | 47.2 |
| Annual Growth (%) | 10.5 | -0.2 | 1.9 | 3.6 | 3.9 | 4.0 | 4.0 |
| Corporations Tax | 23.1 | 30.4 | 27.1 | 27.5 | 28.1 | 29.2 | 30.2 |
| Annual Growth (%) | -16.7 | 31.3 | -10.7 | 1.4 | 2.4 | 3.6 | 3.7 |
| All Other Taxes | 28.1 | 29.2 | 29.5 | 30.2 | 31.1 | 32.1 | 33.2 |
| Annual Growth (%) | -1.2 | 4.1 | 1.0 | 2.4 | 2.8 | 3.3 | 3.3 |
| Total Taxation Revenue | 141.9 | 156.6 | 154.2 | 159.1 | 165.1 | 171.7 | 178.6 |
| Annual Growth (%) | 3.9 | 10.4 | -1.5 | 3.2 | 3.7 | 4.0 | 4.0 |
| Transfers from Government of Canada | 34.3 | 36.1 | 38.9 | 39.7 | 40.1 | 41.5 | 43.0 |
| Annual Growth (%) | 9.8 | 5.1 | 7.7 | 2.1 | 1.0 | 3.4 | 3.7 |
| Income from Government Business Enterprises | 7.4 | 7.4 | 6.5 | 6.9 | 8.0 | 8.3 | 8.5 |
| Annual Growth (%) | 21.1 | -0.0 | -12.1 | 6.4 | 14.8 | 4.0 | 3.0 |
| Other Non-Tax Revenue | 25.4 | 25.2 | 21.9 | 21.4 | 21.7 | 22.4 | 23.2 |
| Annual Growth (%) | 23.8 | -1.0 | -12.8 | -2.6 | 1.4 | 3.5 | 3.6 |
| Total Revenue | 209.0 | 225.3 | 221.5 | 227.1 | 234.8 | 243.9 | 253.3 |
| Annual Growth (%) | 7.5 | 7.8 | -1.7 | 2.5 | 3.4 | 3.9 | 3.9 |
| Spending | |||||||
| Health | 85.2 | 91.2 | 95.3 | 99.4 | 103.1 | 108.2 | 113.5 |
| Annual Growth (%) | 9.0 | 6.7 | 4.4 | 4.3 | 3.7 | 5.0 | 4.8 |
| Education | 38.8 | 39.7 | 42.2 | 43.3 | 44.6 | 45.7 | 46.8 |
| Annual Growth (%) | 7.2 | 2.4 | 6.2 | 2.6 | 3.0 | 2.4 | 2.4 |
| Children, Community and Social Services | 19.3 | 20.5 | 21.6 | 22.2 | 22.8 | 23.4 | 24.0 |
| Annual Growth (%) | 7.6 | 5.5 | 5.3 | 2.9 | 3.0 | 2.3 | 2.6 |
| Postsecondary Education | 13.3 | 14.0 | 13.7 | 13.1 | 12.8 | 12.7 | 13.0 |
| Annual Growth (%) | 12.5 | 5.8 | -2.5 | -3.7 | -2.7 | -0.5 | 1.9 |
| Justice | 6.0 | 7.0 | 6.7 | 6.9 | 6.9 | 7.1 | 7.3 |
| Annual Growth (%) | 10.9 | 16.4 | -4.8 | 3.9 | -1.2 | 3.2 | 2.8 |
| Other Programs | 32.7 | 38.9 | 38.0 | 36.9 | 36.5 | 35.6 | 37.2 |
| Annual Growth (%) | -11.4 | 20.4 | -2.1 | -2.9 | -1.3 | -2.3 | 4.5 |
| Total Program Spending | 195.2 | 211.3 | 217.4 | 221.9 | 226.6 | 232.7 | 241.7 |
| Annual Growth (%) | 4.7 | 8.3 | 2.9 | 2.1 | 2.1 | 2.7 | 3.9 |
| Interest on Debt | 14.5 | 15.2 | 16.1 | 17.1 | 18.3 | 19.1 | 20.7 |
| Annual Growth (%) | 3.8 | 5.3 | 5.8 | 6.2 | 6.9 | 4.5 | 8.1 |
| Total Spending | 209.7 | 226.5 | 233.5 | 239.0 | 244.9 | 251.8 | 262.4 |
| Annual Growth (%) | 4.7 | 8.1 | 3.1 | 2.4 | 2.5 | 2.8 | 4.2 |
| Budget Balance, Net Debt and Fiscal Sustainability Indicators | |||||||
| Budget Balance | -0.6 | -1.3 | -12.0 | -11.8 | -10.1 | -7.9 | -9.0 |
| Accumulated Deficit | 244.3 | 245.6 | 257.5 | 269.4 | 279.5 | 287.4 | 296.5 |
| Net Debt | 408.0 | 423.4 | 453.4 | 483.7 | 508.8 | 530.0 | 549.3 |
| Net Debt-to-GDP (%) | 36.4 | 35.9 | 37.2 | 38.4 | 38.9 | 39.0 | 38.9 |
| Net Debt-to-Operating Revenue (%) | 198.1 | 190.0 | 206.5 | 214.7 | 218.3 | 218.9 | 218.4 |
| Net Interest-to-Operating Revenue (%) | 5.5 | 5.7 | 6.4 | 6.8 | 7.1 | 7.2 | 7.49 |
| Difference ($ billions) | 2024-25 | 2025-26 | 2026-27 | 2027-28 |
|---|---|---|---|---|
| Personal Income Tax | 0.9 | -0.8 | -1.9 | -3.0 |
| Sales Tax | 0.4 | 0.5 | 0.4 | 0.1 |
| Corporations Tax | 2.4 | 1.1 | -0.2 | -1.3 |
| All Other Taxes | 0.1 | -0.3 | -0.5 | -0.4 |
| Total Taxation Revenue | 3.8 | 0.5 | -2.1 | -4.7 |
| Transfers from Government of Canada | -0.3 | 0.0 | 0.3 | 0.3 |
| Income from Government Business Enterprises | 0.0 | 0.2 | 0.0 | 0.2 |
| Other Non-Tax Revenue | 0.2 | 0.9 | 1.0 | 1.0 |
| Total Revenue | 3.7 | 1.6 | -0.8 | -3.1 |
| Difference ($ billions) | 2024-25 | 2025-26 | 2026-27 | 2027-28 |
|---|---|---|---|---|
| Health | 0.7 | 4.1 | 7.0 | 9.5 |
| Education | -0.3 | -0.5 | 0.4 | 1.4 |
| Postsecondary Education | -0.2 | 0.7 | 0.0 | -0.0 |
| Children, Community and Social Services | -0.1 | 1.2 | 1.8 | 2.4 |
| Justice | -0.1 | -0.1 | 0.4 | 0.4 |
| Other Programs* | -0.9 | -4.3 | -4.4 | -5.0 |
| Interest on Debt | -0.0 | -0.1 | 0.1 | 0.5 |
| Total Spending Difference | -1.1 | 1.0 | 5.3 | 9.2 |
Footnotes
[1] Ontario nominal GDP grew by 11.0 per cent in 2021 and 9.4 per cent in 2022, reflecting the impact of high inflation, and marking the fastest two-year growth since 1987-1988.
[2] CREA Updates Resale Housing Market Forecast Amid Continuing Economic Uncertainty, The Canadian Real Estate Association, June 2025.
[3] For details, see the FAO’s Ontario’s Labour Market in 2024.
[4] Market Participants Survey: Second Quarter of 2025, Bank of Canada, August 2025.
[5] This report uses the term “Interest on Debt”, which was renamed to “Interest and Other Debt Servicing Charges” in the 2025 Ontario Budget (see page 182).
[6] Net debt as a share of GDP is a measure of the debt burden relative to the size of the economy and provides information on a government’s ability to raise funds to manage its debt obligations.
[7] Net debt-to-operating revenue is a measure of the debt burden and indicates the number of years it would take to eliminate a government’s net debt if all operating revenues were used for debt repayment. For example, a net debt-to-operating revenue ratio of 200 per cent means it would take two years to pay off a government’s net debt if all operating revenues were dedicated to debt repayment.
[8] The ratio of net interest-to-operating revenue is an indicator of budgetary flexibility – a higher ratio indicates that a government has a smaller share of revenue available to spend on programs.
[9] In 2024-25 temporary revenues include: tax revenue from prior years; an FAO estimated $1.8 billion from a tobacco company settlement; an accounting adjustment for the consolidation of nuclear funds for Ontario Power Generation, and higher than usual recoveries from prior year expenses.
[10] For more analysis on the government’s revenue projection see the FAO’s 2025 Ontario Budget Note.
[11] Examples of new programs during this period include the Renewable Cost Shift (2020-21, currently referred to as the Comprehensive Electricity Plan) and the start of the $10-a-day child care program in 2022-23.
[12] Examples of expanded programs include the expansion of hospital beds and the increase in hours of direct care provided to long-term care home residents.
[13] Benefit rates for the Ontario Disability Support Program are indexed to inflation, while benefit rates for the Ontario Works program are currently not scheduled to change.
[14] New Deal funding includes time-limited operating and capital support for public transit and homelessness.
[15] Table 7.5 in the Appendix provides a comparison by sector of the FAO’s spending projection to the 2025 budget’s spending forecast.
[16] Other risks include ongoing geopolitical tensions, the potential for higher inflation in the United States which could push up prices in Ontario through imports, and slower than projected global economic growth particularly for Ontario’s main trading partners. In addition, the FAO’s spending outlook does not include the estimated cost of some recently announced measures, as details on funding and design are not yet known. This includes the upload to the Province of the Gardiner Expressway, Don Valley Parkway and Ottawa Road 174.
[17] These scenarios use the same methodological assumptions from the low and high impact scenarios in the FAO’s The Potential Impacts of US Tariffs on the Ontario Economy.
[18] After this report was finalized, the Canadian government announced the removal of countermeasures on CUSMA-compliant US goods except for steel, aluminum and autos. This change is not expected to have a material impact to the FAO’s economic outlook.