


1. Summary
At the request of a Member of Provincial Parliament, this report reviews the Government of Ontario’s (the Province’s) Ministry of Education spending plan as outlined in the 2025 Ontario Budget.
Spending Plan Overview
- In the 2025 Ontario Budget, the Province projects that Ministry of Education spending will grow at an average annual rate of 2.5 per cent, from $40.1 billion in 2024-25 to $43.2 billion in 2027-28.
- This is a significantly slower pace than the 8.3 per cent average annual growth over the previous three years from 2021-22 to 2024-25.
- Over the 34-year period from 1990-91 to 2023-24, Ministry of Education spending grew at an average annual rate of 3.1 per cent.
- The FAO estimated Ministry of Education spending from 2025-26 to 2027-28 that would be required to maintain 2024-25 service levels. Also known as a cost driver forecast, this scenario does not recommend how spending should change but serves as a benchmark to show whether the 2025 budget’s Ministry of Education spending plan is likely to maintain, improve or reduce the quality and accessibility of ministry services.
- Overall, the FAO estimates that Ministry of Education spending would need to grow by an average annual rate of 3.2 per cent over the next three years to maintain current service levels.
- Comparing the Ministry of Education spending plan in the 2025 budget against the FAO’s cost driver projection by fiscal year:
- In 2025-26, the 2025 budget spending plan exceeds the FAO’s cost driver projection by $1.1 billion, meaning that there are sufficient funds to improve service levels compared to 2024-25.
- In 2026-27, the 2025 budget spending plan is consistent with the FAO’s cost driver projection, meaning that there are sufficient funds to maintain 2024-25 service levels.
- In 2027-28, the 2025 budget spending plan is below the FAO’s cost driver projection by $0.9 billion. This means that the Province will need to implement education program efficiencies (i.e., provide the same level of services with less resources) and/or commit additional funding to the ministry to maintain 2024-25 service levels.
Spending Plan Analysis: School Boards
- The Ministry of Education provides operating funding to school boards based on its estimate of required spending on teachers, transportation, facilities and other services.
- In 2024-25, real per-student provincial operating funding to school boards was $14,504, the lowest level over the last 10 years. Going forward, the FAO estimates that the 2025 budget spending plan will increase real provincial operating funding to school boards to $14,521 per student in 2025-26 and $14,685 per student in 2026-27, before declining to $14,111 per student in 2027-28.
- Total school board operating spending reflects actual expenditures by school boards based on funds received from the Province and from other sources.
- In 2024-25, real per-student school board operating spending was $14,997, above the inflation-adjusted average of $14,865 over the last 10 years. Based on the 2025 budget spending plan, the FAO estimates that real per-student spending will increase to $15,068 in 2025-26, before declining to $14,778 in 2027-28.
Spending Plan Analysis: Child Care
- The Ministry of Education administers and funds licensed child care programs in Ontario, including the Canada-wide Early Learning and Child Care (CWELCC) program and other provincial subsidies for licensed child care spaces, the Ontario Child Care Tax Credit, EarlyON child and family centres, and First Nations licensed child care.
- In 2024-25, there were 532,573 licensed child care spaces in centres in Ontario for children aged zero to 12, an increase of 143,287 spaces (36.8 per cent) since 2015-16. Between 2015-16 and 2024-25, licensed child care spaces as a share of the Ontario population aged 12 and under increased from 20.3 per cent to 26.3 per cent.
- In 2022, the Province announced a five-year agreement with the federal government to lower child care fees and expand child care spaces for children under the age of six. Under the Canada-wide Early Learning and Child Care (CWELCC) program, the Province committed to reduce the cost of licensed child care for children under the age of six to an average of $10 per day by September 2025, which was subsequently revised to March 2026. Additionally, the Province set a target to create 86,000 new child care spaces relative to the end of 2018-19, for a total of 375,111 spaces that would be enrolled in the new CWELCC program by the end of 2026.
- The FAO estimates that the CWELCC program will cost $4.2 billion in 2025-26, $5.2 billion in 2026-27 and $5.4 billion in 2027-28. This estimate assumes that the average daily cost for child care is reduced to $10 by the end of March 2026 and the Province is able to reach its target of 375,111 licensed child care spaces enrolled in the CWELCC program by the end of 2026.[1]
- Under the current Canada-Ontario CWELCC agreement, which is scheduled to expire in March 2026, the FAO estimates that there are sufficient funds remaining to support the cost of the CWELCC program in 2025-26.
- After 2025-26, both the federal government and the Province have indicated their intention to renew the CWELCC agreement; however, as of the writing of this report, a renewal has not been reached. In March 2025, the federal government announced a funding commitment of $16.8 billion over five years to support the renewal of the Canada-Ontario CWELCC agreement, including an estimated $3.2 billion in 2026-27 and $3.3 billion in 2027-28. Based on the federal government’s proposed funding levels, the FAO estimates that there would be a federal funding shortfall for the CWELCC program of $1.9 billion in 2026-27 and $2.0 billion in 2027-28.
Interprovincial Comparison
- In 2022-23, Ontario’s school board spending per student was $15,012, $302 below the national average of $15,313. Compared to other large provinces, Ontario’s spending was higher than in British Columbia ($14,116) and Alberta ($13,627) but lower than in Quebec ($18,617).
- In 2023-24, Ontario’s child care spending per child aged zero to 12 was $2,199, $455 below the national average of $2,654. Ontario’s spending was higher than in Alberta ($1,639) but lower than in British Columbia ($2,655) and Quebec ($4,339).
2. Introduction
This report reviews the Government of Ontario’s (the Province’s) Ministry of Education spending plan as outlined in the 2025 Ontario Budget.
This analysis was undertaken in response to a request from a Member of Provincial Parliament and is part of a planned series that reviews the spending plans for five ministries: Health; Long-Term Care; Education; Colleges, Universities, Research Excellence and Security; and Children, Community and Social Services.
The report is organized as follows:
- Chapter 3 reviews the Province’s Ministry of Education spending plan in the 2025 Ontario Budget against both historical ministry spending and estimated ministry cost drivers. The cost driver analysis includes the FAO’s projection for Ministry of Education spending required to maintain current service levels.
- Chapter 4 estimates the impact of the Province’s spending plan on two program areas: school board operations and child care.
- Chapter 5 provides an interprovincial comparison of per-capita school board and child care spending.
For additional information on the Ministry of Education’s 2025-26 spending plan, see the FAO’s Examining Ontario’s 2025-26 Expenditure Estimates, which compares planned spending against actual spending over the previous four years to the standard account level of detail.
3. Spending Plan Overview
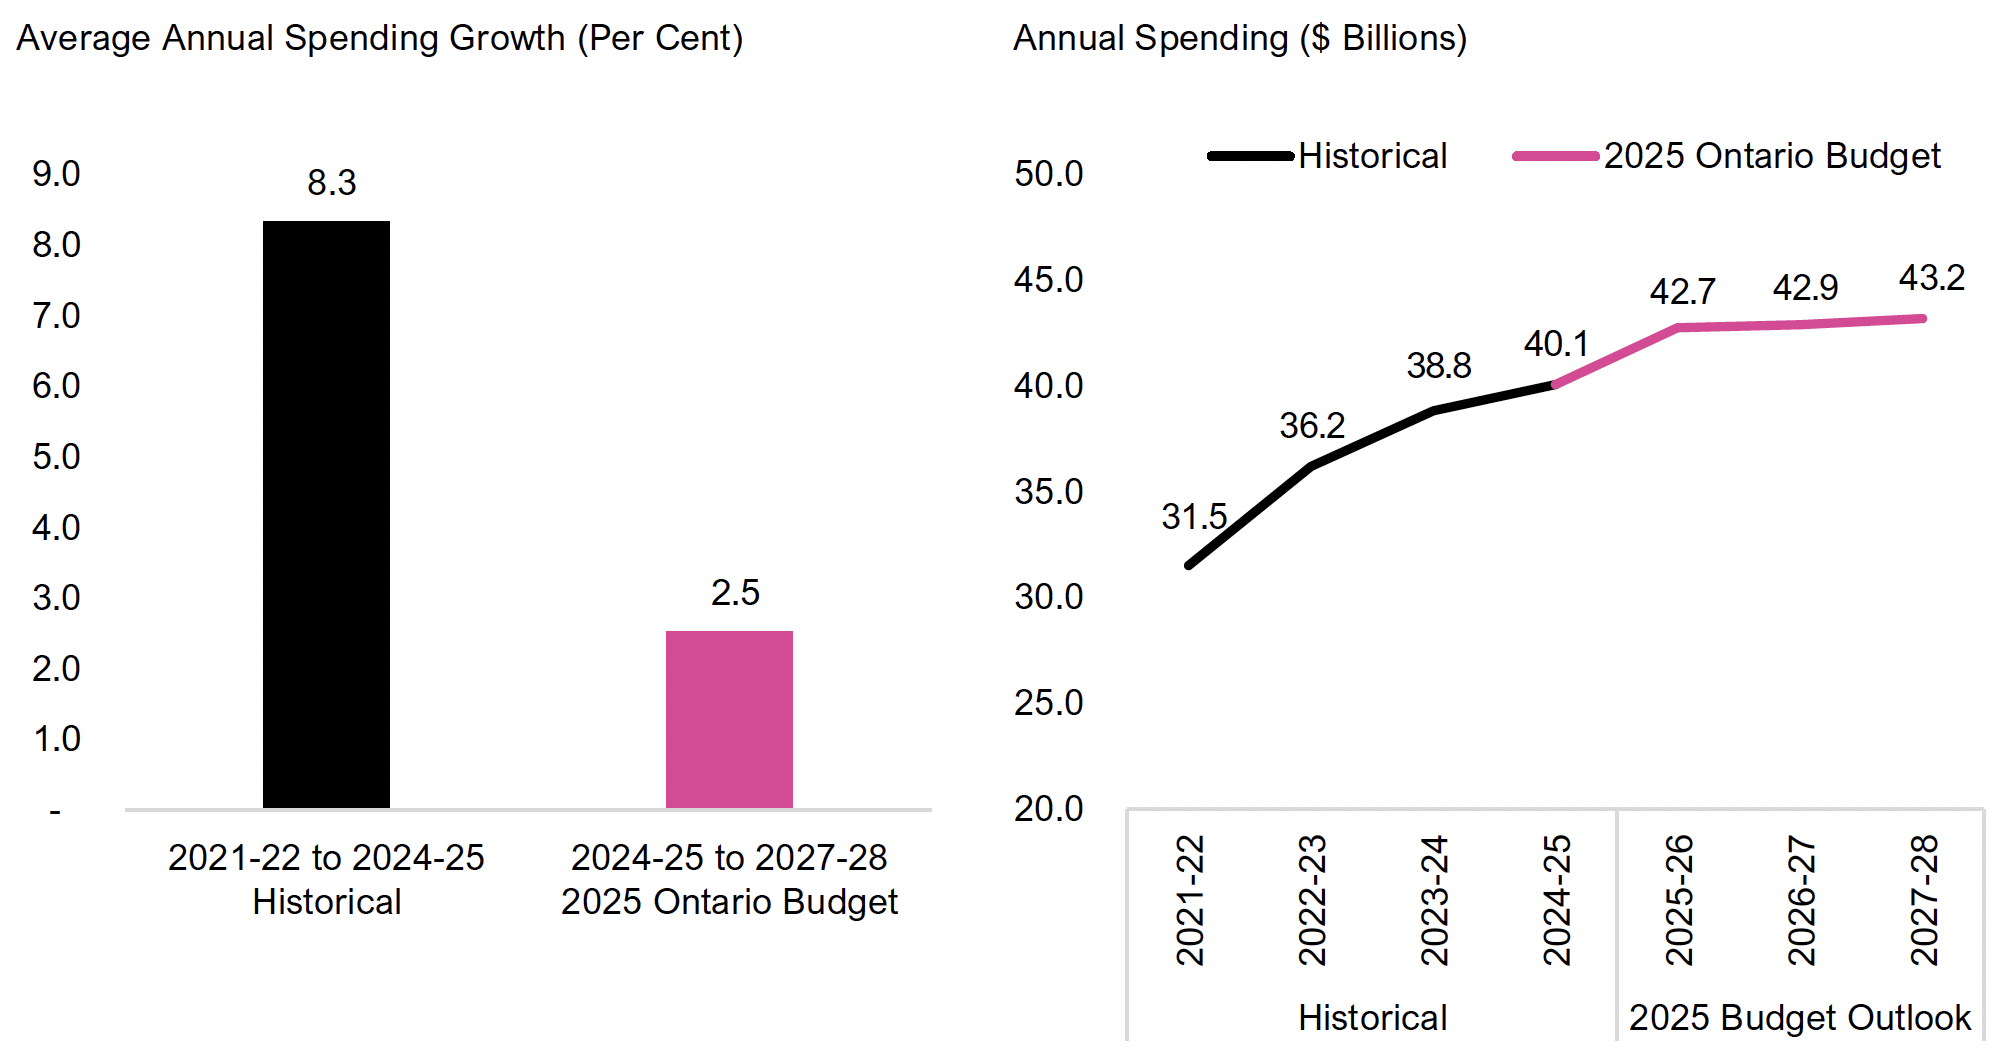
In the 2025 Ontario Budget, the Province projects that Ministry of Education spending will grow at an average annual rate of 2.5 per cent, from $40.1 billion in 2024-25 to $43.2 billion in 2027-28. This is a significantly slower pace than the 8.3 per cent average annual growth over the previous three years from 2021-22 to 2024-25.
Figure 3.1 Ministry of Education spending plan in the 2025 Ontario Budget
Note: Historical values are not restated for program transfers or reclassifications, if any.
Source: Ontario Public Accounts and the 2025 Ontario Budget.
Accessible version
Average Annual Spending Growth (Per Cent)
| 2021-22 to 2024-25 Historical |
2024-25 to 2027-28 2025 Ontario Budget |
|---|---|
| 8.3 | 2.5 |
Annual Spending ($ Billions)
| Historical | 2025 Ontario Budget | ||
|---|---|---|---|
| Historical | 2021-22 | 31.5 | |
| Historical | 2022-23 | 36.2 | |
| Historical | 2023-24 | 38.8 | |
| Historical | 2024-25 | 40.1 | |
| 2025 Budget Outlook | 2025-26 | 42.7 | |
| 2025 Budget Outlook | 2026-27 | 42.9 | |
| 2025 Budget Outlook | 2027-28 | 43.2 |
For context, over the 34-year period from 1990-91 to 2023-24, Ministry of Education spending grew at an average annual rate of 3.1 per cent.[2] The Province’s spending plan in the 2025 budget calls for slower spending growth compared to the 34-year average.
Spending Plan Compared to Cost Drivers
At the request of the Member of Provincial Parliament, the FAO estimated Ministry of Education spending from 2025-26 to 2027-28 that would be required to maintain 2024-25 services levels. Also known as a cost driver forecast, this scenario does not recommend how spending should change but serves as a benchmark to show whether the 2025 budget’s Ministry of Education spending plan is likely to maintain, improve or reduce the quality and accessibility of education services.
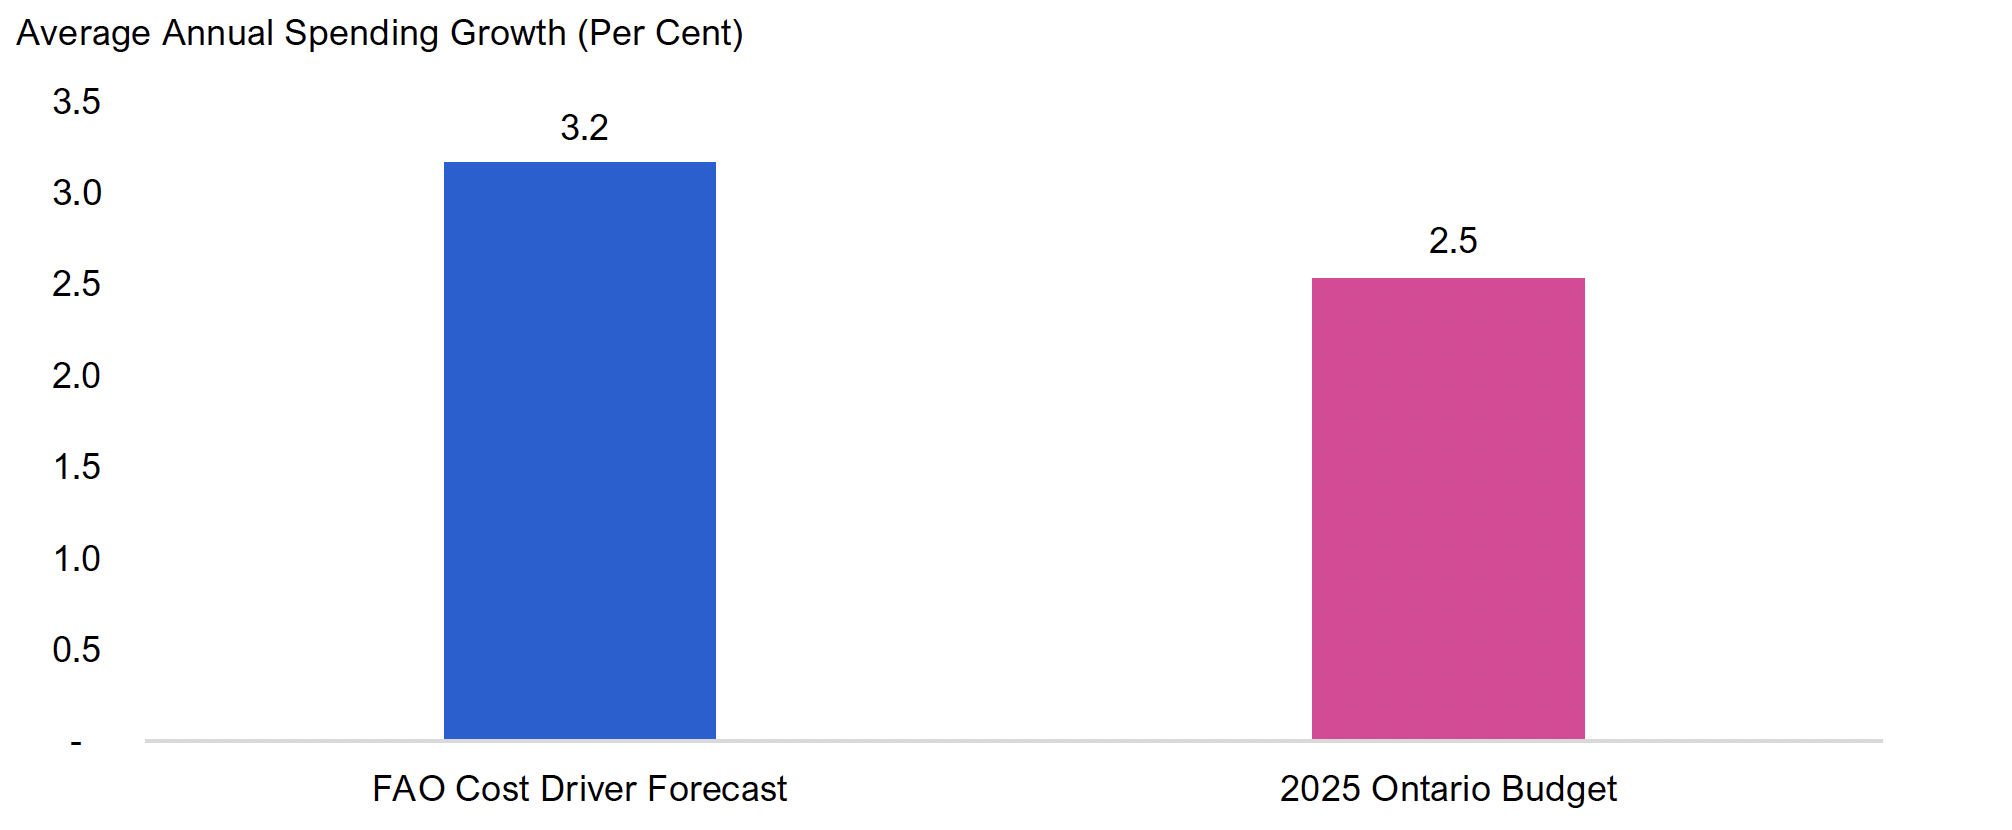
Overall, the FAO estimates that Ministry of Education spending would need to grow by an average annual rate of 3.2 per cent over the next three years to maintain current education service levels. The components of the FAO’s cost driver forecast vary by program area:
- School board operations: The FAO estimates that spending would need to grow by an average annual rate of 3.0 per cent to maintain 2024-25 service levels. This estimate is based on projected elementary and secondary school enrolment, and education sector inflation, which reflects the rising costs of compensation, classroom supplies and services.
- Child care: The FAO estimates that operating spending would need to grow by an average annual rate of 5.9 per cent to maintain 2024-25 service levels. Importantly, in January 2025, the Province reduced the average daily child care fee under the Canada-wide Early Learning and Child Care (CWELCC) program from $23 to $19 and enhanced the program’s funding formula. Maintaining these in-year program changes are expected to contribute significantly to cost driver growth.[3]
- Going forward, in order to maintain 2024-25 service levels, the FAO assumes that the average $19 daily fee will be adjusted with inflation and the number of licensed child care spaces participating in the CWELCC program will increase with child population growth.[4]
- Other ministry programs: Other programs include ministry operations, the Ontario Teachers’ Pension Plan (OTPP), school board capital and other education programs. The FAO estimates that spending would need to grow by an average annual rate of 1.6 per cent to maintain 2024-25 service levels.
Figure 3.2 Comparing Ministry of Education spending growth, FAO cost driver forecast vs. 2025 Ontario Budget, 2024-25 to 2027-28
Source: 2024-25 Public Accounts of Ontario, 2025 Ontario Budget and FAO analysis.
Accessible version
Average Annual Spending Growth (Per Cent)
| FAO Cost Driver Forecast | 2025 Ontario Budget |
|---|---|
| 3.2 | 2.5 |
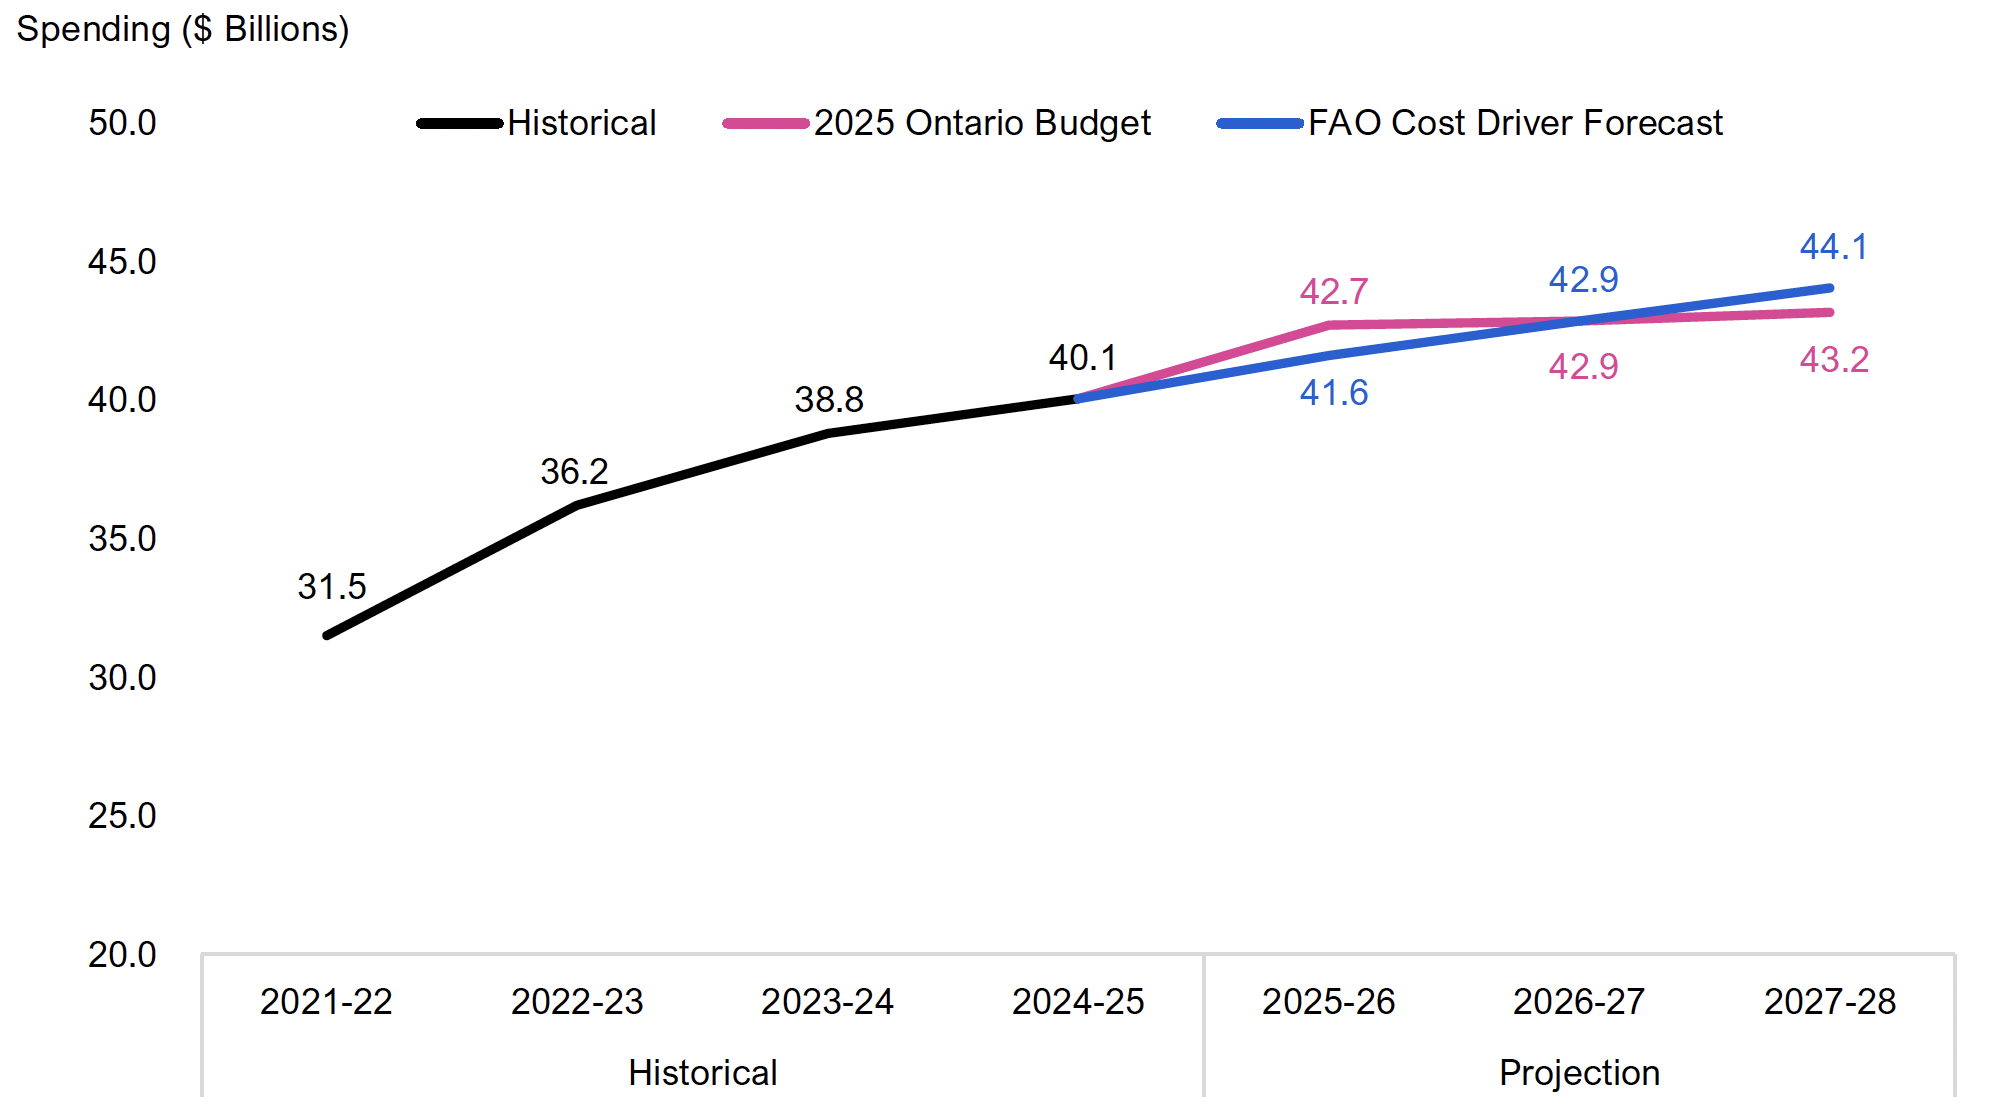
Comparing the Ministry of Education spending plan in the 2025 budget against the FAO’s cost driver projection by fiscal year:
- In 2025-26, the 2025 budget spending plan exceeds the FAO’s cost driver projection by $1.1 billion, meaning that there are sufficient funds to improve service levels compared to 2024-25.
- In 2026-27, the 2025 budget spending plan is consistent with the FAO’s cost driver projection, meaning that there are sufficient funds to maintain 2024-25 service levels.
- In 2027-28, the 2025 budget spending plan is below the FAO’s cost driver projection by $0.9 billion. This means that the Province will need to implement education program efficiencies (i.e., provide the same level of services with less resources) and/or commit additional funding to the ministry to maintain 2024-25 service levels.
Importantly, under the CWELCC program, the Province has committed to reduce average daily fees from the current level of $19 a day to $10 a day by the end of March 2026, and enroll an additional estimated 33,090 licensed child care spaces in 2026 to achieve its target of 375,111 licensed child care spaces enrolled in the CWELCC program by the end of 2026. To achieve these service level improvements, ministry spending in 2026-27 and 2027-28 would need to exceed the FAO’s cost driver projection.
Figure 3.3 FAO cost driver projection and Ministry of Education spending plan in the 2025 Ontario Budget
Note: Historical values are not restated for program transfers or reclassifications, if any.
Source: Ontario Public Accounts, 2025 Ontario Budget and FAO analysis of information provided by the Province.
Accessible version
Annual Spending ($ Billions)
| Historical | FAO Cost Driver Forecast | 2025 Ontario Budget | ||
|---|---|---|---|---|
| Historical | 2021-22 | 31.5 | ||
| Historical | 2022-23 | 36.2 | ||
| Historical | 2023-24 | 38.8 | ||
| Historical | 2024-25 | 40.1 | ||
| Projection | 2025-26 | 41.6 | 42.7 | |
| Projection | 2026-27 | 42.9 | 42.9 | |
| Projection | 2027-28 | 44.1 | 43.2 |
4. Spending Plan Analysis
At the request of the Member of Provincial Parliament, the FAO analyzed the impact of the Province’s Ministry of Education spending plan in the 2025 Ontario Budget on two key program areas: school board operations and child care.
School Board Operations
School boards’ operating expenditures are primarily funded from transfers from the Province,[5] with a smaller share from other sources such as fundraising, investments and international student fees. School boards have flexibility to allocate funds according to local priorities, provided they balance their budgets and meet ministry reporting requirements. As a result, provincial funding to school boards can differ from actual school board spending.
School board operating funding
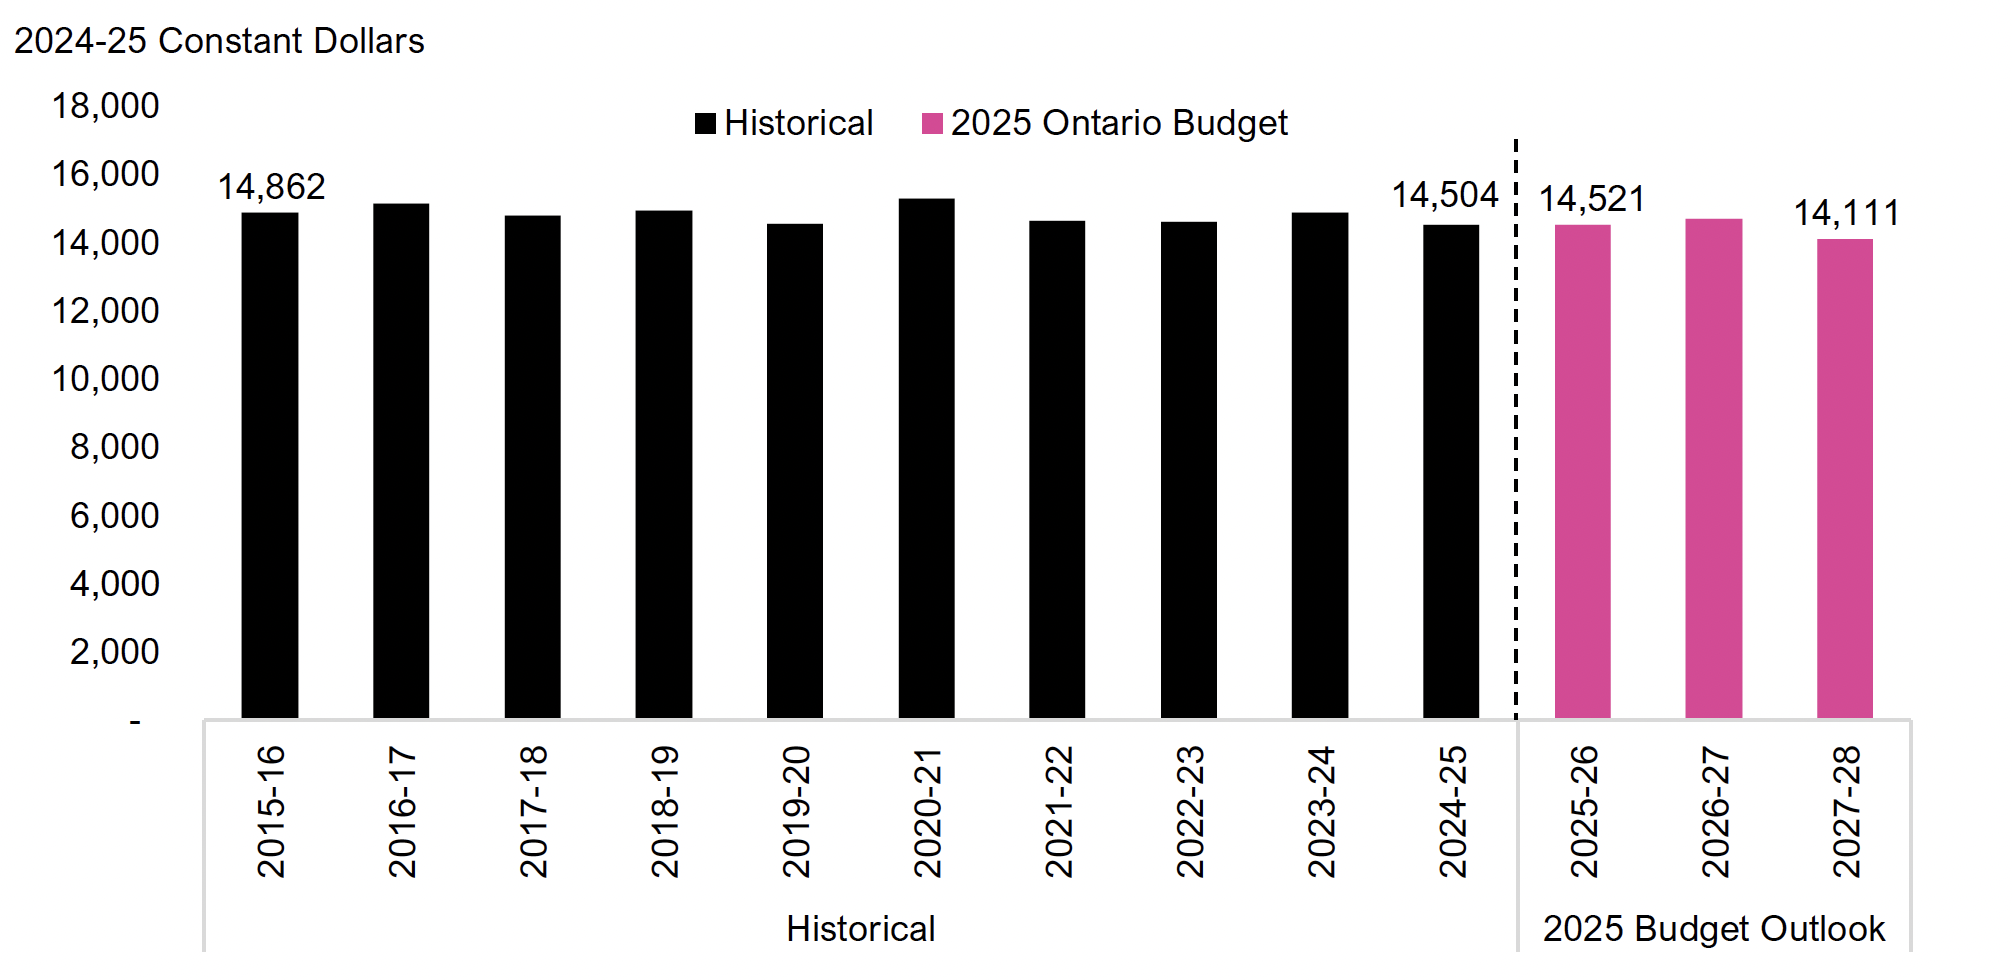
The Ministry of Education provides operating funding to school boards based on its estimate of required spending on teachers, transportation, facilities and other services.[6] In 2024-25, real per-student provincial operating funding to school boards was $14,504, the lowest level over the last 10 years.
Going forward, the FAO estimates that the 2025 budget Ministry of Education spending plan will increase real provincial operating funding to school boards to $14,521 per student in 2025-26 and $14,685 per student in 2026-27, before declining to $14,111 per student in 2027-28.
Figure 4.1 Historical and projected real per-student provincial school board operating funding, 2015-16 to 2027-28
Source: FAO analysis of information provided by the Province.
Accessible version
2024-25 Constant Dollars
| Historical | 2025 Ontario Budget | ||
|---|---|---|---|
| Historical | 2015-16 | 14,862 | |
| Historical | 2016-17 | 15,132 | |
| Historical | 2017-18 | 14,776 | |
| Historical | 2018-19 | 14,923 | |
| Historical | 2019-20 | 14,539 | |
| Historical | 2020-21 | 15,296 | |
| Historical | 2021-22 | 14,640 | |
| Historical | 2022-23 | 14,620 | |
| Historical | 2023-24 | 14,866 | |
| Historical | 2024-25 | 14,504 | |
| 2025 Budget Outlook | 2025-26 | 14,521 | |
| 2025 Budget Outlook | 2026-27 | 14,685 | |
| 2025 Budget Outlook | 2027-28 | 14,111 |
School board operating spending
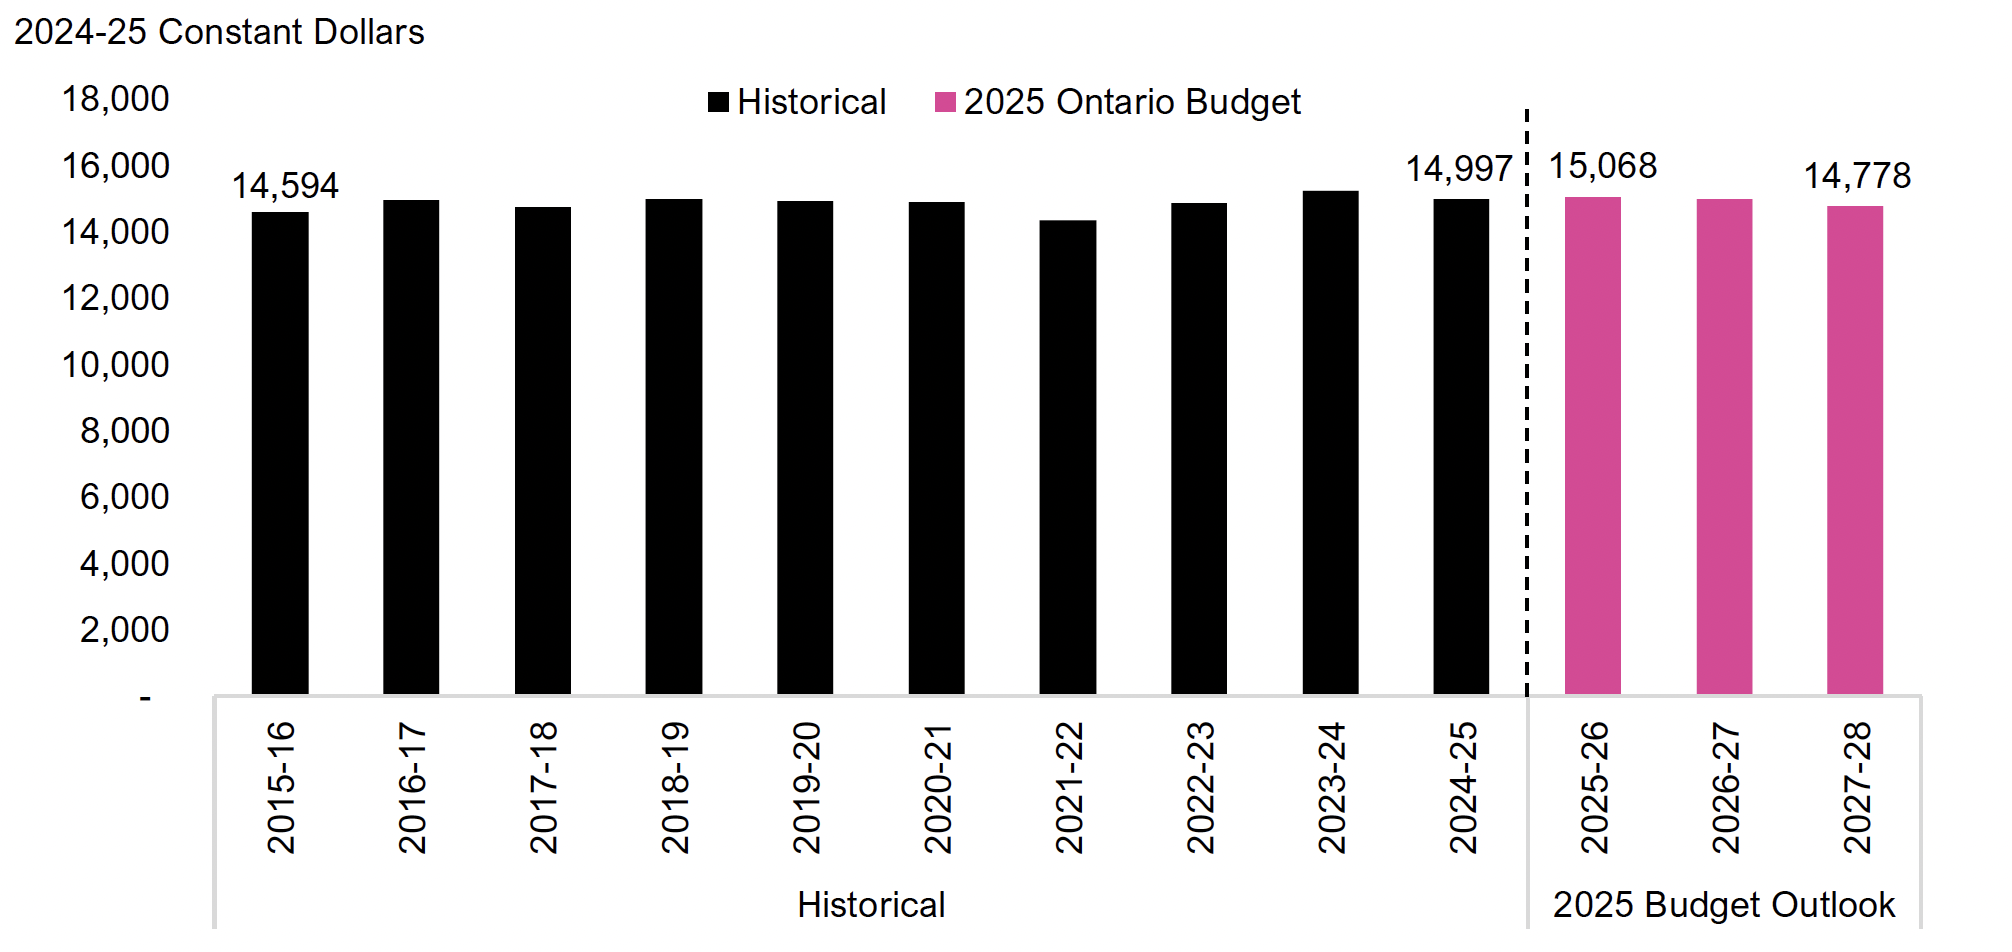
School board operating spending reflects actual expenditures by school boards based on funds received from the Province and from other sources. In 2024-25, real per-student school board operating spending was $14,997, above the average of $14,865 over the last 10 years.
Based on the 2025 budget Ministry of Education spending plan, the FAO estimates that real per-student school board spending will increase to $15,068 in 2025-26, before declining to $14,778 in 2027-28.
Figure 4.2 Historical and projected real per-student school board operating spending, 2015-16 to 2027-28
Source: FAO analysis of information provided by the Province.
Accessible version
2024-25 Constant Dollars
| Historical | 2025 Ontario Budget | ||
|---|---|---|---|
| Historical | 2015-16 | 14,594 | |
| Historical | 2016-17 | 14,982 | |
| Historical | 2017-18 | 14,764 | |
| Historical | 2018-19 | 14,985 | |
| Historical | 2019-20 | 14,939 | |
| Historical | 2020-21 | 14,907 | |
| Historical | 2021-22 | 14,368 | |
| Historical | 2022-23 | 14,867 | |
| Historical | 2023-24 | 15,243 | |
| Historical | 2024-25 | 14,997 | |
| 2025 Budget Outlook | 2025-26 | 15,068 | |
| 2025 Budget Outlook | 2026-27 | 14,997 | |
| 2025 Budget Outlook | 2027-28 | 14,778 |
Child Care
The Ministry of Education administers and funds licensed child care programs in Ontario, including the Canada-wide Early Learning and Child Care (CWELCC) program and other provincial subsidies for licensed child care spaces, the Ontario Child Care Tax Credit, EarlyON child and family centres, and First Nations licensed child care.
Licensed child care spaces
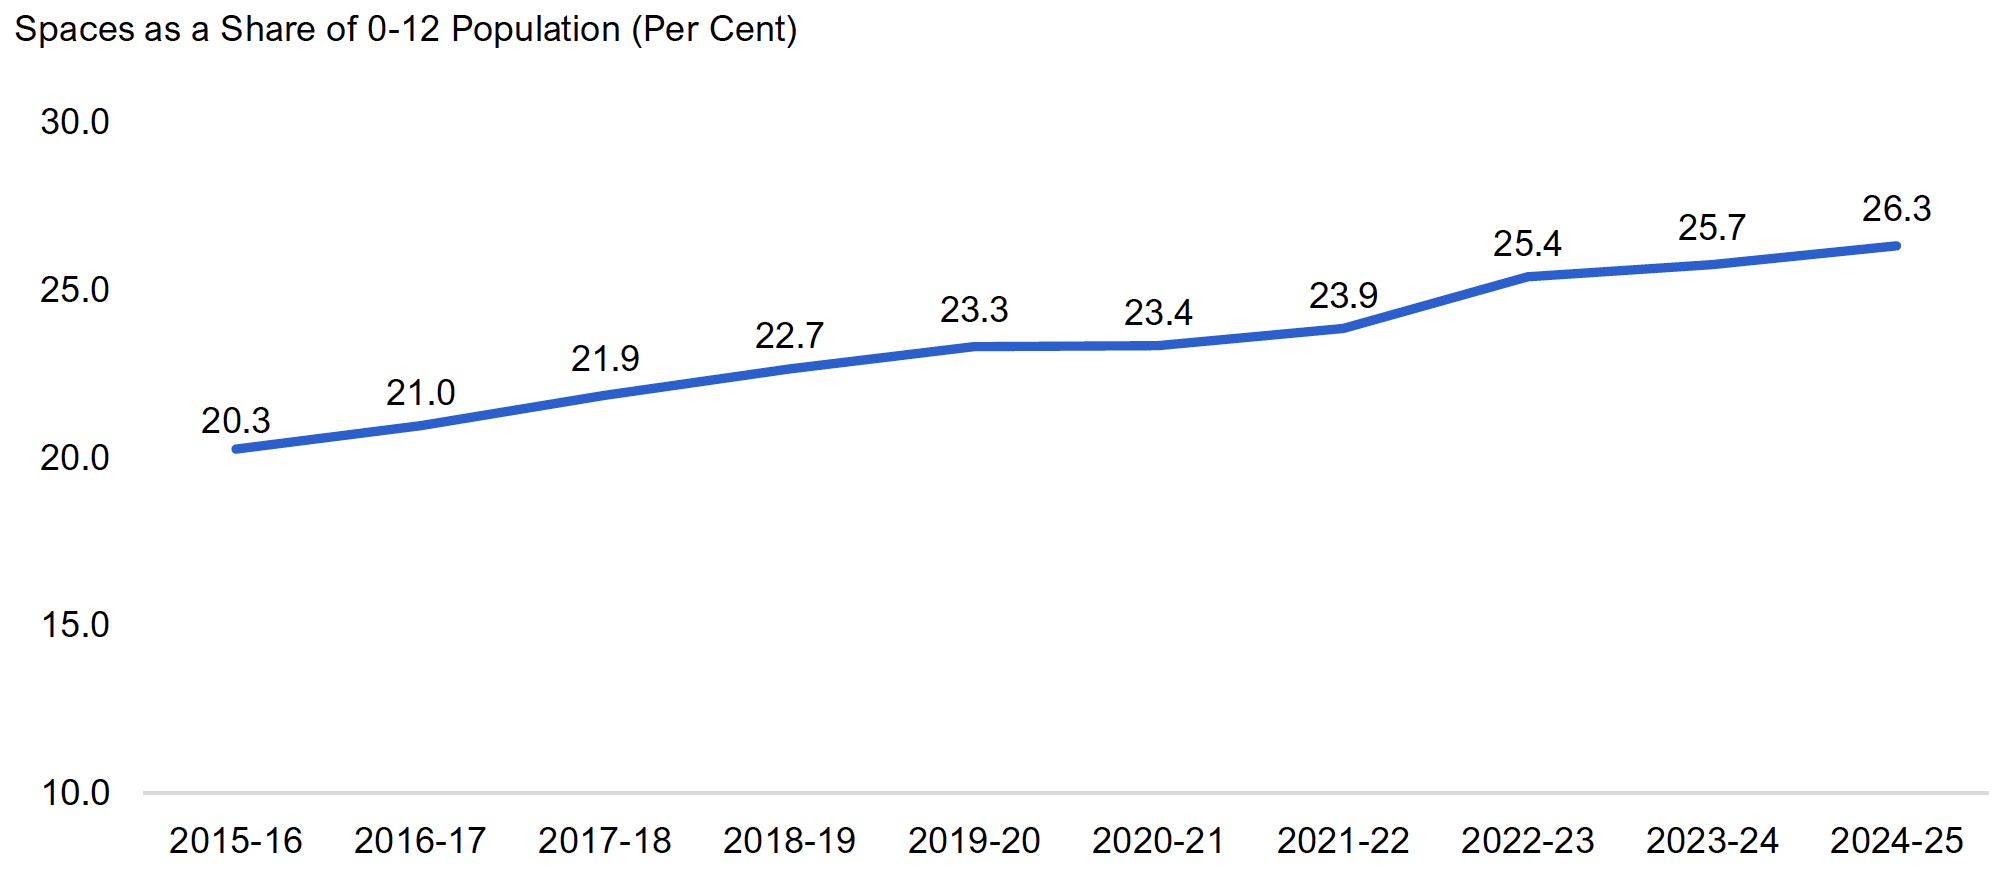
In 2024-25, there were 532,573 licensed child care spaces in centres in Ontario for children aged zero to 12, an increase of 143,287 spaces (36.8 per cent) since 2015-16.[7] Between 2015-16 and 2024-25, licensed child care spaces in centres as a share of the Ontario population aged 12 and under increased from 20.3 per cent to 26.3 per cent.
Figure 4.3 Licensed child care spaces in centres as a share of the Ontario population aged zero to 12, 2015-16 to 2024-25
Note: Licensed child care in Ontario is also provided through home agencies. In 2023-24, there were 22,215 children aged 0 to 12 enrolled in licensed child care home agencies.
Source: FAO analysis of information provided by the Province.
Accessible version
Spaces as a Share of 0-12 Population
| Spaces as a Share of 0-12 Population | |
|---|---|
| 2015-16 | 20.3% |
| 2016-17 | 21.0% |
| 2017-18 | 21.9% |
| 2018-19 | 22.7% |
| 2019-20 | 23.3% |
| 2020-21 | 23.4% |
| 2021-22 | 23.9% |
| 2022-23 | 25.4% |
| 2023-24 | 25.7% |
| 2024-25 | 26.3% |
Overview of the Canada-wide Early Learning and Child Care Program
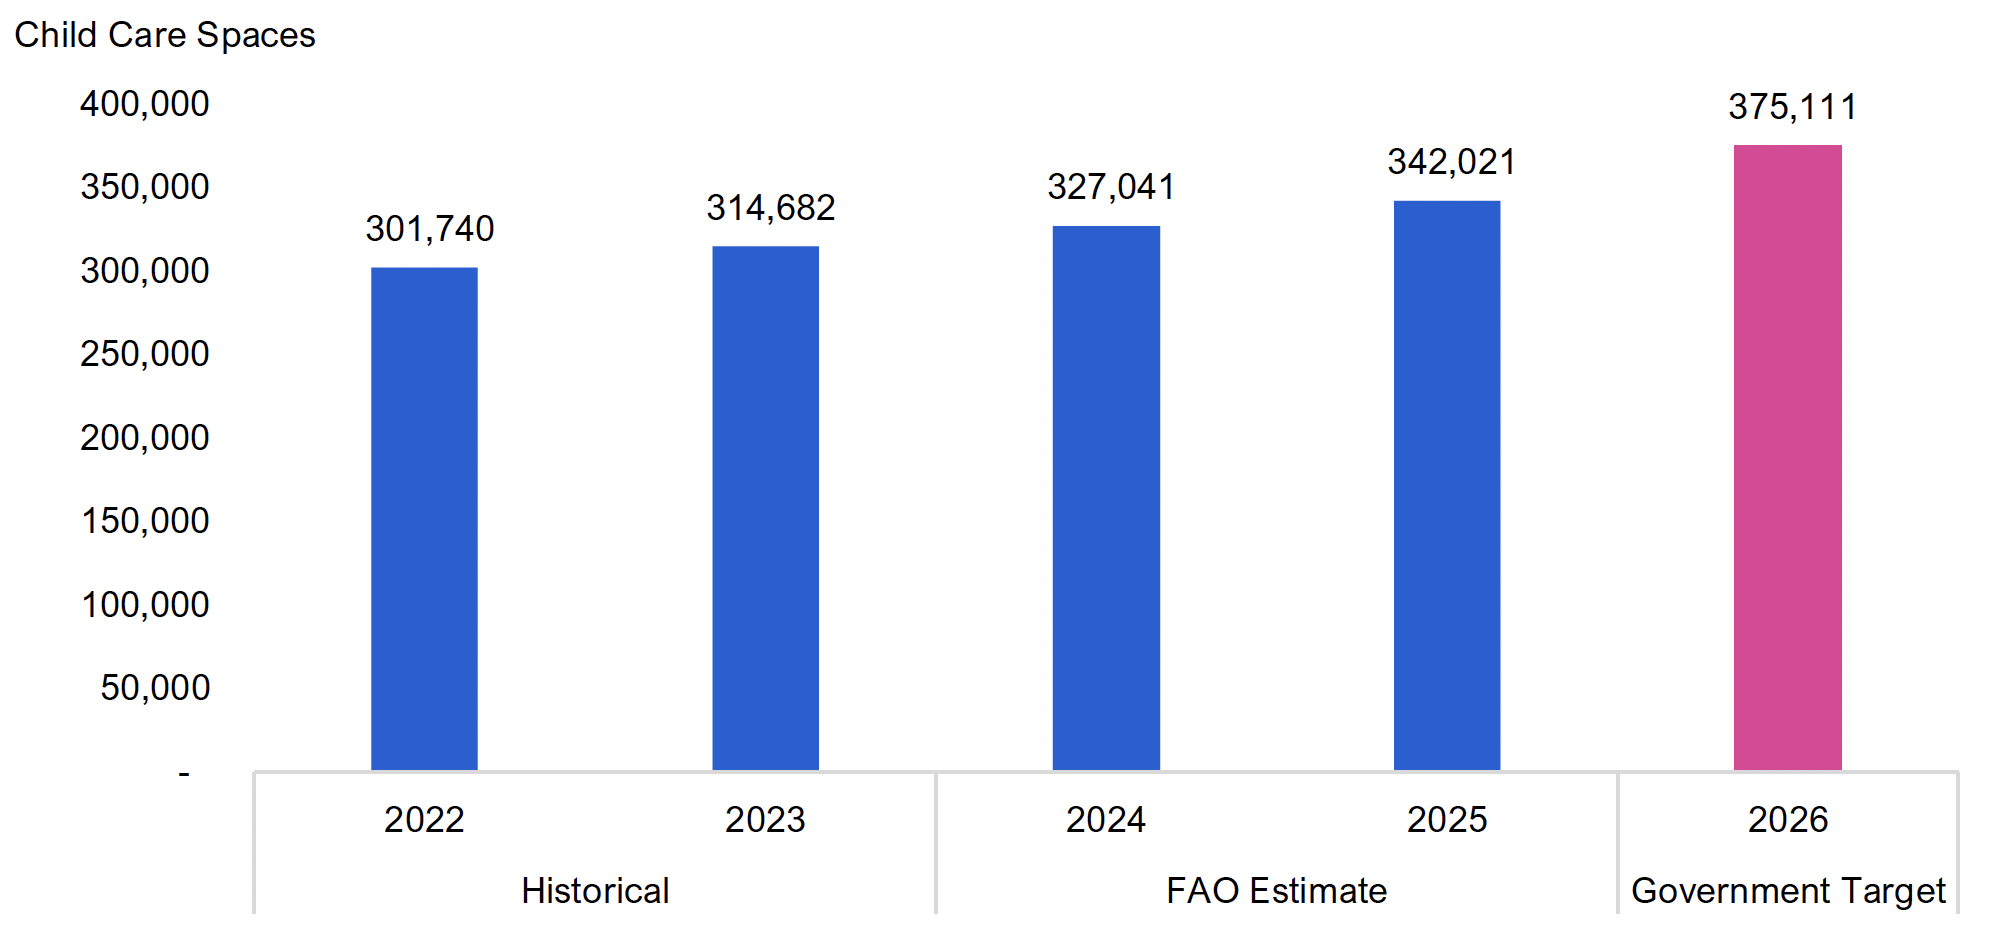
In 2022, the Province announced a five-year agreement with the federal government to lower child care fees and expand child care spaces for children under the age of six. Under the Canada-wide Early Learning and Child Care (CWELCC) program, the Province committed to reduce the cost of licensed child care for children under the age of six to an average of $10 per day by September 2025, which was subsequently revised to the end of March 2026. Additionally, under the CWELCC agreement, the Province set a target to create 86,000 new child care spaces for children under the age of six relative to the end of 2018-19, for a total of 375,111 spaces that would be enrolled in the new CWELCC program by the end of 2026.
When the CWELCC program was launched in 2022, child care providers representing 301,740 licensed child care spaces enrolled in the CWELCC program. In 2023, an additional 12,942 spaces were created, for a total of 314,682 licensed child care spaces enrolled in the CWELCC program. The FAO estimates that in 2024 and 2025, an additional 12,359 spaces and 14,980 spaces were created, respectively.[8] Consequently, the FAO estimates that the Province will need to create an additional 33,090 licensed child care spaces in 2026 to achieve its target of 375,111 licensed child care spaces enrolled in the CWELCC program. This would be more than double the average annual increase in spaces over the previous three years.
Figure 4.4 Canada-wide Early Learning and Child Care (CWELCC) program child care spaces, 2022 to 2026
Source: FAO analysis of information provided by the Province and the Ontario Early Years and Child Care Annual Report 2024.
Accessible version
Child Care Spaces
| Historical | FAO Estimate | Government Target | |
|---|---|---|---|
| 2022 | 301,740 | ||
| 2023 | 314,682 | ||
| 2024 | 327,041 | ||
| 2025 | 342,021 | ||
| 2026 | 375,111 |
Cost of the CWELCC program
The FAO estimates that the CWELCC program will cost $4.2 billion in 2025-26, $5.2 billion in 2026-27 and $5.4 billion in 2027-28. This estimate assumes that the average daily cost for child care is reduced to $10 by the end of March 2026 and the Province is able to reach its target of 375,111 licensed child care spaces enrolled in the CWELCC program by the end of 2026.[9]
Under the current Canada-Ontario CWELCC agreement, which is scheduled to expire in March 2026, the FAO estimates that there are sufficient funds remaining to support the cost of the CWELCC program in 2025-26.
After 2025-26, both the federal government and the Province have indicated their intention to renew the CWELCC agreement; however, as of the writing of this report, a renewal has not been reached. In March 2025, the federal government announced a funding commitment of $16.8 billion over five years to support the renewal of the Canada-Ontario CWELCC agreement, including an estimated $3.2 billion in 2026-27 and $3.3 billion in 2027-28.[10] Based on the federal government’s proposed funding levels, the FAO estimates that there would be a federal funding shortfall for the CWELCC program of $1.9 billion in 2026-27 and $2.0 billion in 2027-28.[11]
5. Interprovincial Comparison
At the request of the Member of Provincial Parliament, this chapter compares Ontario’s per-capita school board and child care spending with spending in other provinces.
School Board Spending
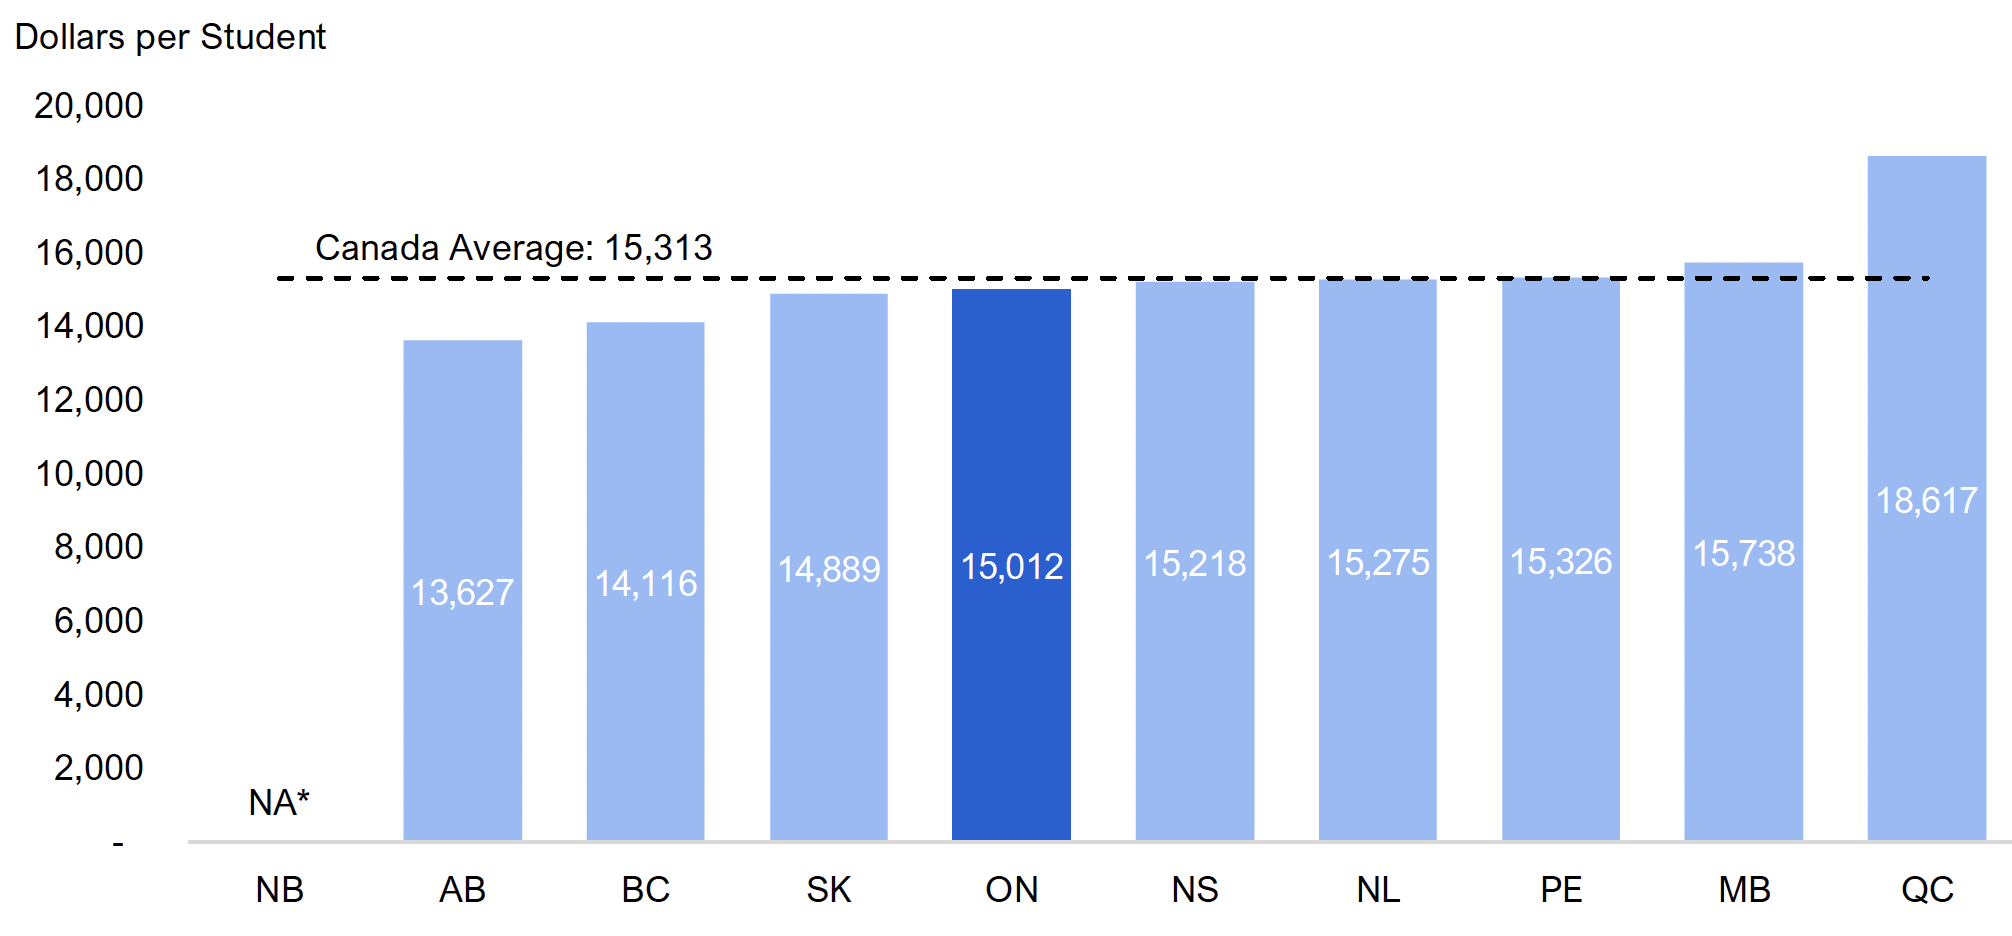
In 2022-23, Ontario had the fourth lowest school board spending per student among the provinces.[12] Ontario’s school board spending per student was $15,012, which was $302 below the national average of $15,313. Compared to other large provinces, Ontario’s spending was higher than in British Columbia ($14,116) and Alberta ($13,627) but lower than in Quebec ($18,617).
Figure 5.1 School board spending per student by province in 2022-23
Note: Canada average excludes territories. Ontario total school board spending per student differs from Figure 4.2, which shows school board operating spending only, as reported in Ontario’s 2022-23 Public Accounts, in 2024-25 dollars. * Comparable data not available.
Source: Statistics Canada, Table 10-10-0019-01 and Table 37-10-0007-01 and FAO analysis.
Accessible version
Dollars per Student
| Province | Dollars per Student |
|---|---|
| NB | NA* |
| AB | 13,627 |
| BC | 14,116 |
| SK | 14,889 |
| ON | 15,012 |
| NS | 15,218 |
| NL | 15,275 |
| PEI | 15,326 |
| MB | 15,738 |
| QC | 18,617 |
| Canada Average | 15,313 |
Child Care Spending
In 2023-24, Ontario had the fifth lowest child care spending per child aged zero to 12 among the provinces.[13] Ontario’s child care spending per child was $2,199, which was $455 below the national average of $2,654. Compared to other large provinces, Ontario’s spending was higher than in Alberta ($1,639) but lower than in British Columbia ($2,655) and Quebec ($4,339).
Figure 5.2 Child care spending per child aged zero to 12 by province in 2023-24
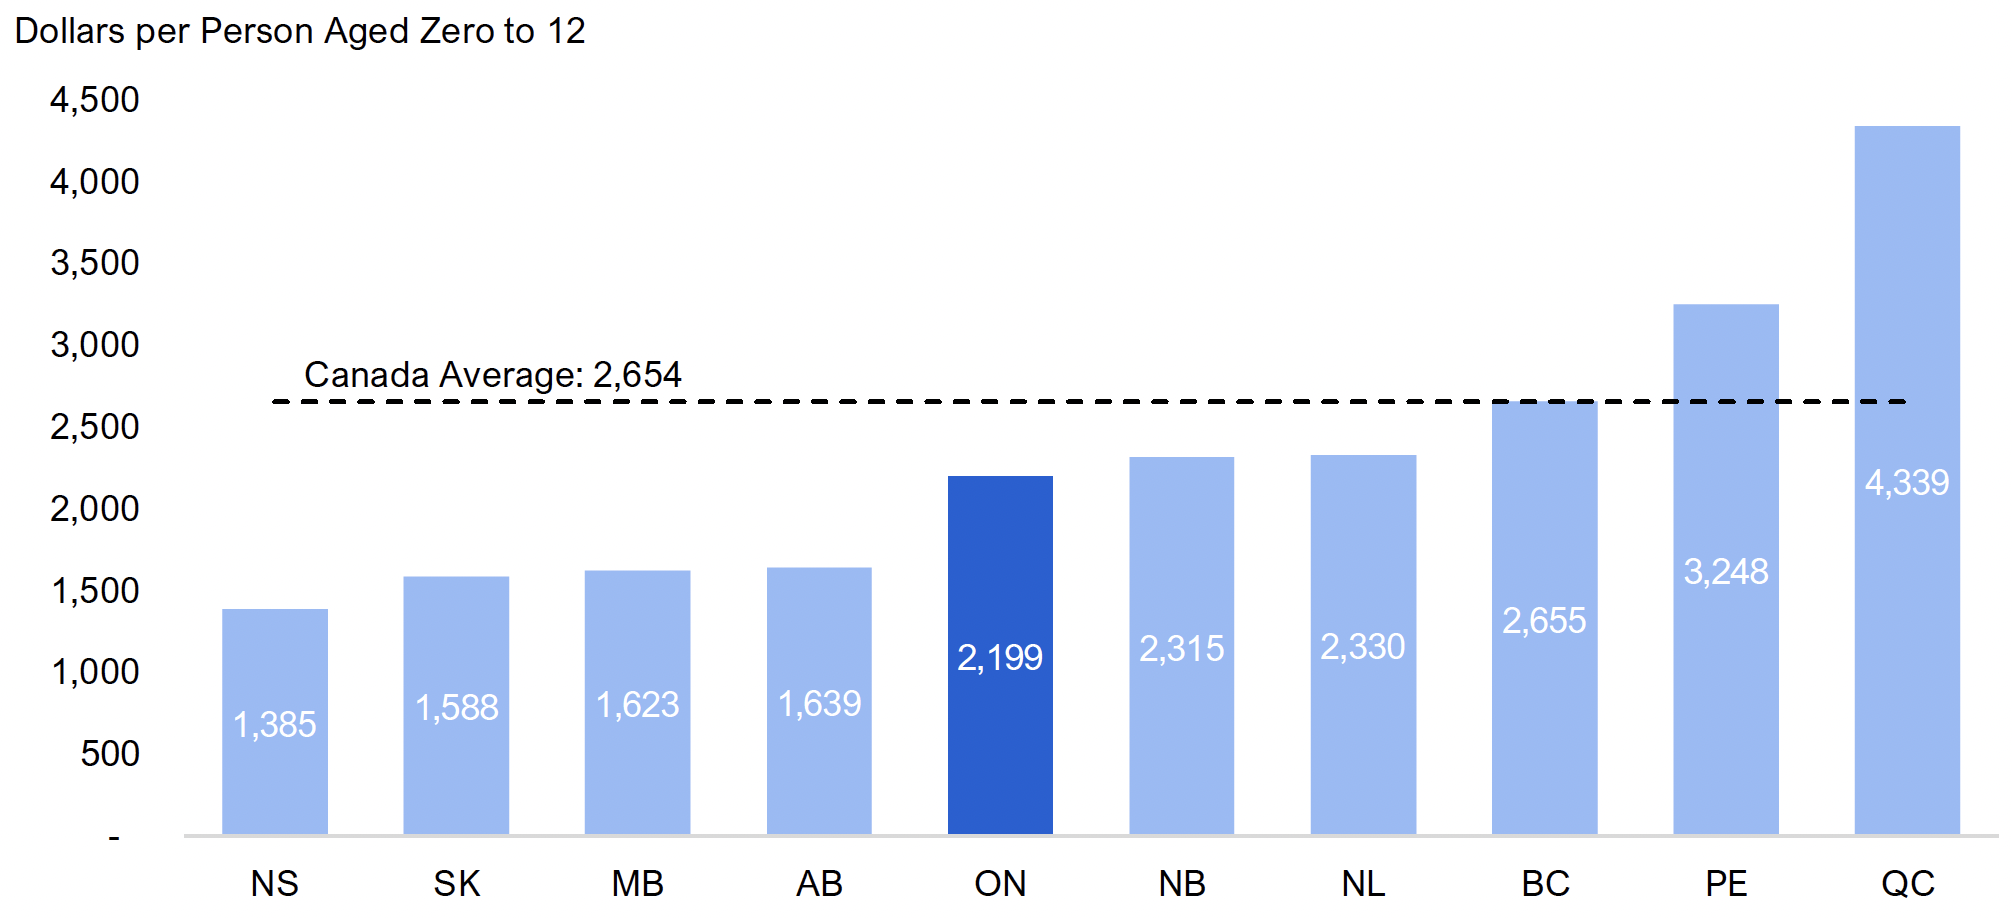
Note: Information compiled directly from provincial public accounts. No adjustments were made to improve comparability across provinces. Canada average excludes territories.
Source: FAO analysis based on provincial public accounts and the Atkinson Centre’s 2023 Early Childhood Education Report.
Accessible version
Dollars per Person Aged Zero to 12
| Province | Dollars per Person Aged Zero to 12 |
|---|---|
| NS | 1,385 |
| SK | 1,588 |
| MB | 1,623 |
| AB | 1,639 |
| ON | 2,199 |
| NB | 2,315 |
| NL | 2,330 |
| BC | 2,655 |
| PEI | 3,248 |
| QC | 4,339 |
| Canada Average | 2,654 |
Footnotes
[1] In January 2025, the Province reduced the average daily child care fee from $23 to $19. The FAO estimates that the Province will need to create an additional 33,090 licensed child care spaces in 2026 to achieve its target of 375,111 licensed child care spaces enrolled in the CWELCC program by the end of 2026.
[2] FAO, Government Spending Trends: 1990 to 2023.
[3] Excluding the in-year service enhancement, the FAO estimates that to maintain service levels, child care spending would need to increase by an average annual rate of 2.1 per cent.
[4] The Province has committed to reduce average daily fees from $19 a day to $10 a day by March 2026, and enroll an additional estimated 33,090 licensed child care spaces in 2026 to achieve its target of 375,111 licensed child care spaces enrolled in the CWELCC program by the end of 2026. If achieved, these measures would improve services compared to 2024-25 levels.
[5] For more information, see FAO, Ontario School Boards: Enrolment, Finances and Student Outcomes.
[6] These funds are primarily allocated through the Core Education Funding (Core Ed) program and the Responsive Education Programs (REP). The Core Ed program provides funding to school boards for teachers, administration, school operations and maintenance, supplies and equipment, pupil transportation, and other needs. The REP provides additional funding for specific government priorities such as mental health supports, literacy programs and equity initiatives.
[7] Licensed child care in Ontario is also provided through home agencies. In 2023-24, there were 22,215 children aged 0 to 12 enrolled in licensed child care home agencies.
[8] In 2025, approximately 92 per cent of licensed child care spaces for children aged zero to five were participating in the CWELCC program.
[9] This estimate includes the Province’s introduction of a new cost-based funding formula in January 2025.
[10] Government of Canada, Toward $10-a-day: An Early Learning and Child Care Backgrounder, 2025.
[11] The FAO’s estimate assumes $0.1 billion in provincial funding each year.
[12] New Brunswick does not have school boards and is excluded from the analysis as no comparable data are available.
[13] Based on provincial public accounts. No adjustments were made to improve comparability across provinces.