


1. Summary
At the request of a Member of Provincial Parliament, this report reviews the Government of Ontario’s (the Province’s) health sector spending plan as outlined in the 2025 Ontario Budget.
Spending Plan Overview
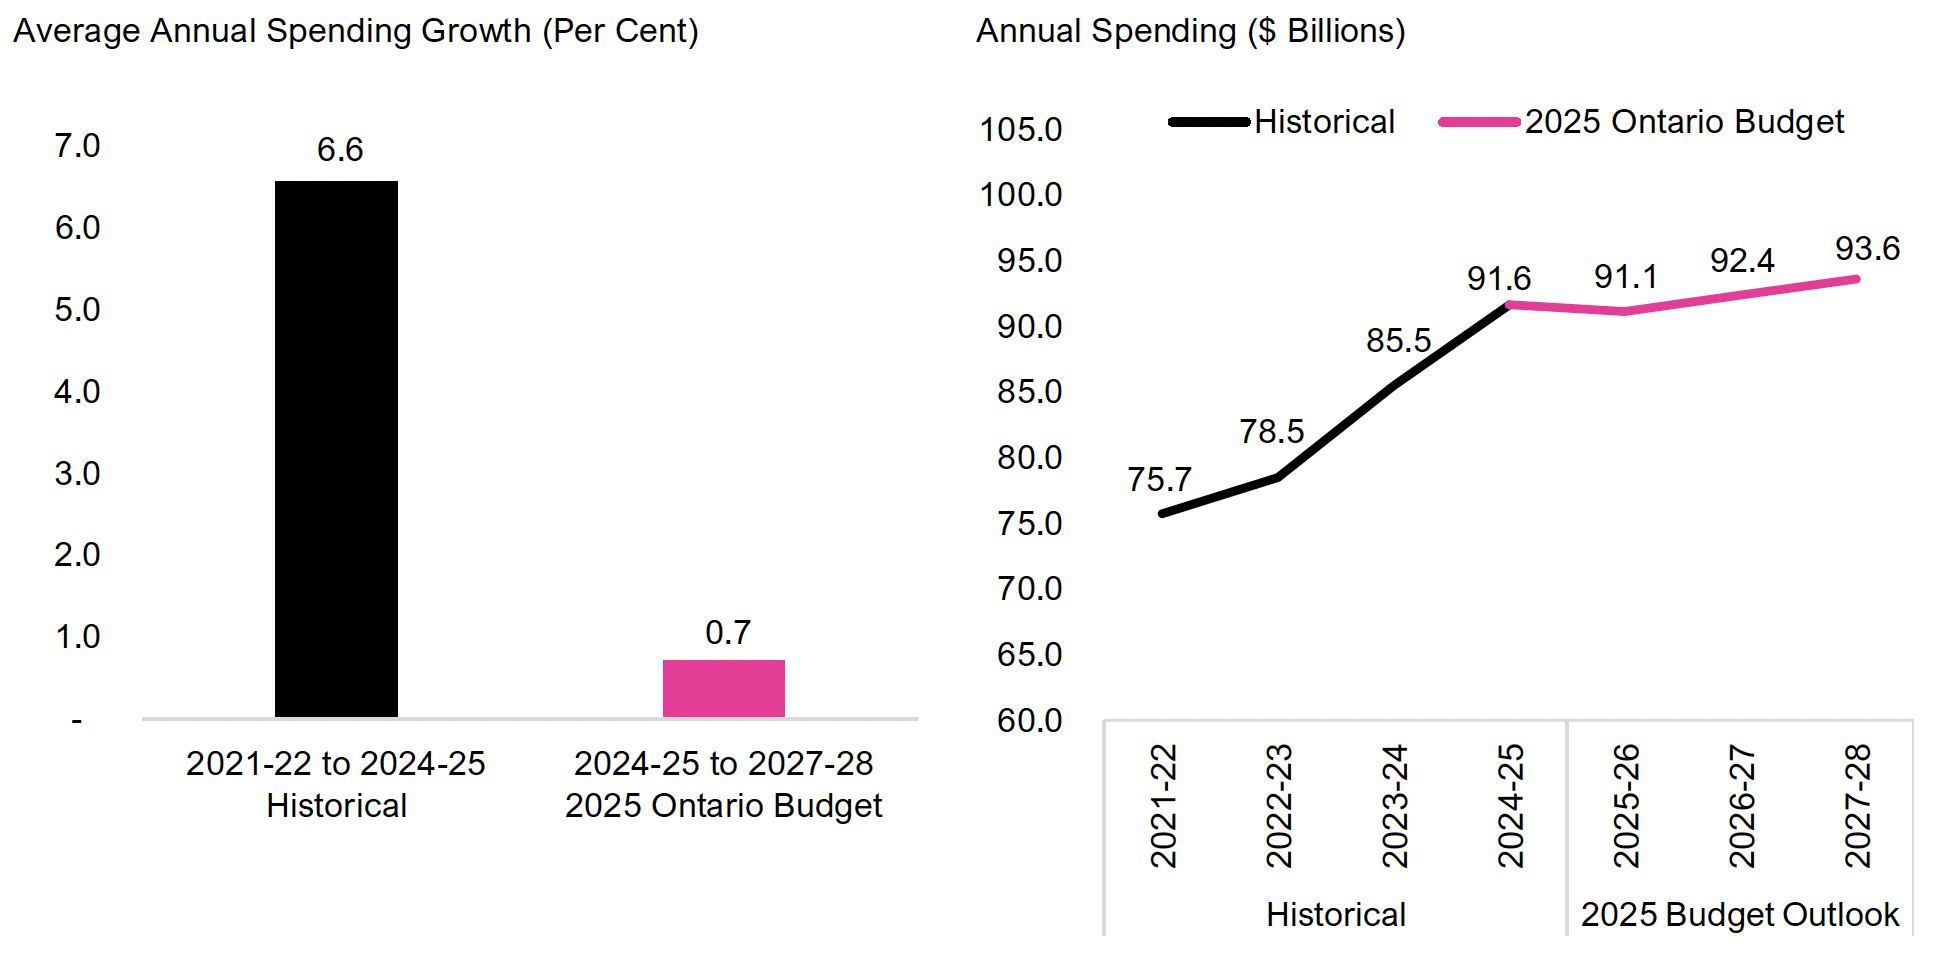
- In the 2025 Ontario Budget, the Province projects that health sector spending will grow at an average annual rate of 0.7 per cent, from $91.6 billion in 2024-25 to $93.6 billion in 2027-28.
- This is a significantly slower pace than the 6.6 per cent average annual growth over the previous three years from 2021-22 to 2024-25.
- For context, over the 34-year period from 1990-91 to 2023-24, health sector spending grew at an average annual rate of 5.0 per cent. If the Province’s health sector spending plan in the 2025 budget is achieved, it would be the slowest three-year growth rate since 1993-94 to 1996-97.
- The FAO estimated health sector spending from 2025-26 to 2027-28 that would be required to maintain 2024-25 service levels. Also known as a cost driver forecast, this scenario does not recommend how spending should change but serves as a benchmark to show whether the 2025 budget’s health sector spending plan is likely to maintain, improve or reduce the quality and accessibility of health services.
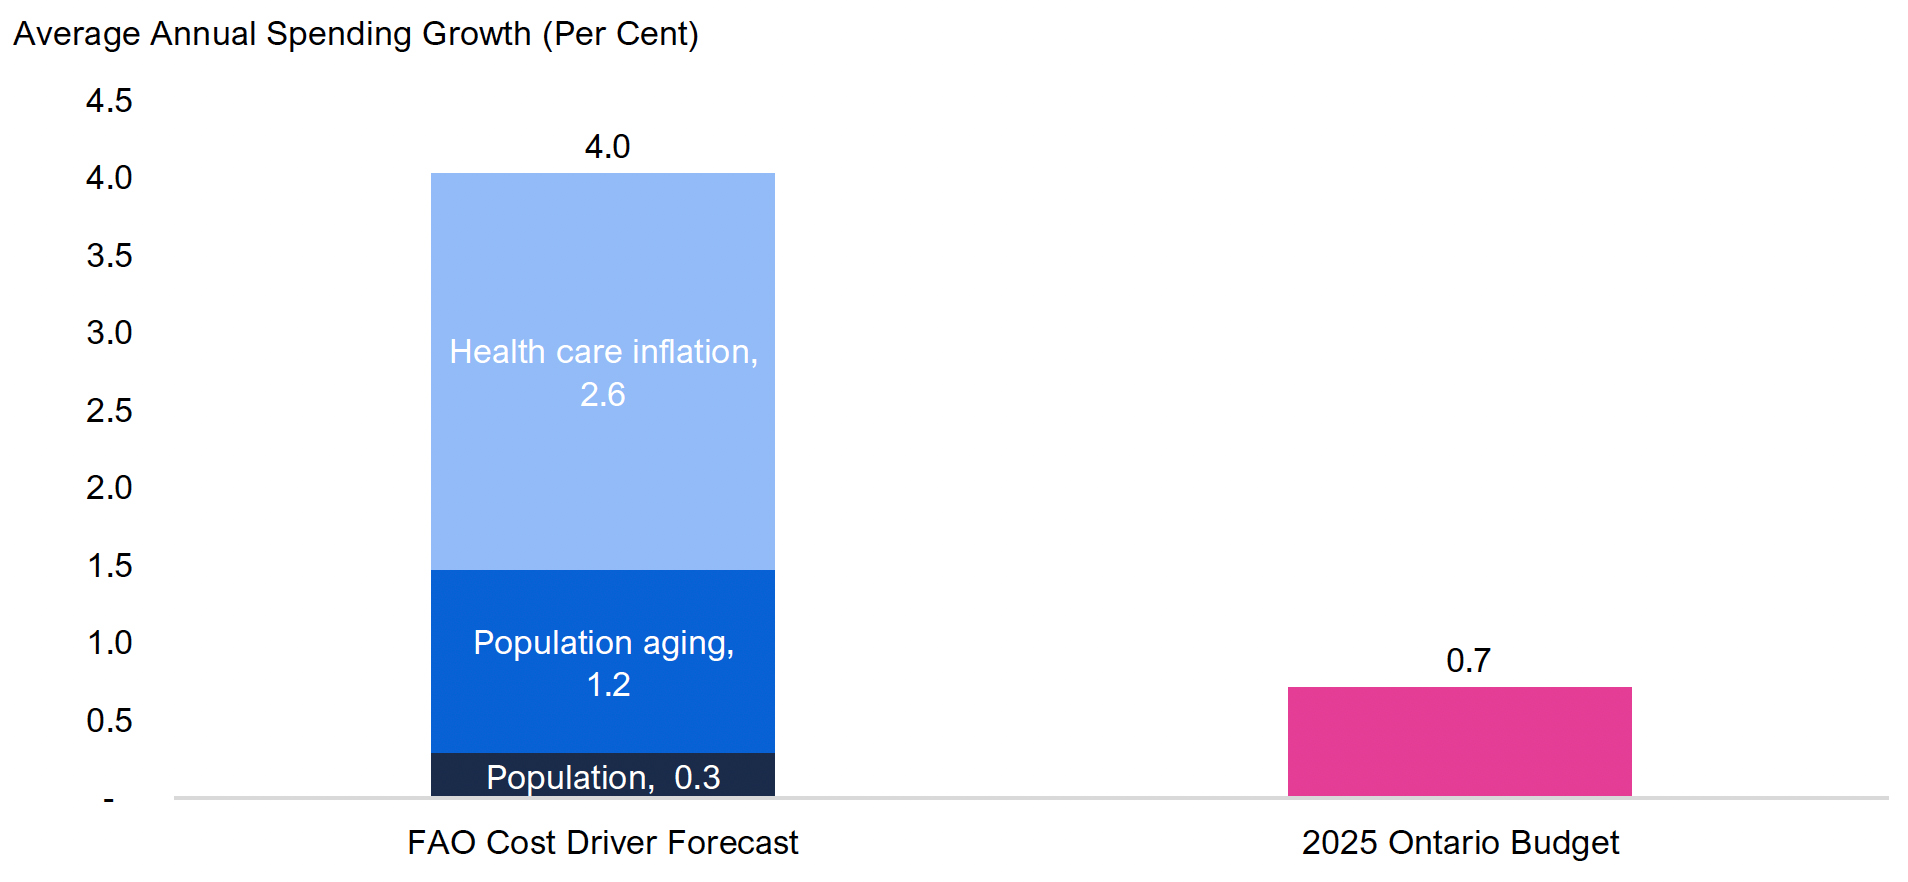
- Overall, the FAO estimates that health sector spending would need to grow by an average annual rate of 4.0 per cent over the next three years to maintain current service levels.
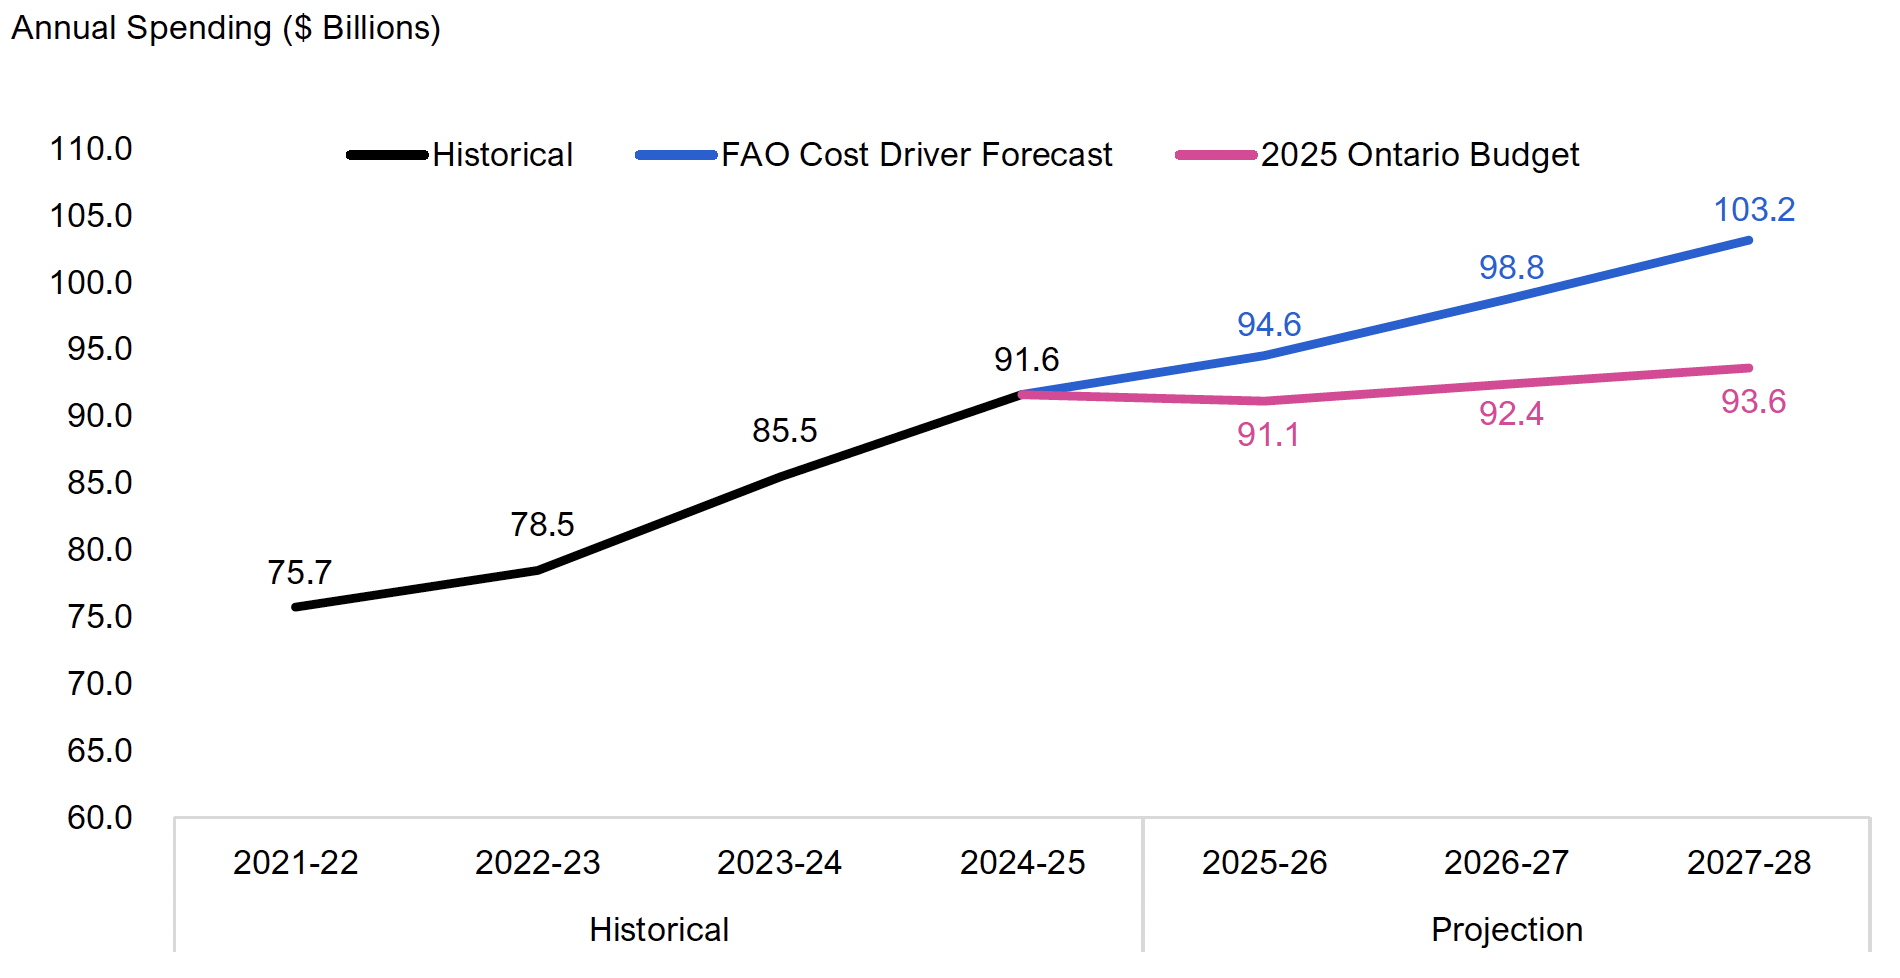
- The 2025 budget spending plan is below the FAO’s cost driver projection by $3.4 billion in 2025-26, $6.4 billion in 2026-27 and $9.6 billion in 2027-28. This means that the Province will need to implement health sector efficiencies (i.e., provide the same level of services with less resources) and/or commit additional funding to the health sector to maintain 2024-25 service levels.
Spending Plan Analysis:
- Hospital Beds: There were 35,540 funded hospital beds in Ontario in 2024-25. Based on the 2025 budget health sector spending plan, the FAO projects that there would be sufficient funding for 33,083 beds by 2027-28, resulting in a decrease from 220 funded hospital beds per 100,000 Ontarians in 2024-25 to 203 funded hospital beds per 100,000 Ontarians in 2027-28.
- Long-Term Care Beds: There were 79,212 long-term care beds in Ontario in 2024-25. Based on the 2025 budget health sector spending plan, the FAO projects that the number of long-term care beds would increase by 4,276, reaching 83,488 long-term care beds in 2027-28. On a per-capita basis, this represents a decline from 60 long-term care beds per 1,000 Ontarians aged 75 and over in 2024-25 to 56 long-term care beds per 1,000 Ontarians aged 75 and over in 2027-28, as the projected growth rate in Ontarians aged 75 and over is expected to outpace the increase in the number of long-term care beds.
- Nurses: The FAO estimates that there were 150,989 provincially funded nurses in the health sector in 2024-25. Based on the 2025 budget health sector spending plan, the FAO projects that there would be sufficient funding for 143,726 provincially funded nurses in 2027-28, a decrease of 7,263 provincially funded nurses from 2024-25 levels. On a per-capita basis, this represents a decline from 936 provincially funded nurses per 100,000 Ontarians in 2024-25 to 883 provincially funded nurses per 100,000 Ontarians in 2027-28.
- Personal Support Workers (PSWs): The FAO estimates that there were 118,883 provincially funded PSWs in the health sector in 2024-25. Based on the 2025 budget health sector spending plan, the FAO projects that the number of provincially funded PSWs would decrease by 1,784, reaching 117,099 PSWs in 2027-28. On a per-capita basis, this represents a decline from 737 provincially funded PSWs per 100,000 Ontarians in 2024-25 to 719 provincially funded PSWs per 100,000 Ontarians in 2027-28.
- Physicians: In 2023-24, there were 35,215 physicians in Ontario or 224 physicians per 100,000 Ontarians. Looking forward, the FAO is unable to project the number of physicians in Ontario based on the 2025 budget health sector spending plan, as most physicians are not directly employed by the Province and all physician services delivered through the Ontario Health Insurance Program (OHIP) are funded irrespective of the spending targets in the 2025 budget. However, the FAO expects that the number of physicians in Ontario will increase, due to increased demand for physician services from Ontario’s growing and aging population, and from supply-side measures implemented by the Province.
Interprovincial Comparison
- In 2022, compared to other provinces Ontario had:
- The second lowest age-standardized per capita total provincial health sector funding at $5,268 per person, below the national average of $5,562 per person.
- The lowest age-standardized per capita provincial funding for hospitals at $1,805 per person, below the national average of $1,949 per person.
- The third highest age-standardized per capita spending on physicians at $1,137 per person, above the national average of $1,084 per person.
- The second highest age-standardized per capita public drug spending at $440 per person, above the national average of $353 per person.
- A below average number of hospital beds, after adjusting for population and population age, with 230 hospital beds per 100,000 population, below the national average of 249 beds per 100,000 population.
- The fourth lowest number of physicians, after adjusting for population and population age, with 233 physicians per 100,000 population, below the Canadian average of 246 physicians per 100,000 population.
2. Introduction
This report reviews the Government of Ontario’s (the Province’s) health sector spending plan as outlined in the 2025 Ontario Budget. Health sector spending consists of the combined spending by the Ministries of Health and Long-Term Care.
This analysis was undertaken in response to a request from a Member of Provincial Parliament and is part of a planned series that reviews the spending plans for five ministries: Health; Long-Term Care; Education; Colleges, Universities, Research Excellence and Security; and Children, Community and Social Services.
The report is organized as follows:
- Chapter 3 reviews the Province’s health sector spending plan in the 2025 Ontario Budget against both historical health sector spending and estimated health sector cost drivers. The cost driver analysis includes the FAO’s projection for health sector spending required to maintain current service levels.
- Chapter 4 estimates the impact of the Province’s health sector spending plan on select service levels.
- Chapter 5 provides an interprovincial comparison of health spending and service levels.
For additional information on the Ministries of Health and Long-Term Care’s 2025-26 spending plan, see the FAO’s Examining Ontario’s 2025-26 Expenditure Estimates, which compares planned spending against actual spending over the previous four years to the standard account level of detail.
3. Spending Plan Overview
In the 2025 Ontario Budget, the Province projects that health sector spending will grow at an average annual rate of 0.7 per cent, from $91.6 billion in 2024-25 to $93.6 billion in 2027-28. This is a significantly slower pace than the 6.6 per cent average annual growth over the previous three years from 2021-22 to 2024-25.
Figure 3.1 Health sector spending plan in the 2025 Ontario Budget
Note: Historical values are not restated for program transfers or reclassifications, if any.
Source: Ontario Public Accounts and the 2025 Ontario Budget.
Accessible version
Average Annual Spending Growth (Per Cent)
| 2021-22 to 2024-25 Historical |
2024-25 to 2027-28 2025 Ontario Budget |
|---|---|
| 6.6 | 0.7 |
Annual Spending ($ Billions)
| Historical | 2025 Ontario Budget | ||
|---|---|---|---|
| Historical | 2021-22 | 75.7 | |
| Historical | 2022-23 | 78.5 | |
| Historical | 2023-24 | 85.5 | |
| Historical | 2024-25 | 91.6 | |
| 2025 Budget Outlook | 2025-26 | 91.1 | |
| 2025 Budget Outlook | 2026-27 | 92.4 | |
| 2025 Budget Outlook | 2027-28 | 93.6 |
For context, over the 34-year period from 1990-91 to 2023-24, health sector spending grew at an average annual rate of 5.0 per cent.[1] The Province’s health sector spending plan in the 2025 budget calls for significantly slower spending growth compared to the 34-year average and would be the slowest three-year growth rate since 1993-94 to 1996-97.
Spending Plan Compared to Cost Drivers
At the request of the Member of Provincial Parliament, the FAO estimated health sector spending from 2025-26 to 2027-28 that would be required to maintain 2024-25 health sector services levels. Also known as a cost driver forecast, this scenario does not recommend how spending should change but serves as a benchmark to show whether the 2025 budget’s health sector spending plan is likely to maintain, improve or reduce the quality and accessibility of health services.
Overall, the FAO estimates that health sector spending would need to grow by an average annual rate of 4.0 per cent over the next three years to maintain current health sector service levels. The components of the FAO’s health sector cost driver forecast take into account three key pressures:
- Population growth: As Ontario’s population increases, more people will access public health care services.
- Population aging: On average, older Ontarians use more health services.
- Health care inflation: The increasing cost of compensation, medicines and equipment.
Figure 3.2 Comparing health sector spending growth, FAO cost driver forecast vs. 2025 Ontario Budget, 2024-25 to 2027-28
Source: 2024-25 Public Accounts of Ontario, 2025 Ontario Budget and FAO analysis.
Accessible version
Average Annual Spending Growth (Per Cent)
| FAO Cost Driver Forecast | 2025 Ontario Budget | |
|---|---|---|
| Health care inflation | 2.6 | |
| Population aging | 1.2 | |
| Population | 0.3 | |
| Total | 4.0 | 0.7 |
As noted above, in the 2025 budget, the Province projects that health sector spending will grow at an average annual rate of 0.7 per cent from 2024-25 to 2027-28. Compared to the FAO’s cost driver projection, the 2025 budget spending plan has a funding shortfall of $3.4 billion in 2025-26, $6.4 billion in 2026-27 and $9.6 billion in 2027-28.
Figure 3.3 FAO cost driver projection and the health sector spending plan in the 2025 Ontario Budget
Note: Historical values are not restated for program transfers or reclassifications, if any.
Source: Ontario Public Accounts, 2025 Ontario Budget and FAO analysis.
Accessible version
Annual Spending ($ Billions)
| Historical | FAO Cost Driver Forecast | 2025 Ontario Budget | ||
|---|---|---|---|---|
| Historical | 2021-22 | 75.7 | ||
| Historical | 2022-23 | 78.5 | ||
| Historical | 2023-24 | 85.5 | ||
| Historical | 2024-25 | 91.6 | ||
| Projection | 2025-26 | 94.6 | 91.1 | |
| Projection | 2026-27 | 98.8 | 92.4 | |
| Projection | 2027-28 | 103.2 | 93.6 |
The funding shortfall means that, in order to maintain current service levels – for example, the ratio of hospital bed to age-adjusted population – the Province will need to implement significant health sector efficiencies (i.e., provide the same level of services with less resources) and/or commit additional funding to the health sector beyond what was planned in the 2025 Ontario Budget.
4. Spending Plan Analysis
At the request of the Member of Provincial Parliament, the FAO estimated the potential impact of the Province’s 2025 budget health sector spending plan on a select number of service level indicators. There are many other measures of health sector service levels. For more information, see Ontario Health, Health System Performance Reporting and CIHI, health system performance measurement.
Hospital Beds
In 2024-25, there were 35,540 funded hospital beds in Ontario.[2] Based on the 2025 budget health sector spending plan, the FAO projects that there would be sufficient funding for 33,083 hospital beds in 2027-28, a decrease of 2,457 funded hospital beds from 2024-25 levels.
On a per-capita basis, this represents a decline from 220 funded hospital beds per 100,000 Ontarians in 2024-25 to 203 hospital beds per 100,000 Ontarians in 2027-28.[3]
Figure 4.1 Number of funded hospital beds per 100,000 Ontarians, 2015-16 to 2027-28
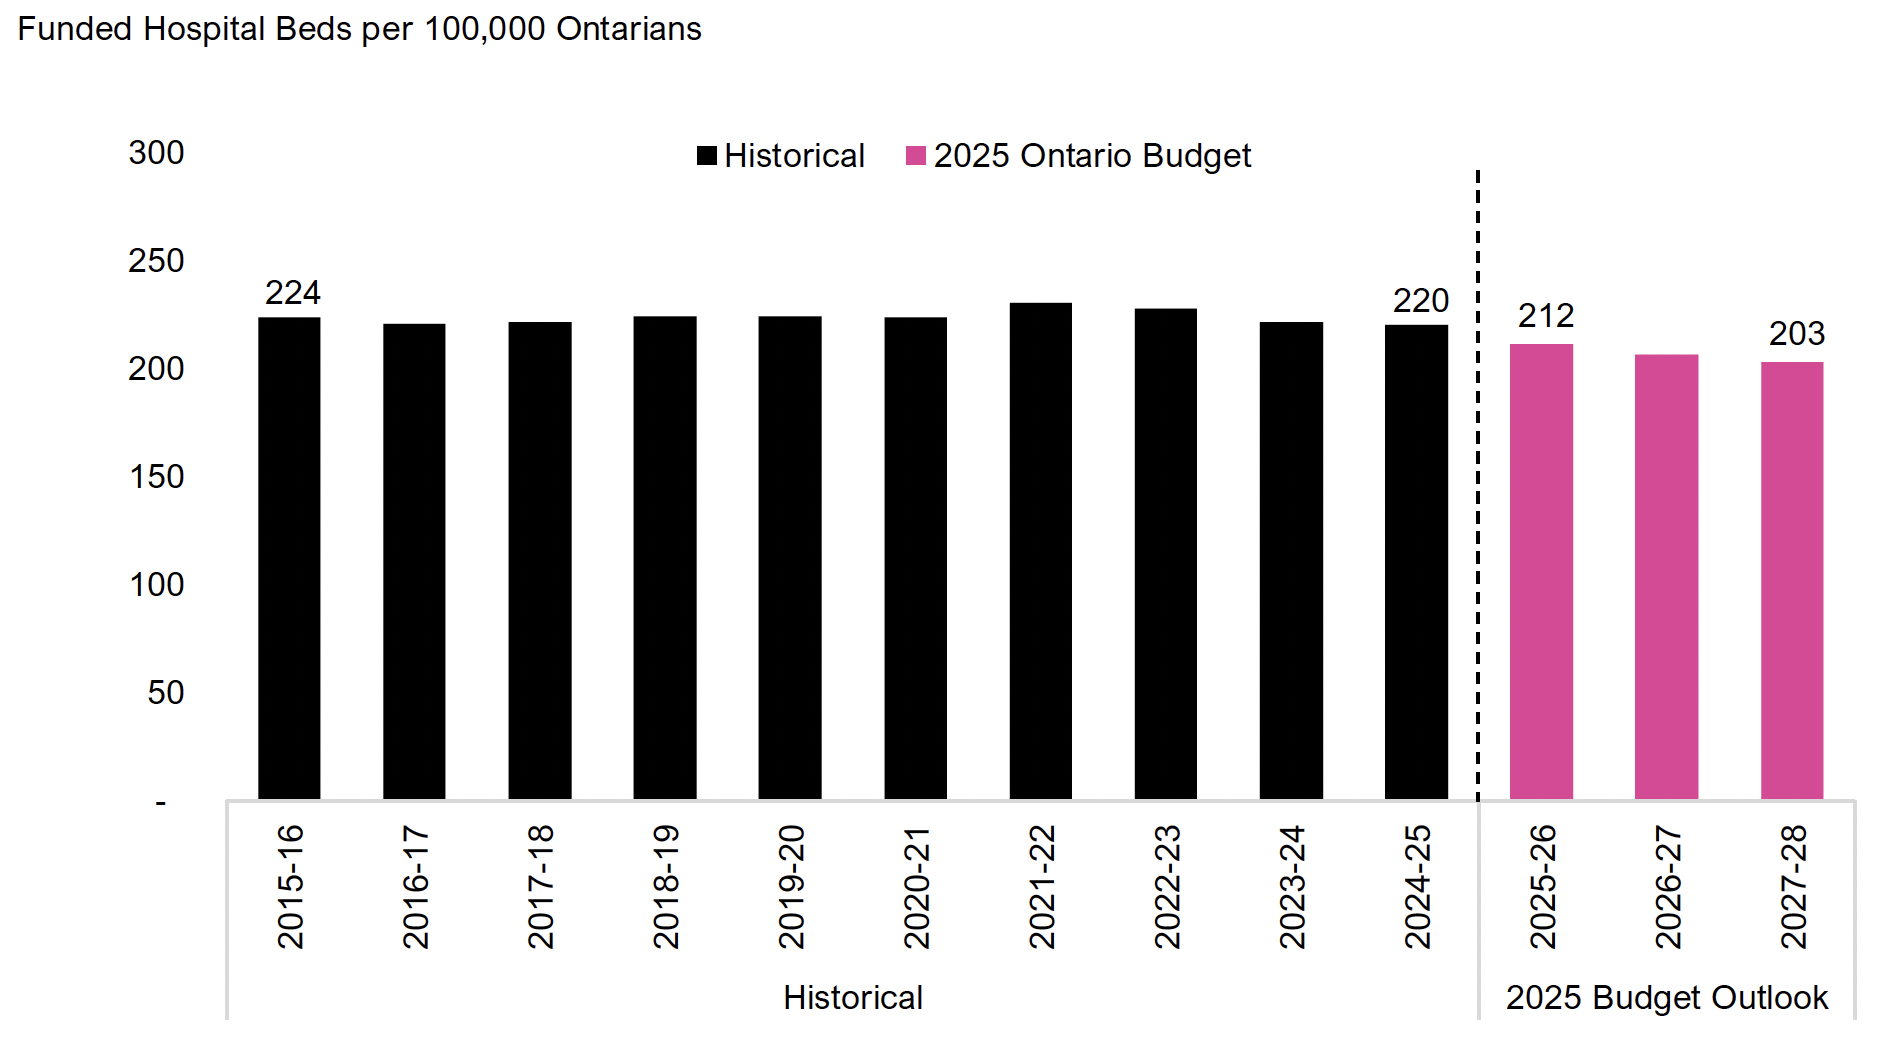
Note: “2025 Budget Outlook” is the FAO’s projection based on the health sector spending plan in the 2025 Ontario Budget. Funded hospital beds represent hospital beds that have been allocated operating funding by the Province and are actively staffed and available to patients.
Source: FAO analysis of information provided by the Province, CIHI Trends in Hospital Spending, 2009-2010 to 2022-2023 – Data Tables – Series D: Beds Staffed and In Operation by Functional Centre, and Ontario Health Coalition hospital beds staffed and in operation Ontario 1990 to 2014.
Accessible version
Funded Hospital Beds per 100,000 Ontarians
| Historical | 2025 Ontario Budget | ||
|---|---|---|---|
| Historical | 2015-16 | 224 | |
| Historical | 2016-17 | 221 | |
| Historical | 2017-18 | 222 | |
| Historical | 2018-19 | 224 | |
| Historical | 2019-20 | 224 | |
| Historical | 2020-21 | 224 | |
| Historical | 2021-22 | 230 | |
| Historical | 2022-23 | 228 | |
| Historical | 2023-24 | 222 | |
| Historical | 2024-25 | 220 | |
| 2025 Budget Outlook | 2025-26 | 212 | |
| 2025 Budget Outlook | 2026-27 | 207 | |
| 2025 Budget Outlook | 2027-28 | 203 |
Long-Term Care Beds
There were 79,212 long-term care beds in Ontario in 2024-25. Based on the 2025 budget health sector spending plan, the FAO projects that the number of long-term care beds would increase by 4,276, reaching 83,488 long-term care beds in 2027-28.
On a per-capita basis, this represents a decline from 60 long-term care beds per 1,000 Ontarians aged 75 and over[4] in 2024-25 to 56 long-term care beds per 1,000 Ontarians aged 75 and over in 2027-28, as the projected growth rate in Ontarians aged 75 and over is expected to outpace the increase in the number of long-term care beds.[5]
Figure 4.2 Number of long-term care beds per 1,000 Ontarians aged 75 and over, 2015-16 to 2027-28
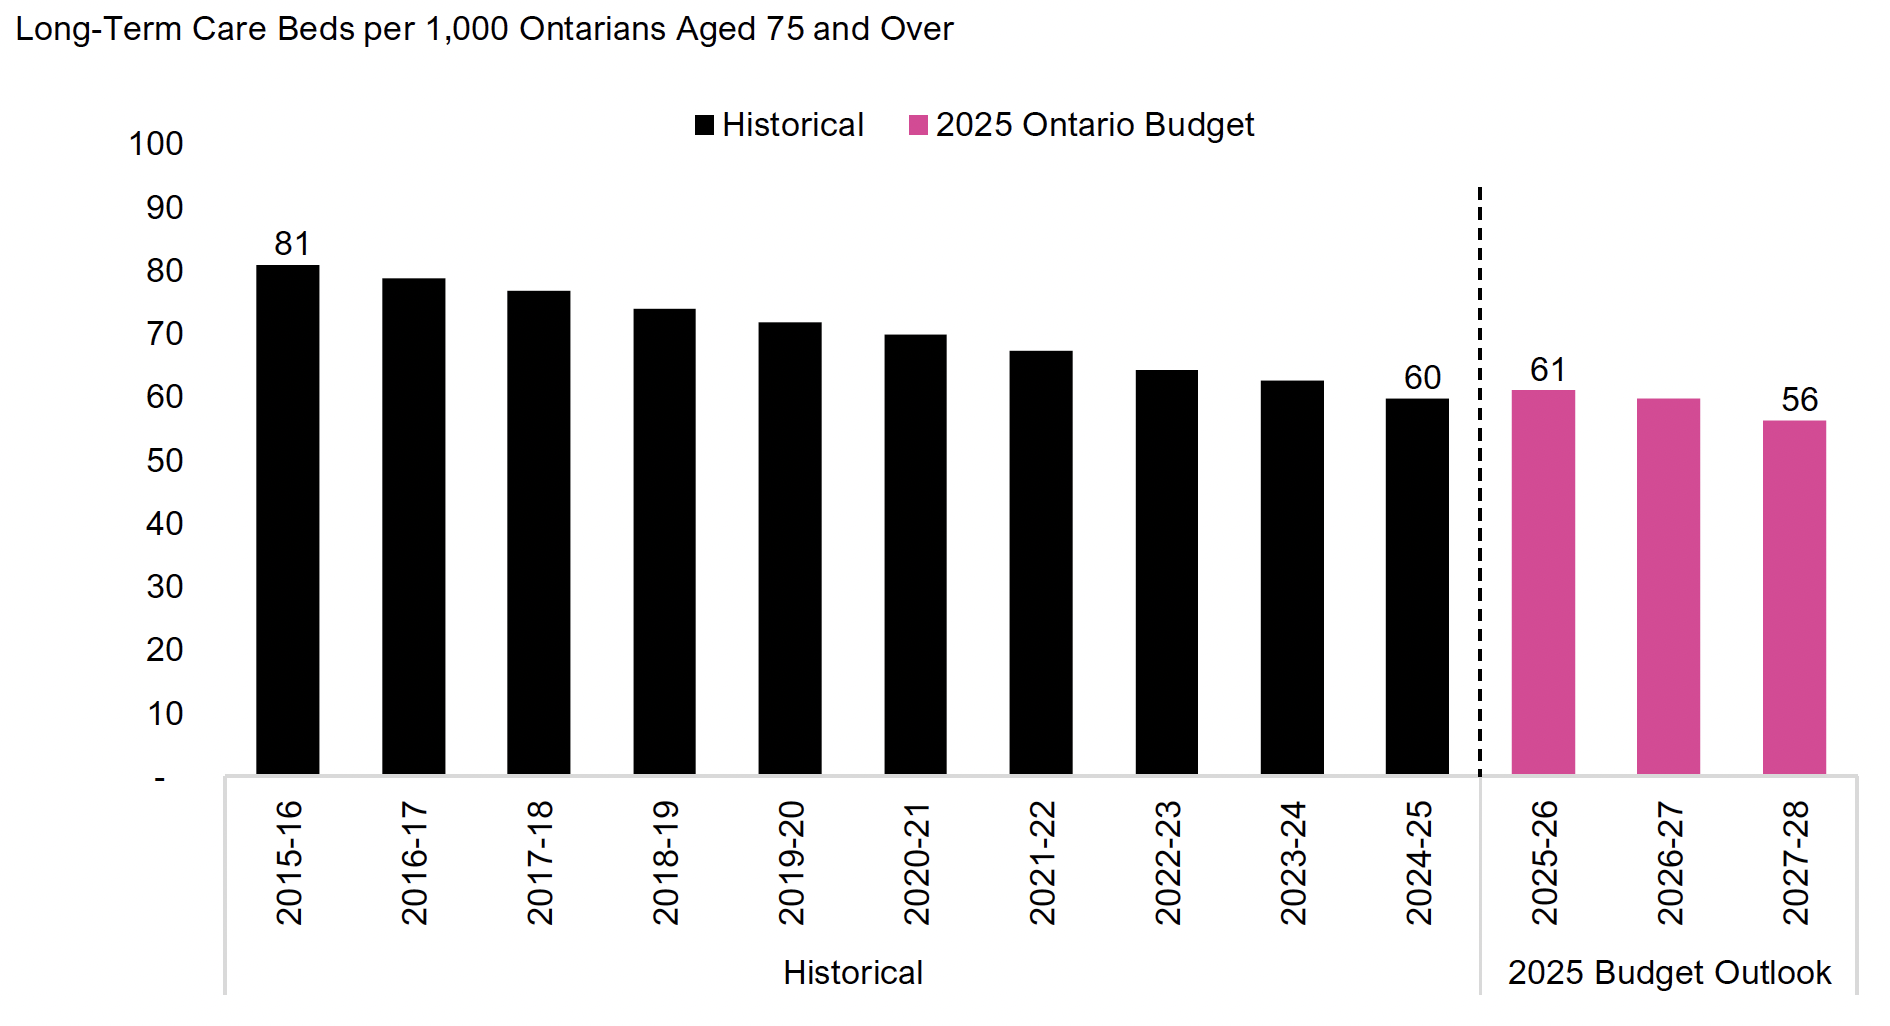
Note: “2025 Budget Outlook” is the FAO’s projection based on the health sector spending plan in the 2025 Ontario Budget.
Source: FAO analysis of information provided by the Province.
Accessible version
Long-Term Care Beds per 1,000 Ontarians Aged 75 and Over
| Historical | 2025 Ontario Budget | ||
|---|---|---|---|
| Historical | 2015-16 | 81 | |
| Historical | 2016-17 | 79 | |
| Historical | 2017-18 | 77 | |
| Historical | 2018-19 | 74 | |
| Historical | 2019-20 | 72 | |
| Historical | 2020-21 | 70 | |
| Historical | 2021-22 | 67 | |
| Historical | 2022-23 | 64 | |
| Historical | 2023-24 | 63 | |
| Historical | 2024-25 | 60 | |
| 2025 Budget Outlook | 2025-26 | 61 | |
| 2025 Budget Outlook | 2026-27 | 60 | |
| 2025 Budget Outlook | 2027-28 | 56 |
Nurses
Provincially funded nurses, which include registered nurses, nurse practitioners and licensed practical nurses, are employed in hospitals, long-term care homes, clinics and many other health care settings. The FAO estimates that, in 2024-25, there were 150,989 provincially funded nurses in the health sector.
Based on the 2025 budget health sector spending plan, the FAO projects that there would be sufficient funding for 143,726 provincially funded nurses in 2027-28, a decrease of 7,263 provincially funded nurses from 2024-25 levels. On a per-capita basis, this represents a decline from 936 provincially funded nurses per 100,000 Ontarians in 2024-25 to 883 provincially funded nurses per 100,000 Ontarians in 2027-28.
Figure 4.3 Number of provincially funded nurses per 100,000 Ontarians, 2015-16 to 2027-28
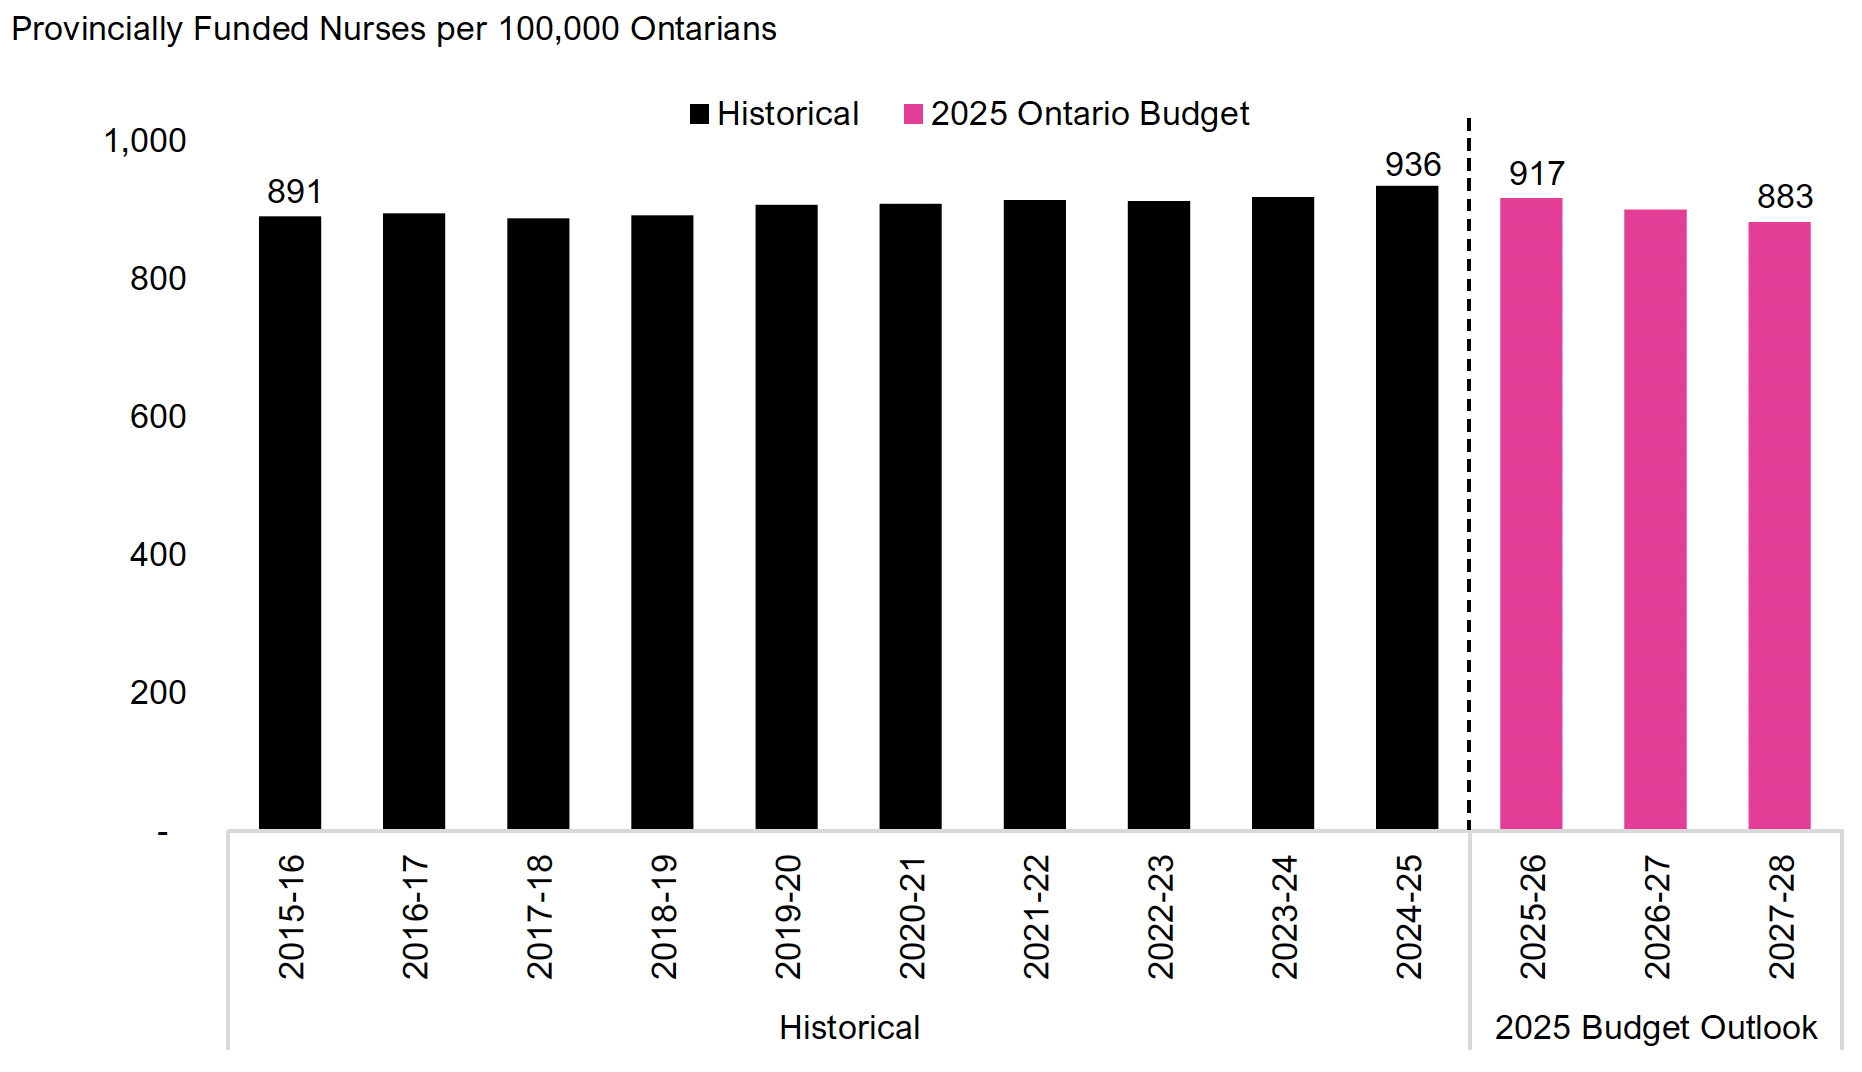
Note: “2025 Budget Outlook” is the FAO’s projection based on the health sector spending plan in the 2025 Ontario Budget.
Source: FAO analysis of information provided by the Province and CIHI Registered Nurses – Workforce of regulated nurses, by jurisdiction and type of professional, 2015 to 2024.
Accessible version
Provincially Funded Nurses per 100,000 Ontarians
| Historical | 2025 Ontario Budget | ||
|---|---|---|---|
| Historical | 2015-16 | 891 | |
| Historical | 2016-17 | 895 | |
| Historical | 2017-18 | 888 | |
| Historical | 2018-19 | 892 | |
| Historical | 2019-20 | 907 | |
| Historical | 2020-21 | 909 | |
| Historical | 2021-22 | 914 | |
| Historical | 2022-23 | 913 | |
| Historical | 2023-24 | 918 | |
| Historical | 2024-25 | 936 | |
| 2025 Budget Outlook | 2025-26 | 917 | |
| 2025 Budget Outlook | 2026-27 | 900 | |
| 2025 Budget Outlook | 2027-28 | 883 |
Personal Support Workers
Provincially funded personal support workers (PSWs) provide care in long-term care homes, hospitals, and home and community care. The FAO estimates that, in 2024-25, there were 118,883 provincially funded PSWs in the health sector.
Based on the 2025 budget health sector spending plan, the FAO projects that the number of provincially funded PSWs would decrease by 1,784, reaching 117,099 PSWs in 2027-28. On a per-capita basis, this represents a decline from 737 provincially funded PSWs per 100,000 Ontarians in 2024-25 to 719 provincially funded PSWs per 100,000 Ontarians in 2027-28.
Figure 4.4 Number of provincially funded personal support workers per 100,000 Ontarians, 2021-22 to 2027-28
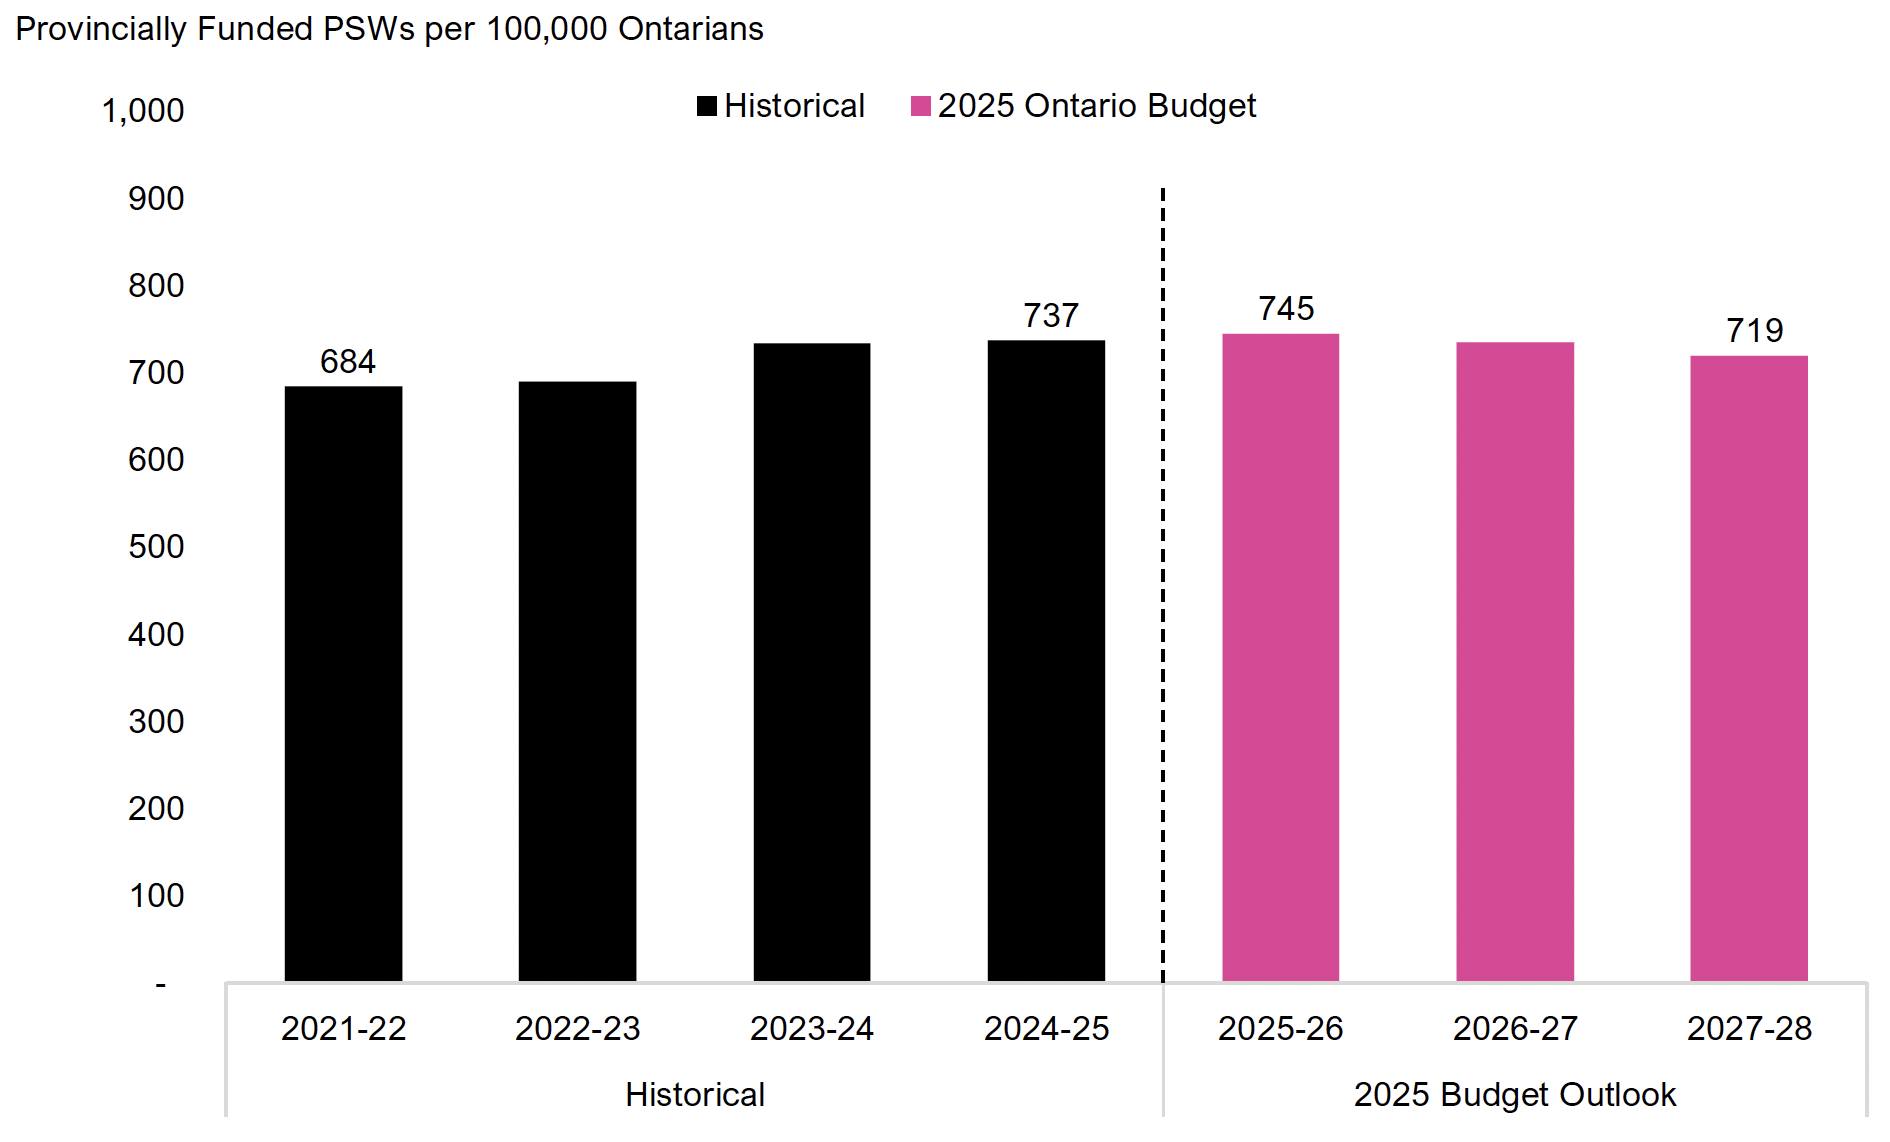
Note: “2025 Budget Outlook” is the FAO’s projection based on the health sector spending plan in the 2025 Ontario Budget.
Source: FAO analysis of information provided by the Province.
Accessible version
Provincially Funded PSWs per 100,000 Ontarians
| Historical | 2025 Ontario Budget | ||
|---|---|---|---|
| Historical | 2021-22 | 684 | |
| Historical | 2022-23 | 690 | |
| Historical | 2023-24 | 734 | |
| Historical | 2024-25 | 737 | |
| 2025 Budget Outlook | 2025-26 | 745 | |
| 2025 Budget Outlook | 2026-27 | 734 | |
| 2025 Budget Outlook | 2027-28 | 719 |
Physicians
Physicians provide care in their own practices, as well as in hospitals and community settings. Unlike nurses and PSWs, physicians are typically not direct employees of the Province. Instead, they are largely independent practitioners who are mainly paid through the Ontario Health Insurance Program (OHIP), under agreements negotiated between the Ministry of Health and the Ontario Medical Association (OMA).
From 2015-16 to 2018-19, the number of physicians in Ontario increased by 3,378, reaching 33,872. This increase outpaced population growth, raising the number of physicians per 100,000 Ontarians from 222 in 2015-16 to 235 in 2018-19. From 2018-19 to 2023-24, the number of physicians in Ontario increased by 1,343, reaching 35,215. However, during this period, the increase in the number of physicians was not able to keep pace with population growth, such that the number of physicians per 100,000 Ontarians declined to 224 in 2023-24.[6]
Figure 4.5 Number of physicians per 100,000 Ontarians, 2015-16 to 2023-24
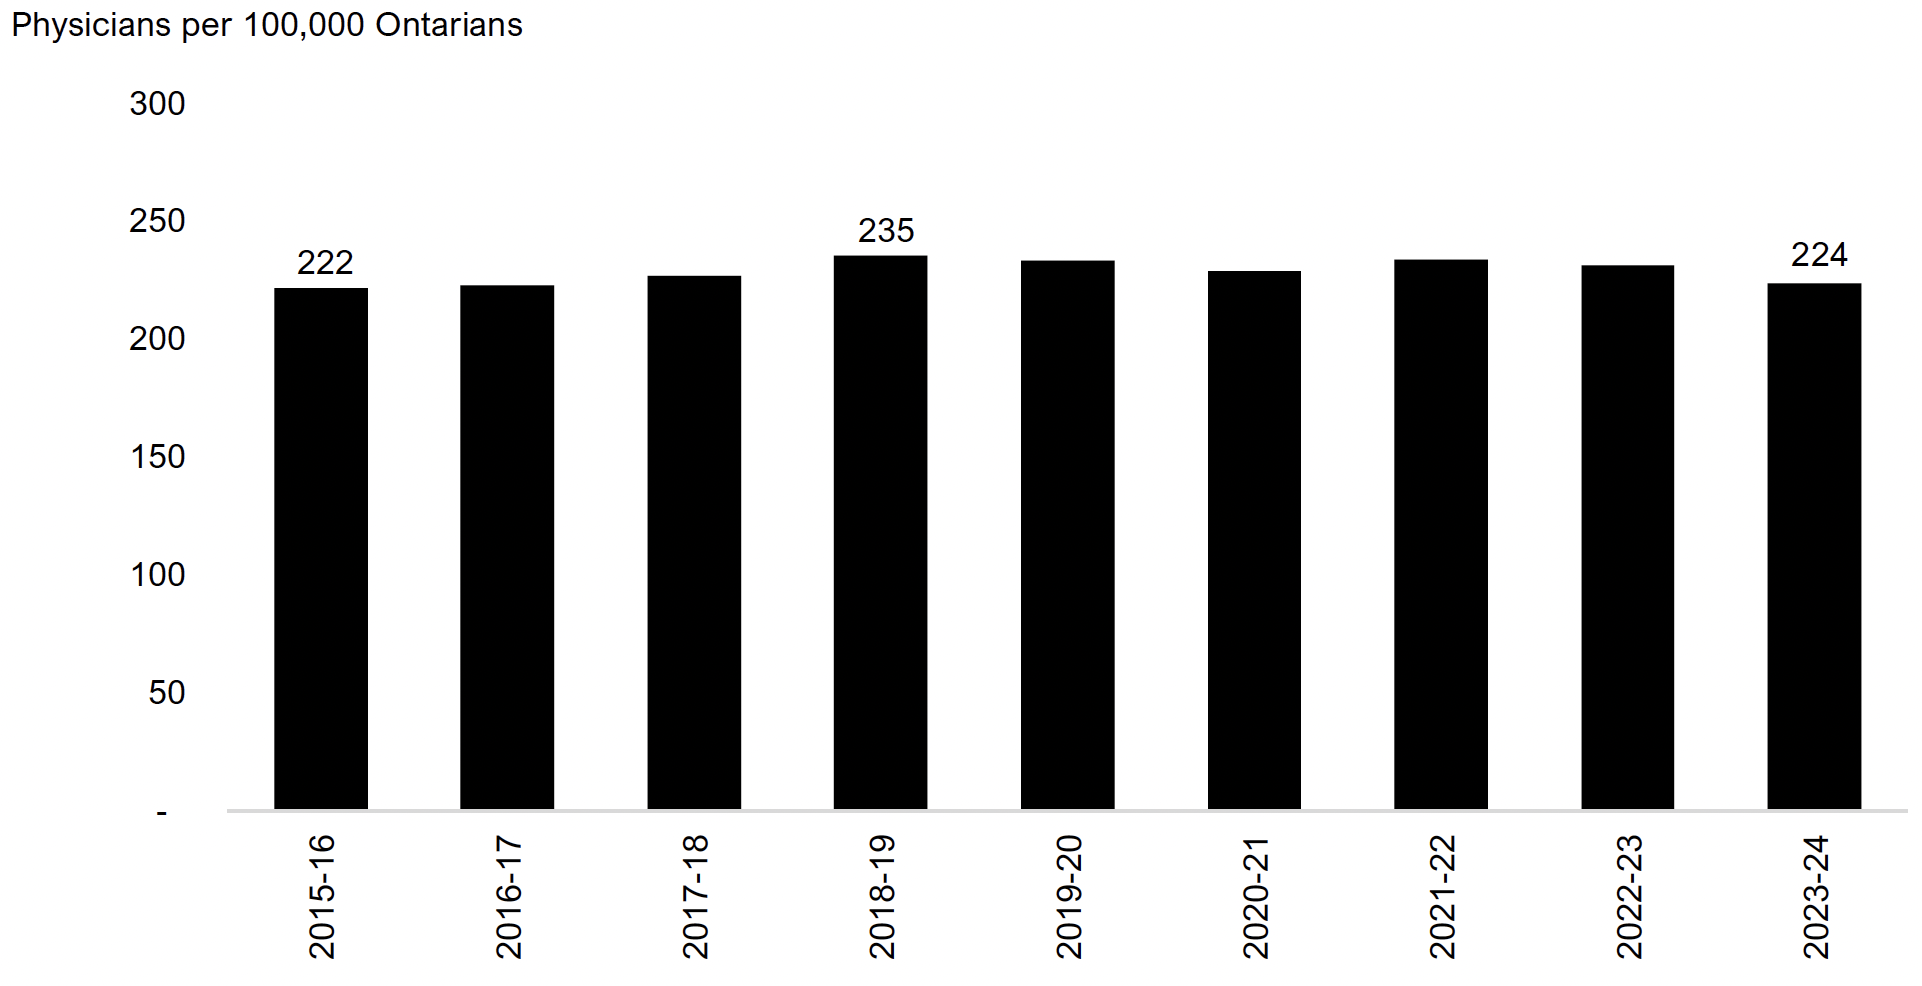
Source: FAO analysis of CIHI Supply, Distribution and Migration of Physicians in Canada, 2023 – Historical Data.
Accessible version
| Physicians per 100,000 Ontarians | |
|---|---|
| 2015-16 | 222 |
| 2016-17 | 223 |
| 2017-18 | 227 |
| 2018-19 | 235 |
| 2019-20 | 233 |
| 2020-21 | 229 |
| 2021-22 | 234 |
| 2022-23 | 231 |
| 2023-24 | 224 |
Looking forward, the FAO is unable to project the number of physicians in Ontario based on the 2025 budget health sector spending plan, as most physicians are not directly employed by the Province and all physician services delivered through OHIP are funded irrespective of the spending targets in the 2025 budget.[7] However, the FAO expects that the number of physicians in Ontario will increase, due to increased demand for physician services from Ontario’s growing and aging population, and from supply-side measures implemented by the Province.[8]
5. Interprovincial Comparison
At the request of the Member of Provincial Parliament, this chapter compares Ontario’s age-standardized per capita health spending and select service levels with those of other provinces. The information is for the 2022 calendar year, the latest year with comparable data.
Total Provincial Health Sector Funding
In 2022, Ontario had the second lowest age-standardized[9] per capita health sector funding[10] among the provinces. Ontario’s total provincial health sector funding was $5,268 per person, $294 below the national average of $5,562. Compared to the next three largest provinces by population, Ontario’s funding was lower than in British Columbia ($5,521), Quebec ($5,627) and Alberta ($6,293).
Figure 5.1 Age-standardized per capita total provincial health sector funding by province in 2022
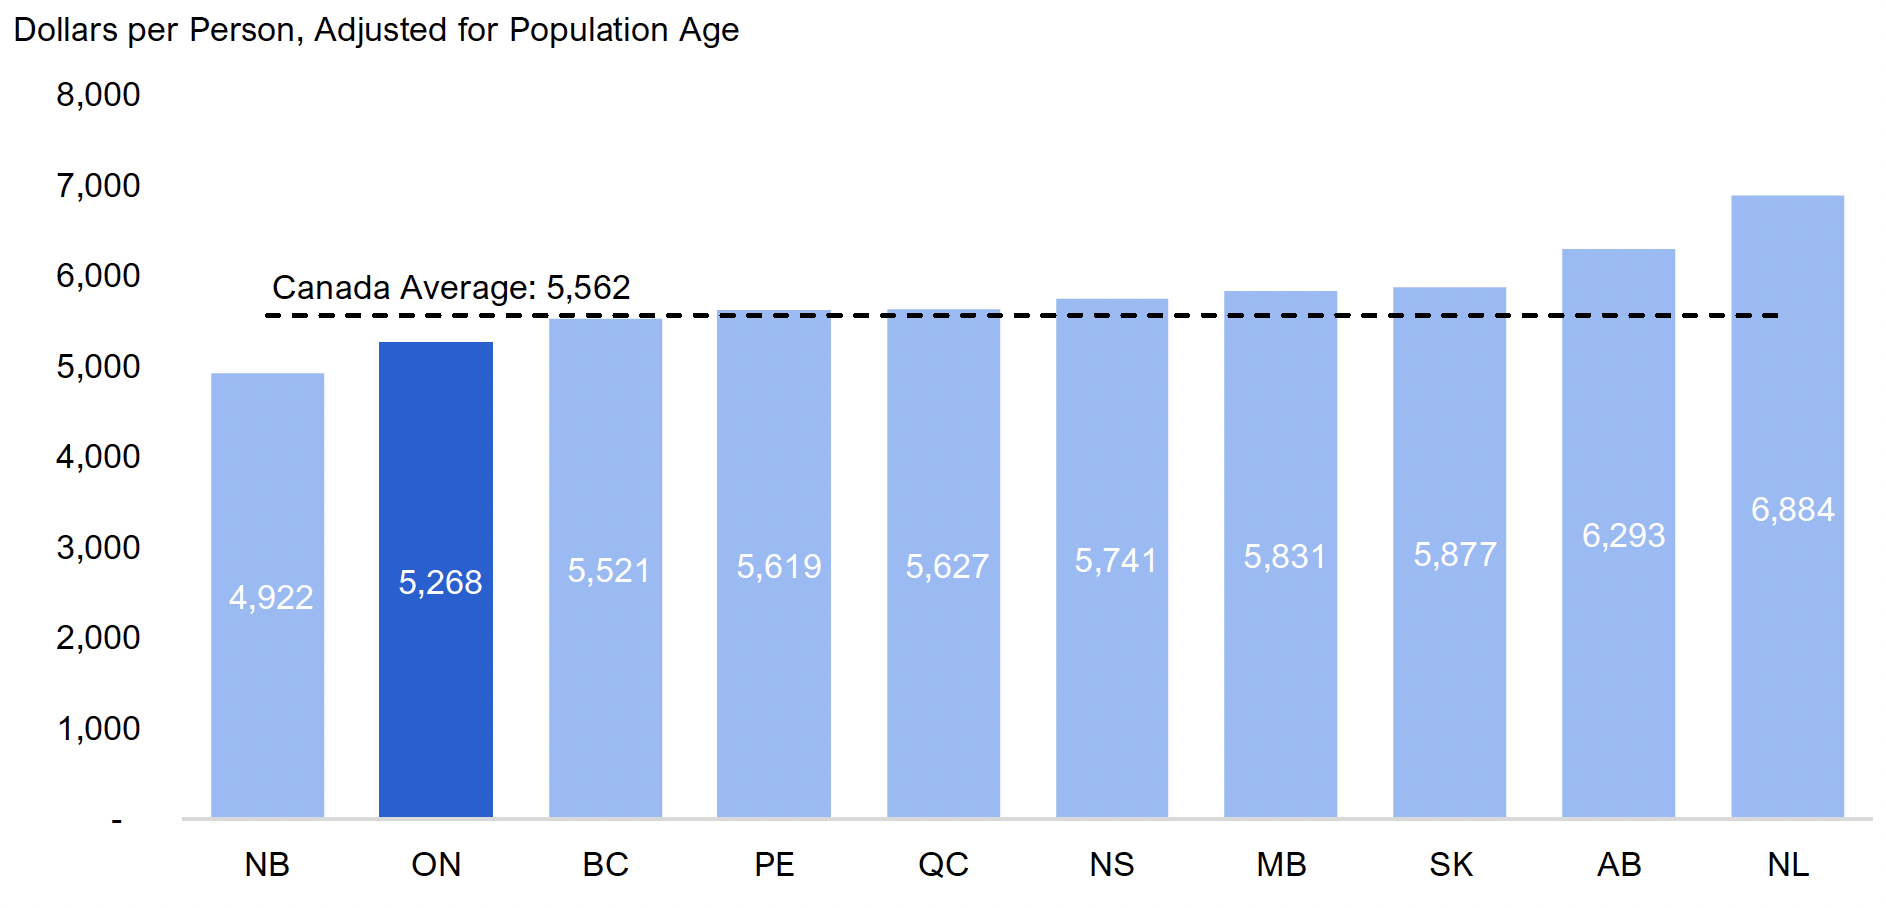
Note: Canada average excludes territories.
Source: FAO analysis of CIHI National Health Expenditure Trends, 2024: Data Tables – Series E1.
Accessible version
| Province | Dollars per Person, Adjusted for Population Age |
|---|---|
| NB | 4,922 |
| ON | 5,268 |
| BC | 5,521 |
| PE | 5,619 |
| QC | 5,627 |
| NS | 5,741 |
| MB | 5,831 |
| SK | 5,877 |
| AB | 6,293 |
| NL | 6,884 |
| Canada Average | 5,562 |
Provincial Hospital Funding
In 2022, Ontario had the lowest age-standardized per capita provincial funding for hospitals at $1,805, compared to the Canadian average of $1,949. British Columbia ($1,855) and Quebec ($1,909) were also below the Canadian average, while Alberta ($2,305) was above the Canadian average.
Figure 5.2 Age-standardized per capita provincial funding for hospitals in 2022
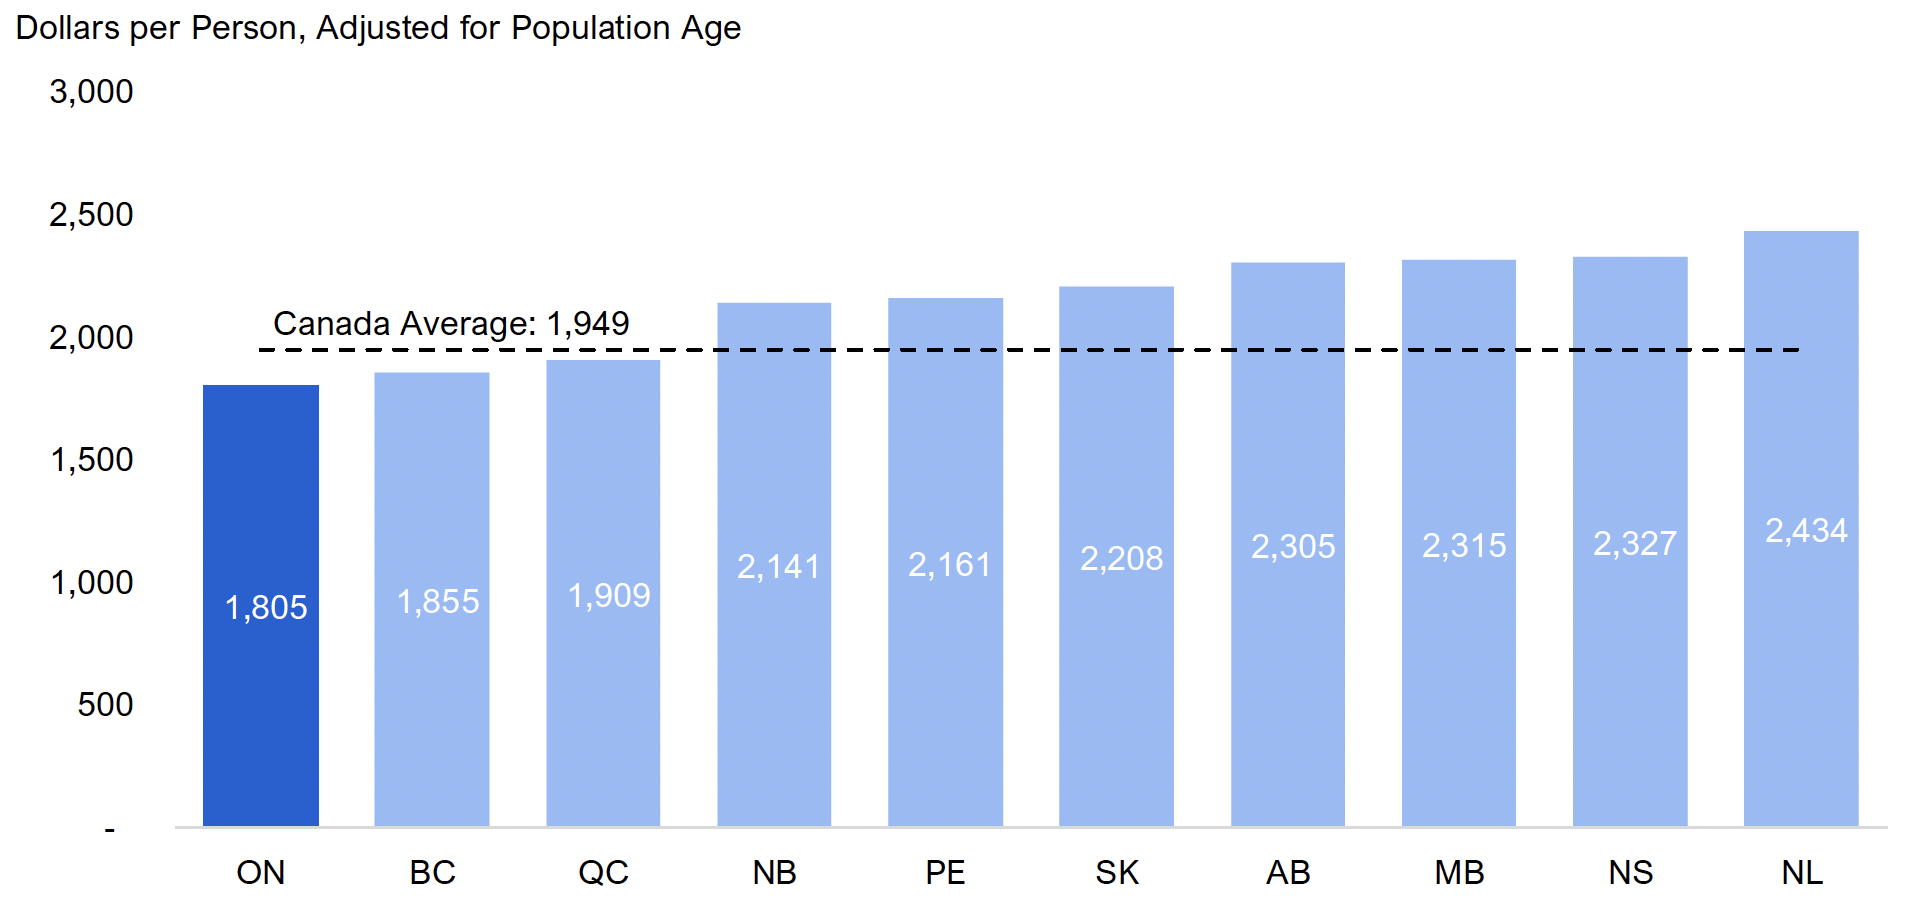
Note: Canada average excludes territories.
Source: FAO analysis of CIHI National Health Expenditure Trends, 2024: Data Tables – Series E2.
Accessible version
| Province | Dollars per Person, Adjusted for Population Age |
|---|---|
| ON | 1,805 |
| BC | 1,855 |
| QC | 1,909 |
| NB | 2,141 |
| PE | 2,161 |
| SK | 2,208 |
| AB | 2,305 |
| MB | 2,315 |
| NS | 2,327 |
| NL | 2,434 |
| Canada Average | 1,949 |
Spending on Physicians
In 2022, Ontario had above average age-standardized per capita spending on physicians, at $1,137 per person. Ontario’s spending on physicians was higher than spending by British Columbia ($1,040) and Quebec ($905) but lower than spending by Alberta ($1,374).
Figure 5.3 Age-standardized per capita spending on physicians by province in 2022
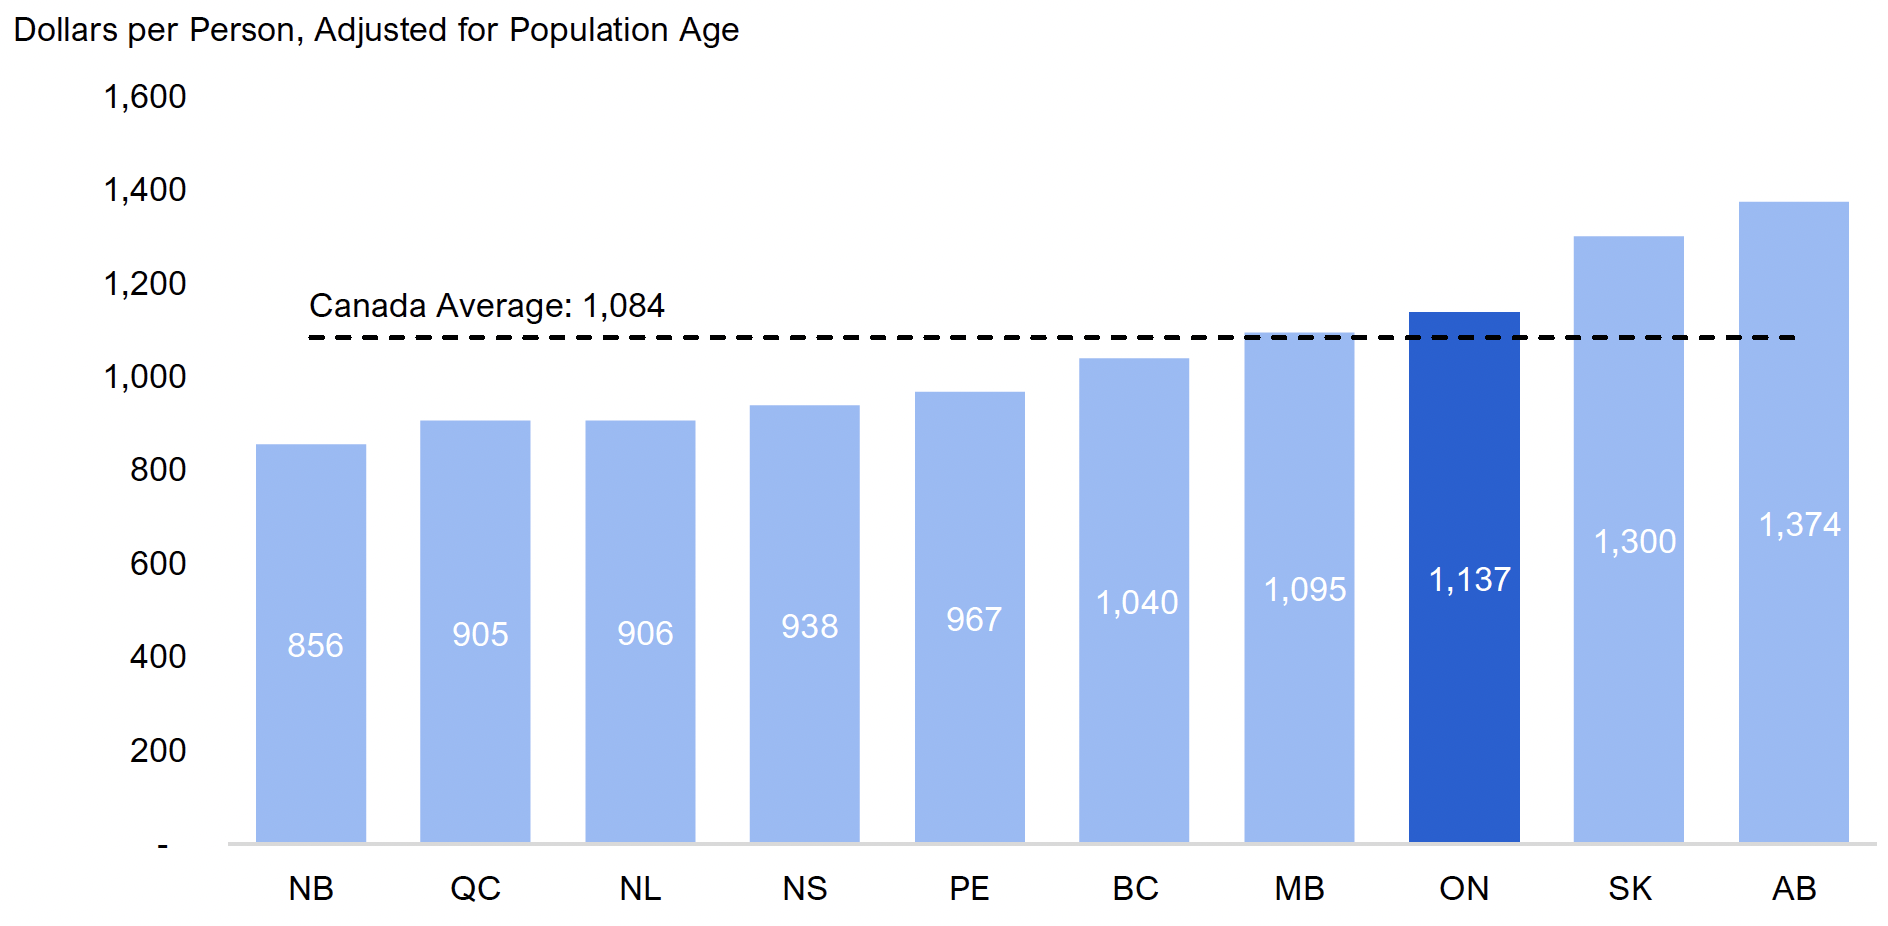
Note: Canada average excludes territories.
Source: FAO analysis of CIHI National Health Expenditure Trends, 2024: Data Tables – Series E4.
Accessible version
| Province | Dollars per Person, Adjusted for Population Age |
|---|---|
| NB | 856 |
| QC | 905 |
| NL | 906 |
| NS | 938 |
| PE | 967 |
| BC | 1,040 |
| MB | 1,095 |
| ON | 1,137 |
| SK | 1,300 |
| AB | 1,374 |
| Canada Average | 1,084 |
Public Drug Spending
In 2022, Ontario ranked second among the provinces for age-standardized per capita public drug spending, at $440 per person, above the national average of $353. Ontario was second only to Alberta ($489) and significantly ahead of British Columbia ($233) and Quebec ($262).
Figure 5.4 Age-standardized per capita public drug spending by province in 2022
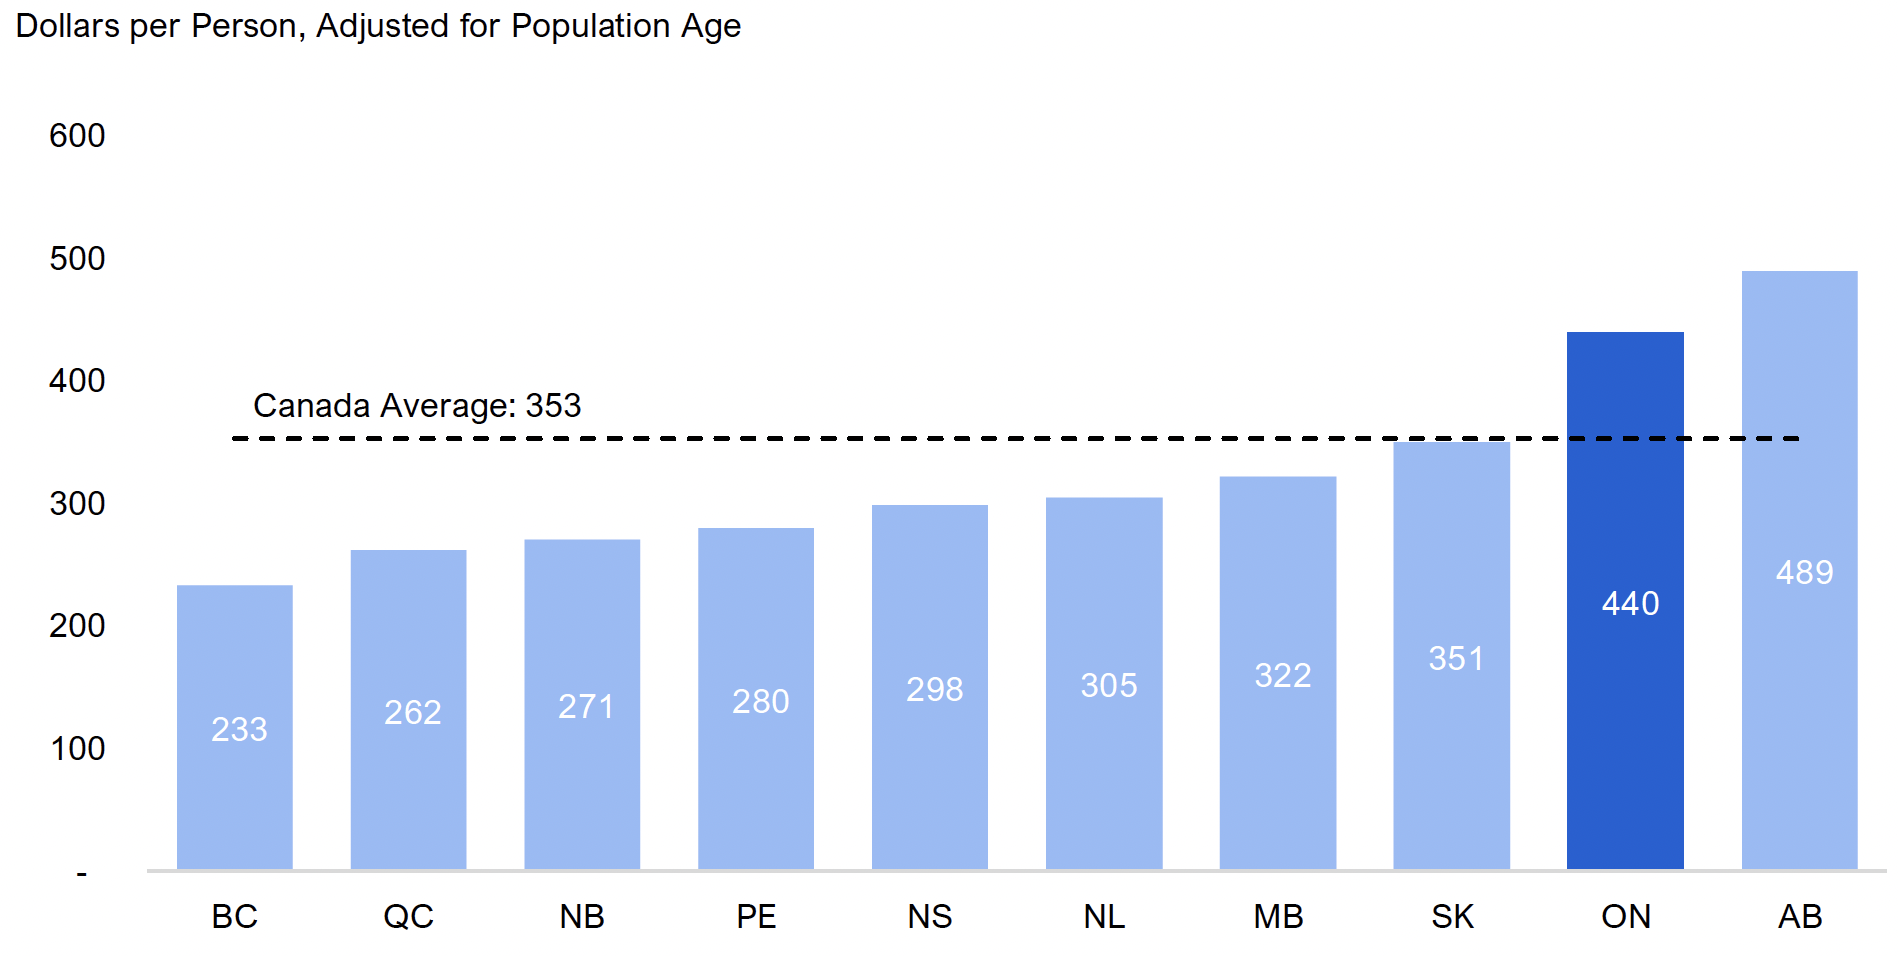
Note: Canada average excludes territories.
Source: FAO analysis of CIHI National Health Expenditure Trends, 2024: Data Tables – Series E6.
Accessible version
| Province | Dollars per Person, Adjusted for Population Age |
|---|---|
| BC | 233 |
| QC | 262 |
| NB | 271 |
| PE | 280 |
| NS | 298 |
| NL | 305 |
| MB | 322 |
| SK | 351 |
| ON | 440 |
| AB | 489 |
| Canada Average | 353 |
Hospital Beds
In 2022, Ontario had a below average number of hospital beds among the provinces, after adjusting for population and population age, with 230 hospital beds per 100,000 population. This placed Ontario ahead of British Columbia (225) but below the national average of 249 beds per 100,000 residents and Alberta (281).
Figure 5.5 Age-standardized number of hospital beds per 100,000 population by province in 2022
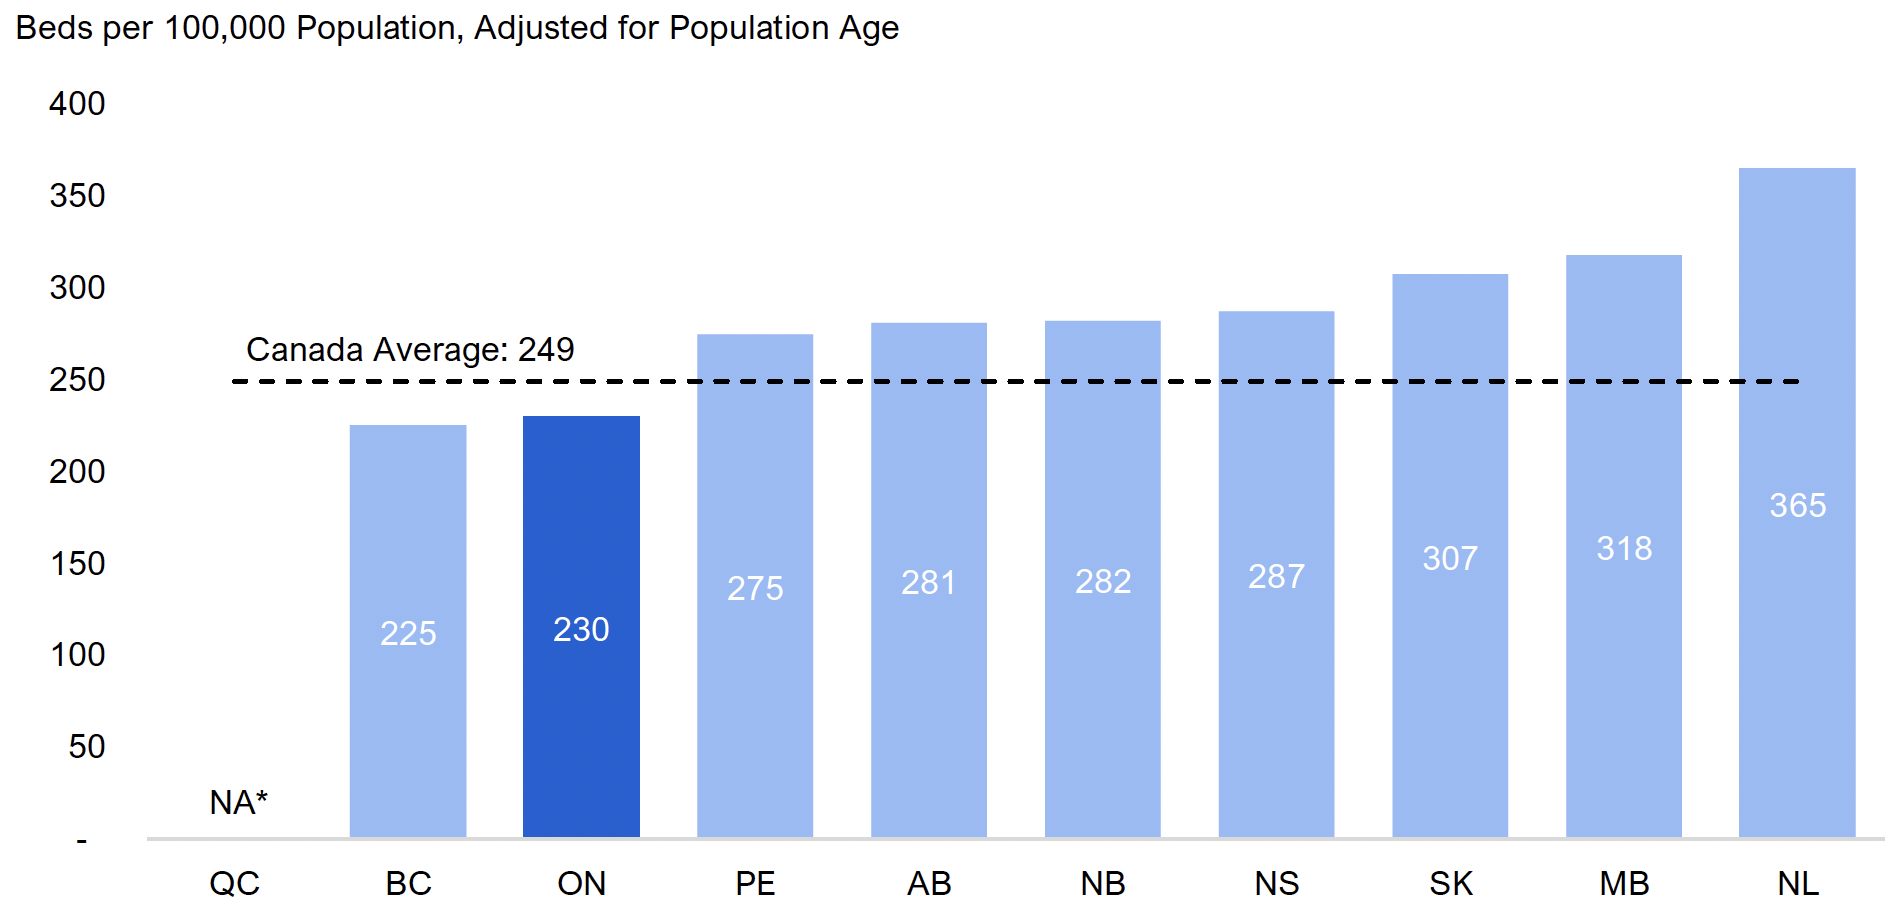
Note: *Quebec is excluded from the comparison because it does not report to CIHI hospital-based long-term care beds (referred to as chronic care beds in Ontario). These beds are distinct from long-term care beds in residential facilities. Canada average excludes territories.
Source: FAO analysis of CIHI Trends in Hospital Spending, 2009-2010 to 2022-2023 – Data Tables – Series D: Beds Staffed and In Operation by Functional Centre.
Accessible version
| Province | Beds per 100,000 Population, Adjusted for Population Age |
|---|---|
| QC | NA* |
| BC | 225 |
| ON | 230 |
| PE | 275 |
| AB | 281 |
| NB | 282 |
| NS | 287 |
| SK | 307 |
| MB | 318 |
| NL | 365 |
| Canada Average | 249 |
Number of Physicians
In 2022, Ontario had the fourth lowest number of physicians among the provinces, after adjusting for population and population age, with 233 physicians per 100,000 population. Ontario was below the Canadian average (246), Quebec (252), British Columbia (261) and Alberta (262).
Figure 5.6 Age-standardized number of physicians per 100,000 population by province in 2022
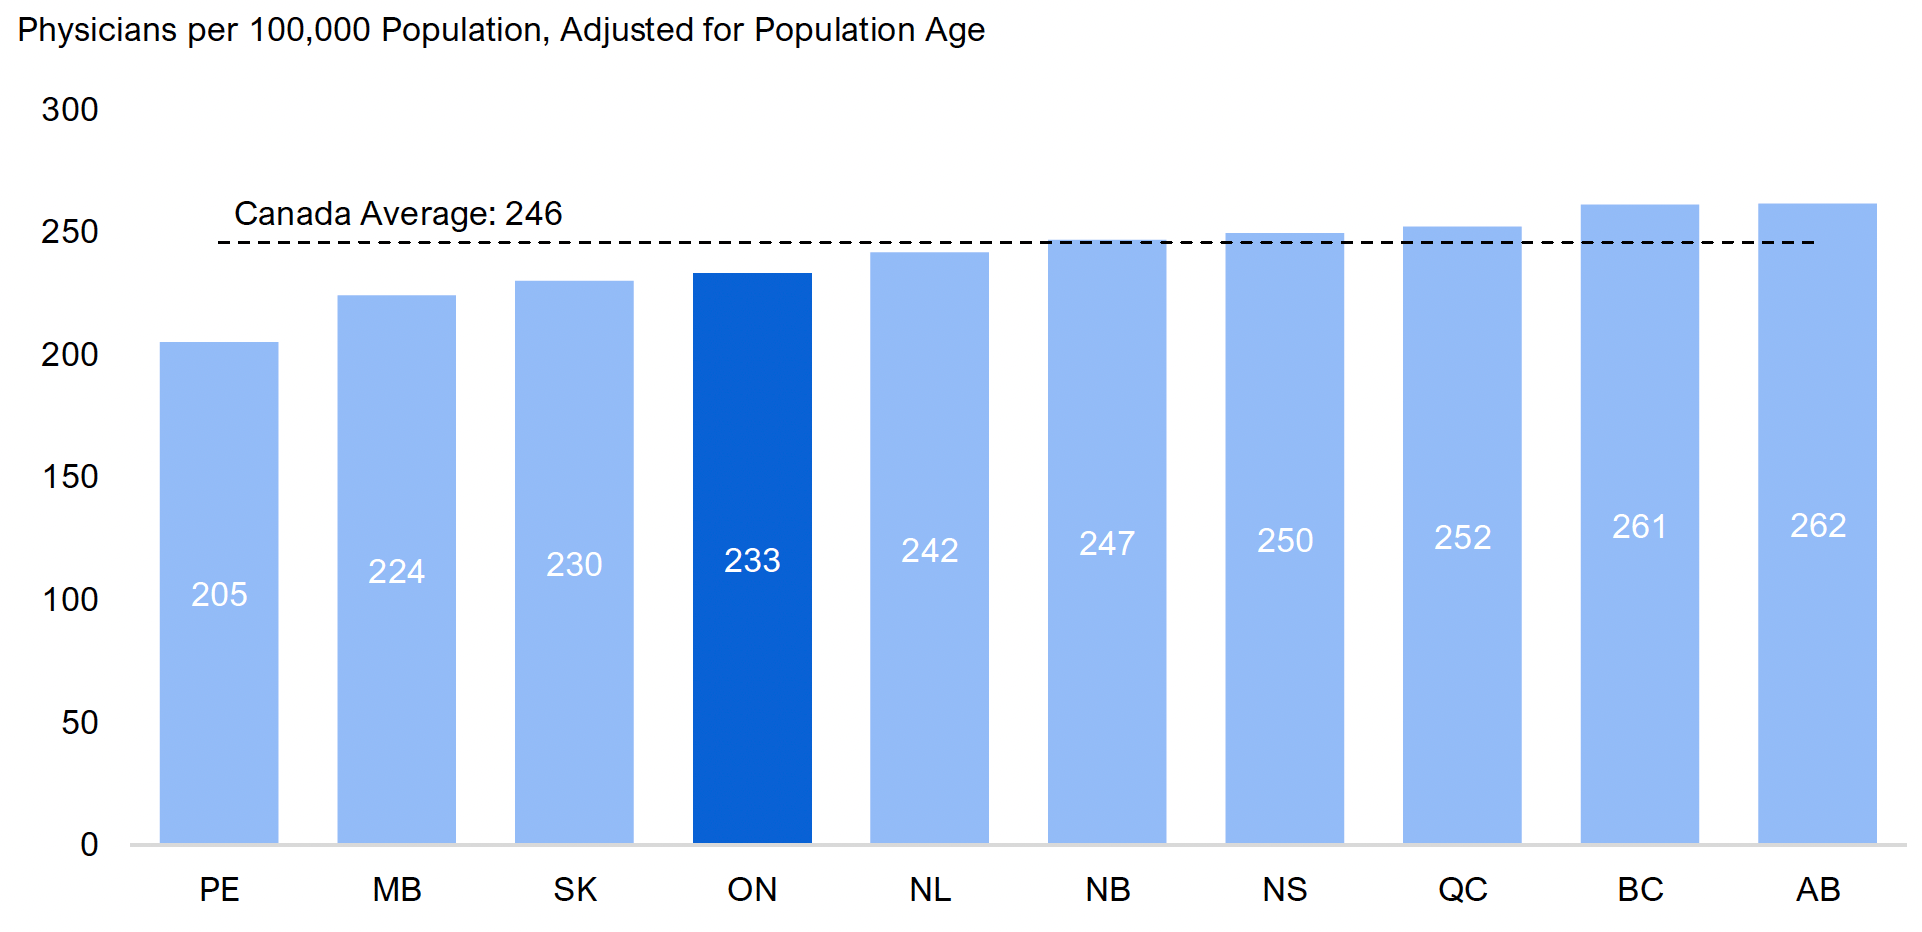
Note: Canada average excludes territories.
Source: FAO analysis of CIHI Supply, Distribution and Migration of Physicians in Canada, 2023 – Historical Data.
Accessible version
| Province | Physicians per 100,000 Population, Adjusted for Population Age |
|---|---|
| PE | 205 |
| MB | 224 |
| SK | 230 |
| ON | 233 |
| NL | 242 |
| NB | 247 |
| NS | 250 |
| QC | 252 |
| BC | 261 |
| AB | 262 |
| Canada Average | 246 |
Footnotes
[1] FAO, Government Spending Trends: 1990 to 2023.
[2] Funded hospital beds represent hospital beds that have been allocated operating funding by the Province and are actively staffed and available to patients.
[3] For a long-term historical analysis of the number of hospital beds in Ontario, see FAO, Government Spending Trends: 1990 to 2023.
[4] Over 90 per cent of LTC residents are over the age of 75, CIHI, Profile of Residents in Residential and Hospital-Based Continuing Care, 2023–2024, Table 3.
[5] For a long-term historical analysis of the number of long-term care beds in Ontario, see FAO, Government Spending Trends: 1990 to 2023.
[6] For a long-term historical analysis of the number of physicians in Ontario, see FAO, Government Spending Trends: 1990 to 2023.
[7] Payments to physicians are authorized through the Health Insurance Act, 1990, applicable regulations and physician services agreements negotiated between the Province and the OMA.
[8] For example, the renewed Physician Services Agreement (PSA) provided a 9.95 per cent pay increase retroactive to April 1, 2024 and a subsequent arbitration decision granted a further 7.3 per cent compensation increase from 2025 to 2028. The PSA also confirmed the new Family Health Organization Plus (FHO+) model, which is intended to reduce administrative burden, address compensation issues and strengthen primary care. In addition, the Province plans to further reduce administrative burden through digitization. The Province is also expanding physician training with a new medical school at Toronto Metropolitan University in Brampton (2025) and another planned at York University (2028), while adding undergraduate and residency seats across existing programs. To improve retention of medical school graduates, the Province is reserving at least 95 per cent of medical school spots for Ontario residents and tying grants to commitments to practise locally, with an emphasis on primary care.
[9] Age standardization adjusts for differences in population age structures. On average, older Canadians require more health care spending than younger Canadians.
[10] Health sector funding refers to provincial payments to fund the health sector.