


1. Summary
At the request of a Member of Provincial Parliament, this report reviews the Government of Ontario’s (the Province’s) Ministry of Colleges, Universities, Research Excellence and Security (MCURES or ministry) spending plan as outlined in the 2025 Ontario Budget.
Spending Plan Overview
- In the 2025 Ontario Budget, the Province projects that MCURES spending will decrease at an average annual rate of -3.3 per cent, from $14.1 billion in 2024-25 to $12.8 billion in 2027-28.
- This is a significantly slower pace than the 10.1 per cent average annual growth over the previous three years from 2021-22 to 2024-25.
- For context, over the 34-year period from 1990-91 to 2023-24, MCURES spending grew at an average annual rate of 4.2 per cent. If the Province’s MCURES spending plan in the 2025 budget is achieved, it would be the slowest three-year growth rate since 1992-93 to 1995-96.
- The FAO estimated MCURES spending from 2025-26 to 2027-28 that would be required to maintain 2024-25 service levels. Also known as a cost driver forecast, this scenario does not recommend how spending should change but serves as a benchmark to show whether the 2025 budget’s MCURES spending plan is likely to maintain, improve or reduce the quality and accessibility of ministry services.
- Overall, the FAO projects that spending consistent with maintaining 2024-25 ministry service levels would result in an average annual decline of -2.1 per cent. This estimate includes projected increases in domestic student enrolment, decreases in international student enrolment and postsecondary education sector inflation.
- Comparing the MCURES spending plan in the 2025 budget against the FAO’s cost driver projection by fiscal year:
- In 2025-26, the 2025 budget spending plan is largely consistent with the FAO’s cost driver projection, with a difference of $0.1 billion, meaning that there are sufficient funds to maintain 2024-25 service levels.
- In 2026-27, the 2025 budget spending plan exceeds the FAO’s cost driver projection by $0.3 billion, meaning that there are sufficient funds to improve service levels compared to 2024-25.
- In 2027-28, the 2025 budget spending plan is below the FAO’s cost driver projection by $0.5 billion. This funding shortfall means that the Province will need to implement efficiencies (i.e., provide the same level of services with less resources) and/or the Province will need to commit additional funding to the ministry to maintain current service levels.
Spending Plan Analysis: Colleges
- The ministry provides funding to Ontario’s 24 public colleges to support domestic students.
- In 2024-25, the FAO estimates that the Province provided $7,926 in operating funding to colleges per full-time equivalent (FTE) [1] domestic student. Going forward, based on the 2025 budget spending plan, the FAO estimates that provincial funding to colleges will increase to $8,431 per FTE domestic student in 2025-26, after adjusting for inflation, and then decrease to $7,254 per FTE domestic student by 2027-28.
- Total colleges operating spending reflects actual expenditures by colleges based on funds received from the ministry and other funding sources, primarily student tuition fees from both domestic and international students.
- In 2024-25, on a per-FTE student basis, which includes both domestic and international students, the FAO estimates that colleges operating spending was $17,600.[2] Going forward, based on the 2025 budget spending plan, the FAO estimates that inflation-adjusted colleges operating spending per FTE student will increase to $20,257 in 2025-26, rising to $21,789 in 2027-28.
Spending Plan Analysis: Universities
- The ministry provides operating funding to Ontario’s 23 public universities to support domestic students.
- In 2024-25, provincial operating funding to universities was $8,886 per FTE domestic student. Going forward, based on the 2025 budget spending plan, the FAO estimates that provincial operating funding to universities per FTE domestic student will increase to $9,294 in 2025-26, after adjusting for inflation, and then decline to $8,013 in 2027-28.
Interprovincial Comparison
- In 2022-23, Ontario had the lowest per FTE domestic student provincial funding for colleges among all provinces, at $10,910, which was $5,093 below the national average of $16,002. Compared to other large provinces, Ontario’s per FTE domestic student colleges funding was lower than in British Columbia ($18,465), Quebec ($17,977) and Alberta ($17,592).
- In 2022-23, Ontario ranked the second lowest in terms of colleges spending per FTE student (including domestic and international students), at $19,723, which was $741 below the national average of $20,464. Compared to other large provinces, Ontario’s colleges spending per FTE student was higher than in Quebec ($16,859), but lower than in Alberta ($24,744) and British Columbia ($23,509).
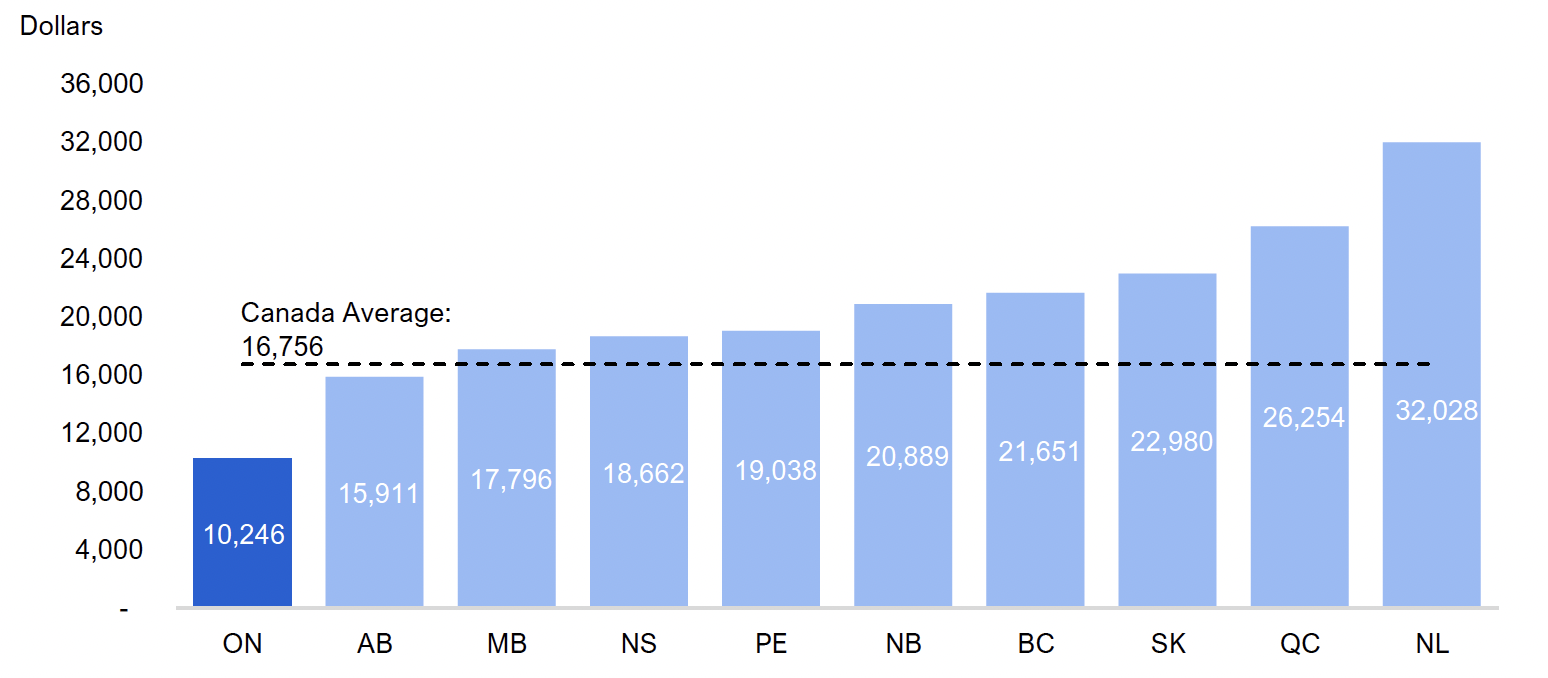
- In 2022-23, Ontario had the lowest per FTE domestic student provincial funding for universities among all provinces, at $10,246, which was $6,511 below the national average of $16,756. Compared to other large provinces, Ontario’s universities funding per FTE domestic student was lower than in Quebec ($26,254), British Columbia ($21,651) and Alberta ($15,911).
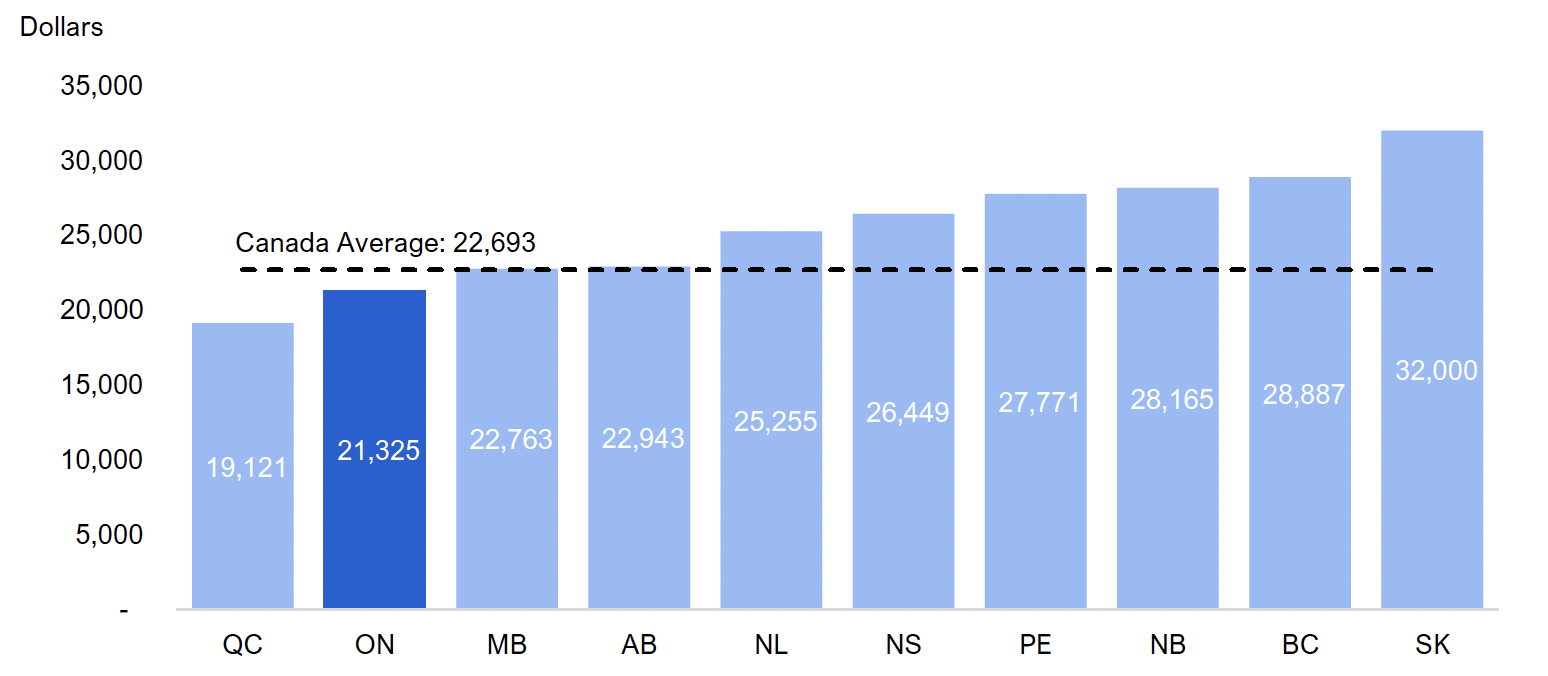
- In 2022-23, Ontario had the second lowest universities spending per FTE student (including domestic and international students) among all provinces, at $21,325, which was $1,368 below the national average of $22,693. Compared to other large provinces, Ontario’s universities spending per FTE student was higher than in Quebec ($19,121), but lower than in British Columbia ($28,887) and Alberta ($22,943).
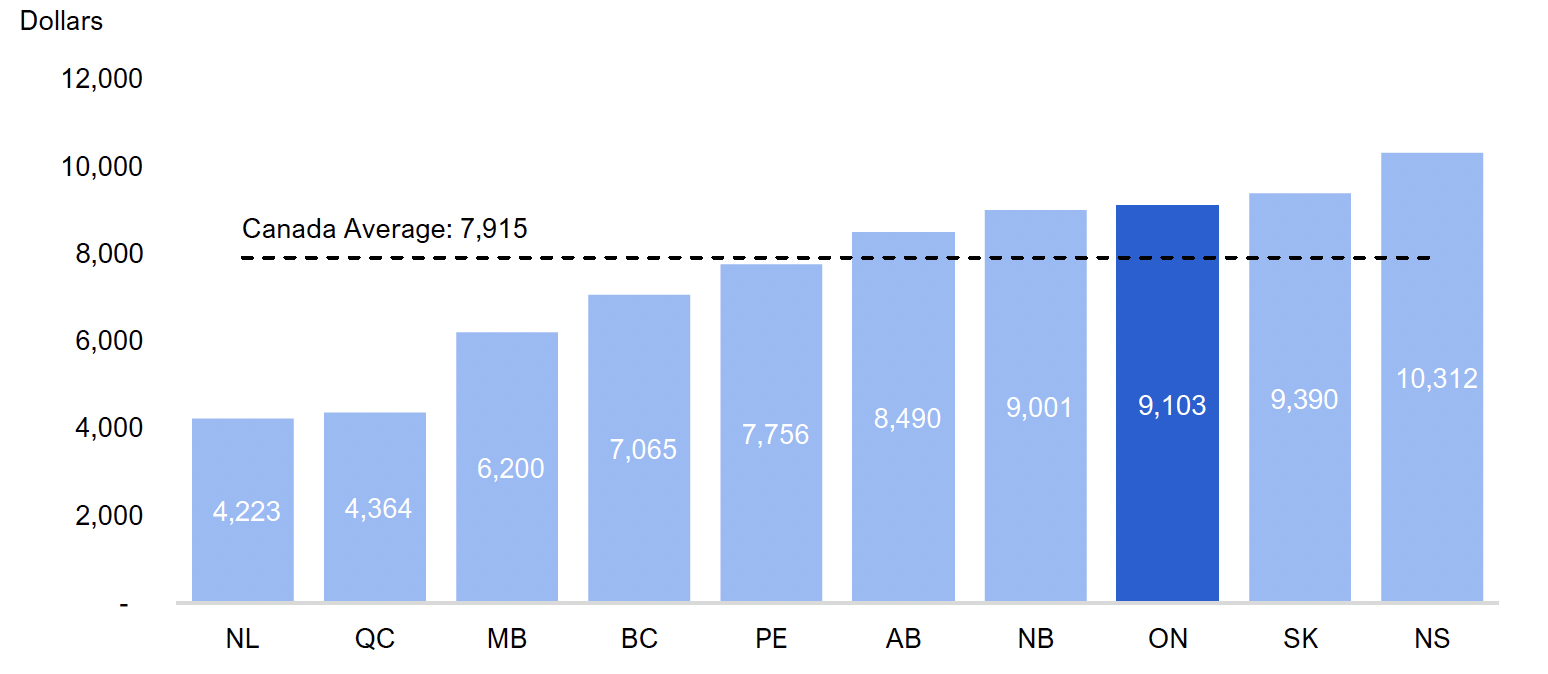
- In 2022-23, Ontario had the third highest average domestic tuition fees per university and college undergraduate full-time domestic student among all provinces, at $9,103, which was $1,188 above the national average of $7,915. Compared to other large provinces, Ontario’s full-time domestic tuition fees were higher than in Quebec ($4,364), British Columbia ($7,065) and Alberta ($8,490).
2. Introduction
- In 2024-25, provincial operating funding to universities was $8,886 per FTE domestic student. Going forward, based on the 2025 budget spending plan, the FAO estimates that provincial operating funding to universities per FTE domestic student will increase to $9,294 in 2025-26, after adjusting for inflation, and then decline to $8,013 in 2027-28.
This report reviews the Government of Ontario’s (the Province’s) Ministry of Colleges, Universities, Research Excellence and Security (MCURES or ministry) spending plan as outlined in the 2025 Ontario Budget.
This analysis was undertaken in response to a request from a Member of Provincial Parliament and is part of a planned series that reviews the spending plans for five ministries: Health; Long-Term Care; Education; Colleges, Universities, Research Excellence and Security; and Children, Community and Social Services.
The report is organized as follows:
- Chapter 3 reviews the Province’s MCURES spending plan in the 2025 Ontario Budget against both historical MCURES spending and estimated ministry cost drivers. The cost driver analysis includes the FAO’s projection for MCURES spending required to maintain current service levels.
- Chapter 4 estimates the impact of the Province’s MCURES spending plan on provincial funding for colleges and universities.
- Chapter 5 provides an interprovincial comparison of postsecondary education funding, spending and tuition fees.
For additional information on the Ministry of Colleges, Universities, Research Excellence and Security’s 2025-26 spending plan, see the FAO’s Examining Ontario’s 2025-26 Expenditure Estimates, which compares planned spending against actual spending over the previous four years to the standard account level of detail.
3. Spending Plan Overview
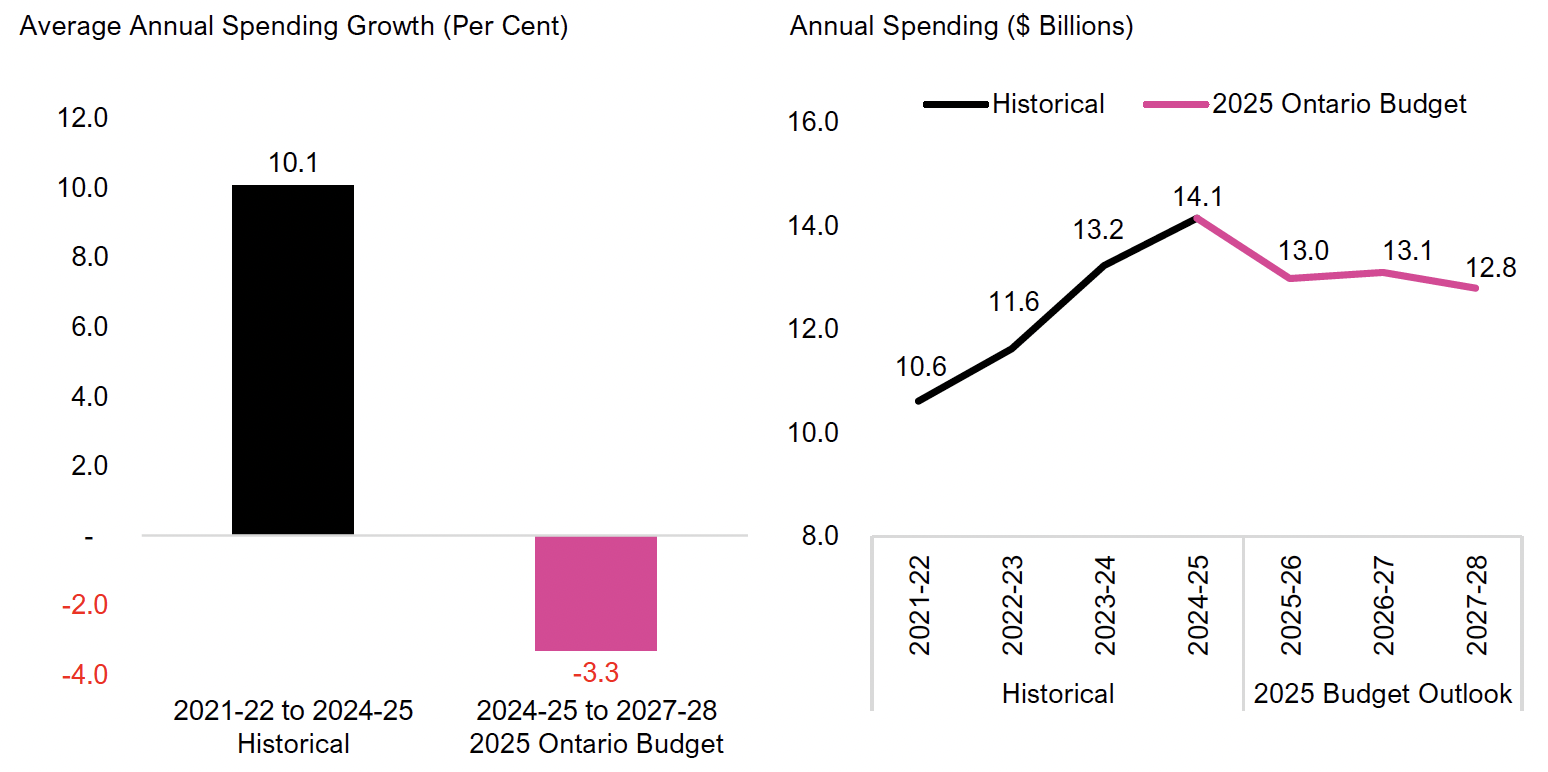
In the 2025 Ontario Budget, the Province projects that Ministry of Colleges, Universities, Research Excellence and Security (MCURES or ministry) spending will decrease at an average annual rate of -3.3 per cent, from $14.1 billion in 2024-25 to $12.8 billion in 2027-28. By comparison, between 2021-22 and 2024-25, provincial spending on MCURES increased at an average annual rate of 10.1 per cent from $10.6 billion to $14.1 billion.
Figure 3.1 Ministry of Colleges, Universities, Research Excellence and Security spending plan in the 2025 Ontario Budget
Note: Historical values are not restated for program transfers or reclassifications, if any.
Source: Ontario Public Accounts and 2025 Ontario Budget.
Accessible version
Average Annual Spending Growth (Per Cent)
| 2021-22 to 2024-25 Historical |
2024-25 to 2027-28 2025 Ontario Budget |
|---|---|
| 10.1 | -3.3 |
Annual Spending ($ Billions)
| Historical | 2025 Ontario Budget | ||
|---|---|---|---|
| Historical | 2021-22 | 10.6 | |
| Historical | 2022-23 | 11.6 | |
| Historical | 2023-24 | 13.2 | |
| Historical | 2024-25 | 14.1 | |
| 2025 Budget Outlook | 2025-26 | 13.0 | |
| 2025 Budget Outlook | 2026-27 | 13.1 | |
| 2025 Budget Outlook | 2027-28 | 12.8 |
For context, over the 34-year period from 1990-91 to 2023-24, MCURES spending grew at an average annual rate of 4.2 per cent.[3] The Province’s MCURES spending plan in the 2025 budget calls for significantly slower spending growth compared to the 34-year average and would be the slowest three-year growth rate since 1992-93 to 1995-96.
Spending Plan Compared to Cost Drivers
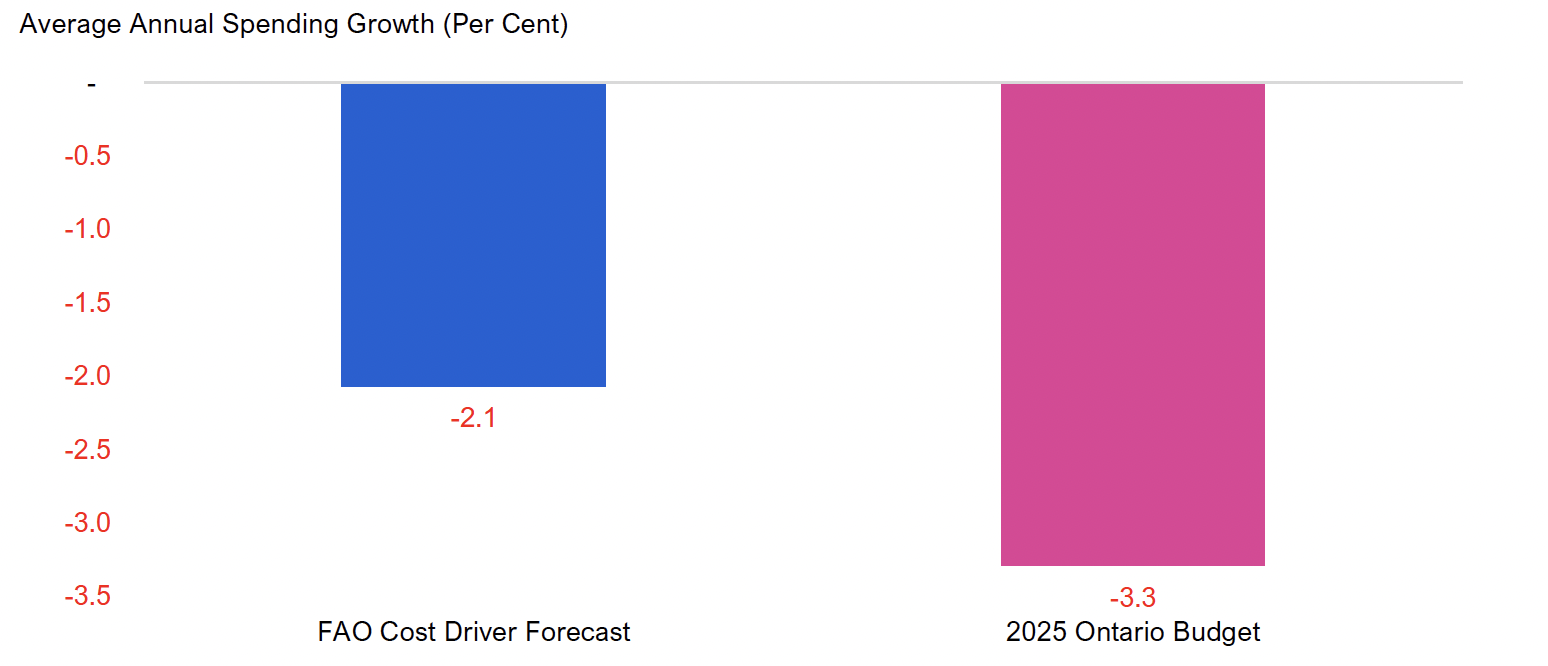
At the request of the Member of Provincial Parliament, the FAO estimated MCURES spending from 2024-25 to 2027-28 that would be required to maintain 2024-25 services levels. Also known as a cost driver forecast, this scenario does not recommend how spending should change but serves as a benchmark to show whether the 2025 budget’s MCURES spending plan is likely to maintain, improve or reduce the quality and accessibility of postsecondary education services.
From 2024-25 to 2027-28, the FAO projects that spending consistent with maintaining 2024-25 ministry service levels would result in an average annual decline of -2.1 per cent. The components of the FAO’s cost driver forecast vary by program area:
- Colleges: The FAO projects that, if the student-instructor ratio and other student services are maintained at 2024-25 levels, college sector spending would decline at an average annual rate of -8.1 per cent. This estimate is based on projected college domestic and international student enrolment and postsecondary education sector inflation, which reflects the rising costs of compensation, classroom supplies and services.
- Universities: The FAO estimates that spending would need to grow by an average annual rate of 3.6 per cent to maintain 2024-25 service levels, defined as maintaining the inflation-adjusted provincial funding per domestic university student. This estimate is based on projected domestic university enrolment and inflation.
- Student Financial Assistance: The FAO estimates that spending would need to grow by an average annual rate of 4.1 per cent to maintain 2024-25 service levels, defined as maintaining inflation-adjusted provincial funding per recipient.
- Other ministry programs: Other programs include ministry operations, grants to postsecondary institutions for research and capital investments, funding for Indigenous institutions, funding for intellectual property, and other expenses. The FAO estimates that spending would need to grow by an average annual rate of 3.6 per cent to maintain 2024-25 service levels.
Figure 3.2 Comparing Ministry of Colleges, Universities, Research Excellence and Security spending growth, FAO cost driver forecast vs. 2025 Ontario Budget, 2024-25 to 2027-28
Source: 2024-25 Public Accounts of Ontario, 2025 Ontario Budget and FAO analysis.
Accessible version
Average Annual Spending Growth (Per Cent)
| FAO Cost Driver Forecast | 2025 Ontario Budget |
|---|---|
| -2.1 | -3.3 |
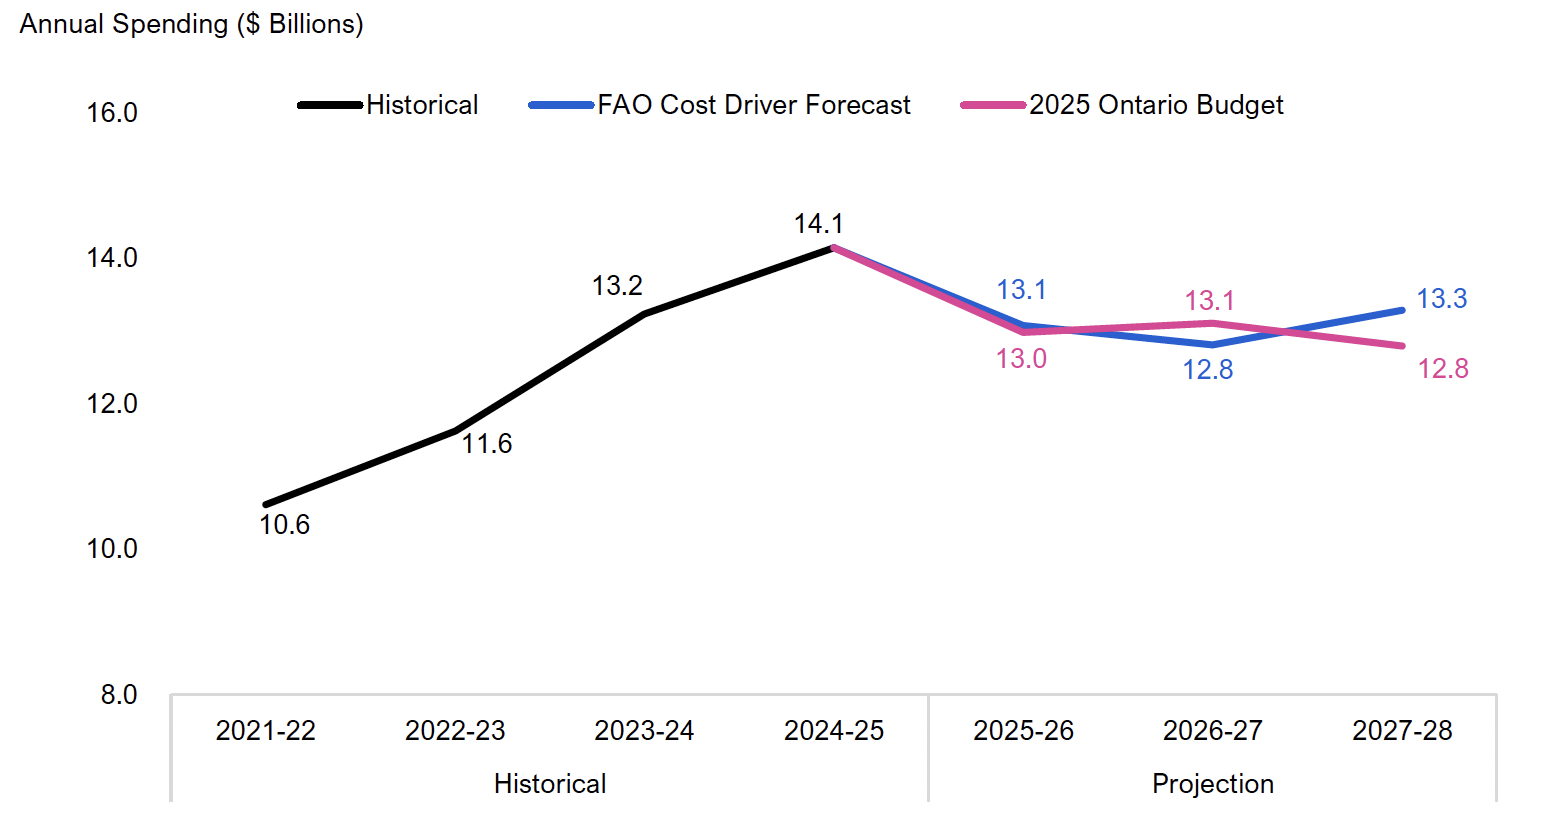
Comparing the MCURES spending plan in the 2025 budget against the FAO’s cost driver projection by fiscal year:
- In 2025-26, the 2025 budget spending plan is largely consistent with the FAO’s cost driver projection, with a difference of $0.1 billion, meaning that there are sufficient funds to maintain 2024-25 service levels.
- In 2026-27, the 2025 budget spending plan exceeds the FAO’s cost driver projection by $0.3 billion, meaning that there are sufficient funds to improve service levels compared to 2024-25.
- In 2027-28, the 2025 budget spending plan is below the FAO’s cost driver projection by $0.5 billion. This funding shortfall means that the Province will need to implement efficiencies (i.e., provide the same level of services with less resources) and/or the Province will need to commit additional funding to the ministry to maintain current service levels.
Figure 3.3 FAO cost driver projection and the Ministry of Colleges, Universities, Research Excellence and Security spending plan in the 2025 Ontario Budget
Note: Historical values are not restated for program transfers or reclassifications, if any.
Source: Ontario Public Accounts, 2025 Ontario Budget and FAO analysis.
Accessible version
Annual Spending ($ Billions)
| Historical | FAO Cost Driver Forecast | 2025 Ontario Budget | ||
|---|---|---|---|---|
| Historical | 2021-22 | 10.6 | ||
| Historical | 2022-23 | 11.6 | ||
| Historical | 2023-24 | 13.2 | ||
| Historical | 2024-25 | 14.1 | ||
| Projection | 2025-26 | 13.1 | 13.0 | |
| Projection | 2026-27 | 12.8 | 13.1 | |
| Projection | 2027-28 | 13.2 | 12.8 |
4. Spending Plan Analysis
At the request of the Member of Provincial Parliament, the FAO analyzed the impact of the Province’s MCURES spending plan in the 2025 Ontario Budget on provincial funding for colleges and universities.
Colleges
Ontario’s 24 public colleges’ operating expenditures are funded by payments from the Ministry of Colleges, Universities, Research Excellence and Security, as well as student tuition fees from both domestic and international students.
Provincial operating funding to colleges
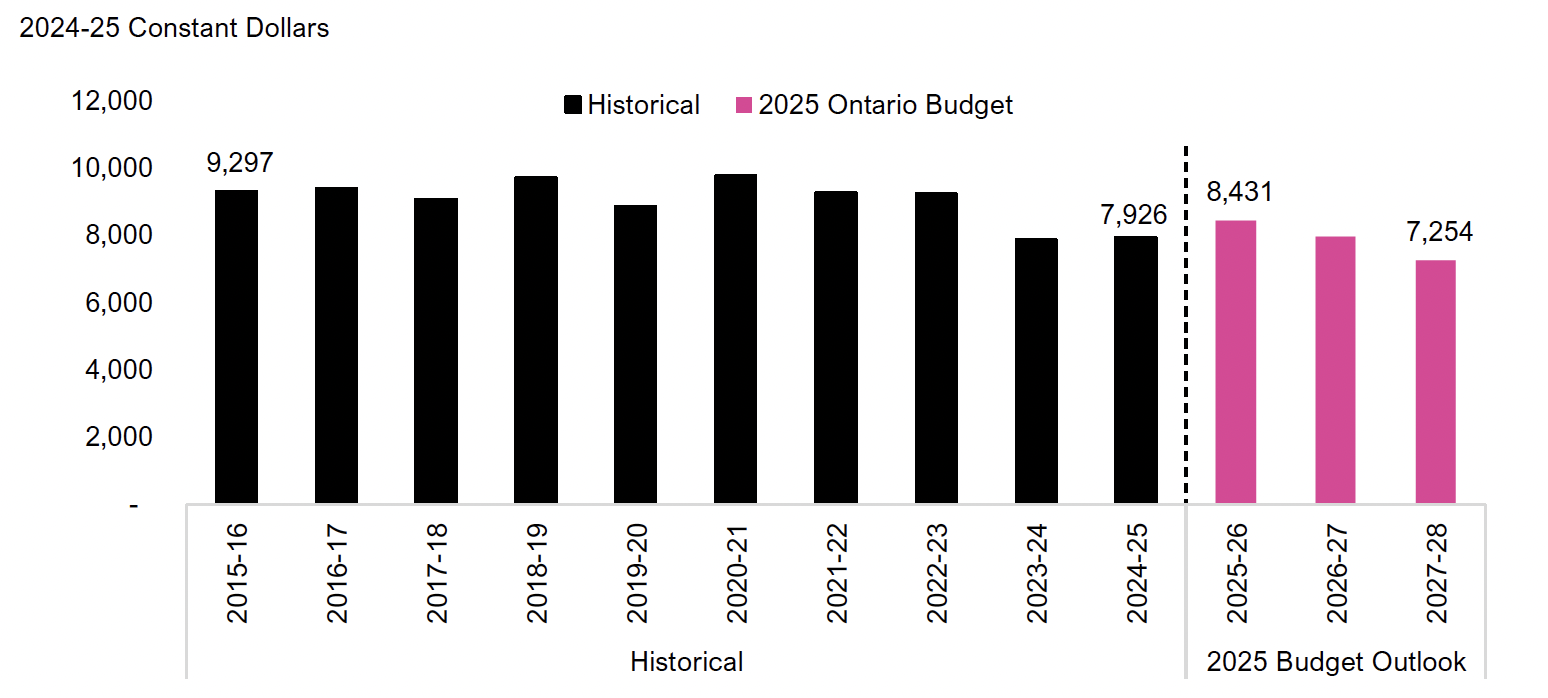
The Province provides funding to colleges to support domestic students. In 2024-25, the FAO estimates that the Province provided $7,926 in operating funding per full-time equivalent (FTE)[4] domestic student. Going forward, based on the 2025 budget MCURES spending plan, the FAO estimates that provincial funding will increase to $8,431 per FTE domestic student in 2025-26, after adjusting for inflation. However, inflation-adjusted provincial funding is expected to decrease to $7,254 per FTE domestic student by 2027-28.
Figure 4.1 Provincial operating funding to public colleges per FTE domestic student, inflation-adjusted, 2015-16 to 2027-28
Note: The FAO estimates full-time equivalent enrolment as full-time enrolment, plus part-time enrolment divided by 3.5.
Source: Statistics Canada, “Postsecondary enrolments, by registration status, institution type, status of student in Canada and gender”, Table: 37-10-0018-01, and FAO analysis of information provided by the Province.
Accessible version
2024-25 Constant Dollars
| Historical | 2025 Ontario Budget | ||
|---|---|---|---|
| Historical | 2015-16 | 9,297 | |
| Historical | 2016-17 | 9,380 | |
| Historical | 2017-18 | 9,071 | |
| Historical | 2018-19 | 9,710 | |
| Historical | 2019-20 | 8,867 | |
| Historical | 2020-21 | 9,788 | |
| Historical | 2021-22 | 9,277 | |
| Historical | 2022-23 | 9,240 | |
| Historical | 2023-24 | 7,862 | |
| Historical | 2024-25 | 7,926 | |
| 2025 Budget Outlook | 2025-26 | 8,431 | |
| 2025 Budget Outlook | 2026-27 | 7,966 | |
| 2025 Budget Outlook | 2027-28 | 7,254 |
Operating spending by colleges
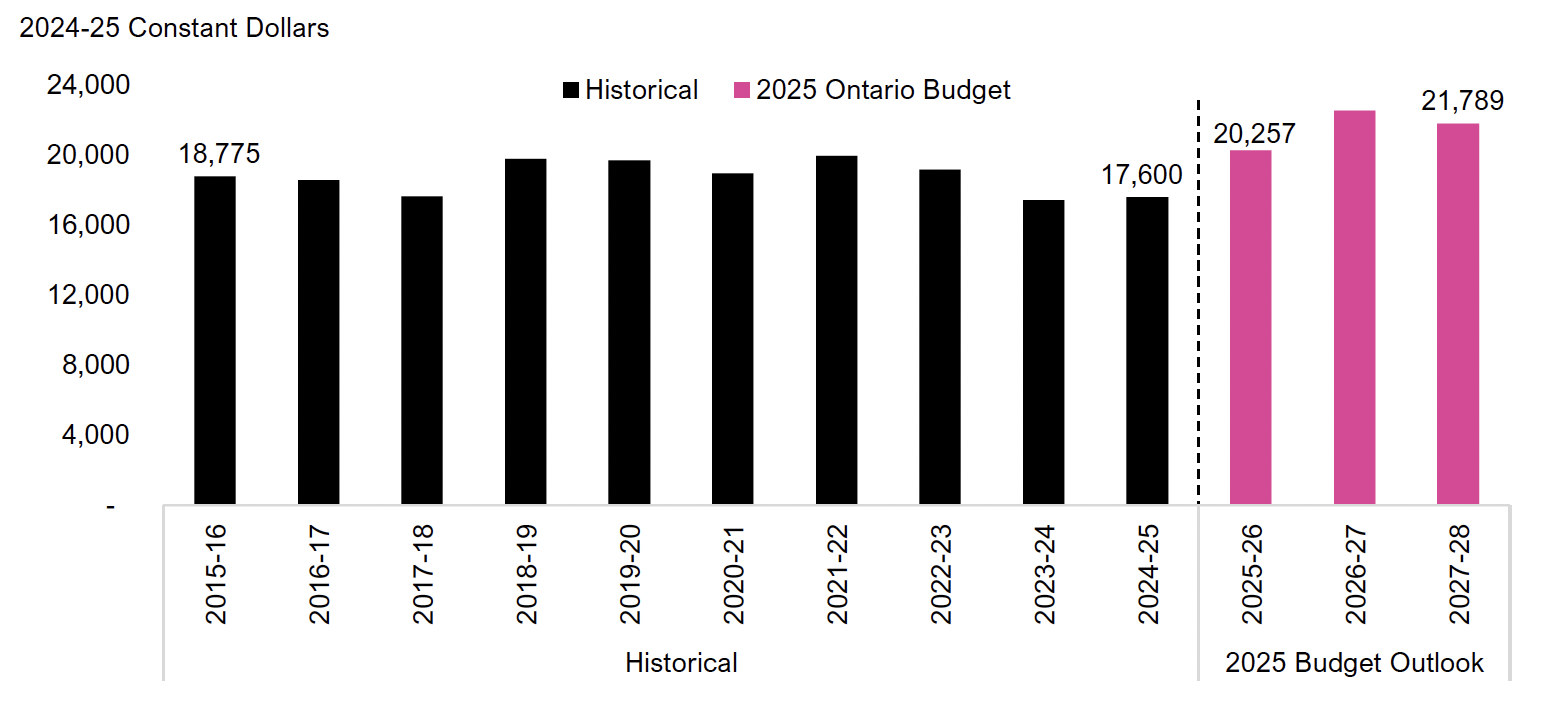
Colleges operating spending is funded through provincial transfers and other funding sources that are primarily comprised of student tuition fees. On a per-FTE student basis, which includes both domestic and international students, the FAO estimates that 2024-25 colleges operating spending was $17,600.[5] Going forward, based on the 2025 budget MCURES spending plan, the FAO estimates that inflation-adjusted colleges operating spending per FTE student will increase to $20,257 in 2025-26, rising to $21,789 in 2027-28.
Figure 4.2 Public colleges operating spending per FTE student, inflation-adjusted, 2015-16 to 2027-28
Note: Excludes spending and enrolment related to public college-private partnerships. The FAO estimates full-time equivalent enrolment as full-time enrolment, plus part-time enrolment divided by 3.5.
Source: Statistics Canada, “Postsecondary enrolments, by registration status, institution type, status of student in Canada and gender”, Table: 37-10-0018-01, and FAO analysis of information provided by the Province.
Accessible version
2024-25 Constant Dollars
| Historical | 2025 Ontario Budget | ||
|---|---|---|---|
| Historical | 2015-16 | 18,775 | |
| Historical | 2016-17 | 18,564 | |
| Historical | 2017-18 | 17,654 | |
| Historical | 2018-19 | 19,780 | |
| Historical | 2019-20 | 19,693 | |
| Historical | 2020-21 | 18,956 | |
| Historical | 2021-22 | 19,947 | |
| Historical | 2022-23 | 19,172 | |
| Historical | 2023-24 | 17,432 | |
| Historical | 2024-25 | 17,600 | |
| 2025 Budget Outlook | 2025-26 | 20,257 | |
| 2025 Budget Outlook | 2026-27 | 22,542 | |
| 2025 Budget Outlook | 2027-28 | 21,789 |
Universities
Provincial operating funding to universities
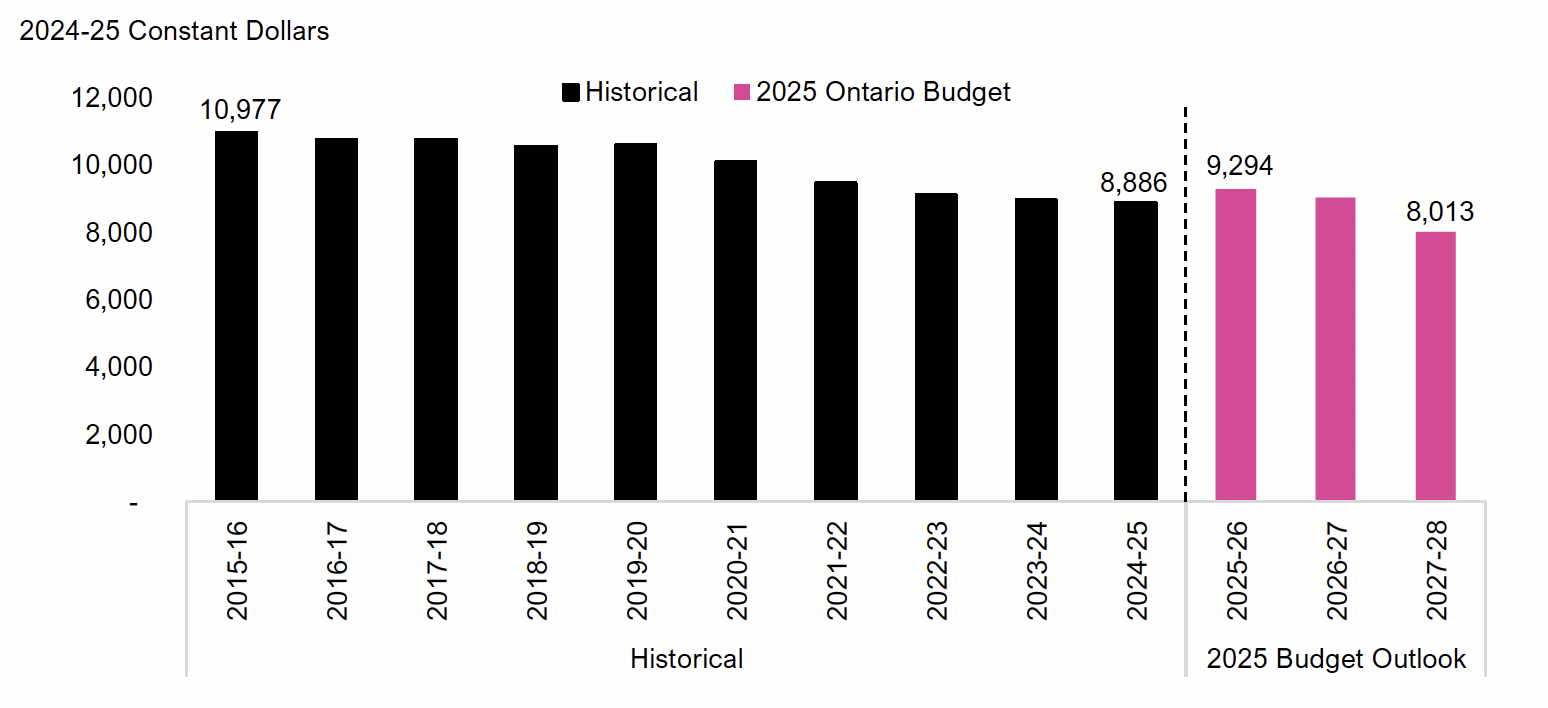
The Ministry of Colleges, Universities, Research Excellence and Security provides funding to the province’s 23 public universities. This funding is intended to support domestic students studying in Ontario’s universities.
Provincial operating funding to universities was $8,886 per FTE domestic student in 2024-25. Going forward, based on the 2025 budget MCURES spending plan, the FAO estimates that provincial operating funding to universities per FTE domestic student will increase to $9,294 in 2025-26, after adjusting for inflation, and then decline to $8,013 in 2027-28.
Figure 4.3 Provincial operating funding to public universities per FTE domestic student, inflation-adjusted, 2015-16 to 2027-28
Note: The FAO estimates full-time equivalent enrolment as full-time enrolment, plus part-time enrolment divided by 3.5.
Source: Statistics Canada, “Postsecondary enrolments, by registration status, institution type, status of student in Canada and gender”, Table: 37-10-0018-01, and FAO analysis of information provided by the Province.
Accessible version
2024-25 Constant Dollars
| Historical | 2025 Ontario Budget | ||
|---|---|---|---|
| Historical | 2015-16 | 10,977 | |
| Historical | 2016-17 | 10,778 | |
| Historical | 2017-18 | 10,761 | |
| Historical | 2018-19 | 10,554 | |
| Historical | 2019-20 | 10,617 | |
| Historical | 2020-21 | 10,107 | |
| Historical | 2021-22 | 9,482 | |
| Historical | 2022-23 | 9,125 | |
| Historical | 2023-24 | 8,985 | |
| Historical | 2024-25 | 8,886 | |
| 2025 Budget Outlook | 2025-26 | 9,294 | |
| 2025 Budget Outlook | 2026-27 | 9,043 | |
| 2025 Budget Outlook | 2027-28 | 8,013 |
5. Interprovincial Comparison
At the request of the Member of Provincial Parliament, this chapter compares provincial funding to colleges and universities with funding in other provinces. It also compares colleges and universities spending and average domestic tuition fees across provinces.
Colleges
Provincial funding to colleges
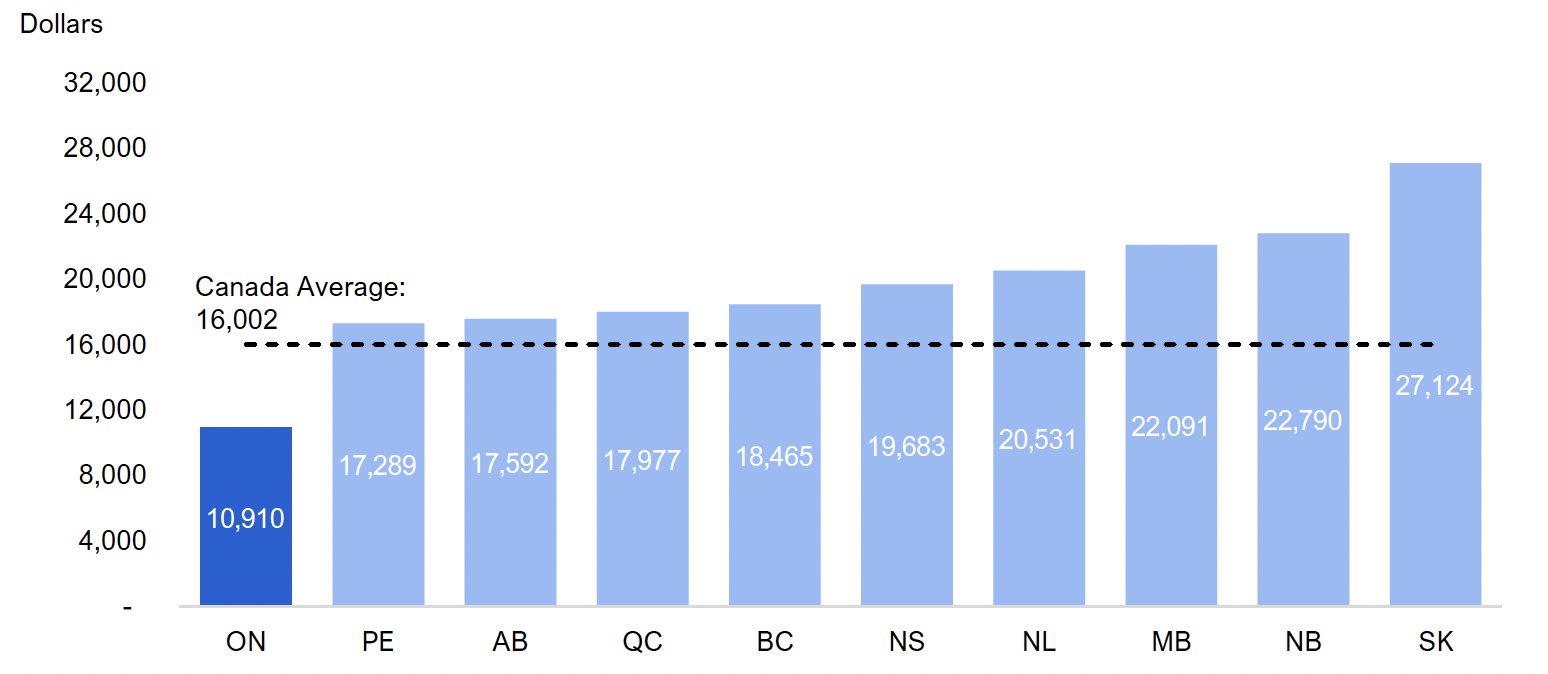
In 2022-23, Ontario had the lowest per full-time equivalent (FTE) domestic student provincial funding for colleges among all provinces, at $10,910, which was $5,093 below the national average of $16,002. Compared to other large provinces, Ontario’s per FTE domestic student colleges funding was lower than in British Columbia ($18,465), Quebec ($17,977) and Alberta ($17,592).
Figure 5.1 Provincial funding to public colleges per FTE domestic college student, by province, 2022-23
Note: The FAO estimates full-time equivalent enrolment as full-time enrolment, plus part-time enrolment divided by 3.5. Canada average does not include territories. Quebec college funding includes direct subsidies to lower “in province” domestic student tuition fees.
Source: Statistics Canada, “Revenues of colleges by type of revenues and funds”, Table: 37-10-0028-01 and “Postsecondary enrolments, by registration status, institution type, status of student in Canada and gender”, Table: 37-10-0018-01.
Accessible version
Dollars
| Province | Funding per FTE Domestic Student |
|---|---|
| ON | 10,910 |
| PE | 17,289 |
| AB | 17,592 |
| QC | 17,977 |
| BC | 18,465 |
| NS | 19,683 |
| NL | 20,531 |
| MB | 22,091 |
| NB | 22,790 |
| SK | 27,124 |
| Canada Average | 16,002 |
Colleges spending
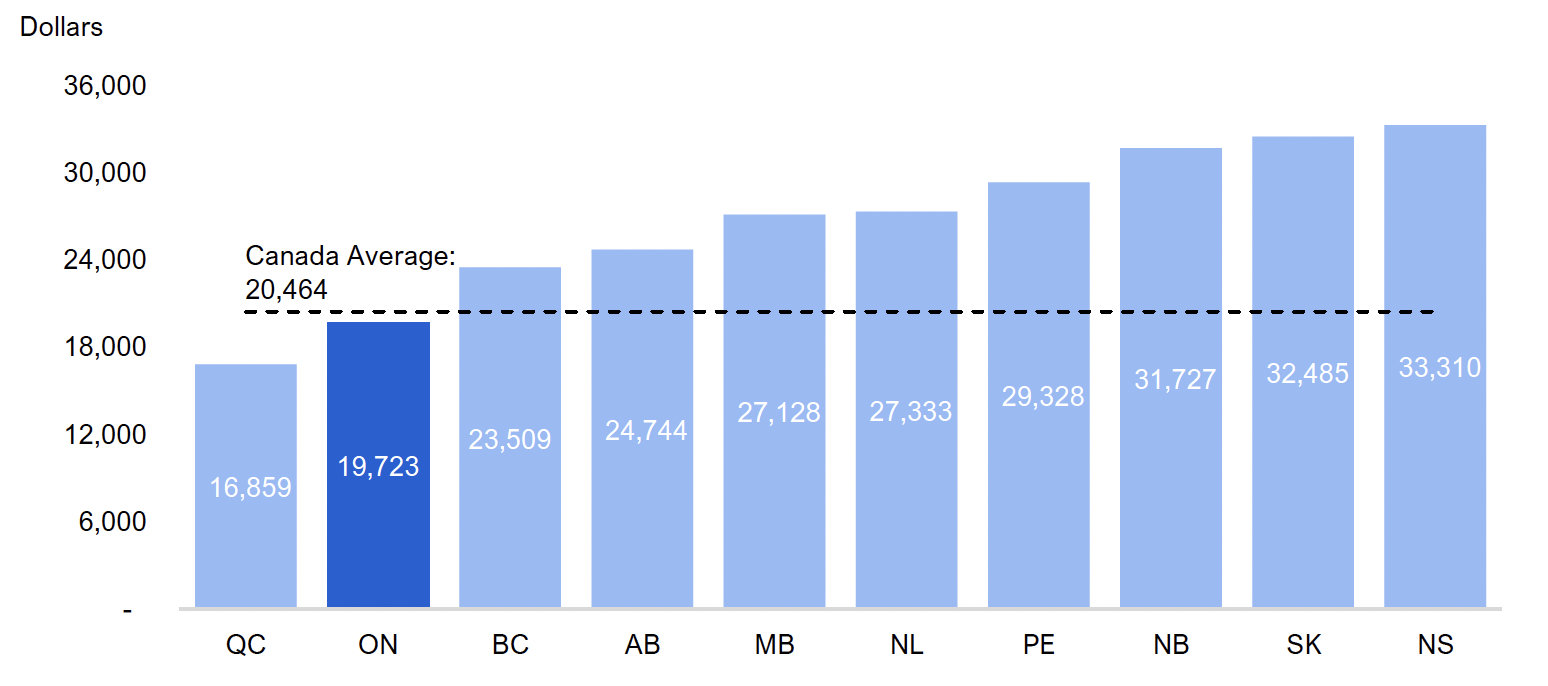
In 2022-23, Ontario ranked the second lowest in terms of colleges spending per FTE student (including domestic and international students), at $19,723, which was $741 below the national average of $20,464. Compared to other large provinces, Ontario’s colleges spending per FTE student was higher than in Quebec ($16,859), but lower than in Alberta ($24,744) and British Columbia ($23,509).
Figure 5.2 Colleges spending per FTE student, by province, 2022-23
Note: The FAO estimates full-time equivalent enrolment as full-time enrolment, plus part-time enrolment divided by 3.5. Canada average does not include territories.
Source: Statistics Canada, “Canadian Classification of Functions of Government (CCOFOG) by consolidated government component”, Table: 10-10-0005-01 and “Postsecondary enrolments, by registration status, institution type, status of student in Canada and gender”, Table: 37-10-0018-01.
Accessible version
Dollars
| Province | Spending per FTE Student |
|---|---|
| QC | 16,859 |
| ON | 19,723 |
| BC | 23,509 |
| AB | 24,744 |
| MB | 27,128 |
| NL | 27,333 |
| PE | 29,328 |
| NB | 31,727 |
| SK | 32,485 |
| NS | 33,310 |
| Canada Average | 20,464 |
Universities
Provincial funding to universities
In 2022-23, Ontario had the lowest universities funding per FTE domestic student among all provinces, at $10,246, which was $6,511 below the national average of $16,756. Compared to other large provinces, Ontario’s universities funding per FTE domestic student was lower than in Quebec ($26,254), British Columbia ($21,651) and Alberta ($15,911).
Figure 5.3 Provincial funding to public universities per FTE domestic university student, by province, 2022-23
Note: The FAO estimates full-time equivalent enrolment as full-time enrolment, plus part-time enrolment divided by 3.5. Canada average does not include territories. Quebec and Nova Scotia university funding includes direct subsidies to lower “in province” domestic student tuition fees.
Source: Statistics Canada, “Revenues of universities by type of revenues and funds”, Table: 37-10-0026-01 and “Postsecondary enrolments, by registration status, institution type, status of student in Canada and gender”, Table: 37-10-0018-01.
Accessible version
Dollars
| Province | Funding per FTE Domestic Student |
|---|---|
| ON | 10,246 |
| AB | 15,911 |
| MB | 17,796 |
| NS | 18,662 |
| PE | 19,038 |
| NB | 20,889 |
| BC | 21,651 |
| SK | 22,980 |
| QC | 26,254 |
| NL | 32,028 |
| Canada Average | 16,756 |
Universities spending
In 2022-23, Ontario had the second lowest universities spending per FTE student (including domestic and international students) among all provinces, at $21,325, which was $1,369 below the national average of $22,693. Compared to other large provinces, Ontario’s universities spending per FTE student was higher than in Quebec ($19,121), but lower than in British Columbia ($28,887) and Alberta ($22,943).
Figure 5.4 Universities spending per FTE student, by province, 2022-23
Note: The FAO estimates full-time equivalent enrolment as full-time enrolment, plus part-time enrolment divided by 3.5. Canada average does not include territories.
Source: Statistics Canada, “Canadian Classification of Functions of Government (CCOFOG) by consolidated government component”, Table: 10-10-0005-01 and “Postsecondary enrolments, by registration status, institution type, status of student in Canada and gender”, Table: 37-10-0018-01.
Accessible version
Dollars
| Province | Spending per FTE Student |
|---|---|
| QC | 19,121 |
| ON | 21,325 |
| MB | 22,763 |
| AB | 22,943 |
| NL | 25,255 |
| NS | 26,449 |
| PE | 27,771 |
| NB | 28,165 |
| BC | 28,887 |
| SK | 32,000 |
| Canada Average | 22,693 |
Domestic Tuition Fees
In 2022-23, Ontario had the third highest average domestic tuition fees per university and college undergraduate full-time domestic student among all provinces, at $9,103, which was $1,188 above the national average of $7,915. Compared to other large provinces, Ontario’s full-time domestic tuition fees were higher than in Quebec ($4,364), British Columbia ($7,065) and Alberta ($8,490).
Figure 5.5 Average tuition and additional compulsory fees for undergraduate full-time domestic students in public postsecondary education programs, by province, 2022-23
Note: Additional compulsory fees are the fees paid by all full-time students, which include general fees (admission, registration, etc.), technology fees, student association fees, fees for athletics and recreational activities, etc. Canada average excludes all territories except Yukon. Quebec and Nova Scotia average tuition accounts for different fees paid by "in province" and "out of province" Canadian students. Quebec average excludes tuition fees for students enrolled in CEGEP.
Source: Statistics Canada, “Canadian students, tuition and additional compulsory fees, by level of study”, Table: 37-10-0121-01.
Accessible version
Dollars
| Province | Average Fees per Undergraduate Full-time Domestic Student |
|---|---|
| NL | 4,223 |
| QC | 4,364 |
| MB | 6,200 |
| BC | 7,065 |
| PE | 7,756 |
| AB | 8,490 |
| NB | 9,001 |
| ON | 9,103 |
| SK | 9,390 |
| NS | 10,312 |
| Canada Average | 7,915 |
Footnotes
[1] In this report, the FAO estimates full-time equivalent enrolment as full-time enrolment, plus part-time enrolment divided by 3.5.
[2] Excludes spending and enrolment related to public college-private partnerships.
[3] FAO, Government Spending Trends: 1990 to 2023.
[4] In this report, the FAO estimates full-time equivalent enrolment as full-time enrolment, plus part-time enrolment divided by 3.5.
[5] Excludes spending and enrolment related to public college-private partnerships.