


1. Summary
This report compares the FAO’s projections for the 2024-25 fiscal year for the Government of Ontario’s (the Province’s) budget balance, revenue and spending against the actual results published in the Public Accounts of Ontario. In addition, this report reviews the FAO’s historical forecast accuracy since 2016-17 (the first year of FAO forecasting) and compares the FAO’s forecasts against the government’s forecasts in Ontario Budgets.
- This review is intended to provide transparency and information to Members of Provincial Parliament as they use the FAO’s work, and to assist the FAO in improving on the quality of its projections.
2024-25 Review
- In the Spring 2024 Economic and Budget Outlook (EBO), released on May 15, 2024, the FAO projected a $6.4 billion budget deficit for 2024-25, which was $5.3 billion below the $1.1 billion actual budget deficit reported in the 2024-25 Public Accounts of Ontario, released on September 26, 2025.
- The FAO’s revenue projection was $15.2 billion (6.7 per cent) below the actual results for 2024-25 and the FAO’s spending projection was $9.9 billion (4.4 per cent) below the actual results. These underestimates partially offset each other, leading to a $5.3 billion underestimate of the budget balance.
- The FAO’s revenue projection was below actual largely due to an $8.8 billion underestimate of other non-tax revenue, as well as underestimates of personal income tax ($2.0 billion) and corporations tax ($3.5 billion).
- The FAO’s spending projection was below actual due to a combination of new policies introduced by the government during the fiscal year ($3.1 billion); unanticipated developments that affected spending, such as wage and legal settlements ($3.6 billion); and an underestimate of the cost or volume of provincial services and programs ($3.2 billion).
Forecast Accuracy: One-Year Outlooks
The FAO reviewed its one-year historical forecast accuracy since 2016-17 for the Province’s budget balance, revenue and spending by comparing the FAO’s projection in year one of the EBO outlook against the actual results in the Public Accounts of Ontario.
- Since 2016-17, the FAO’s one-year average absolute variance (which measures the magnitude of variance regardless of direction) for the provincial budget balance was $8.5 billion. Overall, the FAO overestimated the budget balance twice in nine years (2022-23 and 2023-24).
- The average absolute variance was significantly influenced by the pandemic years of 2020-21 and 2021-22. In those two years, the FAO’s average absolute variance was $26.6 billion, largely due to the FAO’s significant underestimates of revenue in this period.
- Prior to the pandemic, from 2016-17 to 2019-20, the FAO’s average absolute variance for the budget balance was $2.5 billion, while in the post-pandemic period, from 2022-23 to 2024-25, the FAO’s average absolute variance was $4.4 billion.
- The FAO’s one-year average absolute revenue variance was 6.1 per cent from 2016-17 to 2024-25. Overall, the FAO’s revenue forecasts were below the actual results in all nine years, showing a consistent downward tendency.
- The FAO’s one-year average absolute spending variance was 2.8 per cent from 2016-17 to 2024-25. Overall, the FAO overestimated spending twice in nine years (2018-19 and 2021-22) which indicates a downward tendency in the FAO’s spending projections.
Forecast Accuracy: Three-Year Outlooks
The FAO reviewed its three-year historical forecast accuracy since 2016-17 for the Province’s budget balance by comparing the FAO’s projection in year three of the EBO outlook against the actual results in the Public Accounts of Ontario.
- The FAO’s three-year average absolute variance for the provincial budget balance was $5.5 billion from 2018-19 to 2024-25. Overall, the FAO underestimated the budget balance three times in seven years (2021-22, 2022-23 and 2023-24).
Forecast Accuracy Compared to the Government
2024-25
- The FAO’s Spring 2024 EBO projected a $6.4 billion budget deficit, which was $5.3 billion below the $1.1 billion actual budget deficit published in the 2024-25 Public Accounts of Ontario. The 2024 Ontario Budget projected a $9.8 billion budget deficit, which was $8.7 billion below actual.
- The FAO’s revenue projection was $15.2 billion (6.7 per cent) below actual, while the government’s revenue projection was $17.9 billion (7.9 per cent) below actual.
- The FAO’s spending projection was $9.9 billion (4.4 per cent) below actual, while the government’s spending projection was $10.2 billion (4.5 per cent) below actual.
One-Year Outlooks
- From 2016-17 to 2024-25, the FAO’s one-year average absolute variance for the budget balance was $8.5 billion, while the government’s average absolute variance was $10.0 billion. By fiscal year, the government’s projection was closer to the actual results in the Public Accounts in five of nine years.
- For revenue, the FAO’s one-year average absolute variance was 6.1 per cent, while the government’s one-year average absolute revenue variance was 5.0 per cent.
- Both the FAO and the government revenue forecasts were below actual in all nine years. By major revenue component, historical average absolute variances were greatest for corporations tax, income from government business enterprises, other non-tax revenue and personal income tax for both the FAO and the government.
- For spending, the FAO’s one-year average absolute variance was 2.8 per cent, while the government’s one-year average absolute spending variance was 1.5 per cent.
- By sector, the FAO’s average absolute variance was lower than the government’s in the health; postsecondary education; children, community and social services; justice; and interest and other debt servicing charges sectors, while the government’s average absolute variance was lower than the FAO’s in the education and ‘other programs’ sectors.
Three-Year Outlooks
- From 2018-19 to 2024-25, the FAO’s three-year average absolute variance for the budget balance was $5.5 billion, while the government’s average absolute variance was $9.7 billion. In every fiscal year, the FAO’s projection for the budget balance was closer to the actual results in the Public Accounts.
2. Introduction
This report compares the FAO’s projections for the 2024-25 fiscal year for the Government of Ontario’s (the Province’s) budget balance, revenue and spending against the actual results published in the Public Accounts of Ontario. In addition, this report reviews the FAO’s historical forecast accuracy since 2016-17 (the first year of FAO forecasting) and compares the FAO’s forecasts against the government’s forecasts in Ontario Budgets.
Going forward, the FAO intends to report on the accuracy of its forecasts on a periodic basis. These reviews provide transparency and information to Members of Provincial Parliament as they use the FAO’s work, and will assist the FAO in improving on the quality of its projections.
The FAO’s forecasts can differ from actual results for many reasons. As forecasts are based on available information at the time, various factors can contribute to forecast variances, including subsequent revisions to historical economic or financial information, policy changes announced by the provincial and federal governments, significant unanticipated events, and inherent modelling uncertainty.
This report is organized as follows:
- Chapter 3 compares the FAO’s projections in the Spring 2024 Economic and Budget Outlook[1] report for the Province’s 2024-25 budget balance, revenue and spending against the actual results in the 2024-25 Public Accounts of Ontario.
- Chapter 4 examines the FAO’s one-year historical forecast accuracy since 2016-17 (the first year of FAO forecasting) for the Province’s budget balance, revenue and spending.
- Chapter 5 examines the FAO’s three-year historical forecast accuracy for the Province’s budget balance.
- Chapter 6 compares the FAO’s historical forecast accuracy against the government’s forecasts in Ontario Budgets.
This report reviews the FAO’s revenue, spending and budget balance forecasts published in its Economic and Budget Outlook reports. This report does not review the FAO’s economic projections, costings of specific policies or programs, or other projections.
3. 2024-25 Review
This chapter compares the FAO’s projections in the Spring 2024 Economic and Budget Outlook (EBO), released on May 15, 2024, for the Province’s 2024-25 budget balance, revenue and spending against the actual results in the 2024-25 Public Accounts of Ontario, released on September 26, 2025.
Budget Balance
In the Spring 2024 EBO, the FAO projected a $6.4 billion budget deficit for 2024-25, which was $5.3 billion below the $1.1 billion actual budget deficit reported in the 2024-25 Public Accounts of Ontario.
Figure 3.1 FAO Spring 2024 EBO forecast and Public Accounts actual for the 2024-25 budget balance
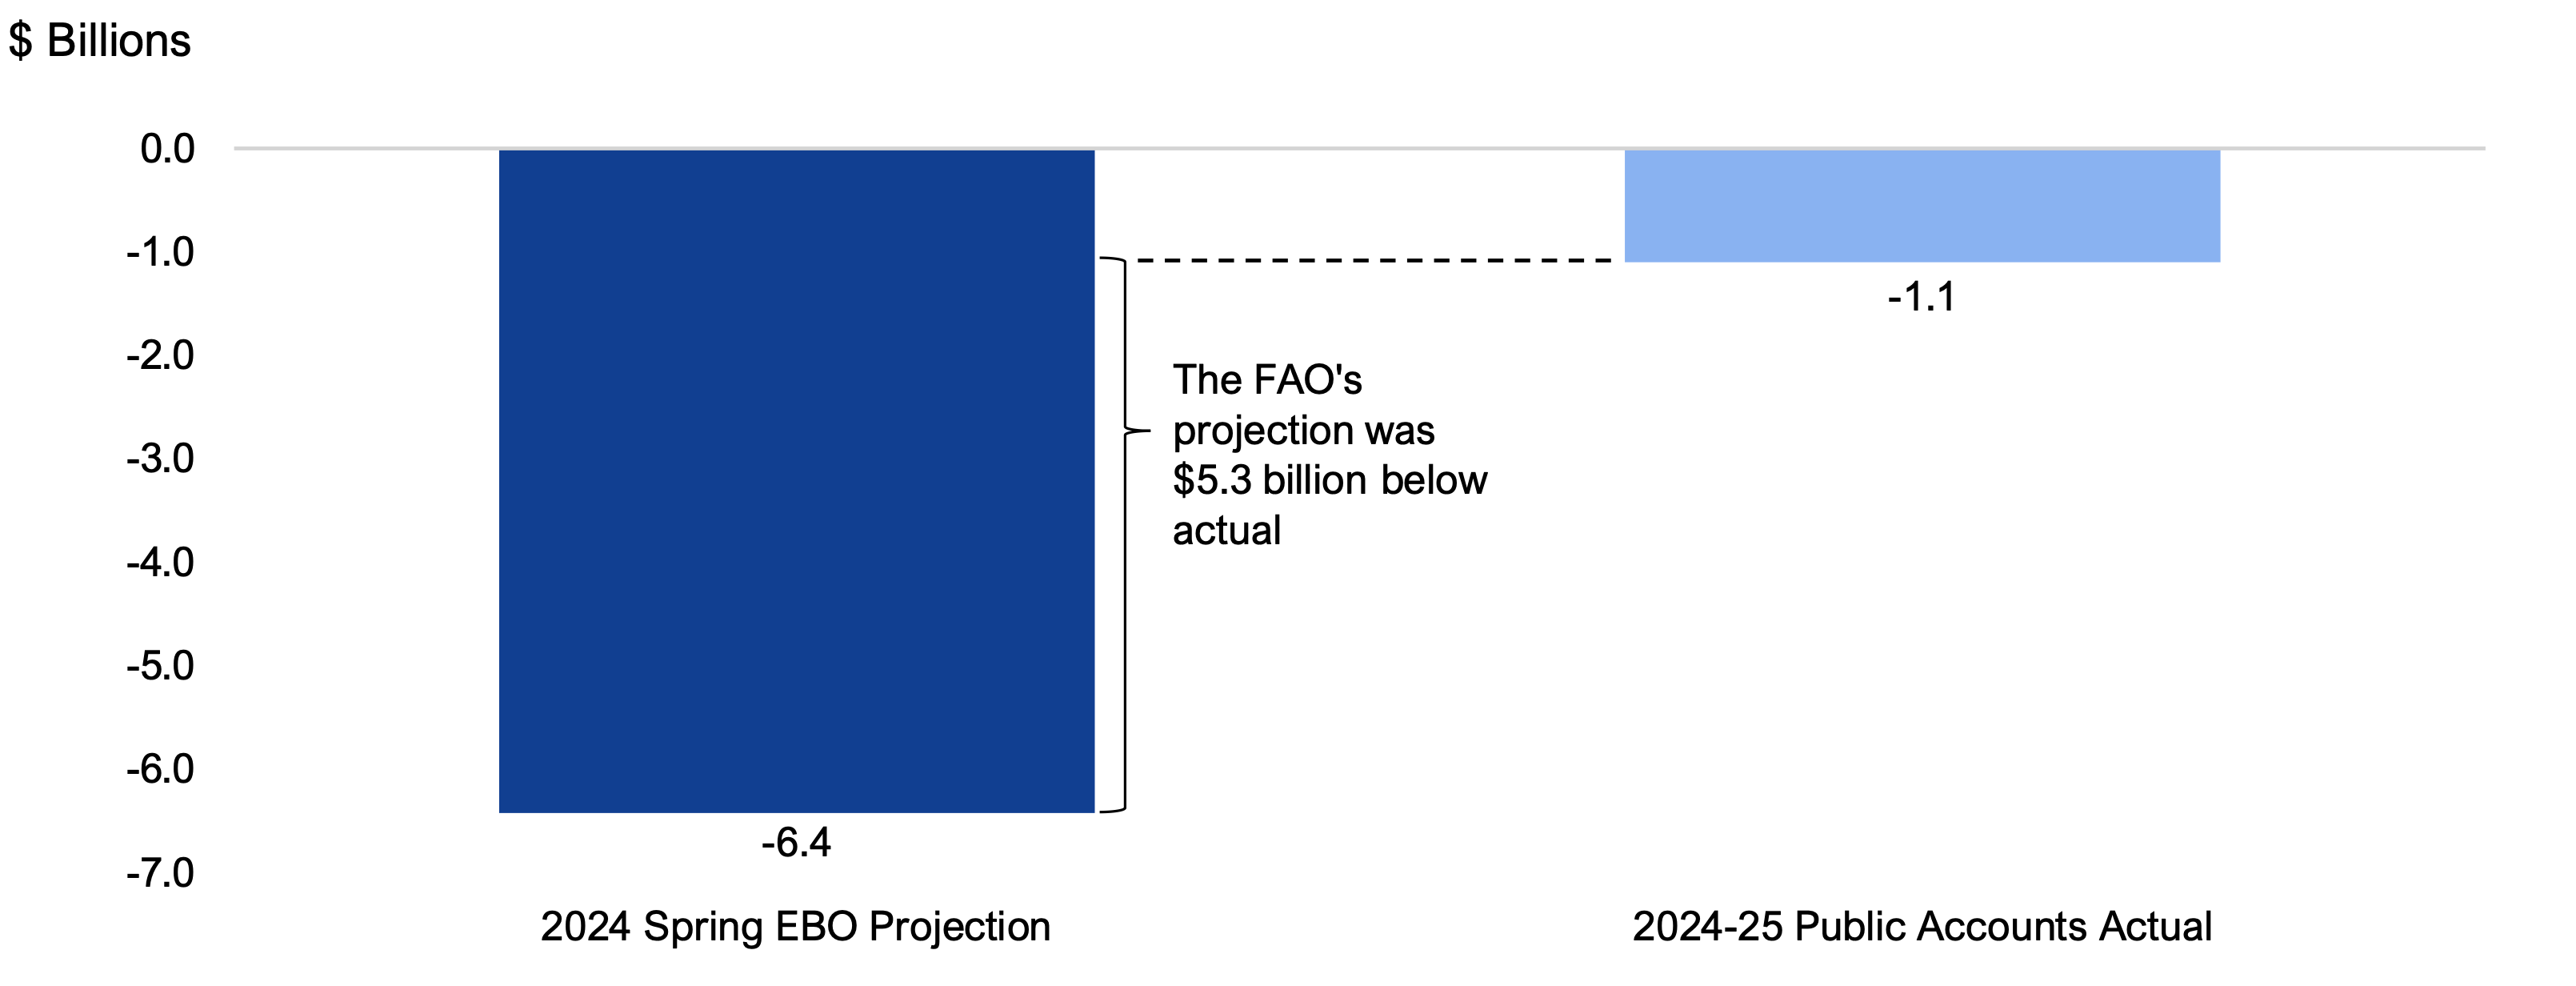
Source: FAO Spring 2024 Economic and Budget Outlook and the 2024-25 Public Accounts of Ontario.
Accessible version
| $ Billions | Budget Balance | Difference |
|---|---|---|
| 2024 Spring EBO Projection | -6.4 | The FAO’s projection was $5.3 billion below actual |
| 2024-25 Public Accounts Actual | -1.1 |
The accuracy of the FAO’s budget balance projection depends on the accuracy of the FAO’s revenue and spending projections. For the 2024-25 fiscal year, the FAO’s Spring 2024 EBO revenue projection was $15.2 billion below the actual results in the 2024-25 Public Accounts and the spending projection was $9.9 billion below the actual results. These underestimates partially offset each other, leading to a $5.3 billion underestimate of the budget balance.
| Spring 2024 EBO Projection | 2024-25 Public Accounts Actual | Difference | |
|---|---|---|---|
| Revenue | 210.9 | 226.2 | -15.2 |
| Spending | 217.4 | 227.3 | -9.9 |
| Budget Balance | -6.4 | -1.1 | -5.3 |
Revenue
In the Spring 2024 EBO, the FAO projected total 2024-25 revenue at $210.9 billion,[2] which was $15.2 billion (6.7 per cent) below actual total revenue of $226.2 billion.
Figure 3.2 FAO Spring 2024 EBO forecast and Public Accounts actual for total 2024-25 revenue
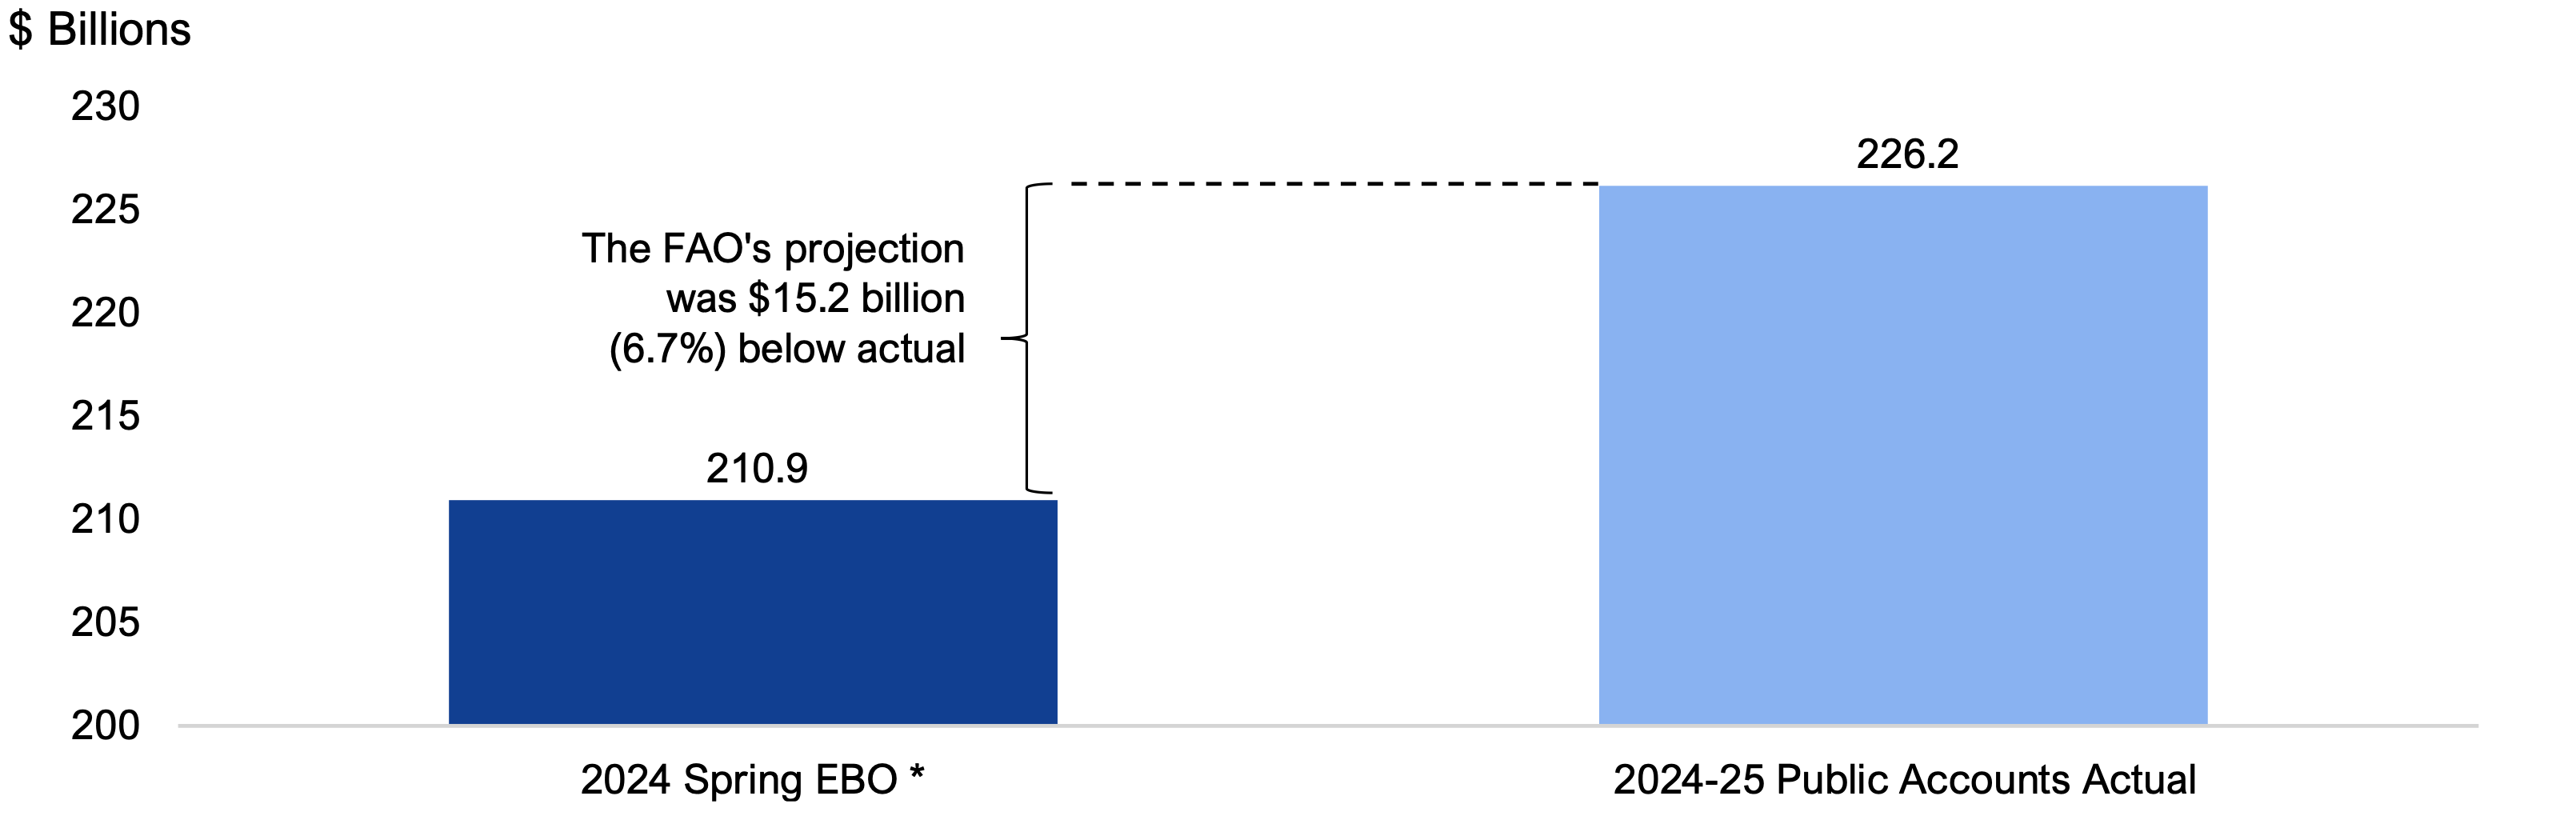
* The FAO’s Spring 2024 EBO projection is restated to reflect an accounting change to interest and investment income introduced in the 2024-25 Public Accounts of Ontario.
Source: FAO Spring 2024 Economic and Budget Outlook and 2024-25 Public Accounts of Ontario.
Accessible version
| $ Billions | Budget Balance | Difference |
|---|---|---|
| 2024 Spring EBO* | 210.9 | The FAO’s projection was $15.2 billion (6.7%) below actual |
| 2024-25 Public Accounts Actual | 226.2 |
The FAO’s total revenue projection was below actual largely due to an $8.8 billion underestimate of other non-tax revenue, as well as underestimates of personal income tax ($2.0 billion) and corporations tax ($3.5 billion).
| Spring 2024 EBO Projection | 2024-25 Public Accounts Actual | Difference ($ billions) | Difference (%) | |
|---|---|---|---|---|
| Personal Income Tax | 53.7 | 55.7 | -2.0 | -3.7% |
| Sales Tax | 38.8 | 39.4 | -0.5 | -1.3% |
| Corporations Tax | 24.3 | 27.8 | -3.5 | -12.5% |
| All other taxes | 29.3 | 28.7 | 0.6 | 2.1% |
| Total Taxation Revenue | 146.1 | 151.5 | -5.4 | -3.6% |
| Transfers from Government of Canada | 36.3 | 36.6 | -0.3 | -0.9% |
| Income from Government Business Enterprises | 6.8 | 7.5 | -0.7 | -9.1% |
| Other Non-Tax Revenue* | 21.8 | 30.5 | -8.8 | -28.7% |
| Total Revenue | 210.9 | 226.2 | -15.2 | -6.7% |
- The FAO’s personal income tax projection was $2.0 billion (3.7 per cent) lower than actual. Of this:
- $0.9 billion was due to stronger-than-expected labour income growth. The Spring 2024 EBO projected average annual growth in labour income of 5.1 per cent from 2023 to 2025, which the FAO now estimates to be 5.4 per cent based on updated economic data and forecasts for 2025.
- -$0.1 billion was due to federal and provincial tax policy changes announced after the release of the Spring 2024 EBO, primarily the reversal of the increased capital gains inclusion rate, which was partially offset by other federal tax changes.
- The remaining $1.3 billion was due to underestimates for personal income tax for the 2023-24 and earlier fiscal years that were carried forward into the 2024-25 Public Accounts actual.
- The FAO’s corporations tax projection was $3.5 billion (12.5 per cent) lower than actual. Of this:
- $0.6 billion was due to stronger-than-expected corporate profit growth. The Spring 2024 EBO projected corporate profits to decline by an average annual rate of -1.8 per cent from 2023 to 2025, which the FAO now estimates to be -1.6 per cent based on updated economic data and forecasts for 2025. In addition, Statistics Canada revised the level of 2023 corporate profits up by 36 per cent, meaning that corporate profits were significantly higher over the 2023 to 2025 period than projected by the FAO in the Spring 2024 EBO.
- $0.8 billion was due to federal tax policy changes, including the reversal of the increased capital gains inclusion rate, the elimination of dividend deductions for financial institutions and changes to interest deductibility limits.
- The remaining $2.1 billion was due to underestimates for corporations tax for the 2023-24 and earlier fiscal years that were carried forward into the 2024-25 Public Accounts actual.
- The FAO’s other non-tax revenue projection was $8.8 billion (28.7 per cent) lower than actual. Of this:
- $3.4 billion was due to a one-time payment related to a court-approved settlement between tobacco companies and their creditors, which included compensation to provincial and territorial governments for smoking-related health care costs.
- $3.2 billion was due to higher-than-expected revenue from broader public sector organizations, including $2.0 billion in higher hospitals revenue from fees, donations, research grants and other ancillary services, and $1.0 billion in higher colleges revenue, largely due to higher-than-expected international student tuition revenue.
- $1.5 billion was due to higher-than-expected revenue from miscellaneous other non-tax revenue sources, primarily higher-than-expected recovery of prior-year expenditures.
- $0.2 billion was due to higher-than-expected interest and investment income.
- $0.4 billion was due to differences in the remaining other non-tax revenue sources, including fees and licences, sales and rentals, and reimbursements.
Spending
In the Spring 2024 EBO, the FAO projected total 2024-25 spending at $217.4 billion,[3] which was $9.9 billion (4.4 per cent) below actual total spending of $227.3 billion.
Figure 3.3 FAO Spring 2024 EBO forecast and Public Accounts actual for total 2024-25 spending
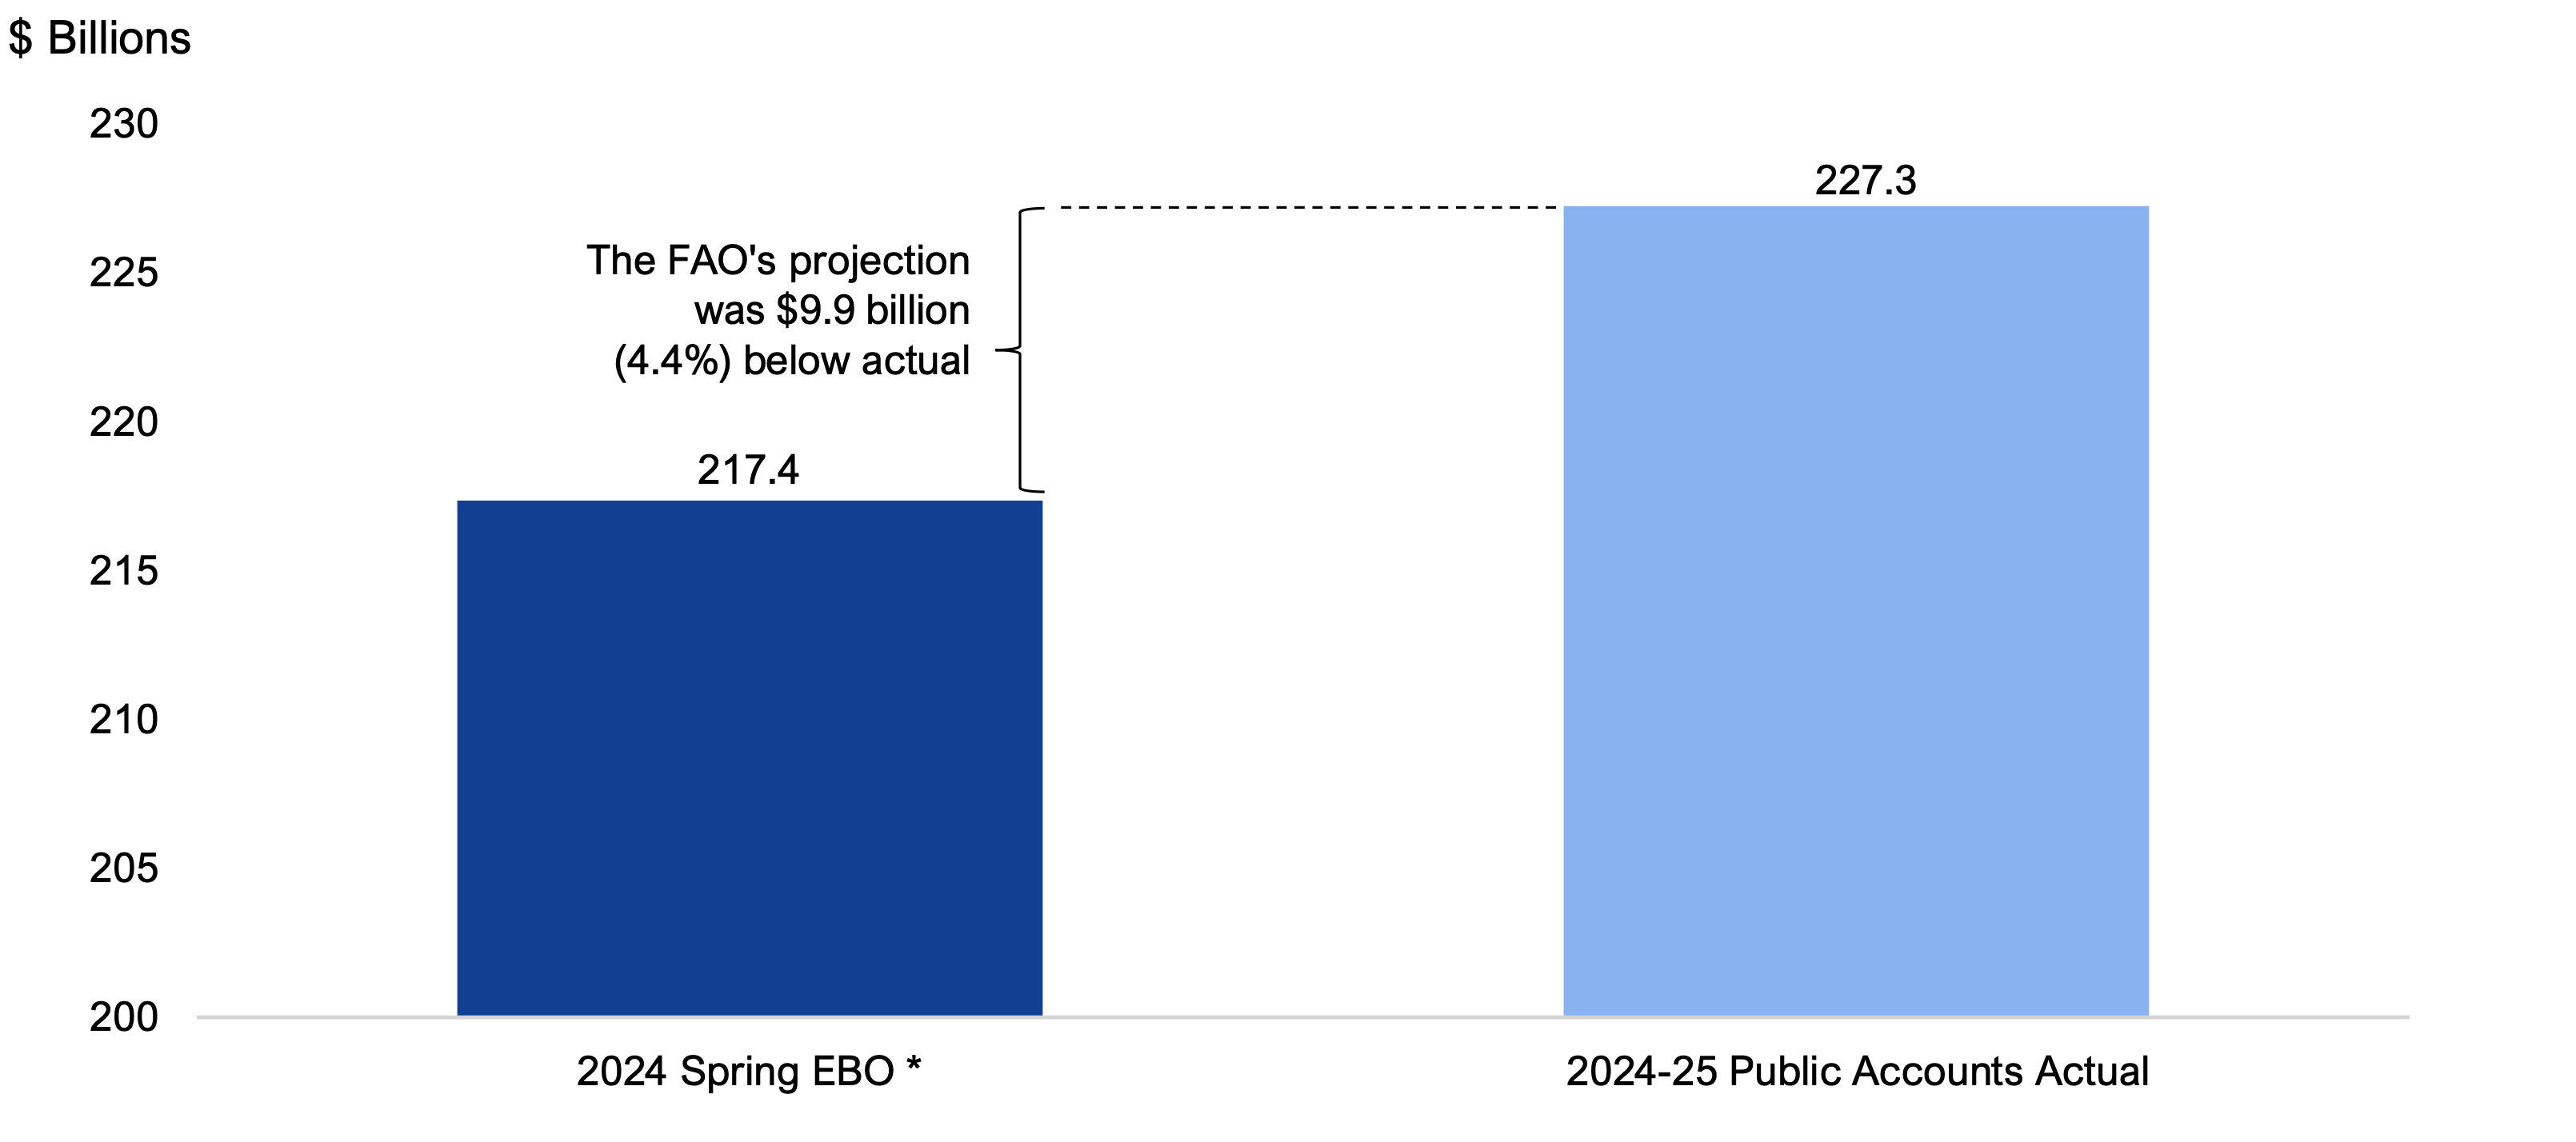
* The FAO’s Spring 2024 EBO projection is restated to reflect an accounting change to interest and investment income introduced in the 2024-25 Public Accounts of Ontario.
Source: FAO Spring 2024 Economic and Budget Outlook and 2024-25 Public Accounts of Ontario.
Accessible version
| $ Billions | Budget Balance | Difference |
|---|---|---|
| 2024 Spring EBO* | 217.4 | The FAO’s projection was $9.9 billion (4.4 %) below actual |
| 2024-25 Public Accounts Actual | 227.3 |
The FAO underestimated spending in 2024-25 due to a combination of new policies introduced by the government during the fiscal year; unanticipated developments that affected spending, such as wage and legal settlements; and an underestimate of the cost or volume of provincial services and programs.
Of the $9.9 billion of unanticipated spending in 2024-25:
- $3.1 billion was due to new policies announced during the fiscal year, including:
- $2.9 billion for the Ontario Taxpayer Rebate.
- $0.2 billion for policing services in First Nations communities.
- $3.6 billion was due to unanticipated developments during the fiscal year, including:
- $2.2 billion in additional spending on physician services mainly due to new and retroactive compensation following a September 2024 arbitration settlement.[4]
- $1.4 billion in new spending on legal settlement costs in the justice sector and payments to the Mercury Disability Fund.
- $3.2 billion was due to a net underestimate of the cost or volume of services and programs, including:
- $2.6 billion in higher-than-projected spending on compensation across sectors.
- $2.3 billion in higher-than-anticipated health sector spending, including $0.8 billion in non-compensation spending by hospitals, $0.7 billion on drug programs and home care, and $0.7 billion on other health services including cancer care, digital health, public health and emergency services.
- $0.6 billion in higher-than-expected spending on student financial assistance programs.
- These increases were partially offset by a net $2.3 billion in lower-than-anticipated spending in other areas, largely for electricity subsidy programs, transfer payments for infrastructure and business supports, and interest and other debt servicing charges.
| Sector | Spring 2024 EBO Projection | 2024-25 Public Accounts Actual | Difference ($ billions) | Difference (%) |
|---|---|---|---|---|
| Health | 86.0 | 91.6 | -5.7 | -6.2% |
| Education | 39.7 | 40.1 | -0.4 | -1.0% |
| Postsecondary Education | 12.9 | 14.1 | -1.2 | -8.6% |
| Children, Community and Social Services | 20.3 | 20.7 | -0.4 | -2.1% |
| Justice | 6.1 | 7.2 | -1.2 | -16.1% |
| Other Programs | 36.2 | 38.3 | -2.2 | -5.7% |
| Interest and Other Debt Servicing Charges* | 16.3 | 15.1 | 1.1 | 7.6% |
| Total Spending | 217.4 | 227.3 | -9.9 | -4.4% |
On a sector basis, the FAO’s spending projection was below actual largely due to underestimates of health, postsecondary education, justice and ‘other programs’ spending.
- The FAO’s health sector spending projection was $5.7 billion (6.2 per cent) below actual, driven by $2.2 billion in higher-than-anticipated payments to physicians following a September 2024 arbitration settlement, $1.9 billion in higher spending by hospitals largely due to higher than anticipated compensation spending, and a combined $0.7 billion in higher spending for drug programs and home care services.
- The FAO’s postsecondary education sector spending projection was $1.2 billion (8.6 per cent) below actual, $0.6 billion of which was due to the FAO projecting a larger-than-actual reduction in spending by colleges following the implementation of caps to international student permits for 2024 and 2025.[5] The remaining $0.6 billion was due to higher-than-projected spending for student financial assistance programs, driven by higher-than-anticipated domestic student enrolment.
- The FAO’s justice sector spending projection was $1.2 billion (16.1 per cent) lower than actual, primarily due to $0.6 billion in new legal settlement costs and $0.2 billion in new initiatives announced during the fiscal year, such as funding to enhance policing services in First Nations communities.[6]
- The FAO’s ‘other programs’ spending projection was $2.2 billion (5.7 per cent) lower than actual due to a combination of $2.9 billion in new spending for the Ontario Taxpayer Rebate and $0.8 billion for payments to the Mercury Disability Fund. This was partially offset by $0.6 billion in lower-than-anticipated spending on electricity subsidies due to lower-than-anticipated electricity prices and $0.9 billion in lower spending in the remaining programs, mostly in transfer payments for infrastructure and business supports.
4. Forecast Accuracy: One-Year Outlooks
This chapter examines the FAO’s one-year historical forecast accuracy since 2016-17 (the first year of FAO forecasting) for the Province’s budget balance, revenue and spending. It compares the FAO’s Economic and Budget Outlook projections for the current fiscal year (typically released one to two months after the start of the fiscal year) against the actual results in the Public Accounts of Ontario (released within 180 days after the end of the fiscal year),[7] calculates the FAO’s forecast variance from actuals and discusses the reasons for these forecast variances.
Budget Balance
The FAO’s one-year average absolute variance (which measures the magnitude of variance regardless of direction) for the provincial budget balance was $8.5 billion from 2016-17 to 2024-25. Overall, the FAO overestimated the budget balance twice in nine years (2022-23 and 2023-24).
Figure 4.1 FAO one-year historical budget balance variances, 2016-17 to 2024-25
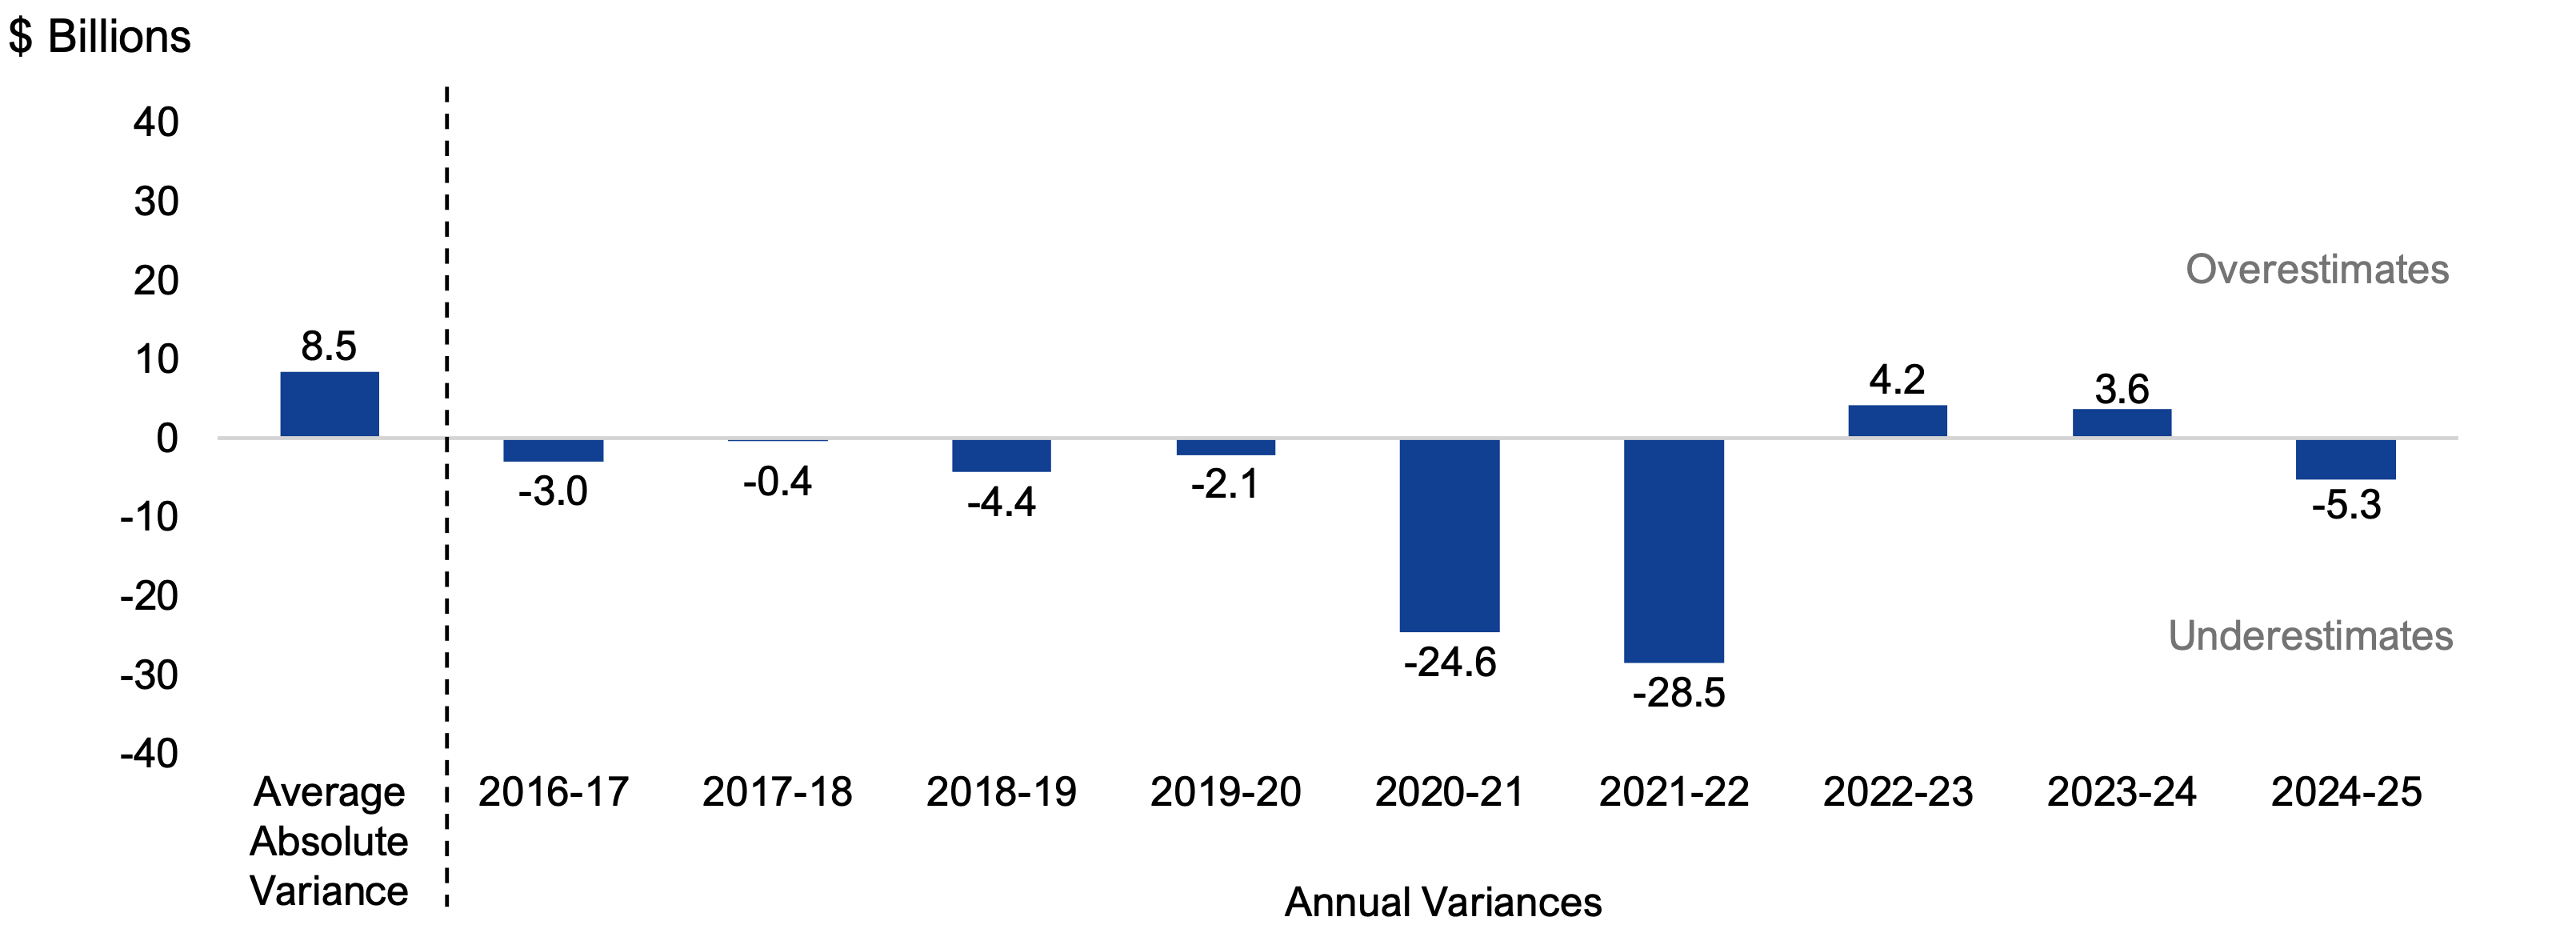
Note: Each forecast variance compares the FAO’s one-year projection from the Economic and Budget Outlook against the actual results in the Public Accounts of Ontario. FAO projections have been adjusted to reflect accounting changes introduced in the Public Accounts of Ontario.
Source: FAO Economic and Budget Outlook reports and Public Accounts of Ontario.
Accessible version
| $ Billions | ||
|---|---|---|
| Average Absolute Variance | 8.5 | |
| Annual Variances | 2016-17 | -3.0 |
| 2017-18 | -0.4 | |
| 2018-19 | -4.4 | |
| 2019-20 | -2.1 | |
| 2020-21 | -24.6 | |
| 2021-22 | -28.5 | |
| 2022-23 | 4.2 | |
| 2023-24 | 3.6 | |
| 2024-25 | -5.3 |
The average absolute variance of $8.5 billion from 2016-17 to 2024-25 was significantly influenced by the pandemic years of 2020-21 and 2021-22.
- From 2016-17 to 2019-20, the FAO’s average absolute variance for the budget balance was $2.5 billion. This was due to modest revenue and spending variances during this period.
- From 2020-21 to 2021-22, the FAO’s average absolute variance was $26.6 billion, largely due to the FAO’s significant underestimates of revenue in this period.
- In the post-pandemic period, from 2022-23 to 2024-25, the FAO’s average absolute variance was $4.4 billion, due to underestimates of similar magnitudes for both revenue and spending.
Excluding the pandemic years of 2020-21 and 2021-22, the FAO’s average absolute variance for the budget balance was $3.3 billion.
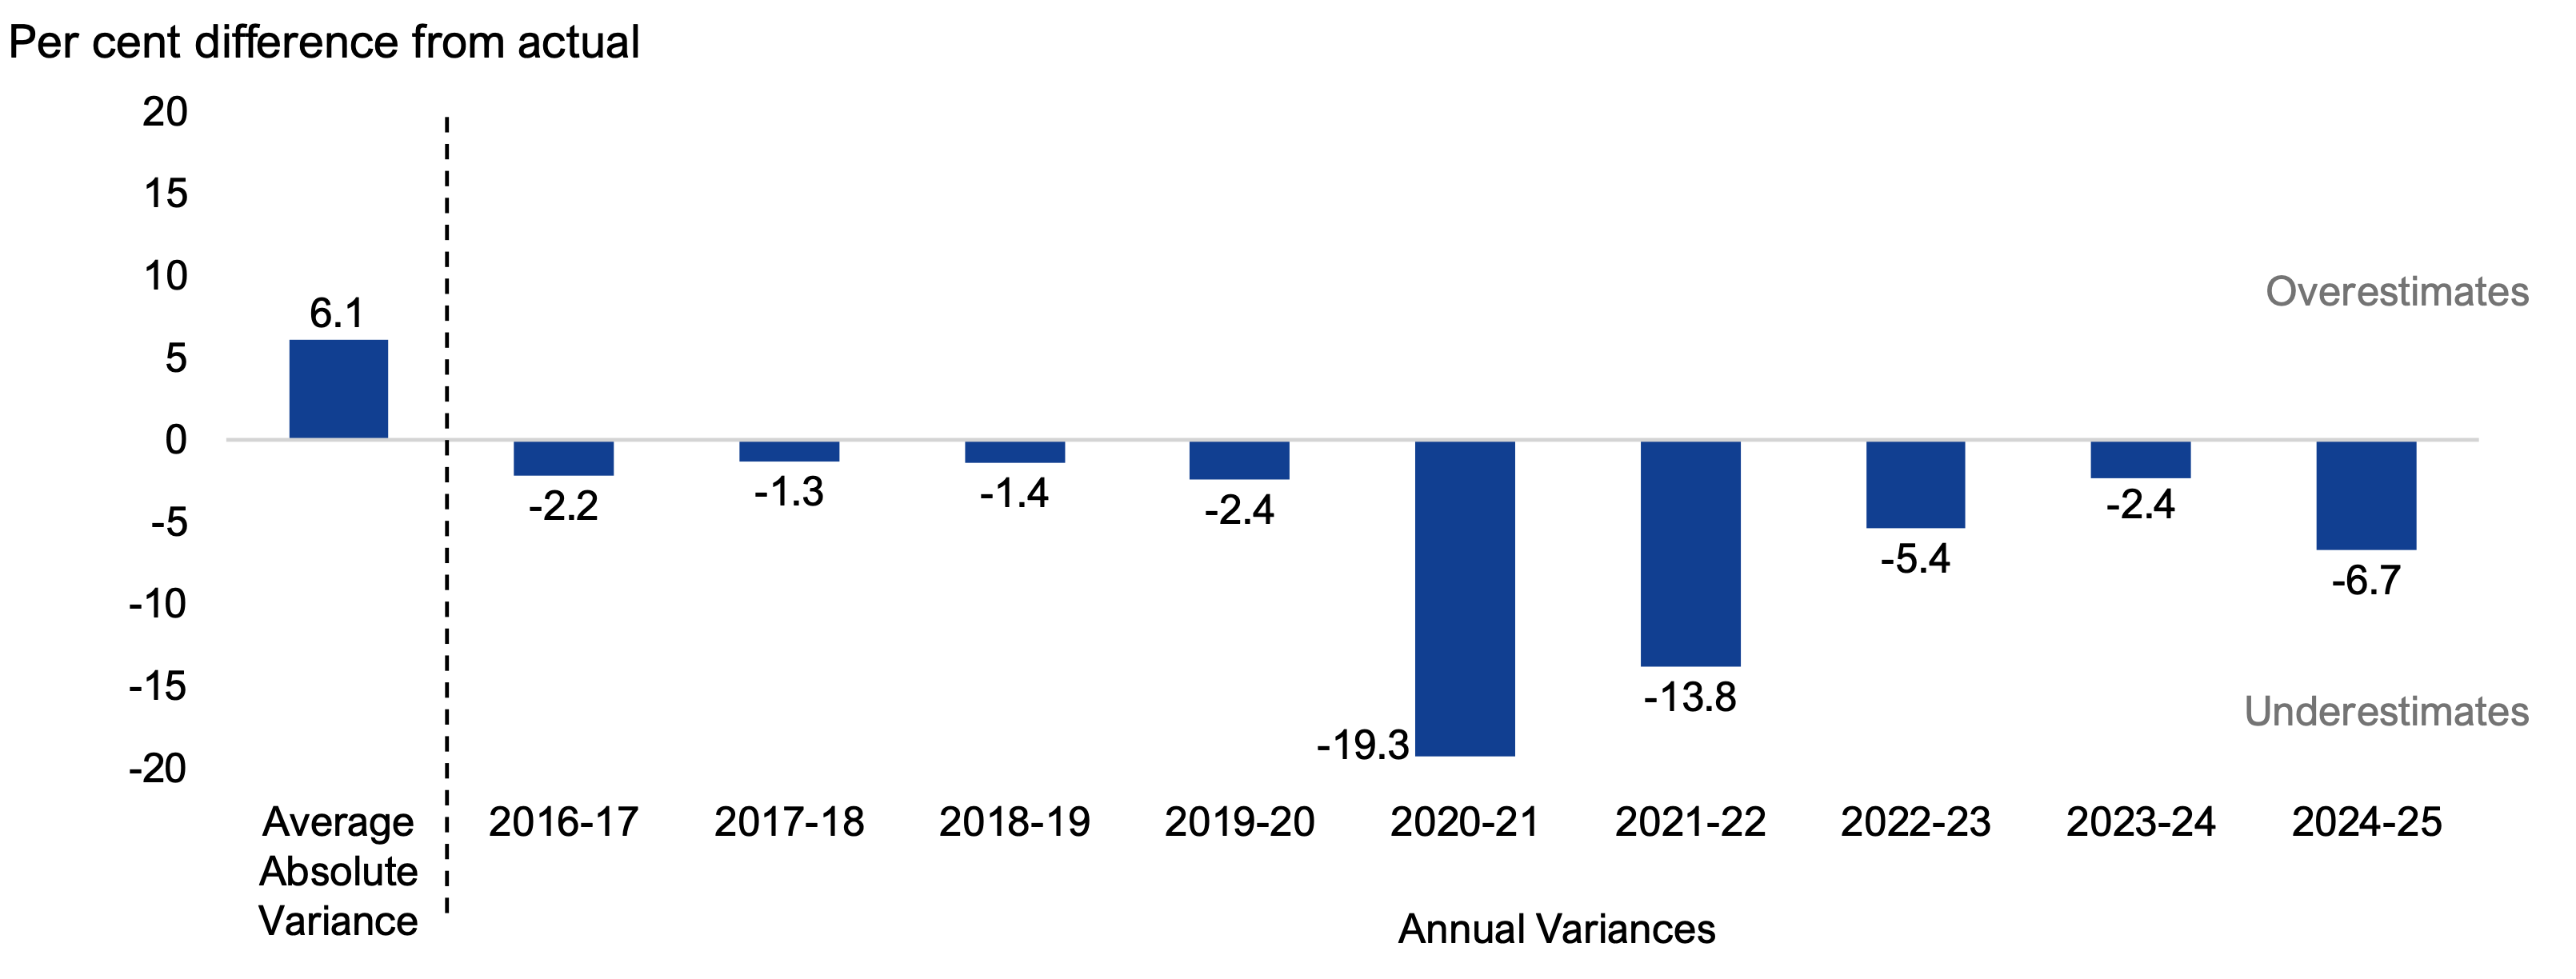
Revenue
The FAO’s one-year average absolute revenue variance was 6.1 per cent from 2016-17 to 2024-25. Overall, the FAO’s revenue forecasts were below actual in all nine years, showing a consistent downward tendency.
Figure 4.2 FAO one-year historical revenue variances, 2016-17 to 2024-25
Note: Each forecast variance compares the FAO’s one-year projection from the Economic and Budget Outlook against the actual results in the Public Accounts of Ontario. FAO projections have been adjusted to reflect accounting changes introduced in the Public Accounts of Ontario.
Source: FAO and Public Accounts of Ontario.
Accessible version
| Per cent difference from actual | ||
|---|---|---|
| Average Absolute Variance | 6.1 | |
| Annual Variances | 2016-17 | -2.2 |
| 2017-18 | -1.3 | |
| 2018-19 | -1.4 | |
| 2019-20 | -2.4 | |
| 2020-21 | -19.3 | |
| 2021-22 | -13.8 | |
| 2022-23 | -5.4 | |
| 2023-24 | -2.4 | |
| 2024-25 | -6.7 |
The average absolute variance of 6.1 per cent was influenced by the pandemic years of 2020-21 and 2021-22, where the FAO significantly underestimated actual revenue.
- From 2016-17 to 2019-20, the FAO’s average absolute revenue variance was 1.8 per cent. This was largely due to the FAO’s underestimates of tax revenue, particularly corporations tax and sales tax.
- During the pandemic period from 2020-21 to 2021-22, the FAO’s average absolute revenue variance was 16.6 per cent. In this period, total revenue growth was much stronger than the underlying economic drivers would normally suggest. This strength was due in part to the significant federal government support for households and businesses, which helped support incomes and income taxes during the pandemic. In addition, federal transfers and income from government business enterprises were much higher than projected.
- In the post-pandemic period, from 2022-23 to 2024-25, the FAO’s average absolute revenue variance was 4.8 per cent, due to modest tax revenue underestimates and a more significant underestimate of other non-tax revenues.[8]
| 2016-17 to 2024-25 | 2016-17 to 2019-20 | 2020-21 to 2021-22 | 2022-23 to 2024-25 | |
|---|---|---|---|---|
| Personal Income Tax | 7.6% | 3.5% | 21.7% | 3.8% |
| Sales Tax | 4.5% | 3.0% | 2.0% | 8.0% |
| Corporations Tax | 22.3% | 12.5% | 58.5% | 11.4% |
| All other taxes | 2.1% | 1.2% | 3.4% | 2.3% |
| Total Taxation Revenue | 6.5% | 2.6% | 19.3% | 3.1% |
| Transfers from Government of Canada | 5.4% | 2.8% | 16.4% | 1.5% |
| Income from Government Business Enterprises | 13.2% | 11.1% | 23.6% | 9.1% |
| Other Non-Tax Revenue | 8.3% | 1.9% | 6.9% | 17.6% |
| Total Revenue | 6.1% | 1.8% | 16.6% | 4.8% |
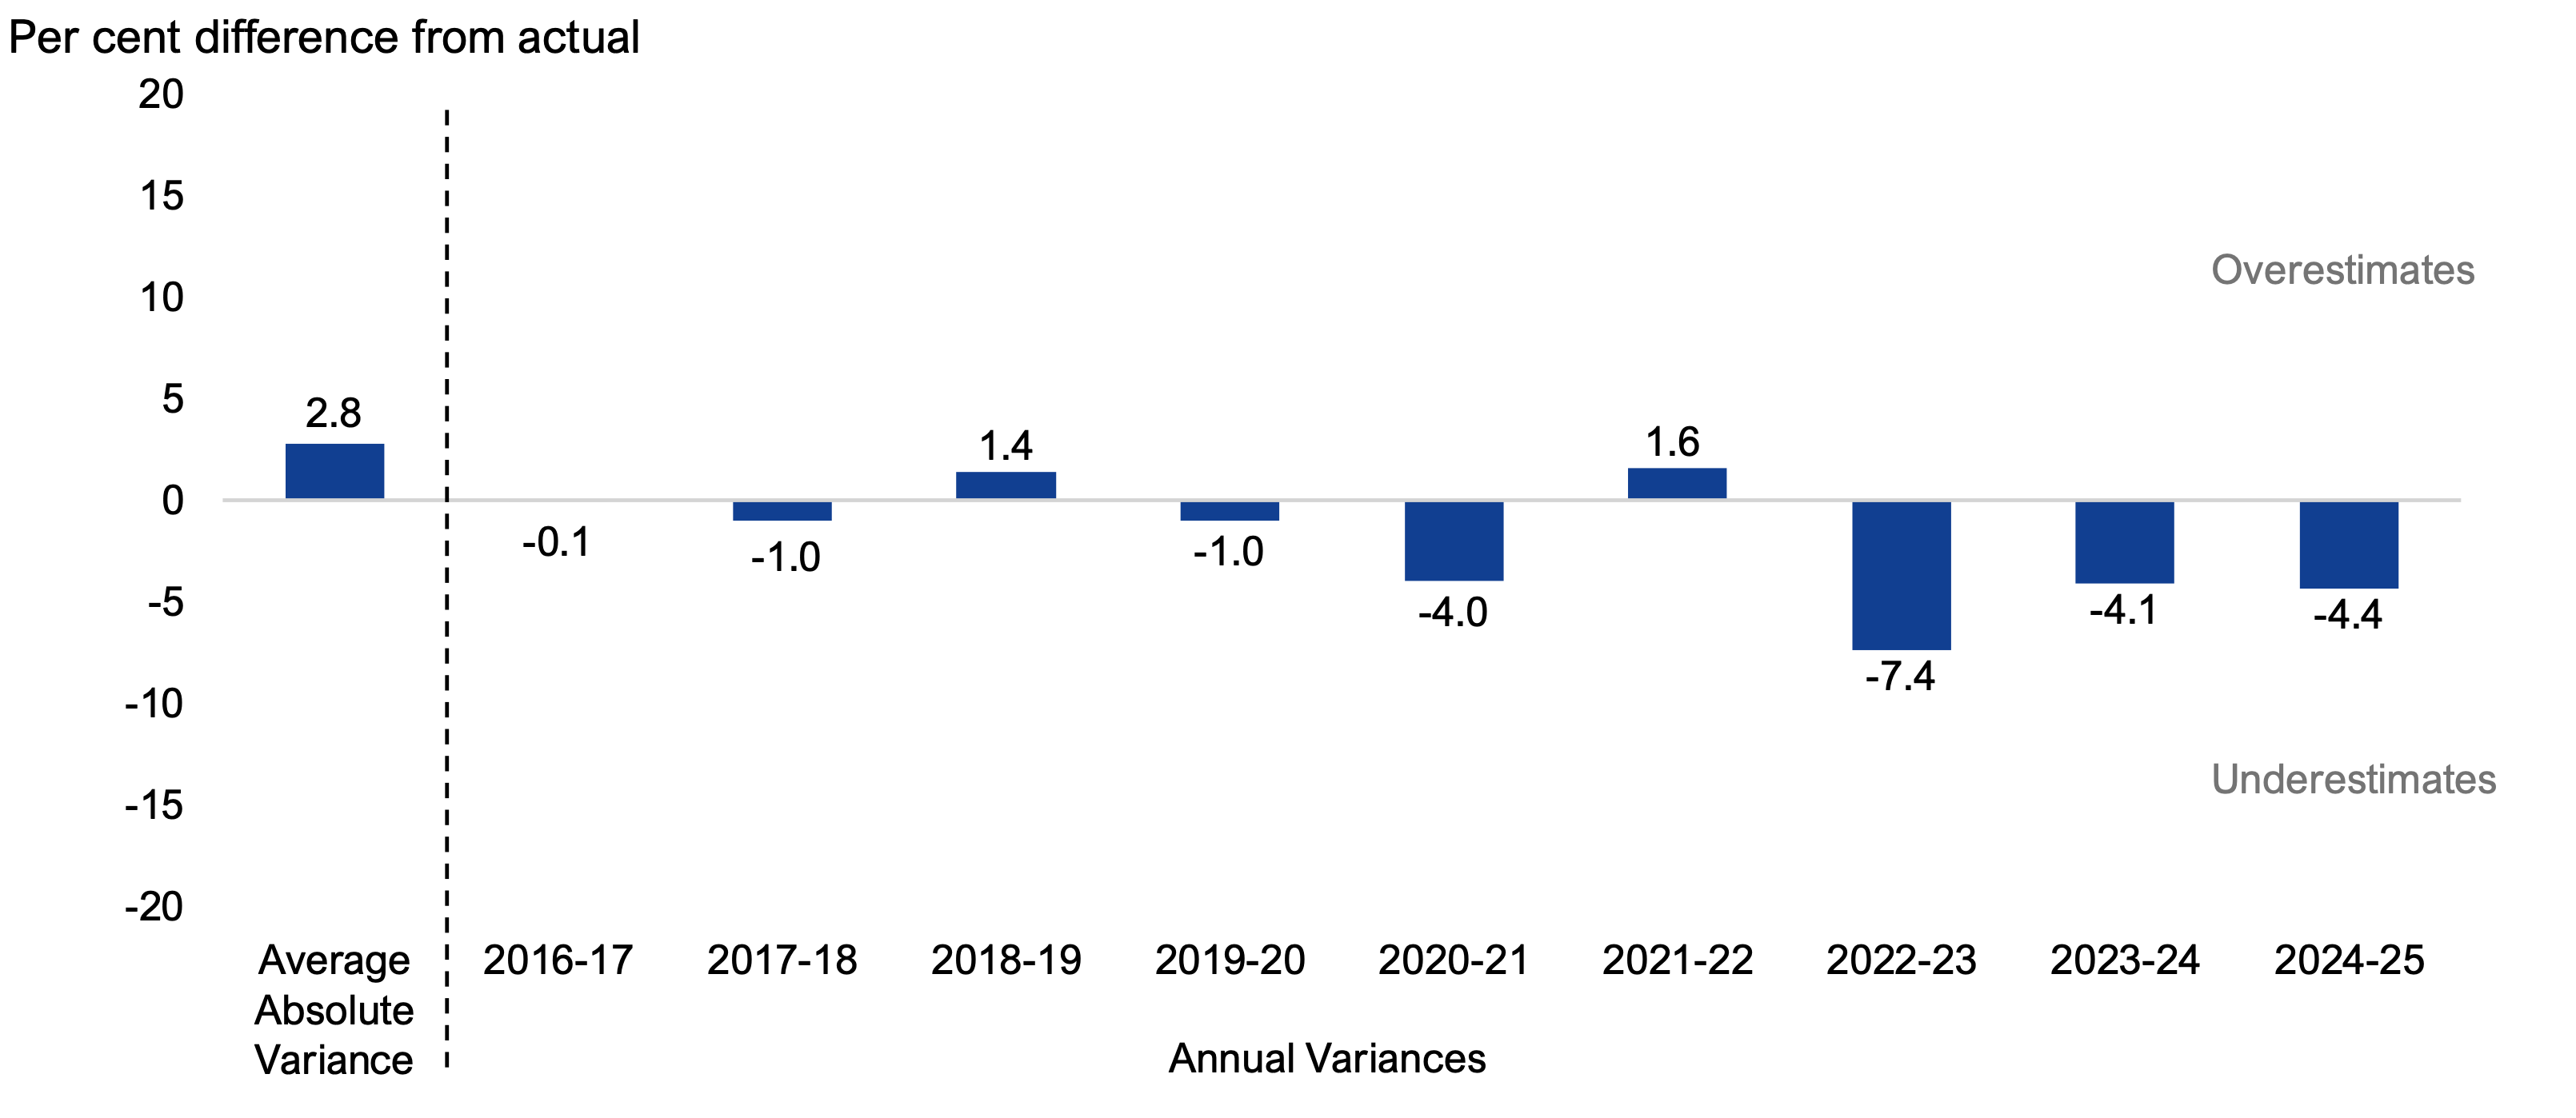
Spending
The FAO’s one-year average absolute spending variance was 2.8 per cent from 2016-17 to 2024-25. Overall, the FAO overestimated spending twice in nine years (2018-19 and 2021-22), which indicates a downward tendency in the FAO’s spending projections.
Figure 4.3 FAO one-year historical spending variances, 2016-17 to 2024-25
Note: Each forecast variance compares the FAO’s one-year projection from the Economic and Budget Outlook against the actual results in the Public Accounts of Ontario. FAO projections have been adjusted to reflect accounting changes introduced in the Public Accounts of Ontario.
Source: FAO and Public Accounts of Ontario.
Accessible version
| Per cent difference from actual | ||
|---|---|---|
| Average Absolute Variance | 2.8 | |
| Annual Variances | 2016-17 | -0.1 |
| 2017-18 | -1.0 | |
| 2018-19 | 1.4 | |
| 2019-20 | -1.0 | |
| 2020-21 | -4.0 | |
| 2021-22 | 1.6 | |
| 2022-23 | -7.4 | |
| 2023-24 | -4.1 | |
| 2024-25 | -4.4 |
The FAO’s average absolute spending variance increased during the pandemic and post-pandemic periods.
- From 2016-17 to 2019-20, the FAO’s average absolute spending variance was 0.9 per cent, with the largest variances in the justice and ‘other programs’ sectors.
- During the pandemic in 2020-21 and 2021-22, the FAO’s average absolute variance increased to 2.8 per cent. This period saw increased spending variances across all sectors driven by uncertainty surrounding the effect of the pandemic on government spending and service levels.
- From 2022-23 to 2024-25, the FAO’s average absolute variance increased further to 5.3 per cent. This increase was largely due to significant unanticipated one-time expenses in 2022-23 and 2024-25,[9] and higher-than-anticipated compensation spending growth in response to elevated inflation and the repeal of Bill 124.[10]
| 2016-17 to 2024-25 | 2016-17 to 2019-20 | 2020-21 to 2021-22 | 2022-23 to 2024-25 | |
|---|---|---|---|---|
| Health | 2.6% | 0.8% | 1.7% | 5.5% |
| Education | 2.5% | 0.8% | 3.8% | 3.9% |
| Postsecondary Education | 4.2% | 1.0% | 4.6% | 8.2% |
| Children, Community and Social Services | 2.2% | 2.2% | 3.1% | 1.7% |
| Justice | 6.1% | 3.7% | 6.0% | 9.5% |
| Other Programs | 7.4% | 3.4% | 10.9% | 10.3% |
| Interest and Other Debt Servicing Charges | 4.7% | 2.4% | 4.2% | 8.2% |
| Total Spending | 2.8% | 0.9% | 2.8% | 5.3% |
5. Forecast Accuracy: Three-Year Outlooks
This chapter examines the FAO’s three-year historical forecast accuracy since 2016-17 (the first year of FAO forecasting) for the Province’s budget balance. It compares the FAO’s Economic and Budget Outlook projection for the Province’s budget balance in year three of the outlook against the actual results in the Public Accounts of Ontario,[11] and calculates the FAO’s forecast variance from actuals.
The FAO’s three-year average absolute variance (which measures the magnitude of variance regardless of direction) for the provincial budget balance in the third year of the EBO outlook was $5.5 billion from 2018-19 to 2024-25. Overall, the FAO underestimated the budget balance three times in seven years (2021-22, 2022-23 and 2023-24).
Figure 5.1 FAO three-year historical budget balance variances, 2018-19 to 2024-25
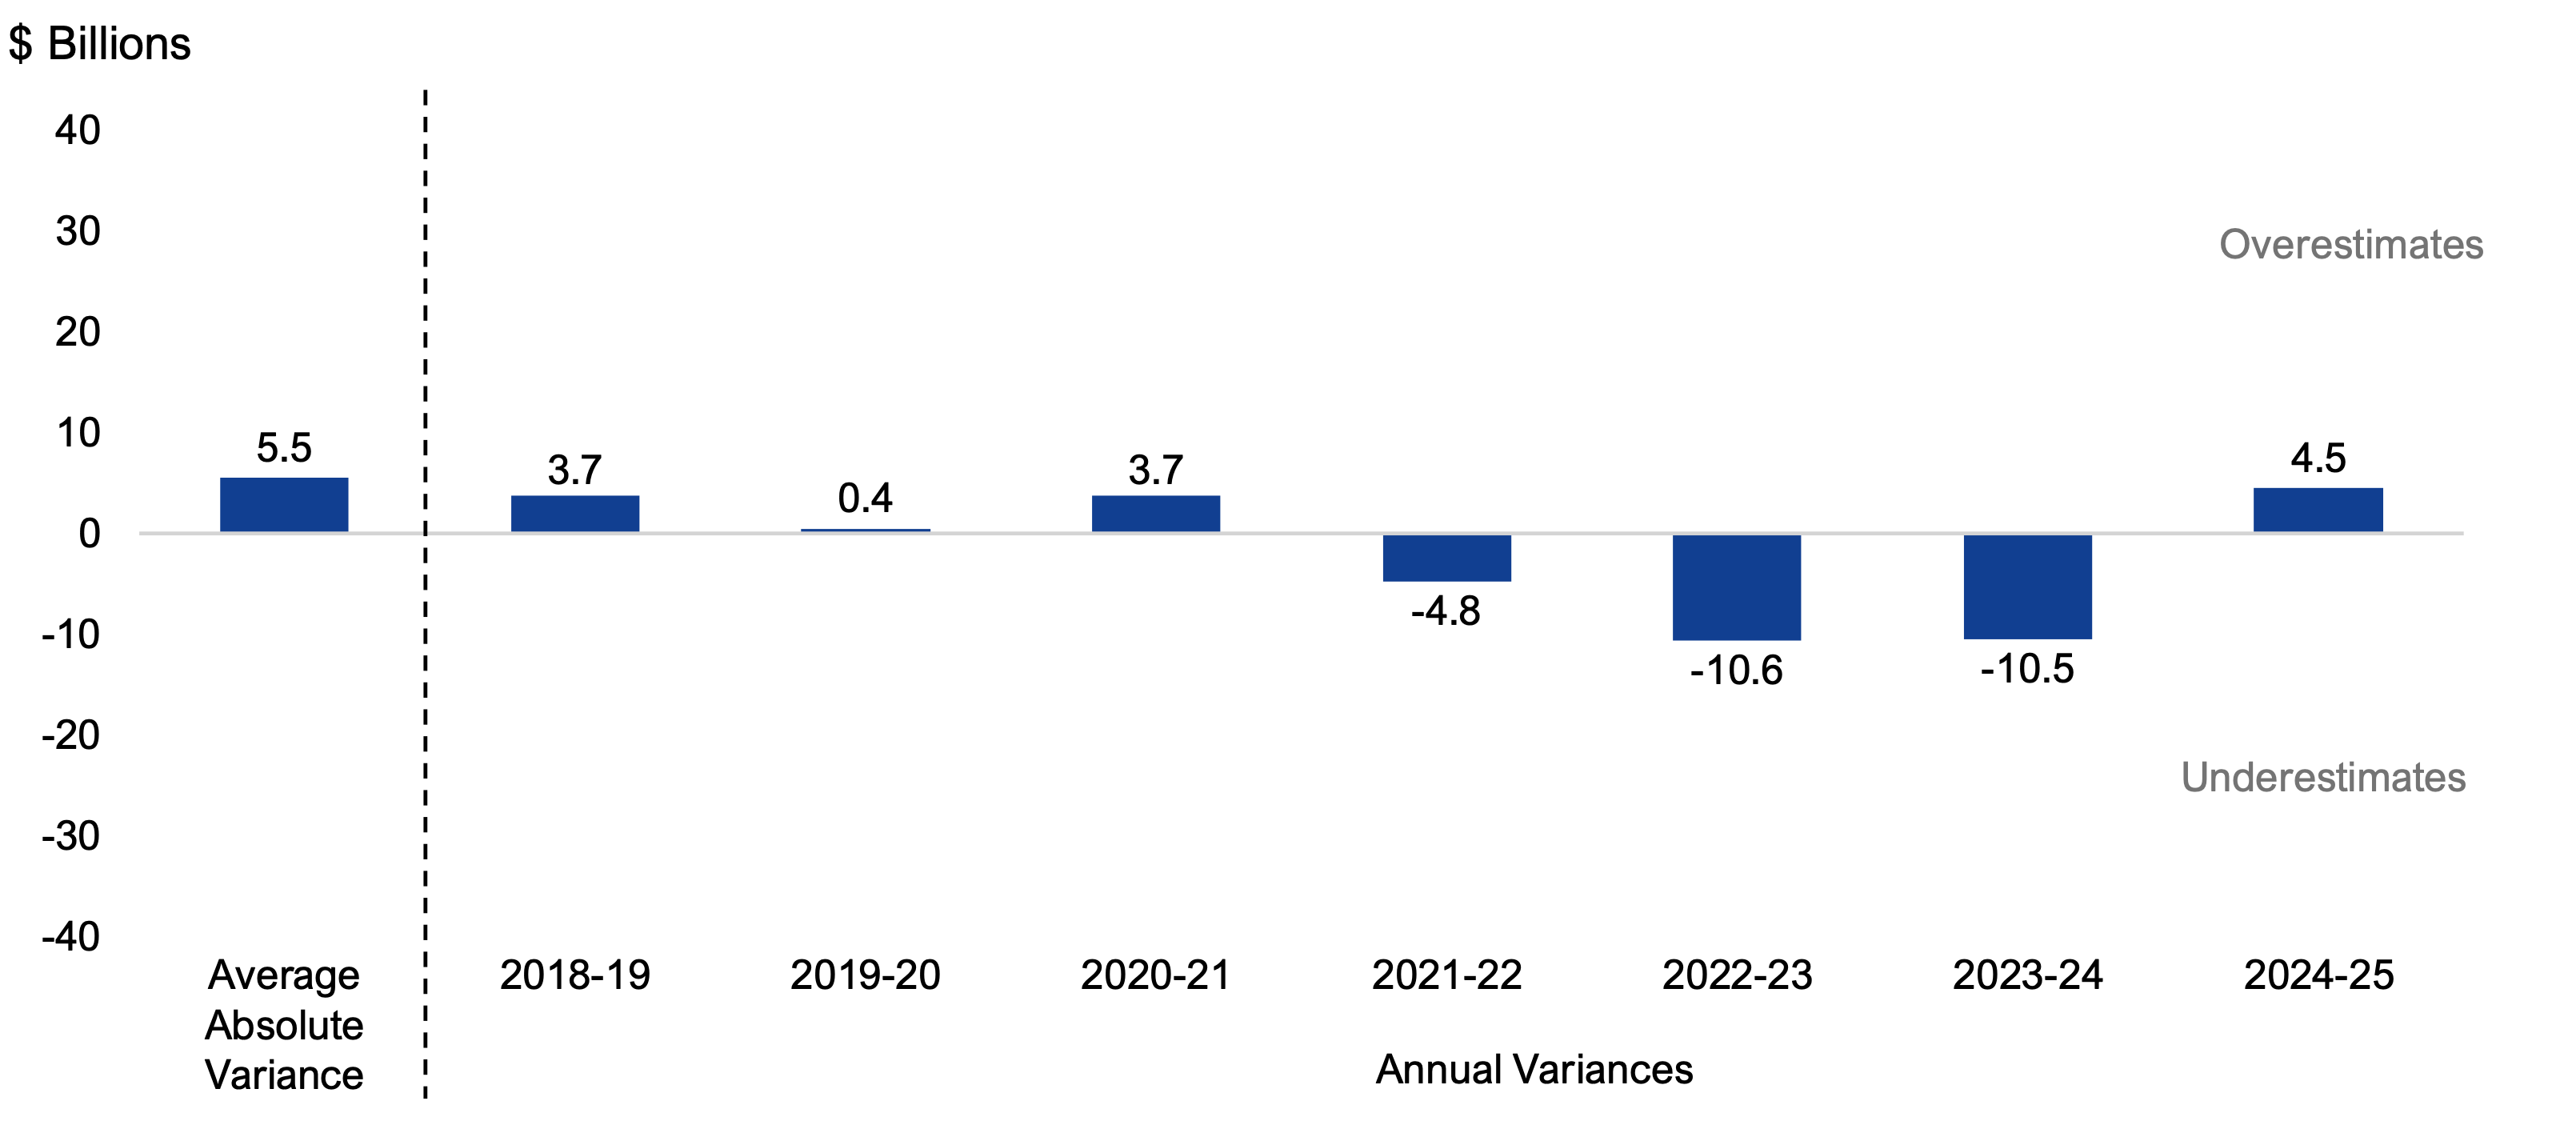
Note: Each forecast variance compares the FAO’s Economic and Budget Outlook projection for the Province’s budget balance in year three of the outlook against the actual results in the Public Accounts of Ontario. FAO projections have been adjusted to reflect accounting changes introduced in the Public Accounts of Ontario. The FAO’s projection for 2022-23 was taken from the Fall 2020 Economic and Budget Outlook as the outlook in the Spring 2020 EBO did not include a projection to 2022-23.
Source: FAO Economic and Budget Outlook reports and Public Accounts of Ontario.
Accessible version
| $ Billions | ||
|---|---|---|
| Average Absolute Variance | 5.5 | |
| Annual Variances | 2018-19 | 3.7 |
| 2019-20 | 0.4 | |
| 2020-21 | 3.7 | |
| 2021-22 | -4.8 | |
| 2022-23 | -10.6 | |
| 2023-24 | -10.5 | |
| 2024-25 | 4.5 |
The FAO’s three-year budget balance projections for 2022-23 and 2023-24 (produced in the pandemic years of 2020-21 and 2021-22) were both underestimated by over $10 billion. This was due to the unanticipated strength of revenue growth throughout the pandemic, which was only partially offset by the FAO’s underestimated spending outlook. Excluding 2022-23 and 2023-24, the FAO’s average absolute variance for the provincial budget balance in the third year of the EBO outlook was $3.4 billion.
6. Forecast Accuracy Compared to the Government
This chapter compares the FAO’s forecast accuracy against the government’s forecasts in Ontario Budgets, with a focus on 2024-25 and historical one-year and three-year outlooks.
There are several reasons why the FAO’s projections in its Economic and Budget Outlook reports may differ from the government’s projections in Ontario Budgets.
- The FAO produces economic, revenue and spending forecasts that are independent of the government’s projections in Ontario Budgets.
- The FAO typically publishes its Economic and Budget Outlook reports after the release of the Ontario Budget, which allows the FAO to use more up-to-date information in its projections. However, the government has access to more detailed information and resources to support its budget projections.
- The Fiscal Sustainability, Transparency and Accountability Act, 2019,[12] requires that the government include a reserve in its fiscal plan to provide for unexpected changes in revenues and expenses. In addition, the government’s spending projections in Ontario Budgets include Contingency Funds that can be used to address spending pressures or fund new/enhanced programs during the fiscal year. FAO projections do not include a reserve or Contingency Funds.
- FAO projections are based on announced government policies and commitments, while the government’s projections may include unannounced program changes or new measures.
2024-25
This section compares the FAO’s 2024-25 projections for budget balance, revenue and spending in the Spring 2024 EBO against the government’s projections in the 2024 Ontario Budget. Both projections are compared to actual results in the 2024-25 Public Accounts of Ontario.[13]
Budget Balance
In the Spring 2024 EBO, the FAO projected a $6.4 billion budget deficit for 2024-25, which was $5.3 billion below the $1.1 billion actual budget deficit reported in the 2024-25 Public Accounts of Ontario. In the 2024 budget, the government projected a $9.8 billion budget deficit, which was $8.7 billion below actual.
Figure 6.1 2024 Ontario Budget forecast, FAO Spring 2024 EBO forecast and Public Accounts actual for the 2024-25 budget balance
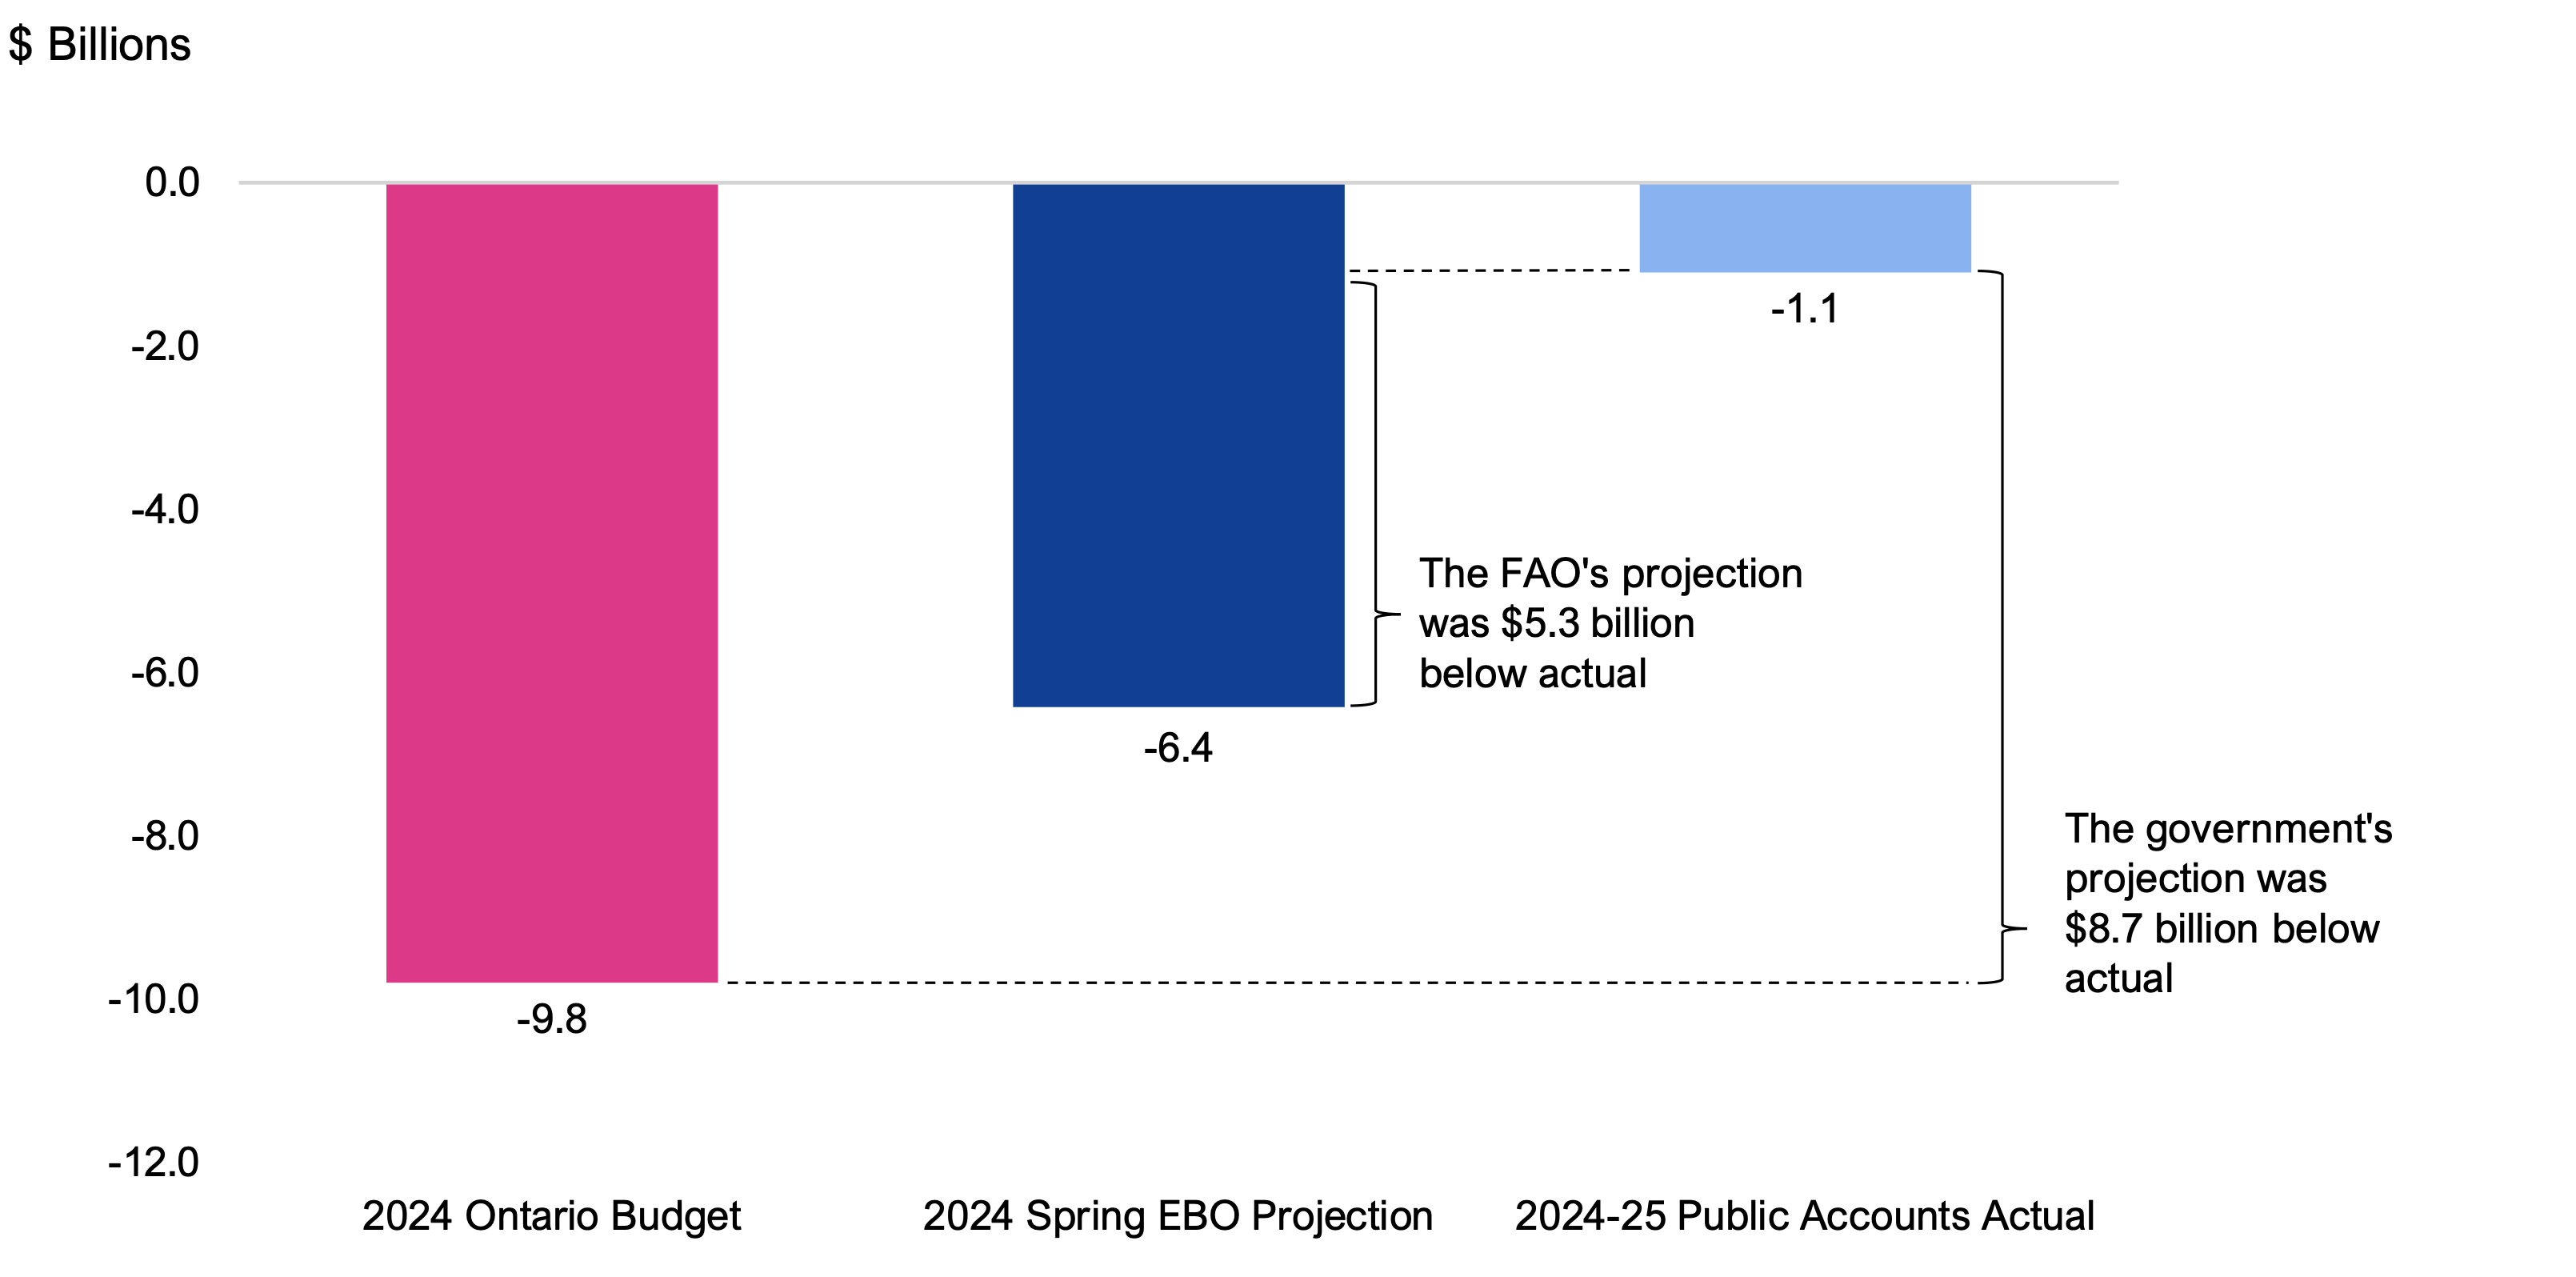
Source: 2024 Ontario Budget, FAO Spring 2024 Economic and Budget Outlook, and the 2024-25 Public Accounts of Ontario.
Accessible version
| $ Billions | Difference | |
|---|---|---|
| 2024 Ontario Budget | -9.8 | The Ontario Government’s projection was $8.7 billion below actual |
| 2024 Spring EBO Projection | -6.4 | The FAO’s projection was $5.3 billion below actual |
| 2024-25 Public Accounts Actual | -1.1 |
Revenue
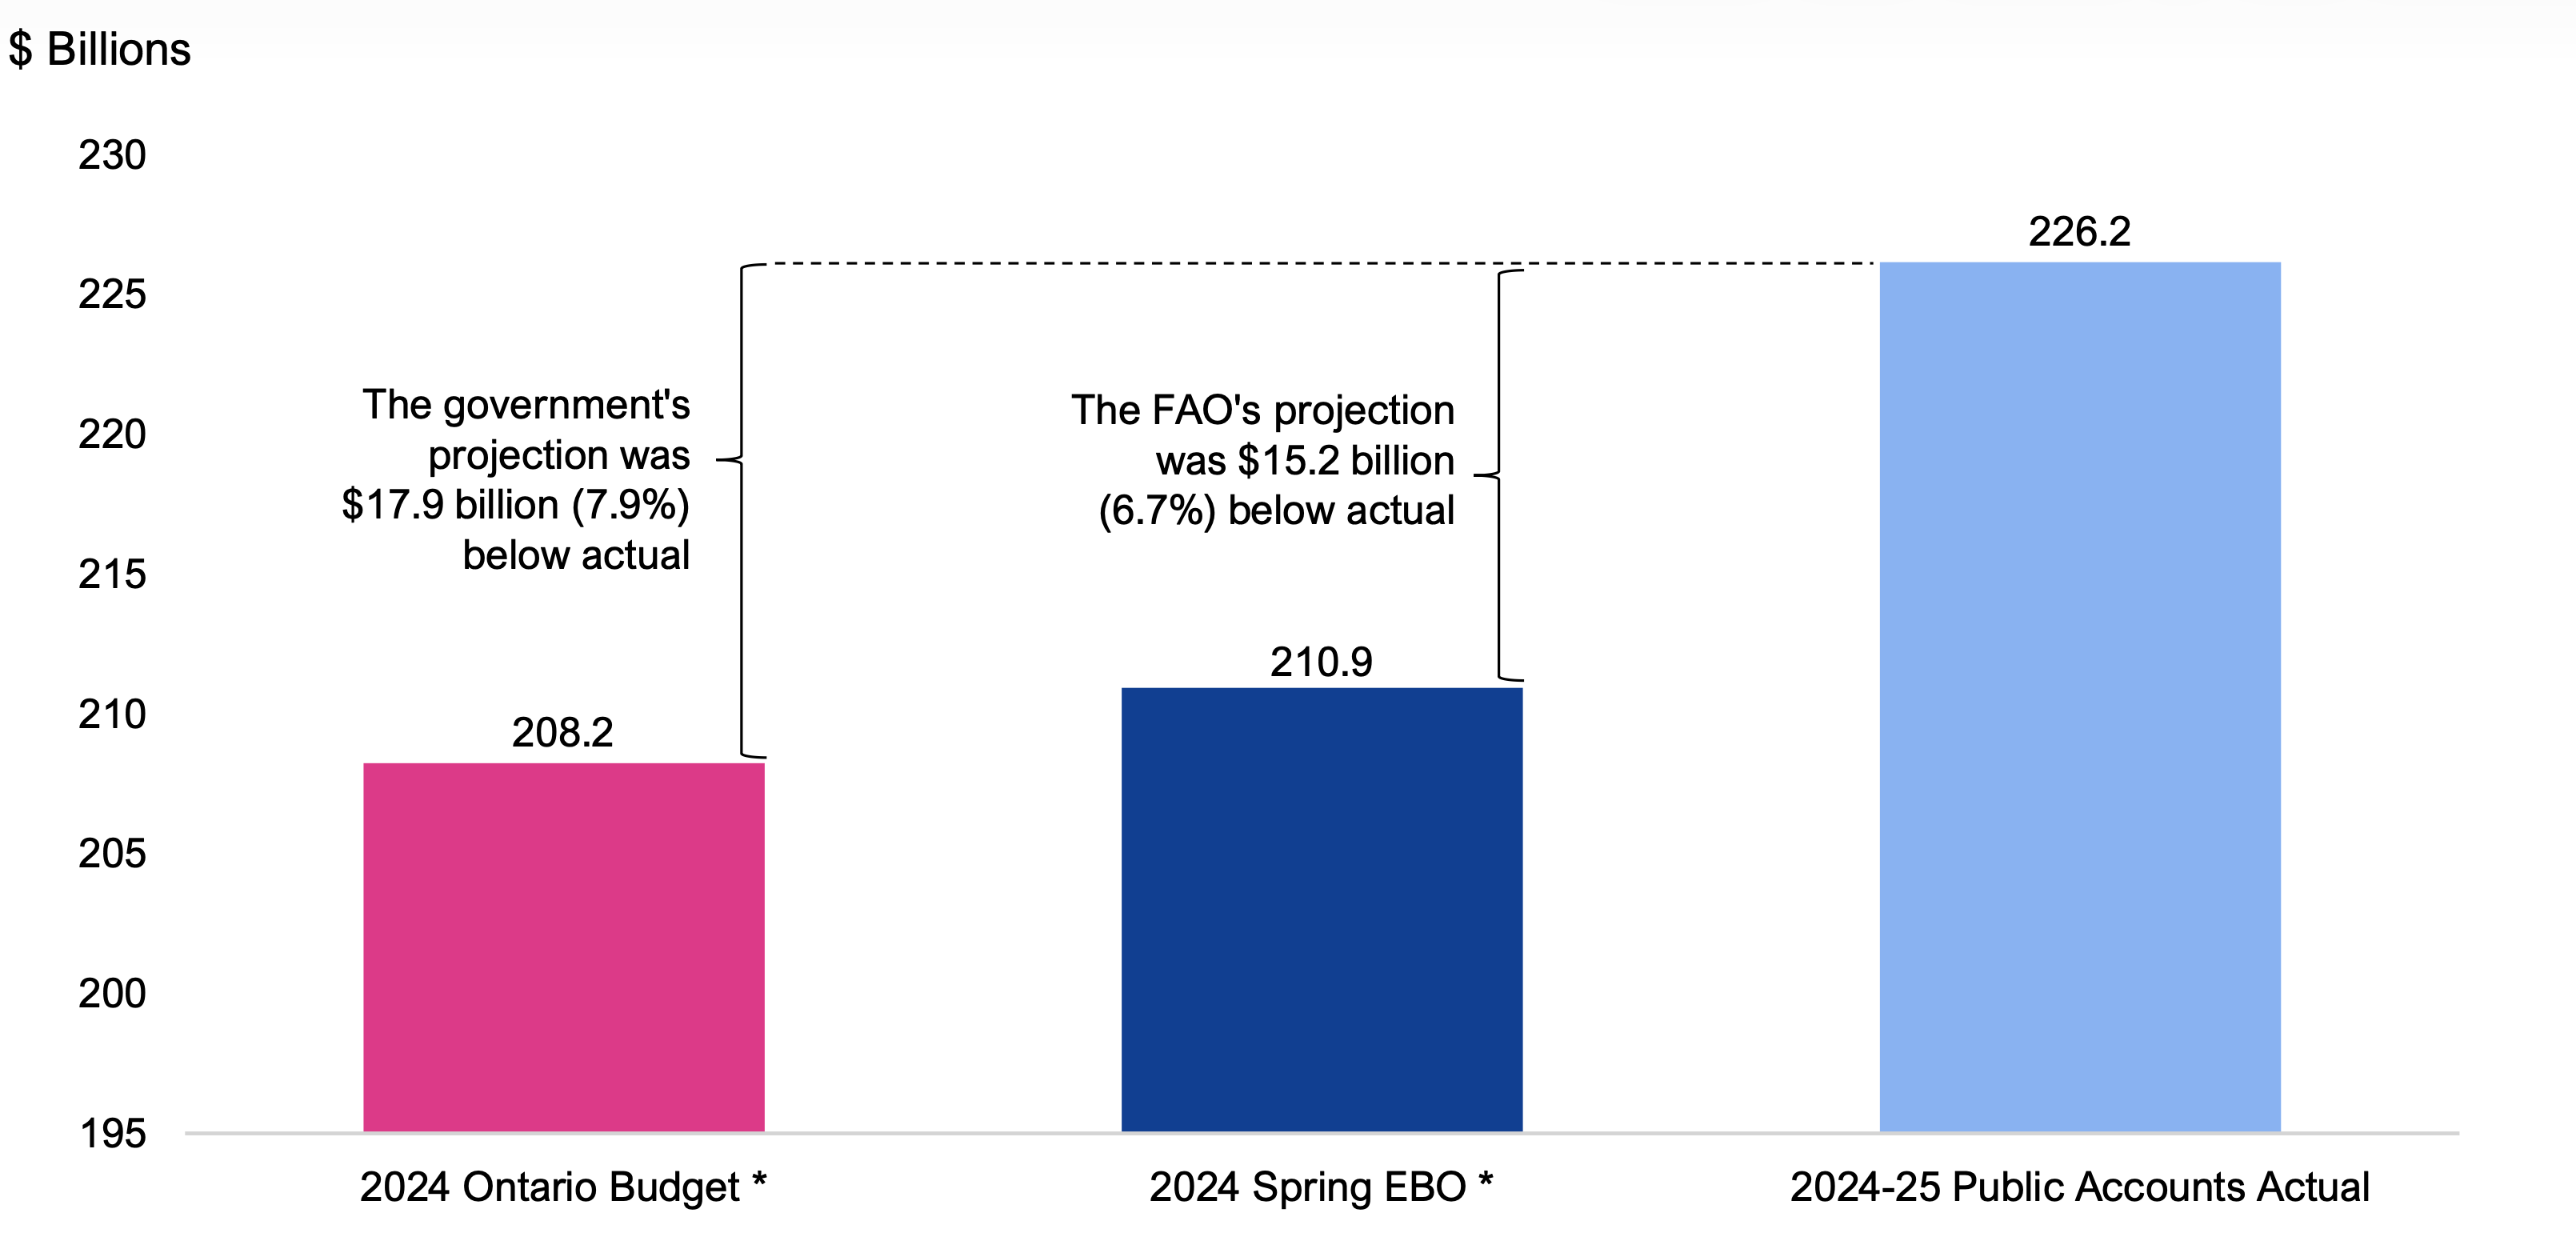
In the Spring 2024 EBO, the FAO projected total 2024-25 revenue at $210.9 billion, which was $15.2 billion (6.7 per cent) below actual total revenue of $226.2 billion. In the 2024 Ontario Budget, the government projected $208.2 billion in total revenue, which was $17.9 billion (7.9 per cent) below actual.
The FAO’s smaller 2024-25 variance was due to a more accurate forecast for personal income tax and, to a lesser extent, a more accurate forecast for other non-tax revenue.
Figure 6.2 2024 Ontario Budget forecast, FAO Spring 2024 EBO forecast and Public Accounts actual for 2024-25 total revenue
* The 2024 Ontario Budget and the Spring 2024 EBO projections have been restated to reflect an accounting change to interest and investment income introduced in the 2024-25 Public Accounts of Ontario.
Source: 2024 Ontario Budget, FAO Spring 2024 Economic and Budget Outlook, and 2024-25 Public Accounts of Ontario.
Accessible version
| $ Billions | Difference | |
|---|---|---|
| 2024 Ontario Budget * | 208.2 | The Ontario Government’s projection was $17.9 billion (7.9%) below actual |
| 2024 Spring EBO * | 210.9 | The FAO’s projection was $15.2 billion (6.7%) below actual |
| 2024-25 Public Accounts Actual | 226.2 |
Spending
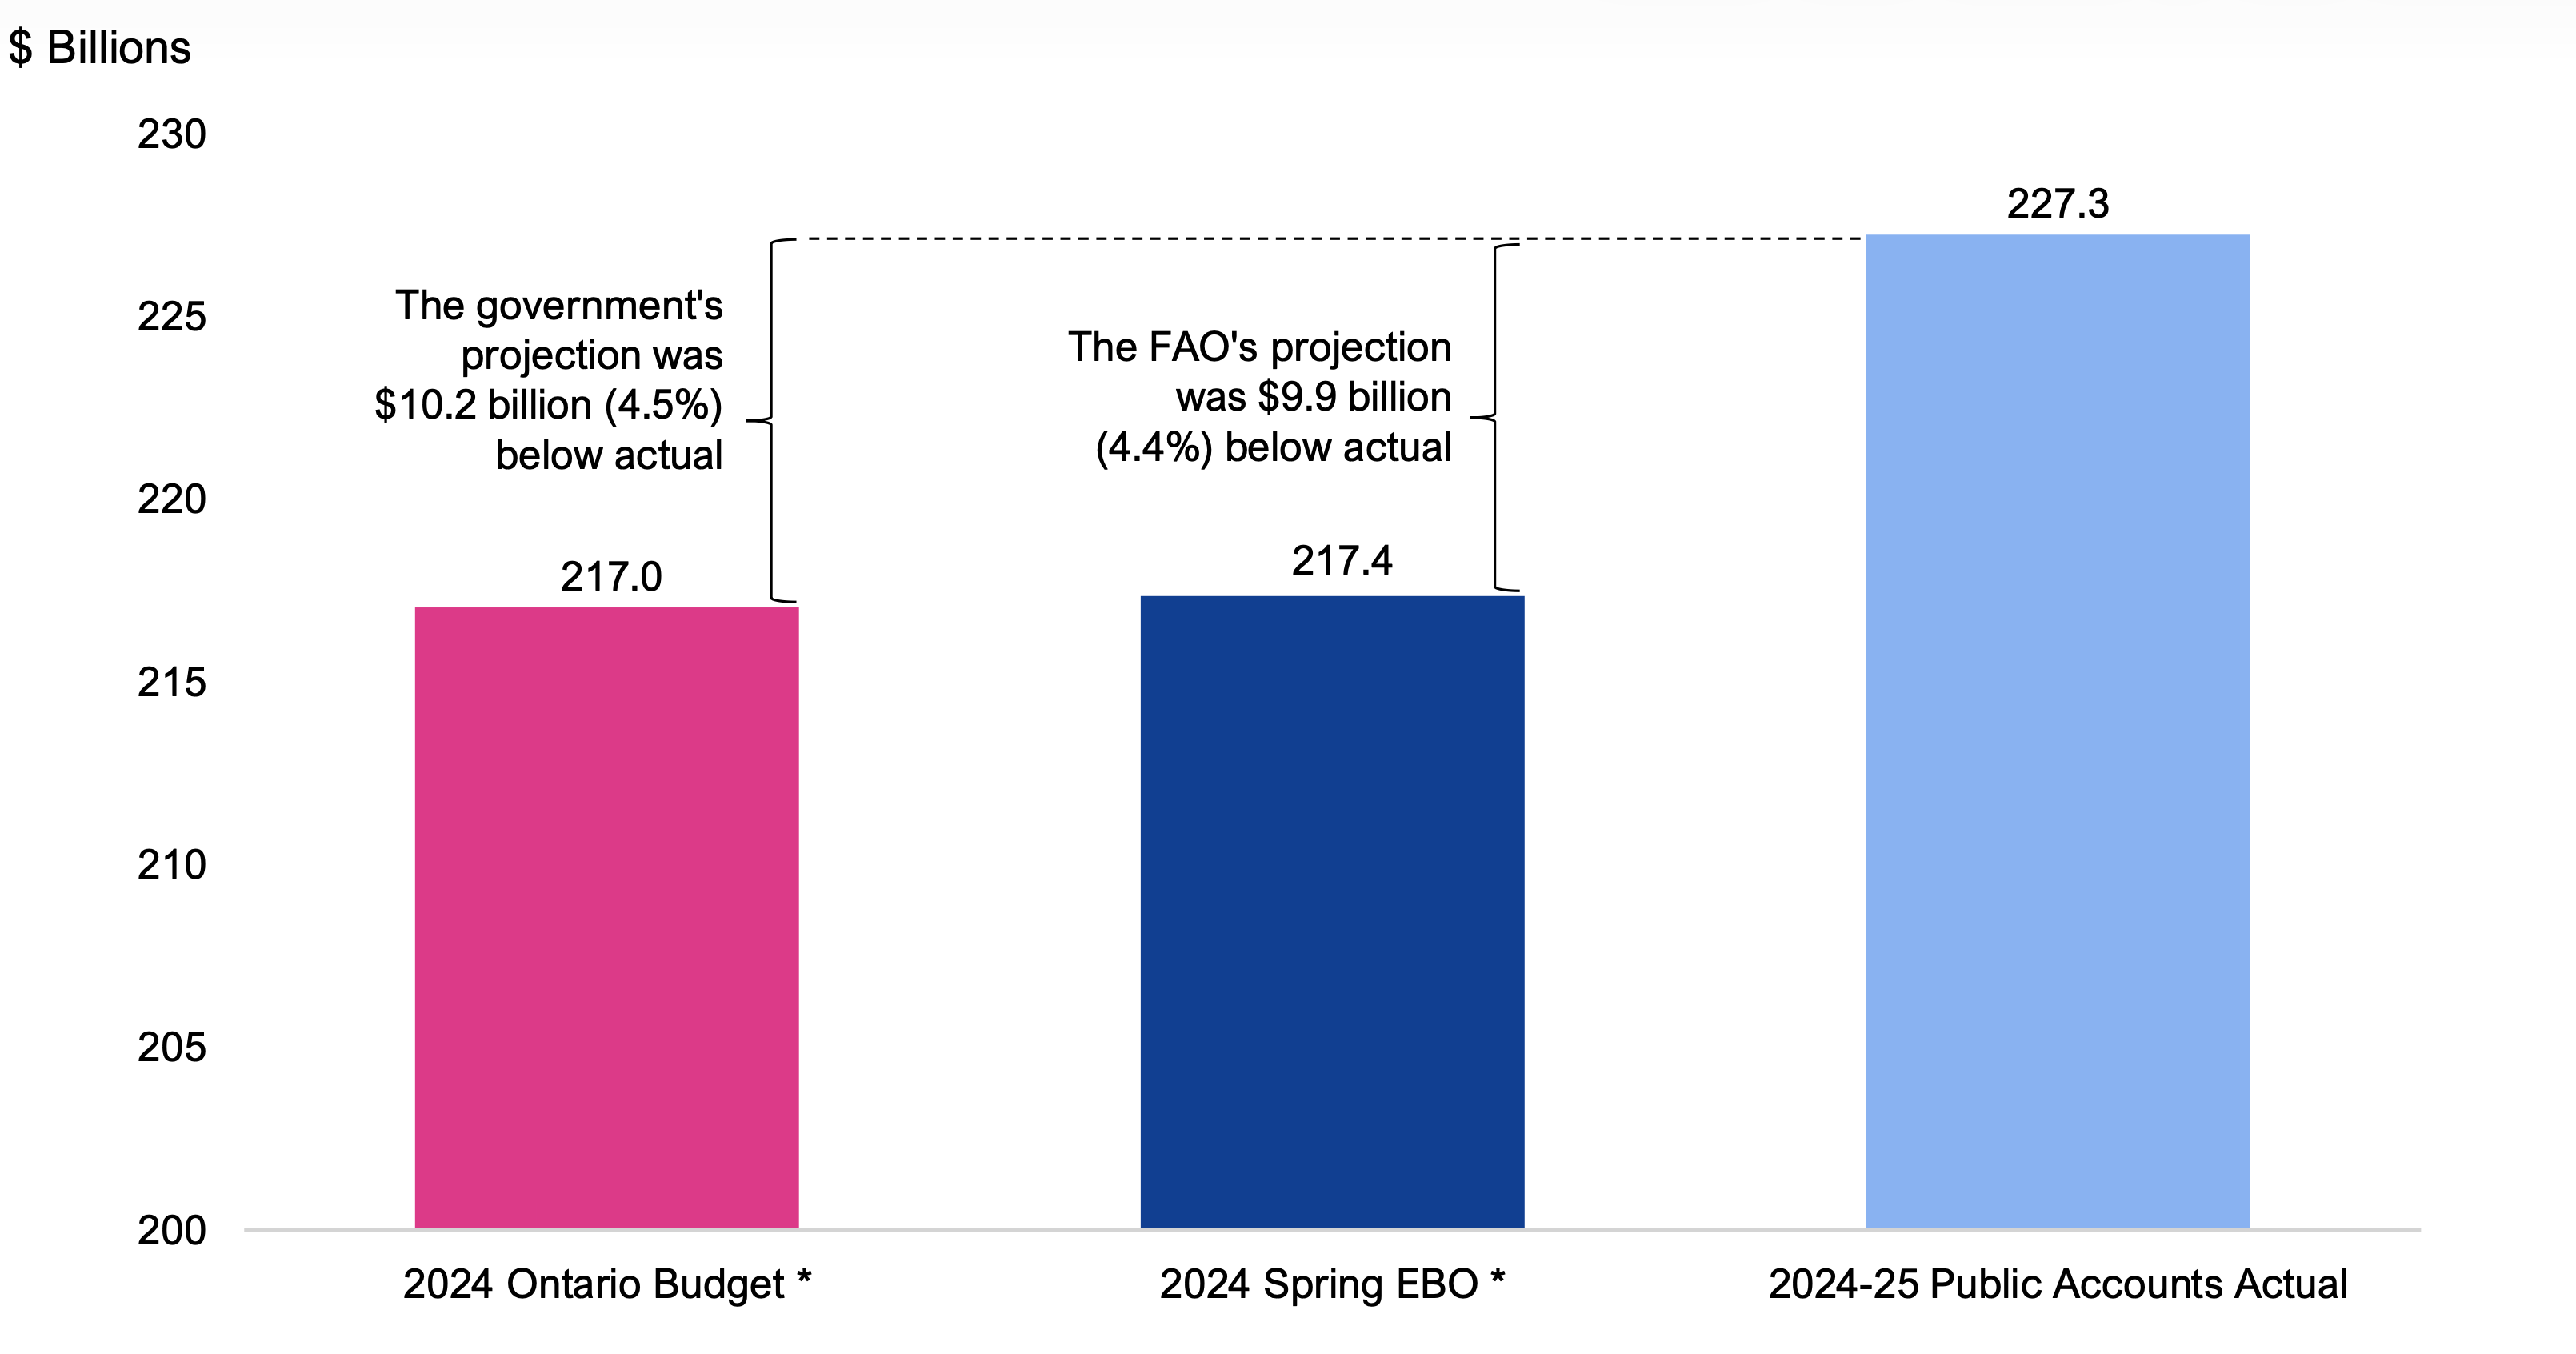
In the Spring 2024 EBO, the FAO projected total 2024-25 spending at $217.4 billion, which was $9.9 billion (4.4 per cent) below actual total spending of $227.3 billion. In the 2024 Ontario Budget, the government projected $217.0 billion in total spending, which was $10.2 billion (4.5 per cent) below actual.
The FAO’s and government’s spending variances were approximately equal. The government underestimated spending across most sectors to a greater extent than the FAO; however, this was offset by the government’s more accurate forecast for ‘other programs’.
Figure 6.3 2024 Ontario Budget forecast, FAO Spring 2024 EBO forecast and Public Accounts actual for 2024-25 total spending
* The 2024 Ontario Budget and the Spring 2024 EBO projections have been restated to reflect an accounting change to interest and investment income introduced in the 2024-25 Public Accounts of Ontario.
Source: 2024 Ontario Budget, FAO Spring 2024 Economic and Budget Outlook, and 2024-25 Public Accounts of Ontario.
Accessible version
| $ Billions | Difference | |
|---|---|---|
| 2024 Ontario Budget * | 217.0 | The Ontario Government’s projection was $10.3 billion (4.5 %) below actual |
| 2024 Spring EBO * | 217.4 | The FAO’s projection was $9.9 billion (4.4 %) below actual |
| 2024-25 Public Accounts Actual | 227.3 |
One-Year Outlooks
This section compares the FAO’s one-year historical forecast accuracy against the government’s for budget balance, revenue and spending. FAO projections from Economic and Budget Outlook reports and government projections from Ontario Budgets are compared to actual results in the Public Accounts of Ontario.
Budget Balance
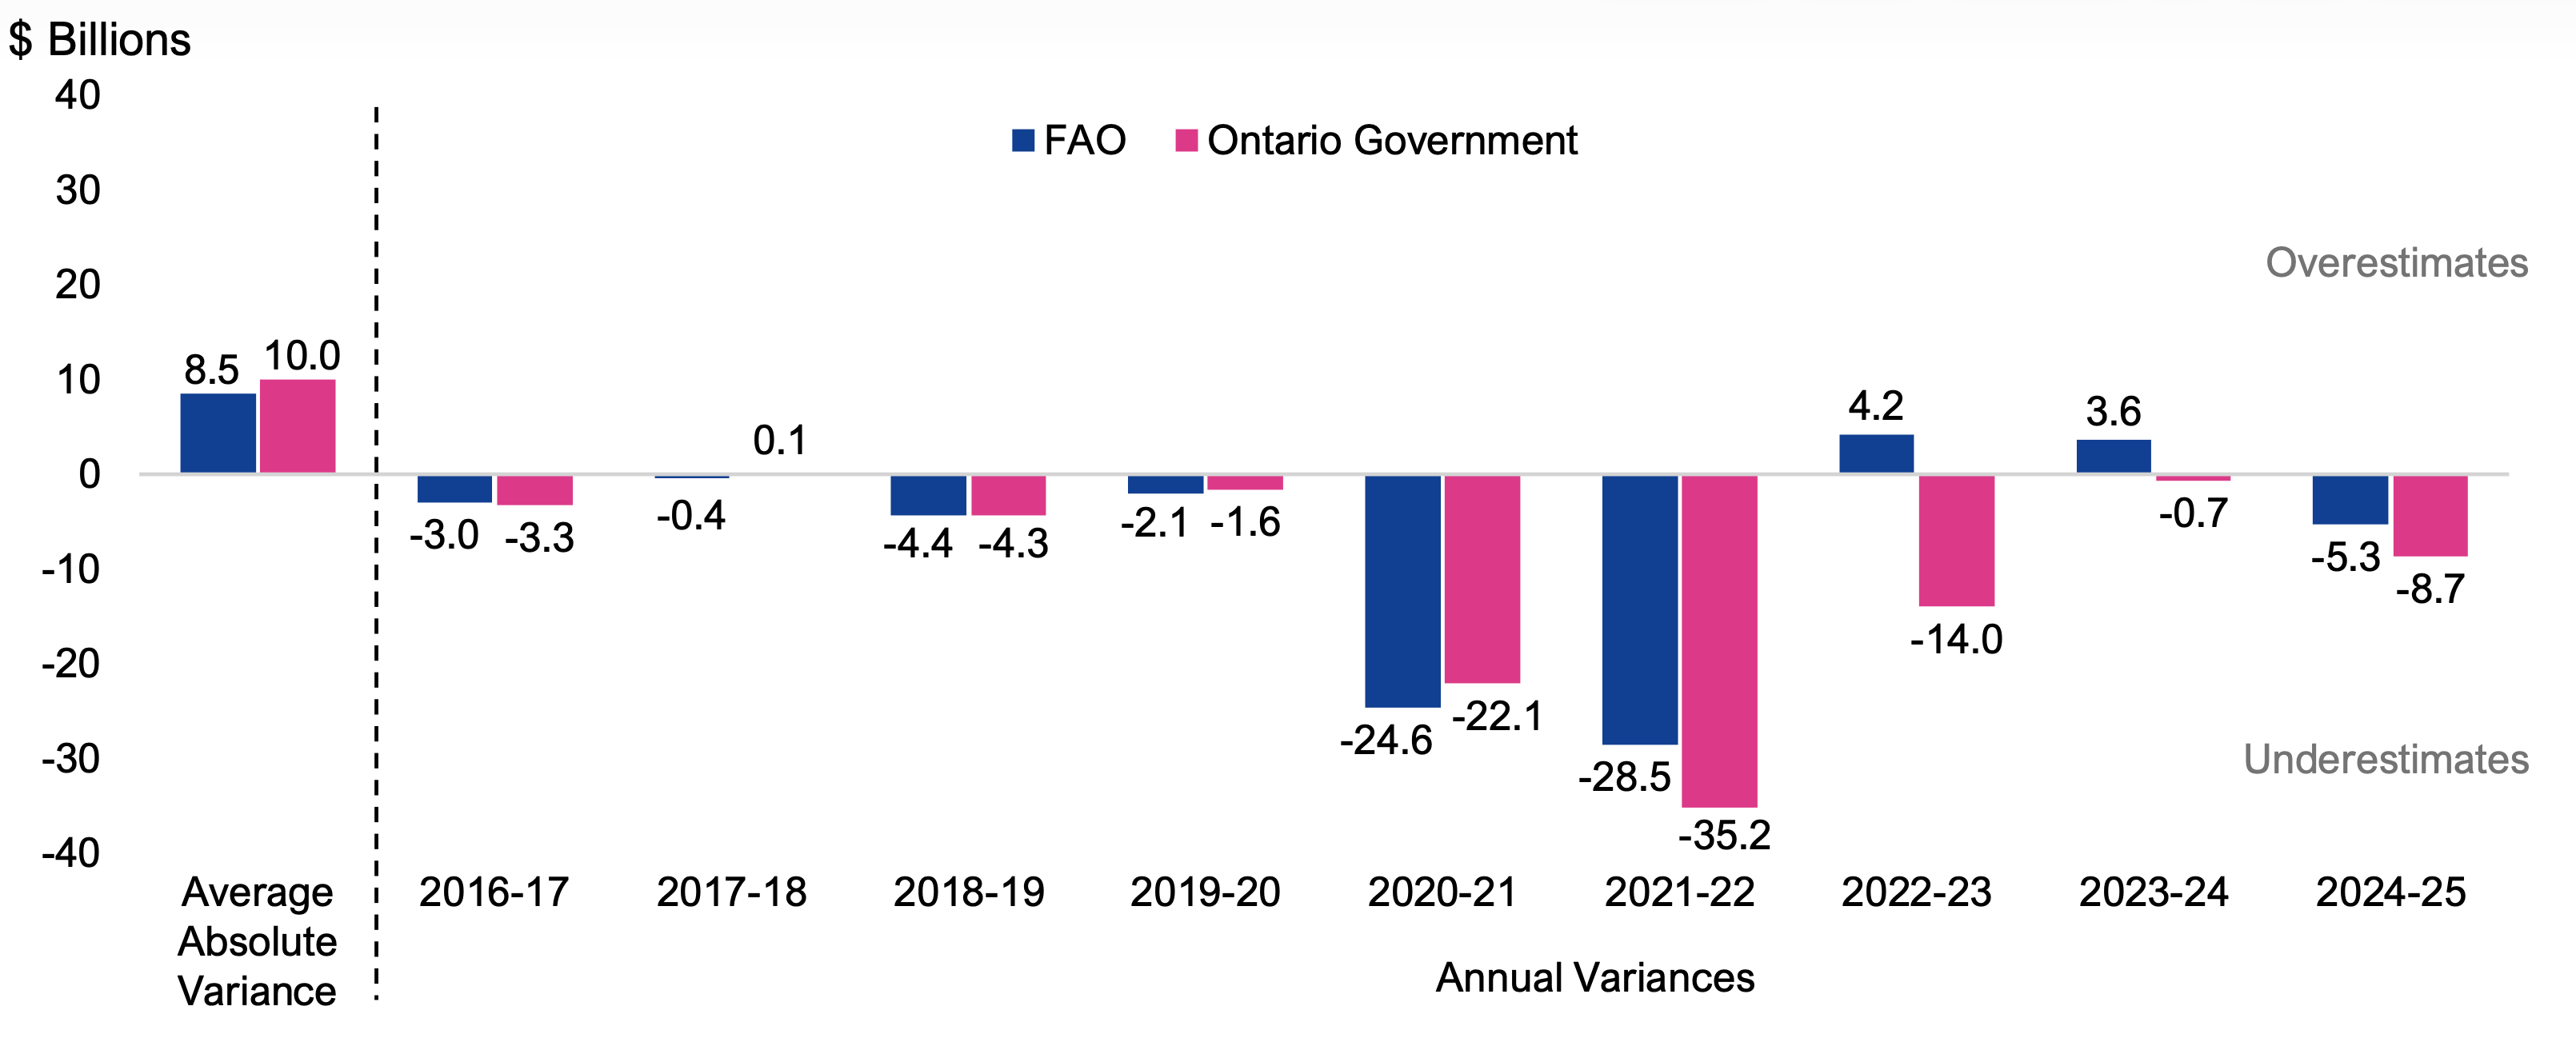
Figure 6.4 shows the one-year budget balance variances for the FAO and the government since 2016-17, as well as the average absolute variance over the period (which measures the magnitude of variance regardless of direction). Over the 2016-17 to 2024-25 period, the FAO’s average absolute variance for the budget balance was $8.5 billion, while the government’s average absolute variance was $10.0 billion. By fiscal year, the government’s projection was closer to the actual results in the Public Accounts in five of nine years. The FAO overestimated the budget balance twice in nine years (2022-23 and 2023-24), while the government overestimated the budget balance once (2017-18).
Figure 6.4 One-year historical budget balance variances, 2016-17 to 2024-25
Note: Projections have been adjusted to reflect accounting changes introduced in the Public Accounts of Ontario.
Source: Ontario Budgets, FAO Economic and Budget Outlook reports, and Public Accounts of Ontario.
Accessible version
| $ Billions | FAO | Ontario Government | |
|---|---|---|---|
| Average Absolute Variance | 8.5 | 10.0 | |
| Annual Variances | 2016-17 | -3.0 | -3.3 |
| 2017-18 | -0.4 | 0.1 | |
| 2018-19 | -4.4 | -4.3 | |
| 2019-20 | -2.1 | -1.6 | |
| 2020-21 | -24.6 | -22.1 | |
| 2021-22 | -28.5 | -35.2 | |
| 2022-23 | 4.2 | -14.0 | |
| 2023-24 | 3.6 | -0.7 | |
| 2024-25 | -5.3 | -8.7 | |
The FAO and government average absolute variances from 2016-17 to 2024-25 were significantly influenced by the pandemic years of 2020-21 and 2021-22.
- Prior to the pandemic, from 2016-17 to 2019-20, the FAO and government average absolute variances were similar, at $2.5 billion and $2.3 billion, respectively.
- Both the FAO and the government significantly underestimated the actual budget balance in the pandemic years of 2020-21 and 2021-22, by similar margins. The FAO’s average absolute variance was $26.6 billion, while the government’s was $28.6 billion.
- Over the last three years, from 2022-23 to 2024-25, budget balance variances for both the FAO and the government were reduced. The FAO’s average absolute variance was $4.4 billion, while the government’s was $7.8 billion.
Excluding the pandemic years of 2020-21 and 2021-22, the FAO’s average absolute variance for the budget balance was $3.3 billion, while the government’s was $4.7 billion.
Revenue
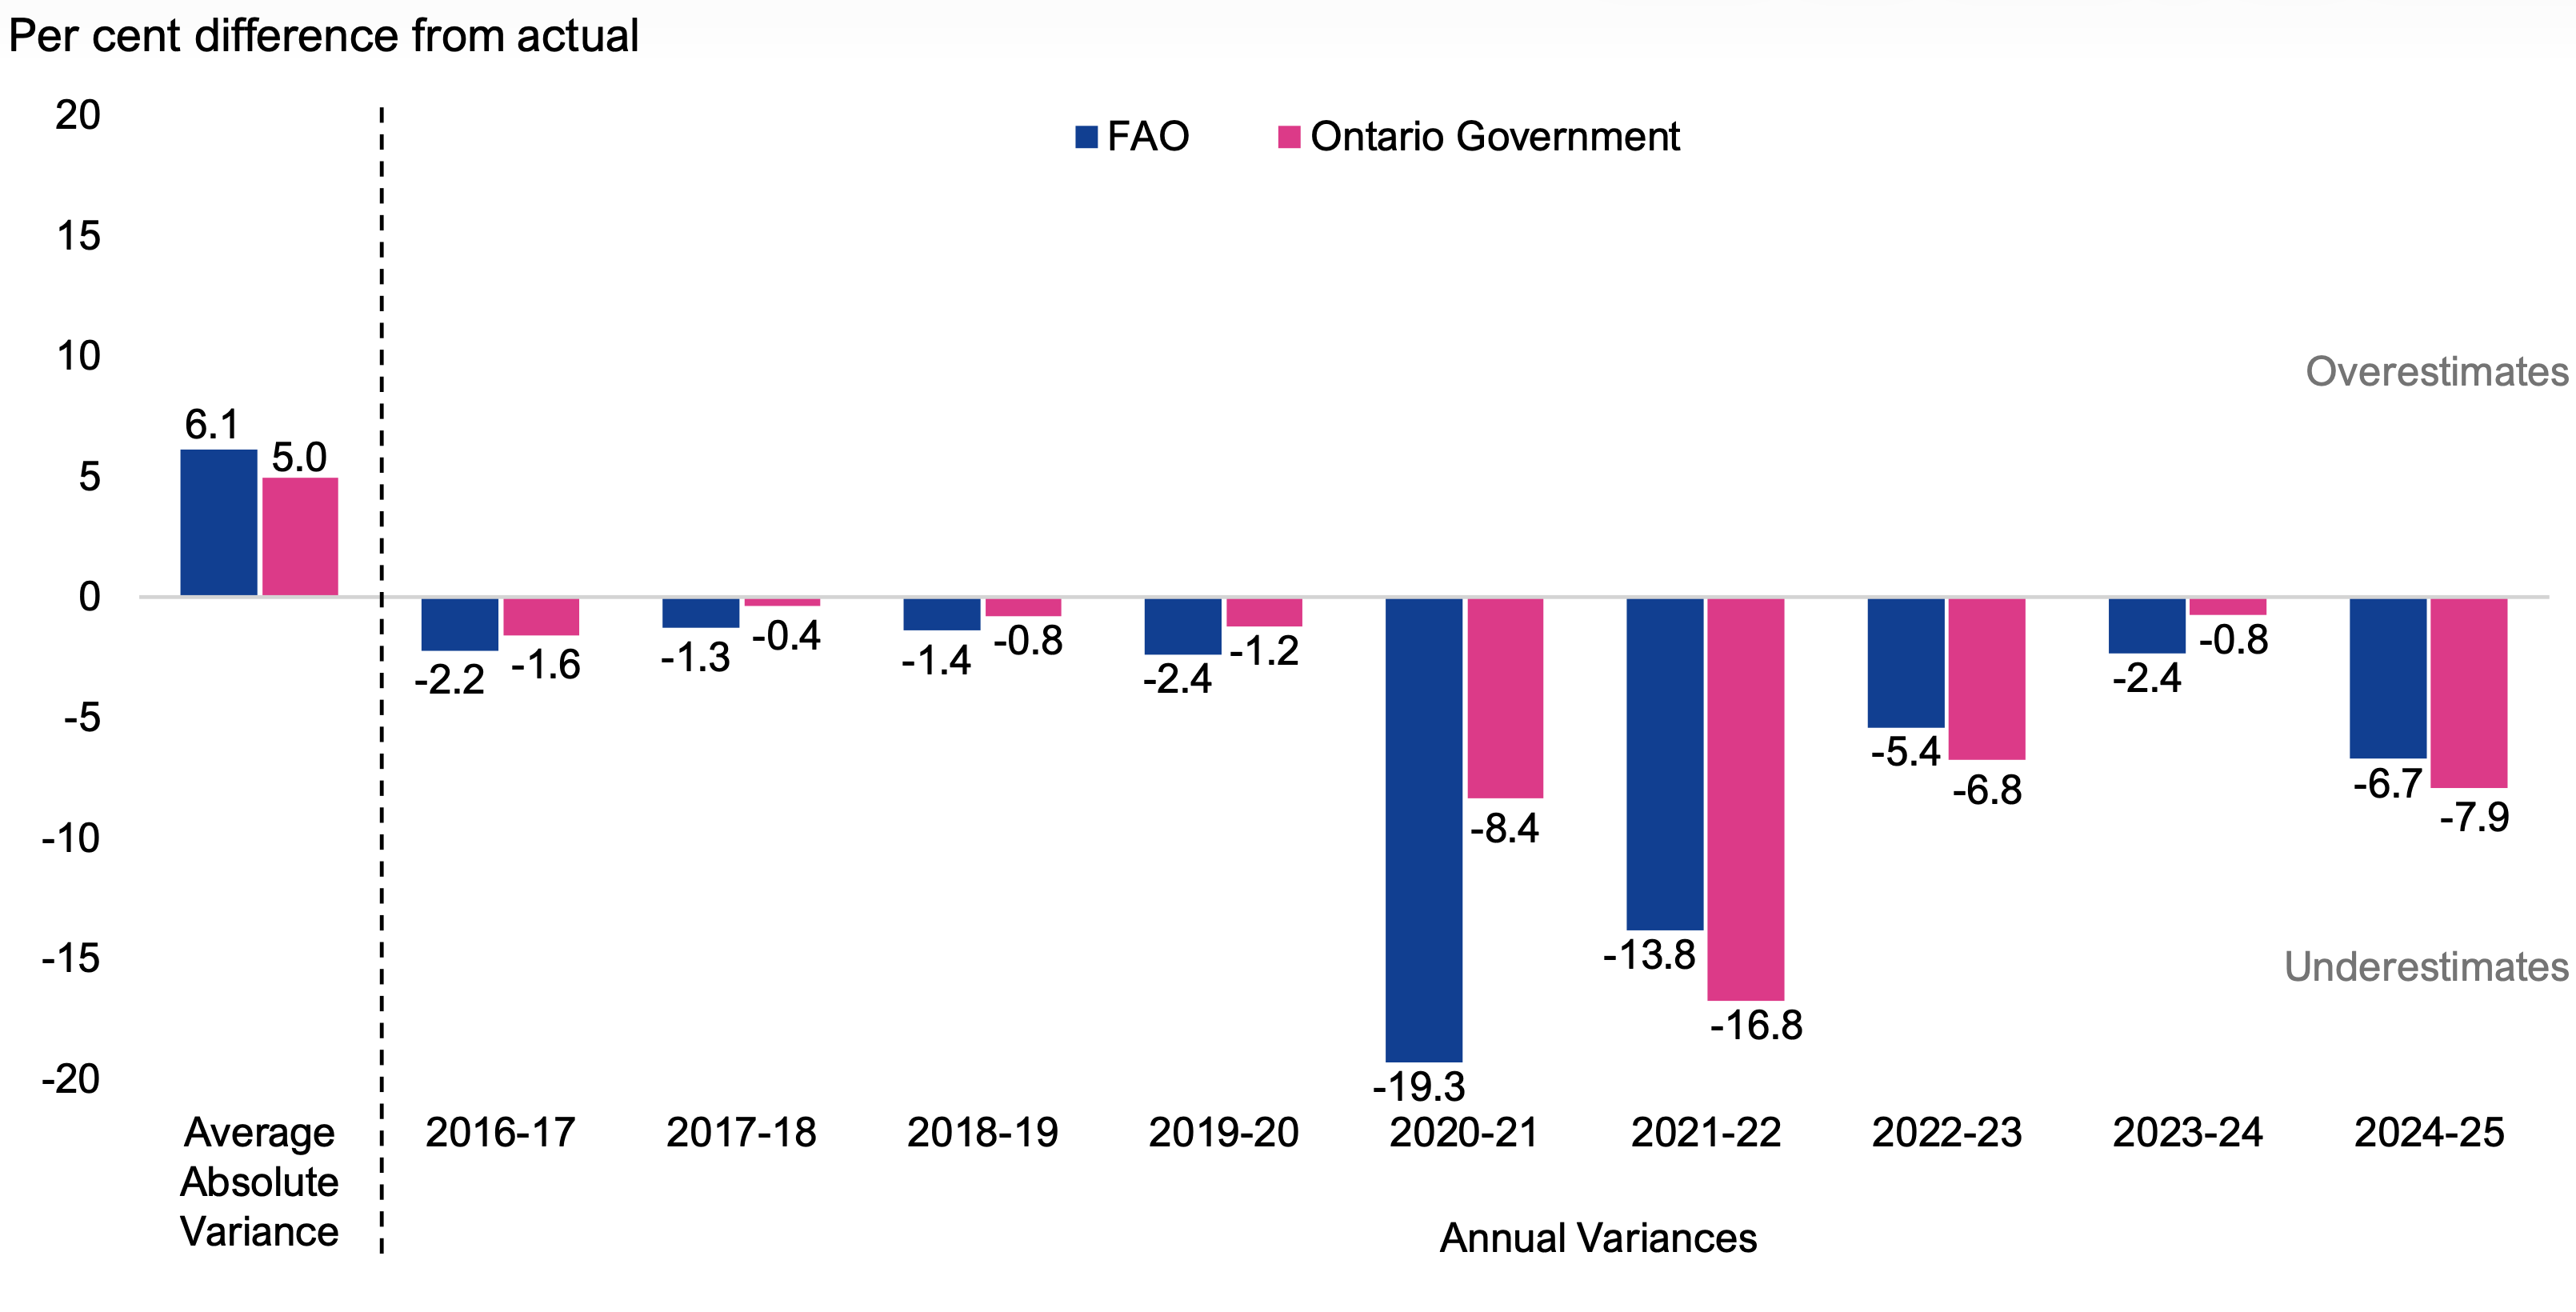
Figure 6.5 compares the FAO’s and the government’s average absolute forecast variances for total revenue. From 2016-17 to 2024-25, the FAO had a 6.1 per cent average absolute variance and the government had an average absolute variance of 5.0 per cent. By fiscal year, the government’s projection was closer to the actual results in the Public Accounts in six of nine years. Both the FAO’s and the government’s revenue forecasts were below actual in all nine years.
Figure 6.5 One-year historical revenue variances, 2016-17 to 2024-25
Note: Projections have been adjusted to reflect accounting changes introduced in the Public Accounts of Ontario.
Source: Ontario Budgets, FAO Economic and Budget Outlook reports, and Public Accounts of Ontario.
Accessible version
| Per cent difference from actual | FAO | Ontario Government | |
|---|---|---|---|
| Average Absolute Variance | 6.1 | 5.0 | |
| Annual Variances | 2016-17 | -2.2 | -1.6 |
| 2017-18 | -1.3 | -0.4 | |
| 2018-19 | -1.4 | -0.8 | |
| 2019-20 | -2.4 | -1.2 | |
| 2020-21 | -19.3 | -8.4 | |
| 2021-22 | -13.8 | -16.8 | |
| 2022-23 | -5.4 | -6.8 | |
| 2023-24 | -2.4 | -0.8 | |
| 2024-25 | -6.7 | -7.9 | |
- From 2016-17 to 2019-20, the FAO’s average absolute revenue forecast variance was 1.8 per cent, while the government’s was 1.0 per cent. This was mostly driven by the FAO underestimating tax revenues to a greater extent than the government in this period.
- Total revenue variances increased significantly during the pandemic. From 2020-21 to 2021-22, the FAO’s average absolute variance was 16.6 per cent, while the government’s was 12.6 per cent. The FAO underestimated tax and federal government transfer revenue to a larger extent in this period compared to the government.
- As economic conditions began to normalize in the post-pandemic period (2022-23 to 2024-25), the FAO’s average absolute variance was 4.8 per cent, while the government’s was 5.2 per cent. In this period, the FAO’s tax revenue underestimates were less than the government’s, which were partially offset by larger underestimates for federal transfer revenue and income from government business enterprises.
By major revenue component, historical average absolute variances were greatest for corporations tax, income from government business enterprises, other non-tax revenue and personal income tax for both the FAO and the government.
| FAO | Ontario Government | |
|---|---|---|
| Personal Income Tax | 7.6 | 7.1% |
| Sales Tax | 4.5% | 5.3% |
| Corporations Tax | 22.3% | 19.3% |
| All other taxes | 2.1% | 2.4% |
| Total Taxation Revenue | 6.5% | 5.9% |
| Transfers from Government of Canada | 5.4% | 3.0% |
| Income from Government Business Enterprises | 13.2% | 13.3% |
| Other Non-Tax Revenue | 8.3% | 9.6% |
| Total Revenue | 6.1% | 5.0% |
Spending
Figure 6.6 compares the FAO’s and the government’s one-year average absolute variances for total spending. From 2016-17 to 2024-25, the FAO had a 2.8 per cent average absolute variance and the government had an average absolute variance of 1.5 per cent. By fiscal year, the government’s projection was closer to the actual results in the Public Accounts in five of nine years. The FAO overestimated spending twice in nine years (2018-19 and 2021-22), while the government overestimated spending four times in nine years (2016-17, 2018-19, 2020-21 and 2021-22).
Figure 6.6 One-year historical spending variances, 2016-17 to 2024-25
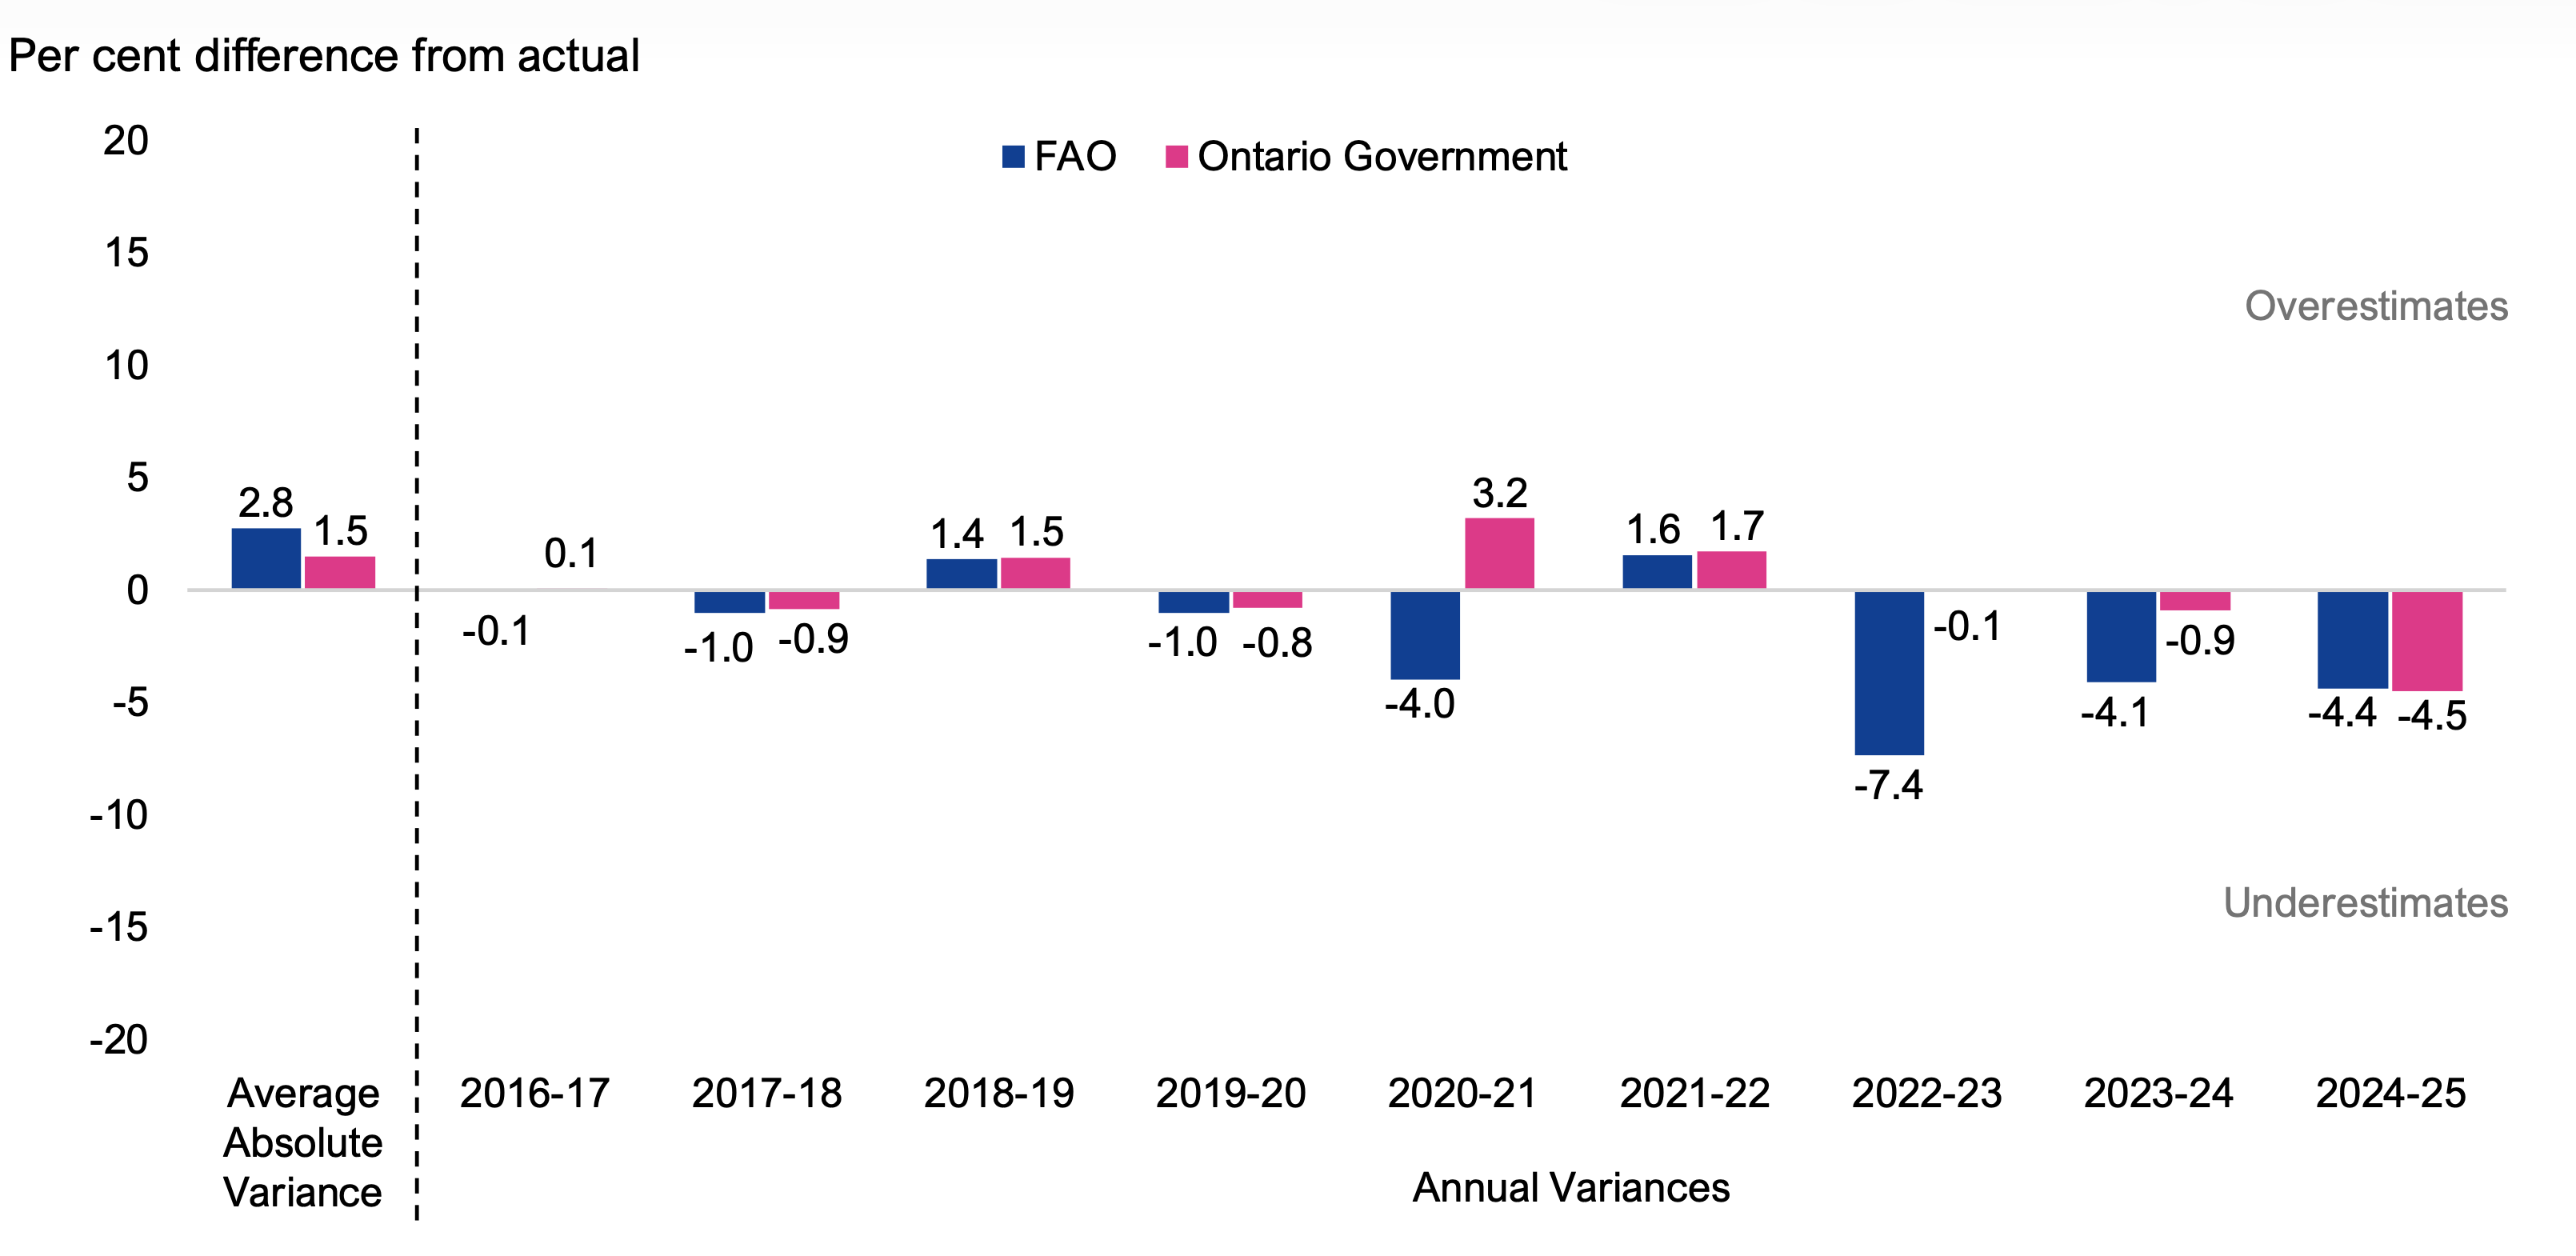
Note: Projections have been adjusted to reflect accounting changes introduced in the Public Accounts of Ontario.
Source: Ontario Budgets, FAO Economic and Budget Outlook reports, and Public Accounts of Ontario.
Accessible version
| Per cent difference from actual | FAO | Ontario Government | |
|---|---|---|---|
| Average Absolute Variance | 2.8 | 1.5 | |
| Annual Variances | 2016-17 | -0.1 | 0.1 |
| 2017-18 | -1.0 | -0.9 | |
| 2018-19 | 1.4 | 1.5 | |
| 2019-20 | -1.0 | -0.8 | |
| 2020-21 | -4.0 | 3.2 | |
| 2021-22 | 1.6 | 1.7 | |
| 2022-23 | -7.4 | -0.1 | |
| 2023-24 | -4.1 | -0.9 | |
| 2024-25 | -4.4 | -4.5 | |
- From 2016-17 to 2019-20, the FAO’s average absolute spending variance was 0.9 per cent, while the government’s was 0.8 per cent.
- Average absolute spending variances for both the FAO and the government increased during the pandemic, with the FAO averaging 2.8 per cent from 2020-21 to 2021-22, while the government averaged 2.4 per cent. This was driven by higher variances in the health and ‘other programs’ sectors where the pandemic most affected spending.
- Following the pandemic, between 2022-23 and 2024-25, the FAO’s average absolute spending variance increased to 5.3 per cent while the government’s declined to 1.8 per cent. Over this period, the FAO underestimated compensation spending in the health, education, postsecondary education and justice sectors to a larger extent than the government. Additionally, the government’s Contingency Fund offset some of the impact of the higher compensation spending and unanticipated one-time expenses discussed in Chapter 4.
| Sector | FAO | Ontario Government |
|---|---|---|
| Health | 2.6% | 2.6% |
| Education | 2.5% | 2.3% |
| Postsecondary Education | 4.2% | 4.7% |
| Children, Community and Social Services | 2.2% | 2.4% |
| Justice | 6.1% | 6.4% |
| Other Programs | 7.4% | 4.0% |
| Interest and Other Debt Servicing Charges | 4.7% | 7.2% |
| Total Spending | 2.8% | 1.5% |
- By sector, the FAO’s average absolute variance was lower than the government’s in the health; postsecondary education; children, community and social services; justice; and interest and other debt servicing charges sectors.
- The government’s average absolute variance was lower than the FAO’s in the education and ‘other programs’ sectors.
- The government’s total spending variance was lower than the FAO’s despite the FAO having lower variance in most sectors. This is because the government both over- and underestimated spending in different sectors, which had offsetting effects on the total spending variance, whereas the FAO had a much greater tendency to underestimate spending.
Three-Year Outlooks
This section compares the FAO’s three-year historical forecast accuracy against the government’s for the budget balance. FAO projections from Economic and Budget Outlook reports and government projections from Ontario Budgets are compared to actual results published in the Public Accounts of Ontario.
Figure 6.7 shows the budget balance variances for the third year of the outlook from the FAO’s EBOs and the government’s Ontario Budgets. Overall, the FAO’s average absolute variance for the budget balance was $5.5 billion, while the government’s was $9.7 billion. In every year, from 2018-19 to 2024-25, the FAO’s outlook for the budget balance was more accurate than the government’s. The FAO underestimated the budget balance three times in seven years (2021-22, 2022-23 and 2023-24), while the government underestimated the budget balance four times in seven years (2021-22, 2022-23, 2023-24 and 2024-25).
Figure 6.7 Three-year historical budget balance variances, 2018-19 to 2024-25
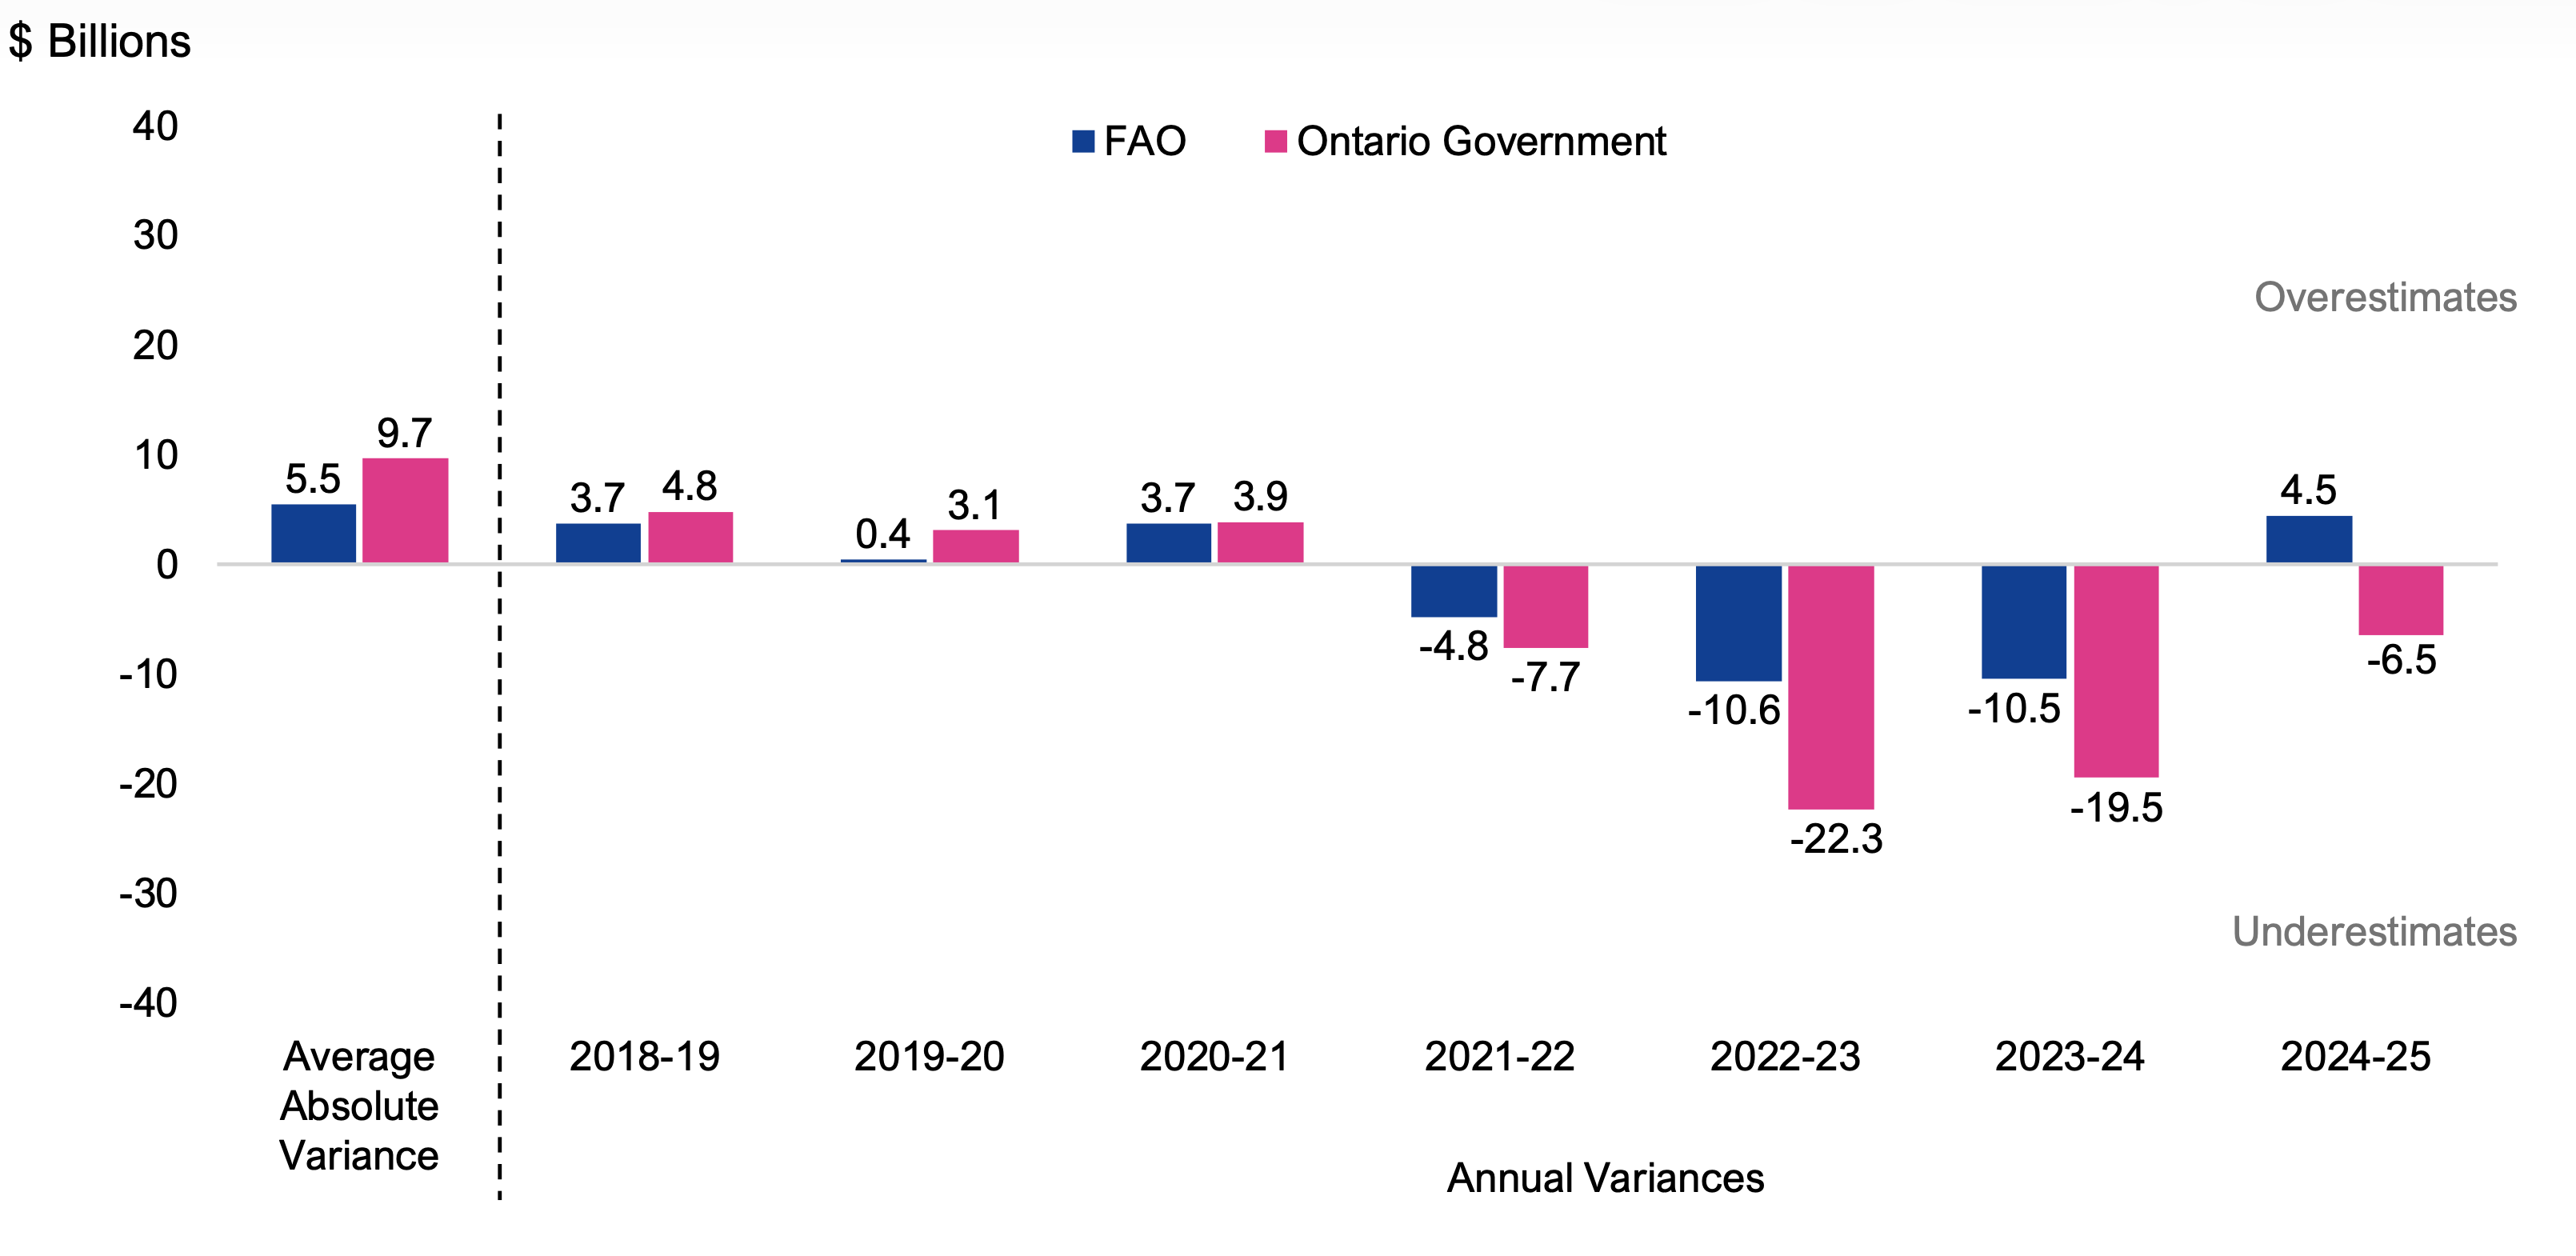
Note: Projections have been adjusted to reflect accounting changes introduced in the Public Accounts of Ontario.
Source: Ontario Budgets, FAO Economic and Budget Outlook reports, and Public Accounts of Ontario.
Accessible version
| $ Billions | FAO | Ontario Government | |
|---|---|---|---|
| Average Absolute Variance | 5.5 | 9.7 | |
| Annual Variances | 2018-19 | 3.7 | 4.8 |
| 2019-20 | 0.4 | 3.1 | |
| 2020-21 | 3.7 | 3.9 | |
| 2021-22 | -4.8 | -7.7 | |
| 2022-23 | -10.6 | -22.3 | |
| 2023-24 | -10.5 | -19.5 | |
| 2024-25 | 4.5 | -6.5 |
Both the government and FAO three-year deficit projections for 2018-19 to 2020-21 (produced in 2016, 2017 and 2018) overestimated budget balances in each year, with the government overestimating by a wider average margin ($3.9 billion) compared to the FAO ($2.6 billion). From 2021-22 to 2023-24, both the government and the FAO underestimated budget balances, with the government underestimating by an average margin of $16.5 billion compared to the FAO at $8.6 billion. However, for 2024-25 (forecast produced in 2022), the FAO overestimated the budget balance by $4.5 billion while the government underestimated the budget balance by $6.5 billion.
Footnotes
[1] FAO, Economic and Budget Outlook, Spring 2024.
[2] The FAO’s revenue projection of $210.9 billion is a restatement that includes the original $208.4 billion projected by the FAO in the Spring 2024 EBO as well as a $2.6 billion increase for interest and investment income to reflect a subsequent accounting adjustment. See note 17 on page 90 in the 2024-25 Ontario Public Accounts.
[3] The FAO’s spending projection of $217.4 billion is a restatement that includes the original $214.8 billion projected by the FAO in the Spring 2024 EBO as well as a $2.6 billion reversal of interest and investment income to reflect a subsequent accounting adjustment. See note 17 on page 90 in the 2024-25 Ontario Public Accounts.
[4] On September 12, 2024, Ontario physicians were awarded a 9.95 per cent fee increase retroactive to April 1, 2024.
[5] In January 2024, the Government of Canada announced a cap on international student permits for 2024 and 2025, which had an annual target for approvals that was 35 per cent lower than the amount issued in 2023.
[6] Ontario Newsroom, Ontario Signs Historic Agreement with Largest First Nations Police Service in Canada, December 10, 2024.
[7] For example, the forecast variance for 2024-25 is calculated as the difference between the FAO’s forecast for 2024-25, published on May 15, 2024 in the Spring 2024 Economic and Budget Outlook, and the actual results released in the 2024-25 Public Accounts of Ontario, published on September 26, 2025.
[8] From 2022-23 to 2024-25, the FAO underestimated other non-tax revenue by an average of 17.6 per cent. The largest contributor was underestimates of revenue from fees, donations and other revenues from broader public sector organizations.
[9] For example, in 2022-23, the Province recorded $6.3 billion in one-time payments for land and land-related claims with Indigenous communities, while in 2024-25, the Province recorded $2.9 billion in spending for the Ontario Taxpayer Rebate.
[10] The FAO identified the risk that spending on compensation could be higher than planned in its 2022 report Ontario Public Sector Employment and Compensation.
[11] For example, the forecast variance for 2018-19 is calculated as the difference between the FAO’s forecast for 2018-19 in the Spring 2016 Economic and Budget Outlook, released in May 2016, and the actual results in the 2018-19 Public Accounts of Ontario, released in September 2019.
[12] Section 6(3), paragraph 3, Fiscal Sustainability, Transparency and Accountability Act, 2019.
[13] The FAO and government revenue and spending projections have been adjusted to reflect an accounting change to interest and investment income introduced in the 2024-25 Public Accounts of Ontario. See note 17 on page 90 in the 2024-25 Ontario Public Accounts.