


1. Summary
- This report reviews Government of Ontario (the Province) spending trends from 1990-91 to 2023-24. The report also reviews trends in federal government transfers to Ontario and analyzes federal transfers as a share of provincial spending.
Ontario Government Spending Trends
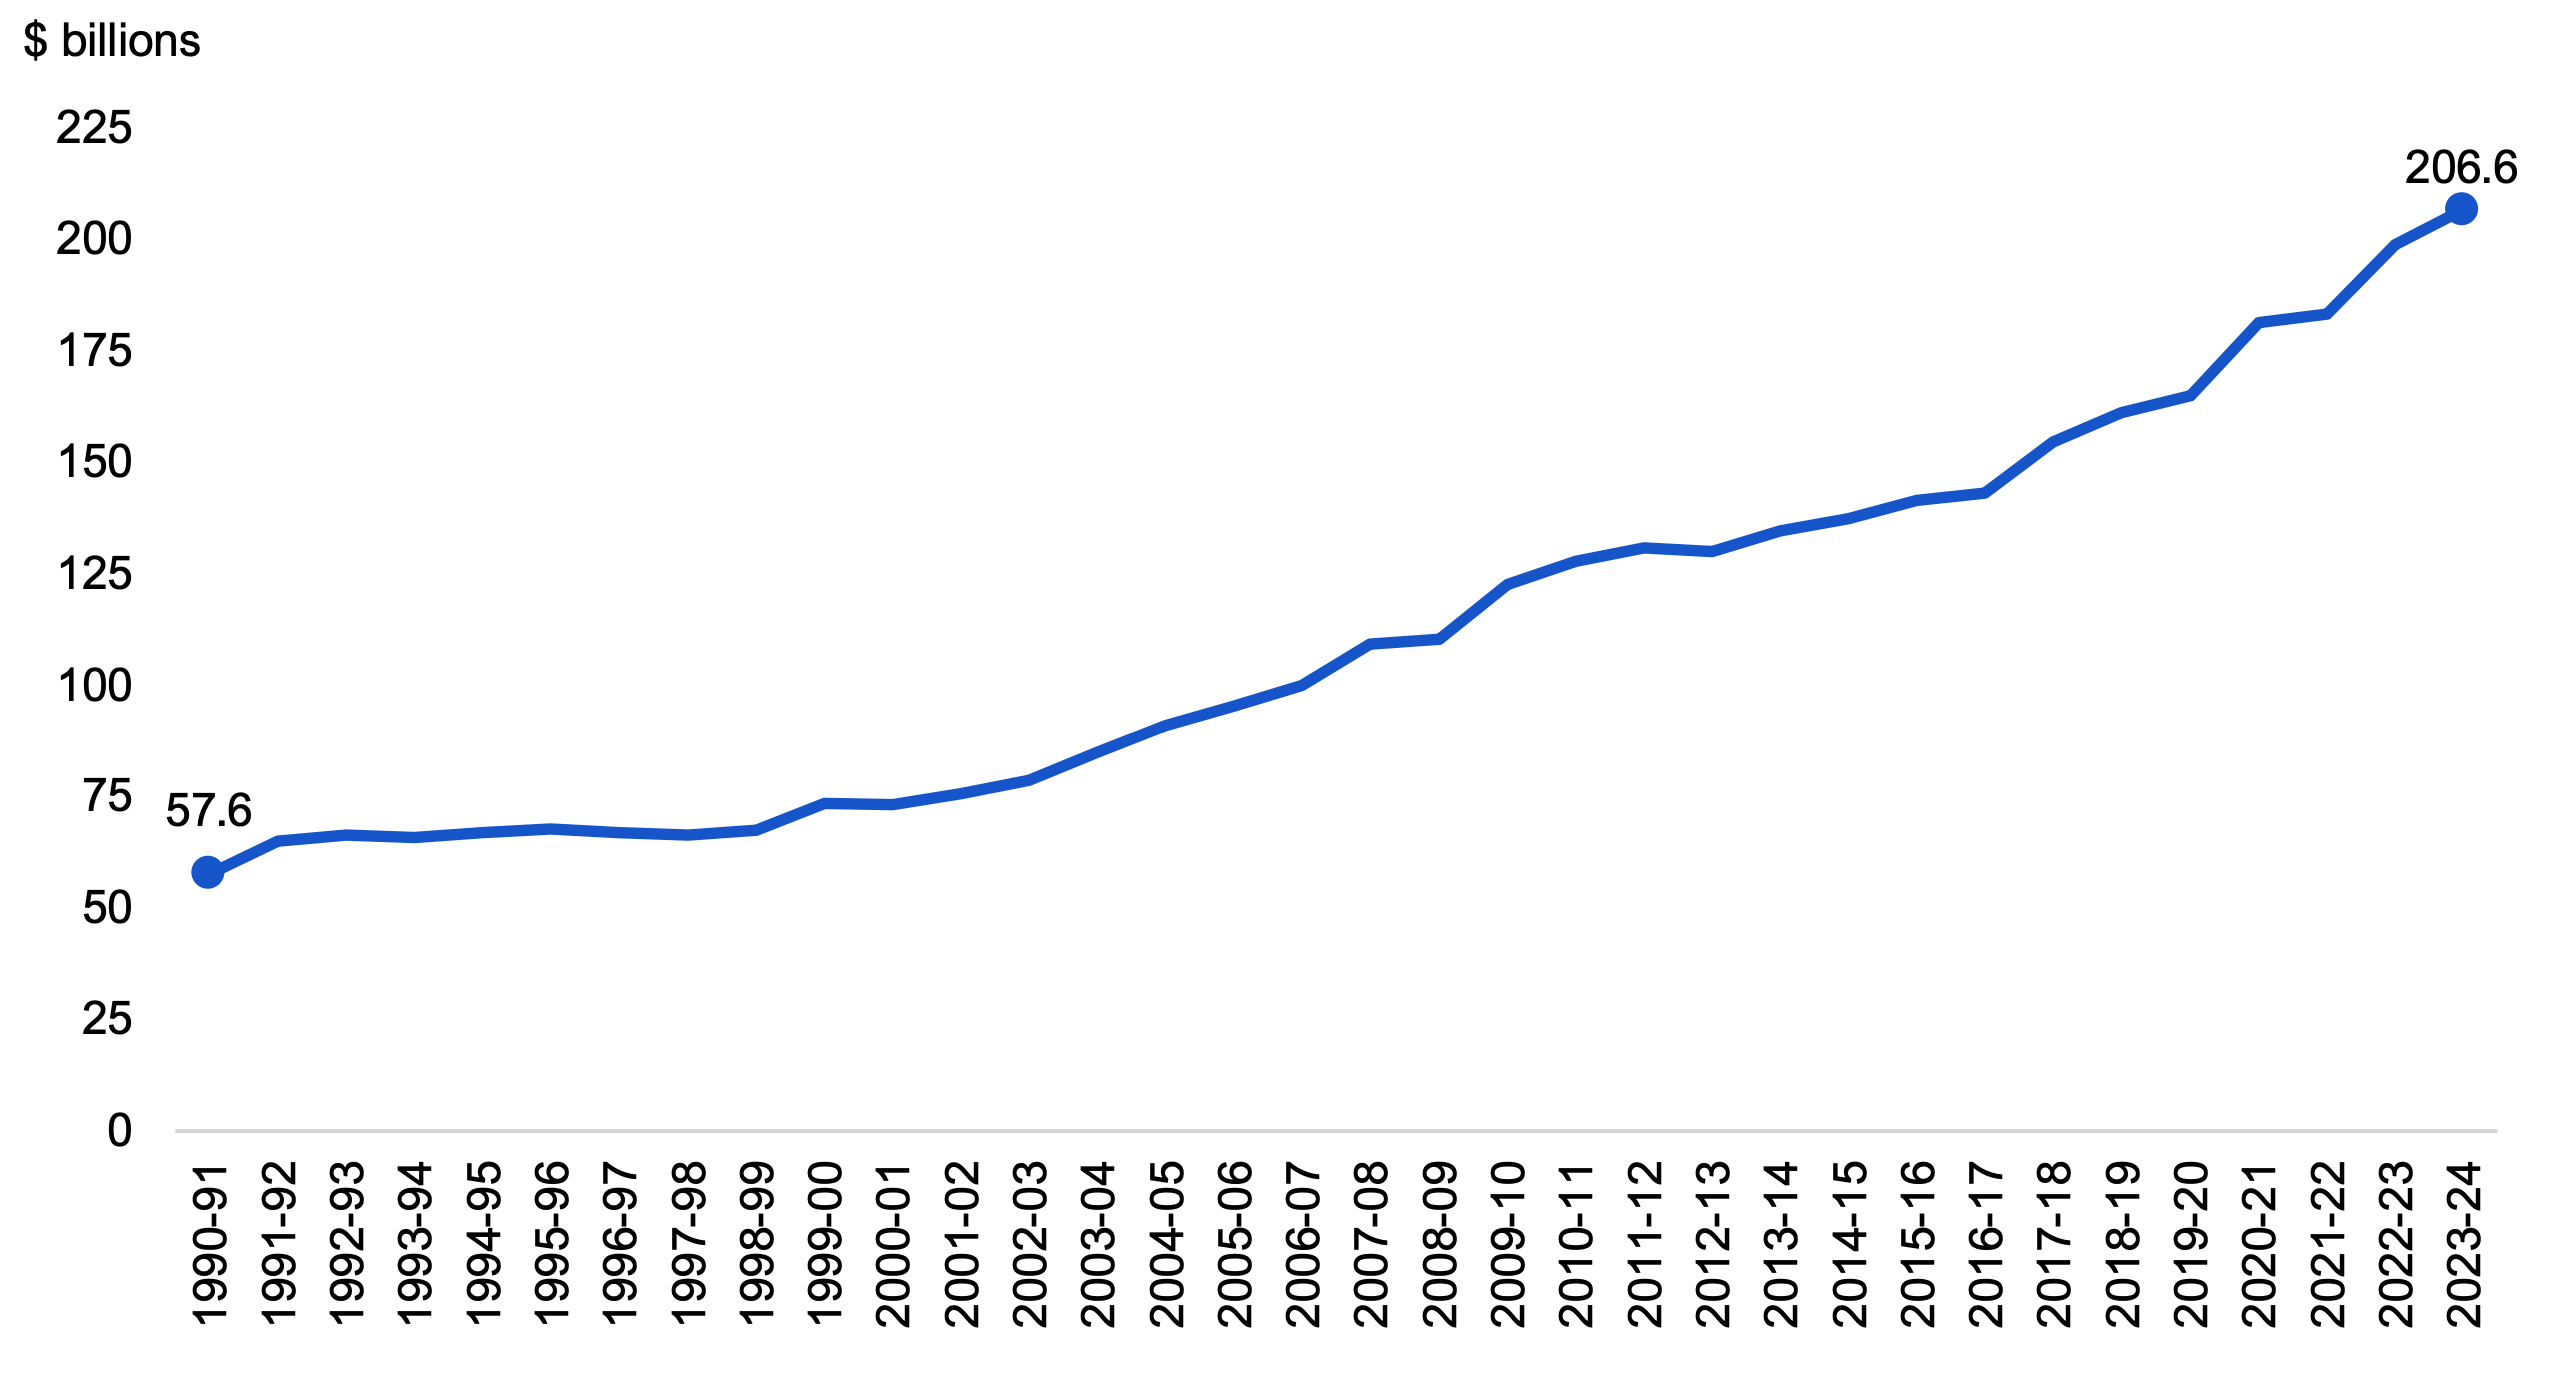
- In 2023-24, the Province spent a total of $206.6 billion, up from $57.6 billion in 1990-91, representing an average annual increase of 3.9 per cent, in nominal (not adjusted for inflation) dollars.
- Total nominal spending increased every year over this 34-year period, with the exception of five years: 1993-94, 1996-97, 1997-98, 2000-01 and 2012-13.
- Nominal government spending can obscure the true impact of government spending on service levels over time as it does not account for changes in Ontario’s population and inflation. Inflation increases the cost of providing public goods and services, while population growth drives up the demand for public services. Therefore, this report also reviews government spending on inflation-adjusted (i.e., real) and per capita terms.
- Inflation and population growth have increased at a combined average annual rate of 3.4 per cent from 1990-91 to 2023-24.
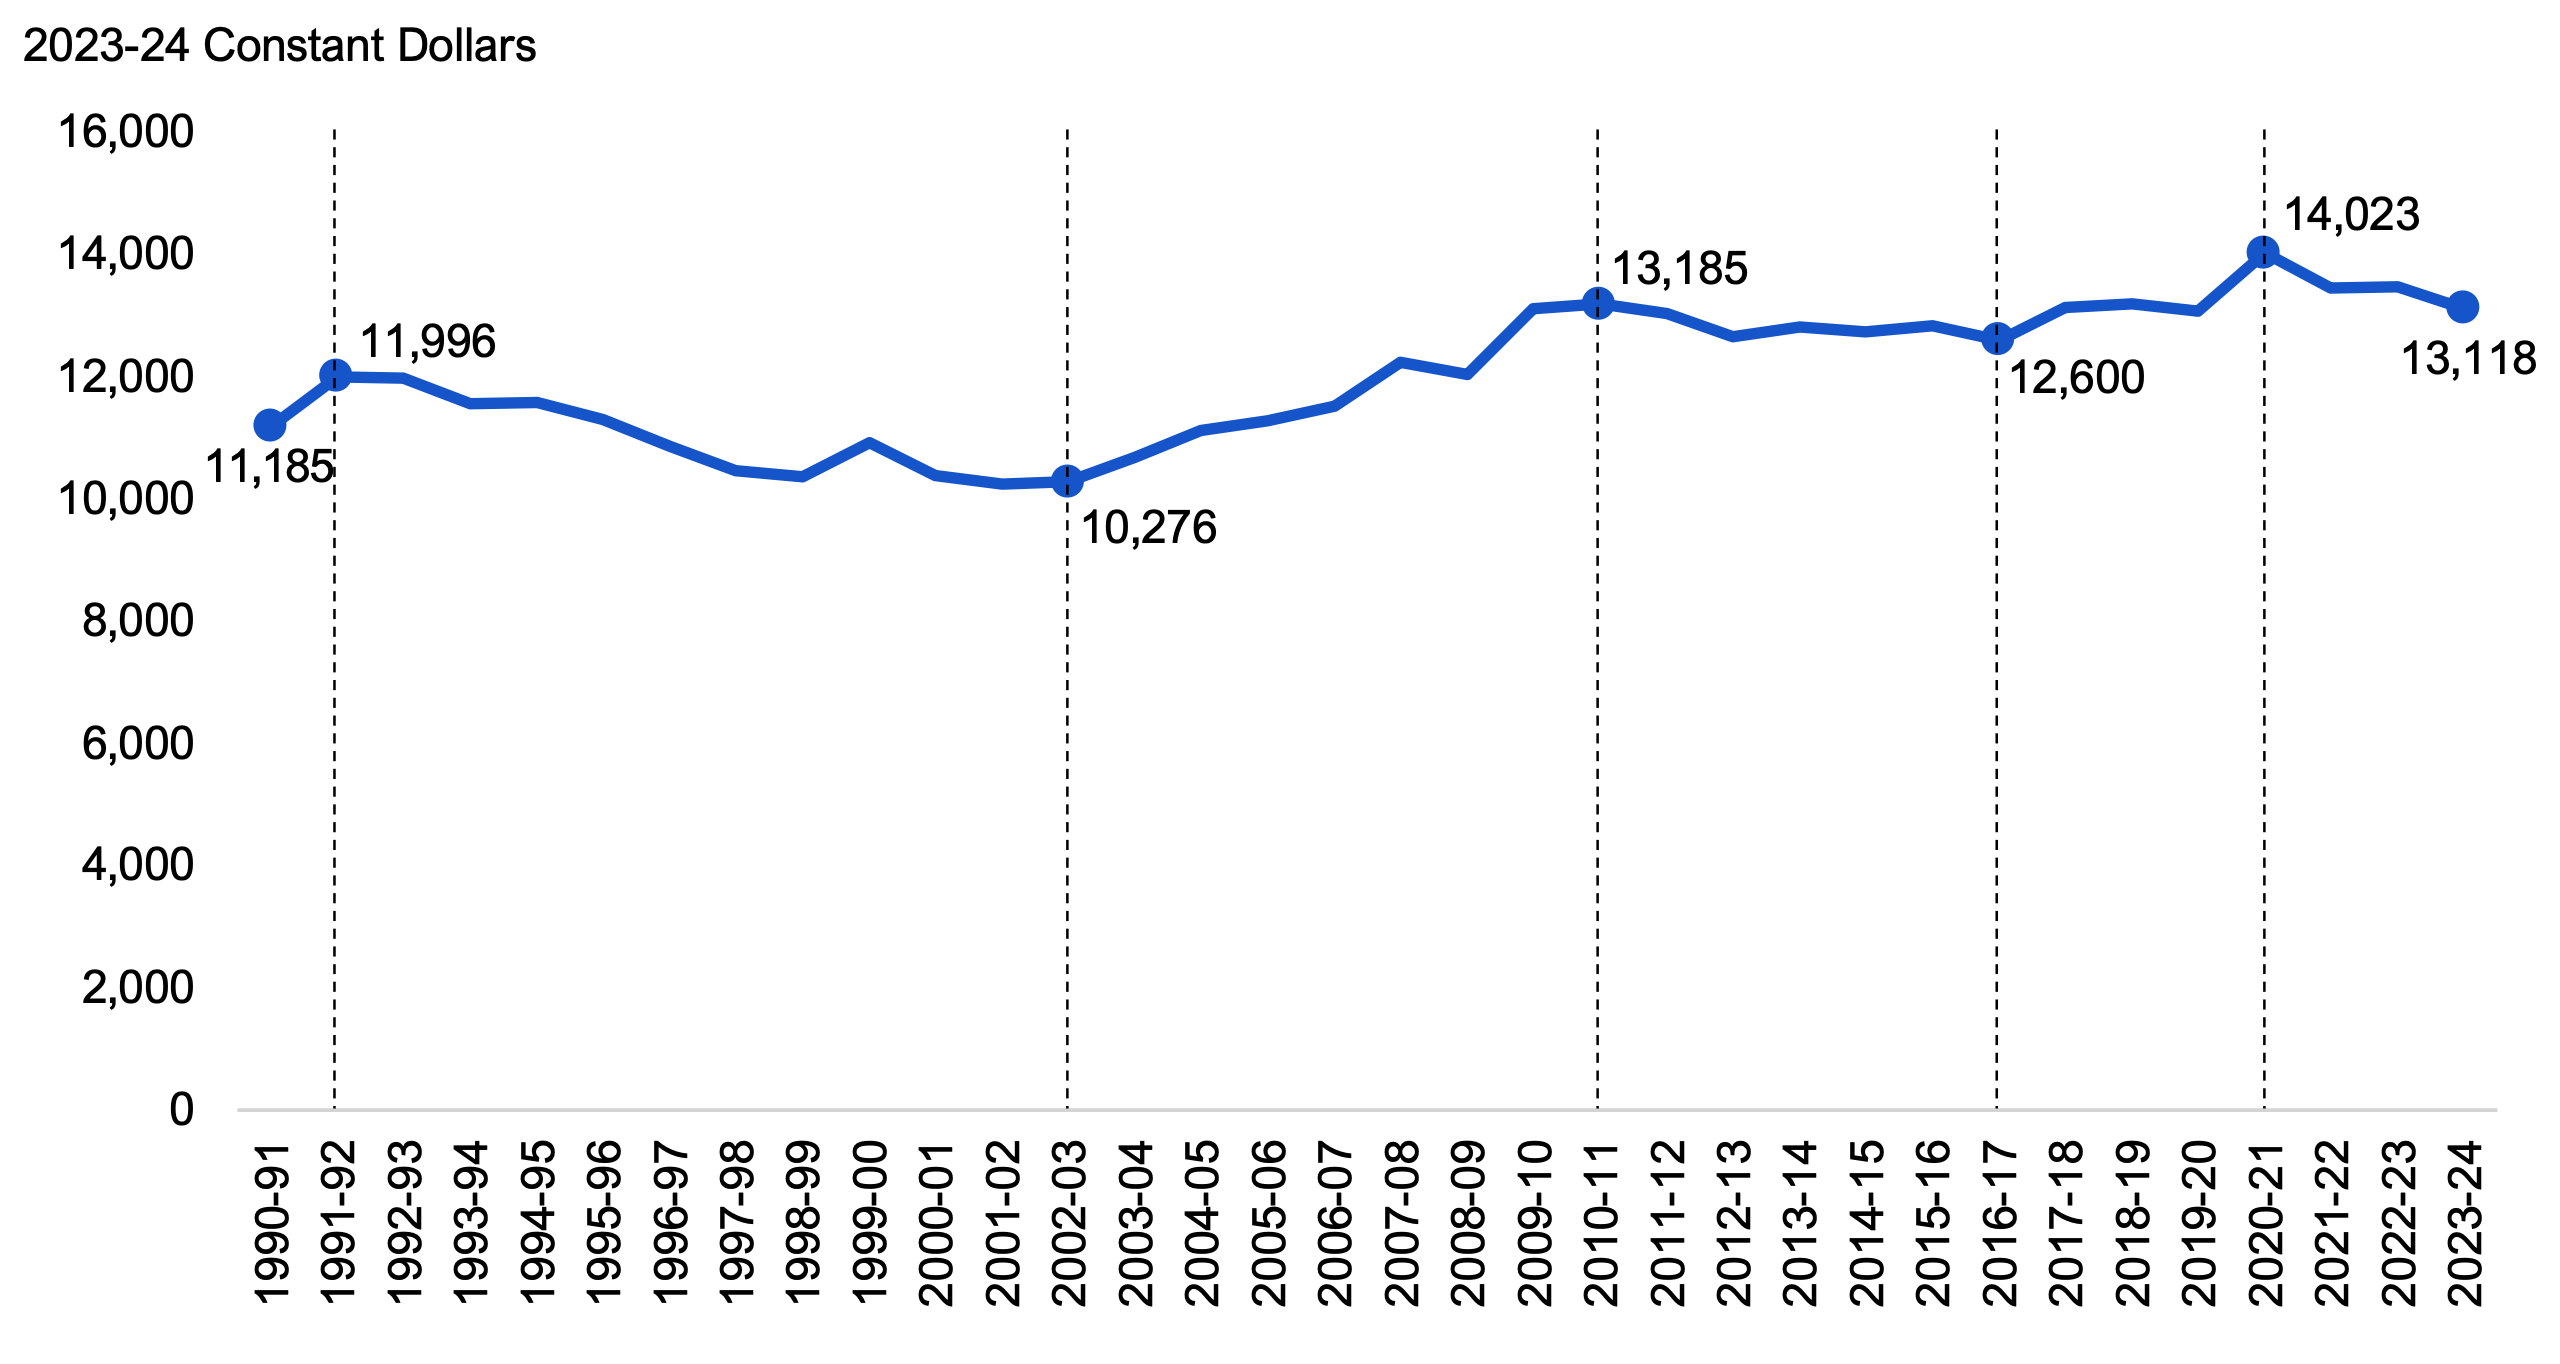
- Consequently, the Province’s real per capita spending has increased at an average annual rate of 0.5 per cent, from spending of $11,185 per person in 1990-91 to $13,118 per person in 2023-24.
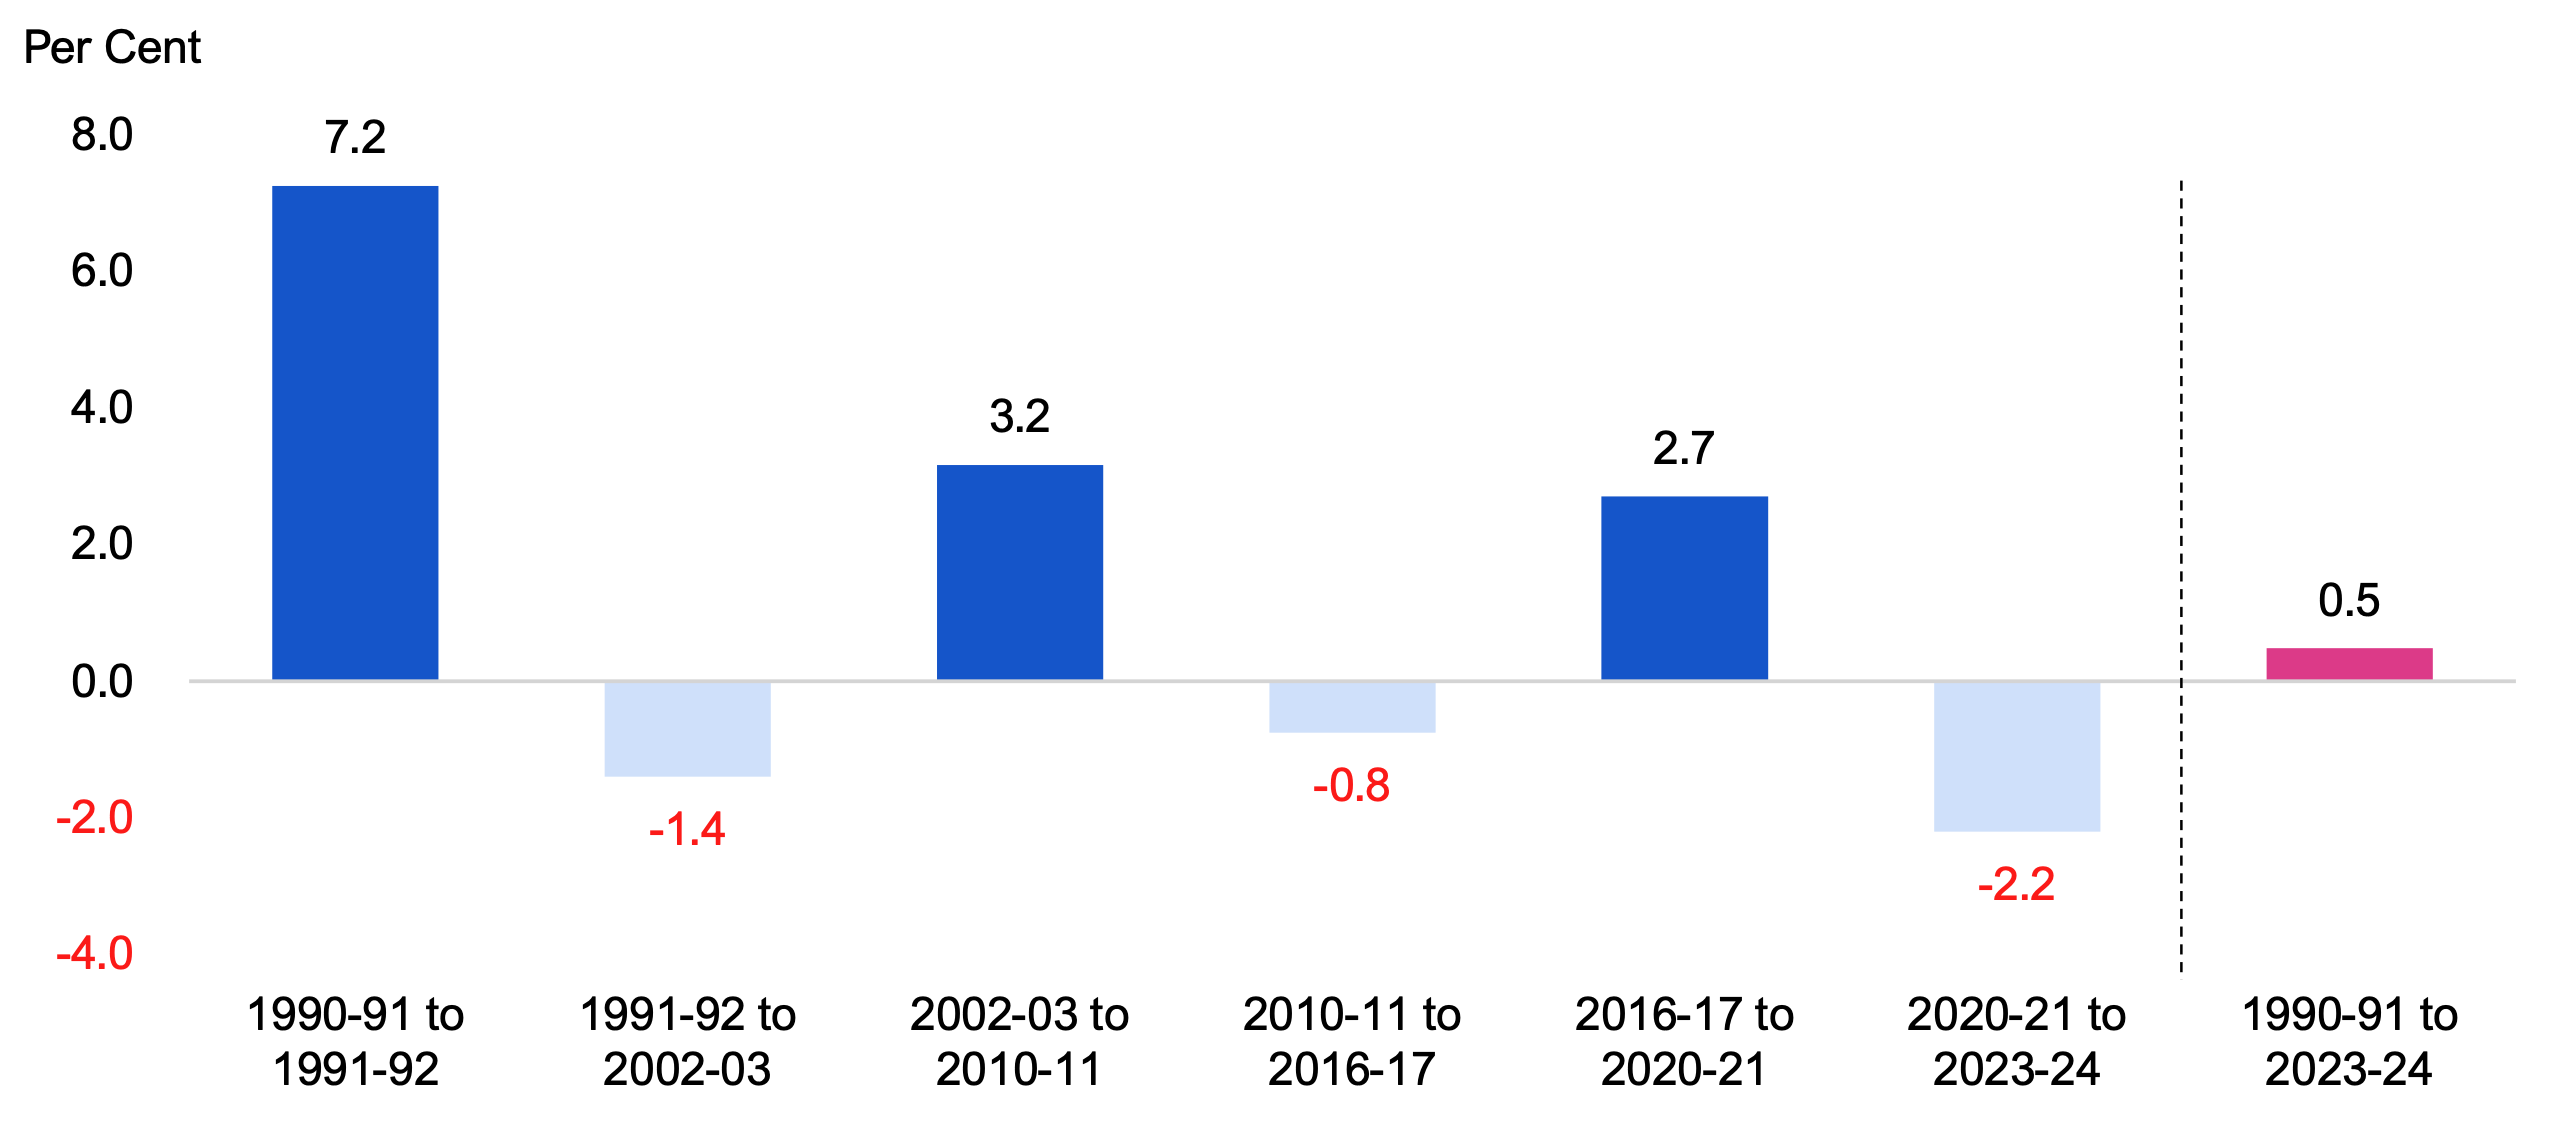
- Over the 34-year period, the FAO identified three periods of real per capita spending growth: one year from 1990-91 to 1991-92 (7.2 per cent growth); eight years from 2002-03 to 2010-11 (3.2 per cent average annual growth); and four years from 2016-17 to 2020-21 (2.7 per cent average annual growth).
- The FAO also identified three periods of real per capita spending declines: 11 years from 1991-92 to 2002-03 (-1.4 per cent average annual decline); six years from 2010-11 to 2016-17 (-0.8 per cent average annual decline); and three years from 2020-21 to 2023-24 (-2.2 per cent average annual decline).
- Another approach to analyzing government spending trends is to compare nominal government spending to nominal gross domestic product (GDP). As nominal GDP is the broadest measure of the tax base, this comparison provides insight into the size of government spending relative to the economy’s ability to pay.
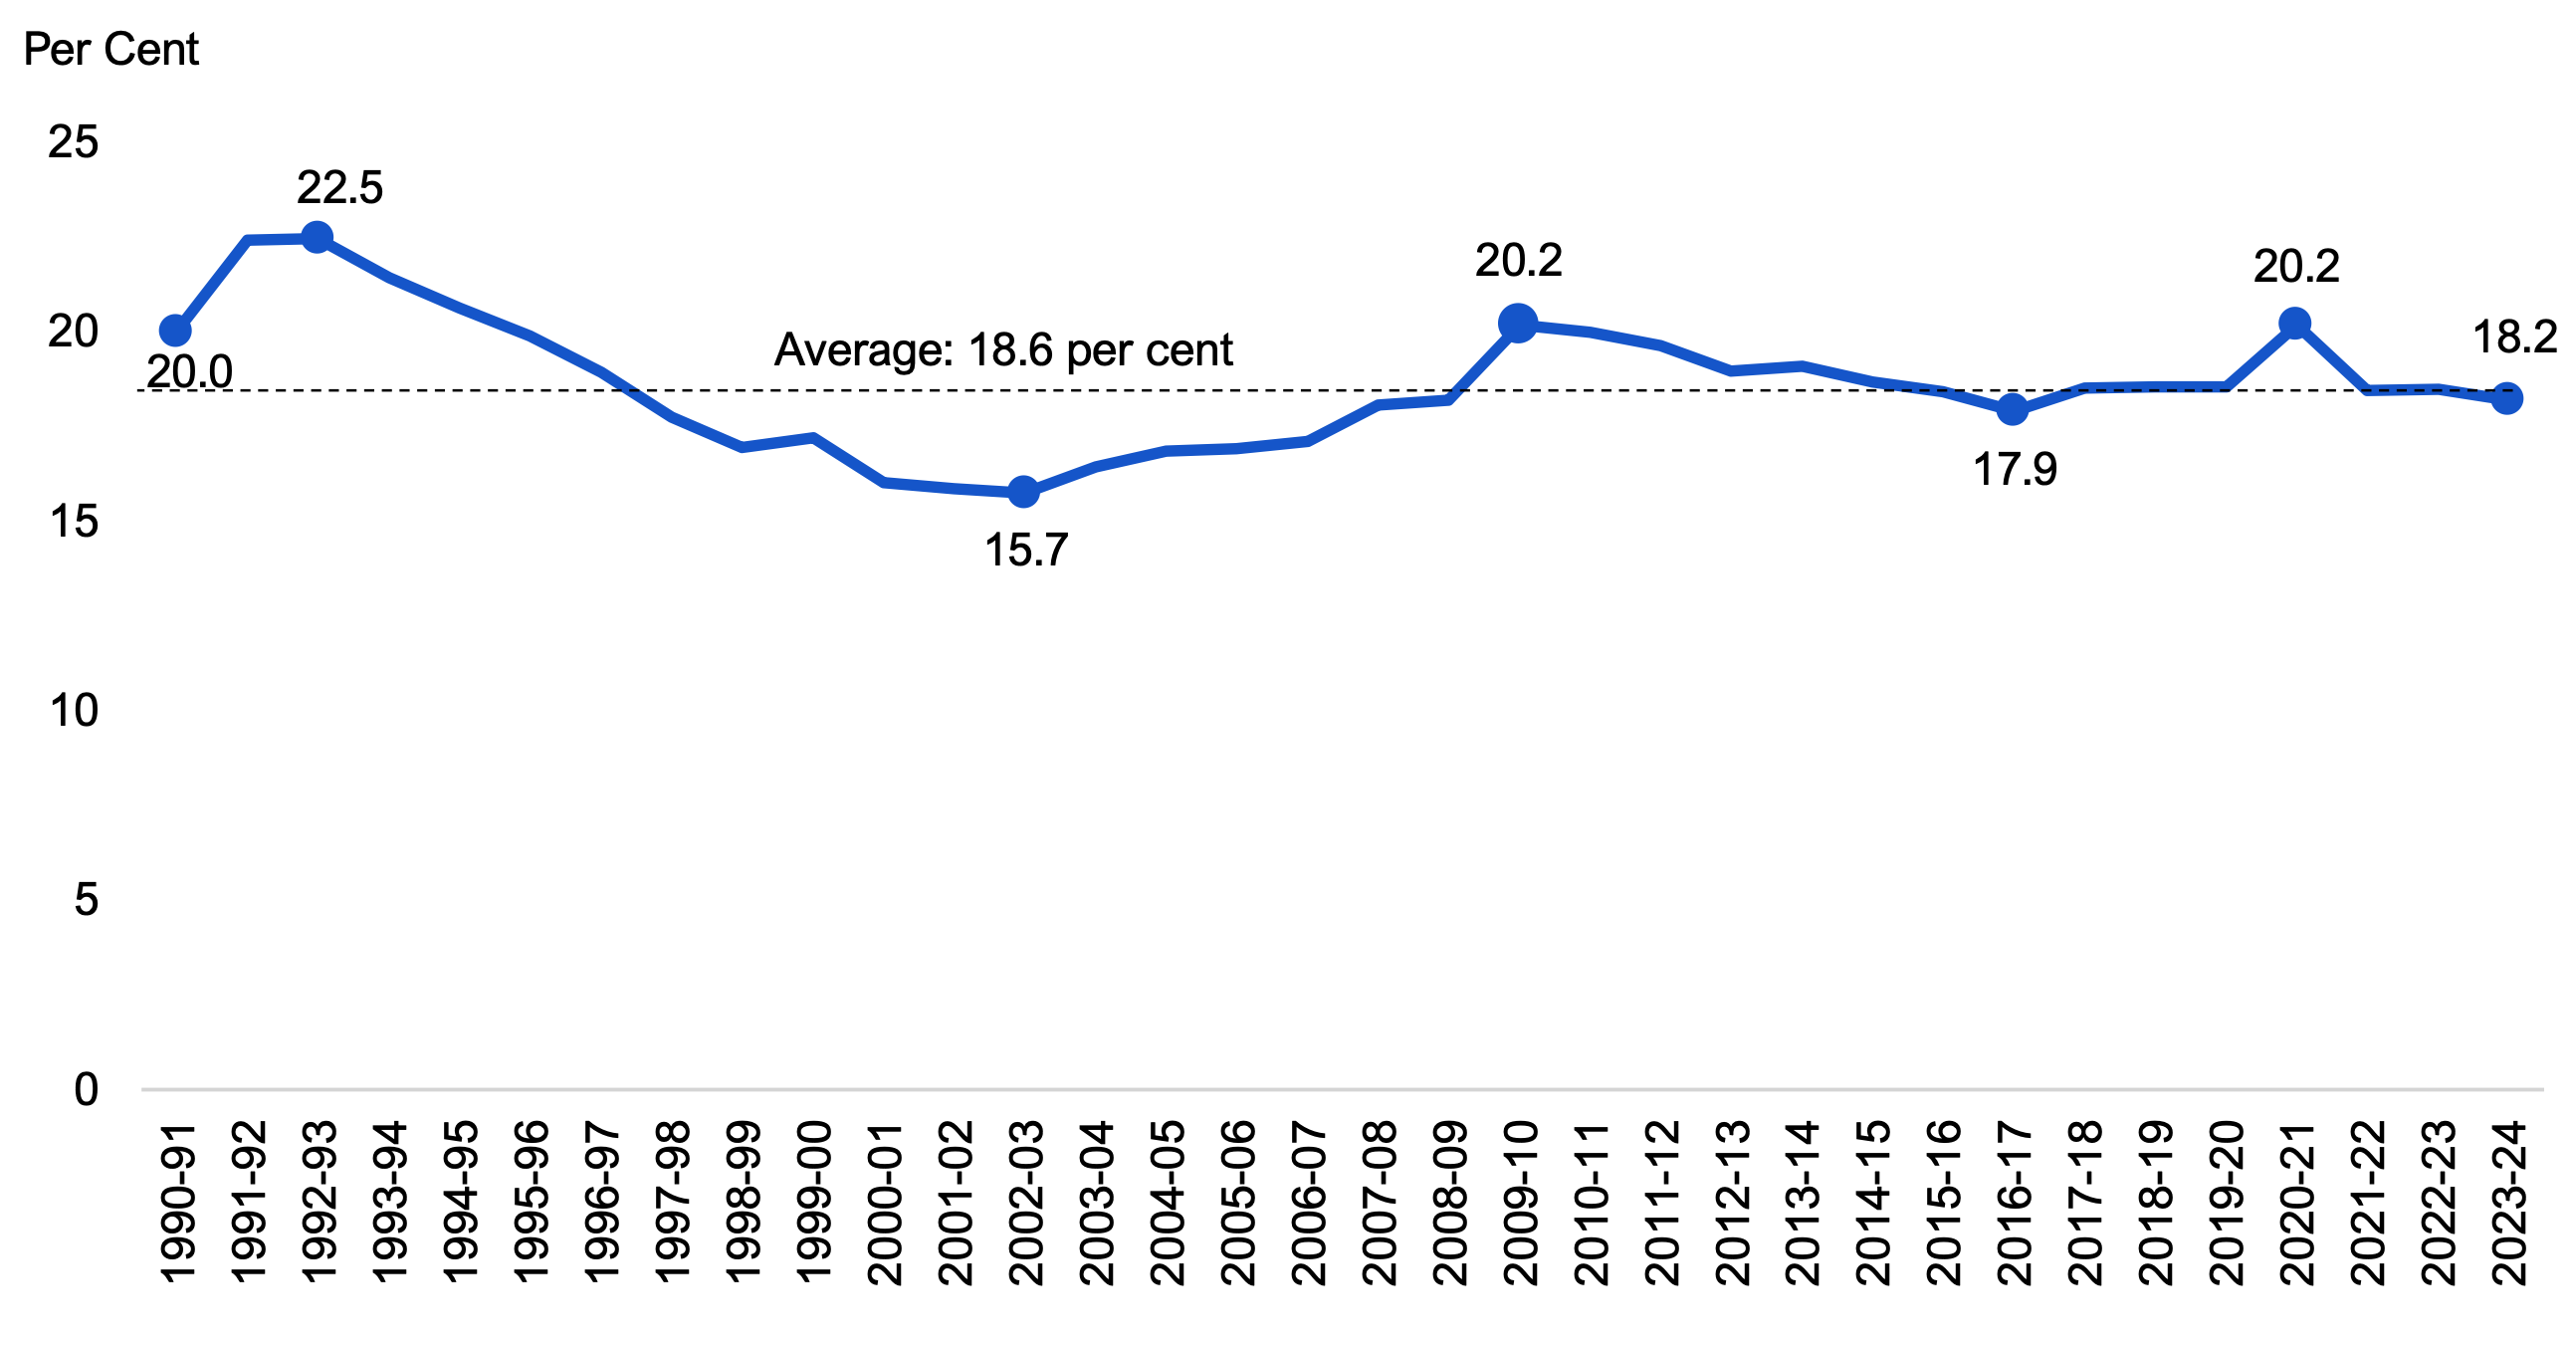
- Spending as a share of Ontario’s GDP averaged 18.6 per cent over the 34-year period and was 18.2 per cent in 2023-24.
- Spending as a share of GDP peaked during the 1990s recession (22.5 per cent in 1992-93), the 2008-2009 global financial crisis (20.2 per cent in 2009-10) and the COVID-19 pandemic (20.2 per cent in 2020-21).
- Spending as a share of GDP reached a low of 15.7 per cent in 2002-03, reflecting a period of spending restraint combined with a pickup in economic growth.
Spending Trends by Sector
- The Province categorizes its spending into seven sectors: health; education; postsecondary education; children, community and social services; justice; ‘other programs’; and interest on debt. While total nominal spending growth averaged 3.9 per cent per year over the 34-year period, spending growth has varied by sector.
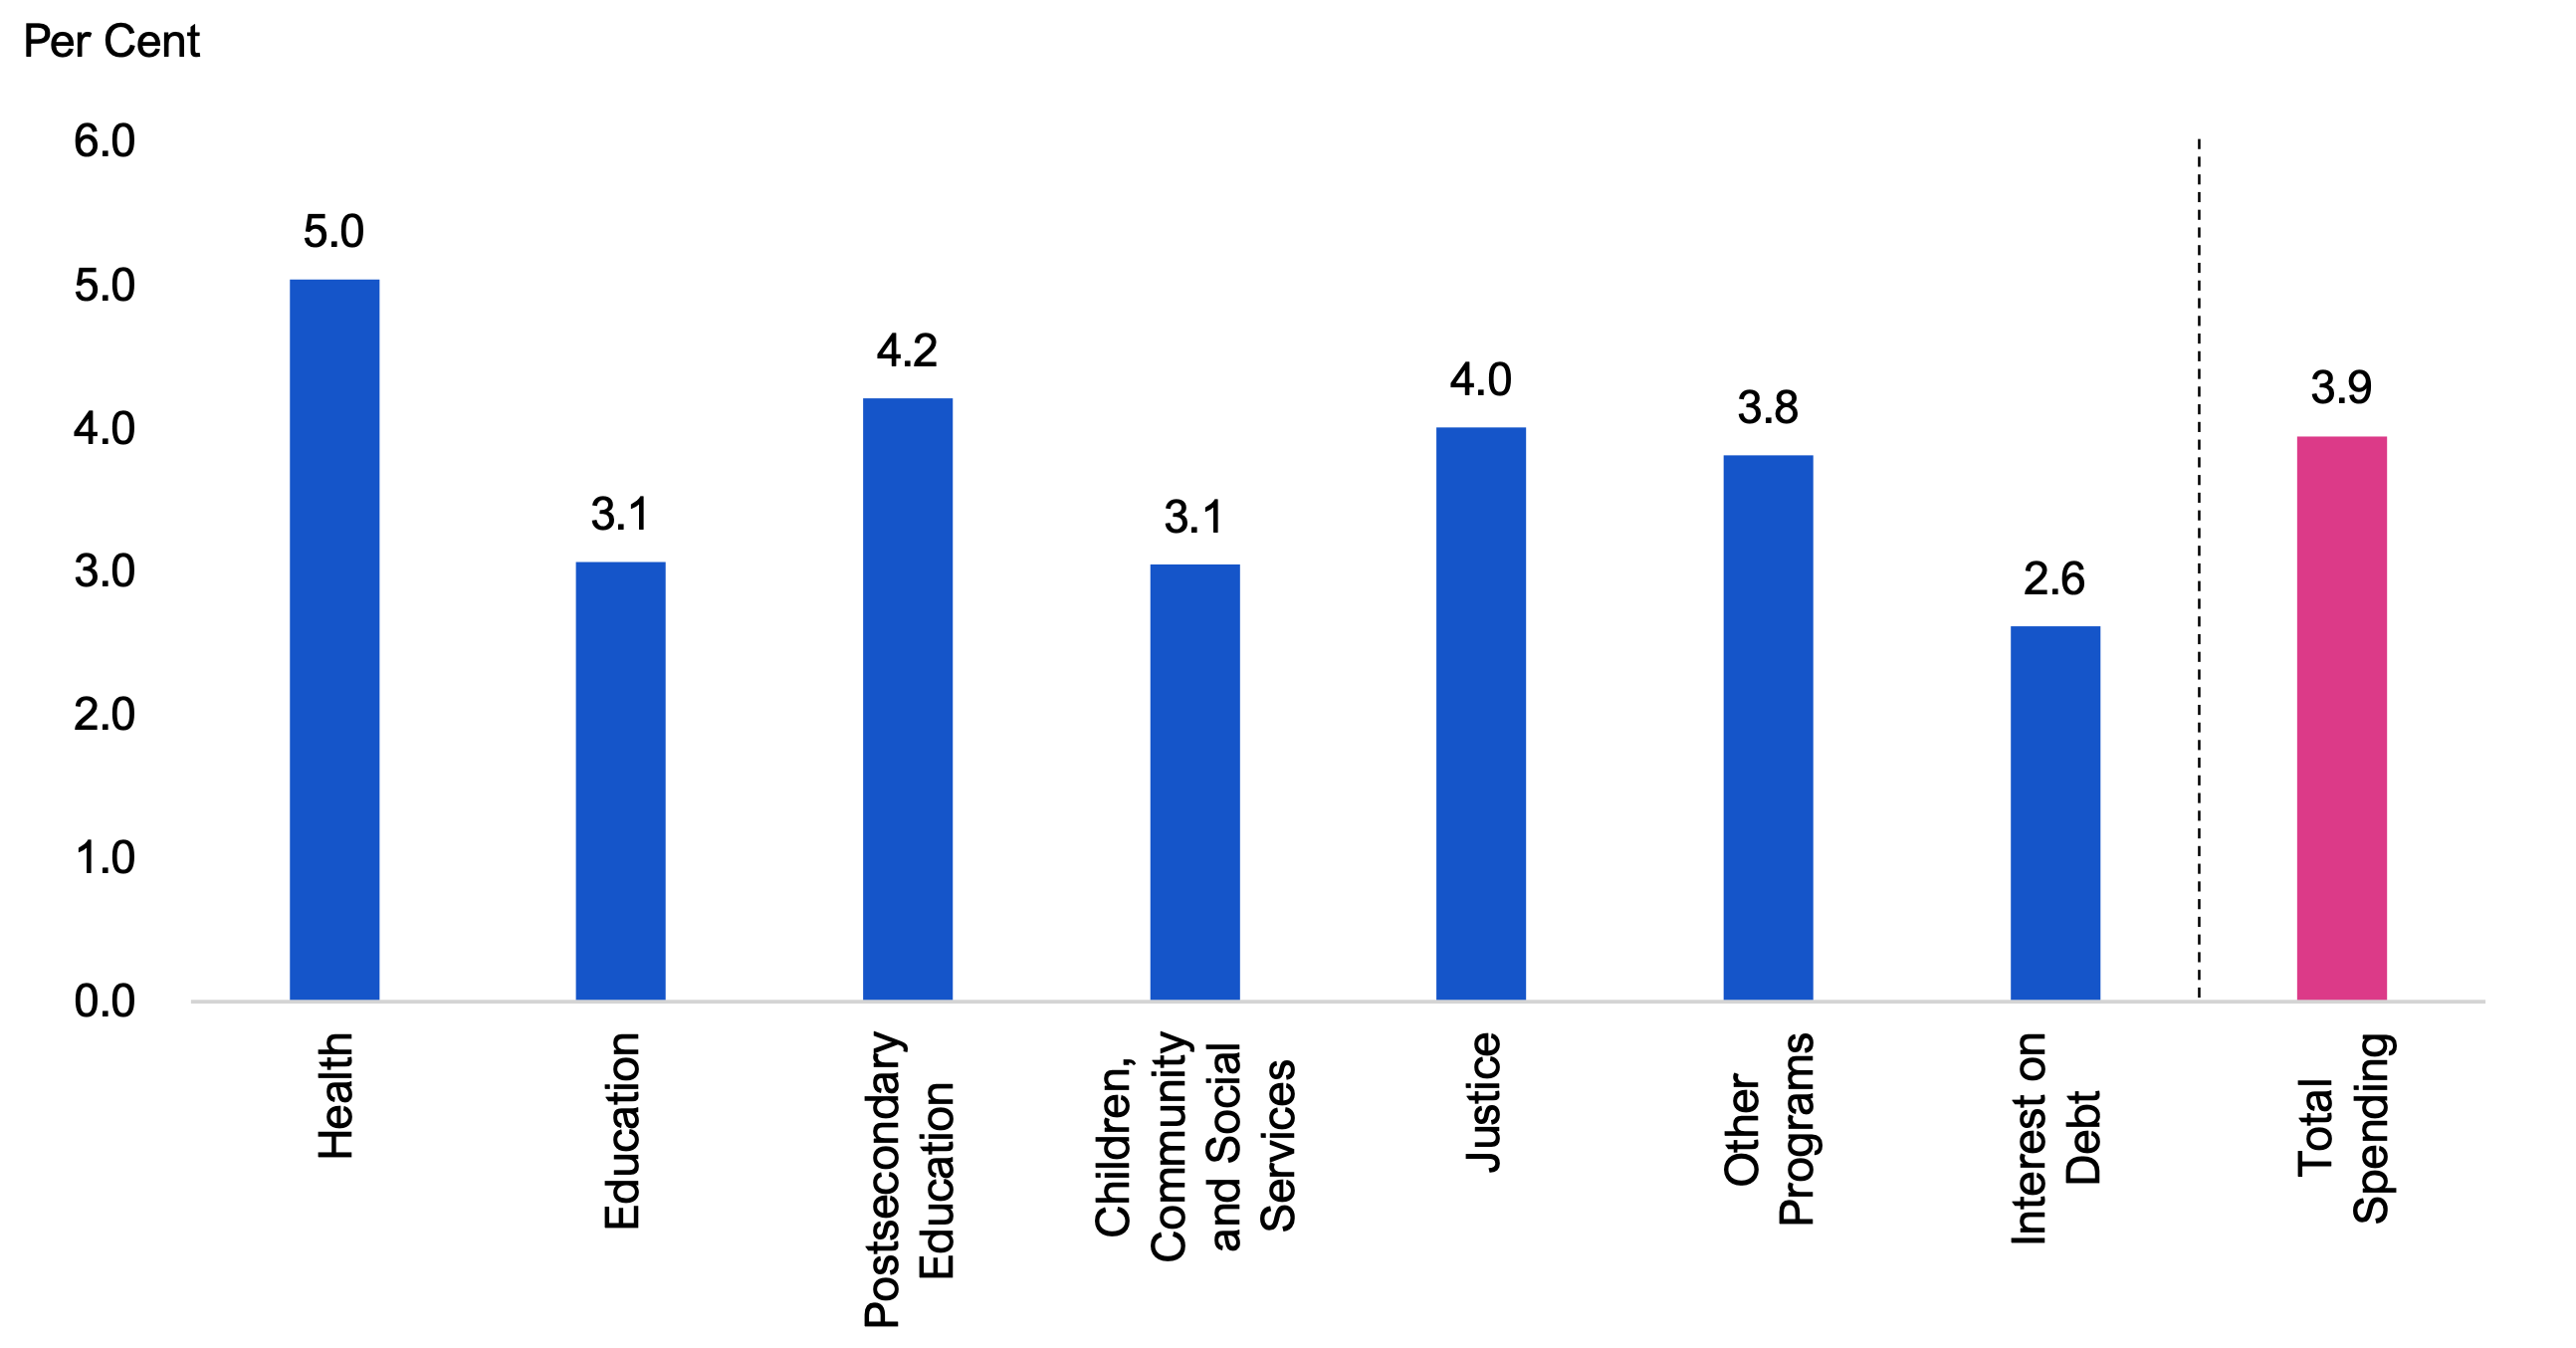
- Overall, three sectors, health (5.0 per cent), postsecondary education (4.2 per cent) and justice (4.0 per cent) experienced above average annual growth over the 34-year period, while four sectors, ‘other programs’ (3.8 per cent), children, community and social services (3.1 per cent), education (3.1 per cent) and interest on debt (2.6 per cent) experienced below average annual growth.
- The different spending growth rates have led to changes in each sector’s spending as a share of total spending:
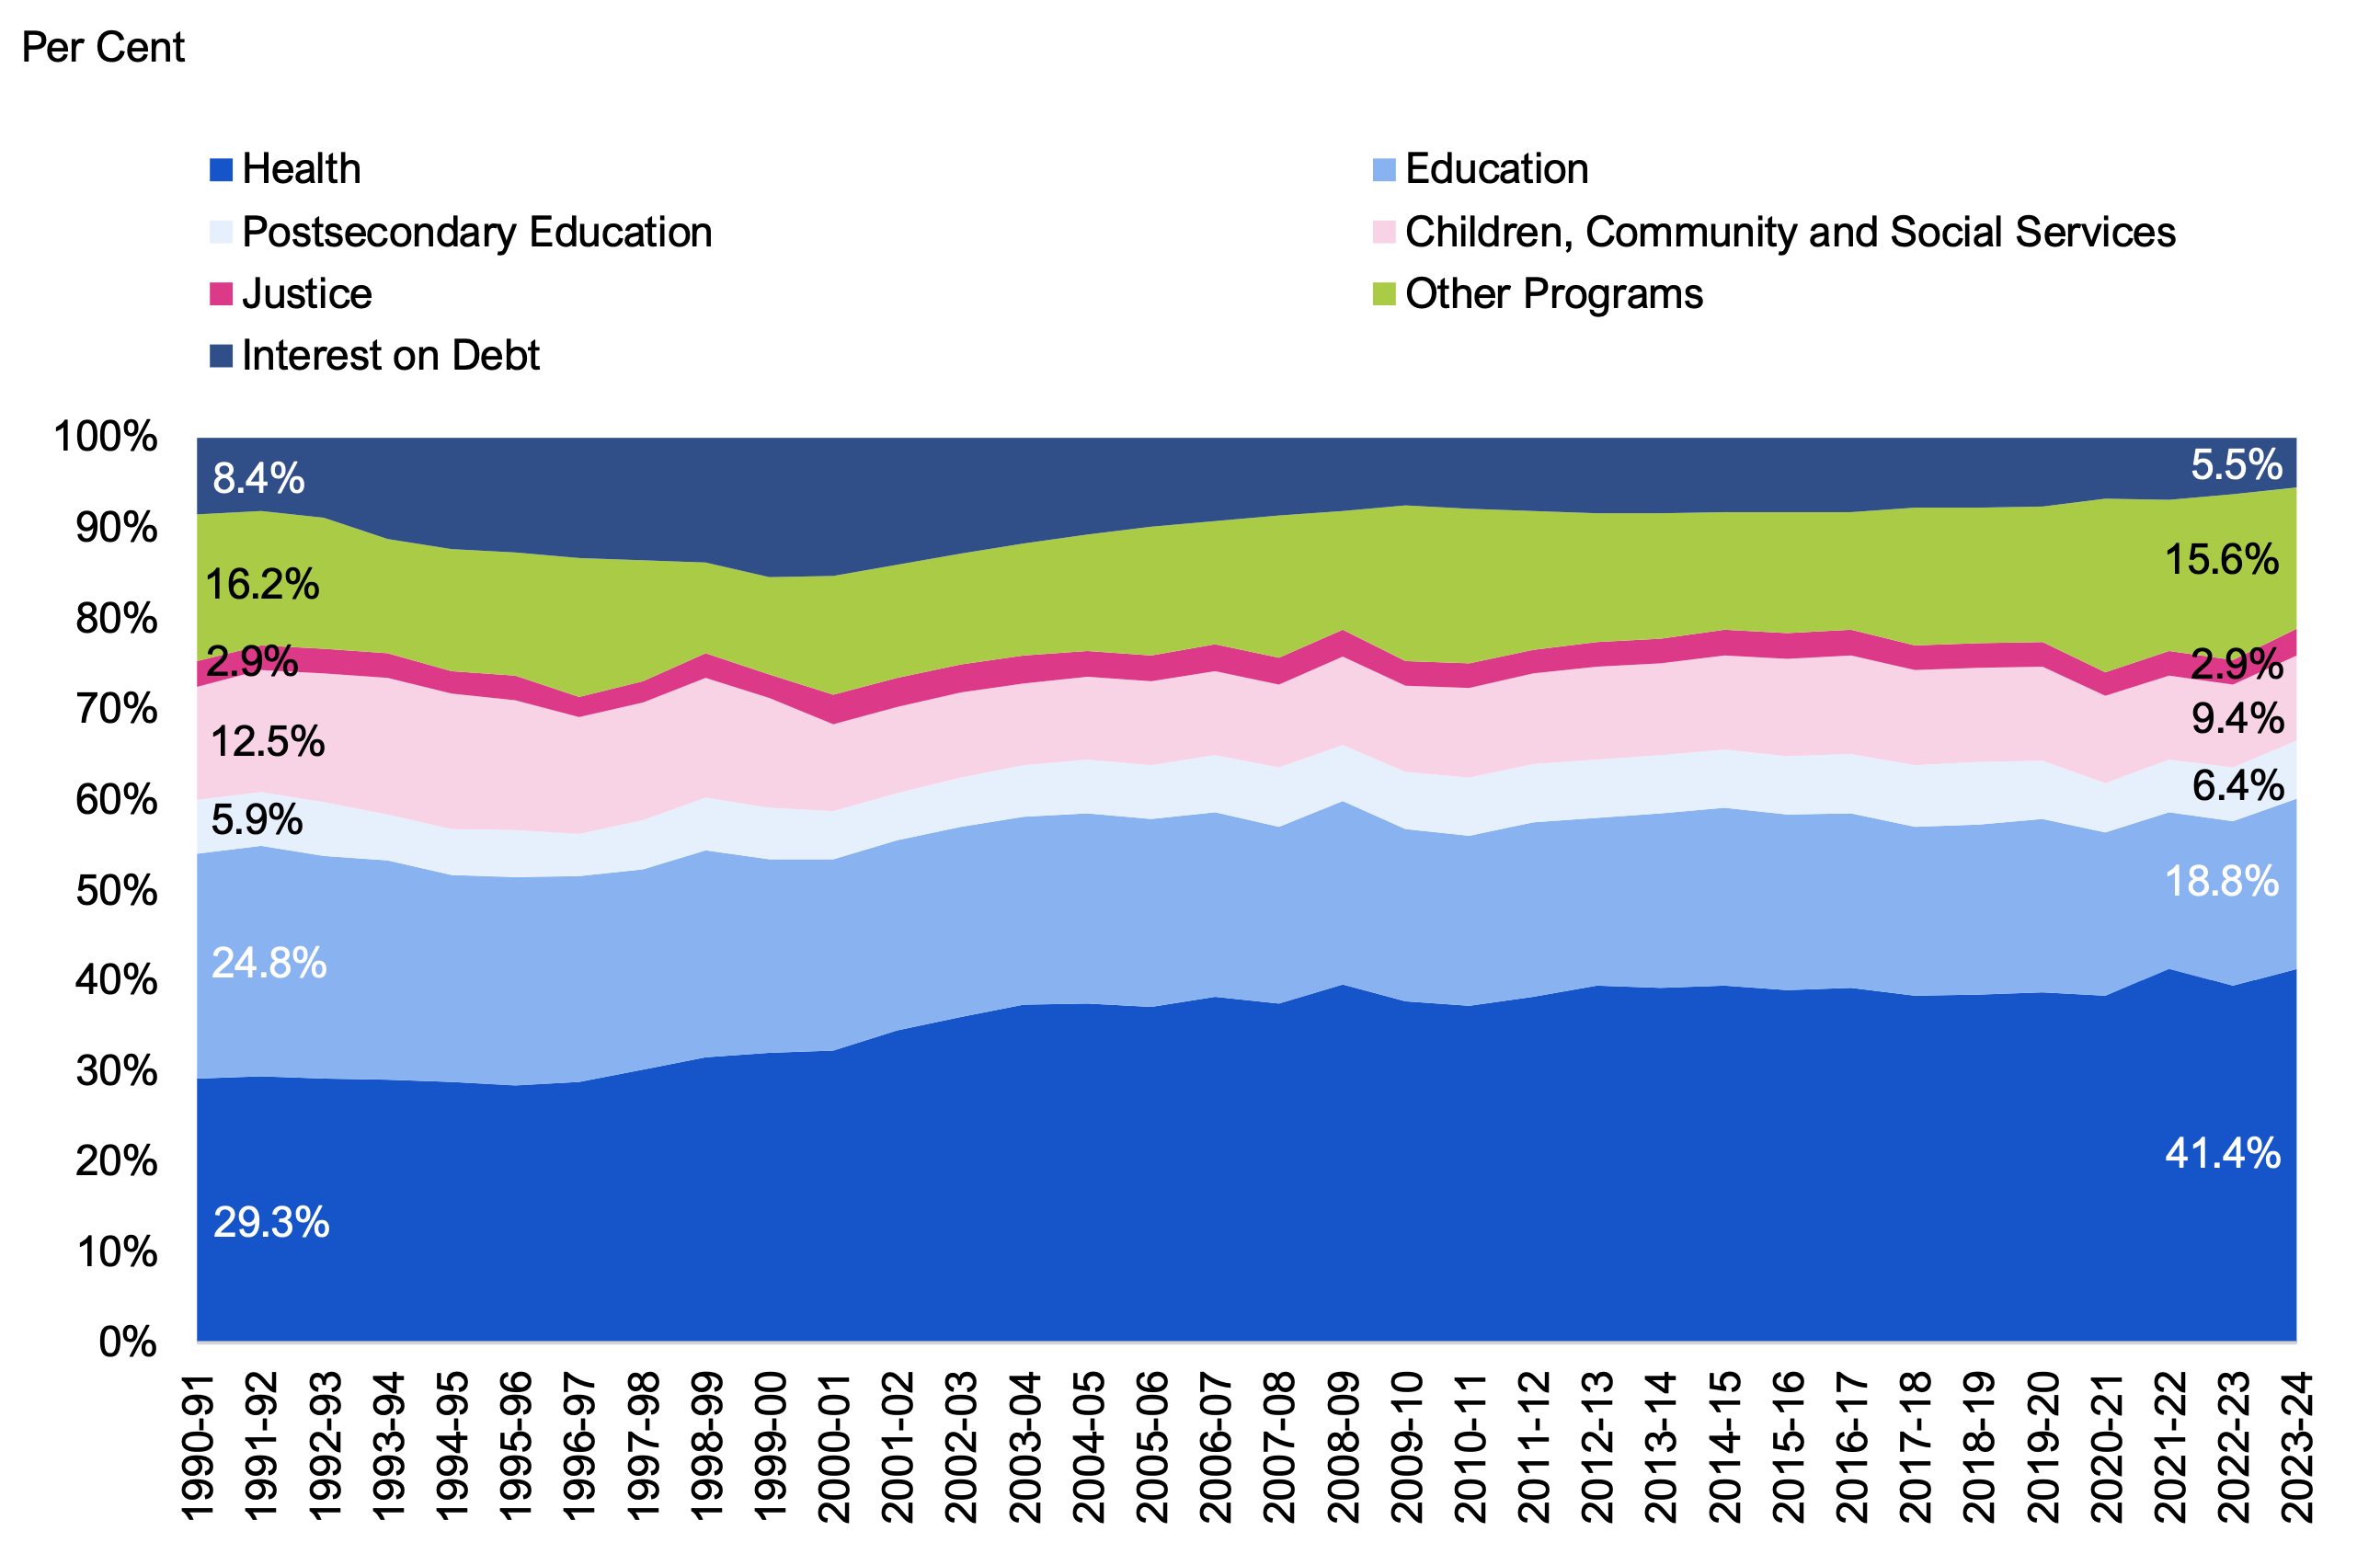
- The health sector has been the largest spending sector throughout the 34-year period, while its share of total spending has steadily increased, from 29.3 per cent in 1990-91 to 41.4 per cent in 2023-24.
- The second largest spending sector over this period was education; however, education sector spending as a share of total spending has steadily declined, from 24.8 per cent in 1990-91 to 18.8 per cent in 2023-24.
- Spending on postsecondary education increased from 5.9 per cent of total spending in 1990-91 to 6.4 per cent in 2023-24.
- Children, community and social services spending decreased from 12.5 per cent of total spending in 1990-91 to 9.4 per cent in 2023-24.
- Justice sector spending as a share of total spending has remained relatively unchanged, at 2.9 per cent of total spending in both 1990-91 and 2023-24.
- ‘Other programs’ sector spending as a share of total spending has fluctuated over time, ranging between 10.0 per cent and 19.1 per cent of total spending. In 1990-91 ‘other programs’ spending was 16.2 per cent of total spending, while in 2023-24 it was 15.6 per cent of total spending.
- Interest on debt spending as a share of total spending increased from 8.4 per cent in 1990-91 to 15.4 per cent in 1999-00, and then steadily declined to 5.5 per cent of total spending in 2023-24.
- This report also reviews spending by sector adjusted for sector specific cost drivers to provide a better indication of the effect spending has on service levels over time. These cost drivers include inflation, population growth in the demographic served by the sector and, in the health sector, population aging.
- When adjusted for these cost drivers, from 1990-91 to 2023-24, four sectors experienced spending growth: health (0.9 per cent age-standardized real per capita average annual growth), education (0.7 per cent real per child/youth average annual growth), justice (0.5 per cent real per capita average annual growth) and ‘other programs’ (0.4 per cent real per capita average annual growth).
- Three sectors experienced spending declines: postsecondary education (-0.3 per cent real per student average annual decline), children, community and social services (-0.4 per cent real per capita average annual decline) and interest on debt (-0.8 per cent real per capita average annual decline).
- Chapters 5 through 11 review spending trends in the seven sectors in more detail, including trends in select service levels.
Trends in Federal Transfers to Ontario
- Transfers from the Government of Canada are an important source of provincial revenue that supports the Province in funding programs and services. Over the 34-year period, the majority of federal transfers to Ontario were provided under programs intended to help finance provincially run health care, social assistance and postsecondary education programs.
- The FAO estimates that transfers from the federal government grew at an average annual rate of 5.5 per cent, from $5.8 billion in 1990-91 to $34.3 billion in 2023-24, in nominal (not adjusted for inflation) dollars.
- In real per capita terms, federal transfers increased at an average annual rate of 2.0 per cent, from $1,124 per person in 1990-91 to $2,180 per person in 2023-24.
- Over the 34-year period, the FAO identified three periods of growth in real per capita federal transfers: four years from 1990-91 to 1994-95 (4.1 per cent average annual growth); 12 years from 1998-99 to 2010-11 (10.8 per cent average annual growth); and four years from 2019-20 to 2023-24 (2.0 per cent average annual growth).
- The FAO also identified two periods of declines in real per capita federal transfers: four years from 1994-95 to 1998-99 (-14.6 per cent average annual decline); and nine years from 2010-11 to 2019-20 (-1.9 per cent average annual decline).
- Comparing total federal transfers to total provincial spending provides insight on the portion of provincial spending that was supported by federal transfers compared to the Province’s own-source revenue.
- Total federal transfers as a share of provincial spending averaged 13.4 per cent over the 34-year period and was 16.6 per cent in 2023-24.
- In each year from 1990-91 to 2004-05, federal transfers as a share of provincial spending was less than the 13.4 per cent average, with a low of 6.8 per cent in 1998-99 during a period of federal fiscal restraint.
- In each year after 2004-05, federal transfers as a share of provincial spending was higher than the 13.4 per cent average, with a high of 18.7 per cent in 2020-21 due to federal government support in response to the COVID-19 pandemic.
2. Introduction
At the request of a Member of Provincial Parliament, this report reviews Government of Ontario (the Province) spending trends from 1990-91 to 2023-24. The report also reviews trends in federal government transfers to Ontario and analyzes federal transfers as a share of provincial spending. The report is organized as follows:
- Chapter 3 reviews total Ontario government spending on a nominal and real per capita basis over the 34-year period from 1990-91 to 2023-24. This chapter also compares total government spending to nominal GDP.
- Chapter 4 reviews spending trends by sector and discusses how the share of spending by sector has changed over time.
- Chapters 5 through 11 discuss spending trends by sector: health; education; postsecondary education; children, community and social services; justice; ‘other programs’; and interest on debt. For each sector, the FAO also reviews trends in select service levels.
- Chapter 12 reviews trends in federal government transfers to Ontario and analyzes federal transfers as a share of provincial spending.
- Appendix A discusses spending trends by standard account from 2016-17 to 2023-24.
- Appendix B provides more details on sector-specific cost drivers and indicators.
- Appendix C provides information on the FAO’s adjustments to historical spending in the Public Accounts of Ontario to improve comparability over the 34-year period.
Scope
The report reviews total consolidated spending by the Province as described in the 2023-24 Public Accounts of Ontario. This includes spending by government ministries, the broader public sector organizations controlled by the Province (hospitals, school boards, colleges and Children’s Aid Societies), the Province’s agencies and the legislative offices. In addition, the report reviews trends in federal government transfers to the Province. The report does not review other provincial revenues or changes to the Province’s balance sheet.
Methodology and Sources
This report utilizes data from the Public Accounts of Ontario and various other sources, including information provided to the FAO from government entities and publicly available information from statistical agencies and other public bodies. Over the past 34 years, numerous restatements and accounting changes have occurred that have altered the presentation of Ontario’s finances. The FAO has made adjustments for these changes to improve the consistency and comparability of spending data. Detailed discussions of these adjustments can be found in Appendix C.
In this report, the FAO reviewed select service levels based on their relevance to each sector, considering factors such as the scale of program spending, the direct impact of government spending on the service level, and the availability of long-term historical data. While this report does not review all government service levels, the FAO has provided links to additional publications for further information.
Background Data
For access to the data presented in this report, please visit the FAO’s website at: https://fao-on.org/GovernmentSpendingTrendsData-EN.xlsx.
3. Ontario Government Spending Trends
Overview
In 2023-24, the Province spent a total of $206.6 billion, up from $57.6 billion in 1990-91, representing an average annual increase of 3.9 per cent. Total spending increased every year over this 34-year period, with the exception of five years: 1993-94, 1996-97, 1997-98, 2000-01 and 2012-13.
Figure 3.1 Total Ontario government spending, 1990-91 to 2023-24
Source: Public Accounts of Ontario, Statistics Canada and FAO analysis of information provided by the Province.
Accessible version
| Fiscal Year | Total Spending |
|---|---|
| 1990-91 | 57.6 |
| 1991-92 | 65.0 |
| 1992-93 | 66.4 |
| 1993-94 | 65.8 |
| 1994-95 | 67.0 |
| 1995-96 | 67.7 |
| 1996-97 | 67.0 |
| 1997-98 | 66.5 |
| 1998-99 | 67.3 |
| 1999-00 | 73.6 |
| 2000-01 | 73.2 |
| 2001-02 | 75.5 |
| 2002-03 | 78.6 |
| 2003-04 | 84.8 |
| 2004-05 | 90.9 |
| 2005-06 | 95.2 |
| 2006-07 | 100.0 |
| 2007-08 | 109.2 |
| 2008-09 | 110.3 |
| 2009-10 | 122.5 |
| 2010-11 | 127.7 |
| 2011-12 | 130.8 |
| 2012-13 | 129.8 |
| 2013-14 | 134.5 |
| 2014-15 | 137.4 |
| 2015-16 | 141.5 |
| 2016-17 | 143.2 |
| 2017-18 | 154.4 |
| 2018-19 | 161.1 |
| 2019-20 | 164.8 |
| 2020-21 | 181.3 |
| 2021-22 | 183.1 |
| 2022-23 | 198.7 |
| 2023-24 | 206.6 |
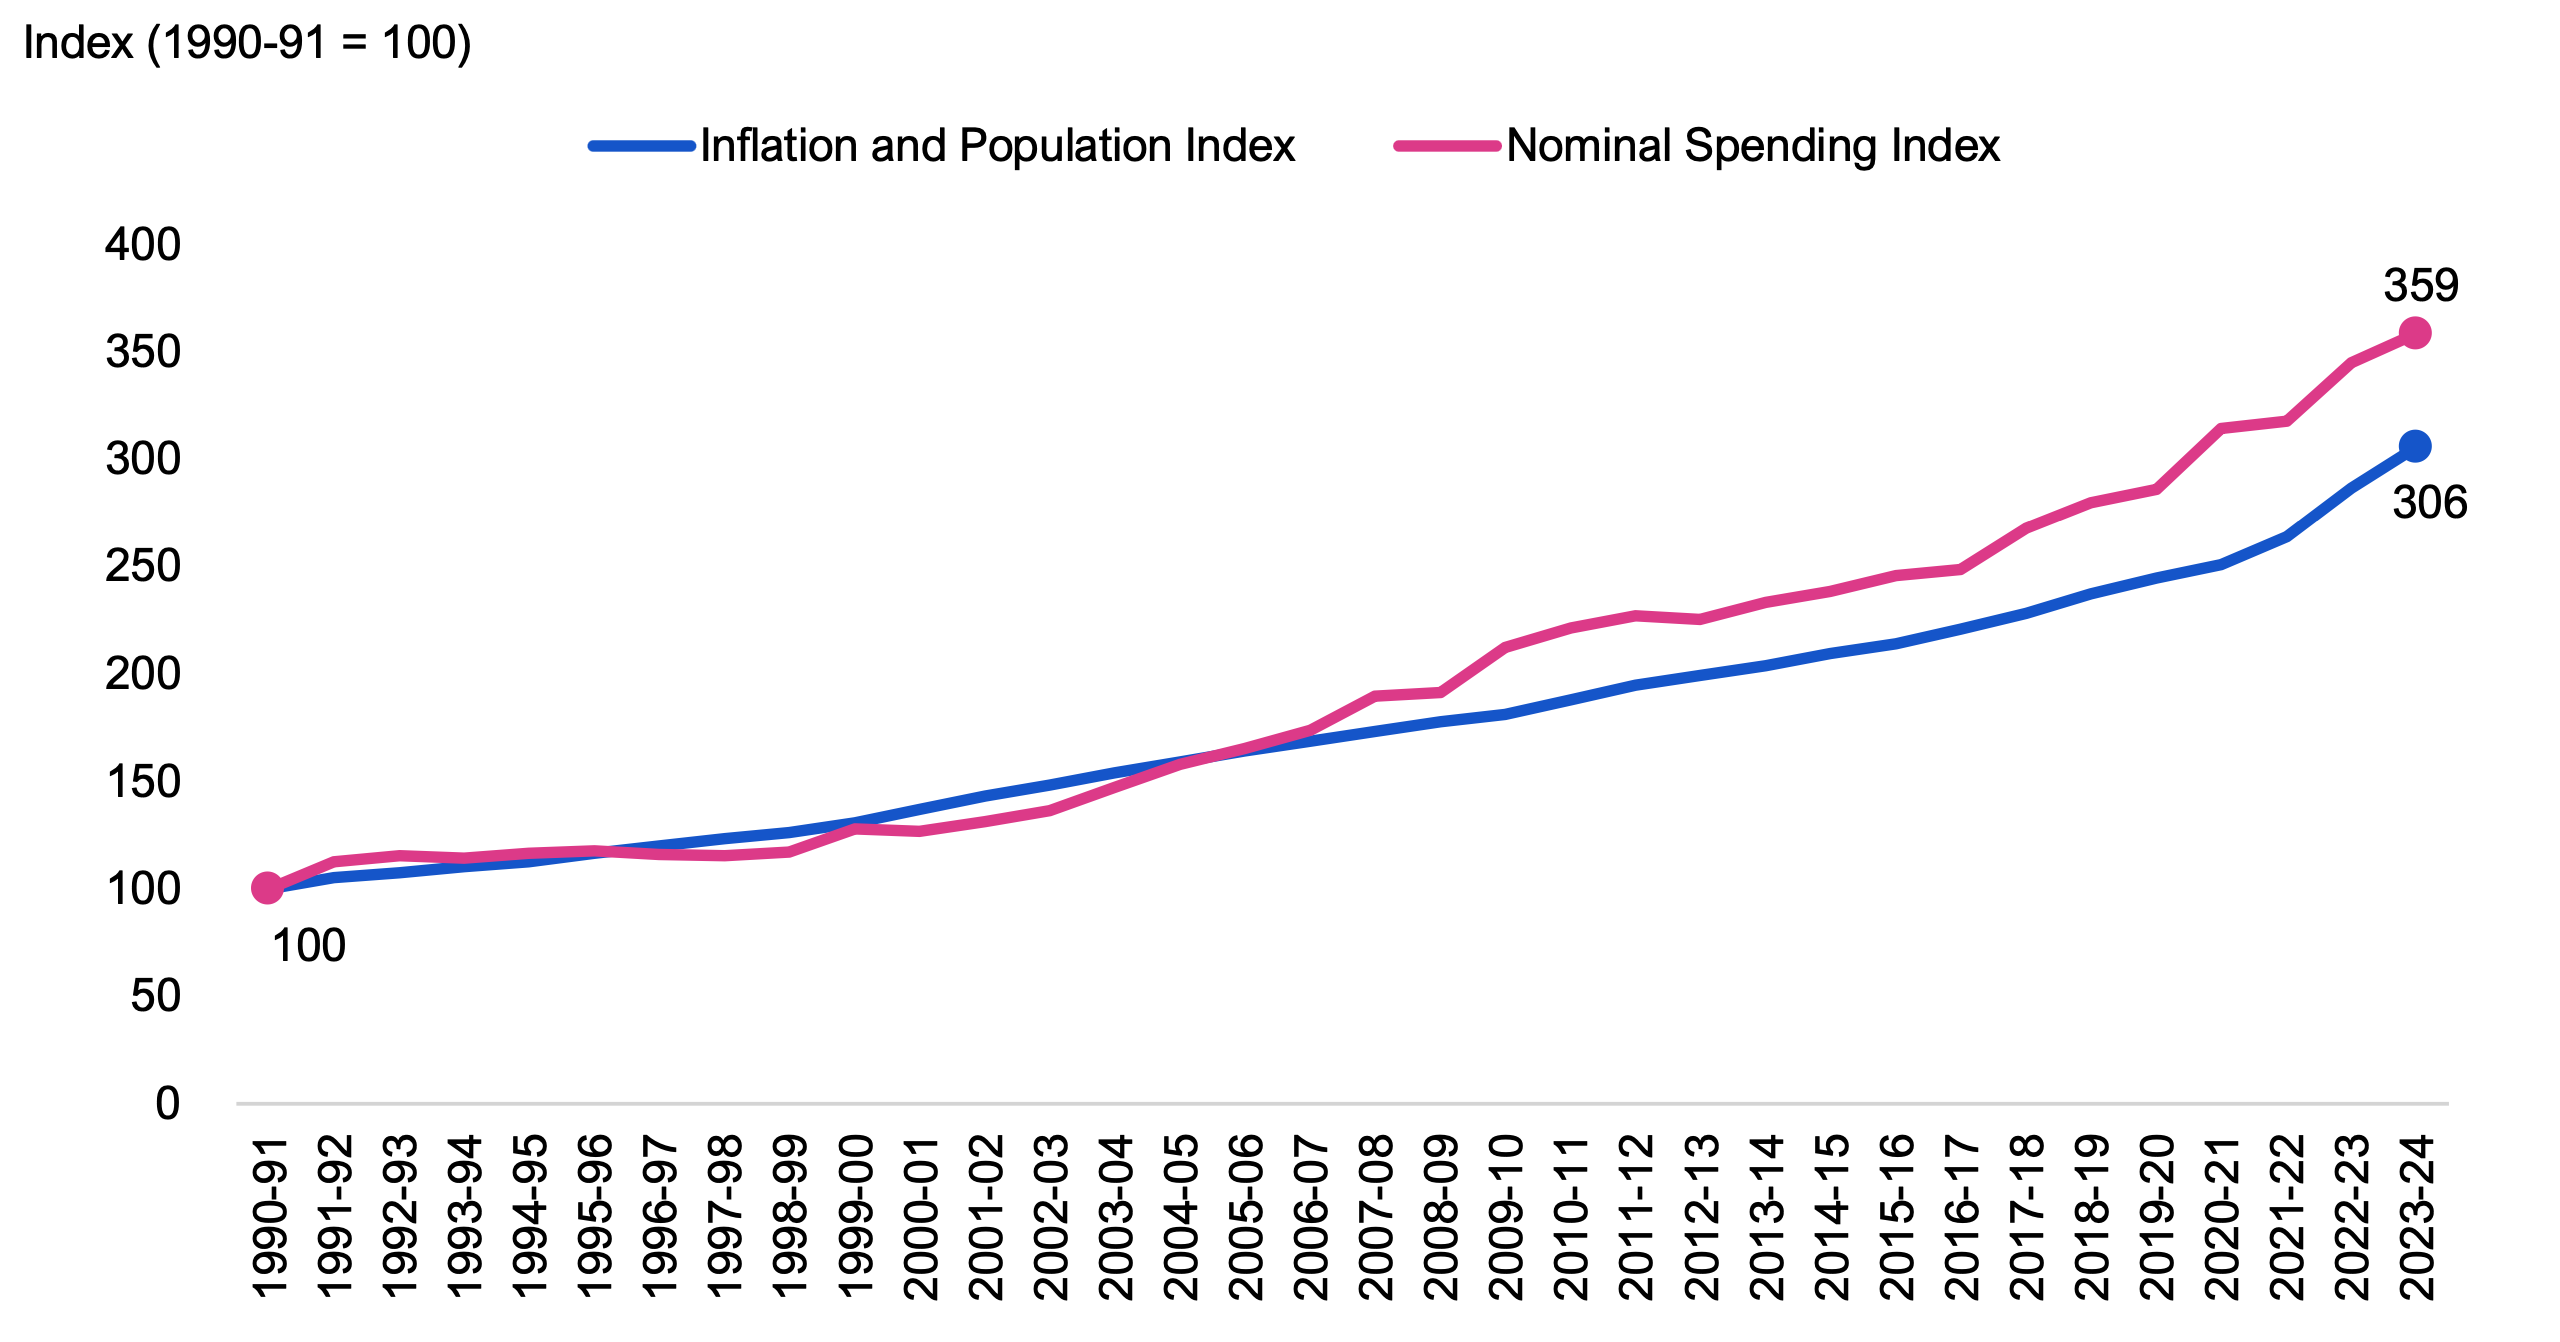
As a comparison, inflation and population growth, which are two broad cost drivers for government spending, have increased at a combined average annual rate of 3.4 per cent over this 34-year period, which is lower than the 3.9 per cent average annual growth in spending. Specifically, general price inflation, which increases the cost of providing public goods and services, and puts pressure on public sector wages, averaged 2.1 per cent over this period. Population growth, which drives up the demand for public services, increased at an average annual rate of 1.3 per cent from 1990-91 to 2023-24.
Looking at the 34-year period in more detail, between 1990-91 and 2005-06, government spending increased at an average annual rate of 3.4 per cent, in line with the 3.4 per cent average annual growth in population and inflation over the same period. However, from 2005-06 to 2023-24, growth in nominal spending averaged 4.4 per cent, outpacing the 3.5 per cent average annual growth in inflation and population.
Figure 3.2 Inflation and population index, and nominal spending index, 1990-91 to 2023-24
Source: FAO calculations, Statistics Canada, Public Accounts of Ontario and FAO analysis of information provided by the Province.
Accessible version
| Fiscal Year | Inflation and Population Index | Nominal Spending Index |
|---|---|---|
| 1990-91 | 100 | 100 |
| 1991-92 | 105 | 113 |
| 1992-93 | 108 | 115 |
| 1993-94 | 110 | 114 |
| 1994-95 | 112 | 116 |
| 1995-96 | 116 | 118 |
| 1996-97 | 120 | 116 |
| 1997-98 | 123 | 115 |
| 1998-99 | 126 | 117 |
| 1999-00 | 131 | 128 |
| 2000-01 | 137 | 127 |
| 2001-02 | 143 | 131 |
| 2002-03 | 148 | 136 |
| 2003-04 | 154 | 147 |
| 2004-05 | 159 | 158 |
| 2005-06 | 164 | 165 |
| 2006-07 | 169 | 174 |
| 2007-08 | 173 | 190 |
| 2008-09 | 178 | 191 |
| 2009-10 | 181 | 213 |
| 2010-11 | 188 | 222 |
| 2011-12 | 195 | 227 |
| 2012-13 | 199 | 225 |
| 2013-14 | 204 | 233 |
| 2014-15 | 209 | 238 |
| 2015-16 | 214 | 246 |
| 2016-17 | 221 | 248 |
| 2017-18 | 228 | 268 |
| 2018-19 | 237 | 280 |
| 2019-20 | 245 | 286 |
| 2020-21 | 251 | 315 |
| 2021-22 | 264 | 318 |
| 2022-23 | 286 | 345 |
| 2023-24 | 306 | 359 |
Real Per Capita Spending
Nominal government spending, which does not account for changes in Ontario’s population and inflation, can obscure the true impact of government spending on service levels, especially when comparing different time periods. Therefore, analyzing spending on inflation-adjusted (i.e., real) and per capita terms offers a clearer comparison of spending levels over time. Overall, the Province’s real per capita spending has increased at an average annual rate of 0.5 per cent from $11,185 in 1990-91 to $13,118 in 2023-24.
Figure 3.3 Real per capita government spending, 1990-91 to 2023-24
Source: FAO calculations, Statistics Canada, Public Accounts of Ontario and FAO analysis of information provided by the Province.
Accessible version
| Fiscal Year | Real Per Capita Spending |
|---|---|
| 1990-91 | 11,185 |
| 1991-92 | 11,996 |
| 1992-93 | 11,970 |
| 1993-94 | 11,564 |
| 1994-95 | 11,570 |
| 1995-96 | 11,294 |
| 1996-97 | 10,856 |
| 1997-98 | 10,467 |
| 1998-99 | 10,357 |
| 1999-00 | 10,926 |
| 2000-01 | 10,386 |
| 2001-02 | 10,243 |
| 2002-03 | 10,276 |
| 2003-04 | 10,690 |
| 2004-05 | 11,109 |
| 2005-06 | 11,268 |
| 2006-07 | 11,515 |
| 2007-08 | 12,229 |
| 2008-09 | 12,025 |
| 2009-10 | 13,114 |
| 2010-11 | 13,185 |
| 2011-12 | 13,027 |
| 2012-13 | 12,647 |
| 2013-14 | 12,818 |
| 2014-15 | 12,737 |
| 2015-16 | 12,836 |
| 2016-17 | 12,600 |
| 2017-18 | 13,137 |
| 2018-19 | 13,182 |
| 2019-20 | 13,063 |
| 2020-21 | 14,023 |
| 2021-22 | 13,457 |
| 2022-23 | 13,470 |
| 2023-24 | 13,118 |
Based on real per capita spending, the FAO has identified six distinct periods of total government spending trends between 1990-91 to 2023-24:
- The first period was for one year, from 1990-91 to 1991-92, during which real per capita spending increased by 7.2 per cent, largely due to government stimulus in response to the early 1990s recession.
- The second period was for 11 years, from 1991-92 to 2002-03. Over this period, real per capita spending declined at an average annual rate of -1.4 per cent, largely due to government measures to reduce budget deficits following the early 1990s recession.
- The third period was for eight years, from 2002-03 to 2010-11. Over this period, real per capita spending increased at an average annual rate of 3.2 per cent, largely due to new and expanded programs, economic stimulus measures in response to the 2008-2009 global financial crisis and above-inflation growth in public sector wages.
- The fourth period was for six years, from 2010-11 to 2016-17. Over this period, real per capita spending declined at an average annual rate of -0.8 per cent as government spending was restrained to reduce budget deficits following the 2008-2009 global financial crisis.
- The fifth period was for four years, from 2016-17 to 2020-21. Over this period, real per capita spending increased at an average annual rate of 2.7 per cent, largely due to new and expanded programs and spending in response to the COVID-19 pandemic.
- The sixth period was for three years, from 2020-21 to 2023-24. Over this period, real per capita spending declined at an average annual rate of -2.2 per cent, primarily due to high inflation and population growth combined with the expiry of time limited spending in response to the COVID-19 pandemic.
Figure 3.4 Average annual real per capita spending growth in Ontario by period, 1990-91 to 2023-24
Source: FAO calculations, Statistics Canada, Public Accounts of Ontario and FAO analysis of information provided by the Province.
Accessible version
| Fiscal Years | 1990-91 to 1991-92 | 1991-92 to 2002-03 | 2002-03 to 2010-11 | 2010-11 to 2016-17 | 2016-17 to 2020-21 | 2020-21 to 2023-24 | 1990-91 to 2023-24 |
|---|---|---|---|---|---|---|---|
| Average Annual Growth | 7.2 | -1.4 | 3.2 | -0.8 | 2.7 | -2.2 | 0.5 |
Spending as a Share of the Economy
Another approach to analyzing government spending trends is to compare nominal government spending to nominal gross domestic product (GDP). As nominal GDP is the broadest measure of the tax base, this comparison provides insight into the size of government spending relative to the economy’s ability to pay. Spending as a share of Ontario’s GDP averaged 18.6 per cent over the 34-year period.
Figure 3.5 Government spending as a share of nominal GDP, 1990-91 to 2023-24
Source: FAO calculations, Statistics Canada, Public Accounts of Ontario and FAO analysis of information provided by the Province.
Accessible version
| Fiscal Year | Spending as a Share of Nominal GDP | Average |
|---|---|---|
| 1990-91 | 20.0 | 18.6 |
| 1991-92 | 22.4 | 18.6 |
| 1992-93 | 22.5 | 18.6 |
| 1993-94 | 21.4 | 18.6 |
| 1994-95 | 20.6 | 18.6 |
| 1995-96 | 19.9 | 18.6 |
| 1996-97 | 18.9 | 18.6 |
| 1997-98 | 17.7 | 18.6 |
| 1998-99 | 17.0 | 18.6 |
| 1999-00 | 17.2 | 18.6 |
| 2000-01 | 16.0 | 18.6 |
| 2001-02 | 15.9 | 18.6 |
| 2002-03 | 15.7 | 18.6 |
| 2003-04 | 16.4 | 18.6 |
| 2004-05 | 16.8 | 18.6 |
| 2005-06 | 16.9 | 18.6 |
| 2006-07 | 17.1 | 18.6 |
| 2007-08 | 18.1 | 18.6 |
| 2008-09 | 18.2 | 18.6 |
| 2009-10 | 20.2 | 18.6 |
| 2010-11 | 20.0 | 18.6 |
| 2011-12 | 19.6 | 18.6 |
| 2012-13 | 19.0 | 18.6 |
| 2013-14 | 19.1 | 18.6 |
| 2014-15 | 18.7 | 18.6 |
| 2015-16 | 18.4 | 18.6 |
| 2016-17 | 17.9 | 18.6 |
| 2017-18 | 18.5 | 18.6 |
| 2018-19 | 18.6 | 18.6 |
| 2019-20 | 18.5 | 18.6 |
| 2020-21 | 20.2 | 18.6 |
| 2021-22 | 18.4 | 18.6 |
| 2022-23 | 18.5 | 18.6 |
| 2023-24 | 18.2 | 18.6 |
During the early 1990s recession, spending as a share of GDP increased to a peak of 22.5 per cent in 1992-93 due to higher nominal government spending and relatively low GDP growth. Over the following years, the share decreased to a low of 15.7 per cent in 2002-03, reflecting a period of spending restraint combined with a pickup in economic growth. The share increased to 20.2 per cent in 2009-10, driven by slow GDP growth and increased government spending and economic stimulus measures in response to the 2008-2009 global financial crisis. From 2009-10 to 2016-17, government spending as a share of GDP declined from 20.2 per cent to 17.9 per cent, reflecting government spending restraint in the early 2010s to reduce budget deficits following the financial crisis. Since 2016-17, spending as a share of GDP has grown moderately to 18.2 per cent in 2023-24, with the exception of a sharp increase to 20.2 per cent in 2020-21 due to increased spending and slow GDP growth during the COVID-19 pandemic.
4. Spending Trends by Sector
The Province categorizes its spending into seven sectors: health; education; postsecondary education; children, community and social services; justice; ‘other programs’; and interest on debt. As outlined in Chapter 3, from 1990-91 to 2023-24, total nominal government spending grew at an average annual rate of 3.9 per cent. This growth has varied by the seven sectors. Overall, three sectors, health (5.0 per cent), postsecondary education (4.2 per cent) and justice (4.0 per cent) experienced above average annual growth over the 34-year period, while four sectors, ‘other programs’ (3.8 per cent), children, community and social services (3.1 per cent), education (3.1 per cent) and interest on debt (2.6 per cent) experienced below average annual growth.
Figure 4.1 Average annual spending growth by sector, 1990-91 to 2023-24
Source: Public Accounts of Ontario, Statistics Canada and FAO analysis of information provided by the Province.
Accessible version
| Sector | Average Annual Spending Growth |
|---|---|
| Health | 5.0 |
| Education | 3.1 |
| Postsecondary Education | 4.2 |
| Children, Community and Social Services | 3.1 |
| Justice | 4.0 |
| Other Programs | 3.8 |
| Interest on Debt | 2.6 |
| Total Spending | 3.9 |
These different spending growth rates have led to changes in each sector’s spending as a share of total spending:
- The health sector has been the largest spending sector throughout the 34-year period, while its share of total spending has steadily increased, from 29.3 per cent in 1990-91 to 41.4 per cent in 2023-24.
- The second largest spending sector over this period was education; however, education sector spending as a share of total spending has steadily declined, from 24.8 per cent in 1990-91 to 18.8 per cent in 2023-24.
- Spending on postsecondary education increased from 5.9 per cent of total spending in 1990-91 to 6.4 per cent in 2023-24.
- Children, community and social services spending decreased from 12.5 per cent of total spending in 1990-91 to 9.4 per cent in 2023-24.
- Justice sector spending as a share of total spending has remained relatively unchanged, at 2.9 per cent of total spending in both 1990-91 and 2023-24.
- ‘Other programs’ sector spending as a share of total spending has fluctuated over time, ranging between 10.0 per cent and 19.1 per cent of total spending. In 1990-91 ‘other programs’ spending was 16.2 per cent of total spending, while in 2023-24 it was 15.6 per cent of total spending.
- Interest on debt spending as a share of total spending increased from 8.4 per cent in 1990-91 to 15.4 per cent in 1999-00, and then steadily declined to 5.5 per cent of total spending in 2023-24.
Figure 4.2 Share of total spending by sector, 1990-91 to 2023-24
Source: Public Accounts of Ontario, Statistics Canada and FAO analysis of information provided by the Province.
Accessible version
| Fiscal Year | Share of Total Government Spending | ||||||
|---|---|---|---|---|---|---|---|
| Health | Education | Postsecondary Education | Children, Community and Social Services | Justice | Other Programs | Interest on Debt | |
| 1990-91 | 29.3% | 24.8% | 5.9% | 12.5% | 2.9% | 16.2% | 8.4% |
| 1991-92 | 29.4% | 25.4% | 6.0% | 13.4% | 2.8% | 14.9% | 8.1% |
| 1992-93 | 29.2% | 24.6% | 6.0% | 14.2% | 2.7% | 14.5% | 8.9% |
| 1993-94 | 29.1% | 24.1% | 5.2% | 15.0% | 2.7% | 12.6% | 11.2% |
| 1994-95 | 28.9% | 22.9% | 5.0% | 15.0% | 2.5% | 13.4% | 12.3% |
| 1995-96 | 28.4% | 23.1% | 5.1% | 14.4% | 2.7% | 13.7% | 12.6% |
| 1996-97 | 28.8% | 22.7% | 4.7% | 12.9% | 2.2% | 15.3% | 13.3% |
| 1997-98 | 30.1% | 22.2% | 5.4% | 13.0% | 2.4% | 13.3% | 13.6% |
| 1998-99 | 31.5% | 23.0% | 5.8% | 13.2% | 2.7% | 10.0% | 13.8% |
| 1999-00 | 32.0% | 21.4% | 5.8% | 12.0% | 2.6% | 10.8% | 15.4% |
| 2000-01 | 32.3% | 21.1% | 5.4% | 9.6% | 3.2% | 13.2% | 15.3% |
| 2001-02 | 34.5% | 21.0% | 5.2% | 9.5% | 3.3% | 12.5% | 14.0% |
| 2002-03 | 36.1% | 21.0% | 5.4% | 9.4% | 3.2% | 12.3% | 12.7% |
| 2003-04 | 37.4% | 20.8% | 5.6% | 9.1% | 3.1% | 12.3% | 11.7% |
| 2004-05 | 37.5% | 21.1% | 5.8% | 9.0% | 2.9% | 13.0% | 10.6% |
| 2005-06 | 37.1% | 20.8% | 5.8% | 9.2% | 2.9% | 14.4% | 9.8% |
| 2006-07 | 38.2% | 20.4% | 6.2% | 9.3% | 2.9% | 13.8% | 9.1% |
| 2007-08 | 37.5% | 19.5% | 6.5% | 9.1% | 3.0% | 15.9% | 8.5% |
| 2008-09 | 39.5% | 20.3% | 6.1% | 9.7% | 3.0% | 13.2% | 8.1% |
| 2009-10 | 37.7% | 19.1% | 6.2% | 9.6% | 2.7% | 17.3% | 7.4% |
| 2010-11 | 37.2% | 18.9% | 6.3% | 9.8% | 2.7% | 17.2% | 7.8% |
| 2011-12 | 38.2% | 19.3% | 6.3% | 10.0% | 2.7% | 15.4% | 8.1% |
| 2012-13 | 39.5% | 18.5% | 6.3% | 10.3% | 2.7% | 14.4% | 8.4% |
| 2013-14 | 39.3% | 19.2% | 6.5% | 10.1% | 2.8% | 13.9% | 8.3% |
| 2014-15 | 39.5% | 19.6% | 6.4% | 10.4% | 2.8% | 13.1% | 8.2% |
| 2015-16 | 39.0% | 19.5% | 6.4% | 10.7% | 2.9% | 13.4% | 8.2% |
| 2016-17 | 39.3% | 19.2% | 6.6% | 10.9% | 2.8% | 13.0% | 8.2% |
| 2017-18 | 38.3% | 18.7% | 6.8% | 10.5% | 2.7% | 15.2% | 7.7% |
| 2018-19 | 38.4% | 18.9% | 6.9% | 10.4% | 2.7% | 15.0% | 7.7% |
| 2019-20 | 38.7% | 19.3% | 6.4% | 10.3% | 2.8% | 14.9% | 7.6% |
| 2020-21 | 38.3% | 18.1% | 5.4% | 9.6% | 2.6% | 19.1% | 6.8% |
| 2021-22 | 41.4% | 17.2% | 5.8% | 9.3% | 2.7% | 16.7% | 6.9% |
| 2022-23 | 39.5% | 18.2% | 5.9% | 9.1% | 2.7% | 18.3% | 6.2% |
| 2023-24 | 41.4% | 18.8% | 6.4% | 9.4% | 2.9% | 15.6% | 5.5% |
Chapters 5 through 11 review spending trends in the seven sectors in more detail.
5. Health
Spending Trends
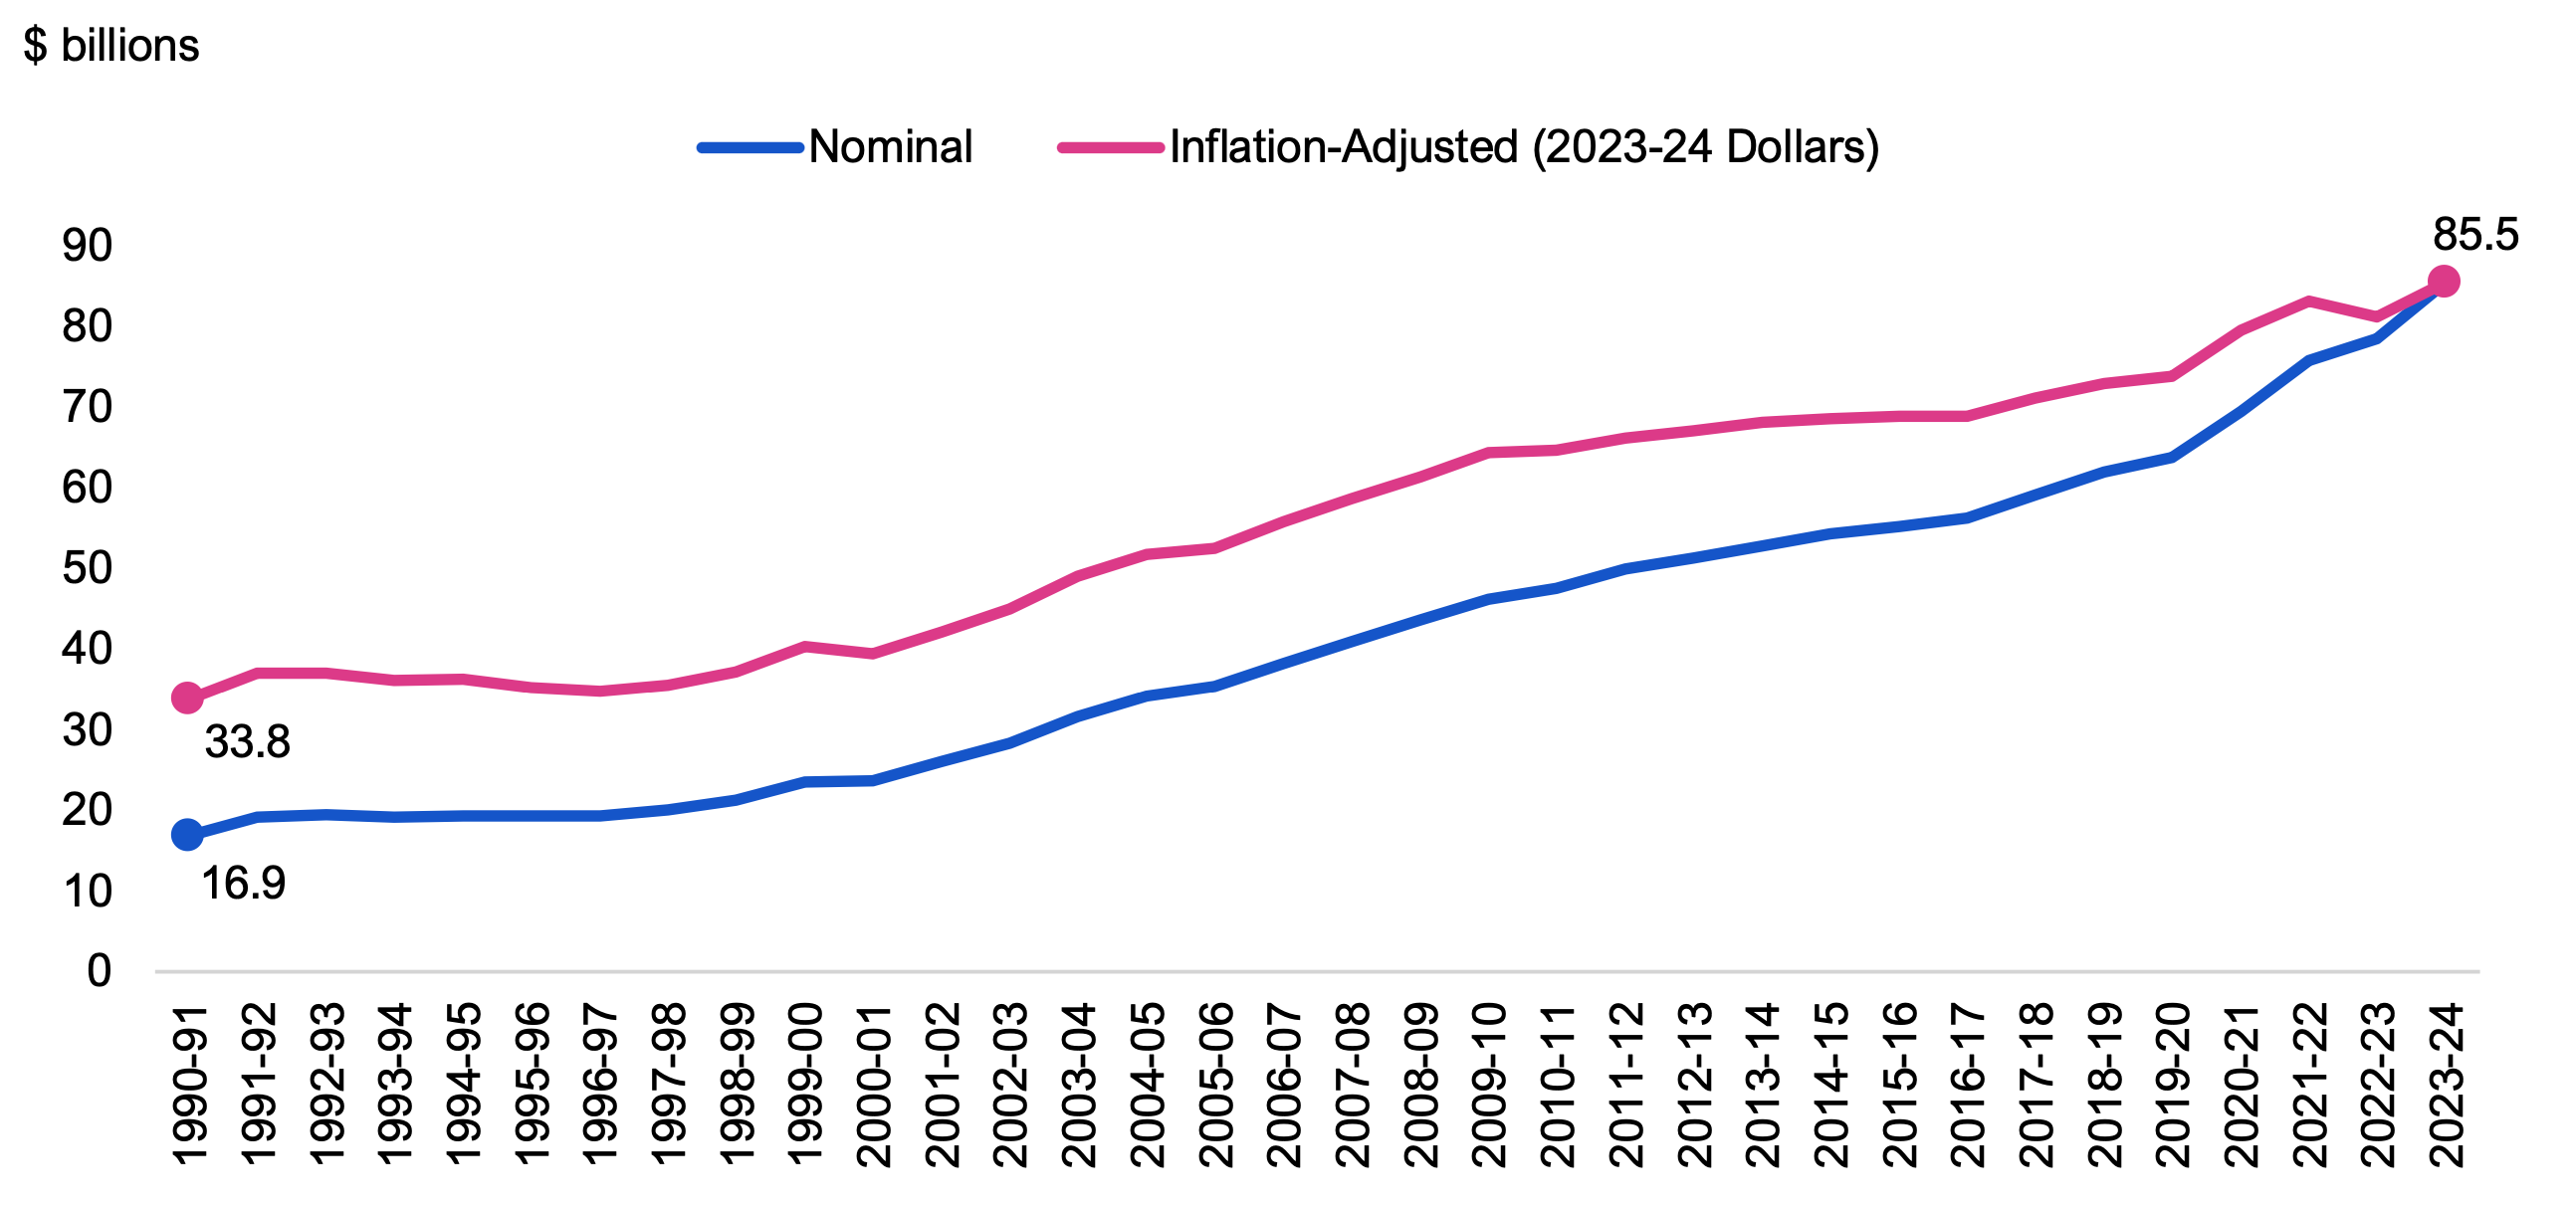
Health is the largest sector in the government, accounting for 41.4 per cent of total spending in 2023-24. The health sector consists of spending on hospitals, physician services, long-term care, community care, public drug programs and other provincially funded health services.[1] The FAO estimates that health sector spending grew at an average annual rate of 5.0 per cent from $16.9 billion in 1990-91 to $85.5 billion in 2023-24. After adjusting for inflation, this sector’s spending grew at an average annual rate of 2.9 per cent from 1990-91 to 2023-24.
Figure 5.1 Health sector spending, nominal and inflation-adjusted, 1990-91 to 2023-24
Source: FAO calculations, Statistics Canada, Public Accounts of Ontario and FAO analysis of information provided by the Province.
Accessible version
| Fiscal Year | Nominal | Inflation-Adjusted (2023-24 Dollars) |
|---|---|---|
| 1990-91 | 16.9 | 33.8 |
| 1991-92 | 19.1 | 37.0 |
| 1992-93 | 19.4 | 37.0 |
| 1993-94 | 19.2 | 36.1 |
| 1994-95 | 19.3 | 36.2 |
| 1995-96 | 19.2 | 35.3 |
| 1996-97 | 19.3 | 34.8 |
| 1997-98 | 20.0 | 35.5 |
| 1998-99 | 21.2 | 37.2 |
| 1999-00 | 23.5 | 40.4 |
| 2000-01 | 23.6 | 39.4 |
| 2001-02 | 26.0 | 42.2 |
| 2002-03 | 28.3 | 44.9 |
| 2003-04 | 31.7 | 49.0 |
| 2004-05 | 34.1 | 51.8 |
| 2005-06 | 35.3 | 52.5 |
| 2006-07 | 38.2 | 55.8 |
| 2007-08 | 40.9 | 58.6 |
| 2008-09 | 43.6 | 61.4 |
| 2009-10 | 46.1 | 64.4 |
| 2010-11 | 47.5 | 64.6 |
| 2011-12 | 50.0 | 66.2 |
| 2012-13 | 51.2 | 67.0 |
| 2013-14 | 52.8 | 68.2 |
| 2014-15 | 54.3 | 68.6 |
| 2015-16 | 55.2 | 68.8 |
| 2016-17 | 56.2 | 68.9 |
| 2017-18 | 59.1 | 71.2 |
| 2018-19 | 61.9 | 72.9 |
| 2019-20 | 63.7 | 73.9 |
| 2020-21 | 69.5 | 79.5 |
| 2021-22 | 75.8 | 83.0 |
| 2022-23 | 78.5 | 81.2 |
| 2023-24 | 85.5 | 85.5 |
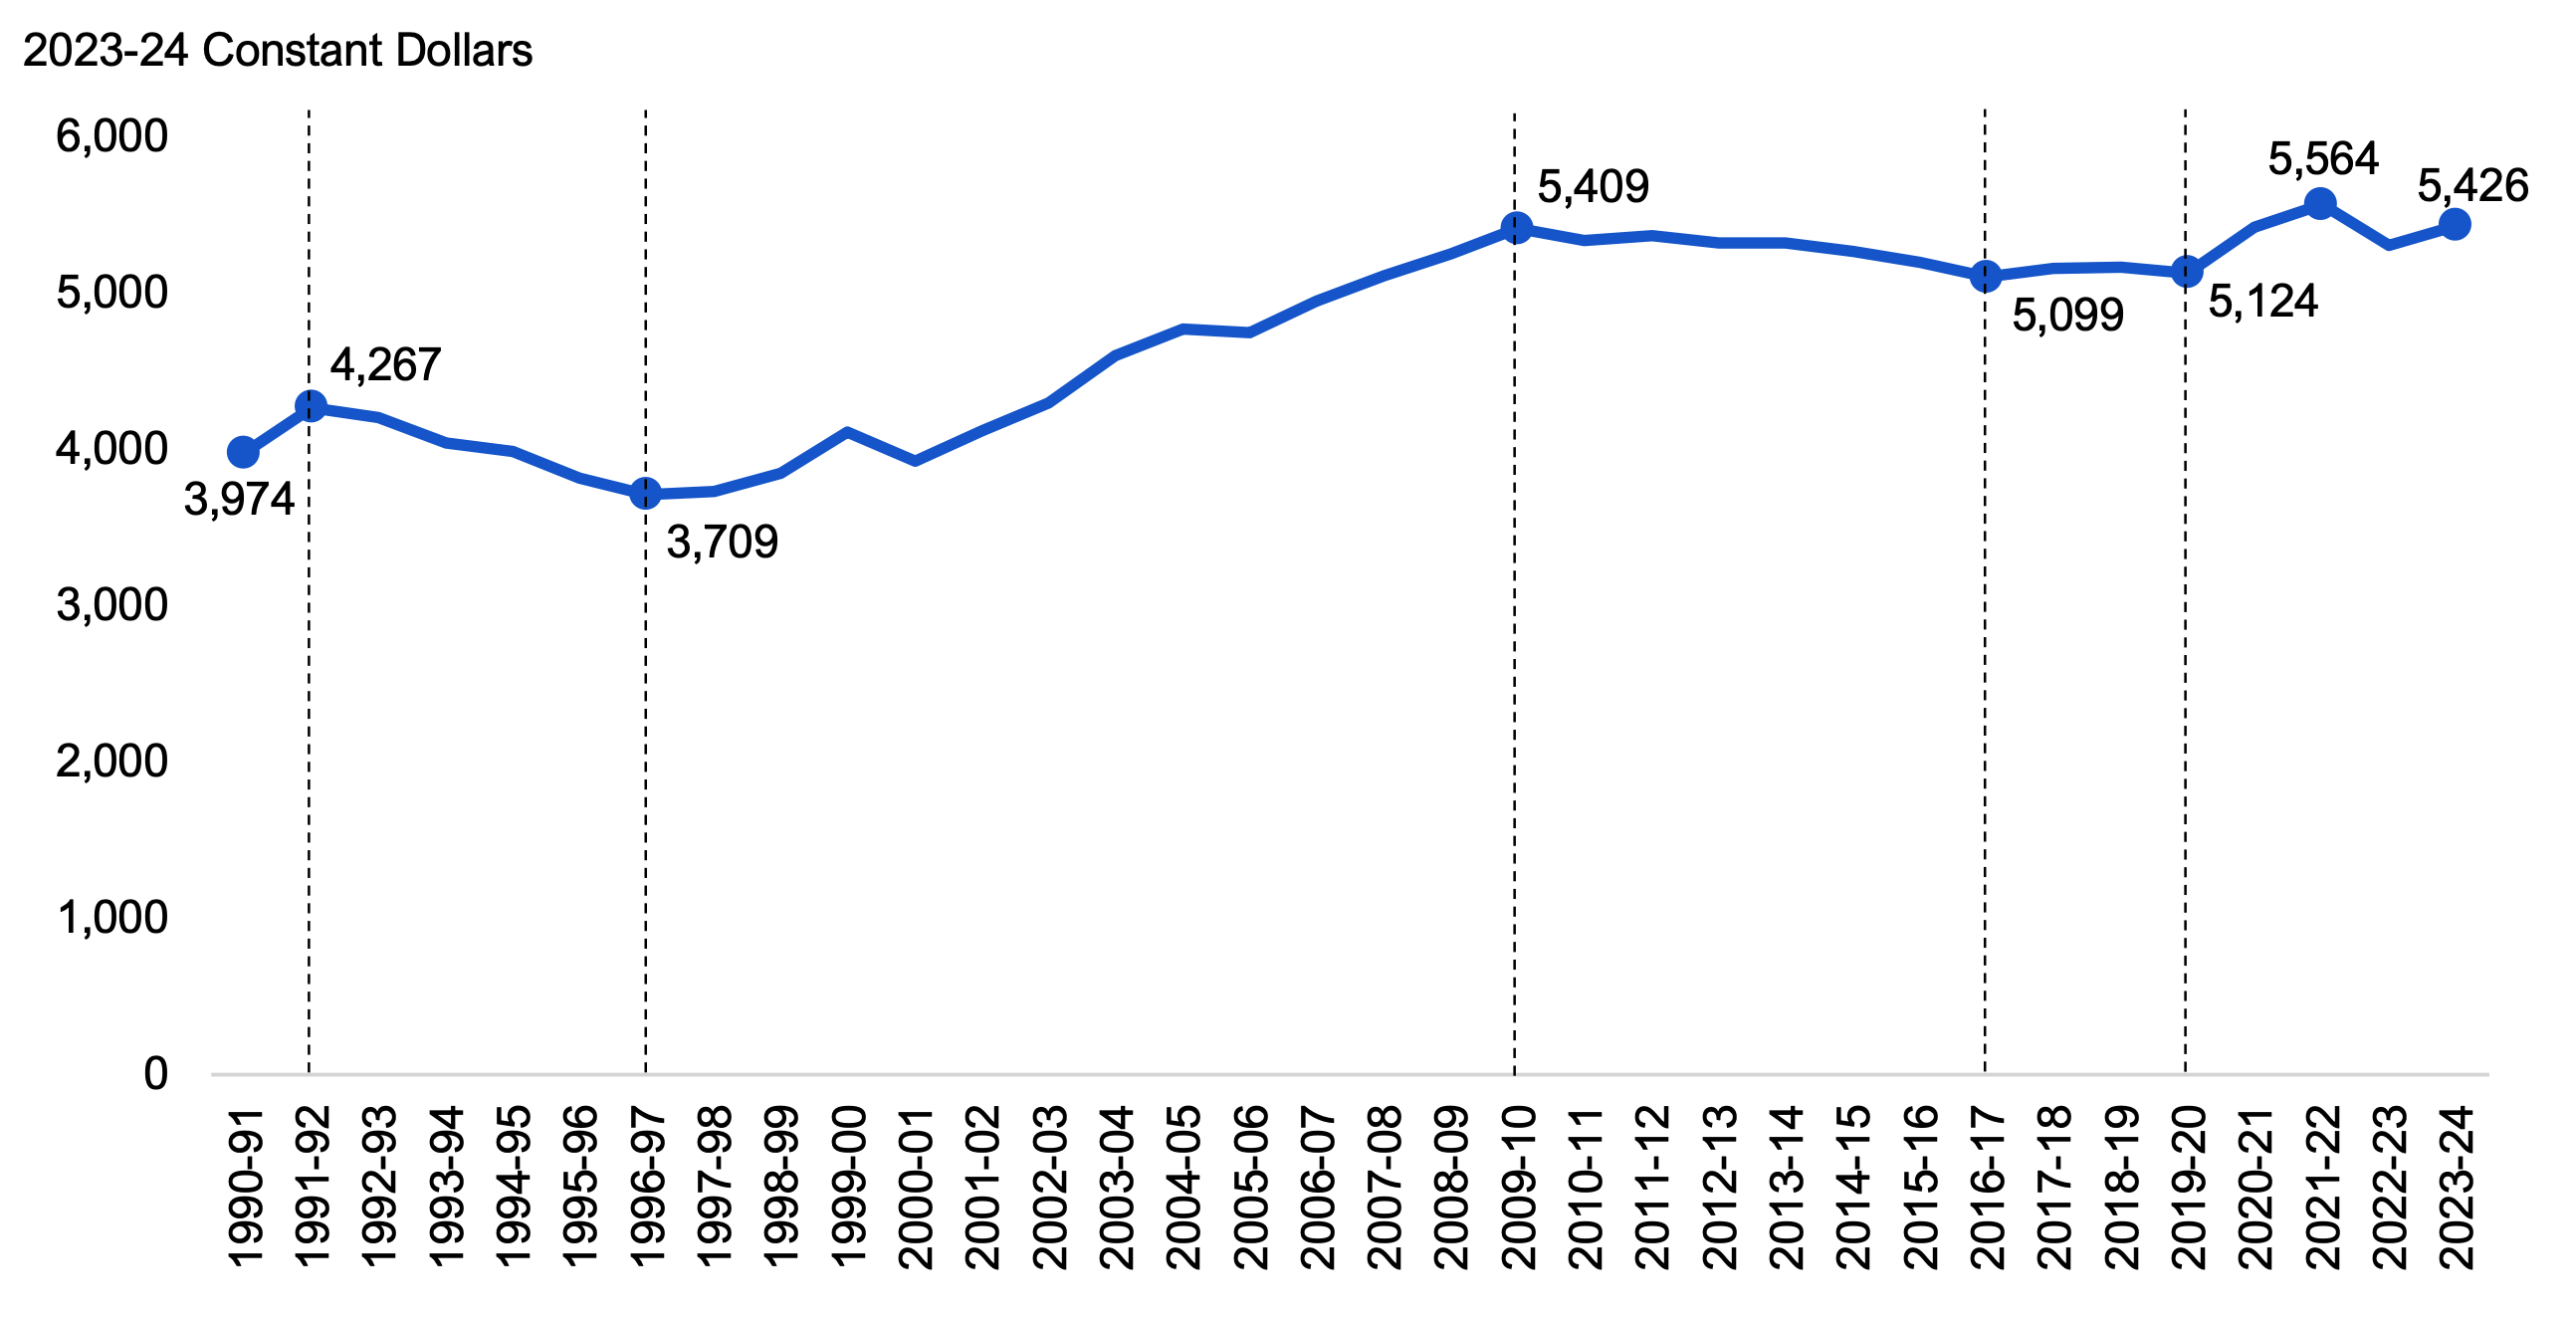
In addition to inflation, population growth and aging are core cost drivers for health sector spending.[2] The following presents health sector spending on a real per capita basis, adjusted for the age structure of Ontario’s population. This allows for a better comparison of the impact that health sector spending has on service levels over time after considering the effect of inflation on prices and the effect of population growth and aging on demand for health care services. Overall, age-standardized real per capita spending increased at an average annual rate of 0.9 per cent from $3,974 per person in 1990-91 to $5,426 per person in 2023-24.
Figure 5.2 Age-standardized real per capita health sector spending, 1990-91 to 2023-24
Source: FAO analysis of CIHI National Health Expenditure Trends, 2024: Data Tables — Series E1, the Public Accounts of Ontario, Statistics Canada, and information provided by the Province.
Accessible version
| Fiscal Year | Age-Standardized Real Per Capita Health Sector Spending |
|---|---|
| 1990-91 | 3,974 |
| 1991-92 | 4,267 |
| 1992-93 | 4,205 |
| 1993-94 | 4,037 |
| 1994-95 | 3,987 |
| 1995-96 | 3,815 |
| 1996-97 | 3,709 |
| 1997-98 | 3,731 |
| 1998-99 | 3,848 |
| 1999-00 | 4,106 |
| 2000-01 | 3,925 |
| 2001-02 | 4,117 |
| 2002-03 | 4,298 |
| 2003-04 | 4,601 |
| 2004-05 | 4,766 |
| 2005-06 | 4,744 |
| 2006-07 | 4,948 |
| 2007-08 | 5,105 |
| 2008-09 | 5,249 |
| 2009-10 | 5,409 |
| 2010-11 | 5,330 |
| 2011-12 | 5,361 |
| 2012-13 | 5,320 |
| 2013-14 | 5,318 |
| 2014-15 | 5,266 |
| 2015-16 | 5,195 |
| 2016-17 | 5,099 |
| 2017-18 | 5,156 |
| 2018-19 | 5,164 |
| 2019-20 | 5,124 |
| 2020-21 | 5,415 |
| 2021-22 | 5,564 |
| 2022-23 | 5,306 |
| 2023-24 | 5,426 |
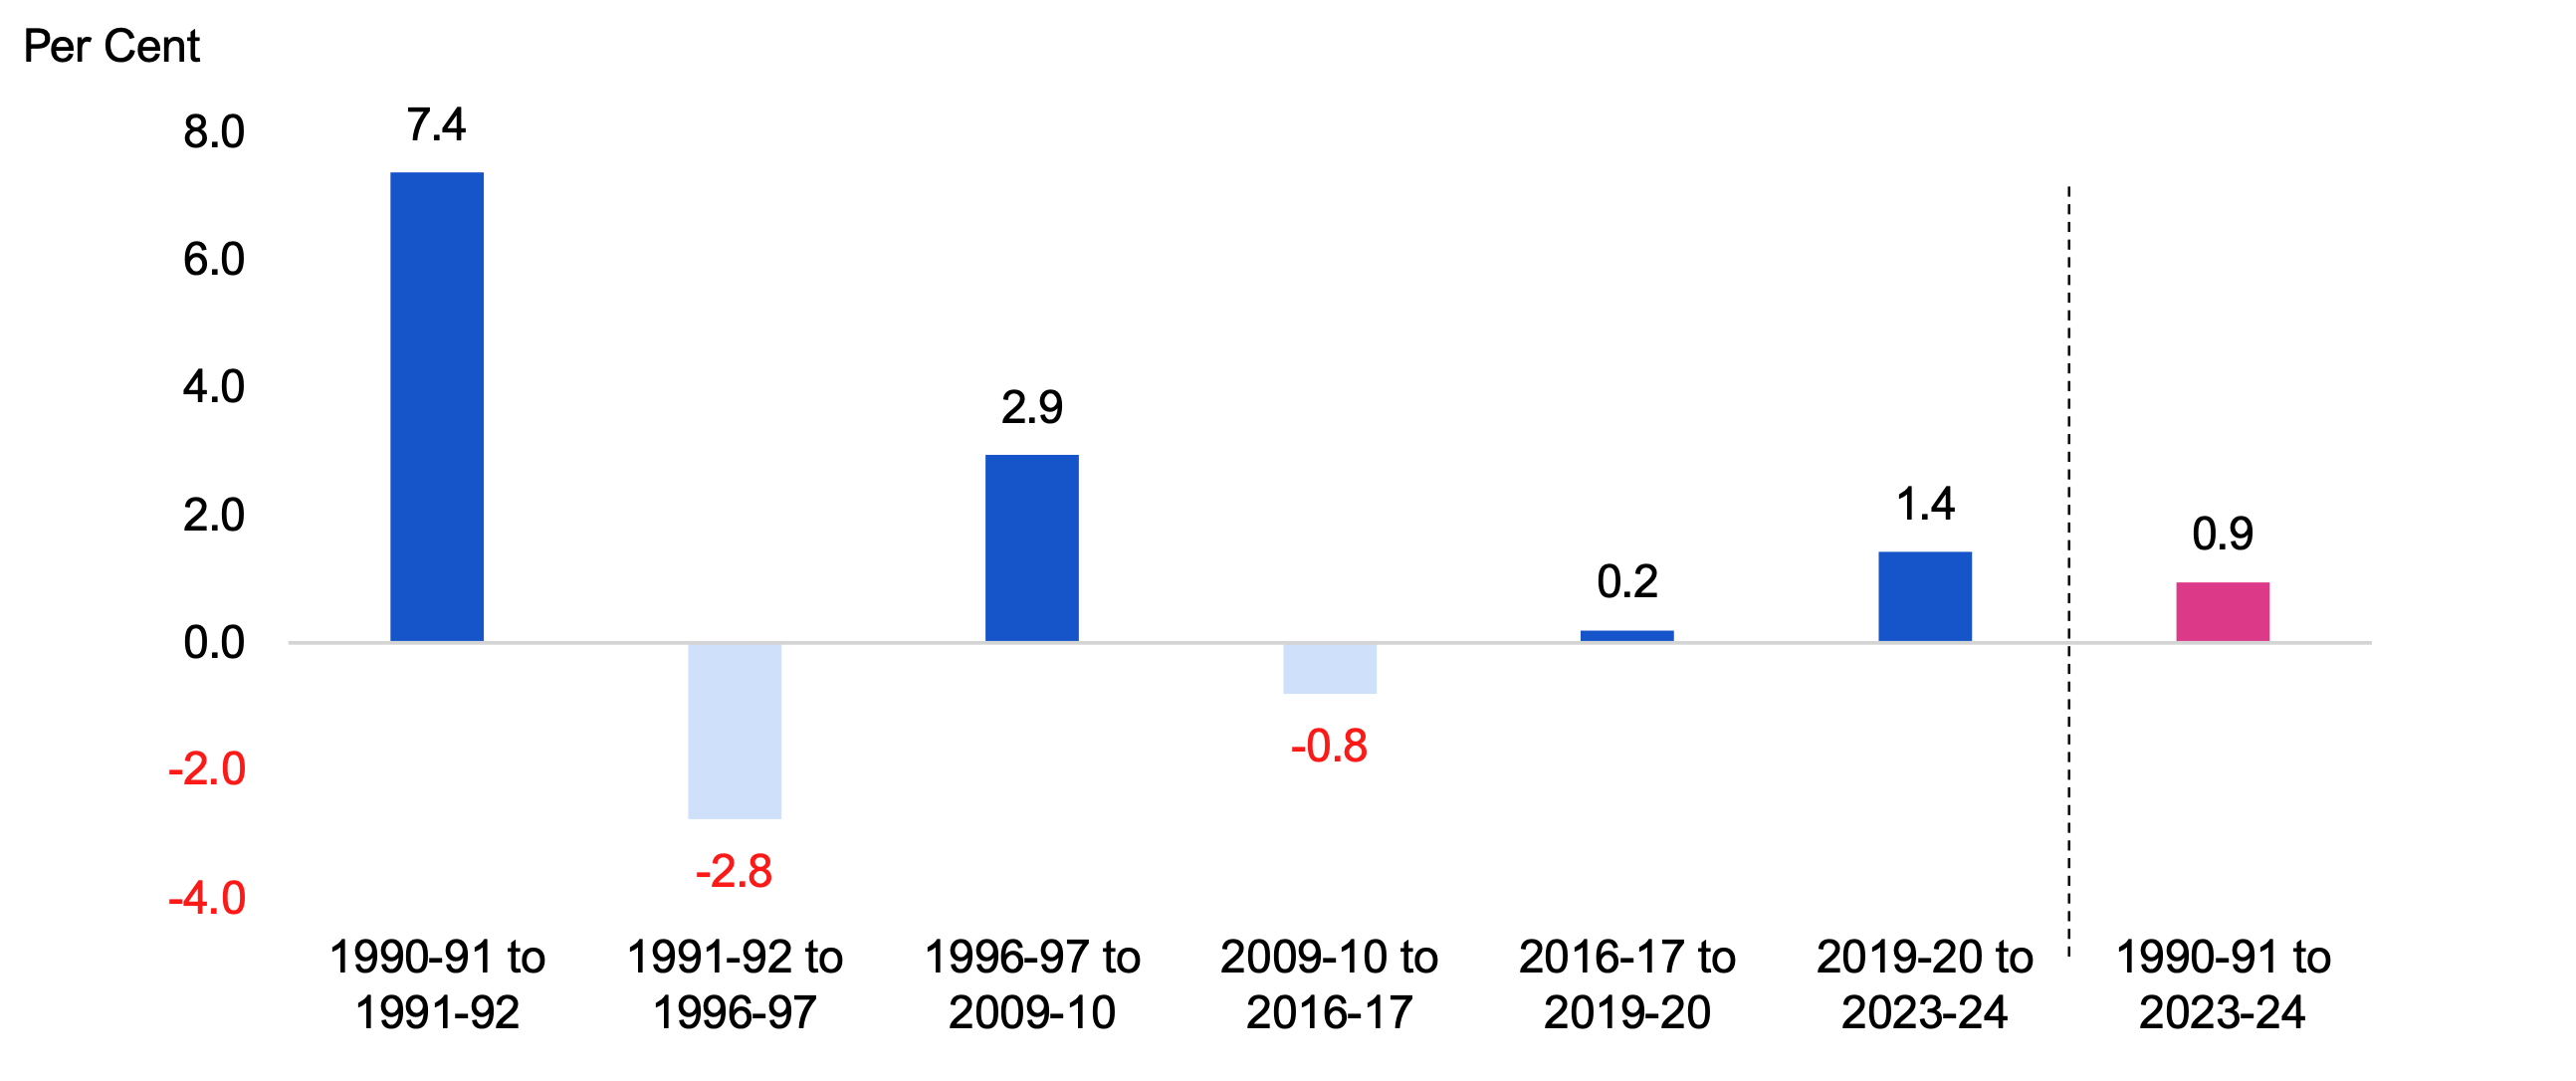
Based on age-standardized real per capita spending, the FAO has identified six distinct periods of health sector spending between 1990-91 to 2023-24:
1990-91 to 1991-92
From 1990-91 to 1991-92, age-standardized real per capita spending increased by 7.4 per cent from $3,974 to $4,267. This growth was driven by increased spending for hospitals, physician services and drug programs.
1991-92 to 1996-97
From 1991-92 to 1996-97, age-standardized real per capita spending declined from $4,267 to $3,709 at an average annual rate of -2.8 per cent. This period was characterized by significant health sector spending restraint driven by relatively flat spending for hospitals due to reductions in hospital capacity. Additionally, there was a nominal decline in spending for physician services resulting from reductions in physician fees and a hard cap on physician billing that was in place from 1993 to 1996.[3]
1996-97 to 2009-10
From 1996-97 to 2009-10, age-standardized real per capita health spending grew from $3,709 to $5,409 at an average annual rate of 2.9 per cent. Significant contributors to this growth include increases in spending on physician services following reforms to physician compensation, expansion of the long-term care sector, and growth in drug program spending.
2009-10 to 2016-17
From 2009-10 to 2016-17, age-standardized real per capita health spending declined from $5,409 to $5,099 at an average annual rate of -0.8 per cent. During this period, the government introduced health spending restraint measures, which included freezing hospital global budgets from 2012-13 to 2015-16, and reducing physician fees in 2013 and 2015. Additionally, drug program spending growth slowed following the establishment of the pan-Canadian Pharmaceutical Alliance in 2010.[4] These measures were partially offset by increased spending on home care.
2016-17 to 2019-20
From 2016-17 to 2019-20, age-standardized real per capita health spending increased from $5,099 to $5,124 at an average annual rate of 0.2 per cent. This period was characterized by increased nominal health spending that was largely offset by inflation, population growth and population aging. Higher nominal health spending was led by increased spending for physician services following a 2019 arbitration decision that increased physician fees and the 2013 and 2015 fee reductions;[5] for drug programs, including the introduction of OHIP+ which provides prescription drug coverage to eligible Ontarians aged 24 and under; and for mental health services, supported by the Canada-Ontario Home and Community Care and Mental Health and Addictions Services Funding Agreement.
2019-20 to 2023-24
From 2019-20 to 2023-24, age-standardized real per capita health spending grew from $5,124 to a peak of $5,564 in 2021-22 before falling to $5,426 in 2023-24, for an average annual growth rate of 1.4 per cent. This period was characterized by time-limited health sector spending in response to the COVID-19 pandemic from 2020-21 to 2022-23, as well as investments to increase capacity in hospitals, home care and long-term care. Additionally, in 2022-23 and 2023-24, the Province recorded expenses for retroactive compensation related to Bill 124, the Protecting a Sustainable Public Sector for Future Generations Act, 2019.
Figure 5.3 Average annual growth in age-standardized real per capita health sector spending, 1990-91 to 2023-24
Source: FAO analysis of CIHI National Health Expenditure Trends, 2022: Data Tables — Series E1, the Public Accounts of Ontario, Statistics Canada, and information provided by the Province.
Accessible version
| Fiscal Years | 1990-91 to 1991-92 | 1991-92 to 1996-97 | 1996-97 to 2009-10 | 2009-10 to 2016-17 | 2016-17 to 2019-20 | 2019-20 to 2023-24 | 1990-91 to 2023-24 |
|---|---|---|---|---|---|---|---|
| Average Annual Growth | 7.4 | -2.8 | 2.9 | -0.8 | 0.2 | 1.4 | 0.9 |
Select Service Levels
In this section, the FAO analyzes three broad service level trends: number of hospital beds, number of physicians and number of long-term care beds. There are many other measures of health system service levels and performance. For more information, see Ontario Health, Health System Performance Reporting and CIHI, health system performance measurement.
Hospital Beds
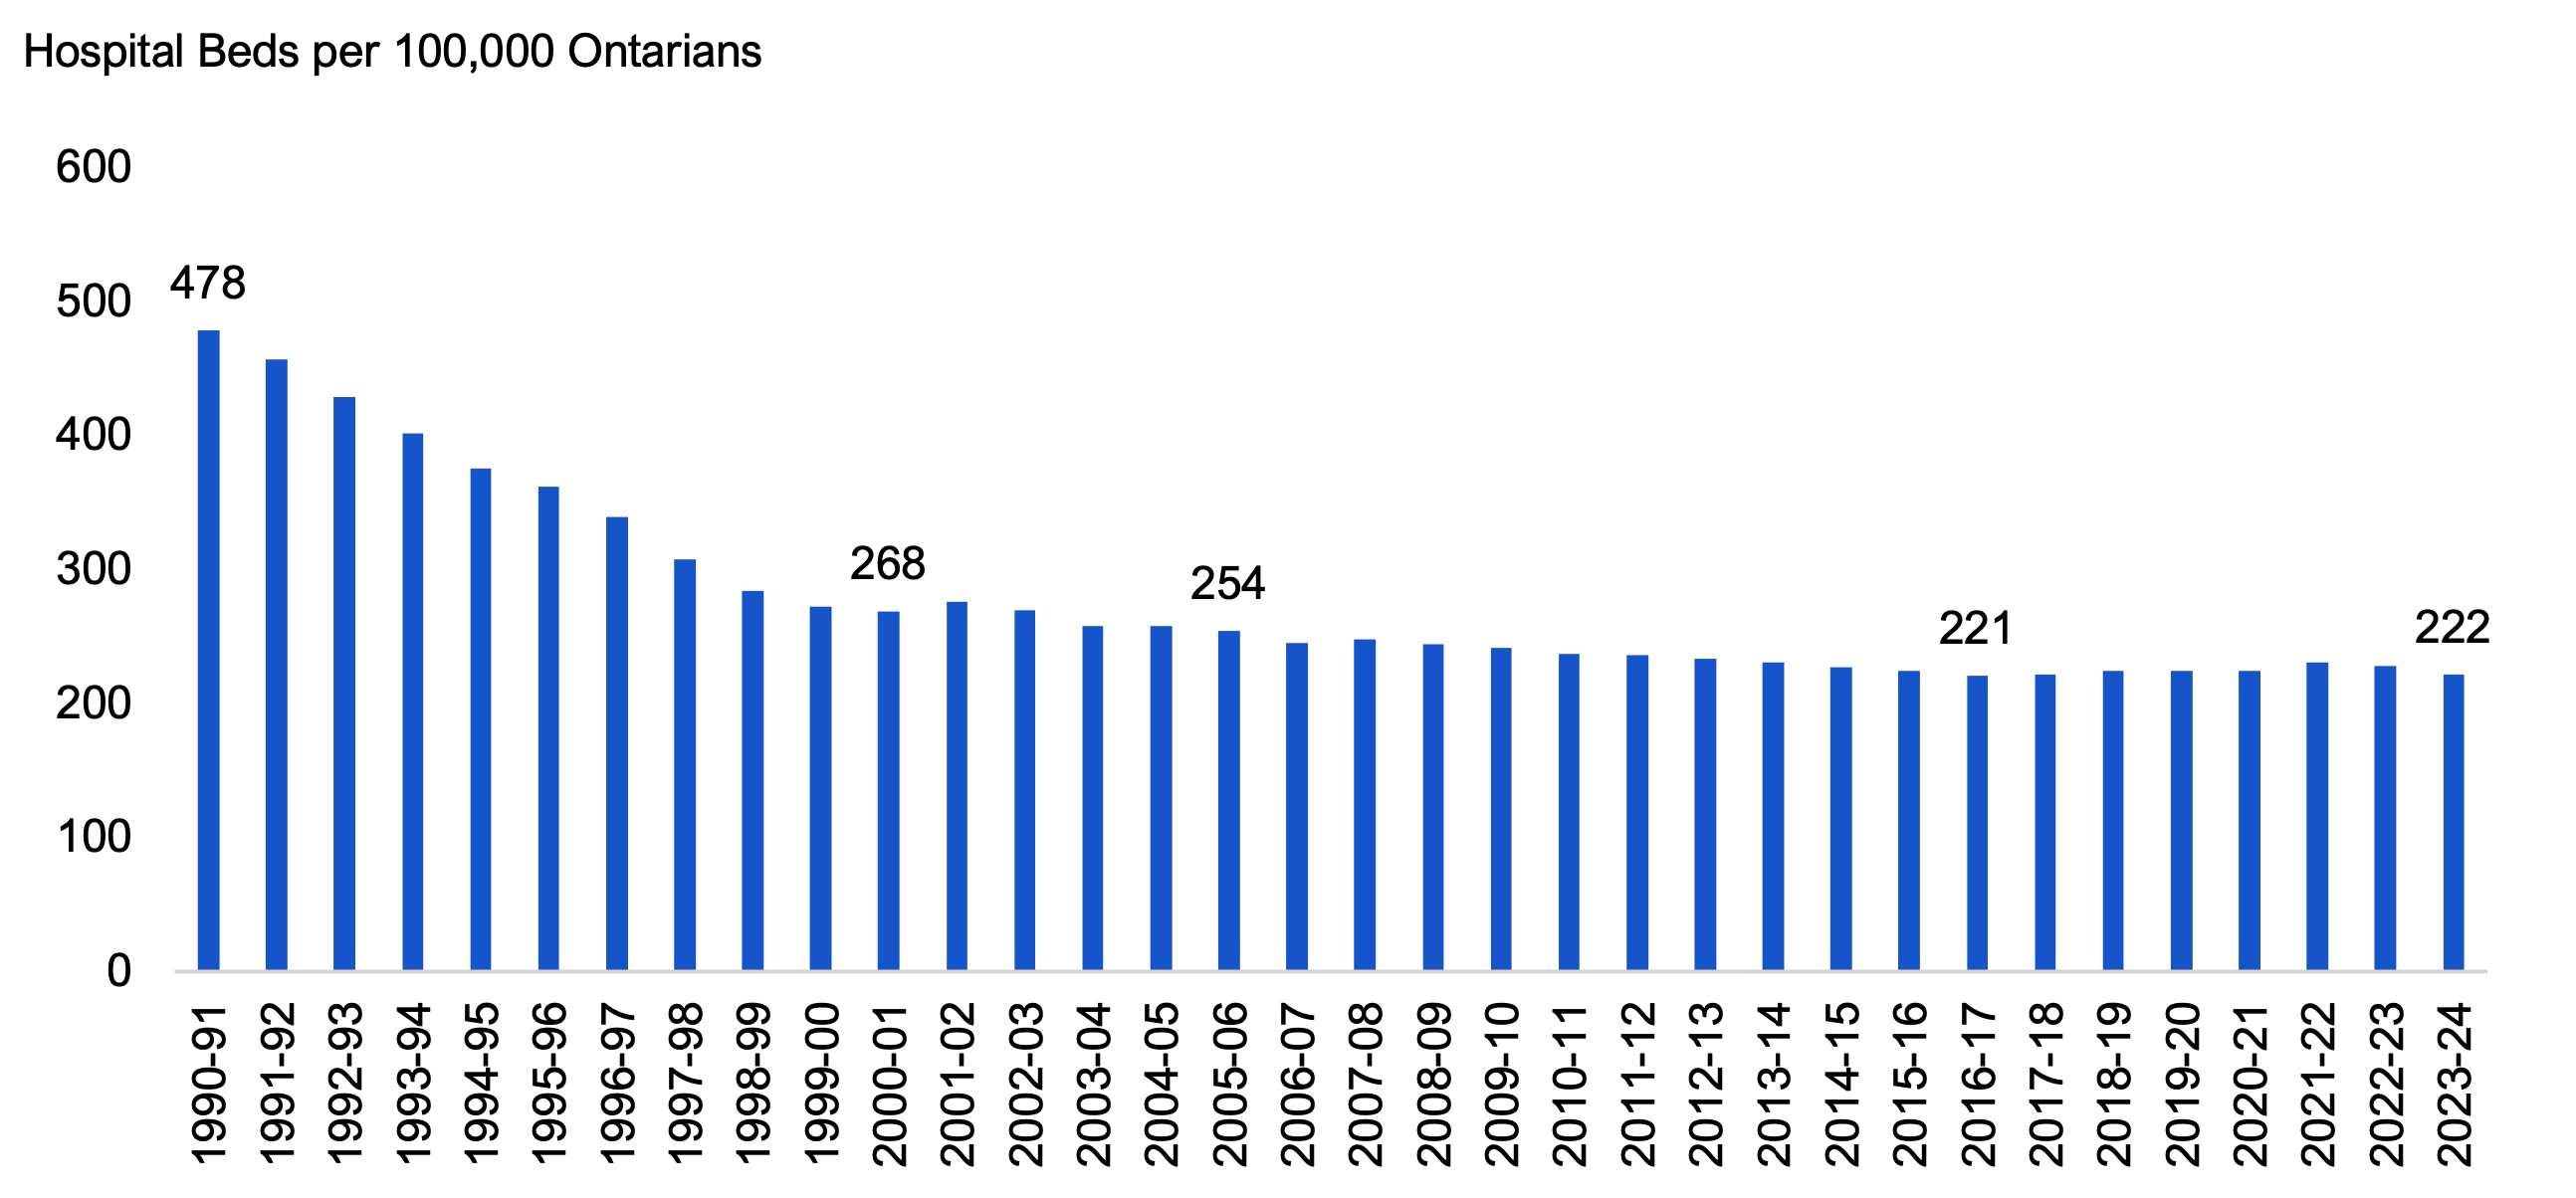
In 2023-24, there were 222 hospital beds for every 100,000 Ontarians. This is less than half of the 478 beds per 100,000 Ontarians in 1990-91.[6] This reduction primarily occurred between 1990-91 and 2000-01 as spending restraint in the health sector contributed to significant downsizing of hospitals.[7] The number of hospital beds per 100,000 Ontarians decreased sharply from 478 in 1990-91 to 268 in 2000-01, and more gradually to 254 in 2005-06. Over this period, there was a corresponding reduction in hospital admissions and in the number of days Ontarians spent in hospitals, which reached their lowest points in 2003-04 and 2005-06, respectively.[8] Beyond 2005-06, the number of hospital beds per 100,000 Ontarians continued to decline to a low of 221 in 2016-17, in line with the end of the freeze to hospital global budgets from 2012-13 to 2015-16. From 2016-17 to 2023-24, over 4,000 beds were added and the number of beds per 100,000 Ontarians remained relatively stable, reaching 222 in 2023-24.
Figure 5.4 Number of hospital beds per 100,000 Ontarians, 1990-91 to 2023-24
Source: FAO analysis of information provided by the Province, Statistics Canada, CIHI Trends in Hospital Spending, 2009–2010 to 2022–2023 — Data Tables — Series D: Beds Staffed and In Operation by Functional Centre and Ontario Health Coalition hospital beds staffed and in operation Ontario 1990 to 2014.
Accessible version
| Fiscal Year | Hospital Beds per 100,000 Ontarians |
|---|---|
| 1990-91 | 478 |
| 1991-92 | 457 |
| 1992-93 | 429 |
| 1993-94 | 402 |
| 1994-95 | 376 |
| 1995-96 | 362 |
| 1996-97 | 339 |
| 1997-98 | 307 |
| 1998-99 | 284 |
| 1999-00 | 272 |
| 2000-01 | 268 |
| 2001-02 | 276 |
| 2002-03 | 270 |
| 2003-04 | 258 |
| 2004-05 | 258 |
| 2005-06 | 254 |
| 2006-07 | 245 |
| 2007-08 | 248 |
| 2008-09 | 244 |
| 2009-10 | 242 |
| 2010-11 | 237 |
| 2011-12 | 236 |
| 2012-13 | 233 |
| 2013-14 | 231 |
| 2014-15 | 227 |
| 2015-16 | 224 |
| 2016-17 | 221 |
| 2017-18 | 222 |
| 2018-19 | 224 |
| 2019-20 | 224 |
| 2020-21 | 224 |
| 2021-22 | 230 |
| 2022-23 | 228 |
| 2023-24 | 222 |
Number of Physicians
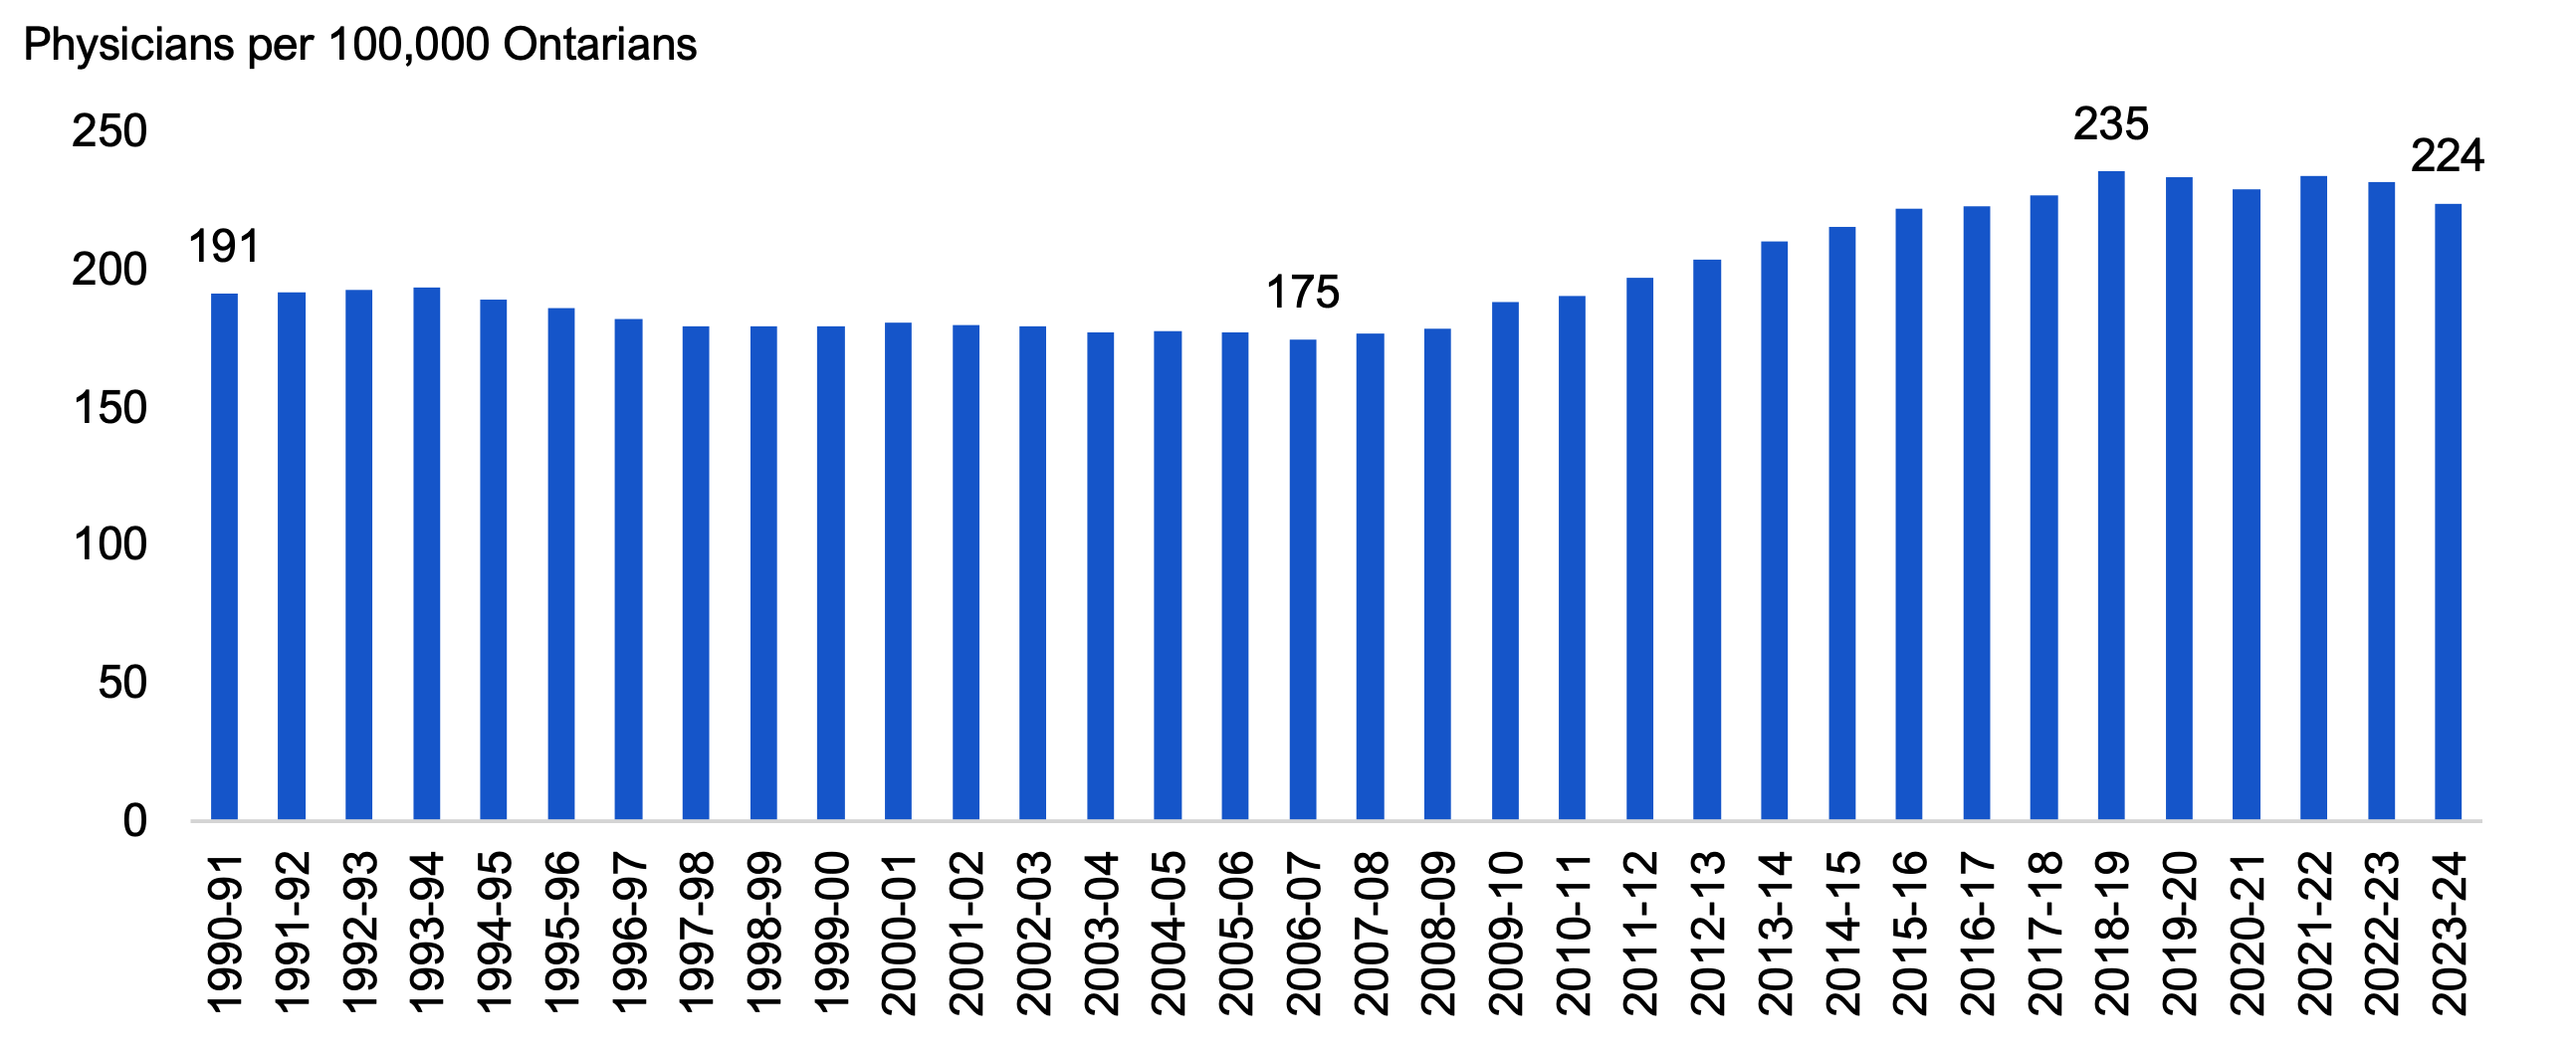
In 2023-24, there were 224 physicians for every 100,000 Ontarians. From 1990-91 to 2006-07, Ontario added 2,400 physicians and the number of physicians per 100,000 Ontarians declined from 191 to a low of 175 in 2006-07. However, following efforts to address shortages of physicians, Ontario added over 11,000 physicians from 2006-07 to 2018-19 and the number of physicians per 100,000 Ontarians reached a peak of 235 in 2018-19. From 2018-19 to 2023-24, the number of physicians per 100,000 residents declined to 224, as growth in the number of physicians slowed during the COVID-19 pandemic.
Figure 5.5 Number of physicians per 100,000 Ontarians, 1990-91 to 2023-24
Source: Statistics Canada and FAO analysis of CIHI National Physician Database Historical Utilization — Data Tables, 2023
Accessible version
| Fiscal Year | Physicians Per 100,000 Ontarians |
|---|---|
| 1990-91 | 191 |
| 1991-92 | 192 |
| 1992-93 | 192 |
| 1993-94 | 193 |
| 1994-95 | 189 |
| 1995-96 | 186 |
| 1996-97 | 182 |
| 1997-98 | 179 |
| 1998-99 | 179 |
| 1999-00 | 179 |
| 2000-01 | 180 |
| 2001-02 | 180 |
| 2002-03 | 179 |
| 2003-04 | 177 |
| 2004-05 | 178 |
| 2005-06 | 177 |
| 2006-07 | 175 |
| 2007-08 | 177 |
| 2008-09 | 178 |
| 2009-10 | 188 |
| 2010-11 | 190 |
| 2011-12 | 197 |
| 2012-13 | 203 |
| 2013-14 | 210 |
| 2014-15 | 215 |
| 2015-16 | 222 |
| 2016-17 | 223 |
| 2017-18 | 227 |
| 2018-19 | 235 |
| 2019-20 | 233 |
| 2020-21 | 229 |
| 2021-22 | 234 |
| 2022-23 | 231 |
| 2023-24 | 224 |
Long-term Care Beds
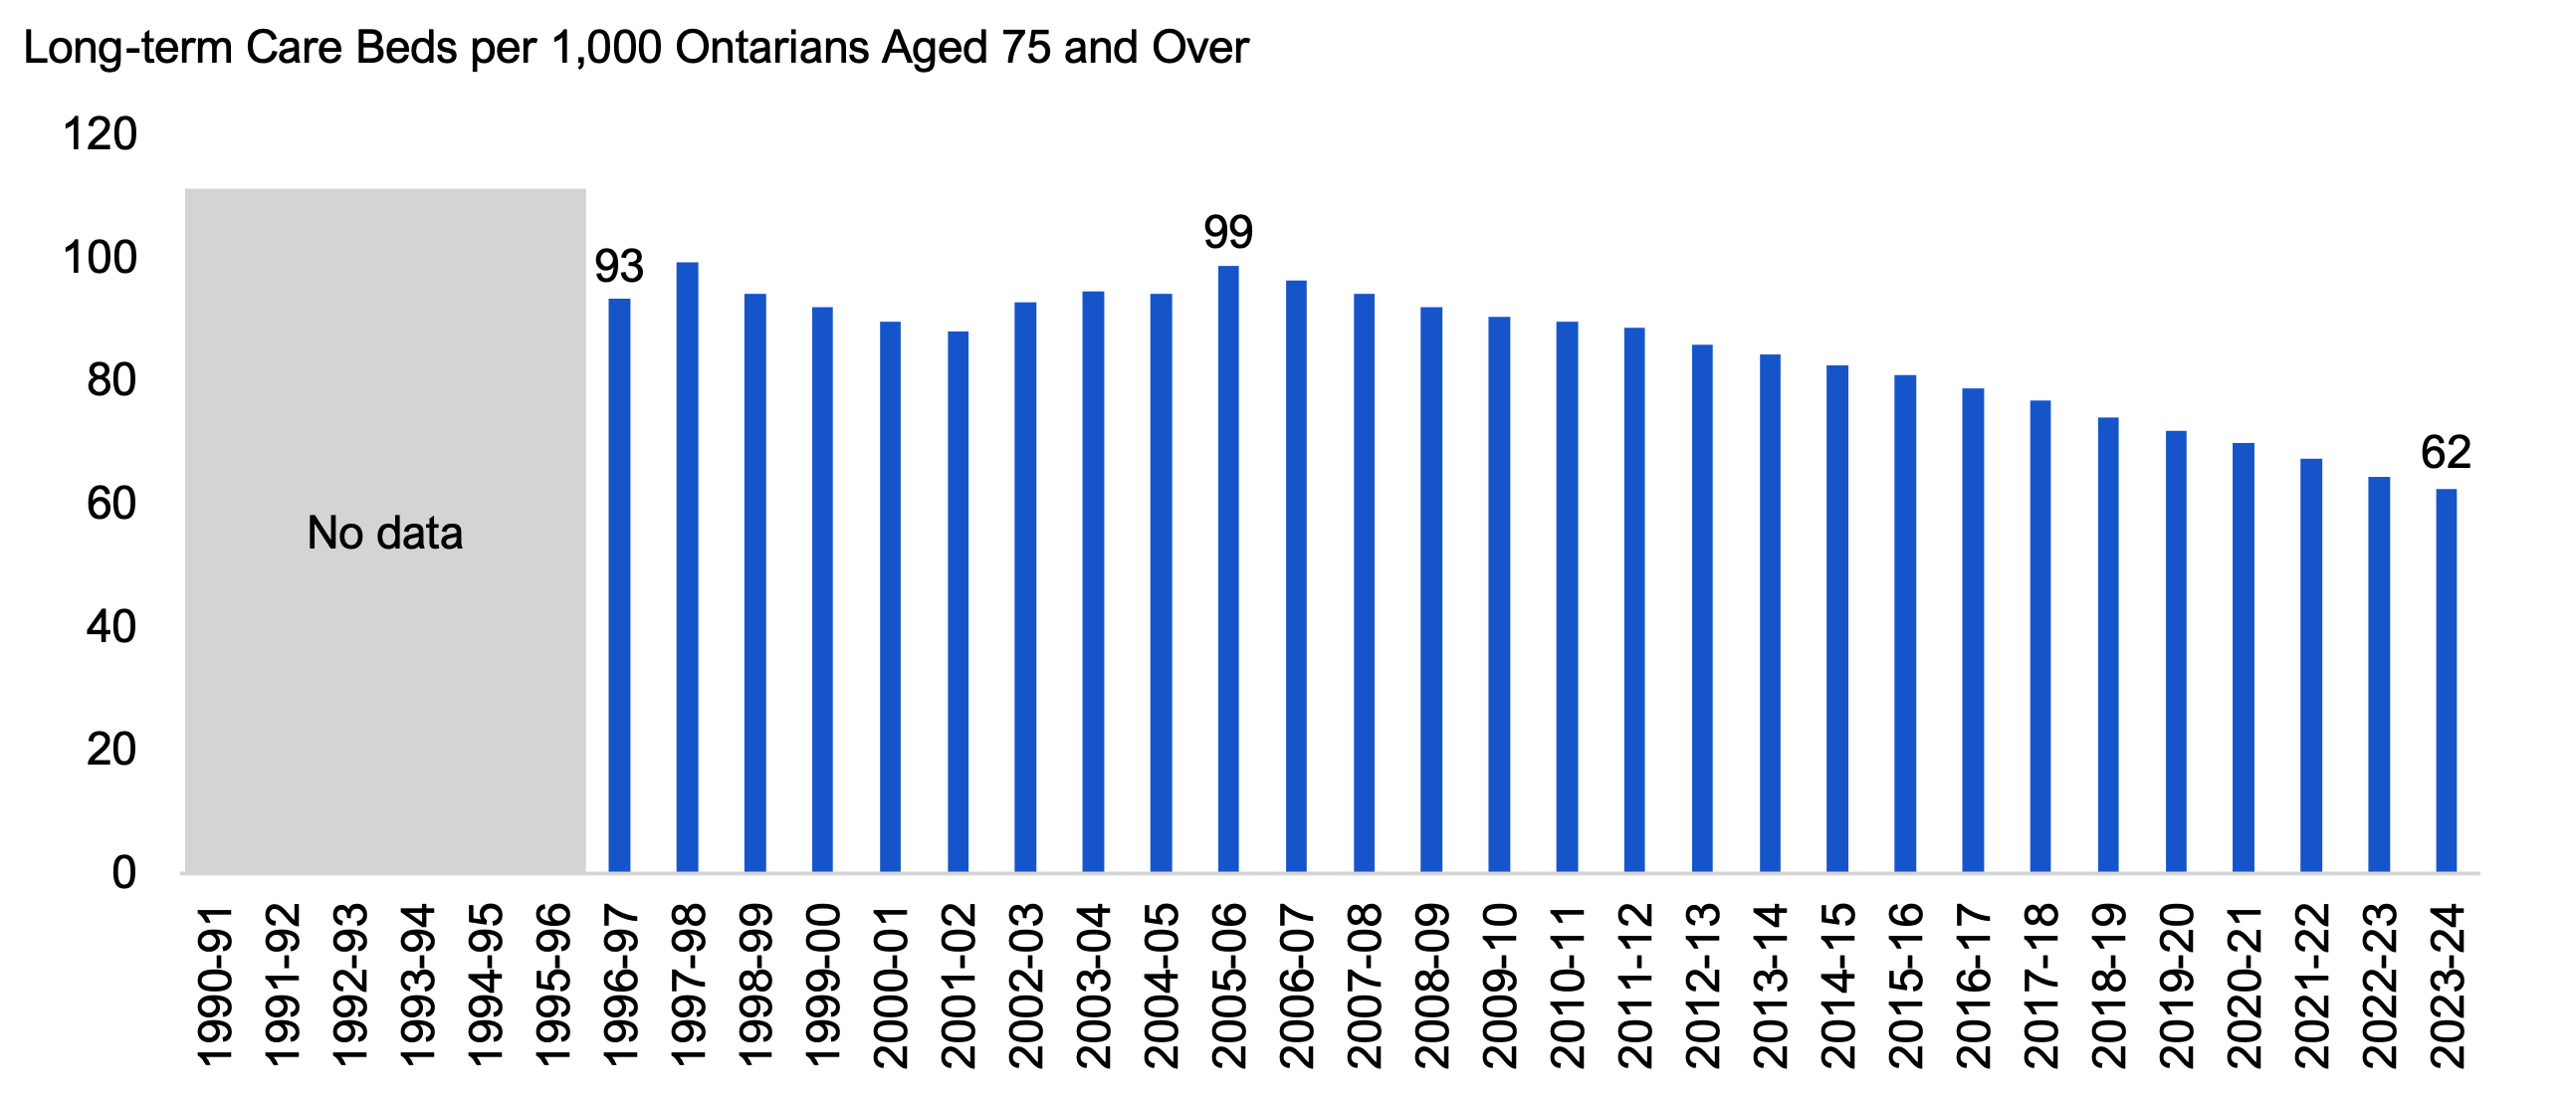
In 2023-24, there were 62 long-term care beds per 1,000 Ontarians aged 75 and over,[9] which was the lowest ratio of beds per population over the analysis period. From 1996-97 to 2005-06, the Province added over 23,000 new long-term care beds, which increased the number of beds per 1,000 Ontarians aged 75 and over to 99 in 2005-06. From 2005-06 to 2023-24, approximately 4,200 new long-term care beds were added. This slow growth in capacity, combined with accelerating growth in the population of Ontarians aged 75 and over, resulted in a steady decline in the number of long-term care beds per 1,000 Ontarians aged 75 and over, from 99 in 2005-06 to 62 in 2023-24.
Figure 5.6 Number of long-term care beds per 1,000 Ontarians aged 75 and over, 1996-97 to 2023-24
Source: FAO analysis of information provided by the Province, Statistics Canada and Hsu AT, Berta W, Coyte PC, Laporte A. Staffing in Ontario’s Long-Term Care Homes: Differences by Profit Status and Chain Ownership. Canadian Journal on Aging / La Revue canadienne du vieillissement. 2016;35(2):175-189. doi:10.1017/S071498081600019
Accessible version
| Fiscal Year | Long-term Care Beds Per 1,000 Ontarians Aged 75 and Over |
|---|---|
| 1990-91 | No Data |
| 1991-92 | No Data |
| 1992-93 | No Data |
| 1993-94 | No Data |
| 1994-95 | No Data |
| 1995-96 | No Data |
| 1996-97 | 93 |
| 1997-98 | 99 |
| 1998-99 | 94 |
| 1999-00 | 92 |
| 2000-01 | 90 |
| 2001-02 | 88 |
| 2002-03 | 93 |
| 2003-04 | 94 |
| 2004-05 | 94 |
| 2005-06 | 99 |
| 2006-07 | 96 |
| 2007-08 | 94 |
| 2008-09 | 92 |
| 2009-10 | 90 |
| 2010-11 | 90 |
| 2011-12 | 88 |
| 2012-13 | 86 |
| 2013-14 | 84 |
| 2014-15 | 82 |
| 2015-16 | 81 |
| 2016-17 | 79 |
| 2017-18 | 77 |
| 2018-19 | 74 |
| 2019-20 | 72 |
| 2020-21 | 70 |
| 2021-22 | 67 |
| 2022-23 | 64 |
| 2023-24 | 62 |
6. Education
Spending Trends
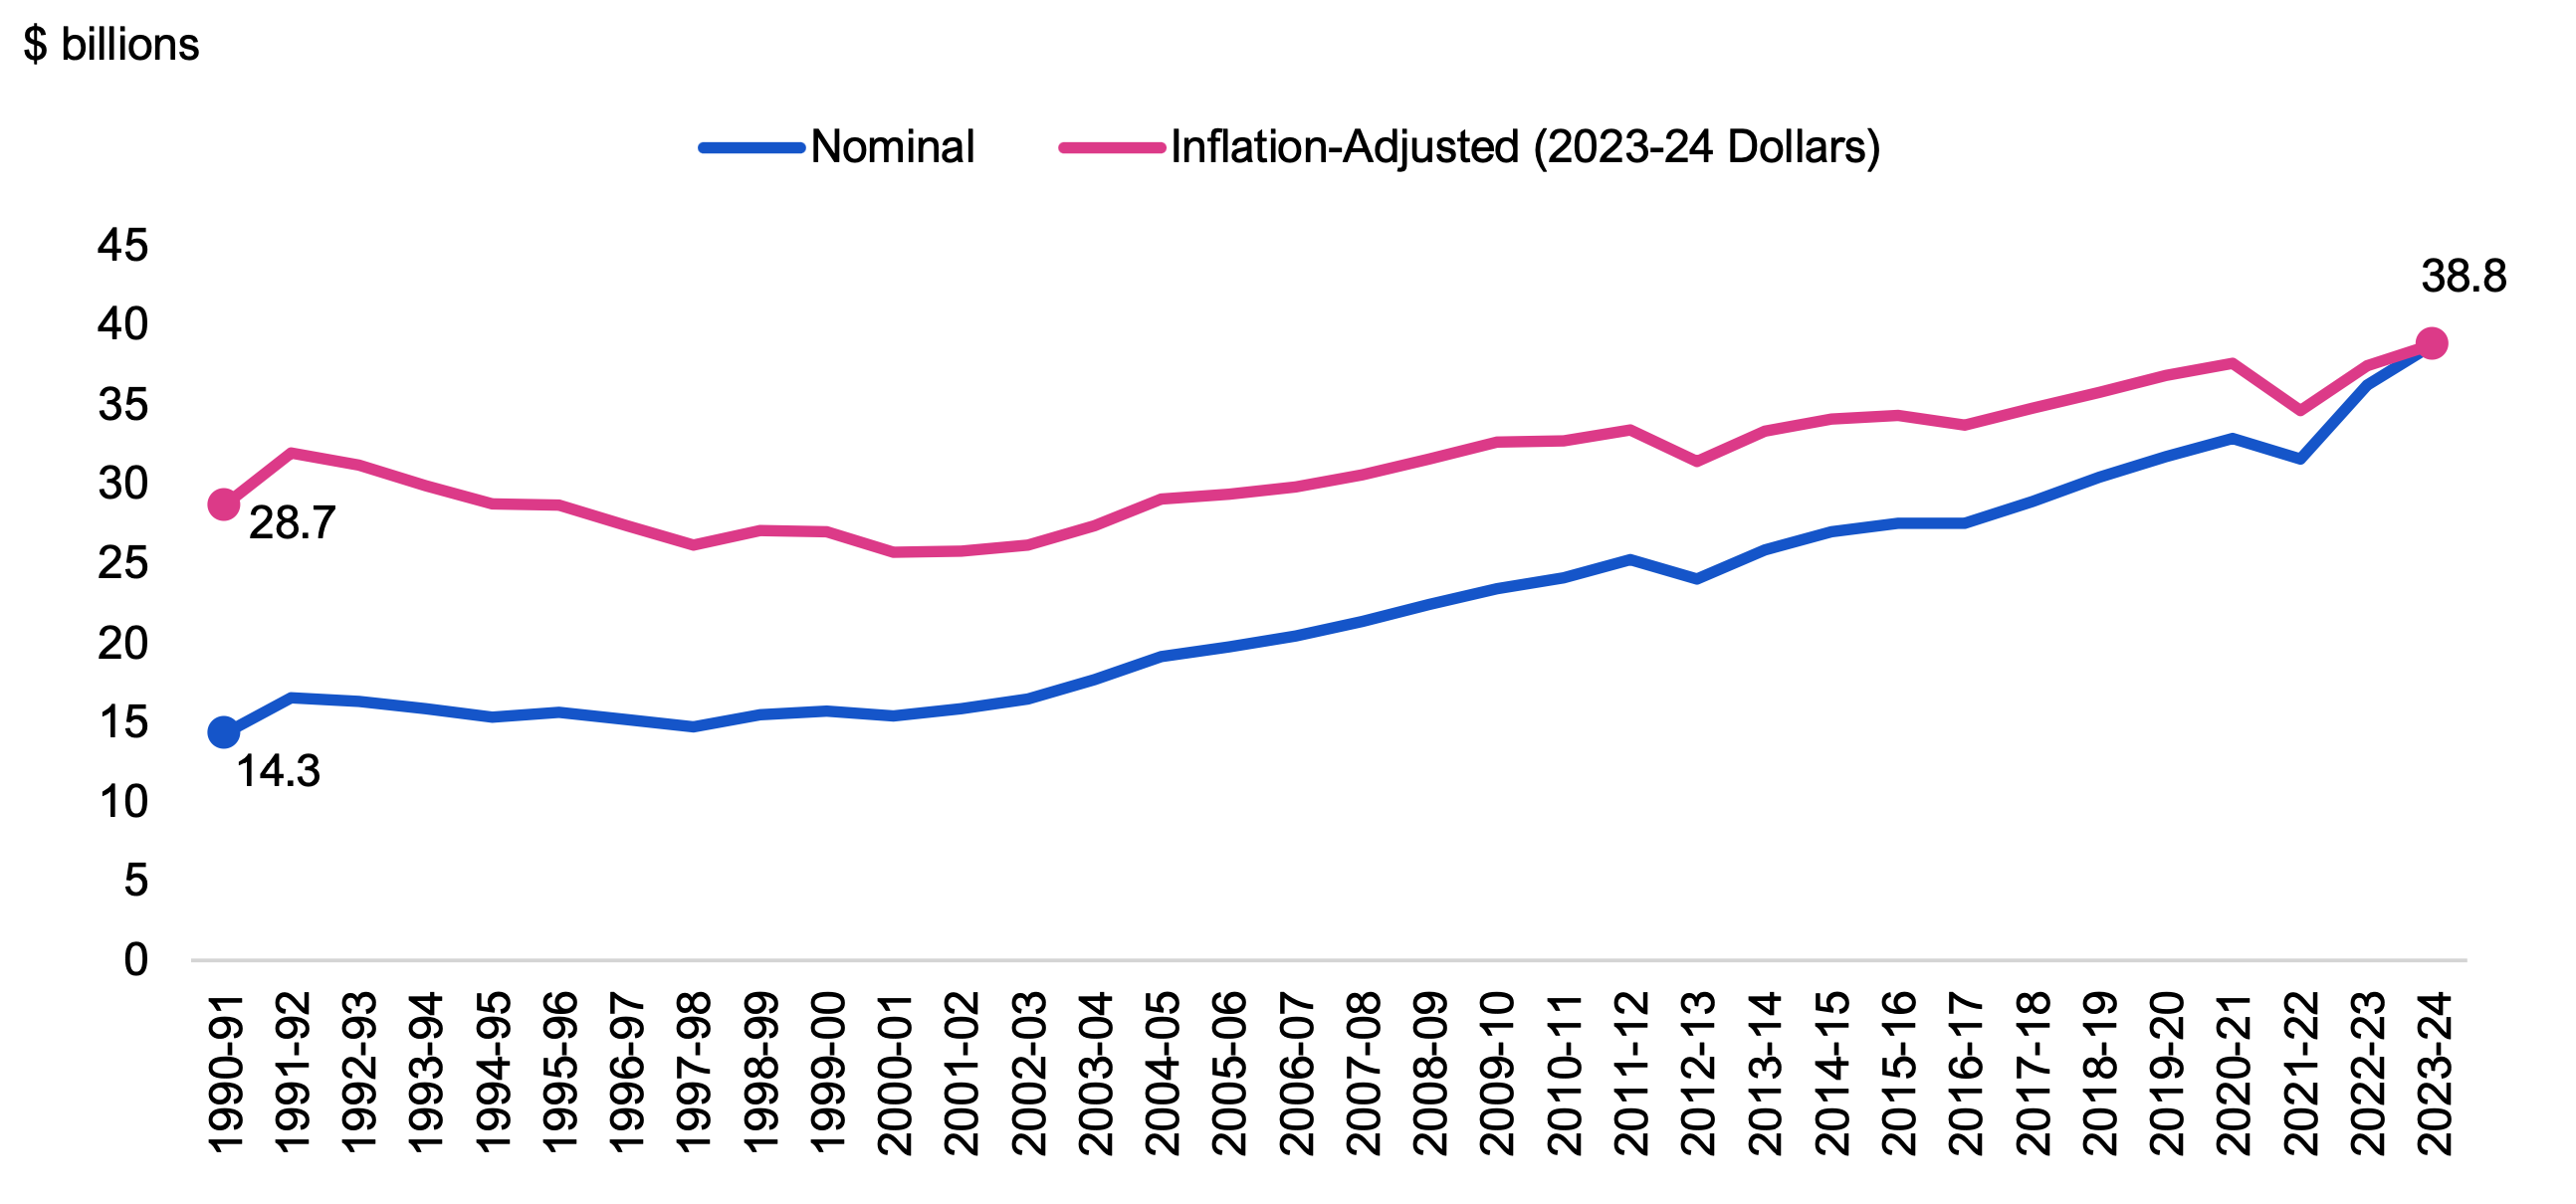
Education is the second largest sector in the government, accounting for 18.8 per cent of total spending in 2023-24. This sector primarily consists of spending on elementary and secondary education, and child care.[10] The FAO estimates education sector spending grew at an average annual rate of 3.1 per cent, increasing from $14.3 billion in 1990-91 to $38.8 billion in 2023-24. After adjusting for inflation, this sector’s spending grew at an average annual rate of 0.9 per cent from 1990-91 to 2023-24.
Figure 6.1 Education sector spending, nominal and inflation-adjusted, 1990-91 to 2023-24
Source: FAO calculations, Statistics Canada, Public Accounts of Ontario and FAO analysis of information provided by the Province.
Accessible version
| Fiscal Year | Nominal | Inflation-Adjusted (2023-24 Dollars) |
|---|---|---|
| 1990-91 | 14.3 | 28.7 |
| 1991-92 | 16.5 | 31.9 |
| 1992-93 | 16.3 | 31.2 |
| 1993-94 | 15.9 | 29.9 |
| 1994-95 | 15.3 | 28.8 |
| 1995-96 | 15.6 | 28.7 |
| 1996-97 | 15.2 | 27.4 |
| 1997-98 | 14.8 | 26.2 |
| 1998-99 | 15.5 | 27.1 |
| 1999-00 | 15.7 | 27.0 |
| 2000-01 | 15.4 | 25.7 |
| 2001-02 | 15.9 | 25.8 |
| 2002-03 | 16.5 | 26.2 |
| 2003-04 | 17.7 | 27.3 |
| 2004-05 | 19.1 | 29.1 |
| 2005-06 | 19.8 | 29.4 |
| 2006-07 | 20.4 | 29.8 |
| 2007-08 | 21.3 | 30.6 |
| 2008-09 | 22.4 | 31.6 |
| 2009-10 | 23.4 | 32.6 |
| 2010-11 | 24.1 | 32.7 |
| 2011-12 | 25.2 | 33.4 |
| 2012-13 | 24.0 | 31.4 |
| 2013-14 | 25.8 | 33.3 |
| 2014-15 | 27.0 | 34.1 |
| 2015-16 | 27.5 | 34.3 |
| 2016-17 | 27.5 | 33.7 |
| 2017-18 | 28.9 | 34.8 |
| 2018-19 | 30.4 | 35.8 |
| 2019-20 | 31.7 | 36.8 |
| 2020-21 | 32.9 | 37.6 |
| 2021-22 | 31.6 | 34.6 |
| 2022-23 | 36.2 | 37.4 |
| 2023-24 | 38.8 | 38.8 |
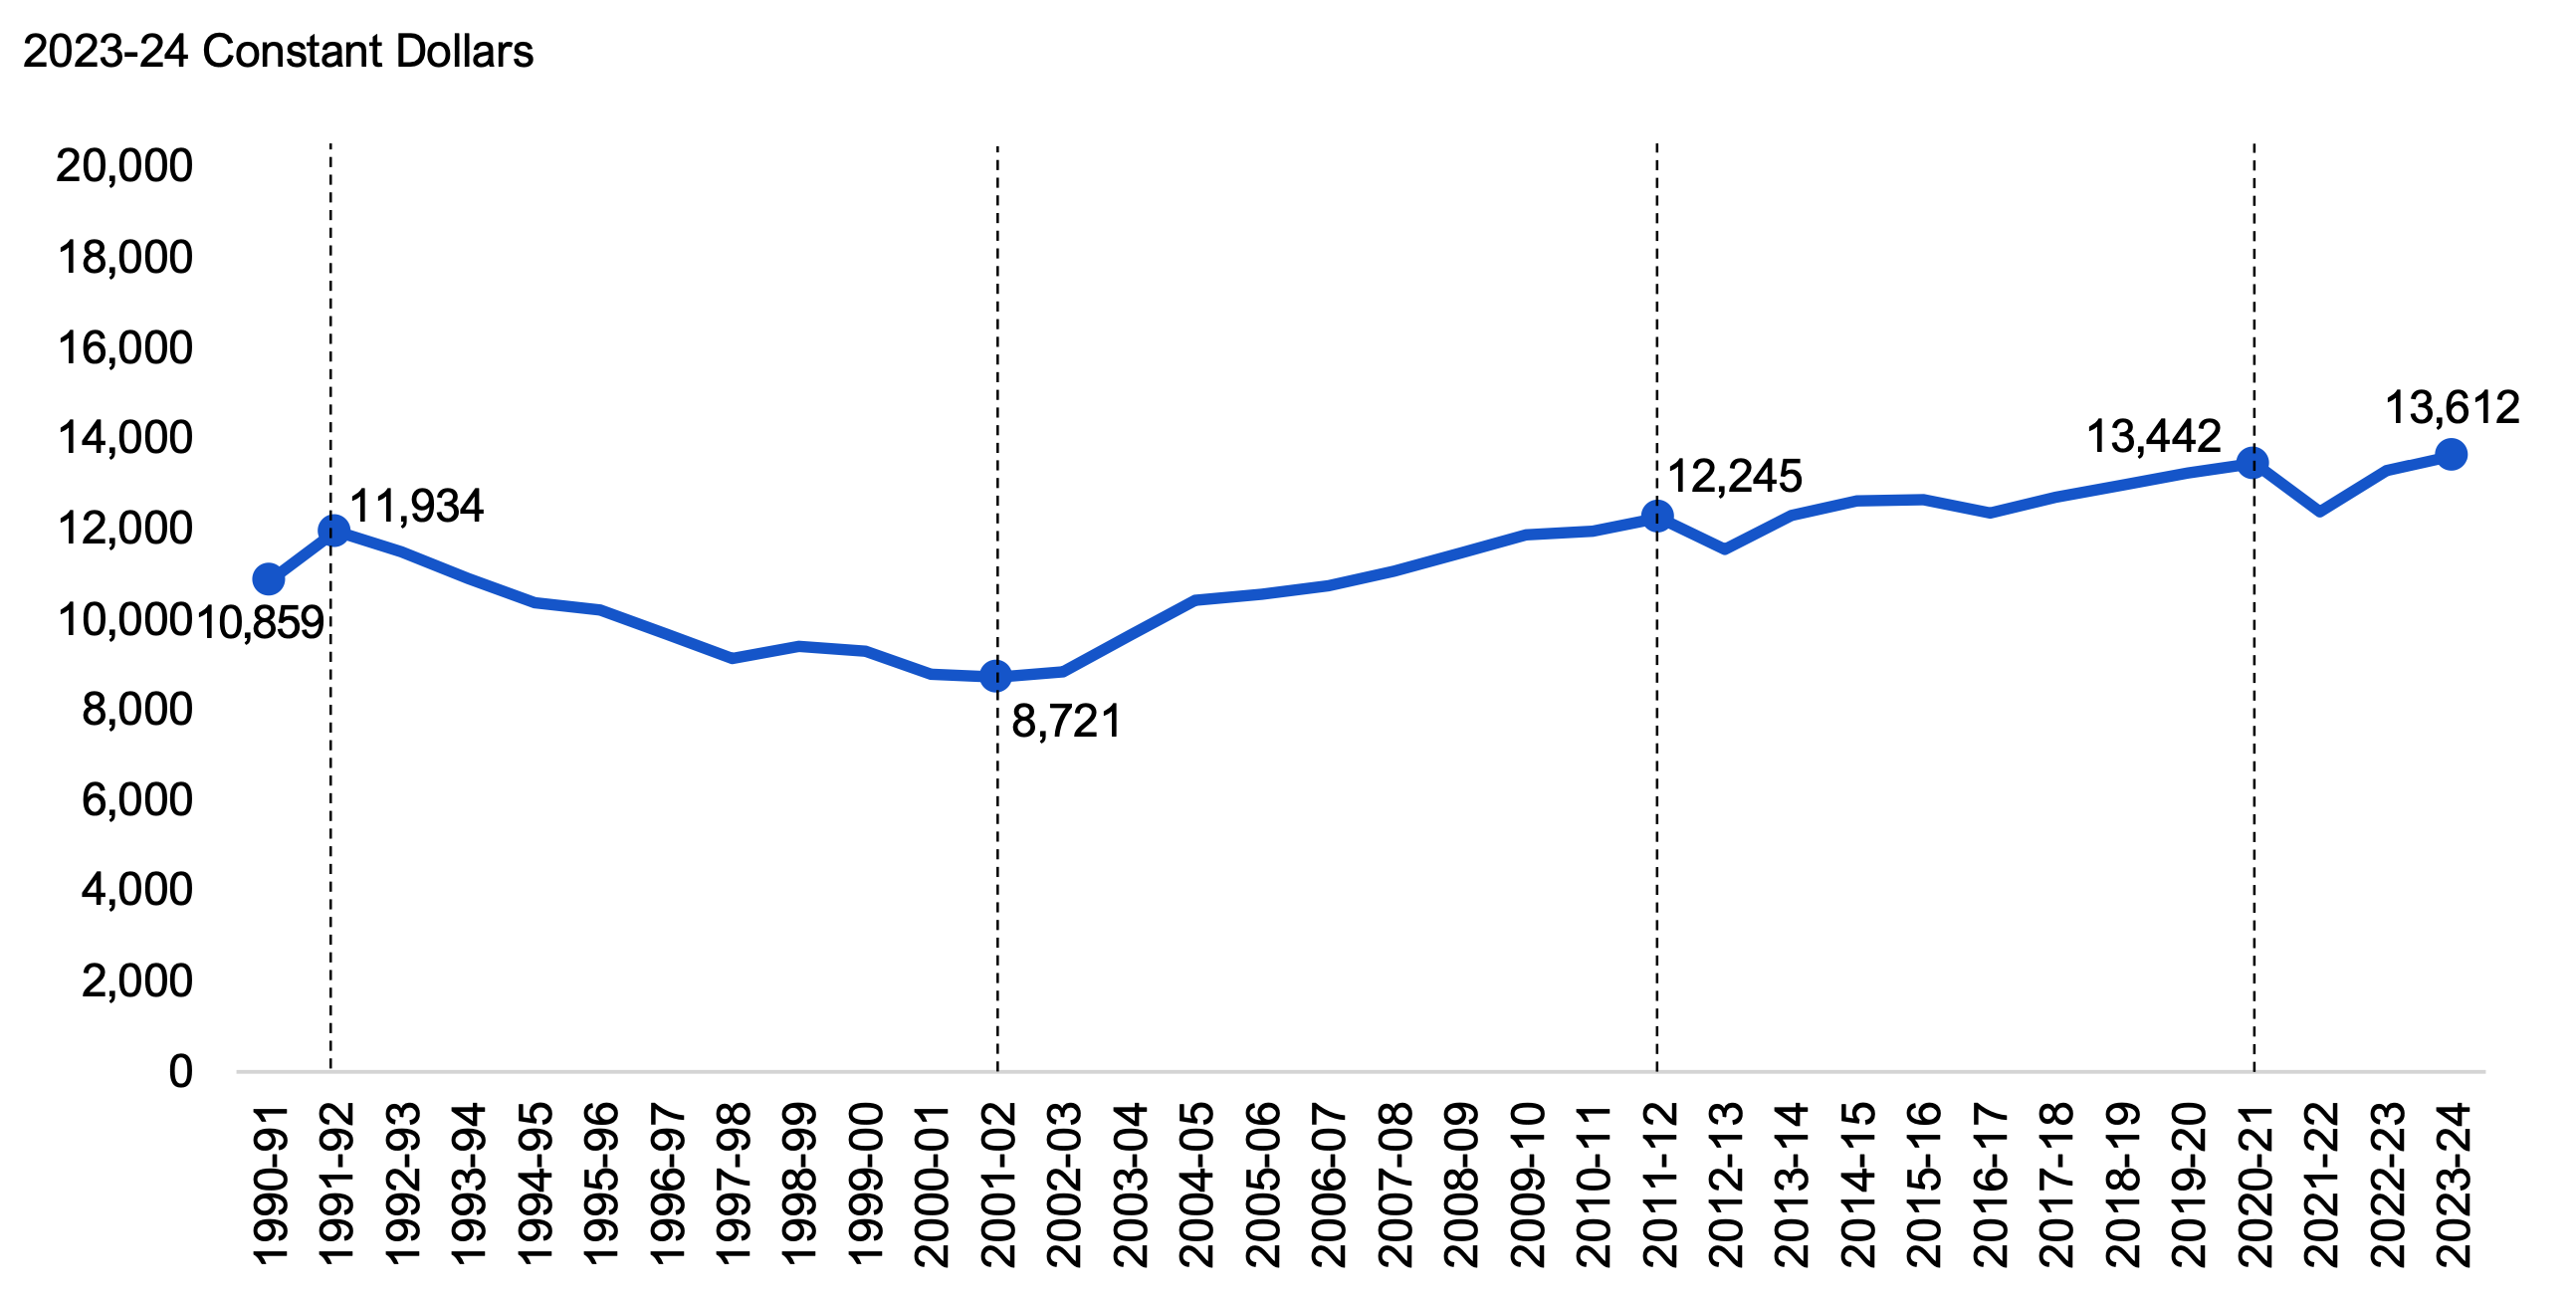
In addition to inflation, an important cost driver of education sector spending is the school- and child care-aged population.[11] The following presents education sector spending on an inflation-adjusted (i.e., real) per child/youth basis to provide a better indication of the impact that education sector spending has on service levels over time. The FAO estimates real per child/youth education sector spending increased at an average annual rate of 0.7 per cent from $10,859 per child/youth in 1990-91 to $13,612 per child/youth in 2023-24.
Figure 6.2 Education sector spending per school- and child care-aged child and youth, inflation-adjusted, 1990-91 to 2023-24
Note: From 1990-91 to 2002-03, the school- and child care-aged population reflects the population of 0- to 18-year-olds. After the phase-out of the Ontario Academic Credit (OAC) fifth year of secondary school education, beginning in 2003-04, this age group reflects the population of 0- to 17-year-olds.
Source: FAO calculations, Public Accounts of Ontario, Statistics Canada and FAO analysis of information provided by the Province.
Accessible version
| Fiscal Year | Real Per Child/Youth Spending |
|---|---|
| 1990-91 | 10,859 |
| 1991-92 | 11,934 |
| 1992-93 | 11,485 |
| 1993-94 | 10,904 |
| 1994-95 | 10,364 |
| 1995-96 | 10,215 |
| 1996-97 | 9,658 |
| 1997-98 | 9,147 |
| 1998-99 | 9,396 |
| 1999-00 | 9,295 |
| 2000-01 | 8,780 |
| 2001-02 | 8,721 |
| 2002-03 | 8,836 |
| 2003-04 | 9,652 |
| 2004-05 | 10,424 |
| 2005-06 | 10,559 |
| 2006-07 | 10,745 |
| 2007-08 | 11,054 |
| 2008-09 | 11,462 |
| 2009-10 | 11,876 |
| 2010-11 | 11,947 |
| 2011-12 | 12,245 |
| 2012-13 | 11,547 |
| 2013-14 | 12,296 |
| 2014-15 | 12,604 |
| 2015-16 | 12,653 |
| 2016-17 | 12,361 |
| 2017-18 | 12,692 |
| 2018-19 | 12,968 |
| 2019-20 | 13,219 |
| 2020-21 | 13,442 |
| 2021-22 | 12,367 |
| 2022-23 | 13,294 |
| 2023-24 | 13,612 |
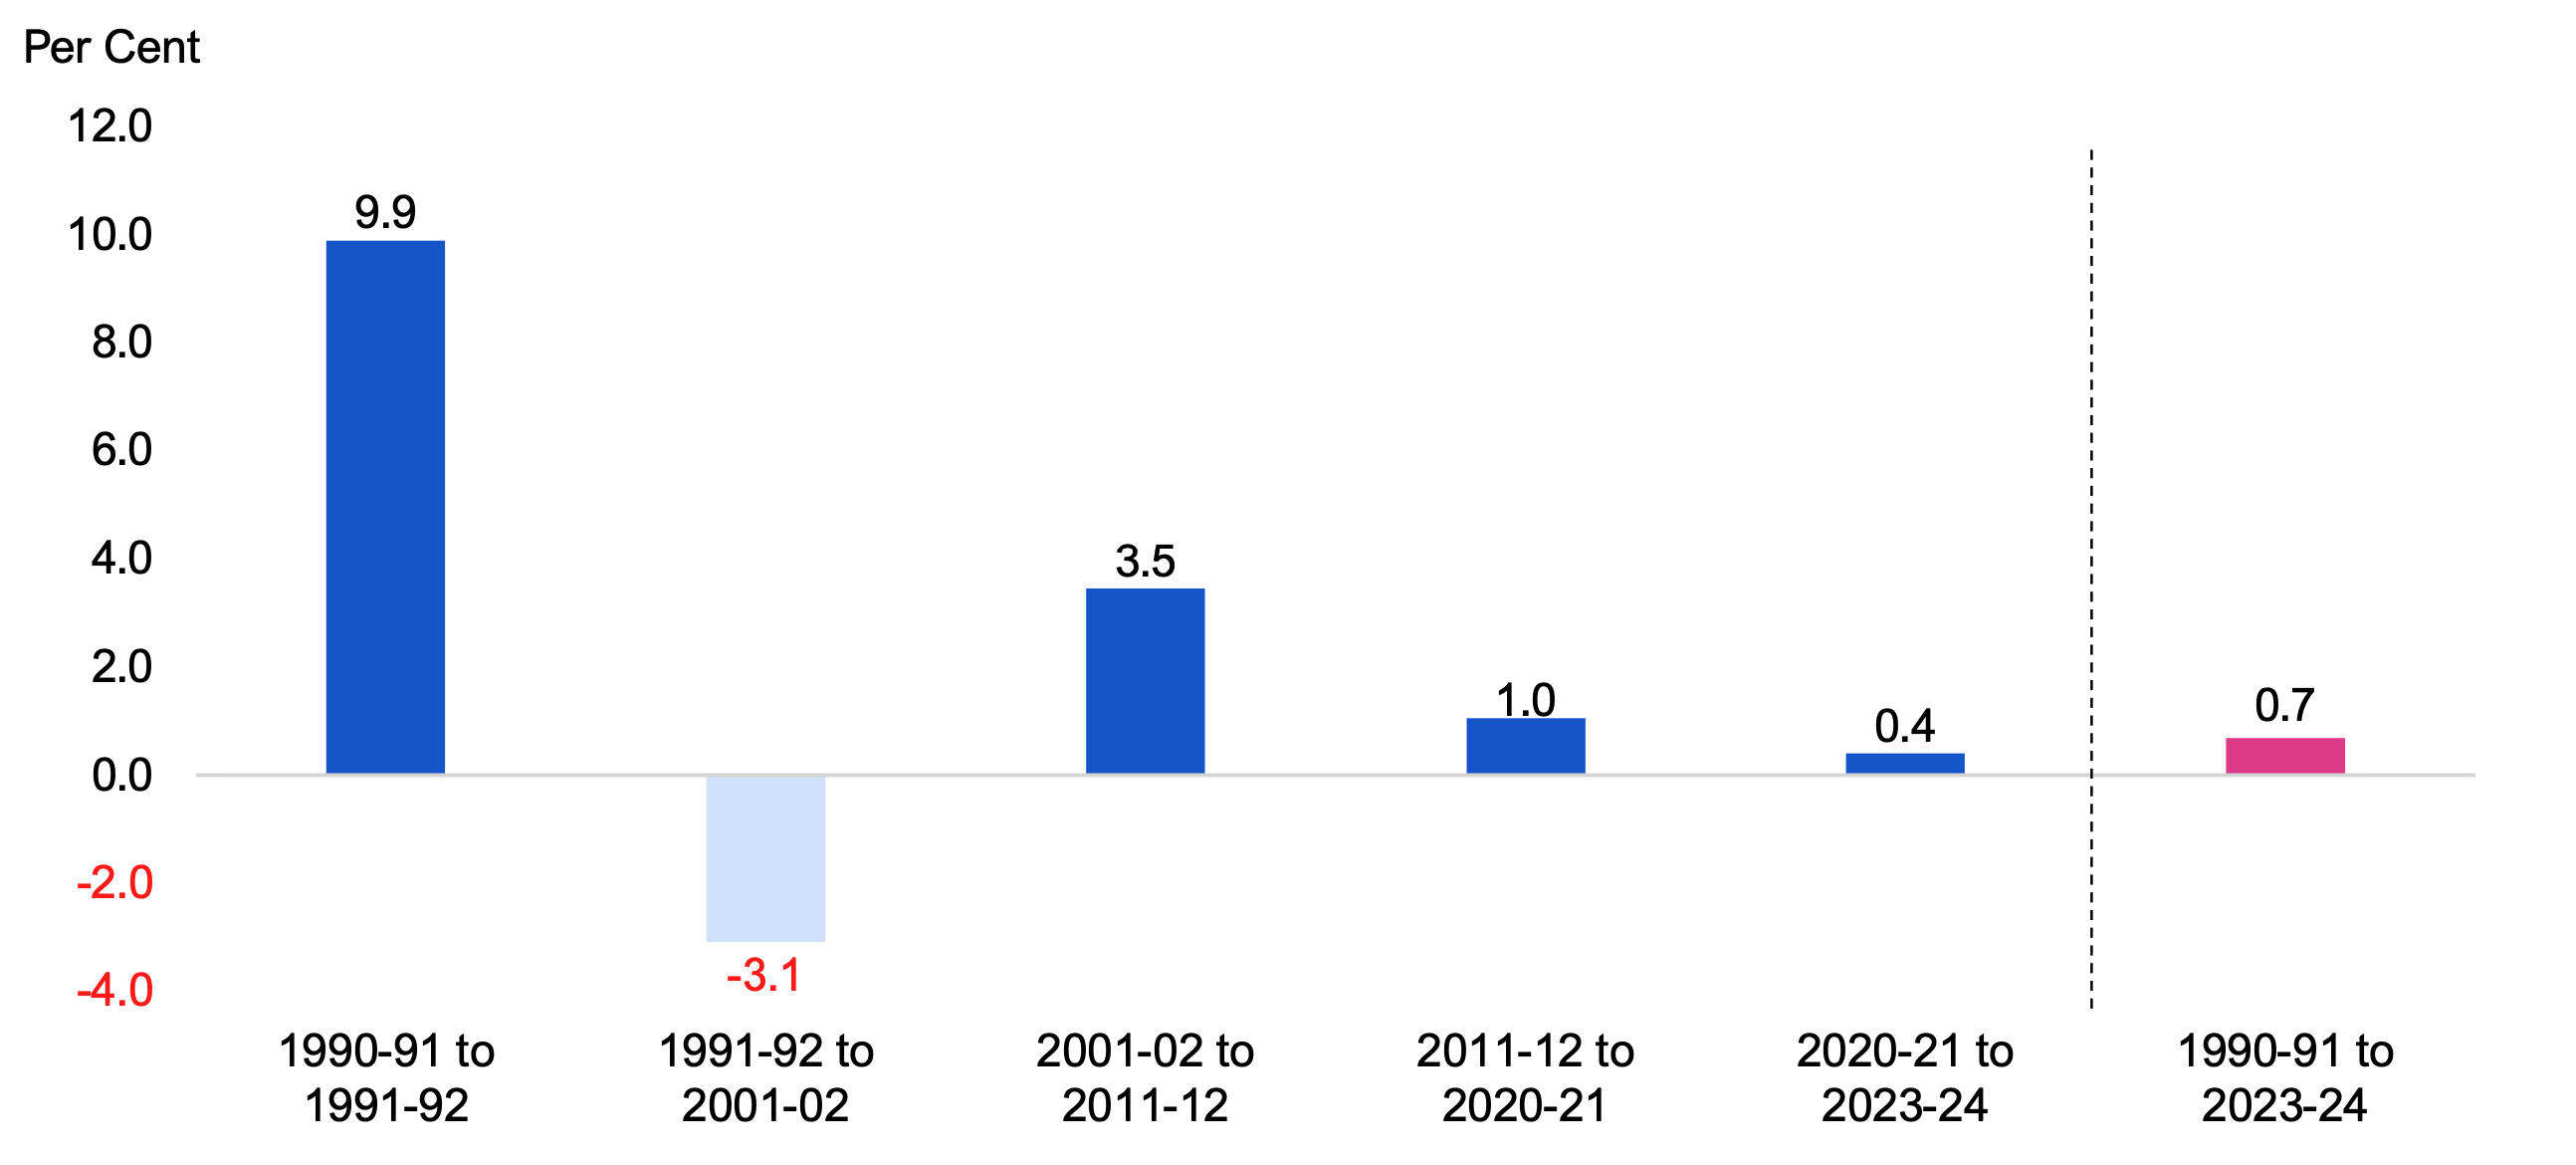
Based on real per child/youth spending, the FAO has identified five distinct periods of education sector spending trends between 1990-91 to 2023-24:
1990-91 to 1991-92
From 1990-91 to 1991-92, real spending per child/youth increased by 9.9 per cent from $10,859 in 1990-91 to $11,934 in 1991-92. This increase was primarily due to increased funding for school boards and contributions to the Ontario Teachers’ Pension Plan.
1991-92 to 2001-02
From 1991-92 to 2001-02, real spending per child/youth decreased from $11,934 in 1991-92 to $8,721 in 2001-02 at an average annual rate of -3.1 per cent. During this period, the government introduced fiscal restraint measures that kept growth in nominal education spending relatively flat while the school- and child care-aged population grew significantly (see Appendix B).
2001-02 to 2011-12
From 2001-02 to 2011-12, real spending per child/youth grew from $8,721 to $12,245 at an average annual rate of 3.5 per cent. This growth was driven by government policy introduced in 2004 to cap class sizes at 20 students for Junior Kindergarten (JK) through Grade 3. Furthermore, the Province launched the Best Start plan in 2005 to enhance early childhood education and add 25,000 new child care spaces.
2011-12 to 2020-21
From 2011-12 to 2020-21, real spending per child/youth grew from $12,245 to $13,442 at an average annual rate of 1.0 per cent. This period was characterized by increased spending in child care and the implementation of Full Day Kindergarten in 2014-15. This increased spending was partially offset by slower growth in elementary and secondary education spending.
2020-21 to 2023-24
From 2020-21 to 2023-24, real spending per child/youth fluctuated but ultimately increased at an average annual rate of 0.4 per cent, to $13,612 in 2023-24. Spending initially declined in 2021-22 due to the expiry of time-limited spending related to the COVID-19 pandemic, before increasing in 2022-23, largely due to the introduction of the Canada Wide Early Learning and Child Care Agreement (CWELCC).[12] Additionally, in 2022-23 and 2023-24, the Province recorded expenses for retroactive compensation related to Bill 124, the Protecting a Sustainable Public Sector for Future Generations Act, 2019.
Figure 6.3 Average annual growth in real per child/youth education sector spending, 1990-91 to 2023-24
Note: From 1990-91 to 2002-03, the school- and child care-aged population reflects the population of 0- to 18-year-olds. After the phase-out of the Ontario Academic Credit (OAC) fifth year of secondary school education, beginning in 2003-04, this age group reflects the population of 0- to 17-year-olds
Source: FAO calculations, Public Accounts of Ontario, Statistics Canada and FAO analysis of information provided by the Province.
Accessible version
| Fiscal Years | 1990-91 to 1991-92 | 1991-92 to 2001-02 | 2001-02 to 2011-12 | 2011-12 to 2020-21 | 2020-21 to 2023-24 | 1990-91 to 2023-24 |
|---|---|---|---|---|---|---|
| Average Annual Growth | 9.9 | -3.1 | 3.5 | 1.0 | 0.4 | 0.7 |
Select Service Levels
In this section, the FAO analyzes two key service level trends: average number of students per teacher and the number of licensed child care centre spaces per child care-aged population. There are many other measures of education sector service levels and performance. For more information, see FAO, Ontario School Boards: Enrolment, Finances and Student Outcomes; Ministry of Education, Ontario’s Early Years and Child Care Annual Report 2024; and EQAO, EQAO Assessment Results for 2023–2024 School Year.
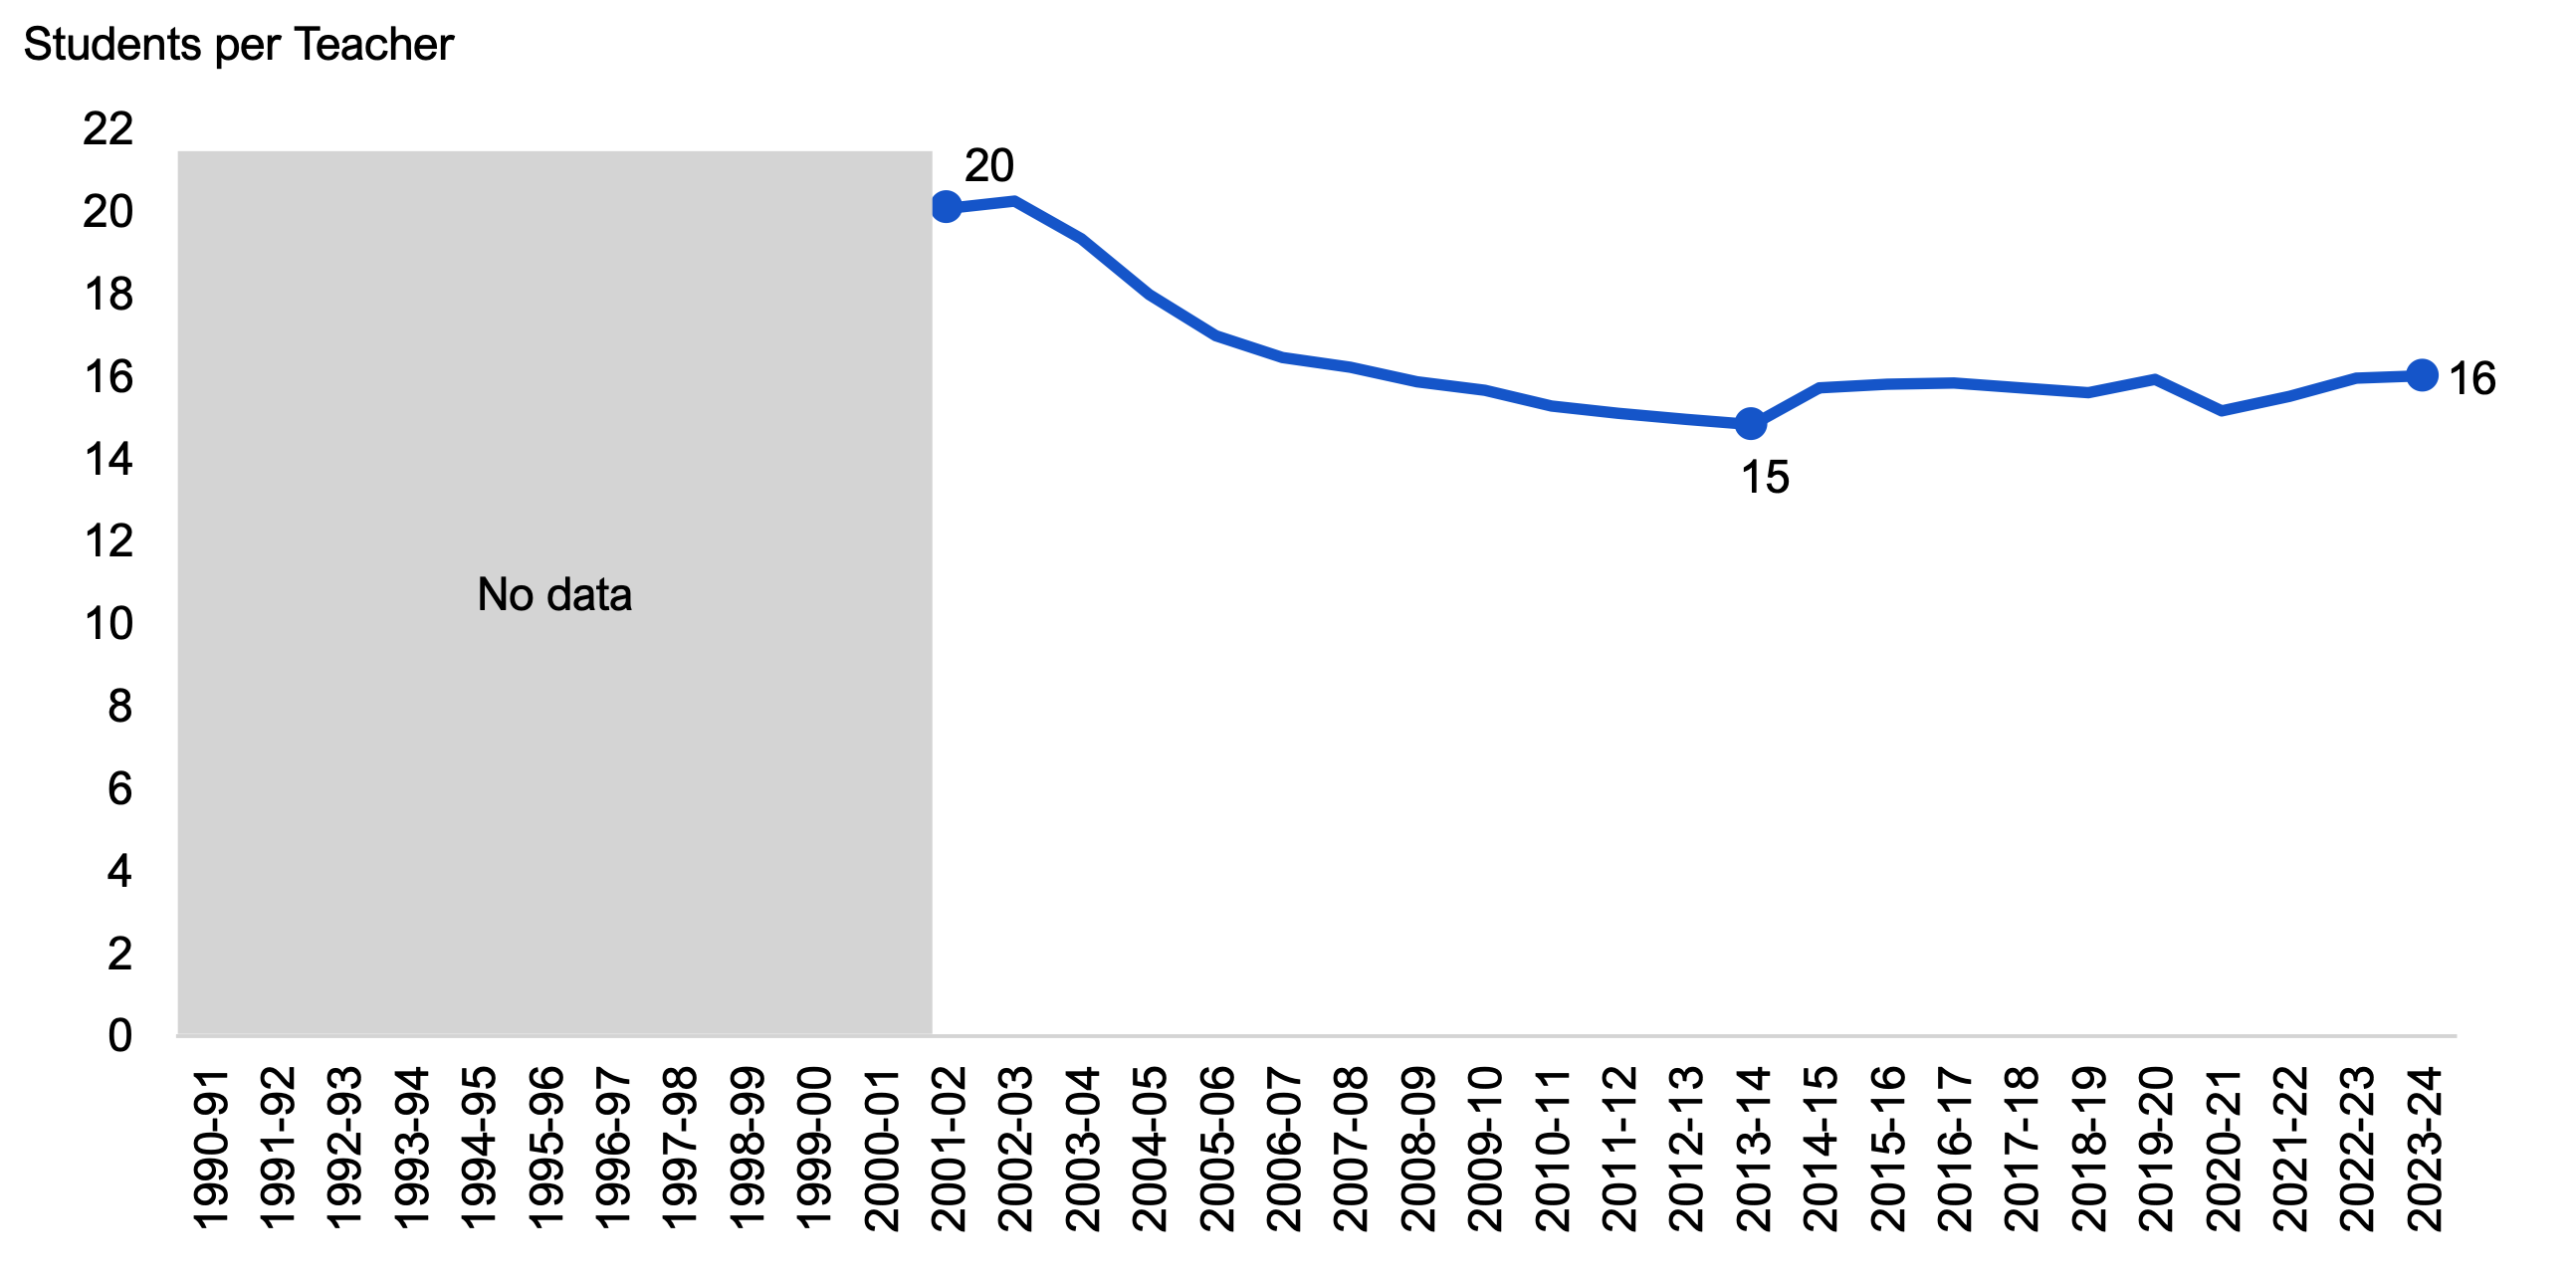
Student-to-Teacher Ratio
Over the period from 2001-02 to 2023-24, the student-to-teacher ratio fell from 20 in 2001-02 to 16 in 2023-24.[13] The ratio began to decline steeply in 2004-05 as a result of measures to reduce class sizes announced in 2004-05 and reached a low of 15 in 2013-14. After 2013-14, the ratio remained relatively stable, with a student-to-teacher ratio of 16 in 2023-24.
Figure 6.4 Average number of students per teacher in Ontario, 2001-02 to 2023-24
Note: The student-to-teacher ratio reflects teacher FTEs for the 2010-11 to 2023-24 school years. For 2001-02 to 2009-10, the student-to-teacher ratio is an FAO estimate based on Statistics Canada salaried education workers data.
Source: Statistics Canada and FAO analysis of information provided by the Province.
Accessible version
| Fiscal Year | Students Per Teacher |
|---|---|
| 1990-91 | No Data |
| 1991-92 | No Data |
| 1992-93 | No Data |
| 1993-94 | No Data |
| 1994-95 | No Data |
| 1995-96 | No Data |
| 1996-97 | No Data |
| 1997-98 | No Data |
| 1998-99 | No Data |
| 1999-00 | No Data |
| 2000-01 | No Data |
| 2001-02 | 20 |
| 2002-03 | 20 |
| 2003-04 | 19 |
| 2004-05 | 18 |
| 2005-06 | 17 |
| 2006-07 | 16 |
| 2007-08 | 16 |
| 2008-09 | 16 |
| 2009-10 | 16 |
| 2010-11 | 15 |
| 2011-12 | 15 |
| 2012-13 | 15 |
| 2013-14 | 15 |
| 2014-15 | 16 |
| 2015-16 | 16 |
| 2016-17 | 16 |
| 2017-18 | 16 |
| 2018-19 | 16 |
| 2019-20 | 16 |
| 2020-21 | 15 |
| 2021-22 | 16 |
| 2022-23 | 16 |
| 2023-24 | 16 |
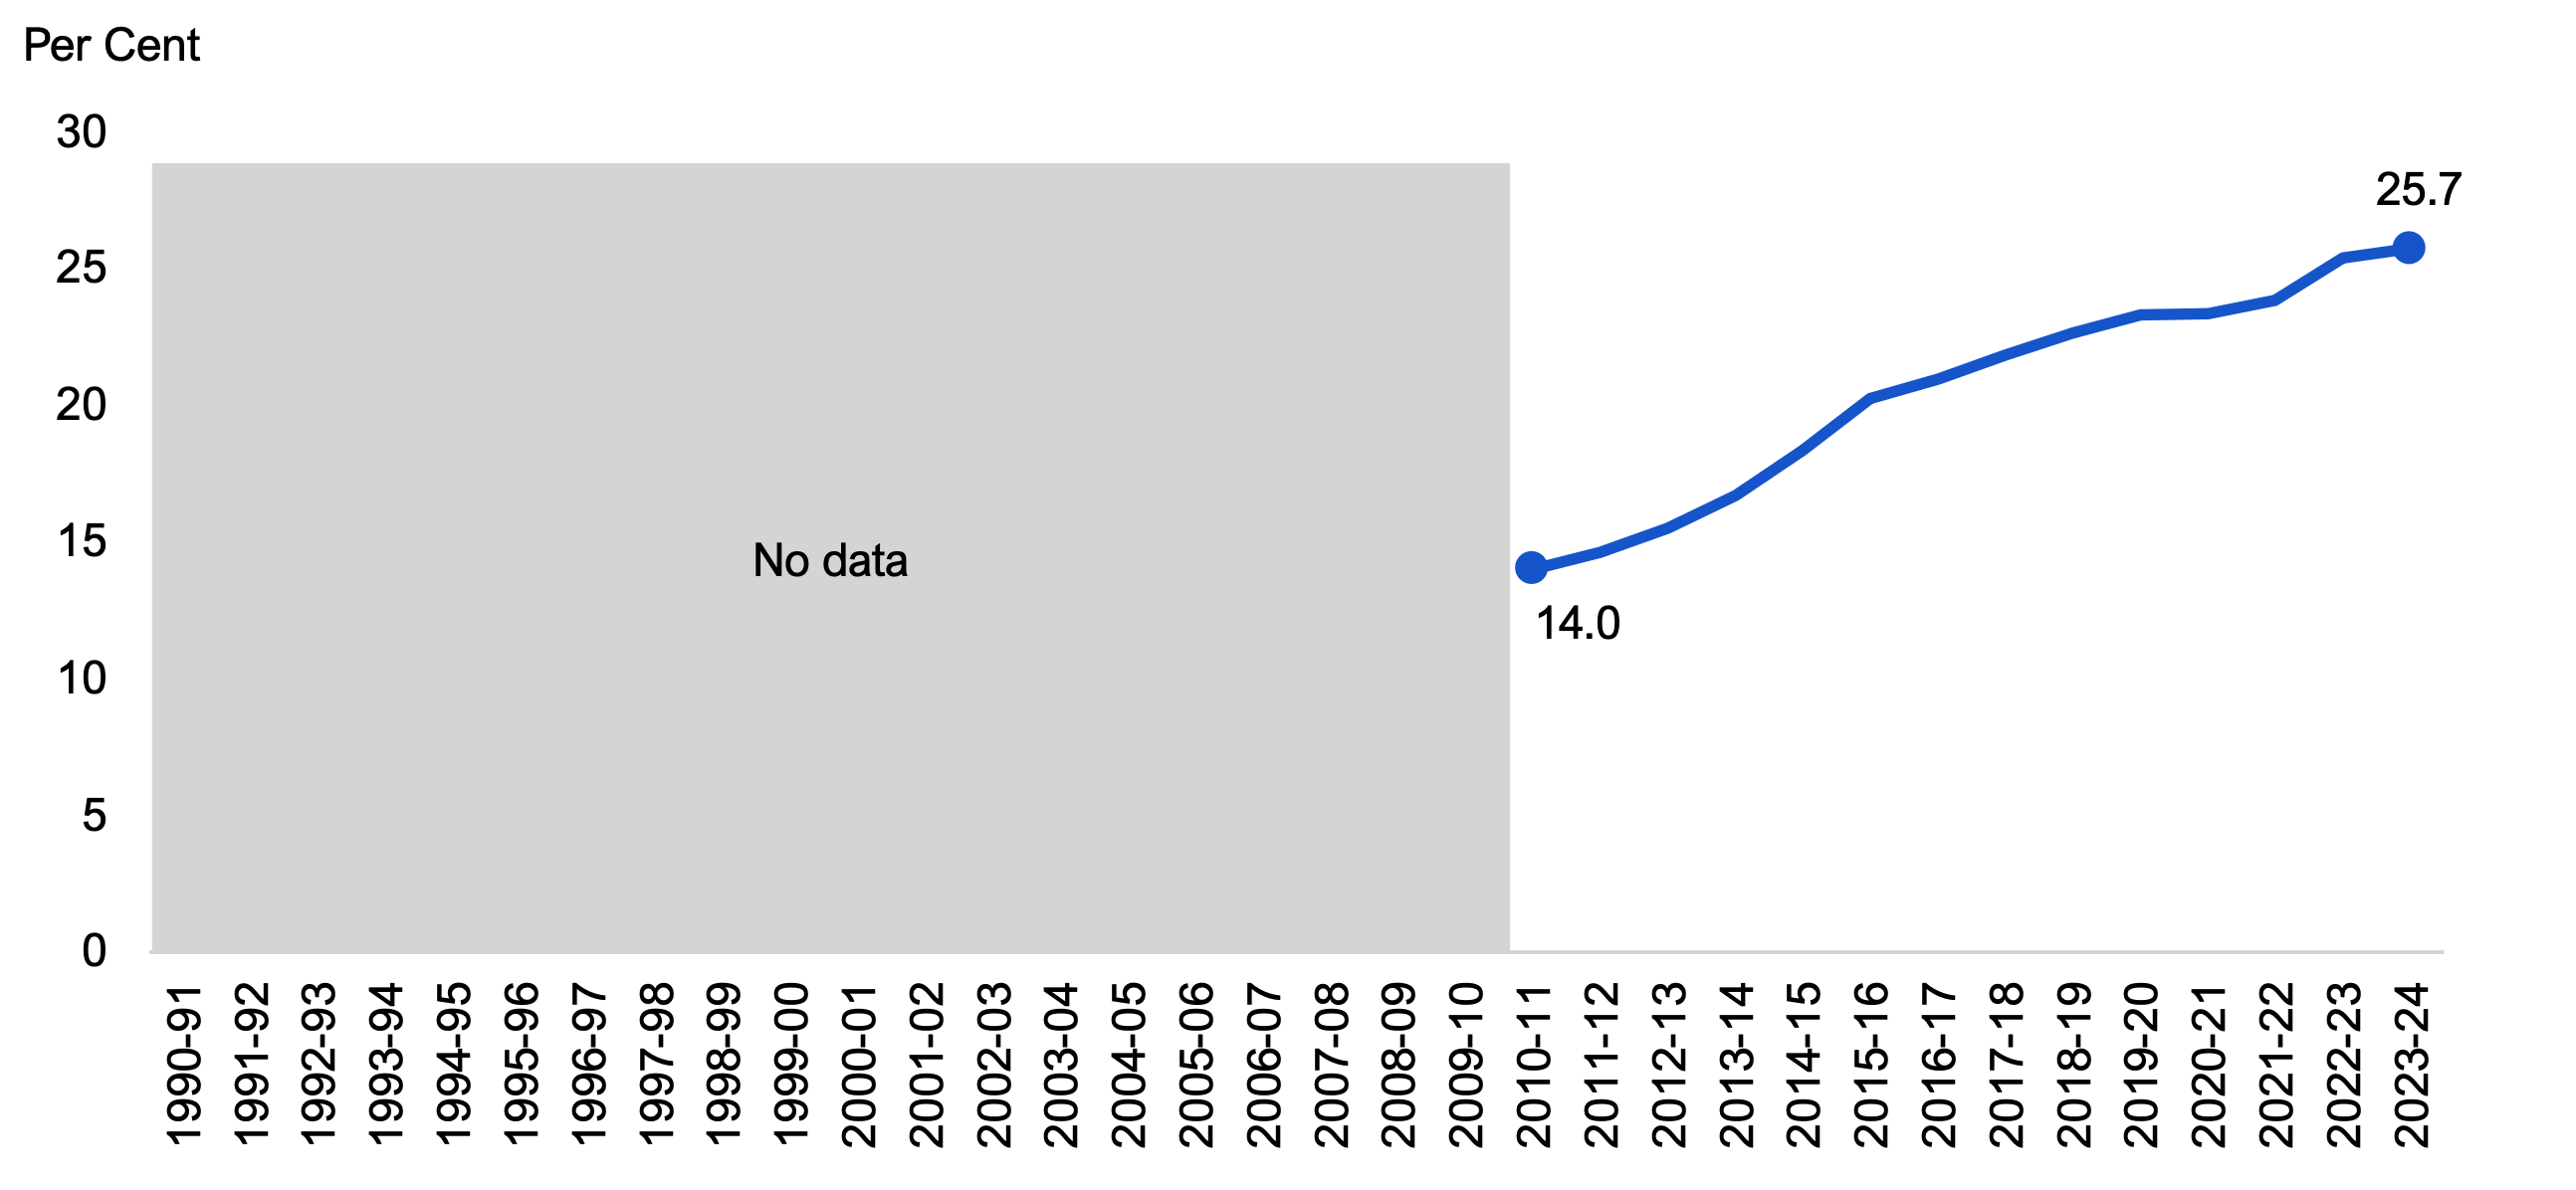
Child Care Spaces
From 2010-11 to 2023-24, growth in the number of licensed child care spaces in Ontario has significantly outpaced growth in the child care-aged population. Over this period, the number of licensed child care centre spaces grew at an average annual rate of 5.3 per cent compared to average annual growth in the child care-aged population of 0.5 per cent. Consequently, the number of licensed child care centre spaces as a share of the child care-aged population increased from 14.0 per cent in 2010-11 to 25.7 per cent in 2023-24.
Figure 6.5 Licensed child care centre spaces as a share of the child care-aged population, 2010-11 to 2023-24
Source: FAO calculations, Statistics Canada and FAO analysis of information provided by the Province.
Accessible version
| Fiscal Year | Licensed Child Care Centre Spaces as a Share of the Child Care-aged Population |
|---|---|
| 1990-91 | No Data |
| 1991-92 | No Data |
| 1992-93 | No Data |
| 1993-94 | No Data |
| 1994-95 | No Data |
| 1995-96 | No Data |
| 1996-97 | No Data |
| 1997-98 | No Data |
| 1998-99 | No Data |
| 1999-00 | No Data |
| 2000-01 | No Data |
| 2001-02 | No Data |
| 2002-03 | No Data |
| 2003-04 | No Data |
| 2004-05 | No Data |
| 2005-06 | No Data |
| 2006-07 | No Data |
| 2007-08 | No Data |
| 2008-09 | No Data |
| 2009-10 | No Data |
| 2010-11 | 14.0 |
| 2011-12 | 14.6 |
| 2012-13 | 15.5 |
| 2013-14 | 16.7 |
| 2014-15 | 18.4 |
| 2015-16 | 20.3 |
| 2016-17 | 21.0 |
| 2017-18 | 21.9 |
| 2018-19 | 22.7 |
| 2019-20 | 23.3 |
| 2020-21 | 23.4 |
| 2021-22 | 23.9 |
| 2022-23 | 25.4 |
| 2023-24 | 25.7 |
7. Postsecondary Education
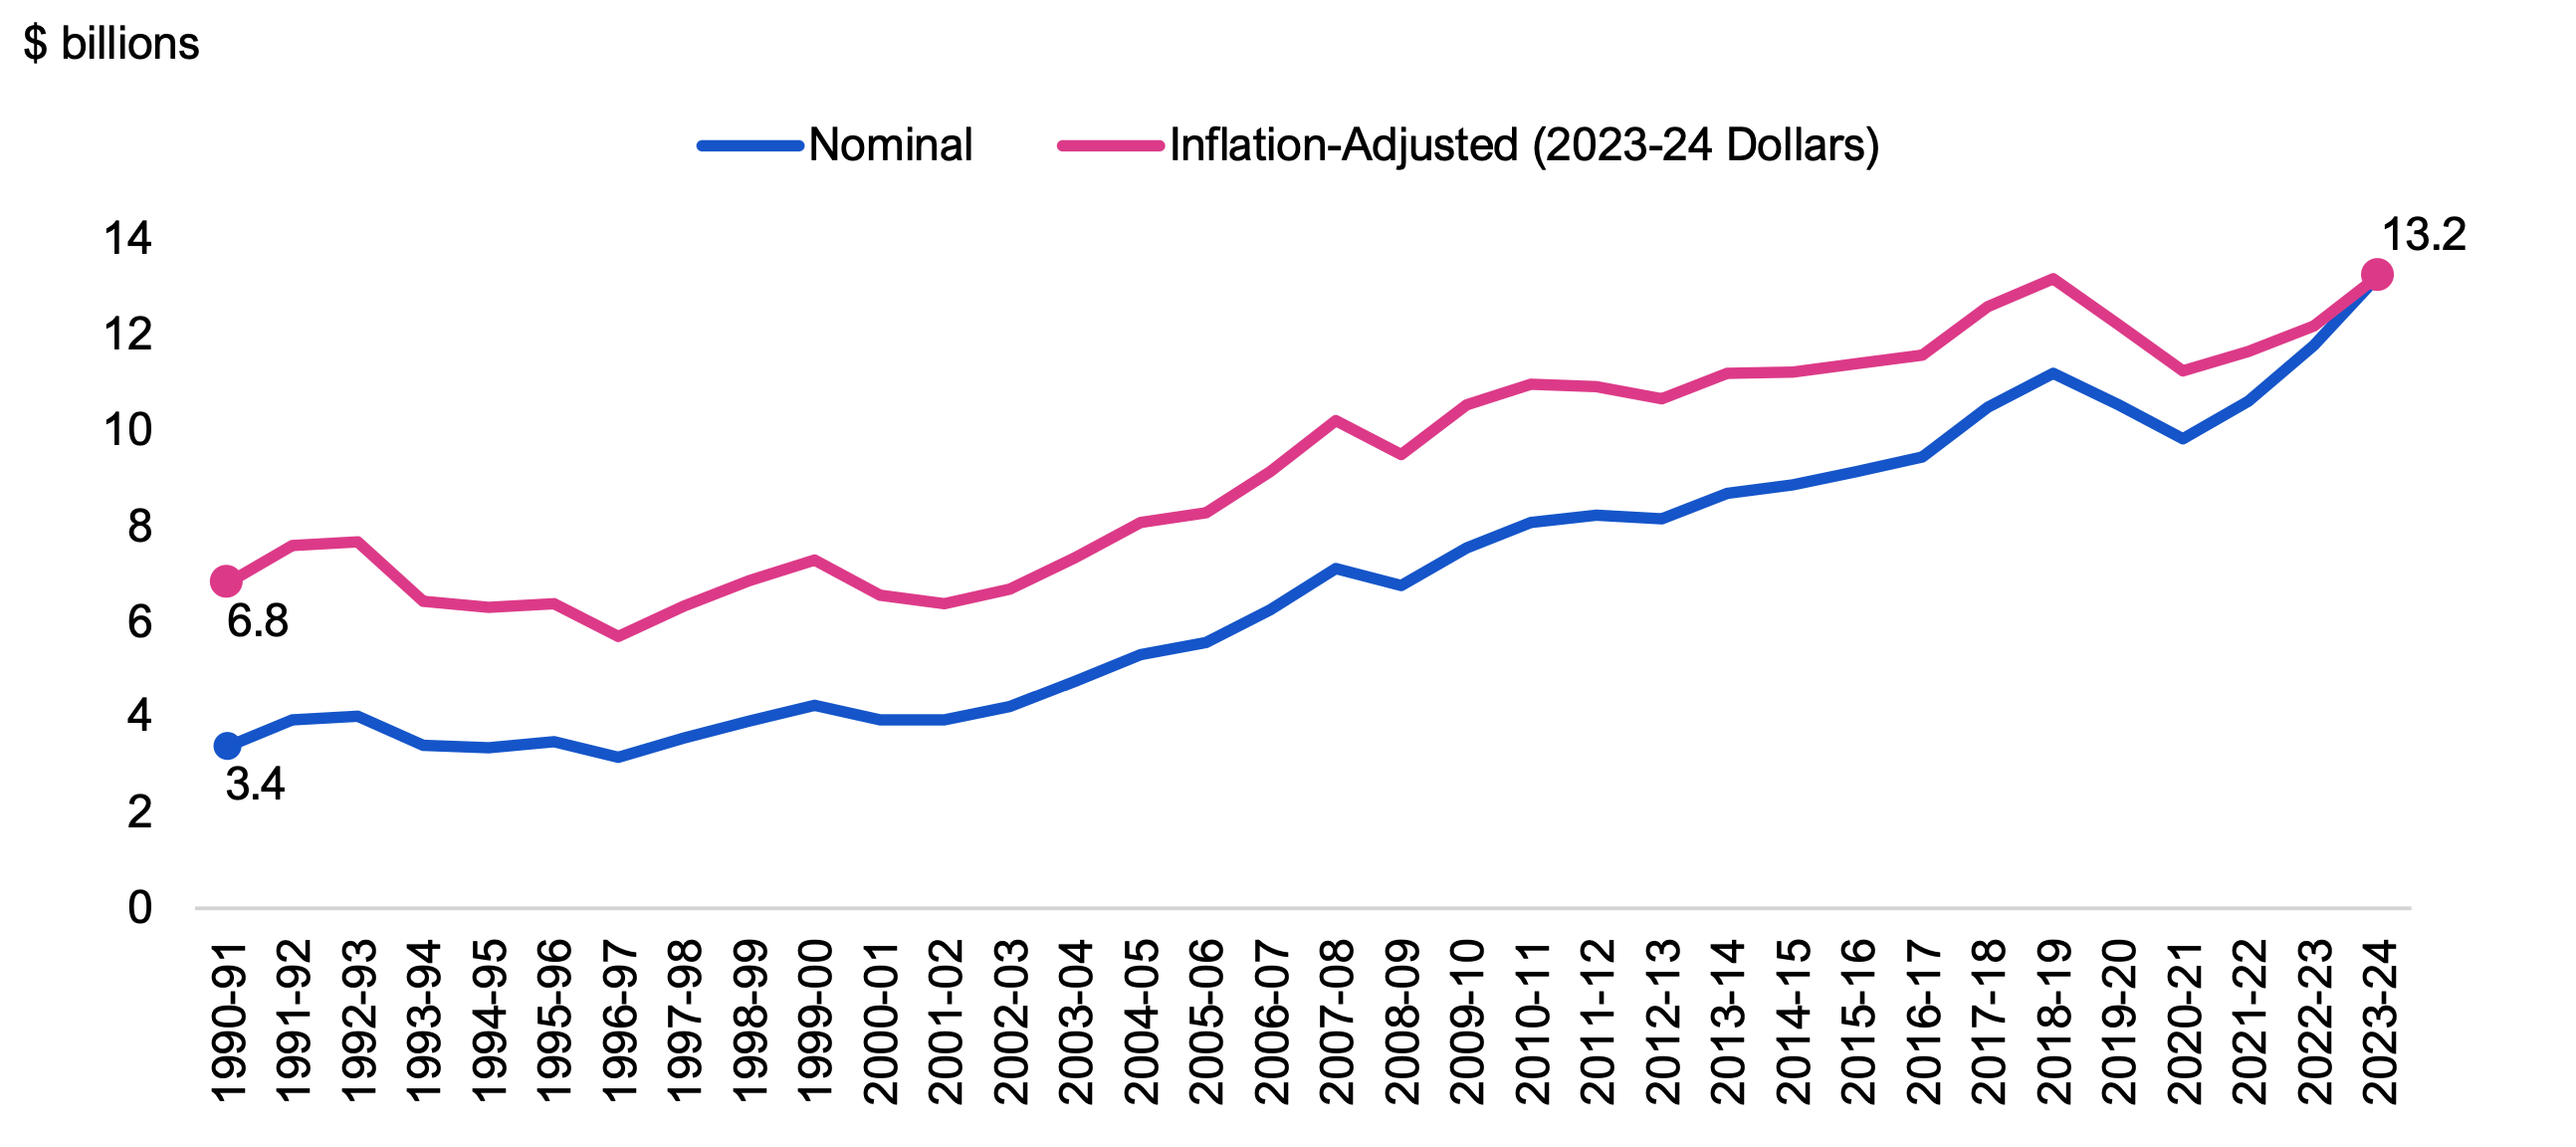
Spending Trends
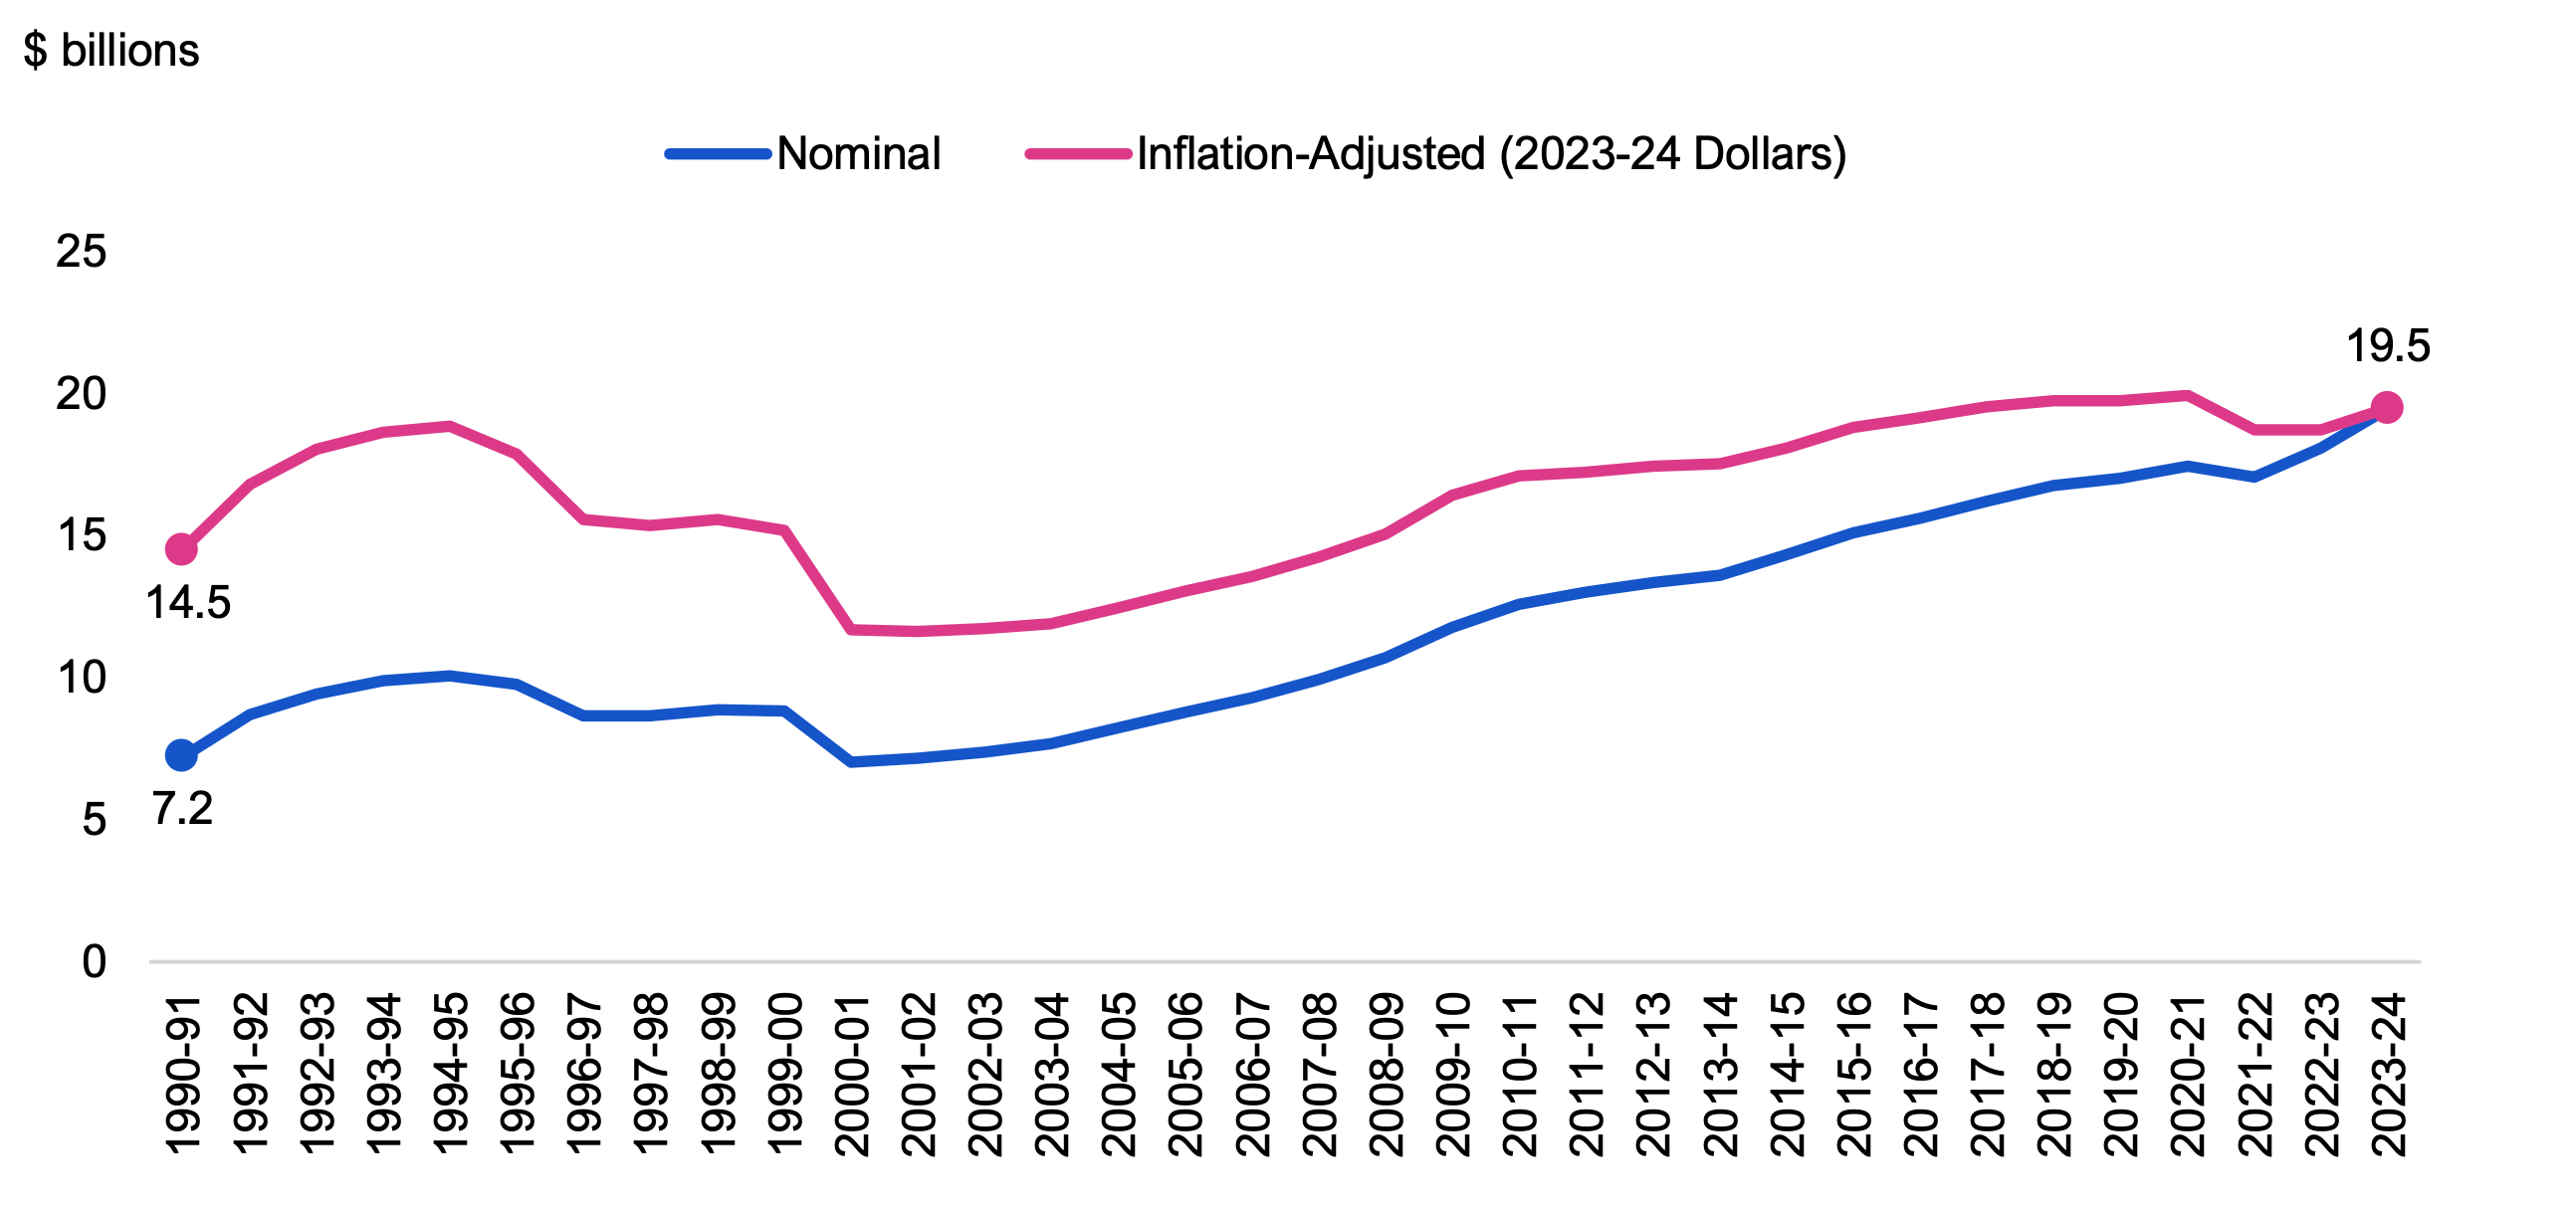
Postsecondary education is the fifth largest sector in the government, accounting for 6.4 per cent of total spending in 2023-24. This sector primarily consists of consolidated spending by colleges, transfer payments to universities and spending on student financial assistance. The FAO estimates postsecondary education sector spending grew at an average annual rate of 4.2 per cent from $3.4 billion in 1990-91 to $13.2 billion in 2023-24. After adjusting for inflation, this sector’s spending increased at an average annual rate of 2.0 per cent from 1990-91 to 2023-24.
Figure 7.1 Postsecondary education sector spending, nominal and inflation-adjusted, 1990-91 to 2023-24
Source: FAO calculations, Statistics Canada, Public Accounts of Ontario and FAO analysis of information provided by the Province.
Accessible version
| Fiscal Year | Nominal | Inflation-Adjusted (2023-24 Dollars) |
|---|---|---|
| 1990-91 | 3.4 | 6.8 |
| 1991-92 | 3.9 | 7.6 |
| 1992-93 | 4.0 | 7.7 |
| 1993-94 | 3.4 | 6.4 |
| 1994-95 | 3.4 | 6.3 |
| 1995-96 | 3.5 | 6.4 |
| 1996-97 | 3.2 | 5.7 |
| 1997-98 | 3.6 | 6.3 |
| 1998-99 | 3.9 | 6.9 |
| 1999-00 | 4.3 | 7.3 |
| 2000-01 | 3.9 | 6.5 |
| 2001-02 | 3.9 | 6.4 |
| 2002-03 | 4.2 | 6.7 |
| 2003-04 | 4.7 | 7.3 |
| 2004-05 | 5.3 | 8.1 |
| 2005-06 | 5.6 | 8.3 |
| 2006-07 | 6.2 | 9.1 |
| 2007-08 | 7.1 | 10.2 |
| 2008-09 | 6.7 | 9.5 |
| 2009-10 | 7.5 | 10.5 |
| 2010-11 | 8.1 | 11.0 |
| 2011-12 | 8.2 | 10.9 |
| 2012-13 | 8.2 | 10.7 |
| 2013-14 | 8.7 | 11.2 |
| 2014-15 | 8.9 | 11.2 |
| 2015-16 | 9.1 | 11.4 |
| 2016-17 | 9.4 | 11.6 |
| 2017-18 | 10.5 | 12.6 |
| 2018-19 | 11.2 | 13.2 |
| 2019-20 | 10.5 | 12.2 |
| 2020-21 | 9.8 | 11.2 |
| 2021-22 | 10.6 | 11.6 |
| 2022-23 | 11.8 | 12.2 |
| 2023-24 | 13.2 | 13.2 |
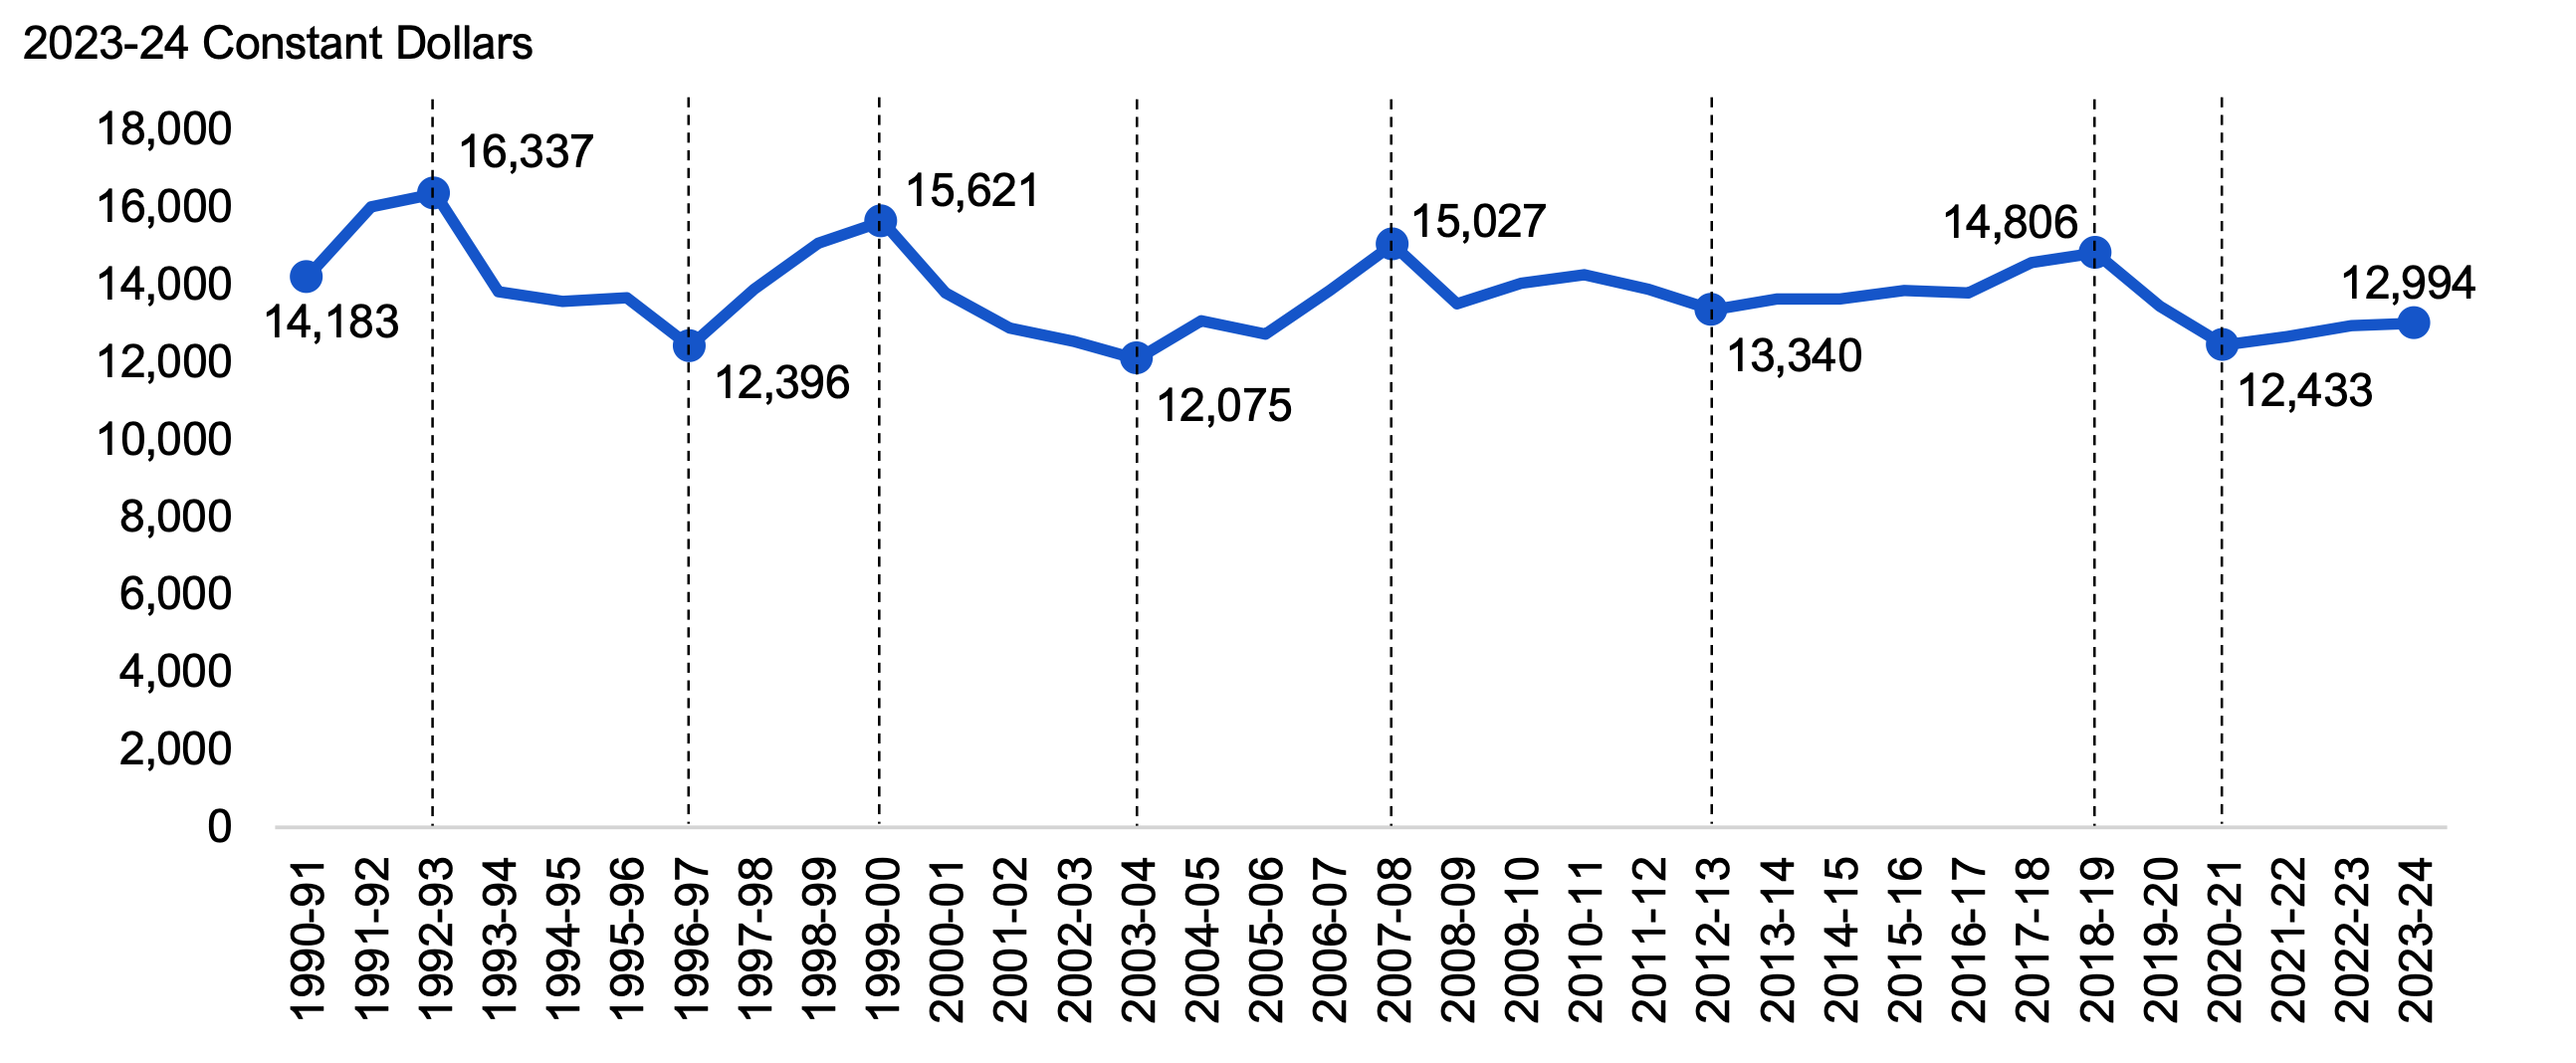
In addition to inflation, an important cost driver of postsecondary education sector spending is student enrolment in colleges and universities.[14] The following presents postsecondary education sector spending on an inflation-adjusted (i.e., real) per student basis to provide a better indication of the impact that postsecondary education spending has on service levels over time. The FAO estimates that real postsecondary education spending per student decreased at an average annual rate of -0.3 per cent from $14,183 in 1990-91 to $12,994 in 2023-24.
Figure 7.2 Postsecondary education sector spending per student, inflation-adjusted, 1990-91 to 2023-24
Source: FAO calculations, Statistics Canada, Public Accounts of Ontario and FAO analysis of information provided by the Province.
Accessible version
| Fiscal Year | Real Per Student Spending |
|---|---|
| 1990-91 | 14,183 |
| 1991-92 | 16,009 |
| 1992-93 | 16,337 |
| 1993-94 | 13,808 |
| 1994-95 | 13,575 |
| 1995-96 | 13,665 |
| 1996-97 | 12,396 |
| 1997-98 | 13,874 |
| 1998-99 | 15,061 |
| 1999-00 | 15,621 |
| 2000-01 | 13,786 |
| 2001-02 | 12,882 |
| 2002-03 | 12,518 |
| 2003-04 | 12,075 |
| 2004-05 | 13,062 |
| 2005-06 | 12,732 |
| 2006-07 | 13,854 |
| 2007-08 | 15,027 |
| 2008-09 | 13,499 |
| 2009-10 | 14,029 |
| 2010-11 | 14,249 |
| 2011-12 | 13,883 |
| 2012-13 | 13,340 |
| 2013-14 | 13,633 |
| 2014-15 | 13,621 |
| 2015-16 | 13,834 |
| 2016-17 | 13,786 |
| 2017-18 | 14,563 |
| 2018-19 | 14,806 |
| 2019-20 | 13,435 |
| 2020-21 | 12,433 |
| 2021-22 | 12,646 |
| 2022-23 | 12,942 |
| 2023-24 | 12,994 |
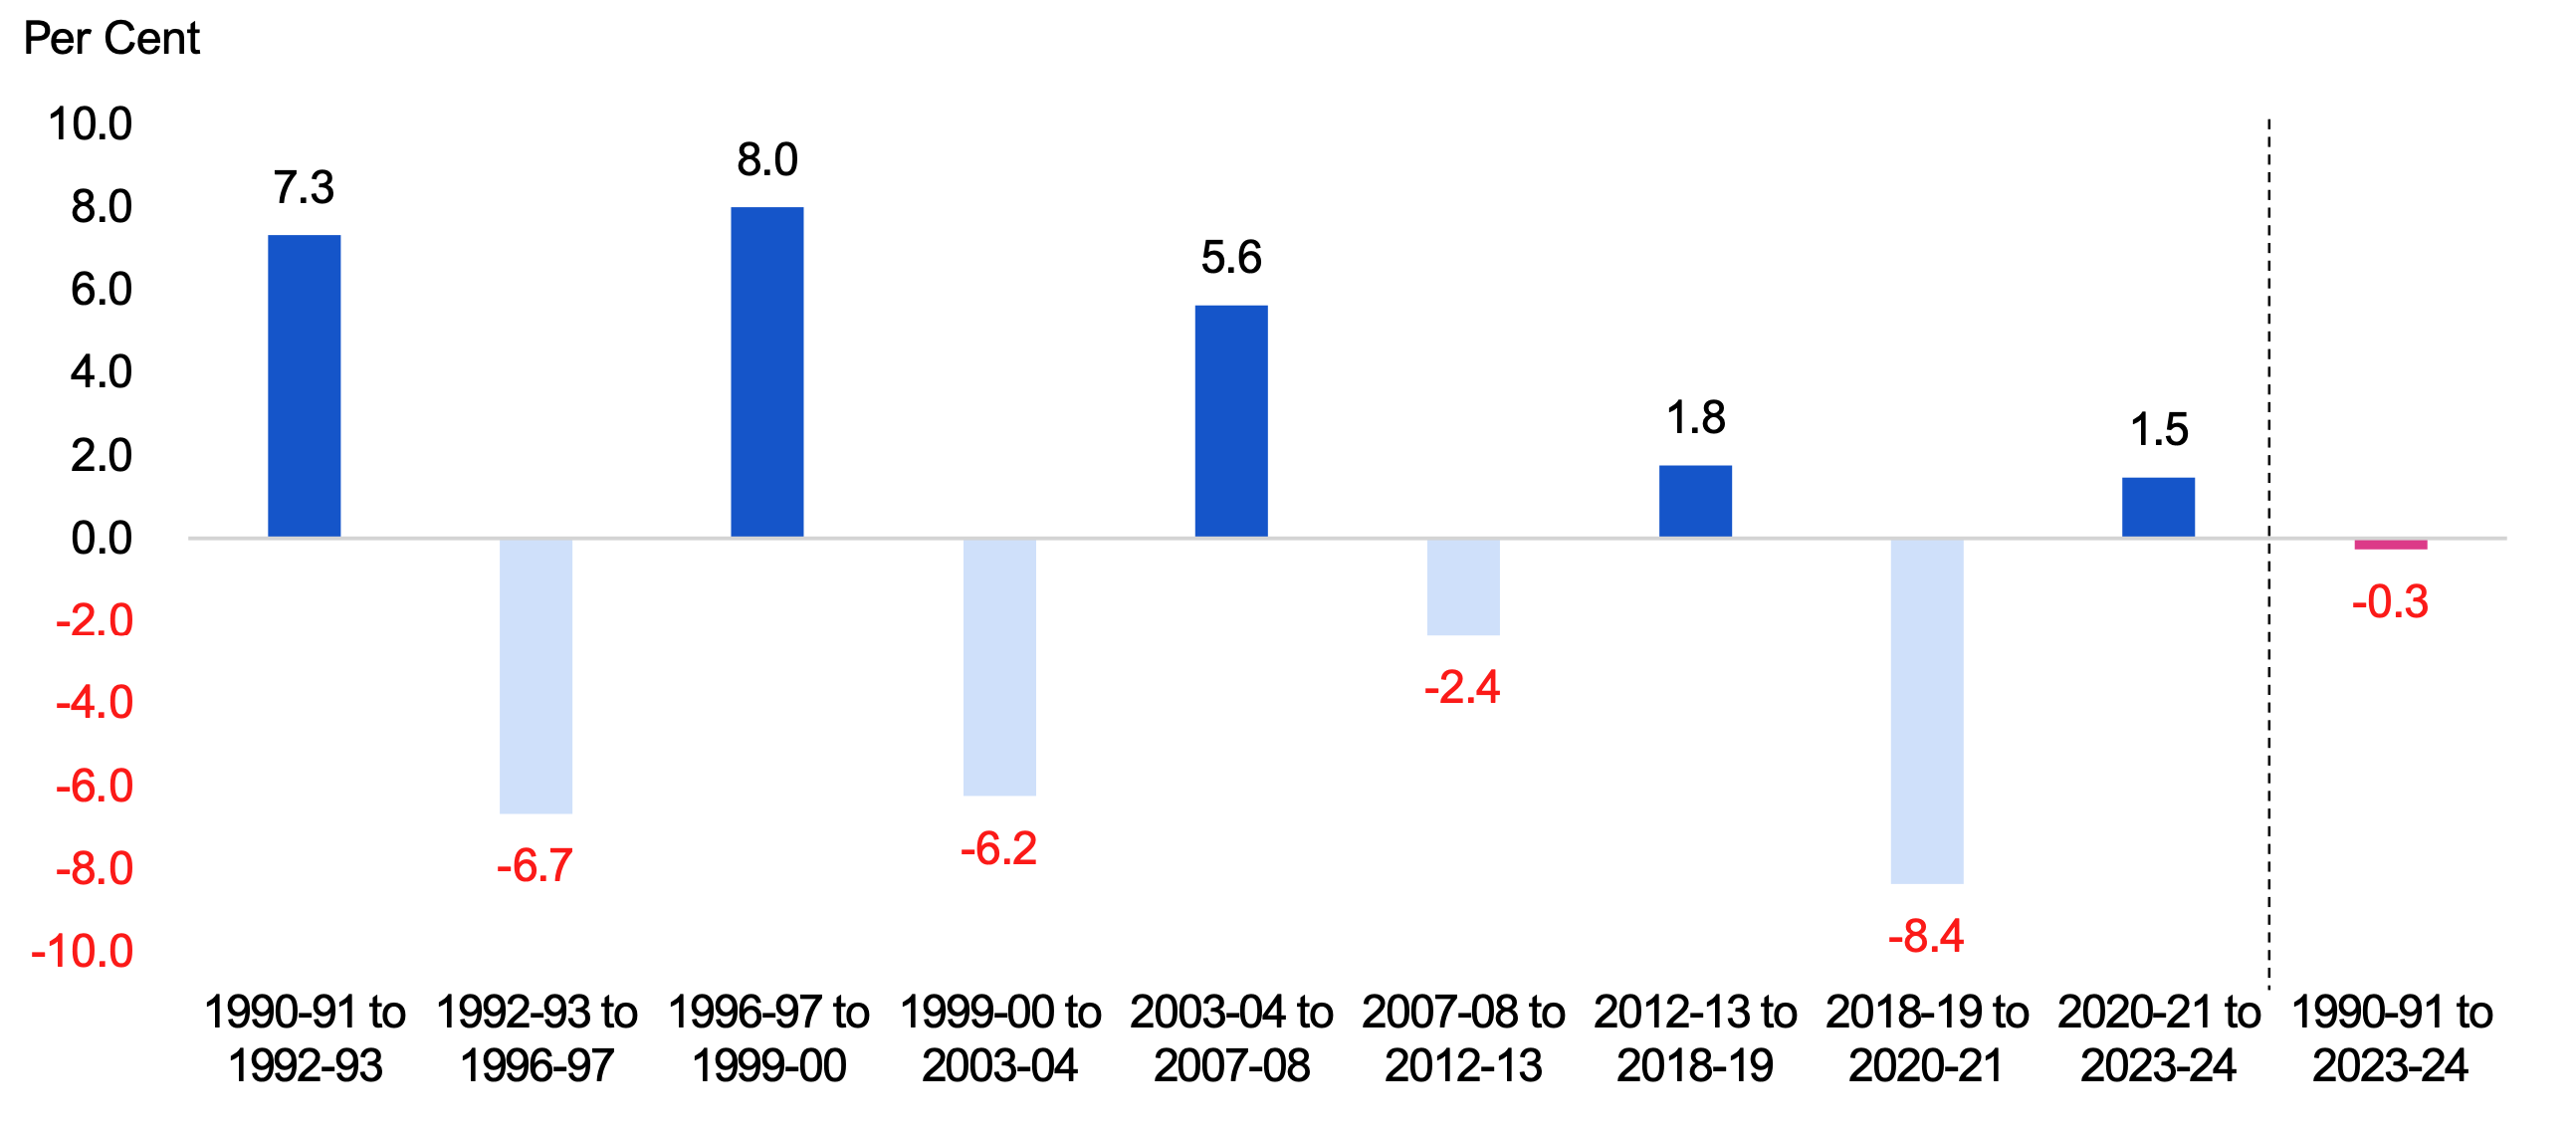
Based on real per student spending, the FAO has identified nine distinct periods of postsecondary education sector spending between 1990-91 to 2023-24:
1990-91 to 1992-93
From 1990-91 to 1992-93, real postsecondary education spending per student increased from $14,183 to $16,337 at an average annual rate of 7.3 per cent. This period was characterized by declining enrolment, which decreased by a total of 2.2 per cent over the two-year period.
1992-93 to 1996-97
From 1992-93 to 1996-97, real postsecondary education spending per student declined from $16,337 to $12,396 at an average annual rate of -6.7 per cent. This period was characterized by reductions in government operating grants to universities and colleges.
1996-97 to 1999-00
From 1996-97 to 1999-00, real postsecondary education spending per student increased from $12,396 to $15,621 at an average annual rate of 8.0 per cent. This period was characterized by rapid growth in tuition fees, which increased provincial spending on student financial assistance and funded higher consolidated spending by colleges.
1999-00 to 2003-04
From 1999-00 to 2003-04, real postsecondary education spending per student declined from $15,621 to $12,075 at an average annual rate of -6.2 per cent. This decline was driven by the expansion of federal government support for student financial assistance programs, which reduced provincial spending on provincial student financial assistance (see the Select Service Levels section below for more information).
2003-04 to 2007-08
From 2003-04 to 2007-08, real per student postsecondary education spending grew from $12,075 to $15,027 at an average annual rate of 5.6 per cent. This spending growth was driven by the introduction of the Reaching Higher Plan in 2005, which provided additional funding to postsecondary institutions to add more faculty and increased spending on student financial assistance.
2007-08 to 2012-13
From 2007-08 to 2012-13, real postsecondary education spending per student declined from $15,027 to $13,340 at an average annual rate of -2.4 per cent. This decline was driven by the expiration of one-time capital funding for universities, and strong international student enrolment growth that averaged 8.9 per cent annually, which outpaced spending growth.
2012-13 to 2018-19
From 2012-13 to 2018-19, real per student postsecondary education spending increased from $13,340 to $14,806 at an average annual rate of 1.8 per cent. This spending growth was driven by increased spending on student financial assistance near the end of the period, including government policy to provide free tuition for eligible domestic students, a shift towards providing more support through grants over loans and expanded eligibility.
2018-19 to 2020-21
From 2018-19 to 2020-21, real postsecondary education spending per student declined from $14,806 to $12,433 at an average annual rate of -8.4 per cent. This decline was largely driven by reduced student financial assistance spending, including the removal of free tuition for eligible domestic students, a 10 per cent reduction in tuition fees for domestic students, which lowered student financial assistance costs, and increased federal student financial assistance during the COVID-19 pandemic, which lowered provincial student financial assistance spending. The reduction in tuition fees also slowed growth in consolidated spending by colleges at the beginning of the period.
2020-21 to 2023-24
From 2020-21 to 2023-24, real per student postsecondary education spending increased from $12,433 to $12,994 at an average annual rate of 1.5 per cent. This increase is largely due to a recovery in provincial spending on student financial assistance following reductions in higher federal supports introduced during the COVID-19 pandemic, and higher consolidated spending by colleges, driven by growth in international student enrolment.
Figure 7.3 Average annual growth in real per student postsecondary education spending, 1990-91 to 2023-24
Source: FAO calculations, Statistics Canada, Public Accounts of Ontario and FAO analysis of information provided by the Province.
Accessible version
| Fiscal Years | 1990-91 to 1992-93 | 1992-93 to 1996-97 | 1996-97 to 1999-00 | 1999-00 to 2003-04 | 2003-04 to 2007-08 | 2007-08 to 2012-13 | 2012-13 to 2018-19 | 2018-19 to 2020-21 | 2020-21 to 2023-24 | 1990-91 to 2023-24 |
|---|---|---|---|---|---|---|---|---|---|---|
| Average Annual Growth | 7.3 | -6.7 | 8.0 | -6.2 | 5.6 | -2.4 | 1.8 | -8.4 | 1.5 | -0.3 |
Select Service Levels
In this section, the FAO analyzes two broad service level trends in the postsecondary education sector: average tuition fees for domestic students and average student financial assistance payments. There are many other measures of postsecondary education sector service levels and performance. For more information, see Higher Education Quality Council of Ontario.
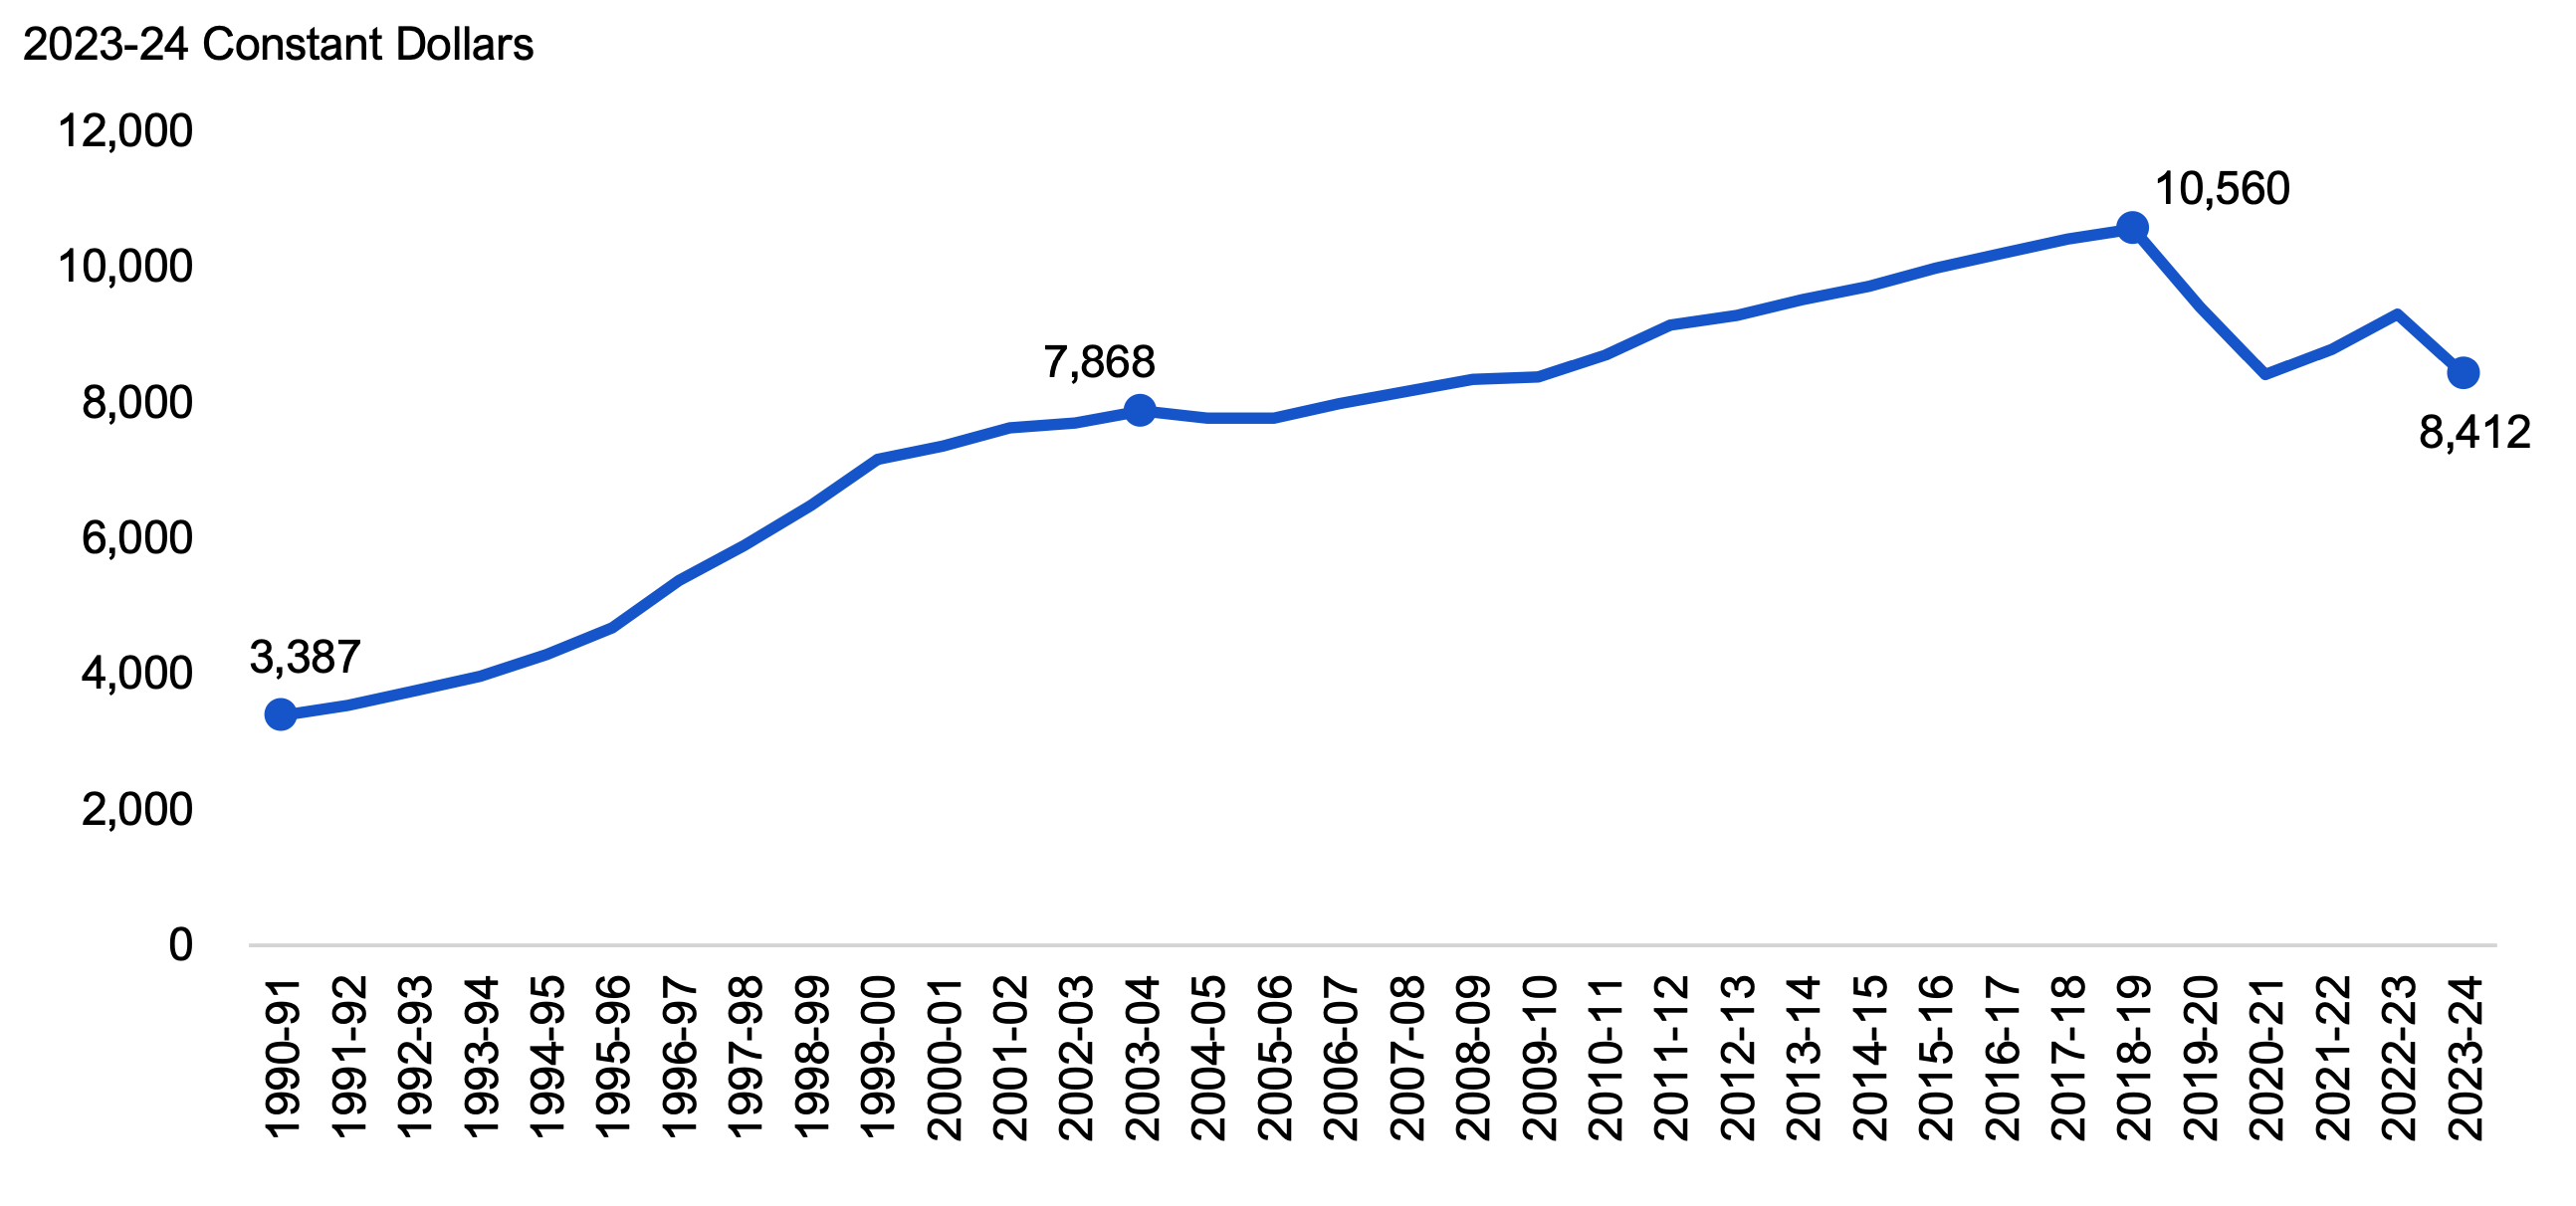
Tuition Fees for Domestic Students
From 1990-91 to 2003-04, real average tuition fees for domestic students increased from $3,387 to $7,868, at an average annual rate of 6.7 per cent, as institutions increased tuition fees to offset reductions in government operating grants. From 2003-04 to 2018-19, annual growth in real average tuition fees slowed to 2.0 per cent and reached a peak of $10,560 in 2018-19. Real average tuition fees then declined to $8,412 in 2023-24, at an average annual rate of -4.4 per cent, following government policy to reduce tuition fees for domestic students by 10 per cent in 2019 and freeze tuition fees going forward.
Figure 7.4 Average tuition fees for domestic students in postsecondary education programs in Ontario, inflation-adjusted, 1990-91 to 2023-24
Note: Average tuition for both undergraduate and graduate students, weighted by enrolment.
Source: FAO analysis of Statistics Canada information
Accessible version
| Fiscal Year | Average Tuition Fee |
|---|---|
| 1990-91 | 3,387 |
| 1991-92 | 3,538 |
| 1992-93 | 3,743 |
| 1993-94 | 3,972 |
| 1994-95 | 4,285 |
| 1995-96 | 4,673 |
| 1996-97 | 5,384 |
| 1997-98 | 5,892 |
| 1998-99 | 6,488 |
| 1999-00 | 7,155 |
| 2000-01 | 7,364 |
| 2001-02 | 7,625 |
| 2002-03 | 7,698 |
| 2003-04 | 7,868 |
| 2004-05 | 7,766 |
| 2005-06 | 7,771 |
| 2006-07 | 7,976 |
| 2007-08 | 8,156 |
| 2008-09 | 8,337 |
| 2009-10 | 8,382 |
| 2010-11 | 8,705 |
| 2011-12 | 9,141 |
| 2012-13 | 9,290 |
| 2013-14 | 9,521 |
| 2014-15 | 9,715 |
| 2015-16 | 9,984 |
| 2016-17 | 10,198 |
| 2017-18 | 10,412 |
| 2018-19 | 10,560 |
| 2019-20 | 9,404 |
| 2020-21 | 8,418 |
| 2021-22 | 8,790 |
| 2022-23 | 9,312 |
| 2023-24 | 8,412 |
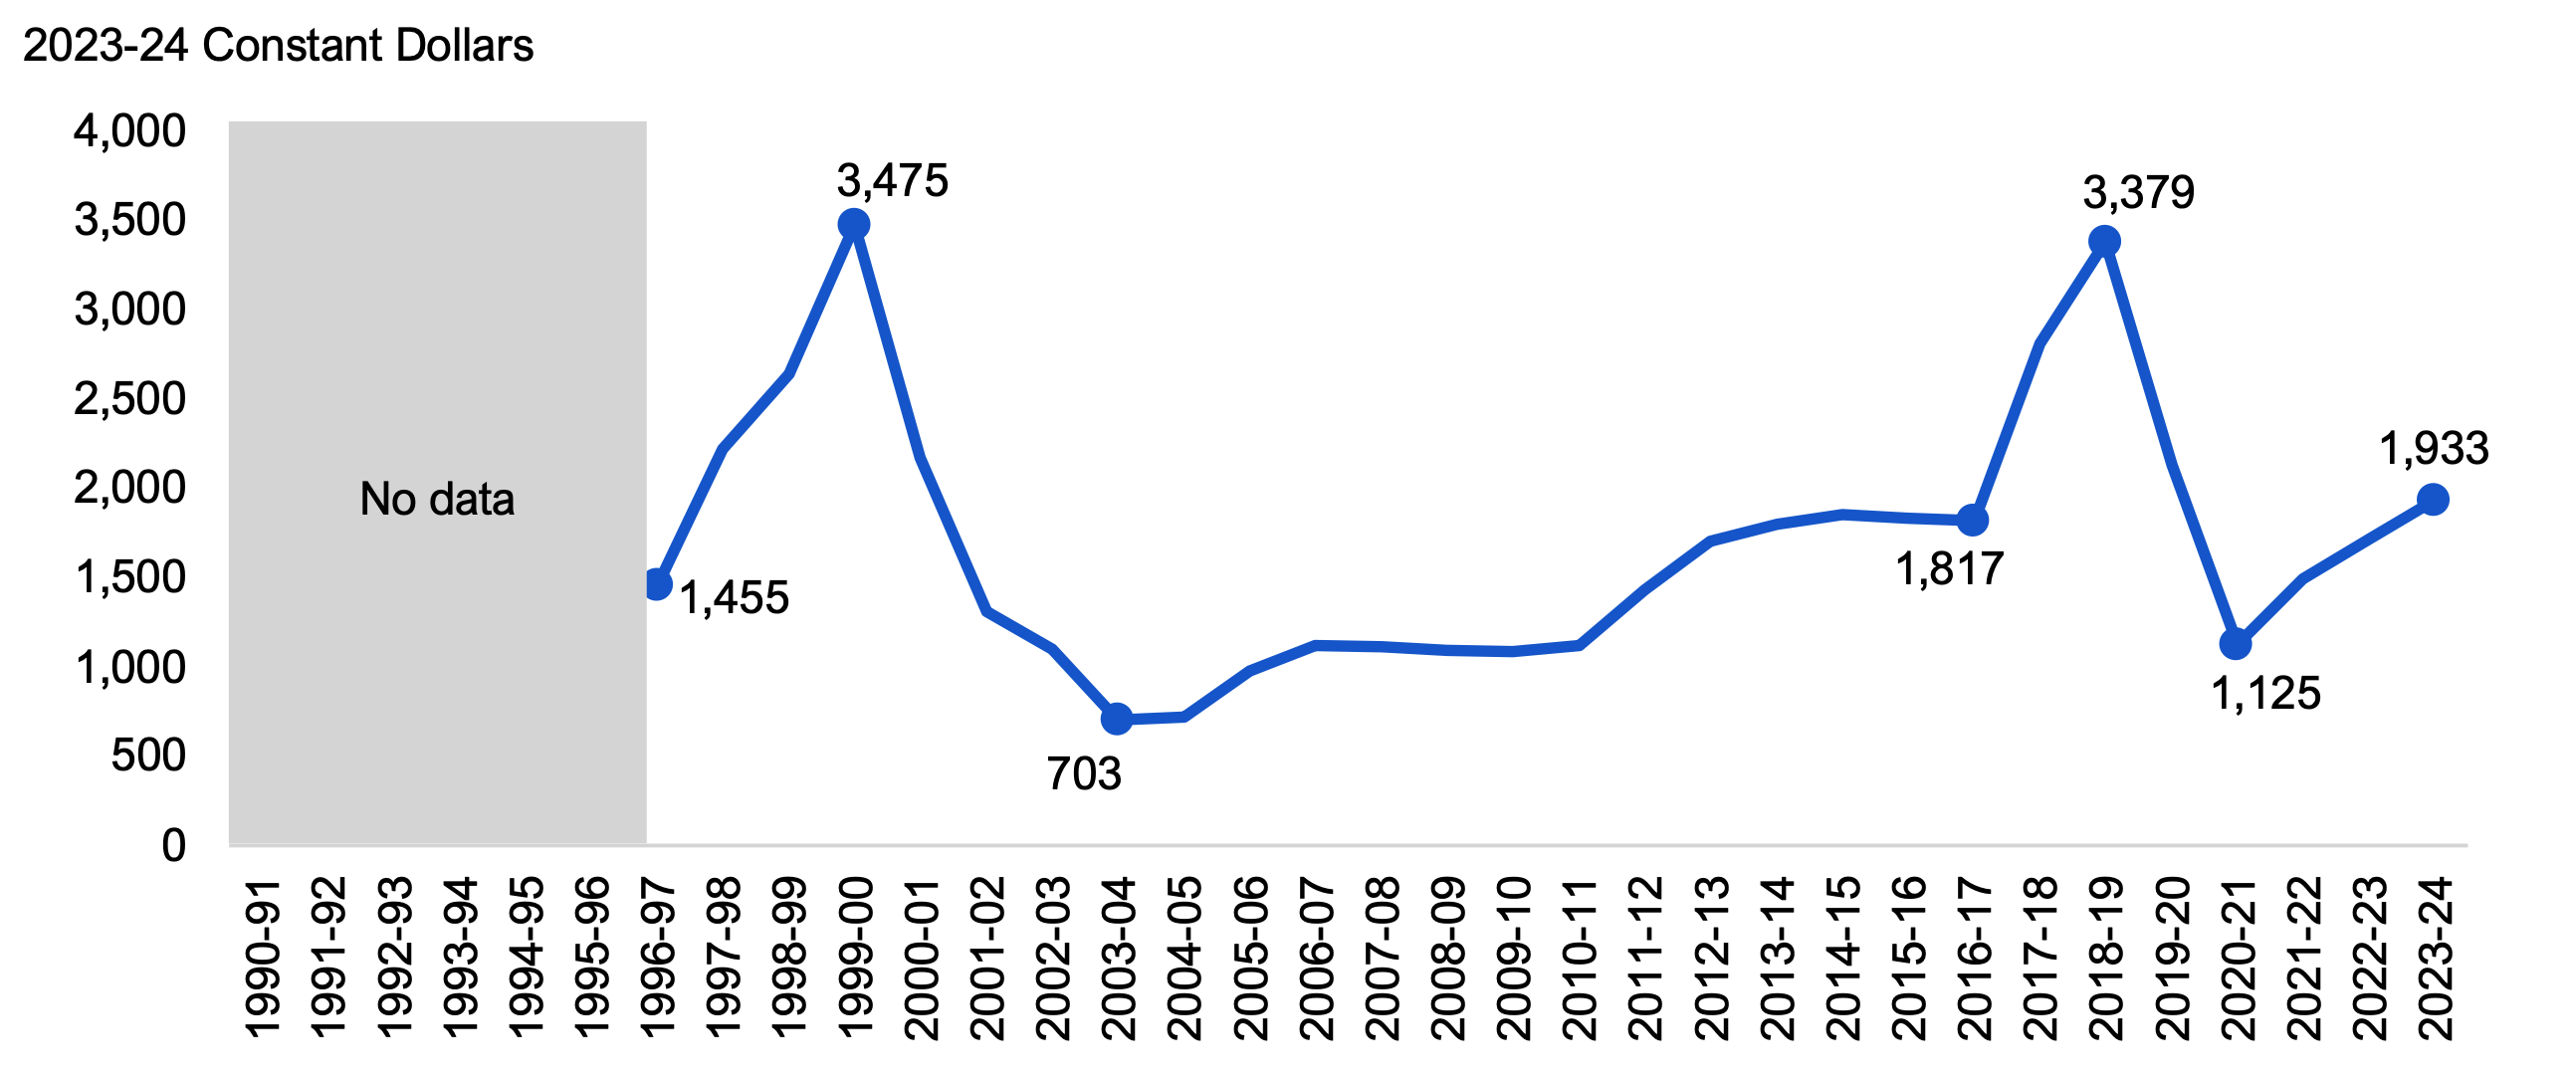
Student Financial Assistance Payments
Between 1996-97 to 2003-04, real average annual student financial assistance payments[15] per domestic student reached a peak of $3,475 in 1999-00, then declined significantly to $703 per student by 2003-04. This decline was driven largely by the expansion of the federal government’s Canada Student Loans Program, which reduced provincial support, and a shift towards providing more support through loans over grants. Real average payments per domestic student then increased, reaching $1,817 in 2016-17, following enhancements made through the Reaching Higher Plan in 2005, and the introduction of a 30 per cent rebate on tuition for eligible students in 2012.
Real average annual student financial assistance payments per domestic student then increased further, reaching $3,379 per domestic student in 2018-19, following government policy to provide free tuition for eligible domestic students, which was provided through the Student Financial Assistance Program, a shift towards providing more support through grants over loans, and expansions to eligibility. Spending then declined to $1,125 in 2020-21 following the reversal and reform of these program enhancements in 2019. The decline in spending was also attributable to a 10 per cent reduction in tuition fees, which reduced the amount of tuition eligible for grants, and increased federal support for students during the COVID-19 pandemic, which offset provincial support. Since then, spending has increased to $1,933 per student in 2023-24, largely due to the reduction of federal supports related to the COVID-19 pandemic.
Figure 7.5 Student financial assistance payments per domestic student enrolled in postsecondary education, inflation-adjusted, 1996-97 to 2023-24
Note: Includes grants through the Ontario Student Assistance Program (OSAP), but excludes loans provided through OSAP
SourceStatistics Canada and FAO analysis of the Public Accounts of Ontario
Accessible version
| Fiscal Year | Payments Per Domestic Student |
|---|---|
| 1990-91 | No Data |
| 1991-92 | No Data |
| 1992-93 | No Data |
| 1993-94 | No Data |
| 1994-95 | No Data |
| 1995-96 | No Data |
| 1996-97 | 1,455 |
| 1997-98 | 2,216 |
| 1998-99 | 2,640 |
| 1999-00 | 3,475 |
| 2000-01 | 2,173 |
| 2001-02 | 1,307 |
| 2002-03 | 1,097 |
| 2003-04 | 703 |
| 2004-05 | 716 |
| 2005-06 | 978 |
| 2006-07 | 1,121 |
| 2007-08 | 1,114 |
| 2008-09 | 1,090 |
| 2009-10 | 1,084 |
| 2010-11 | 1,120 |
| 2011-12 | 1,434 |
| 2012-13 | 1,706 |
| 2013-14 | 1,798 |
| 2014-15 | 1,852 |
| 2015-16 | 1,833 |
| 2016-17 | 1,817 |
| 2017-18 | 2,813 |
| 2018-19 | 3,379 |
| 2019-20 | 2,130 |
| 2020-21 | 1,125 |
| 2021-22 | 1,494 |
| 2022-23 | 1,715 |
| 2023-24 | 1,933 |
8. Children, Community and Social Services
Spending Trends
The children, community and social services sector is the fourth largest in the government, accounting for 9.4 per cent of total spending in 2023-24. This sector primarily consists of spending on financial and employment assistance to households in financial need, as well as targeted supports for adults, youth and children, victims of violence, and Indigenous peoples.[16] The FAO estimates children, community and social services sector spending grew at an average annual rate of 3.1 per cent from $7.2 billion in 1990-91 to $19.5 billion in 2023-24. After adjusting for inflation, this sector’s spending grew at an average annual rate of 0.9 per cent from 1990-91 to 2023-24.
Figure 8.1 Children, community and social services sector spending, nominal and inflation-adjusted, 1990-91 to 2023-24
Source: FAO calculations, Statistics Canada, Public Accounts of Ontario and FAO analysis of information provided by the Province.
Accessible version
| Fiscal Year | Nominal | Inflation-Adjusted (2023-24 Dollars) |
|---|---|---|
| 1990-91 | 7.2 | 14.5 |
| 1991-92 | 8.7 | 16.8 |
| 1992-93 | 9.4 | 18.0 |
| 1993-94 | 9.9 | 18.6 |
| 1994-95 | 10.1 | 18.9 |
| 1995-96 | 9.8 | 17.9 |
| 1996-97 | 8.7 | 15.6 |
| 1997-98 | 8.6 | 15.3 |
| 1998-99 | 8.9 | 15.6 |
| 1999-00 | 8.8 | 15.2 |
| 2000-01 | 7.0 | 11.7 |
| 2001-02 | 7.2 | 11.6 |
| 2002-03 | 7.4 | 11.7 |
| 2003-04 | 7.7 | 11.9 |
| 2004-05 | 8.2 | 12.5 |
| 2005-06 | 8.8 | 13.1 |
| 2006-07 | 9.3 | 13.6 |
| 2007-08 | 9.9 | 14.2 |
| 2008-09 | 10.7 | 15.1 |
| 2009-10 | 11.8 | 16.4 |
| 2010-11 | 12.6 | 17.1 |
| 2011-12 | 13.0 | 17.2 |
| 2012-13 | 13.3 | 17.4 |
| 2013-14 | 13.6 | 17.6 |
| 2014-15 | 14.3 | 18.1 |
| 2015-16 | 15.1 | 18.8 |
| 2016-17 | 15.6 | 19.1 |
| 2017-18 | 16.2 | 19.5 |
| 2018-19 | 16.8 | 19.7 |
| 2019-20 | 17.0 | 19.7 |
| 2020-21 | 17.4 | 19.9 |
| 2021-22 | 17.1 | 18.7 |
| 2022-23 | 18.1 | 18.7 |
| 2023-24 | 19.5 | 19.5 |
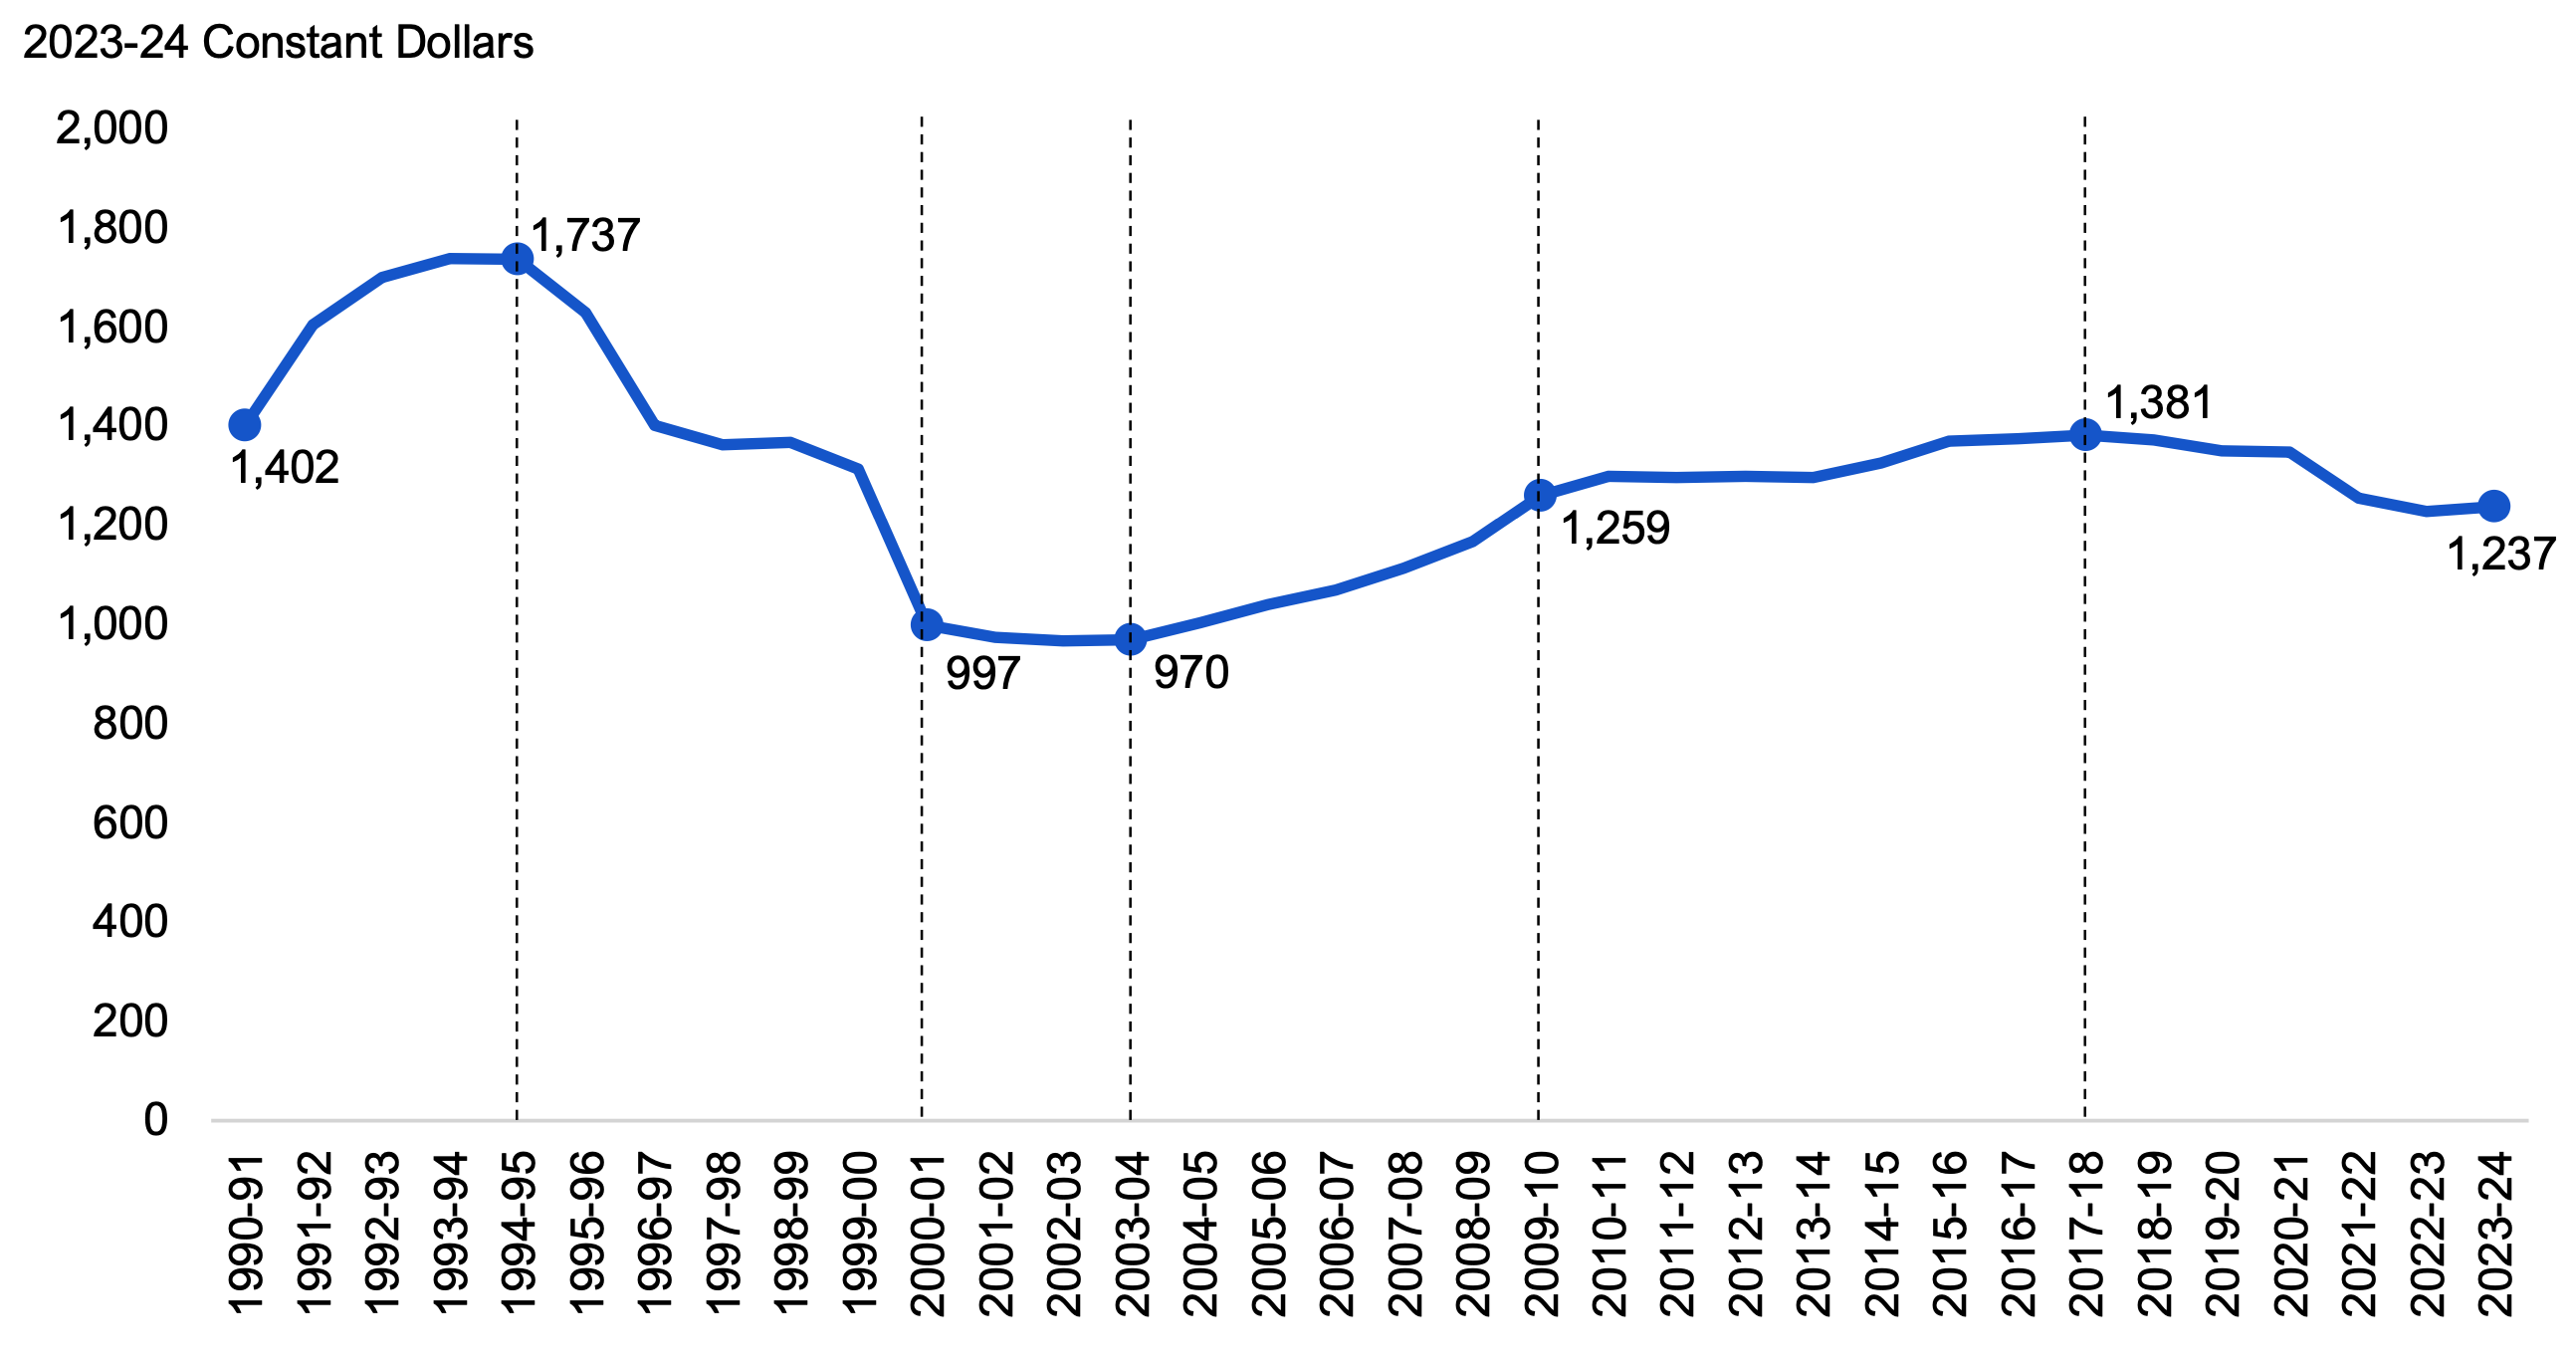
In addition to inflation, an important cost driver of children, community and social services sector spending is population growth. The following presents children, community and social services sector spending on an inflation-adjusted (i.e., real) per capita basis to provide a better indication of the impact that spending has on service levels over time. The FAO estimates real per capita children, community and social services sector spending decreased at an average annual rate of -0.4 per cent from $1,402 per person in 1990-91 to $1,237 per person in 2023-24.
Figure 8.2 Children, community and social services sector spending per capita, inflation-adjusted, 1990-91 to 2023-24
Source: FAO calculations, Statistics Canada, Public Accounts of Ontario and FAO analysis of information provided by the Province.
Accessible version
| Fiscal Year | Spending Per Capita |
|---|---|
| 1990-91 | 1,402 |
| 1991-92 | 1,604 |
| 1992-93 | 1,700 |
| 1993-94 | 1,737 |
| 1994-95 | 1,737 |
| 1995-96 | 1,627 |
| 1996-97 | 1,402 |
| 1997-98 | 1,362 |
| 1998-99 | 1,366 |
| 1999-00 | 1,314 |
| 2000-01 | 997 |
| 2001-02 | 973 |
| 2002-03 | 967 |
| 2003-04 | 970 |
| 2004-05 | 1,004 |
| 2005-06 | 1,040 |
| 2006-07 | 1,069 |
| 2007-08 | 1,112 |
| 2008-09 | 1,167 |
| 2009-10 | 1,259 |
| 2010-11 | 1,298 |
| 2011-12 | 1,296 |
| 2012-13 | 1,299 |
| 2013-14 | 1,296 |
| 2014-15 | 1,326 |
| 2015-16 | 1,369 |
| 2016-17 | 1,374 |
| 2017-18 | 1,381 |
| 2018-19 | 1,371 |
| 2019-20 | 1,350 |
| 2020-21 | 1,349 |
| 2021-22 | 1,255 |
| 2022-23 | 1,227 |
| 2023-24 | 1,237 |
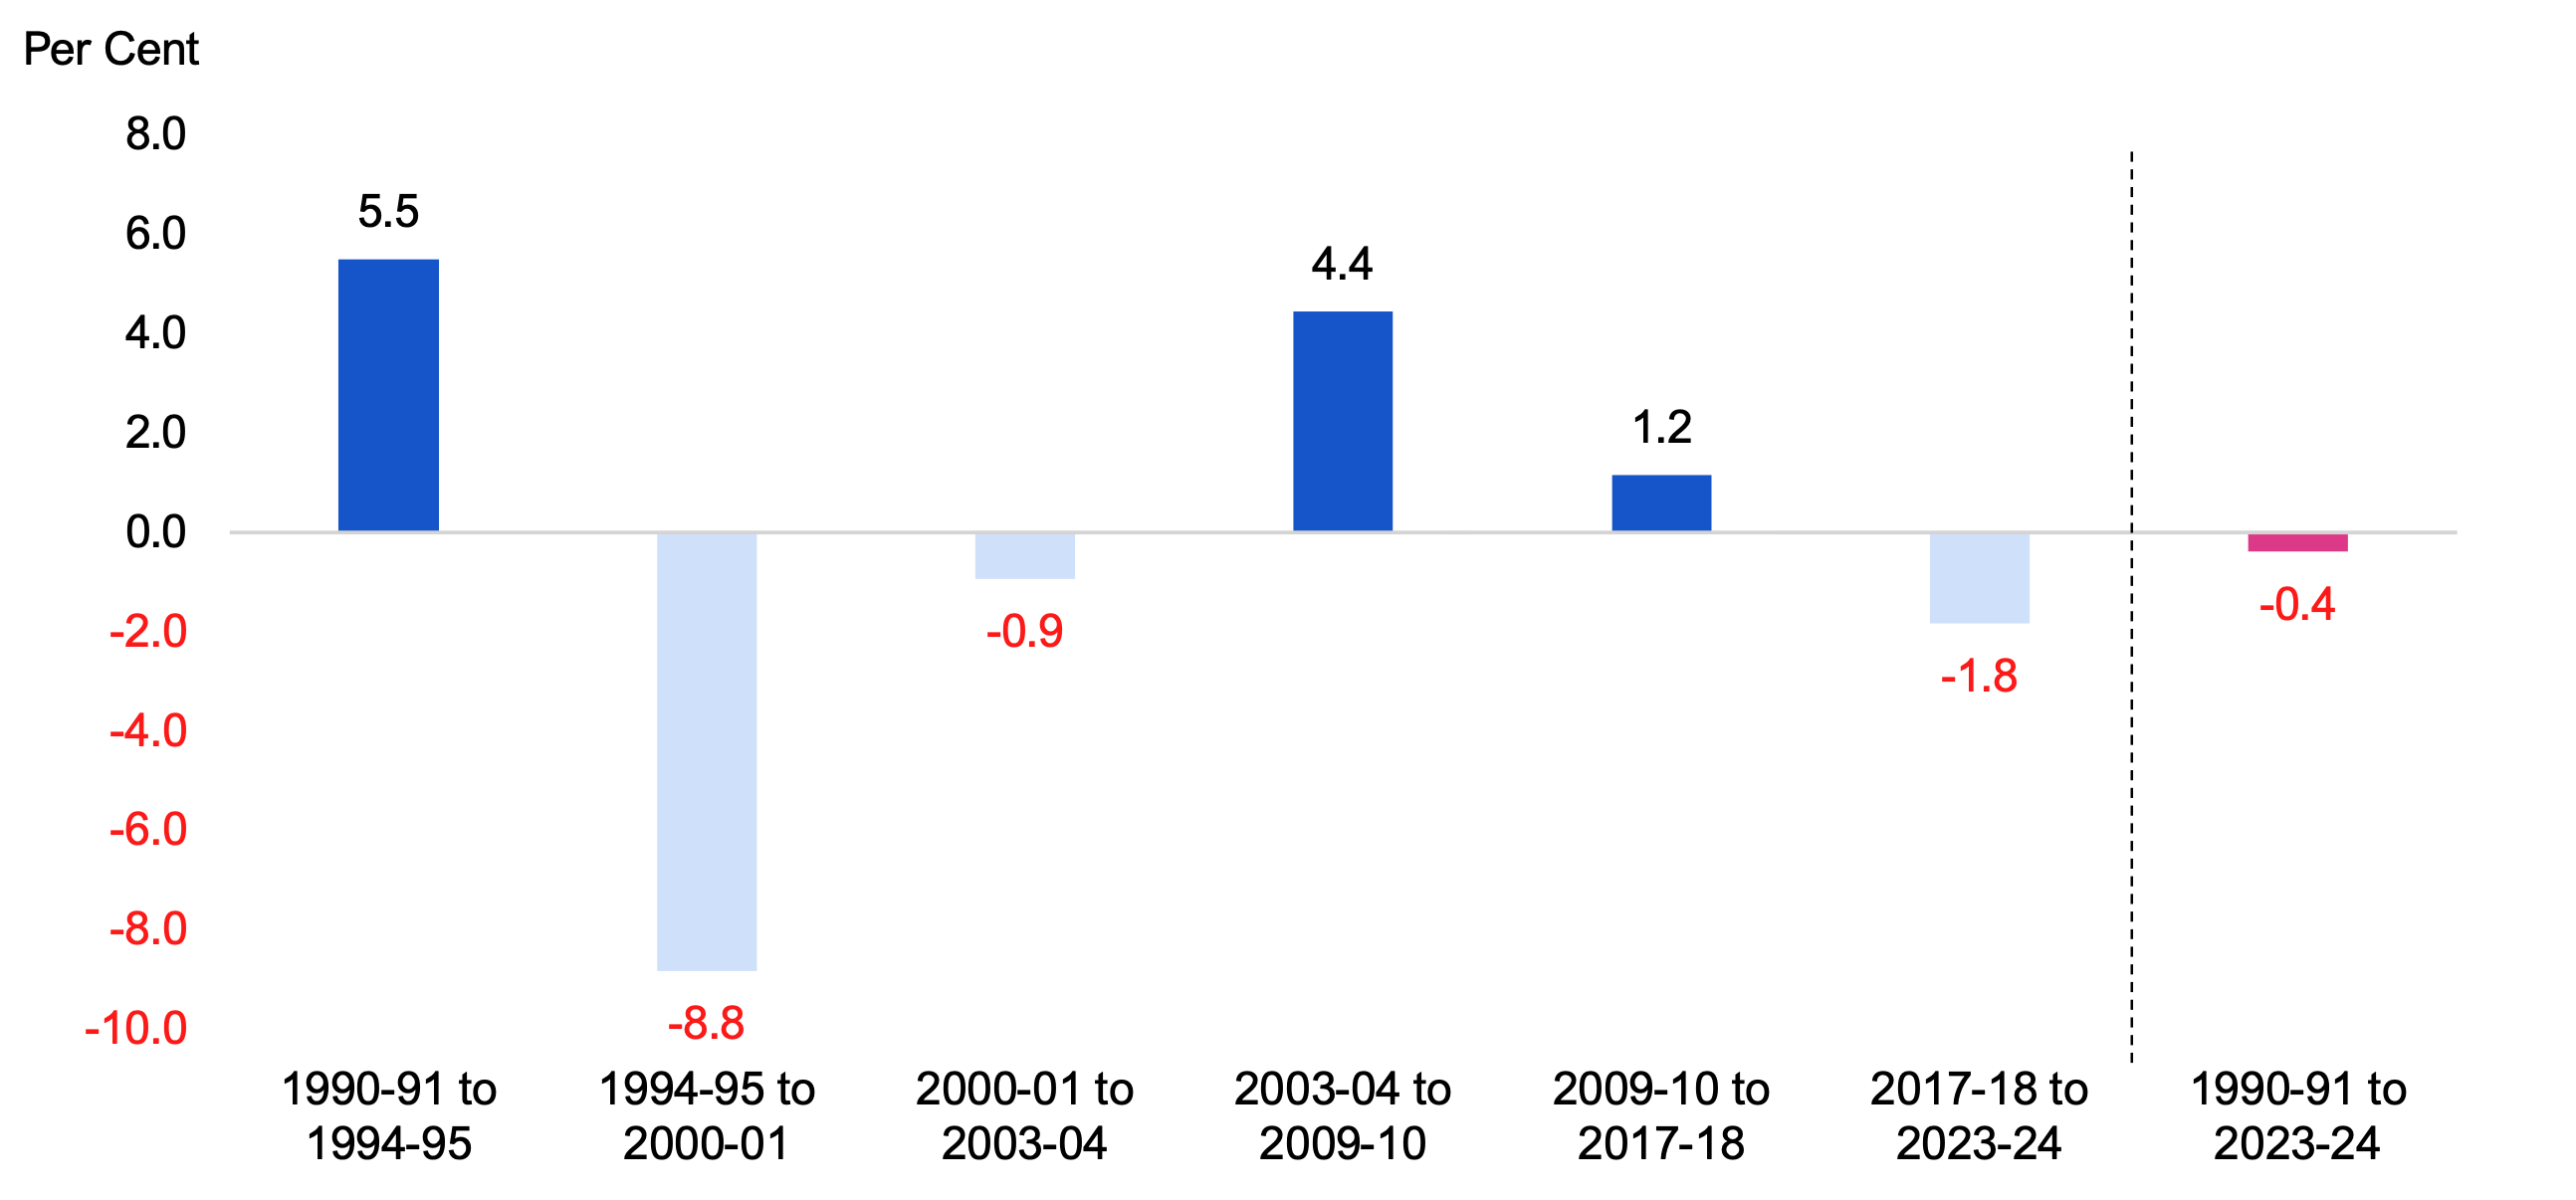
Based on real per capita spending, the FAO has identified six distinct periods of children, community and social services sector spending between 1990-91 to 2023-24:
1990-91 to 1994-95
From 1990-91 to 1994-95, real per capita children, community and social services spending increased from $1,402 to $1,737 at an average annual rate of 5.5 per cent. This growth was driven by government policy to increase social assistance benefit levels and rapid growth in the number of social assistance cases following the early 1990s recession (see the Select Service Levels section below for more information).
1994-95 to 2000-01
From 1994-95 to 2000-01, real per capita children, community and social services spending decreased from $1,737 to $997 at an average annual rate of -8.8 per cent. In 1995-96, the Province began to reform the social assistance system by cutting benefit rates and tightening the eligibility criteria for social assistance, which led to reductions in nominal spending. As part of the reform, General Welfare Assistance was replaced by Ontario Works (OW) and Family Benefits was replaced by the Ontario Disability Support Program (ODSP).
2000-01 to 2003-04
From 2000-01 to 2003-04, real per capita spending declined at an average annual rate of -0.9 per cent from $997 to $970. This decline was driven by lower spending on social assistance as the number of cases fell at an average annual rate of -0.9 per cent during this period, while ODSP and OW allowance rates remained unchanged. This reduction in spending was partially offset by increased spending on child welfare to address higher volumes of children in care.
2003-04 to 2009-10
From 2003-04 to 2009-10, real per capita spending grew from $970 to $1,259 at an average annual rate of 4.4 per cent. Growth was primarily driven by increases to ODSP and OW allowance rates, and increased funding to child protection agencies, women’s shelters, Children’s Treatment Centres, and the Healthy Babies, Healthy Children program and other early intervention services. Additionally, in 2007-08, the Province introduced the Ontario Child Benefit (OCB) and increased funding for Autism and the Developmental Services program for adults with developmental disabilities.
2009-10 to 2017-18
From 2009-10 to 2017-18, real per capita spending grew from $1,259 to $1,381 at an average annual rate of 1.2 per cent. Growth was primarily driven by increases to ODSP, OW and OCB allowance rates; the upload of the municipal share of social assistance program funding to the Province;[17] expansion of the Developmental Services program; and increased program funding in Children’s Treatment and Rehabilitation, Child Welfare and Autism.
2017-18 to 2023-24
From 2017-18 to 2023-24, real per capita spending fell from $1,381 to $1,237 at an average annual rate of ‑1.8 per cent. This reduction is largely due to declines in inflation-adjusted ODSP and OW allowance rates.[18] Additionally, ODSP and OW caseloads declined during the COVID-19 pandemic largely because federal income supports made some individuals ineligible for provincial social assistance. These declines were partially offset by investments in Developmental Services and the Autism program.
Figure 8.3 Average annual growth in real per capita children, community and social services spending, 1990-91 to 2023-24
Source: FAO calculations, Statistics Canada, Public Accounts of Ontario and FAO analysis of information provided by the Province.
Accessible version
| Fiscal Years | 1990-91 to 1994-95 | 1994-95 to 2000-01 | 2000-01 to 2003-04 | 2003-04 to 2009-10 | 2009-10 to 2017-18 | 2017-18 to 2023-24 | 1990-91 to 2023-24 |
|---|---|---|---|---|---|---|---|
| Average Annual Growth | 5.5 | -8.8 | -0.9 | 4.4 | 1.2 | -1.8 | -0.4 |
Select Service Levels
In this section, the FAO analyzes two broad service level trends: the number of social assistance cases and average annual ODSP and OW allowances. There are many other measures of children, community and social services sector service levels and performance. For more information, see FAO, Ministry of Children, Community and Social Services: Spending Plan Review.
Social Assistance Cases
From 1990-91 to 1994-95, the average monthly number of social assistance cases grew at an average annual rate of 14.1 per cent following the early 1990s recession. After peaking in 1994-95, cases declined at an average annual rate of -6.8 per cent from 669,383 in 1994-95 to 407,773 in 2001-02 due to tightened eligibility criteria and strong job creation that caused the unemployment rate to decline. Total cases then grew at an average annual rate of 2.6 per cent from 407,773 in 2001-02 to 650,224 in 2019-20, driven by an average annual growth of 3.7 per cent and 1.2 per cent in ODSP and OW cases, respectively. Total cases declined from 2019-20 to 2021-22, falling from 650,224 to 593,727, largely because federal income supports made some recipients ineligible for social assistance during the COVID-19 pandemic. From 2021-22 to 2023-24, total cases increased, reaching 648,770 cases in 2023-24.
Figure 8.4 Average monthly number of social assistance cases, 1990-91 to 2023-24
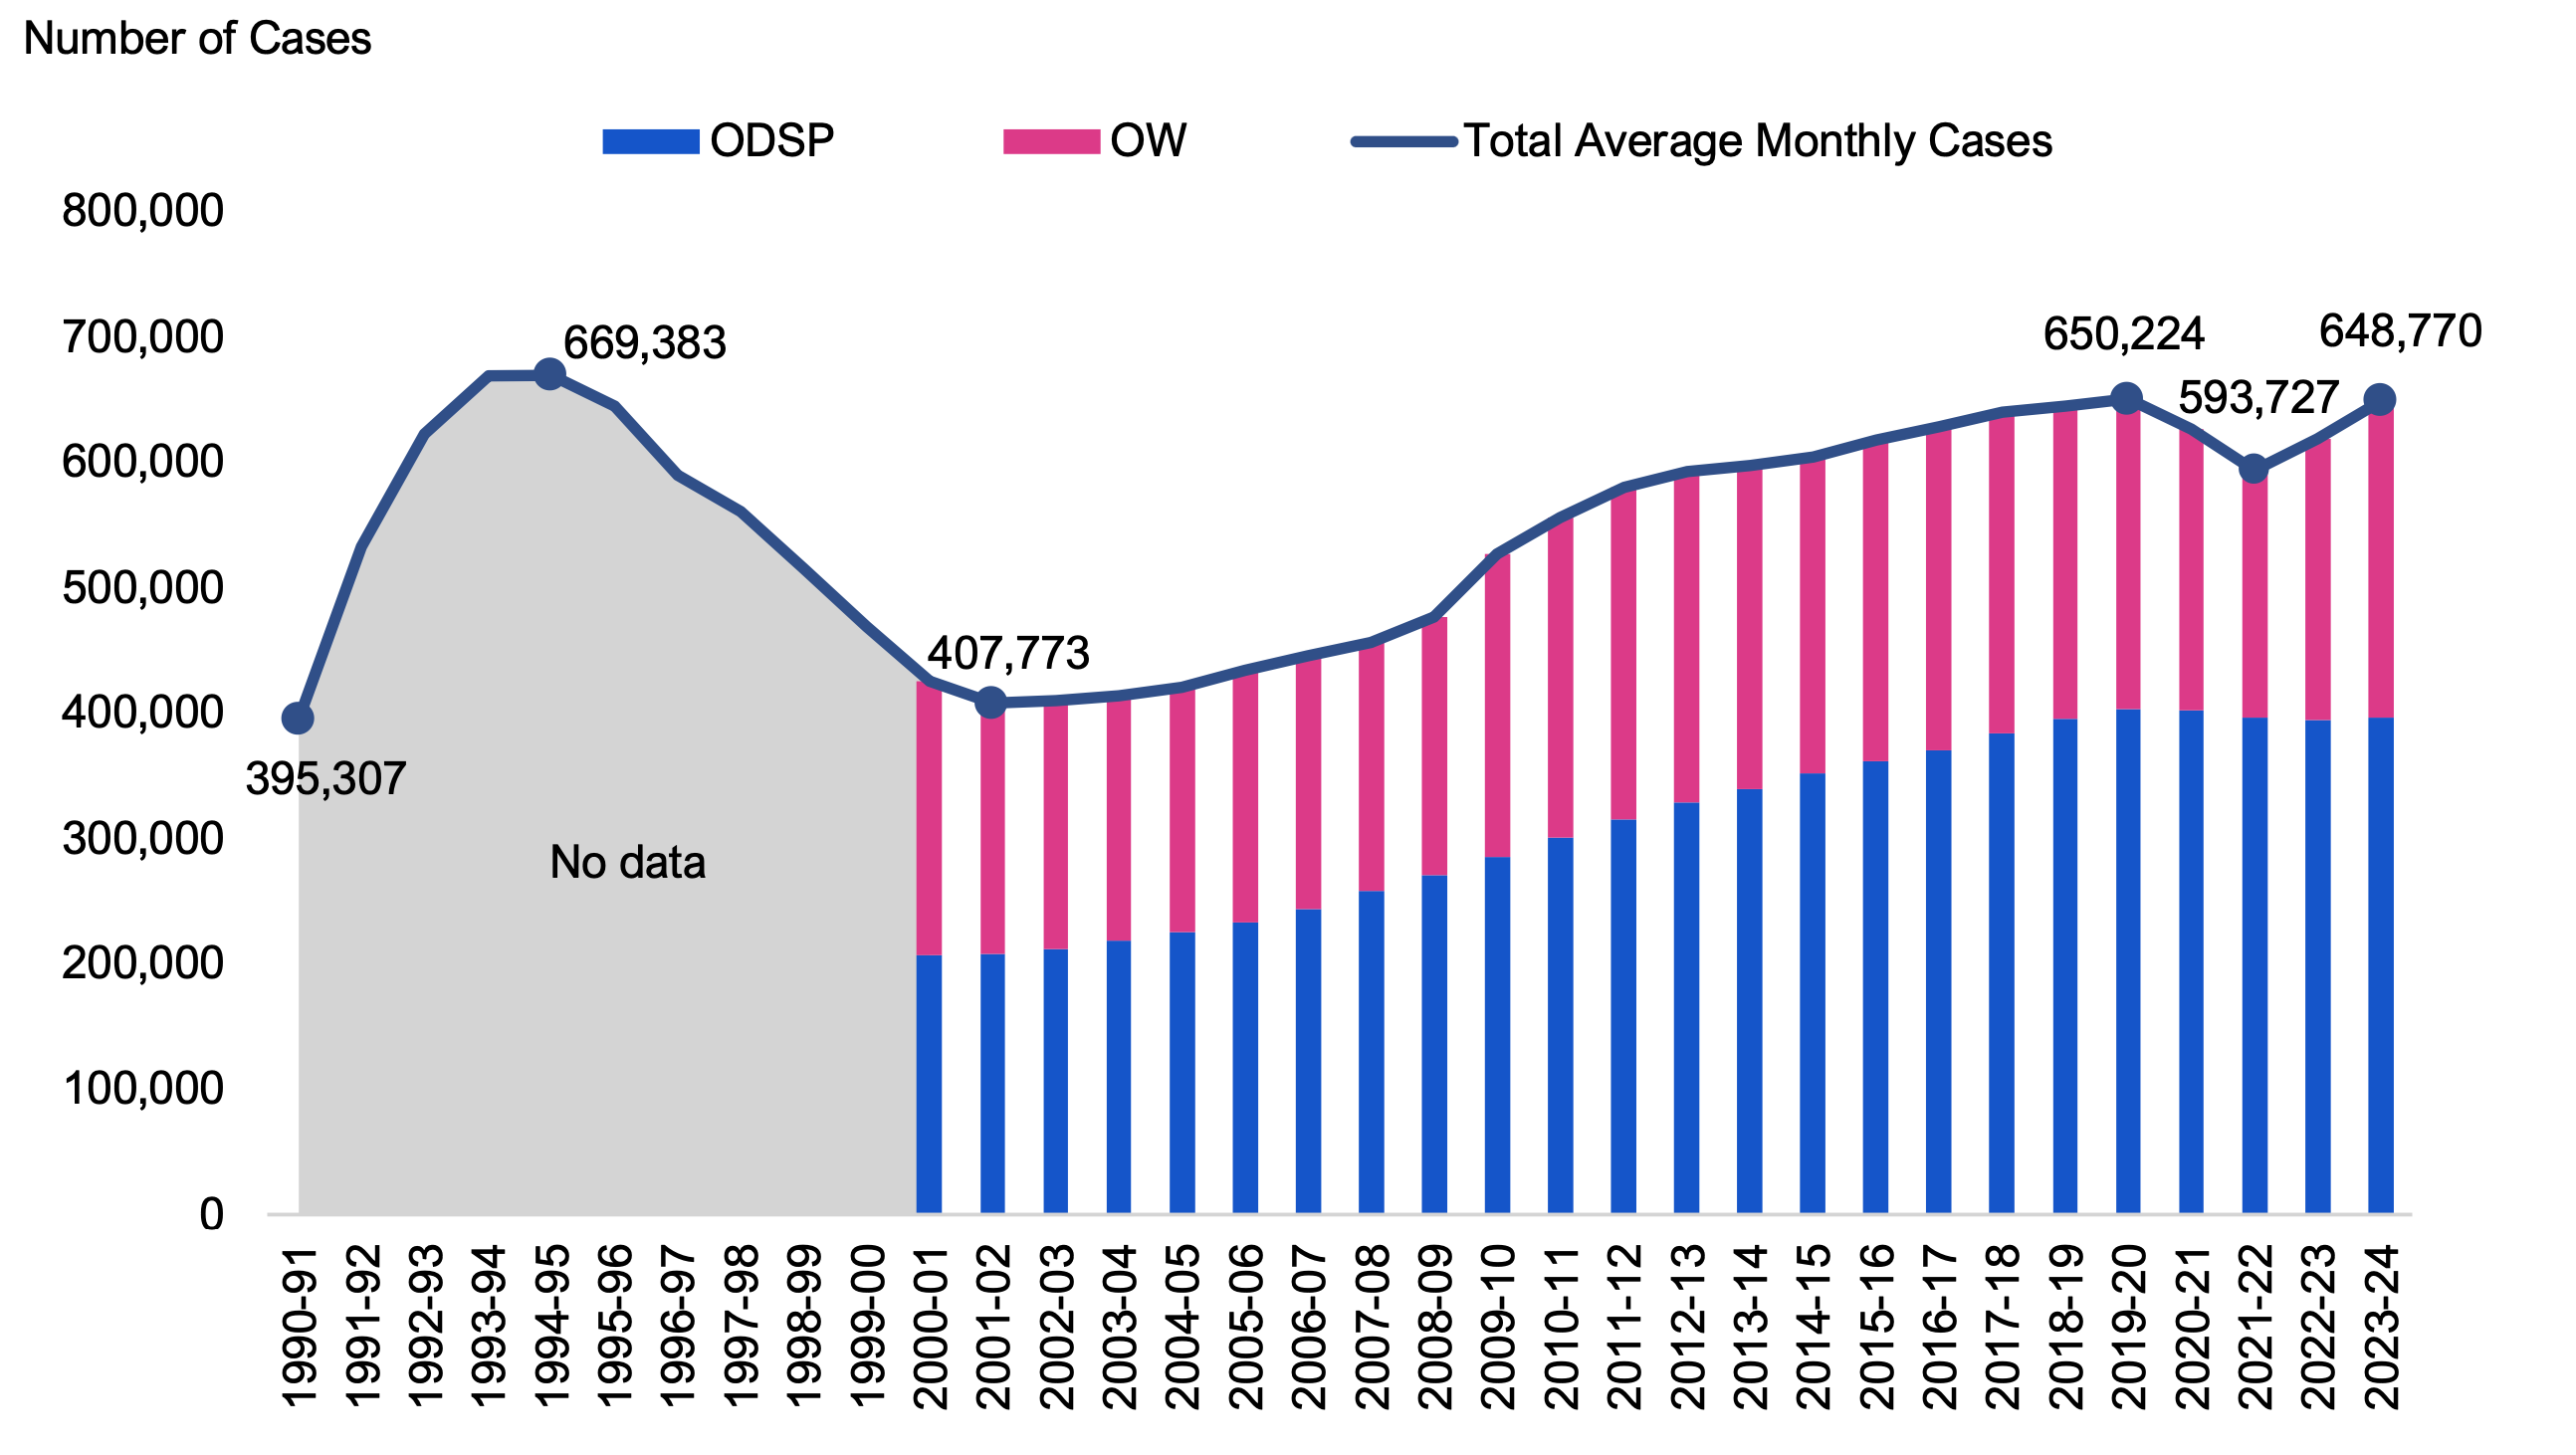
Note: ODSP cases include Assistance for Children with Severe Disabilities cases. OW cases include Temporary Care Assistance cases
SourceGovernment of Ontario, Data Catalogue: Social Assistance Caseloads and FAO analysis of information provided by the Ministry of Children, Community and Social Services
Accessible version
| Fiscal Year | ODSP | OW | Total Average Monthly Cases |
|---|---|---|---|
| 1990-91 | No Data | No Data | 395,307 |
| 1991-92 | No Data | No Data | 532,792 |
| 1992-93 | No Data | No Data | 622,977 |
| 1993-94 | No Data | No Data | 669,322 |
| 1994-95 | No Data | No Data | 669,383 |
| 1995-96 | No Data | No Data | 645,163 |
| 1996-97 | No Data | No Data | 589,812 |
| 1997-98 | No Data | No Data | 560,747 |
| 1998-99 | No Data | No Data | 514,876 |
| 1999-00 | No Data | No Data | 468,957 |
| 2000-01 | 206,745 | 218,600 | 425,345 |
| 2001-02 | 208,070 | 199,703 | 407,773 |
| 2002-03 | 211,897 | 198,397 | 410,294 |
| 2003-04 | 218,888 | 195,331 | 414,219 |
| 2004-05 | 225,750 | 194,900 | 420,650 |
| 2005-06 | 232,859 | 201,650 | 434,510 |
| 2006-07 | 243,329 | 202,673 | 446,002 |
| 2007-08 | 257,828 | 198,697 | 456,525 |
| 2008-09 | 270,298 | 206,291 | 476,590 |
| 2009-10 | 285,292 | 241,910 | 527,202 |
| 2010-11 | 300,682 | 255,655 | 556,337 |
| 2011-12 | 314,795 | 265,380 | 580,175 |
| 2012-13 | 328,291 | 264,613 | 592,903 |
| 2013-14 | 339,795 | 257,698 | 597,493 |
| 2014-15 | 352,019 | 251,990 | 604,009 |
| 2015-16 | 361,562 | 256,009 | 617,571 |
| 2016-17 | 370,609 | 257,757 | 628,367 |
| 2017-18 | 383,428 | 256,164 | 639,593 |
| 2018-19 | 395,131 | 250,218 | 645,349 |
| 2019-20 | 403,069 | 247,155 | 650,224 |
| 2020-21 | 402,685 | 224,084 | 626,769 |
| 2021-22 | 396,763 | 196,964 | 593,727 |
| 2022-23 | 394,575 | 224,460 | 619,035 |
| 2023-24 | 396,848 | 251,922 | 648,770 |
Average ODSP and OW Allowances
Real average annual ODSP and OW allowances have declined at average annual rates of -0.3 per cent and ‑1.1 per cent, respectively, from 2004-05 to 2023-24. From 2004-05 to 2010-11, real average ODSP and OW allowances were maintained at approximately the same level as periodic increases to allowance rates kept pace with inflation.[19] During a period of spending restraint following the 2008-2009 global financial crisis, annual rate increases were limited to one per cent in 2011-12 and again from 2013-14 to 2016-17.[20] As a result, from 2010-11 to 2016-17, real average ODSP and OW allowances declined at average annual rates of ‑0.2 per cent and -0.9 per cent, respectively. In 2018-19, the Province froze allowance rates, which resulted in average annual declines of -2.4 per cent and ‑3.0 per cent in ODSP and OW allowances, respectively, from 2018-19 to 2022-23. Real average annual ODSP allowances increased by 3.9 per cent in 2023-24 as the freeze on ODSP rates ended in September 2022. Real average annual OW allowances decreased by -2.7 per cent in 2023-24 as OW allowances remained frozen.
Figure 8.5 Average annual ODSP and OW allowances, inflation-adjusted, 2004-05 to 2023-24
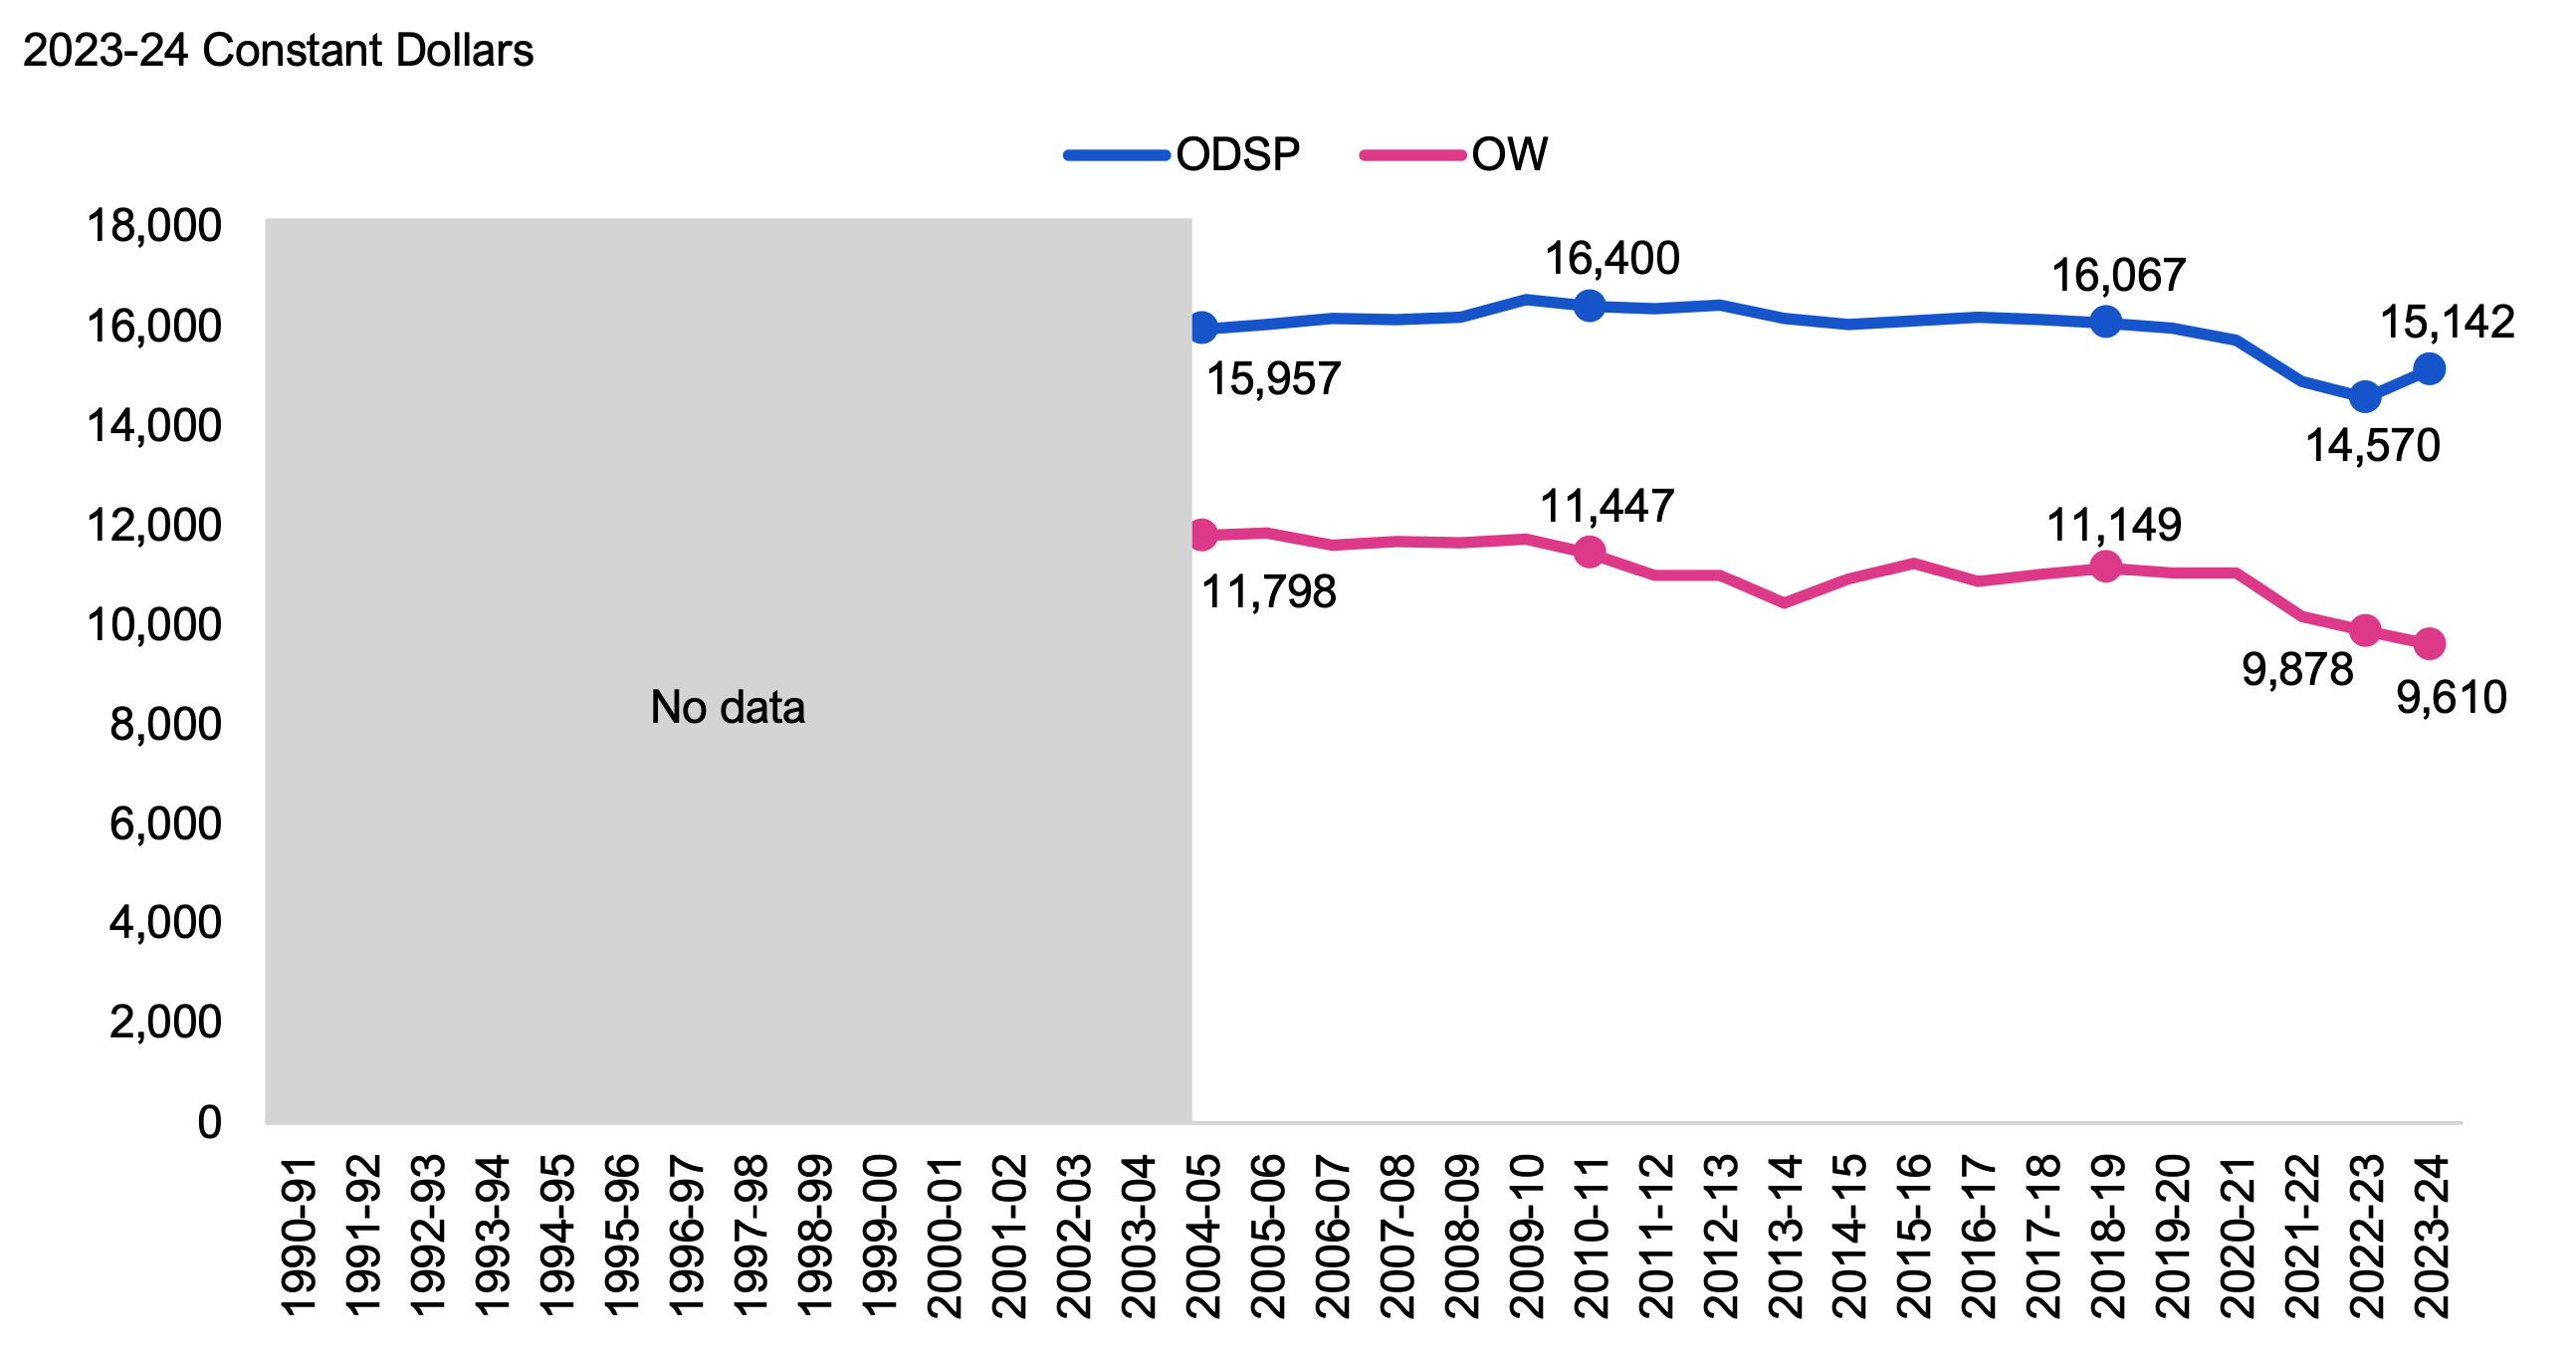
Note: Inflation-adjusted average annual ODSP allowances include municipal expenditures between 2004-05 to 2010-11, when municipalities paid a portion of ODSP allowances, but exclude expenditures on Assistance for Children with Severe Disabilities cases. Similarly, inflation-adjusted average annual OW allowances include municipal expenditures between 2004-05 to 2017-18, when municipalities paid a portion of OW allowances, but exclude expenditures on Temporary Care Assistance cases.
Source: Statistics Canada and FAO analysis of information provided by the Ministry of Children, Community and Social Services
Accessible version
| Fiscal Year | ODSP | OW |
|---|---|---|
| 1990-91 | No Data | No Data |
| 1991-92 | No Data | No Data |
| 1992-93 | No Data | No Data |
| 1993-94 | No Data | No Data |
| 1994-95 | No Data | No Data |
| 1995-96 | No Data | No Data |
| 1996-97 | No Data | No Data |
| 1997-98 | No Data | No Data |
| 1998-99 | No Data | No Data |
| 1999-00 | No Data | No Data |
| 2000-01 | No Data | No Data |
| 2001-02 | No Data | No Data |
| 2002-03 | No Data | No Data |
| 2003-04 | No Data | No Data |
| 2004-05 | 15,957 | 11,798 |
| 2005-06 | 16,044 | 11,855 |
| 2006-07 | 16,158 | 11,620 |
| 2007-08 | 16,139 | 11,690 |
| 2008-09 | 16,189 | 11,667 |
| 2009-10 | 16,543 | 11,723 |
| 2010-11 | 16,400 | 11,447 |
| 2011-12 | 16,355 | 11,010 |
| 2012-13 | 16,422 | 10,997 |
| 2013-14 | 16,163 | 10,436 |
| 2014-15 | 16,043 | 10,919 |
| 2015-16 | 16,118 | 11,239 |
| 2016-17 | 16,187 | 10,875 |
| 2017-18 | 16,136 | 11,020 |
| 2018-19 | 16,067 | 11,149 |
| 2019-20 | 15,970 | 11,042 |
| 2020-21 | 15,737 | 11,049 |
| 2021-22 | 14,899 | 10,172 |
| 2022-23 | 14,570 | 9,878 |
| 2023-24 | 15,142 | 9,610 |
9. Justice
Spending Trends
Justice is the seventh largest sector in the government, accounting for 2.9 per cent of total spending in 2023-24. This sector primarily consists of spending on correctional services and facilities, the Ontario Provincial Police (OPP), court services, criminal prosecutions, and Legal Aid Ontario. The FAO estimates that justice sector spending grew at an average annual rate of 4.0 per cent from $1.6 billion in 1990-91 to $6.0 billion in 2023-24. After adjusting for inflation, this sector’s spending grew at an average annual rate of 1.8 per cent from 1990-91 to 2023-24.
Figure 9.1 Justice sector spending, nominal and inflation-adjusted, 1990-91 to 2023-24
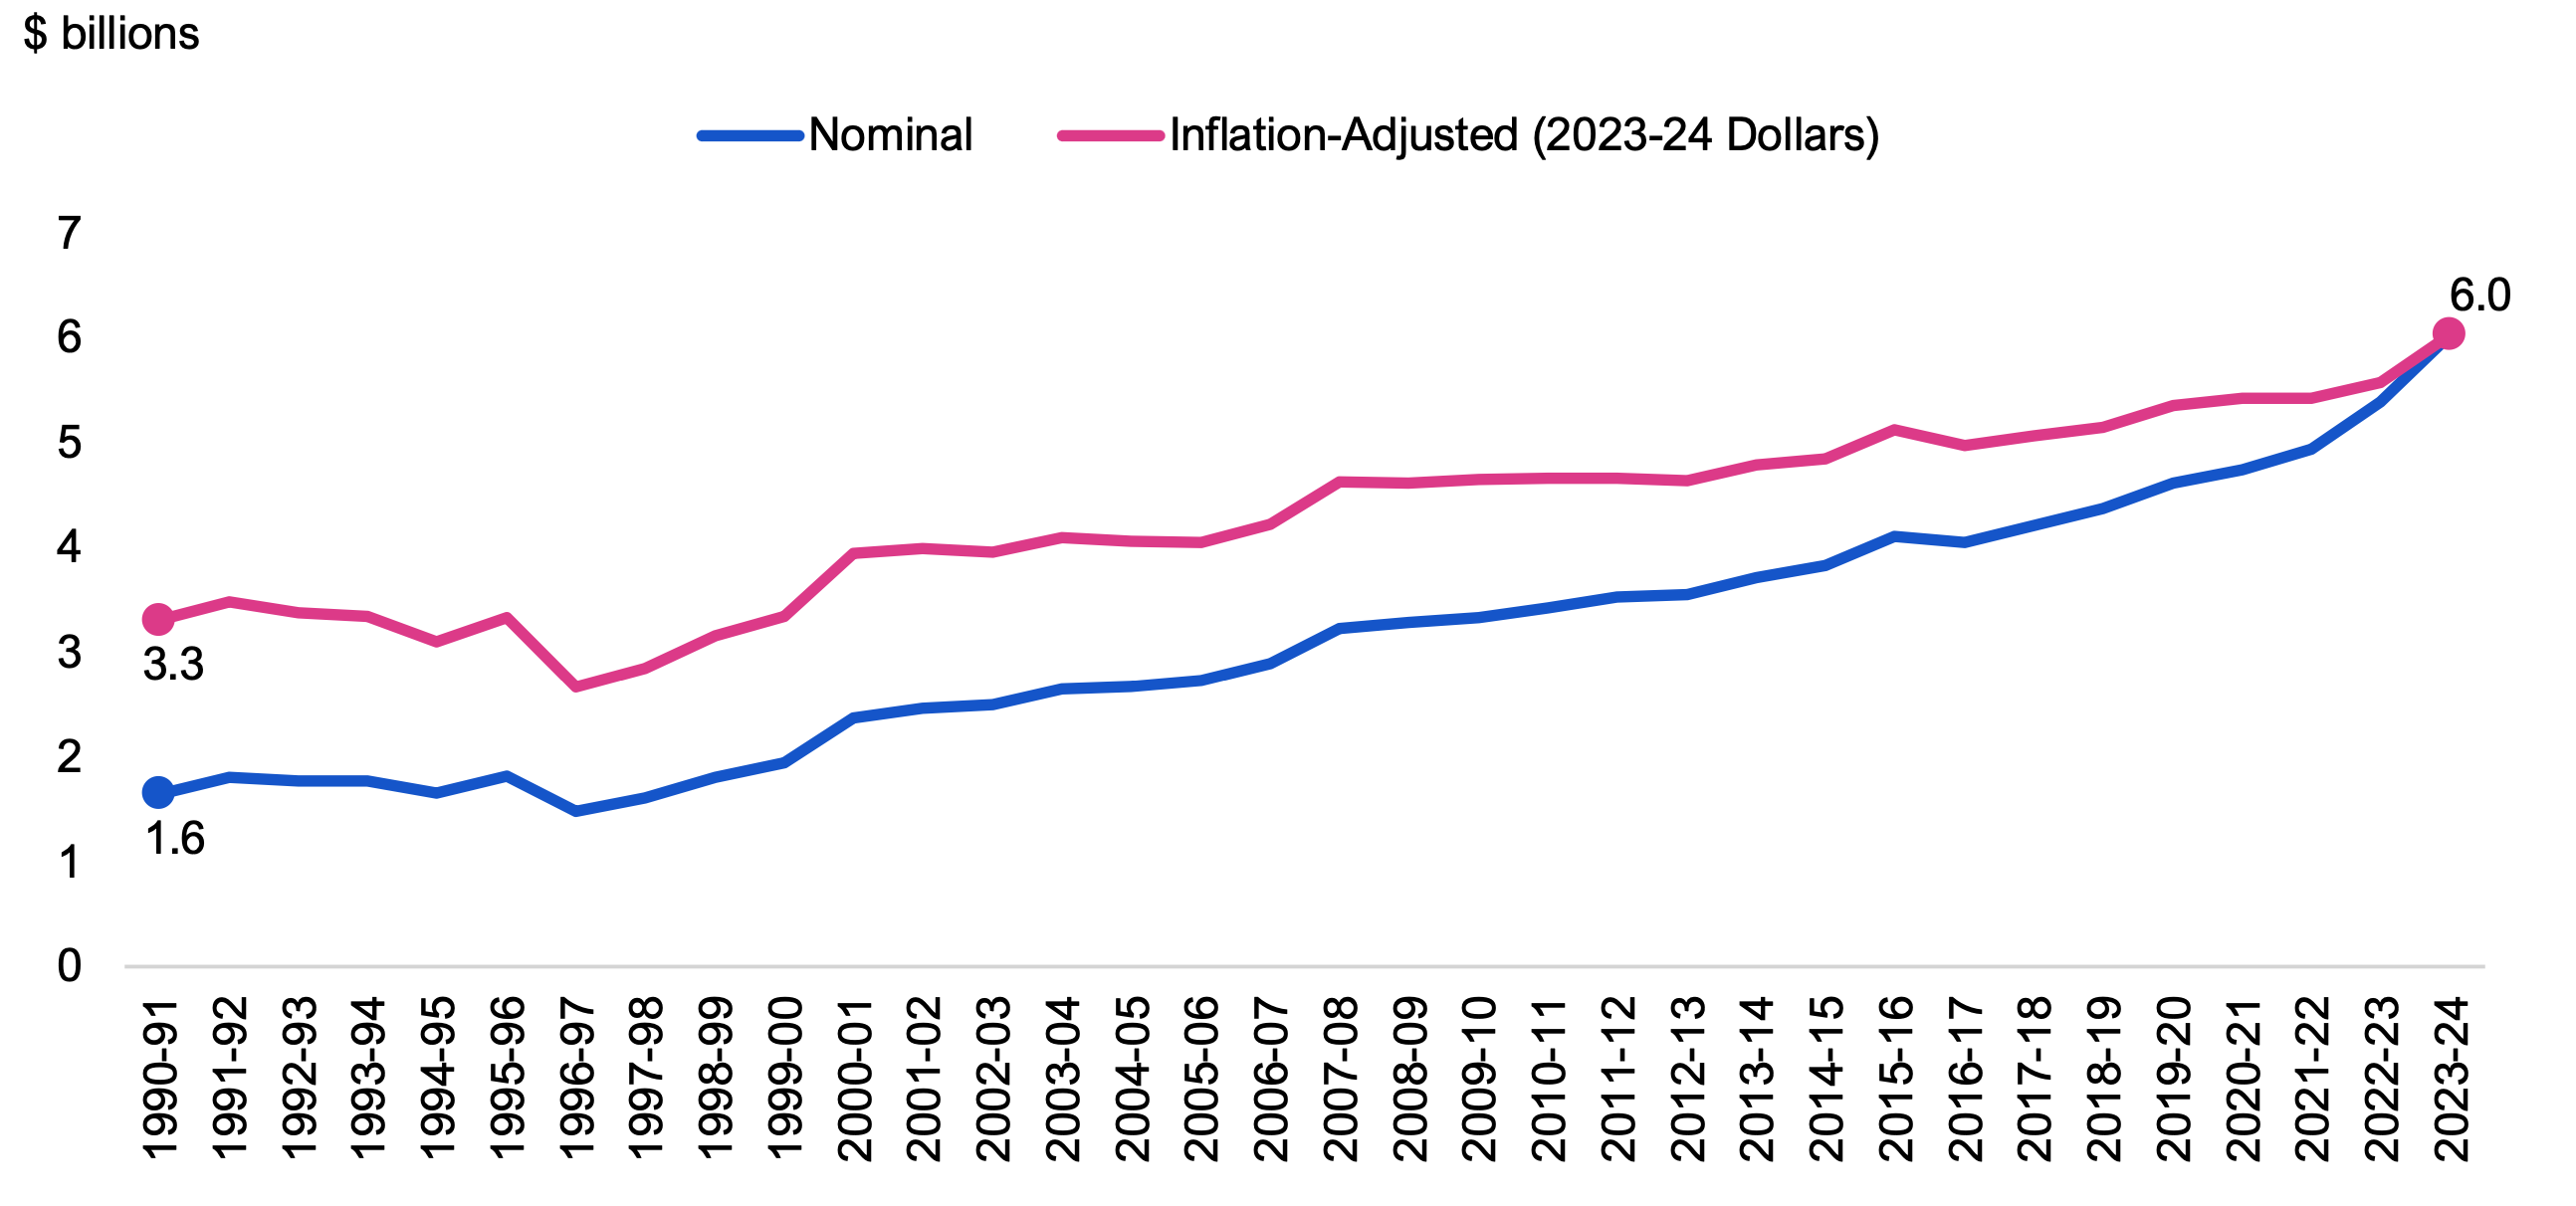
Source: FAO calculations, Statistics Canada, Public Accounts of Ontario and FAO analysis of information provided by the Province.
Accessible version
| Fiscal Year | Nominal | Inflation-adjusted (2023-24 Dollars) |
|---|---|---|
| 1990-91 | 1.6 | 3.3 |
| 1991-92 | 1.8 | 3.5 |
| 1992-93 | 1.8 | 3.4 |
| 1993-94 | 1.8 | 3.3 |
| 1994-95 | 1.7 | 3.1 |
| 1995-96 | 1.8 | 3.3 |
| 1996-97 | 1.5 | 2.7 |
| 1997-98 | 1.6 | 2.8 |
| 1998-99 | 1.8 | 3.2 |
| 1999-00 | 1.9 | 3.3 |
| 2000-01 | 2.4 | 3.9 |
| 2001-02 | 2.5 | 4.0 |
| 2002-03 | 2.5 | 4.0 |
| 2003-04 | 2.7 | 4.1 |
| 2004-05 | 2.7 | 4.1 |
| 2005-06 | 2.7 | 4.1 |
| 2006-07 | 2.9 | 4.2 |
| 2007-08 | 3.2 | 4.6 |
| 2008-09 | 3.3 | 4.6 |
| 2009-10 | 3.3 | 4.7 |
| 2010-11 | 3.4 | 4.7 |
| 2011-12 | 3.5 | 4.7 |
| 2012-13 | 3.6 | 4.6 |
| 2013-14 | 3.7 | 4.8 |
| 2014-15 | 3.8 | 4.8 |
| 2015-16 | 4.1 | 5.1 |
| 2016-17 | 4.1 | 5.0 |
| 2017-18 | 4.2 | 5.1 |
| 2018-19 | 4.4 | 5.2 |
| 2019-20 | 4.6 | 5.4 |
| 2020-21 | 4.8 | 5.4 |
| 2021-22 | 4.9 | 5.4 |
| 2022-23 | 5.4 | 5.6 |
| 2023-24 | 6.0 | 6.0 |
In addition to inflation, population growth is an important cost driver of justice sector spending. The following presents justice sector spending on an inflation-adjusted (i.e., real) per capita basis to provide a better indication of the impact that justice sector spending has on service levels over time. The FAO estimates real per capita justice sector spending increased at an average annual rate of 0.5 per cent, rising from $320 per person in 1990-91 to $383 per person in 2023-24.
Figure 9.2 Justice sector spending per capita, inflation-adjusted, 1990-91 to 2023-24
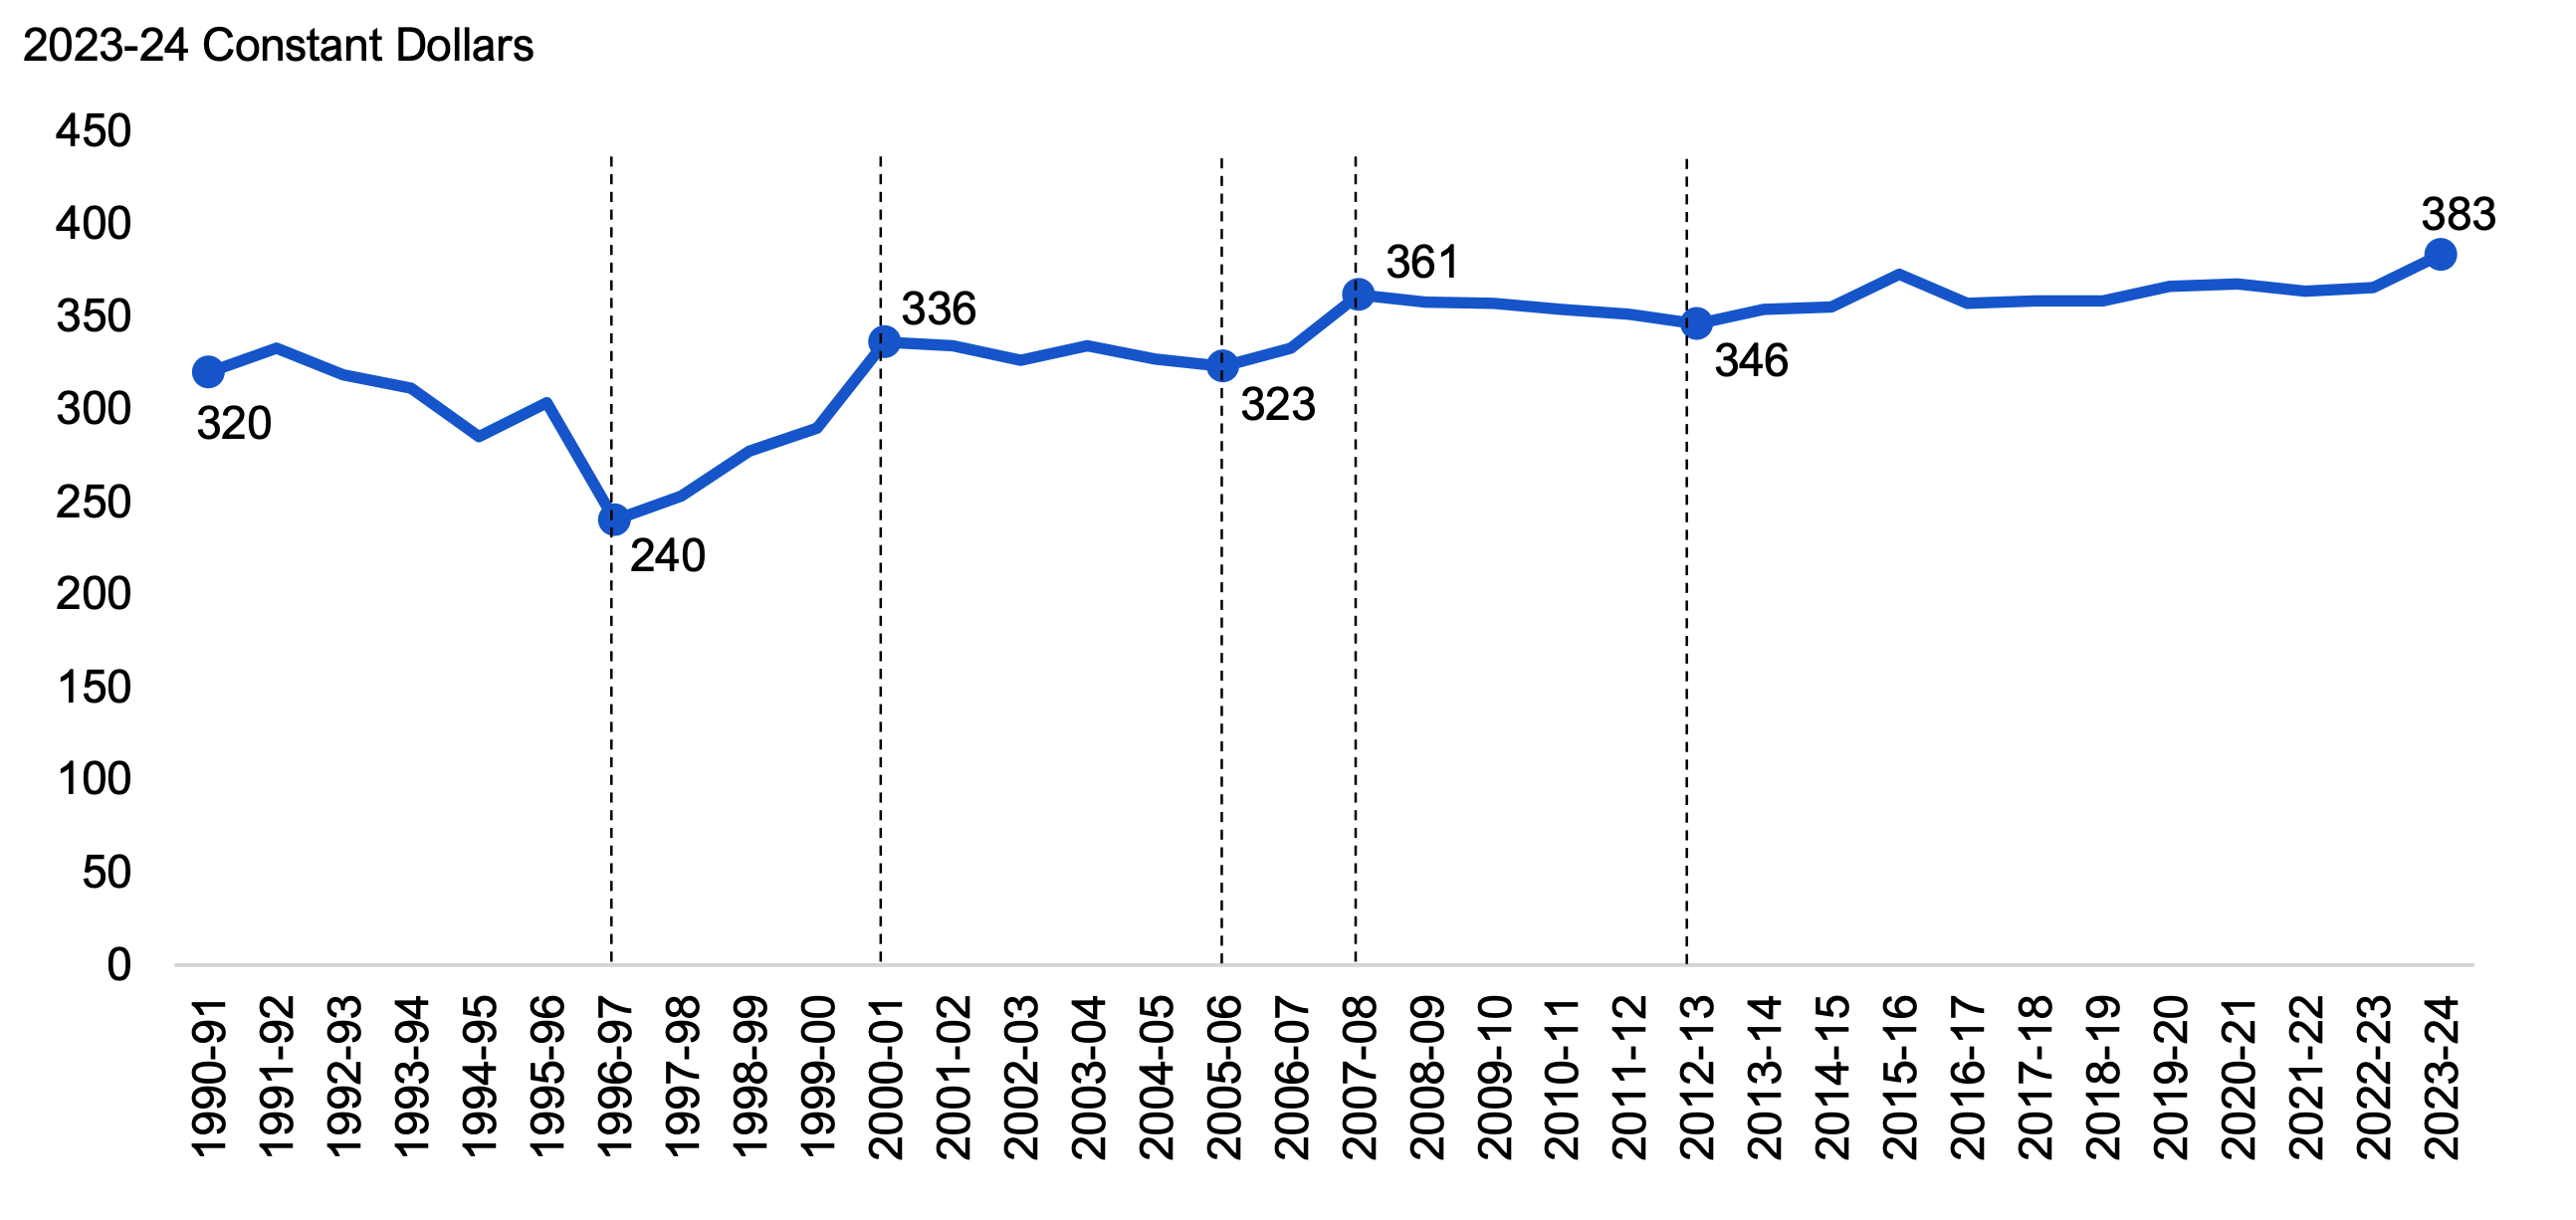
Source: FAO calculations, Statistics Canada, Public Accounts of Ontario and FAO analysis of information provided by the Province.
Accessible version
| Fiscal Year | Spending Per Capita |
|---|---|
| 1990-91 | 320 |
| 1991-92 | 333 |
| 1992-93 | 319 |
| 1993-94 | 312 |
| 1994-95 | 285 |
| 1995-96 | 304 |
| 1996-97 | 240 |
| 1997-98 | 253 |
| 1998-99 | 278 |
| 1999-00 | 289 |
| 2000-01 | 336 |
| 2001-02 | 334 |
| 2002-03 | 327 |
| 2003-04 | 334 |
| 2004-05 | 327 |
| 2005-06 | 323 |
| 2006-07 | 333 |
| 2007-08 | 361 |
| 2008-09 | 358 |
| 2009-10 | 357 |
| 2010-11 | 354 |
| 2011-12 | 351 |
| 2012-13 | 346 |
| 2013-14 | 354 |
| 2014-15 | 355 |
| 2015-16 | 373 |
| 2016-17 | 357 |
| 2017-18 | 359 |
| 2018-19 | 358 |
| 2019-20 | 367 |
| 2020-21 | 368 |
| 2021-22 | 364 |
| 2022-23 | 366 |
| 2023-24 | 383 |
Based on real per capita spending, the FAO has identified six distinct periods of justice sector spending between 1990-91 to 2023-24:
1990-91 to 1996-97
From 1990-91 to 1996-97, real per capita justice sector spending decreased from $320 to $240 at an average annual rate of -4.7 per cent. This decline was due to efforts by the Province to reduce overall government spending, which included capping Legal Aid Ontario funding and decreasing the capacity of provincial correctional facilities.
1996-97 to 2000-01
From 1996-97 to 2000-01, real per capita justice sector spending grew from $240 to $336 at an average annual rate of 8.8 per cent. This growth was led by increased spending for the Ontario Provincial Police. This period also saw increased spending for correctional services, court services and criminal prosecutions.
2000-01 to 2005-06
From 2000-01 to 2005-06, real per capita justice sector spending declined from $336 to $323 at an average annual rate of -0.8 per cent. This period was characterized by decreased spending for correctional services and slowed spending growth for court services and the Ontario Provincial Police.
2005-06 to 2007-08
From 2005-06 to 2007-08, real per capita justice sector spending grew from $323 to $361 at an average annual rate of 5.8 per cent. This was the result of increased spending for court services, Legal Aid, the Ontario Provincial Police and correctional services.
2007-08 to 2012-13
From 2007-08 to 2012-13, real per capita justice sector spending declined from $361 to $346 at an average annual rate of -0.9 per cent. This decline was led by decreased spending for court services and slowed growth in spending for correctional services.
2012-13 to 2023-24
From 2012-13 to 2023-24, real per capita justice sector spending increased from $346 to $383 at an average annual rate of 0.9 per cent. This increase was led by spending growth in the Ontario Provincial Police and correctional services.
Figure 9.3 Average annual growth in real per capita justice sector spending, 1990-91 to 2023-24
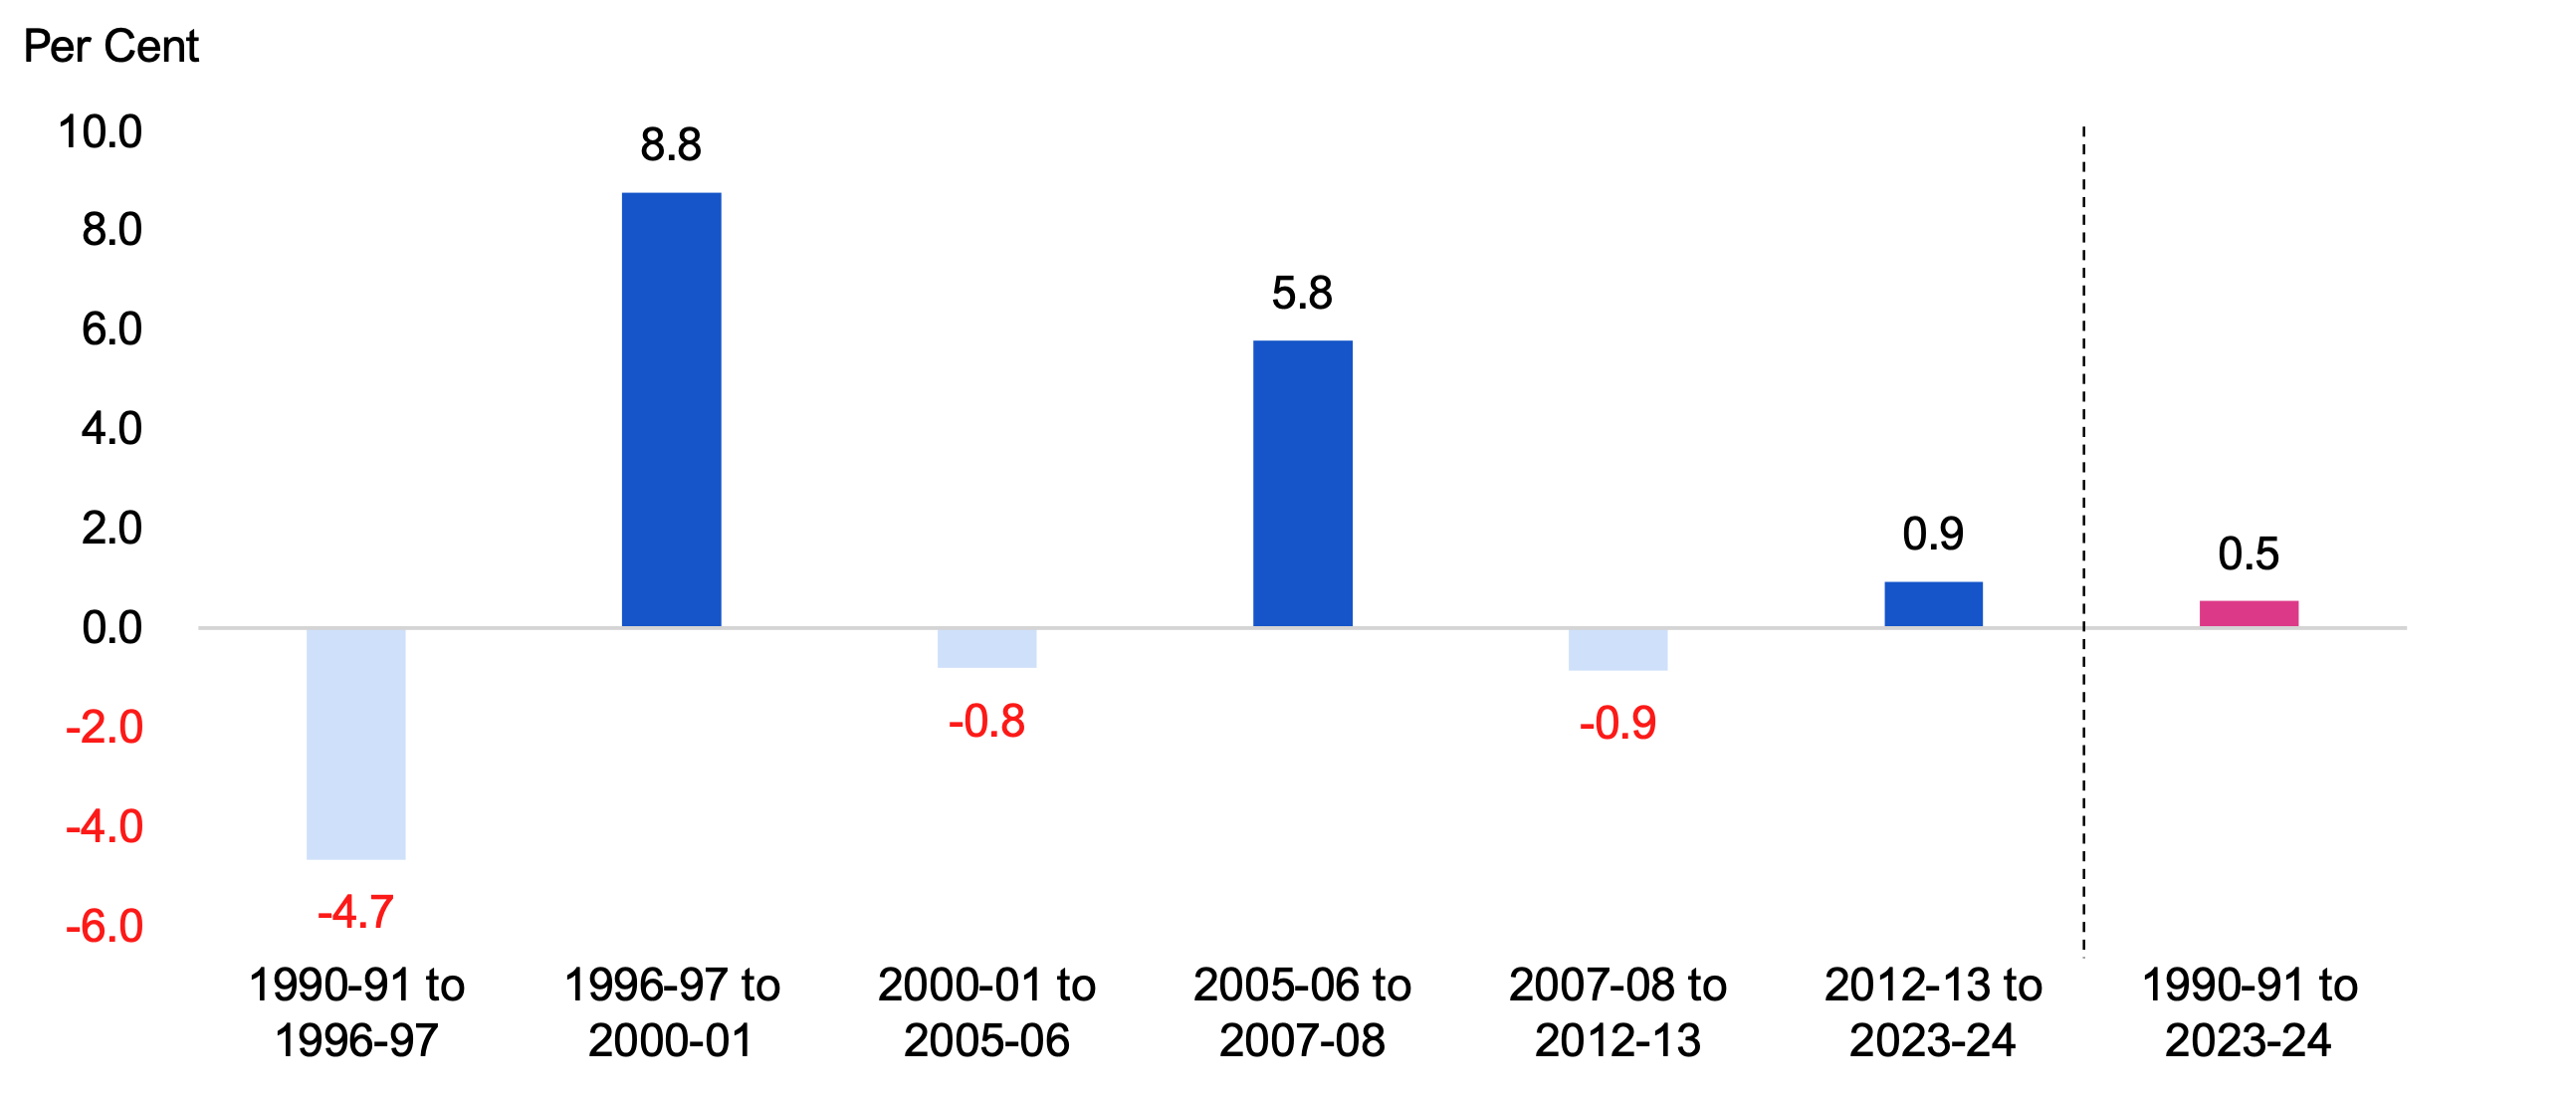
Source: FAO calculations, Statistics Canada, Public Accounts of Ontario and FAO analysis of information provided by the Province.
Accessible version
| Fiscal Years | 1990-91 to 1996-97 | 1996-97 to 2000-01 | 2000-01 to 2005-06 | 2005-06 to 2007-08 | 2007-08 to 2012-13 | 2012-13 to 2023-24 | 1990-91 to 2023-24 |
|---|---|---|---|---|---|---|---|
| Average Annual Growth | -4.7 | 8.8 | -0.8 | 5.8 | -0.9 | 0.9 | 0.5 |
Select Service Levels
In this section, the FAO analyzes two broad justice sector service level trends: number of uniformed OPP officers and the capacity of provincial adult correctional facilities. There are many other measures of justice sector service levels and performance. For more information, see the 2023-2024 Court Services Division Annual Report, the 2023 OPP Annual Report and the 2023 data release of inmates in Ontario.
Uniformed OPP Officers
Over the 34-year period, the number of uniformed OPP officers per 10,000 Ontarians declined from 4.5 in 1990 to 3.9 in 2023. From 1990 to 1993, in response to measures to reduce government spending, the number of uniformed OPP officers per 10,000 Ontarians declined from 4.5 to 4.1. This was followed by a period of steady increases, with the number of uniformed OPP officers per 10,000 Ontarians increasing to 4.7 by 2010, driven by spending growth in areas such as cybercrime and organized crime. The number of uniformed OPP officers per 10,000 Ontarians then steadily decreased to 3.8 in 2020, partially driven by a higher job vacancy rate for front-line constable positions,[21] before increasing to 3.9 in 2023.
Figure 9.4 Number of uniformed OPP officers per 10,000 Ontarians, 1990 to 2023
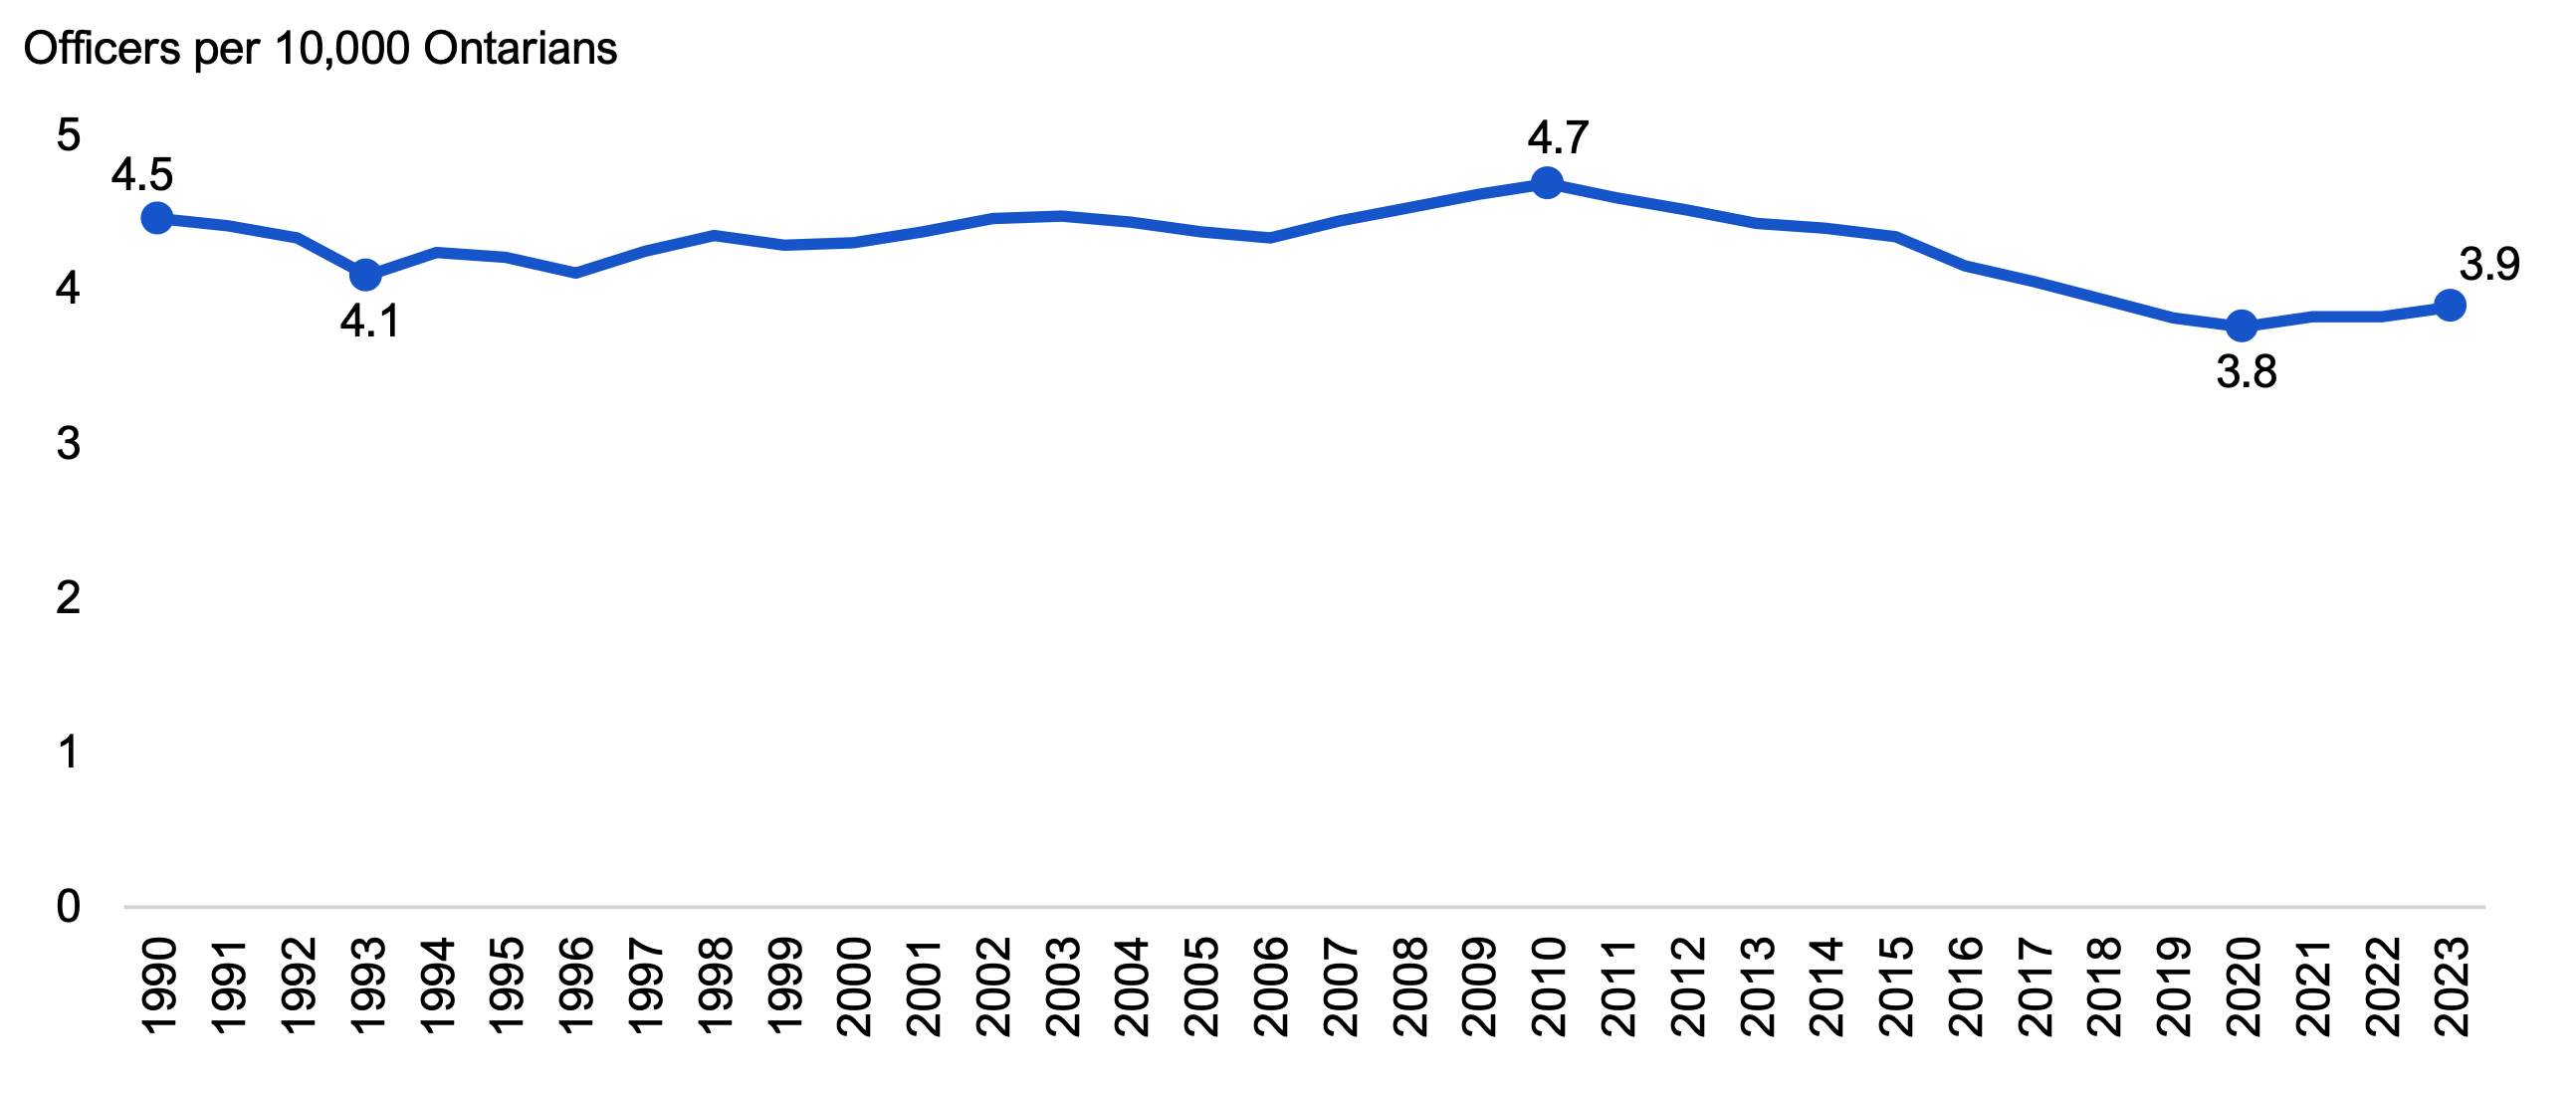
Source: Statistics Canada and FAO analysis of information provided by the Province.
Accessible version
| Year | Number of Uniformed OPP Officers Per 10,000 Adult Ontarians |
|---|---|
| 1990 | 4.5 |
| 1991 | 4.4 |
| 1992 | 4.3 |
| 1993 | 4.1 |
| 1994 | 4.2 |
| 1995 | 4.2 |
| 1996 | 4.1 |
| 1997 | 4.2 |
| 1998 | 4.3 |
| 1999 | 4.3 |
| 2000 | 4.3 |
| 2001 | 4.4 |
| 2002 | 4.5 |
| 2003 | 4.5 |
| 2004 | 4.4 |
| 2005 | 4.4 |
| 2006 | 4.3 |
| 2007 | 4.4 |
| 2008 | 4.5 |
| 2009 | 4.6 |
| 2010 | 4.7 |
| 2011 | 4.6 |
| 2012 | 4.5 |
| 2013 | 4.4 |
| 2014 | 4.4 |
| 2015 | 4.3 |
| 2016 | 4.2 |
| 2017 | 4.1 |
| 2018 | 3.9 |
| 2019 | 3.8 |
| 2020 | 3.8 |
| 2021 | 3.8 |
| 2022 | 3.8 |
| 2023 | 3.9 |
Capacity of Provincial Adult Correctional Facilities
From 1991-92 to 2023-24, the number of beds in provincial adult correctional facilities decreased from 11.3 per 10,000 adult Ontarians in 1991-92 to a low of 6.1 in 2022-23, before increasing to 6.4 in 2023-24.[22] This largely corresponds with the trend in the incarceration rate over the same period, which declined from 10.9 incarcerated individuals in provincial correctional facilities per 10,000 adult Ontarians in 1991-92 to 5.4 in 2020-21. The number of incarcerated individuals in provincial correctional facilities per 10,000 adult Ontarians then increased to 6.4 in 2022-23 and 7.3 in 2023-24, which exceeded the number of beds in correctional facilities.[23]
Figure 9.5 Number of beds in provincial adult correctional facilities per 10,000 adult Ontarians, 1991-92 to 2023-24
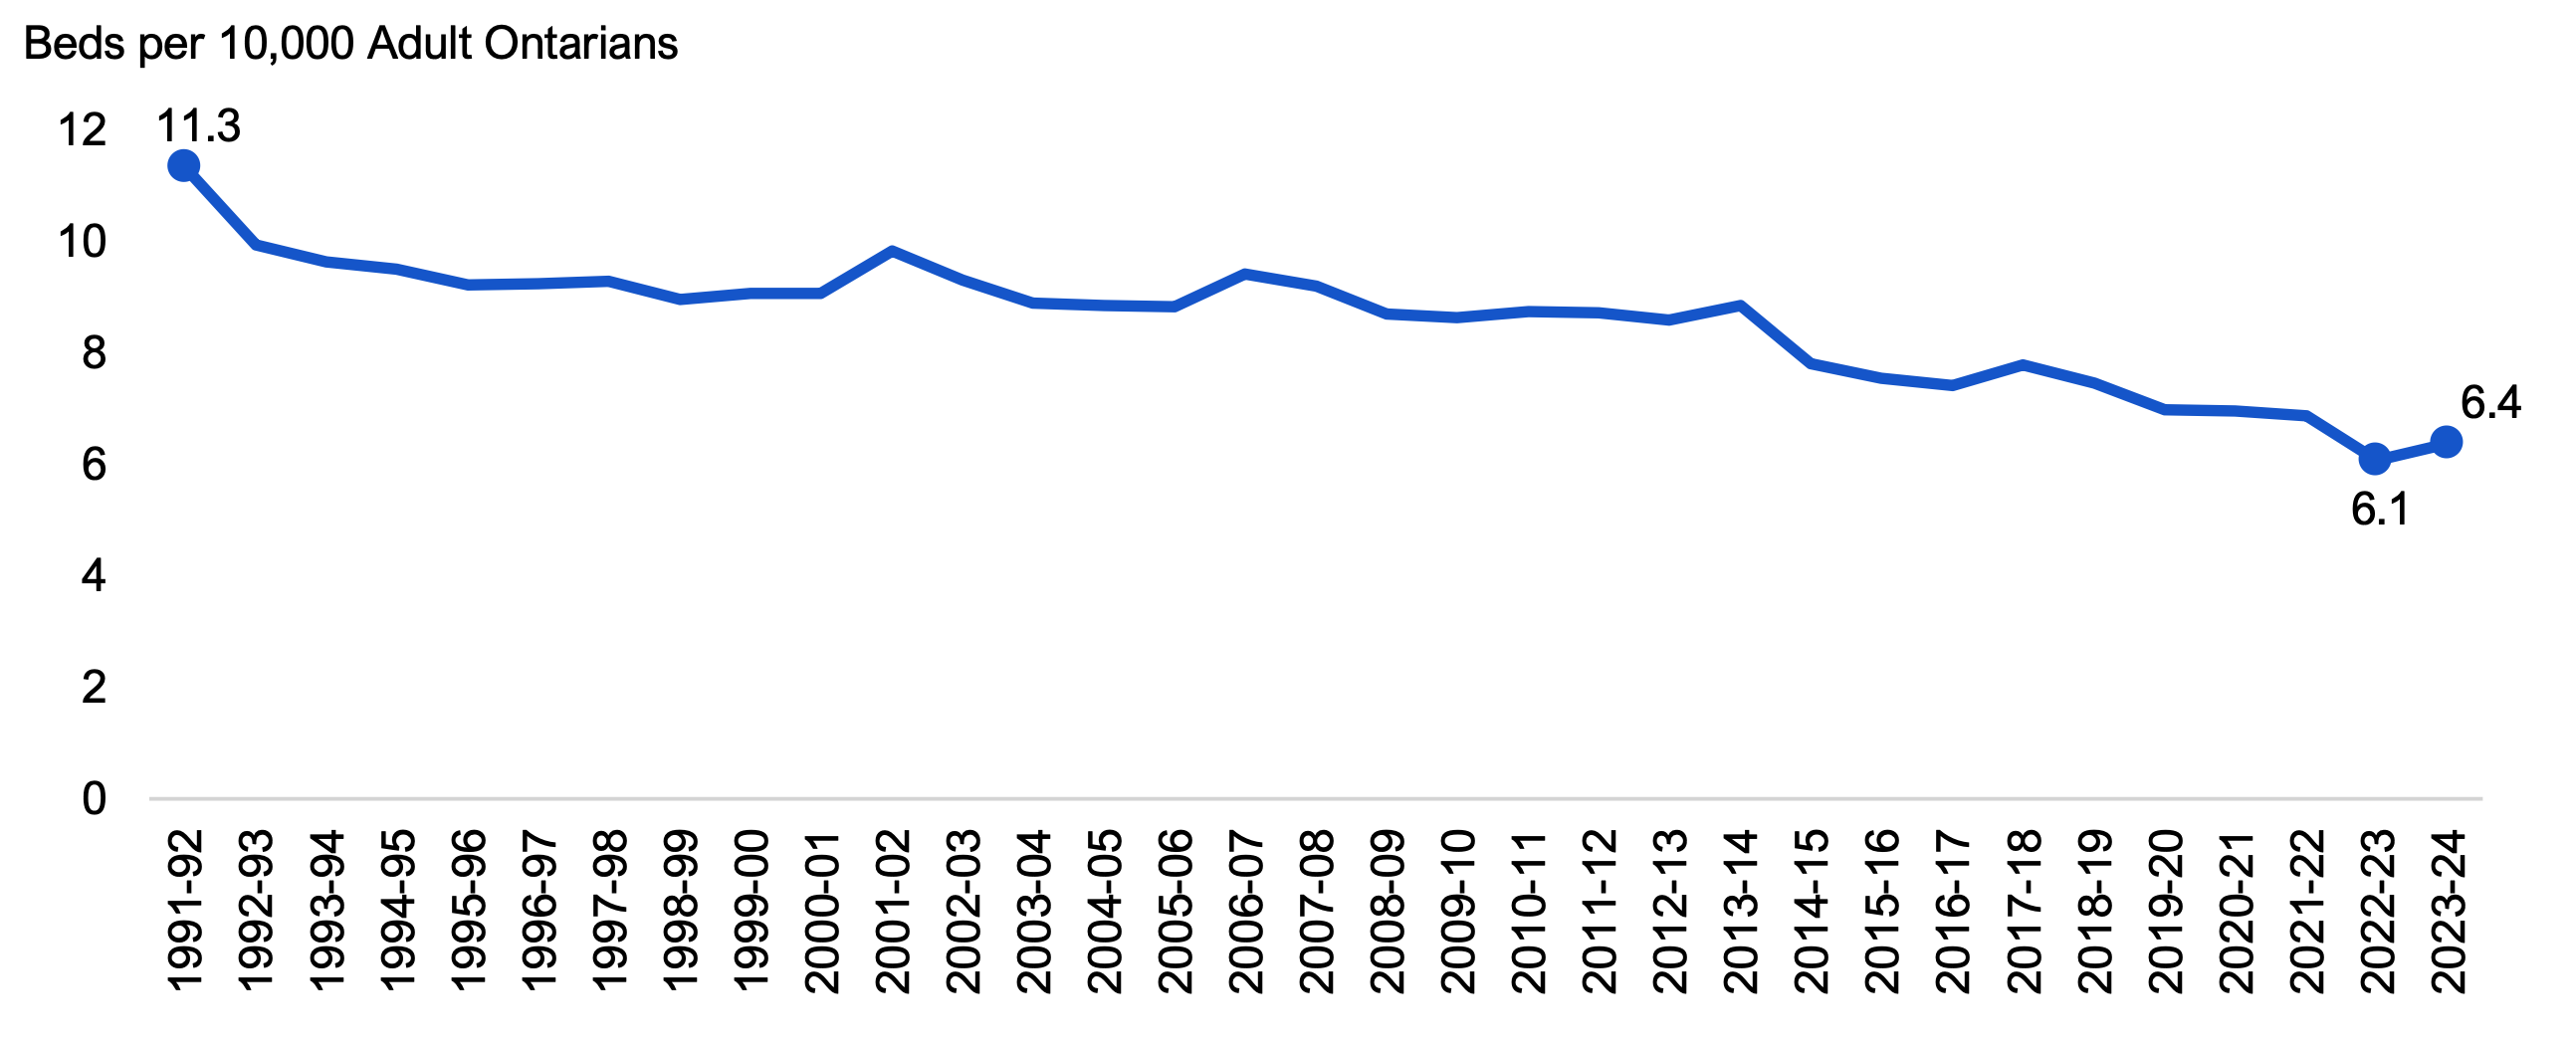
Source: Statistics Canada and FAO analysis of information provided by the Province.
Accessible version
| Fiscal Year | Number of Beds in Provincial Adult Correctional Facilities Per 10,000 Adult Ontarians |
|---|---|
| 1991-92 | 11.3 |
| 1992-93 | 9.9 |
| 1993-94 | 9.6 |
| 1994-95 | 9.5 |
| 1995-96 | 9.2 |
| 1996-97 | 9.2 |
| 1997-98 | 9.3 |
| 1998-99 | 9.0 |
| 1999-00 | 9.1 |
| 2000-01 | 9.1 |
| 2001-02 | 9.8 |
| 2002-03 | 9.3 |
| 2003-04 | 8.9 |
| 2004-05 | 8.8 |
| 2005-06 | 8.8 |
| 2006-07 | 9.4 |
| 2007-08 | 9.2 |
| 2008-09 | 8.7 |
| 2009-10 | 8.6 |
| 2010-11 | 8.7 |
| 2011-12 | 8.7 |
| 2012-13 | 8.6 |
| 2013-14 | 8.9 |
| 2014-15 | 7.8 |
| 2015-16 | 7.5 |
| 2016-17 | 7.4 |
| 2017-18 | 7.8 |
| 2018-19 | 7.5 |
| 2019-20 | 7.0 |
| 2020-21 | 6.9 |
| 2021-22 | 6.9 |
| 2022-23 | 6.1 |
| 2023-24 | 6.4 |
10. Other Programs
Spending Trends
‘Other programs’ is the third largest sector in the government, accounting for 15.6 per cent of total spending in 2023-24. The largest program areas within ‘other programs’ are energy, transportation and infrastructure. The FAO estimates ‘other programs’ spending grew at an average annual rate of 3.8 per cent from $9.4 billion in 1990-91 to $32.2 billion in 2023-24. After adjusting for inflation, ‘other programs’ spending grew at an average annual rate of 1.6 per cent from 1990-91 to 2023-24.
Figure 10.1 Other programs spending, nominal and inflation-adjusted, 1990-91 to 2023-24
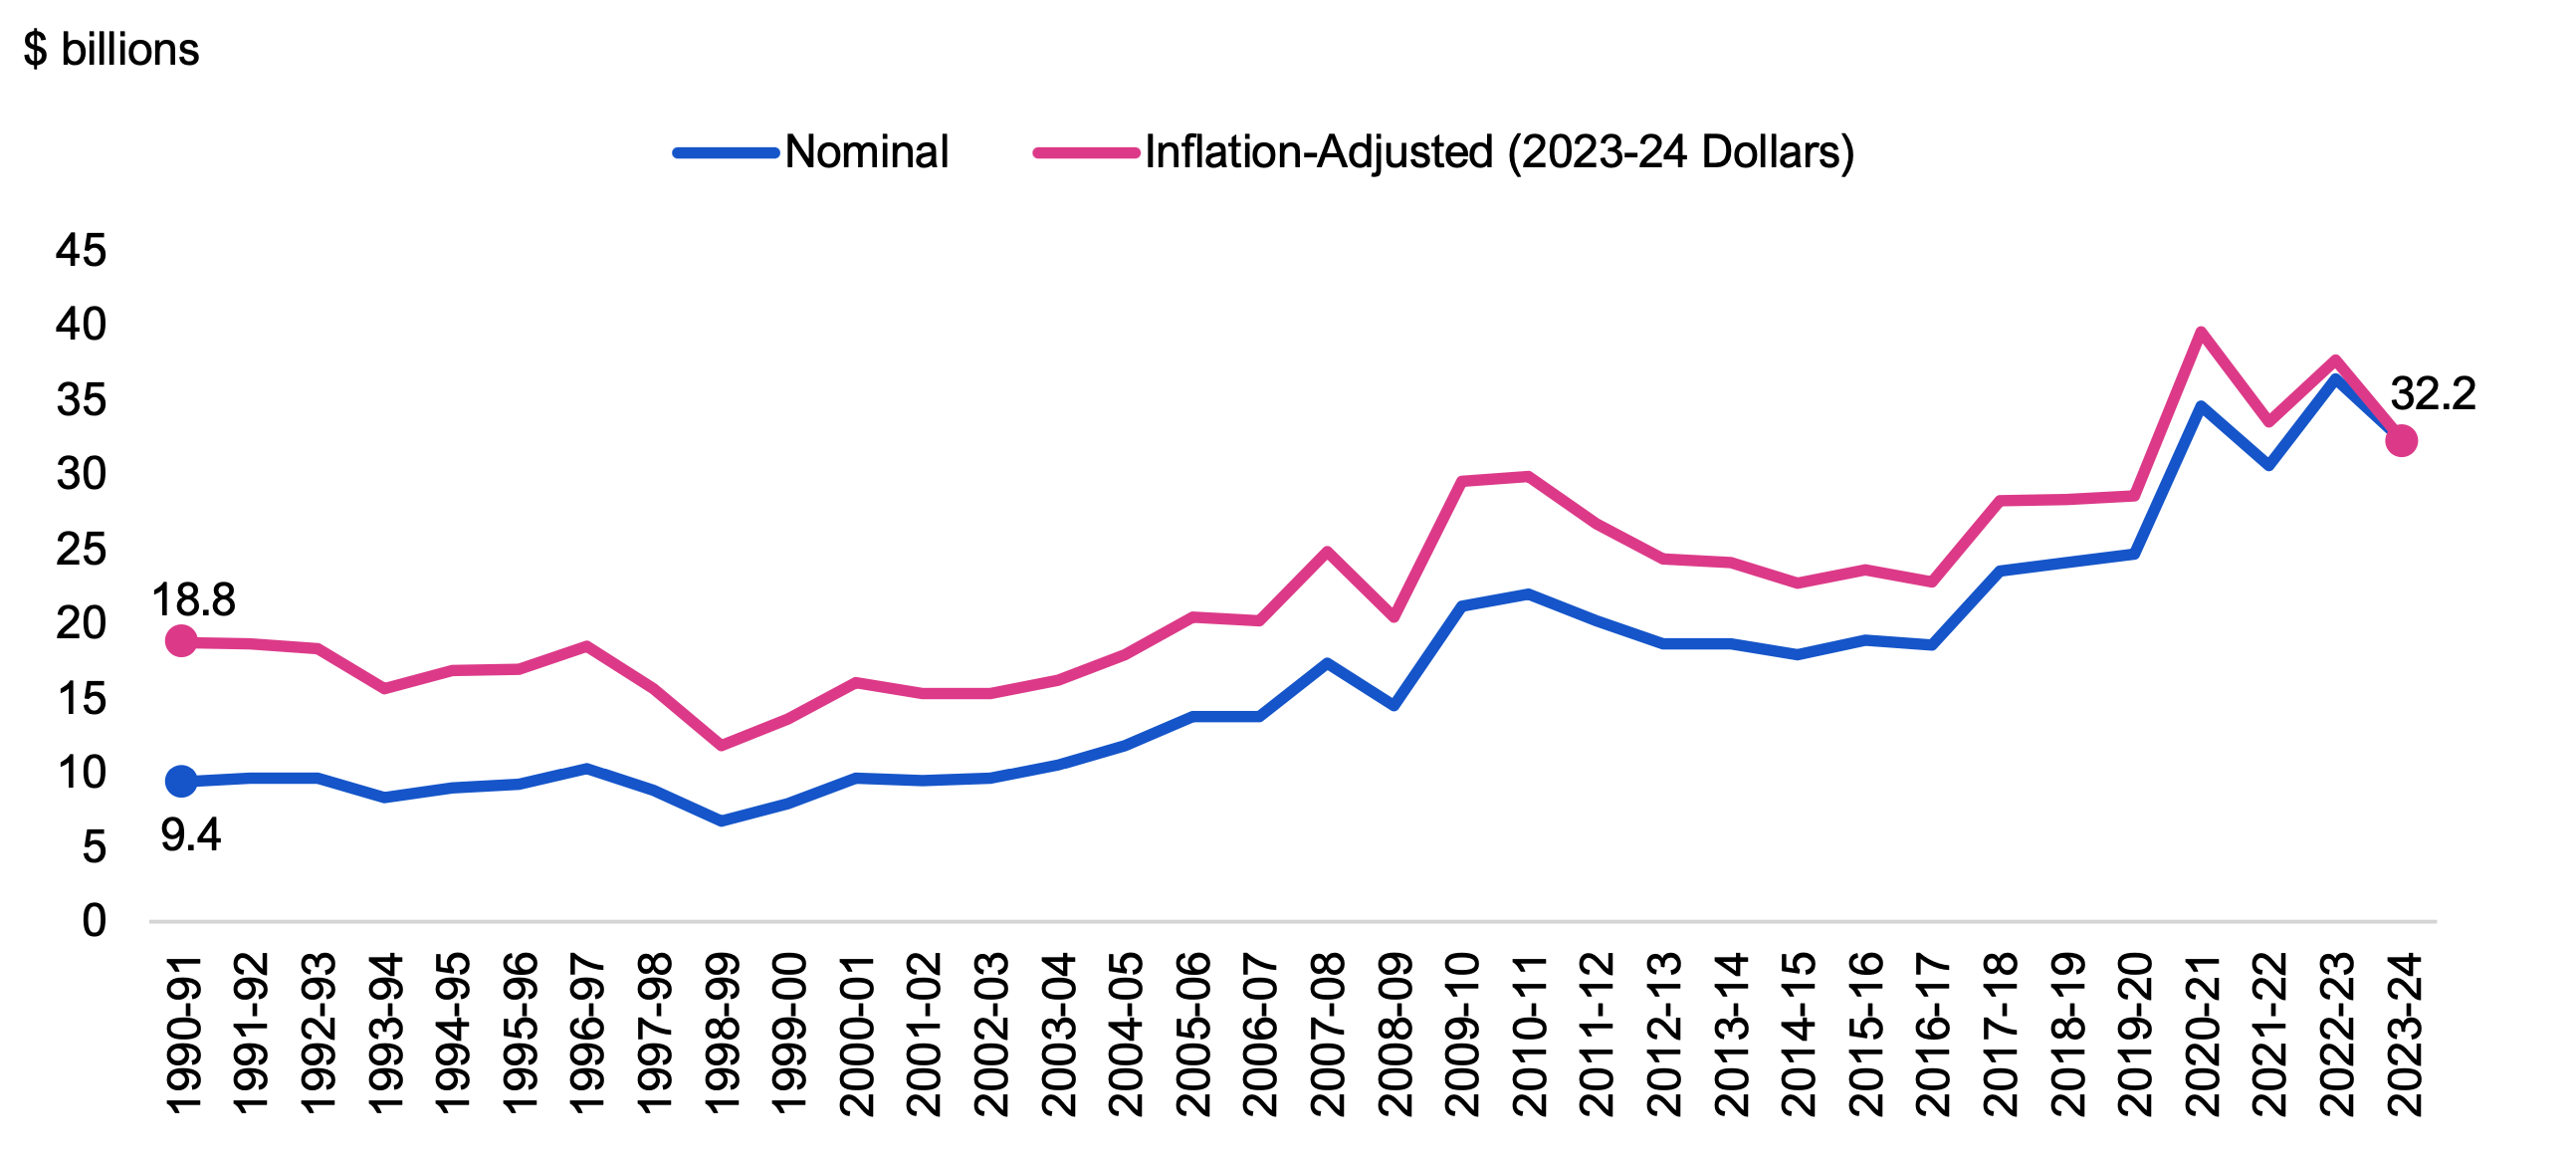
Source: FAO calculations, Statistics Canada, Public Accounts of Ontario and FAO analysis of information provided by the Province.
Accessible version
| Fiscal Year | Nominal | Inflation-Adjusted (2023-24 Dollars) |
|---|---|---|
| 1990-91 | 9.4 | 18.8 |
| 1991-92 | 9.6 | 18.6 |
| 1992-93 | 9.6 | 18.3 |
| 1993-94 | 8.3 | 15.7 |
| 1994-95 | 9.0 | 16.8 |
| 1995-96 | 9.2 | 16.9 |
| 1996-97 | 10.3 | 18.5 |
| 1997-98 | 8.8 | 15.7 |
| 1998-99 | 6.7 | 11.8 |
| 1999-00 | 7.9 | 13.6 |
| 2000-01 | 9.6 | 16.0 |
| 2001-02 | 9.4 | 15.3 |
| 2002-03 | 9.6 | 15.3 |
| 2003-04 | 10.5 | 16.2 |
| 2004-05 | 11.8 | 17.9 |
| 2005-06 | 13.7 | 20.4 |
| 2006-07 | 13.8 | 20.2 |
| 2007-08 | 17.4 | 24.9 |
| 2008-09 | 14.5 | 20.5 |
| 2009-10 | 21.2 | 29.6 |
| 2010-11 | 22.0 | 29.9 |
| 2011-12 | 20.2 | 26.7 |
| 2012-13 | 18.6 | 24.4 |
| 2013-14 | 18.7 | 24.1 |
| 2014-15 | 17.9 | 22.7 |
| 2015-16 | 18.9 | 23.6 |
| 2016-17 | 18.6 | 22.8 |
| 2017-18 | 23.5 | 28.3 |
| 2018-19 | 24.1 | 28.4 |
| 2019-20 | 24.6 | 28.6 |
| 2020-21 | 34.6 | 39.6 |
| 2021-22 | 30.6 | 33.5 |
| 2022-23 | 36.4 | 37.7 |
| 2023-24 | 32.2 | 32.2 |
In addition to inflation, population growth is an important cost driver of ‘other programs’ sector spending. The following presents ‘other programs’ sector spending on an inflation-adjusted (i.e., real) per capita basis to provide a better indication of the impact that ‘other programs’ sector spending has on service levels over time. The FAO estimates real per capita ‘other programs’ sector spending increased at an average annual rate of 0.4 per cent from $1,817 per person in 1990-91 to $2,044 per person in 2023-24.
Figure 10.2 Other programs spending per capita, inflation-adjusted, 1990-91 to 2023-24
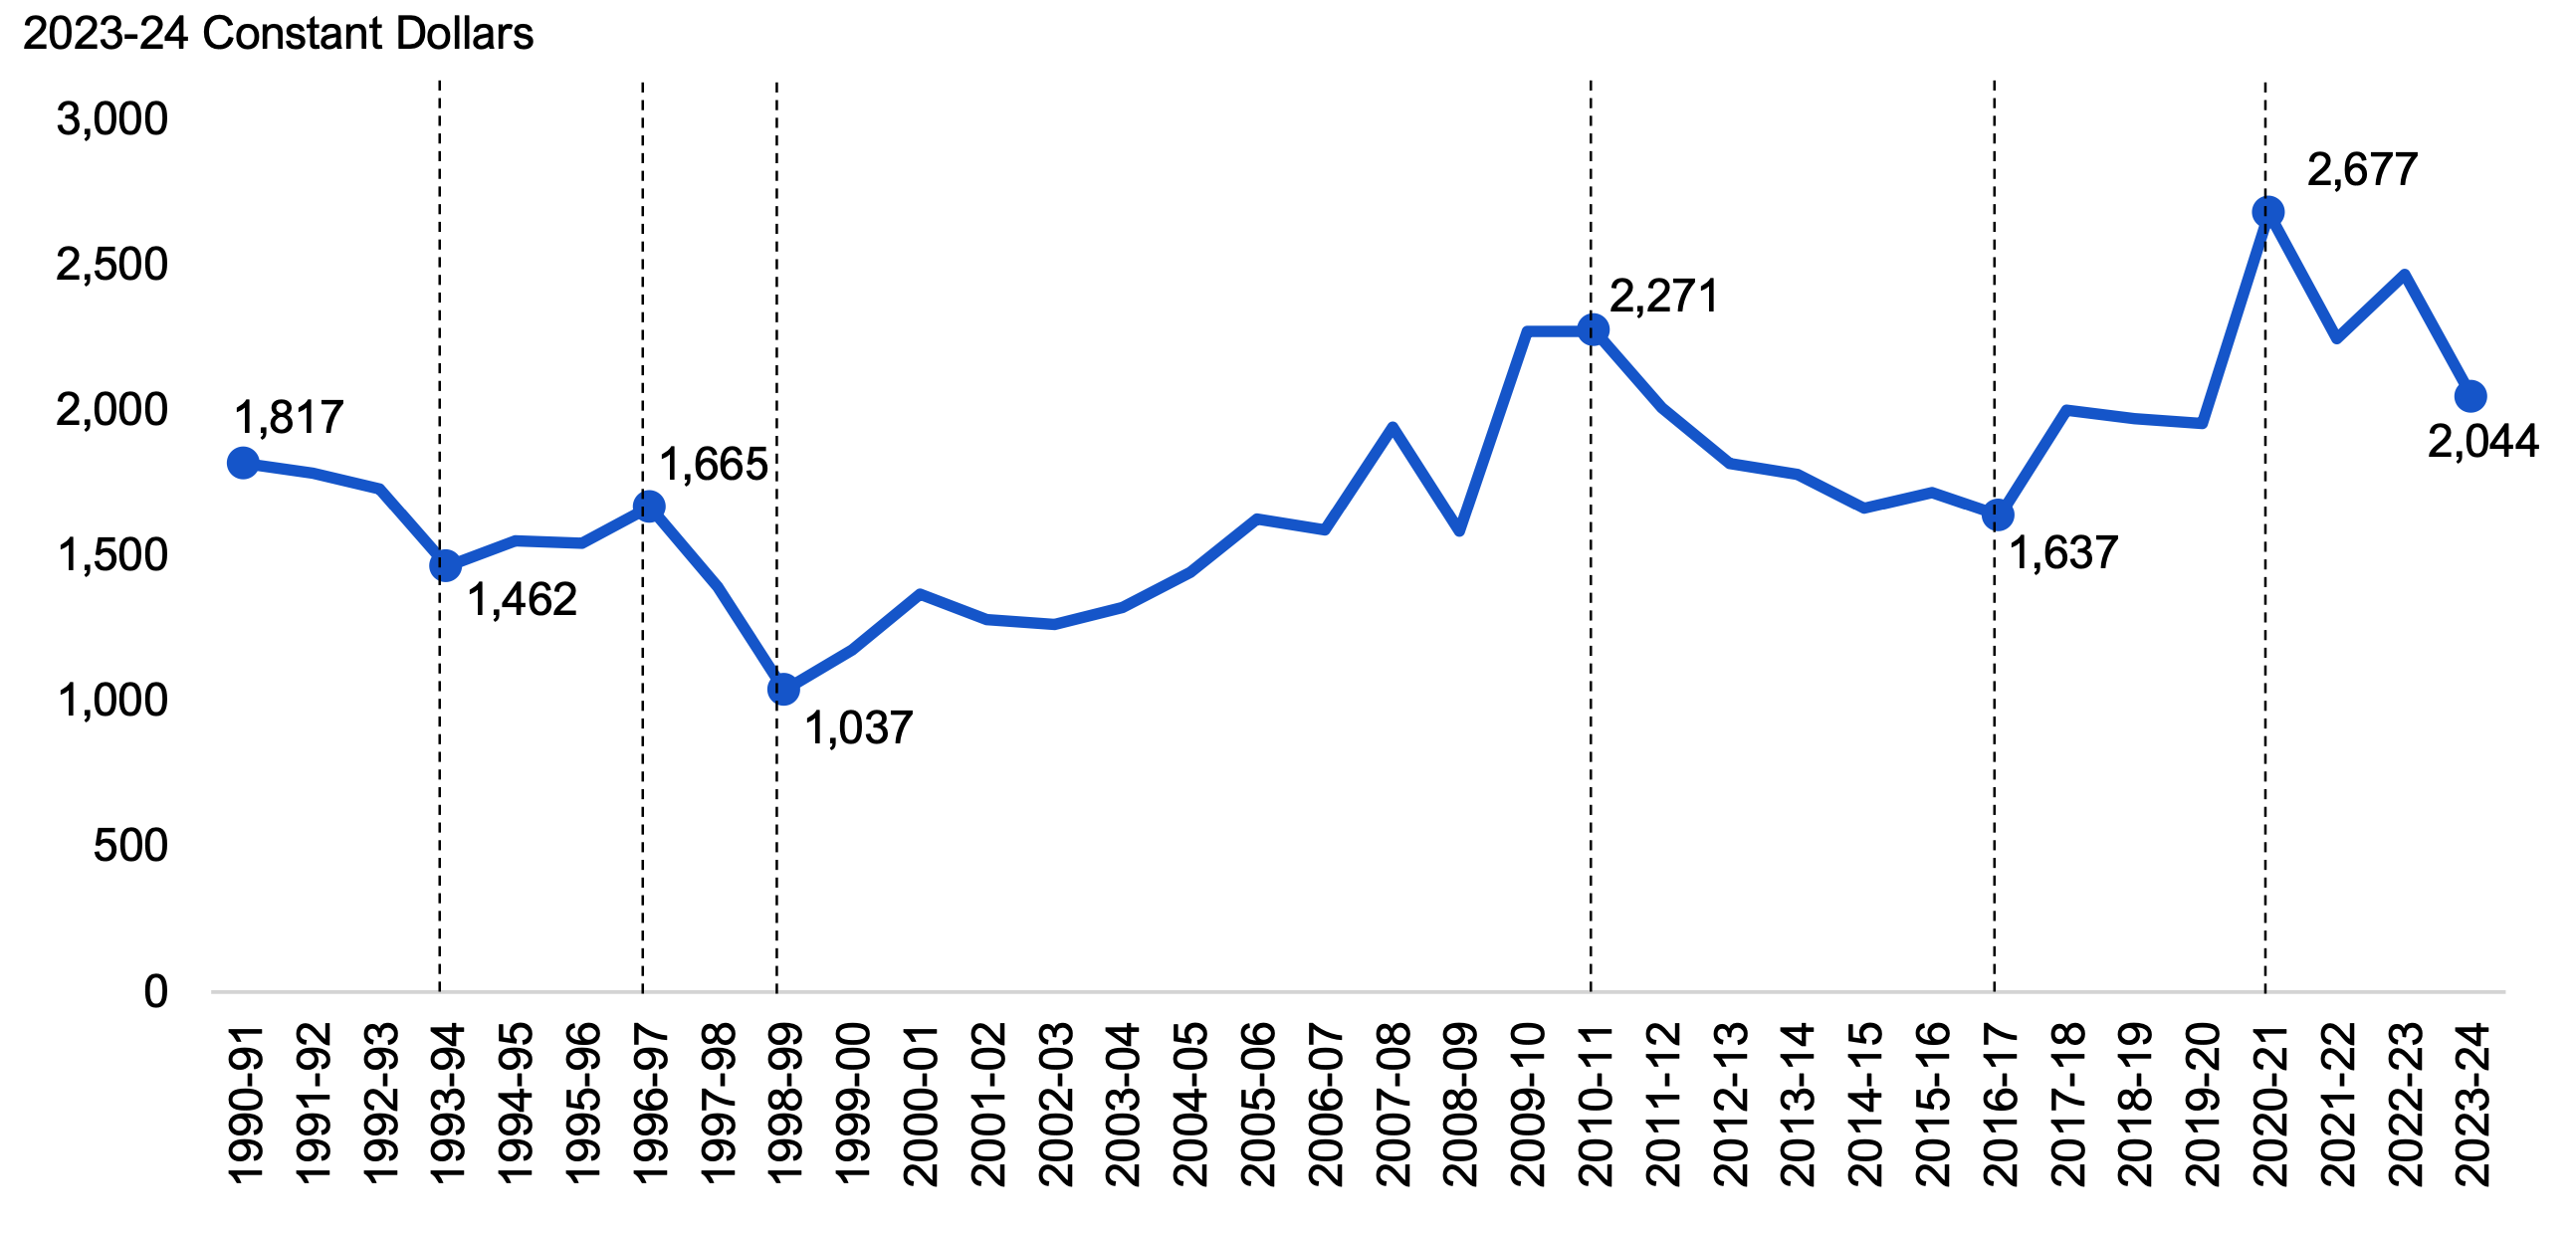
Source: FAO calculations, Statistics Canada, Public Accounts of Ontario and FAO analysis of information provided by the Province.
Accessible version
| Fiscal Year | Spending Per Capita |
|---|---|
| 1990-91 | 1,817 |
| 1991-92 | 1,782 |
| 1992-93 | 1,731 |
| 1993-94 | 1,462 |
| 1994-95 | 1,551 |
| 1995-96 | 1,542 |
| 1996-97 | 1,665 |
| 1997-98 | 1,391 |
| 1998-99 | 1,037 |
| 1999-00 | 1,177 |
| 2000-01 | 1,366 |
| 2001-02 | 1,279 |
| 2002-03 | 1,261 |
| 2003-04 | 1,320 |
| 2004-05 | 1,443 |
| 2005-06 | 1,625 |
| 2006-07 | 1,589 |
| 2007-08 | 1,944 |
| 2008-09 | 1,585 |
| 2009-10 | 2,270 |
| 2010-11 | 2,271 |
| 2011-12 | 2,010 |
| 2012-13 | 1,816 |
| 2013-14 | 1,781 |
| 2014-15 | 1,663 |
| 2015-16 | 1,716 |
| 2016-17 | 1,637 |
| 2017-18 | 1,999 |
| 2018-19 | 1,971 |
| 2019-20 | 1,953 |
| 2020-21 | 2,677 |
| 2021-22 | 2,247 |
| 2022-23 | 2,468 |
| 2023-24 | 2,044 |
Based on real per capita spending, the FAO has identified seven distinct periods of ‘other programs’ spending between 1990-91 to 2023-24:
1990-91 to 1993-94
From 1990-91 to 1993-94, real per capita spending in ‘other programs’ decreased from $1,817 to $1,462 at an average annual rate of -7.0 per cent. This period was characterized by spending restraint, led by lower spending in transportation and agriculture.
1993-94 to 1996-97
From 1993-94 to 1996-97, real per capita spending in ‘other programs’ increased from $1,462 to $1,665 at an average annual rate of 4.4 per cent. This growth was due in part to increased municipal supports and other time-limited investments made in 1996-97 to support the restructure of the delivery of certain public services.[24]
1996-97 to 1998-99
From 1996-97 to 1998-99, real per capita spending in ‘other programs’ decreased from $1,665 to $1,037 at an average annual rate of -21.1 per cent. The phasing out of time-limited restructuring investments contributed to this decline, as well as lower spending in agriculture.
1998-99 to 2010-11
From 1998-99 to 2010-11, real per capita spending in ‘other programs’ increased from $1,037 to $2,271 at an average annual rate of 6.8 per cent. This growth was driven by increased spending in infrastructure, transportation and energy. Additionally, there was significant time-limited spending in 2009-10 and 2010-11 in response to the 2008-2009 global financial crisis and due to Harmonized Sales Tax Transition Support payments to families and businesses.
2010-11 to 2016-17
From 2010-11 to 2016-17, real per capita spending in ‘other programs’ decreased from $2,271 to $1,637 at an average annual rate of -5.3 per cent. Spending dropped sharply in 2011-12 and 2012-13, primarily due to the expiration of time-limited spending. In the following years, real per capita spending continued to decline at a more modest pace led by lower spending in agriculture and energy. Higher spending for transportation and infrastructure partially offset these declines.
2016-17 to 2020-21
From 2016-17 to 2020-21, real per capita spending in ‘other programs’ increased from $1,637 to $2,677 at an average annual rate of 13.1 per cent. This growth was led by increased spending for transit and electricity subsidies. Additionally, high real per capita spending in 2020-21 was driven by time-limited spending related to the COVID-19 pandemic.
2020-21 to 2023-24
From 2020-21 to 2023-24, real per capita spending in ‘other programs’ decreased from $2,677 to $2,044 at an average annual rate of -8.6 per cent. This decline was primarily due to the phasing out of time-limited spending related to the COVID-19 pandemic combined with high inflation and population growth.
Figure 10.3 Average annual growth in real per capita ‘other programs’ spending, 1990-91 to 2023-24
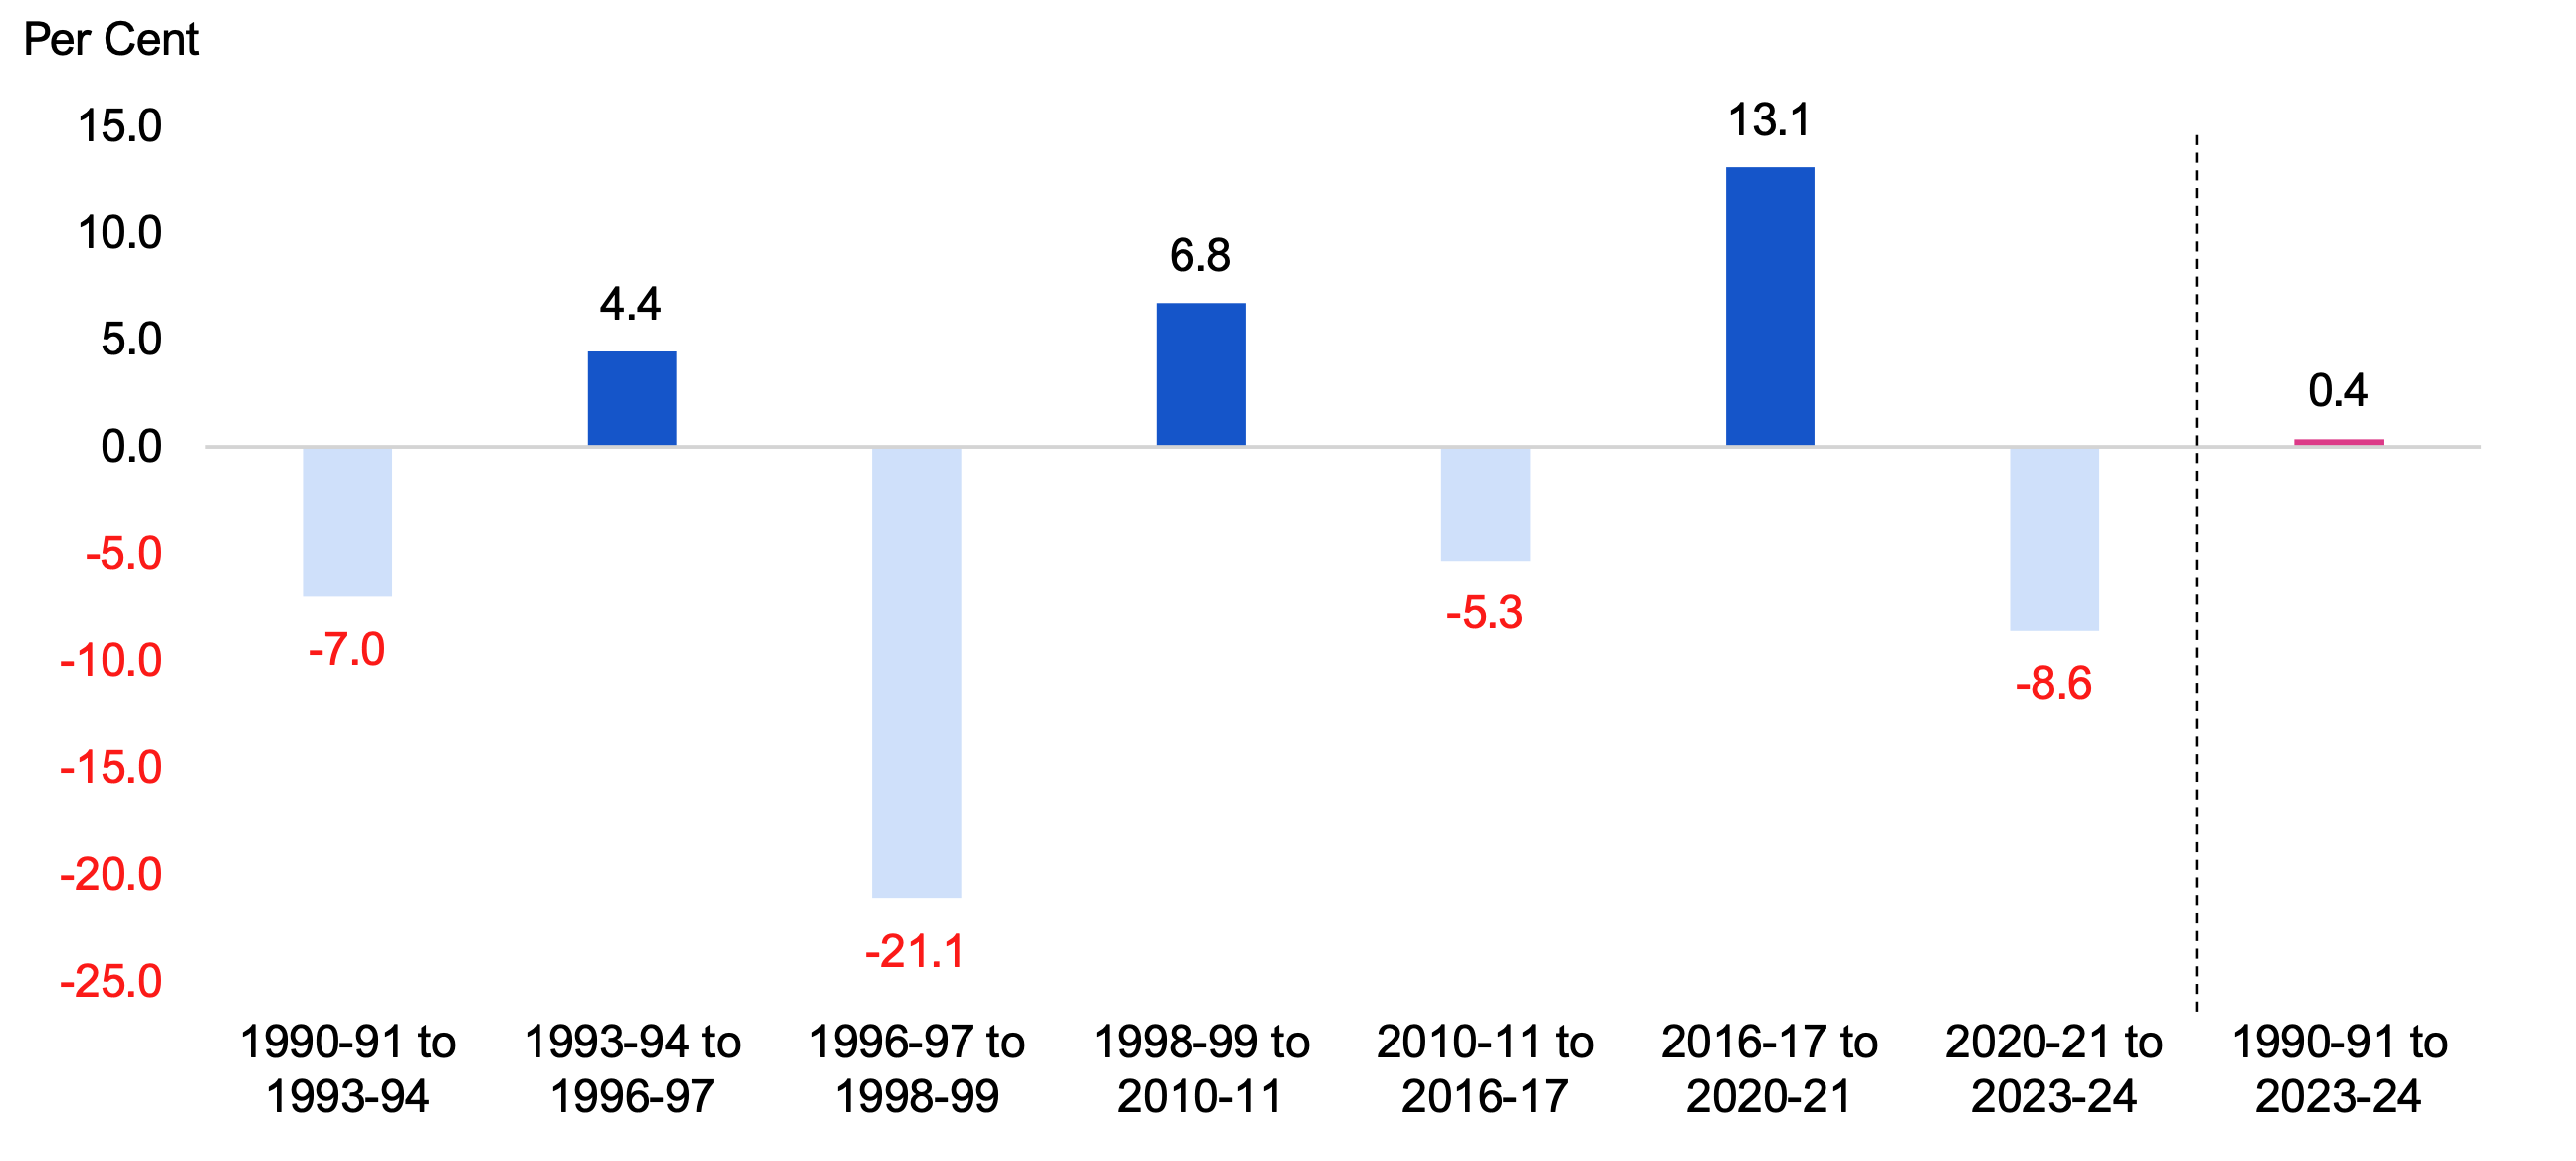
Source: FAO calculations, Statistics Canada, Public Accounts of Ontario and FAO analysis of information provided by the Province.
Accessible version
| Fiscal Years | 1990-91 to 1993-94 | 1993-94 to 1996-97 | 1996-97 to 1998-99 | 1998-99 to 2010-11 | 2010-11 to 2016-17 | 2016-17 to 2020-21 | 2020-21 to 2023-24 | 1990-91 to 2023-24 |
|---|---|---|---|---|---|---|---|---|
| Average Annual Growth | -7.0 | 4.4 | -21.1 | 6.8 | -5.3 | 13.1 | -8.6 | 0.4 |
Select Service Levels
In 2023-24, the ‘other programs’ sector included 22 ministries and the legislative offices. For information on spending and service levels for all ministries, see Ontario Published Plans and Annual Reports.
Five program areas accounted for just over half of total spending in the ‘other programs’ sector: capital expenses[25] (20.1 per cent), electricity subsidy programs (19.0 per cent), transit operations[26] (9.0 per cent), affordable housing and homelessness programs (4.2 per cent) and highway operations (2.0 per cent). For additional information on spending and select service levels in these five program areas, see the following FAO reports: Ontario’s Public Transit Agencies: Ridership, Finances and Operating Subsidies; Provincial Infrastructure; Ontario’s Energy and Electricity Subsidy Programs; Housing and Homelessness Programs in Ontario; and Expenditure Estimates 2019-20: Ministry of Transportation.
11. Interest on Debt
Spending Trends
Interest on debt (IOD) spending is the sixth largest sector in the government and accounted for 5.5 per cent of total spending in 2023-24. The FAO estimates IOD spending grew at an average annual rate of 2.6 per cent from $4.8 billion in 1990-91 to $11.4 billion in 2023-24. After adjusting for inflation, IOD spending grew at an average annual rate of 0.5 per cent from 1990-91 to 2023-24.
Figure 11.1 Interest on debt spending, nominal and inflation-adjusted, 1990-91 to 2023-24
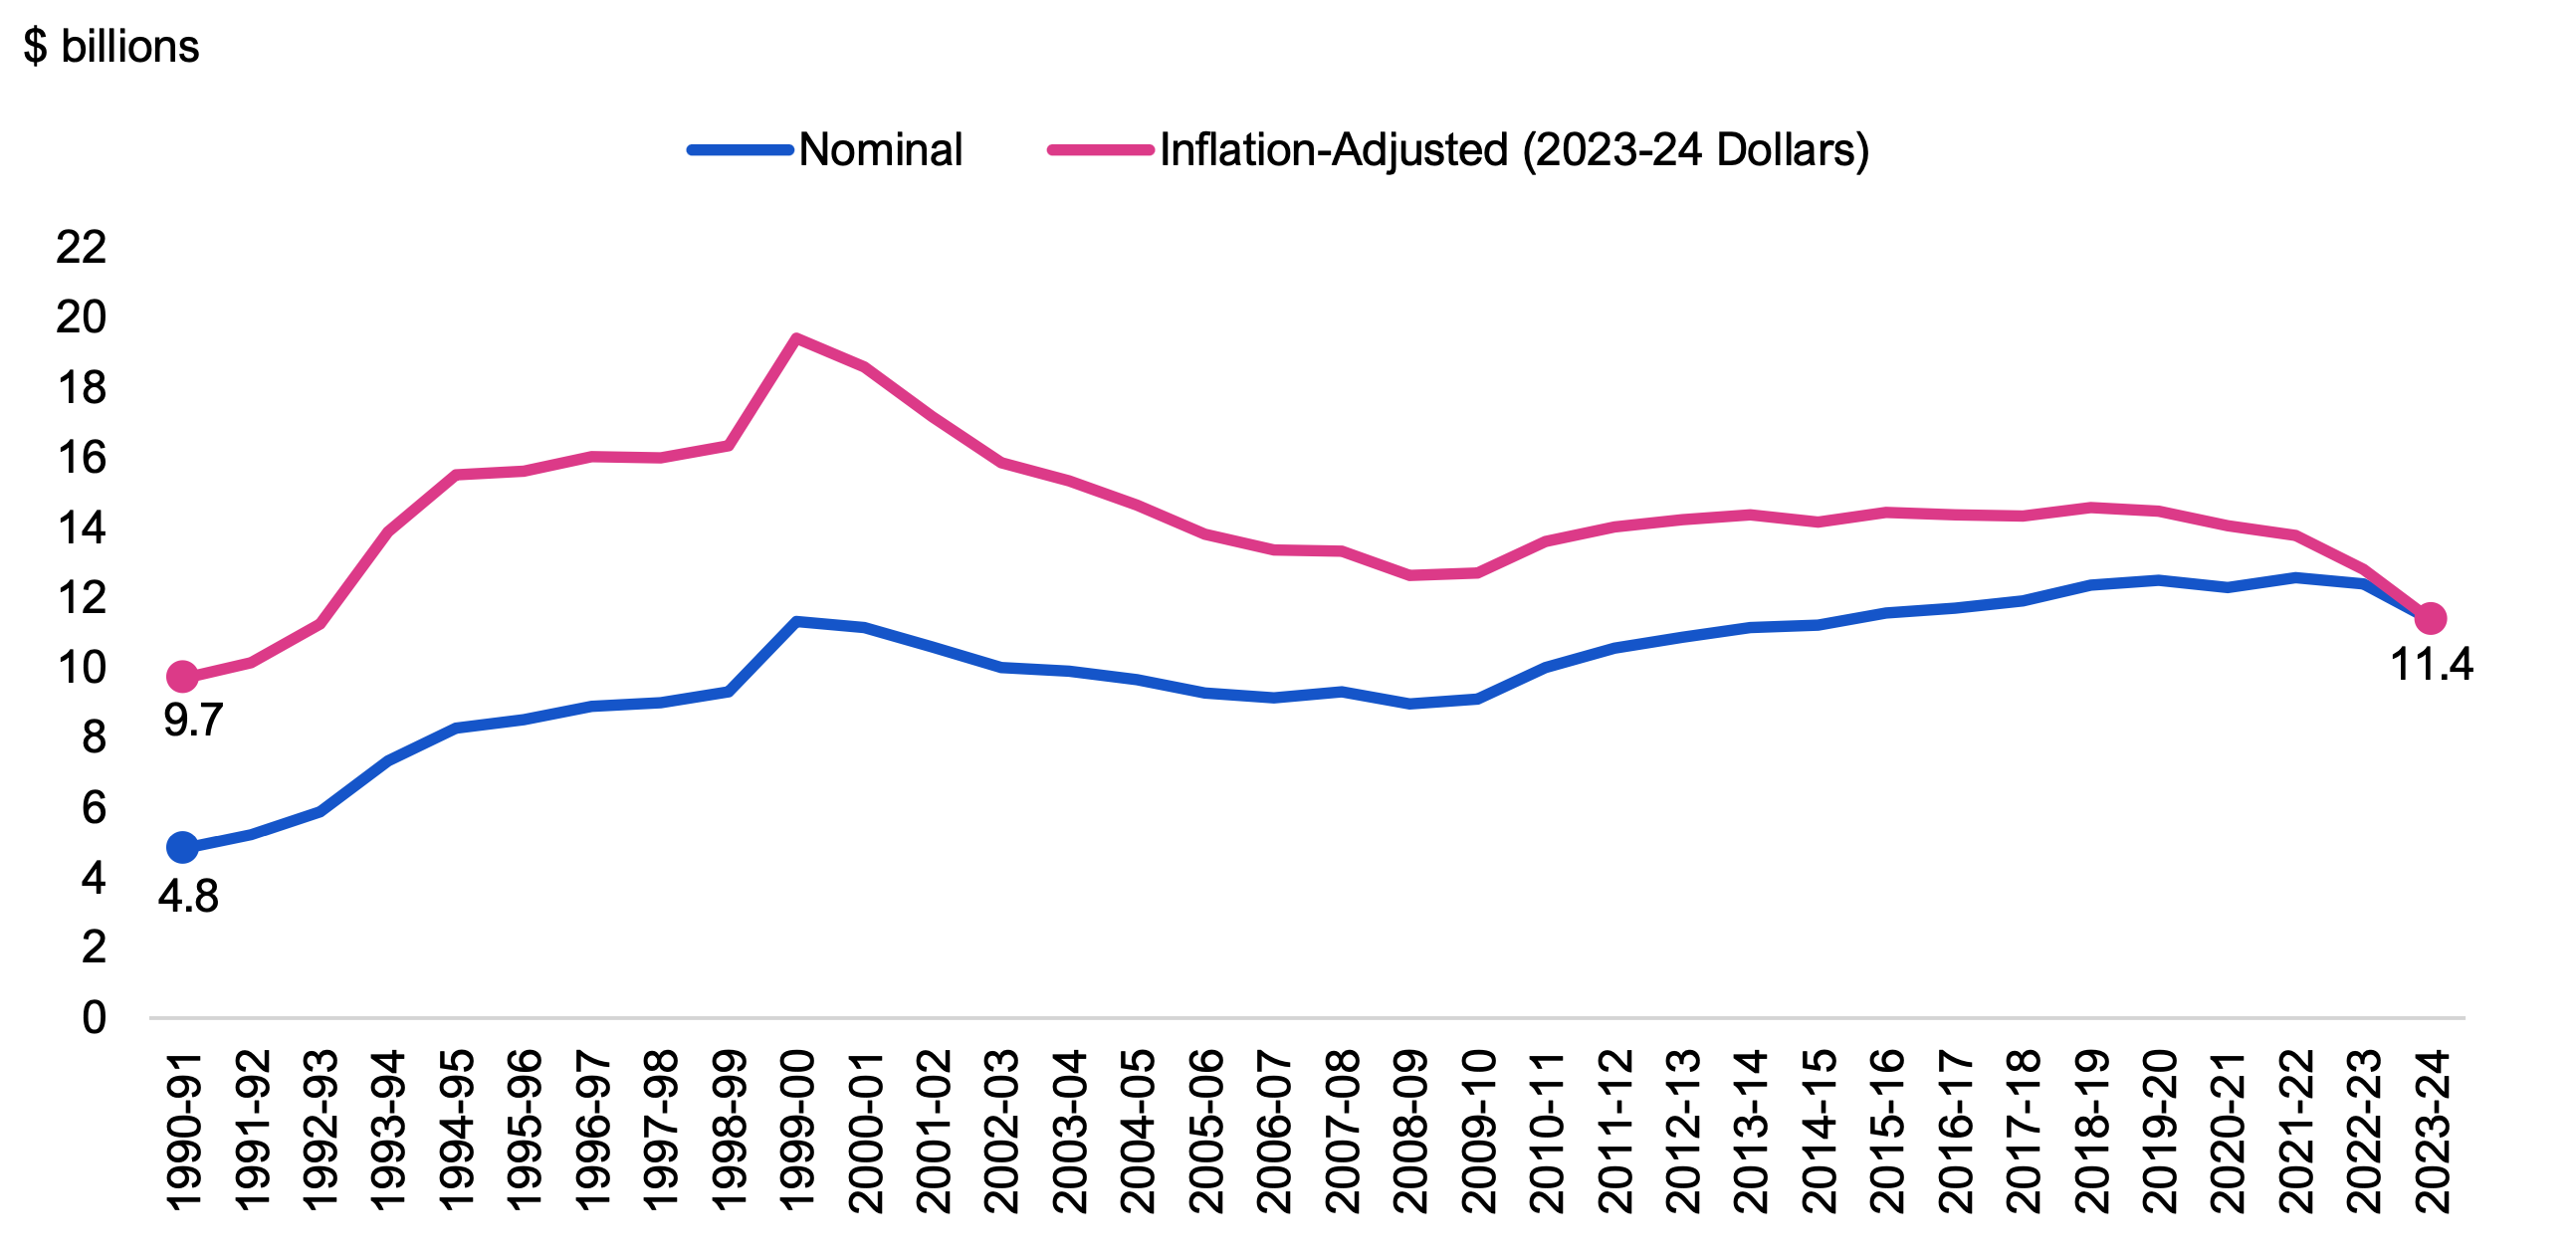
Source: FAO calculations, Statistics Canada, Public Accounts of Ontario and FAO analysis of information provided by the Province.
Accessible version
| Fiscal Year | Nominal | Inflation-adjusted (2023-24 Dollars) |
|---|---|---|
| 1990-91 | 4.8 | 9.7 |
| 1991-92 | 5.2 | 10.1 |
| 1992-93 | 5.9 | 11.3 |
| 1993-94 | 7.4 | 13.9 |
| 1994-95 | 8.3 | 15.5 |
| 1995-96 | 8.5 | 15.6 |
| 1996-97 | 8.9 | 16.0 |
| 1997-98 | 9.0 | 16.0 |
| 1998-99 | 9.3 | 16.3 |
| 1999-00 | 11.3 | 19.4 |
| 2000-01 | 11.2 | 18.6 |
| 2001-02 | 10.6 | 17.2 |
| 2002-03 | 10.0 | 15.9 |
| 2003-04 | 9.9 | 15.3 |
| 2004-05 | 9.7 | 14.7 |
| 2005-06 | 9.3 | 13.8 |
| 2006-07 | 9.2 | 13.4 |
| 2007-08 | 9.3 | 13.3 |
| 2008-09 | 9.0 | 12.6 |
| 2009-10 | 9.1 | 12.7 |
| 2010-11 | 10.0 | 13.6 |
| 2011-12 | 10.6 | 14.0 |
| 2012-13 | 10.9 | 14.2 |
| 2013-14 | 11.2 | 14.4 |
| 2014-15 | 11.2 | 14.2 |
| 2015-16 | 11.6 | 14.5 |
| 2016-17 | 11.7 | 14.4 |
| 2017-18 | 11.9 | 14.3 |
| 2018-19 | 12.4 | 14.6 |
| 2019-20 | 12.5 | 14.5 |
| 2020-21 | 12.3 | 14.1 |
| 2021-22 | 12.6 | 13.8 |
| 2022-23 | 12.4 | 12.8 |
| 2023-24 | 11.4 | 11.4 |
After accounting for inflation and population growth, real per capita IOD spending declined at an average annual rate of -0.8 per cent from $940 per person in 1990-91 to $722 per person in 2023-24.
Figure 11.2 Interest on debt spending per capita, inflation-adjusted, 1990-91 to 2023-24
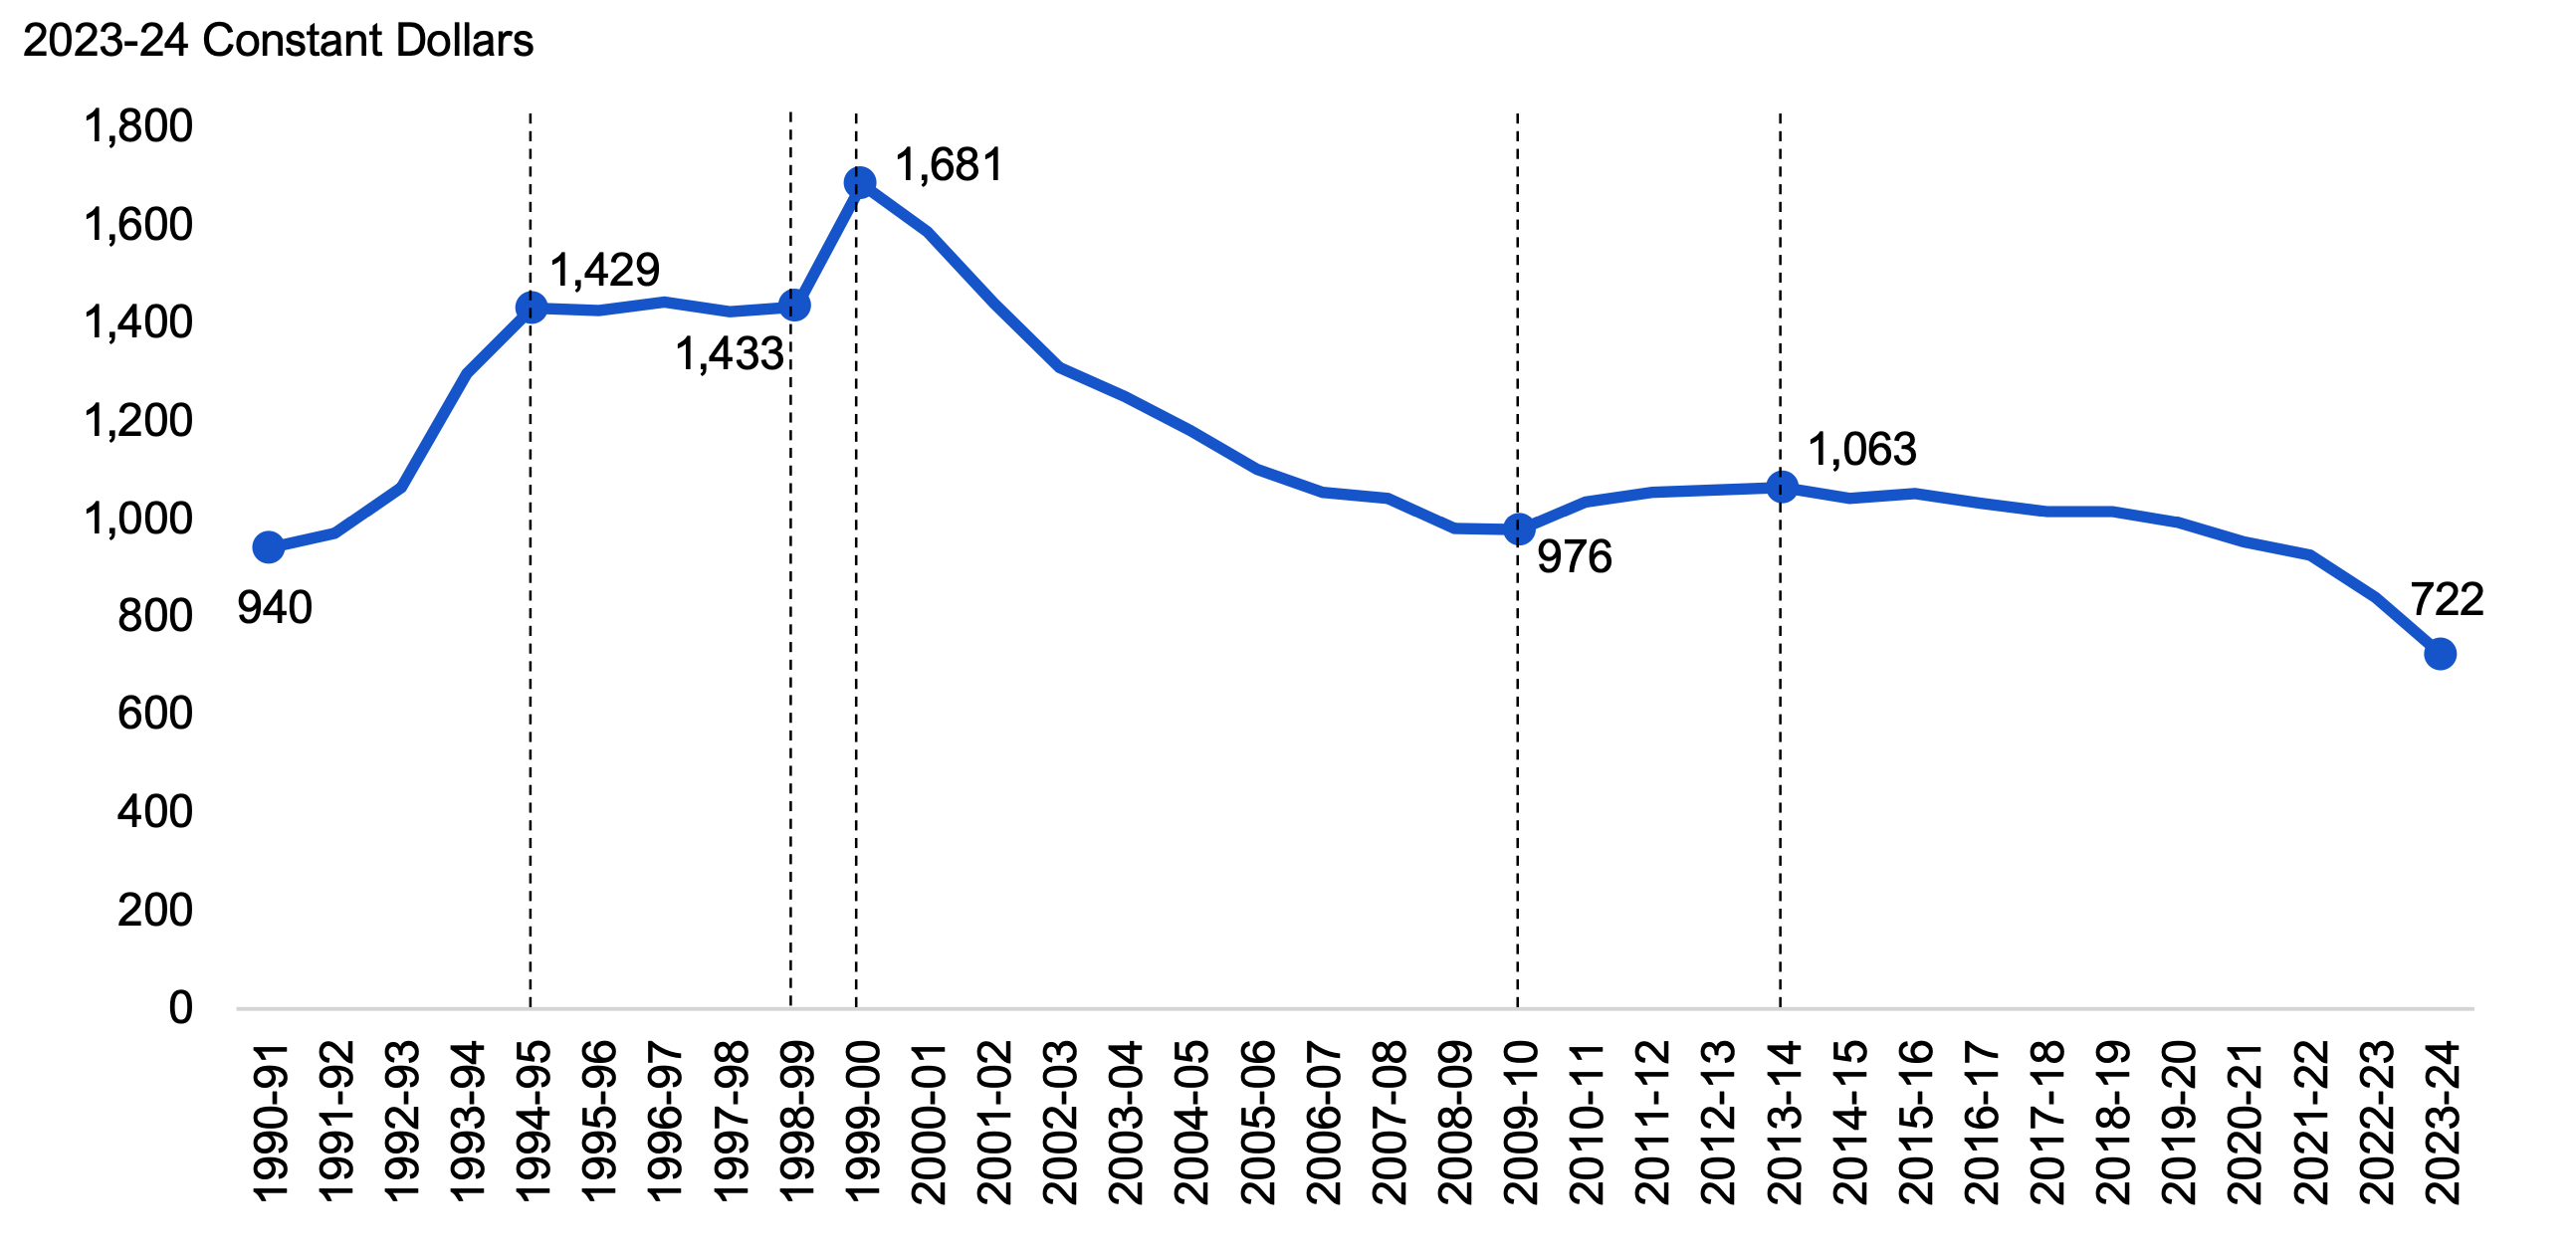
Source: FAO calculations, Statistics Canada, Public Accounts of Ontario and FAO analysis of information provided by the Province.
Accessible version
| Fiscal Year | Spending Per Capita |
|---|---|
| 1990-91 | 940 |
| 1991-92 | 969 |
| 1992-93 | 1,063 |
| 1993-94 | 1,295 |
| 1994-95 | 1,429 |
| 1995-96 | 1,423 |
| 1996-97 | 1,442 |
| 1997-98 | 1,421 |
| 1998-99 | 1,433 |
| 1999-00 | 1,681 |
| 2000-01 | 1,584 |
| 2001-02 | 1,438 |
| 2002-03 | 1,308 |
| 2003-04 | 1,249 |
| 2004-05 | 1,180 |
| 2005-06 | 1,100 |
| 2006-07 | 1,054 |
| 2007-08 | 1,042 |
| 2008-09 | 979 |
| 2009-10 | 976 |
| 2010-11 | 1,033 |
| 2011-12 | 1,055 |
| 2012-13 | 1,060 |
| 2013-14 | 1,063 |
| 2014-15 | 1,040 |
| 2015-16 | 1,051 |
| 2016-17 | 1,032 |
| 2017-18 | 1,014 |
| 2018-19 | 1,013 |
| 2019-20 | 991 |
| 2020-21 | 951 |
| 2021-22 | 925 |
| 2022-23 | 840 |
| 2023-24 | 722 |
Based on real per capita spending, the FAO has identified six distinct periods of interest on debt spending between 1990-91 to 2023-24:
1990-91 to 1994-95
Over the four-year period from 1990-91 to 1994-95, real per capita IOD spending increased from $940 to $1,429 at an average annual rate of 11.0 per cent. High budget deficits following the early 1990s recession increased debt levels, which, combined with high interest rates, increased real per capita IOD spending.
1994-95 to 1998-99
From 1994-95 to 1998-99, real per capita IOD spending remained stable, reaching $1,433 in 1998-99, at an average annual growth rate of 0.1 per cent. Spending restraint in the mid-1990s slowed the growth in provincial debt, which, combined with decreasing interest rates, led to stable real per capita IOD spending.
1998-99 to 1999-00
From 1998-99 to 1999-00, real per capita IOD spending increased by 17.4 per cent to $1,681. This was primarily due to the restructuring of Ontario Hydro, which resulted in the transfer of an estimated $26.2 billion in debt to the newly formed Ontario Electricity Financial Corporation and subsequent recording in the Province’s financial statements.
1999-00 to 2009-10
Over the period from 1999-00 to 2009-10, real per capita IOD spending decreased from $1,681 to $976 at an average annual rate of -5.3 per cent. Slow growth in provincial debt combined with declining interest rates led to rapid declines in real per capita IOD spending.
2009-10 to 2013-14
From 2009-10 to 2013-14, real per capita IOD spending increased from $976 to $1,063 at an average annual rate of 2.2 per cent. This period was characterized by growth in provincial debt following the 2008-2009 global financial crisis, which more than offset the effect of declining interest rates.
2013-14 to 2023-24
From 2013-14 to 2023-24, real per capita IOD spending decreased from $1,063 to $722 at an average annual rate of -3.8 per cent. Spending restraint to reduce budget deficits following the 2008-2009 global financial crisis stabilized growth in provincial debt, which, combined with declining interest rates, led to continued declines in real per capita IOD spending.
Figure 11.3 Average annual growth in real per capita interest on debt spending, 1990-91 to 2023-24
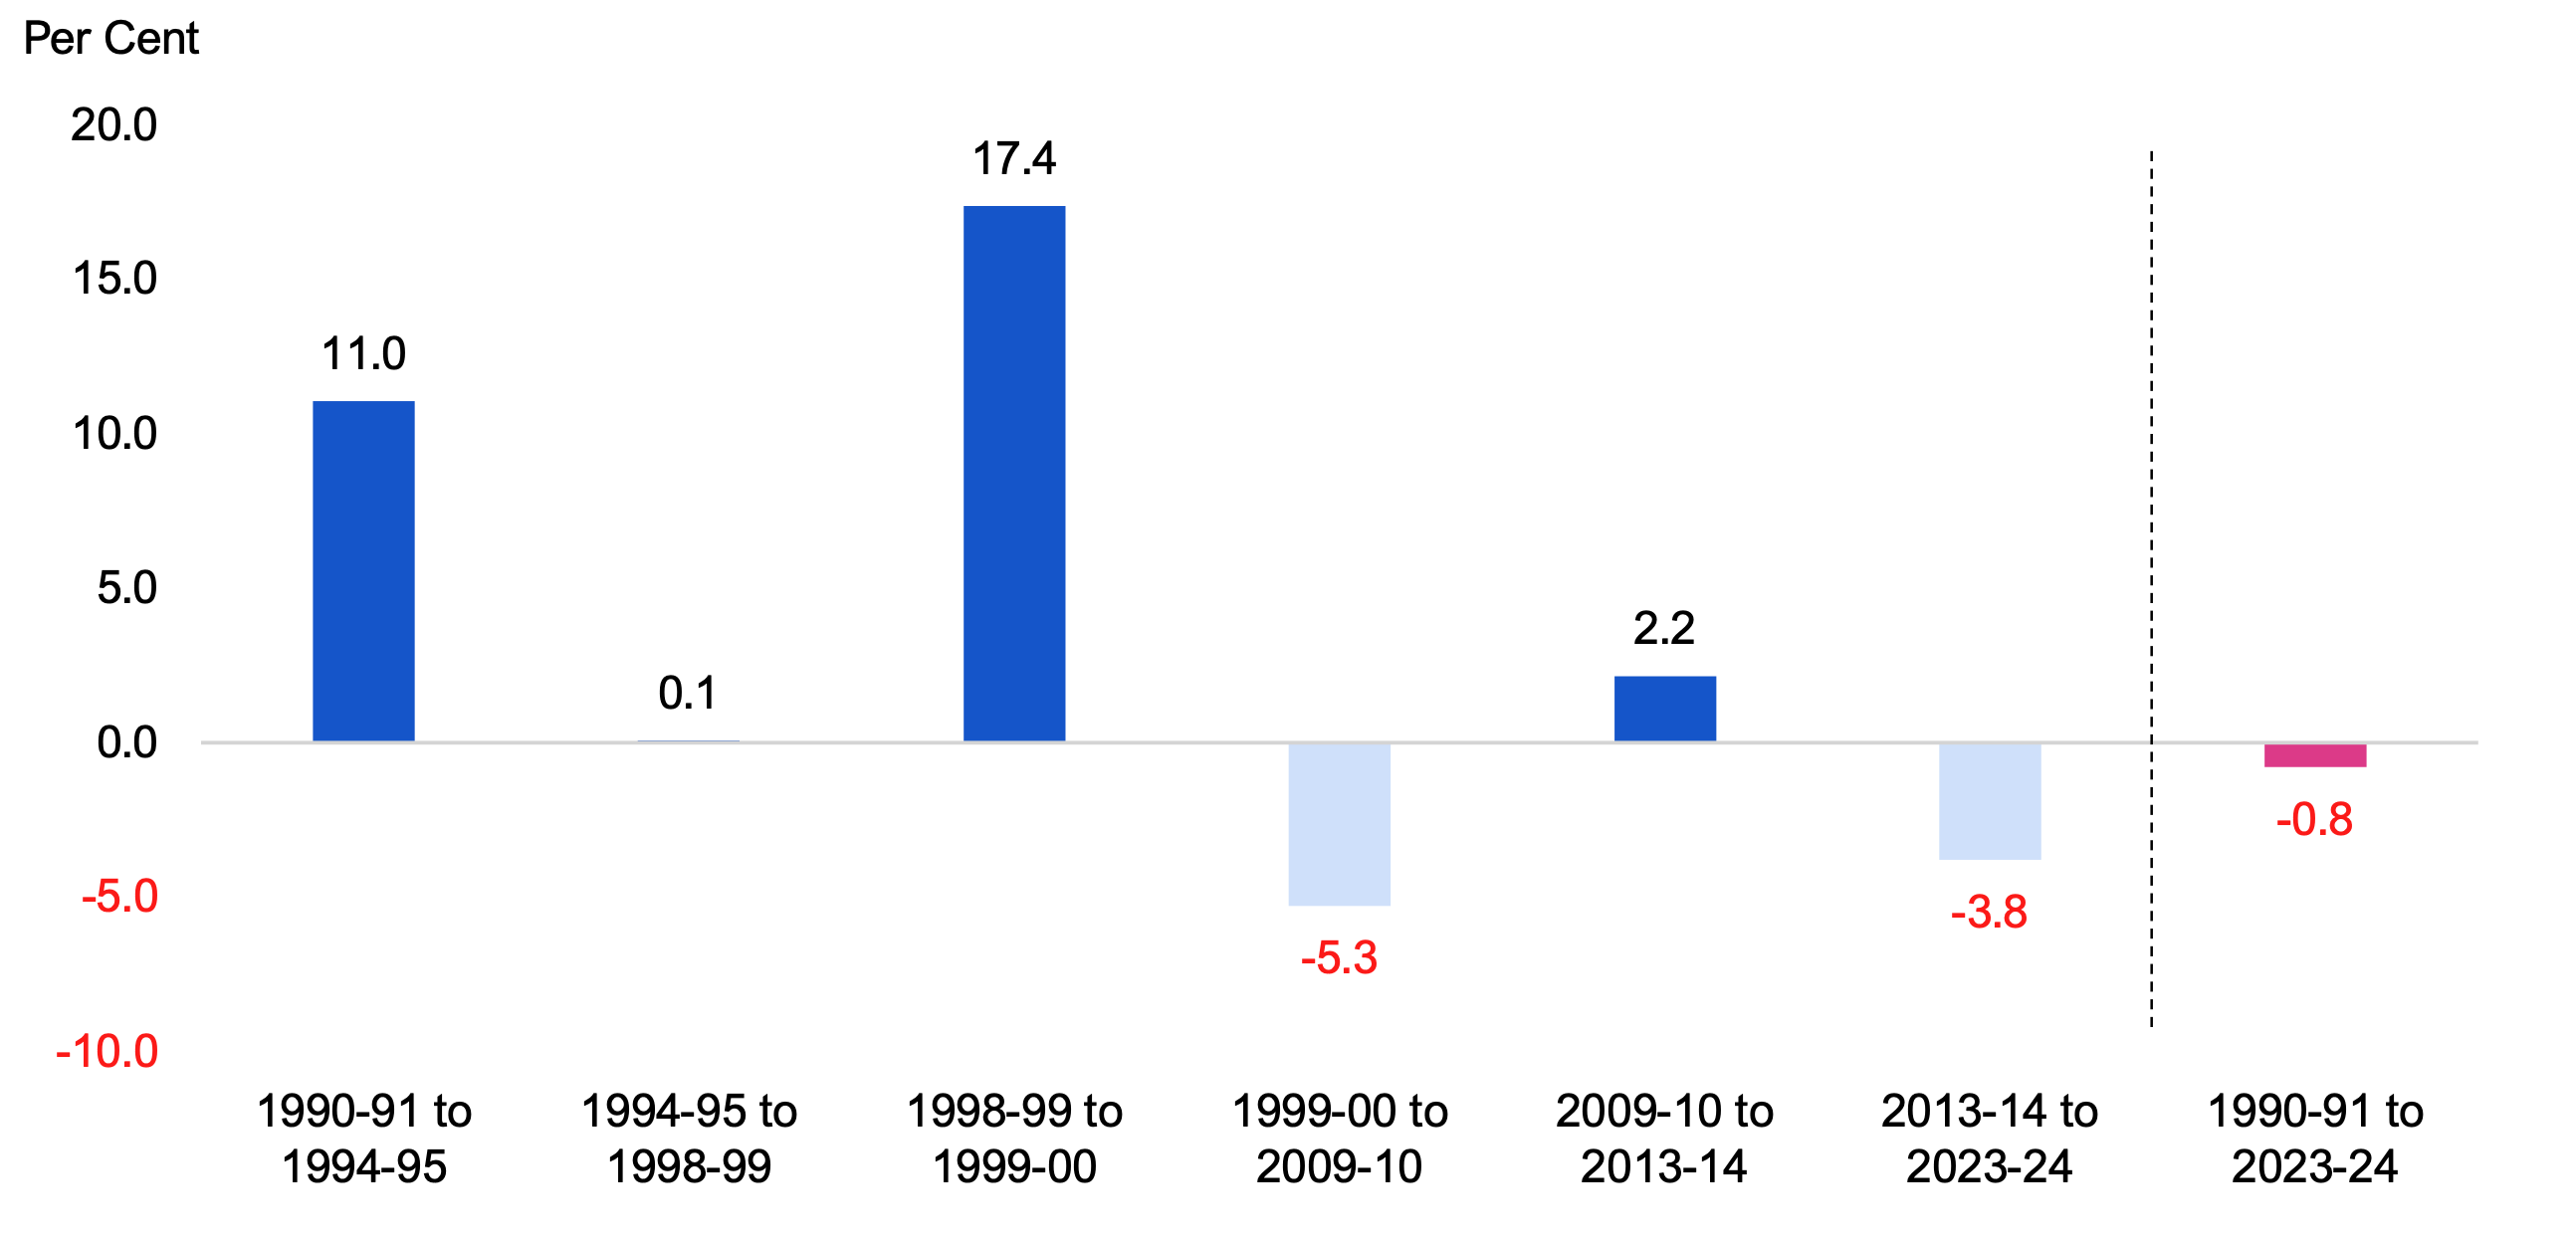
Source: FAO calculations, Statistics Canada, Public Accounts of Ontario and FAO analysis of information provided by the Province.
Accessible version
| Fiscal Years | 1990-91 to 1994-95 | 1994-95 to 1998-99 | 1998-99 to 1999-00 | 1999-00 to 2009-10 | 2009-10 to 2013-14 | 2013-14 to 2023-24 | 1990-91 to 2023-24 |
|---|---|---|---|---|---|---|---|
| Average Annual Growth | 11.0 | 0.1 | 17.4 | -5.3 | 2.2 | -3.8 | -0.8 |
12. Trends in Federal Transfers to Ontario
Overview
Transfers from the Government of Canada are an important source of provincial revenue that supports the Province in funding programs and services. The FAO estimates that transfers from the federal government grew at an average annual rate of 5.5 per cent from $5.8 billion in 1990-91 to $34.3 billion in 2023-24. Over this 34-year period, the majority of federal transfers to Ontario were provided under programs intended to help finance provincially run health care, social assistance and postsecondary education programs.[27]
Figure 12.1 Total federal transfers to Ontario, 1990-91 to 2023-24
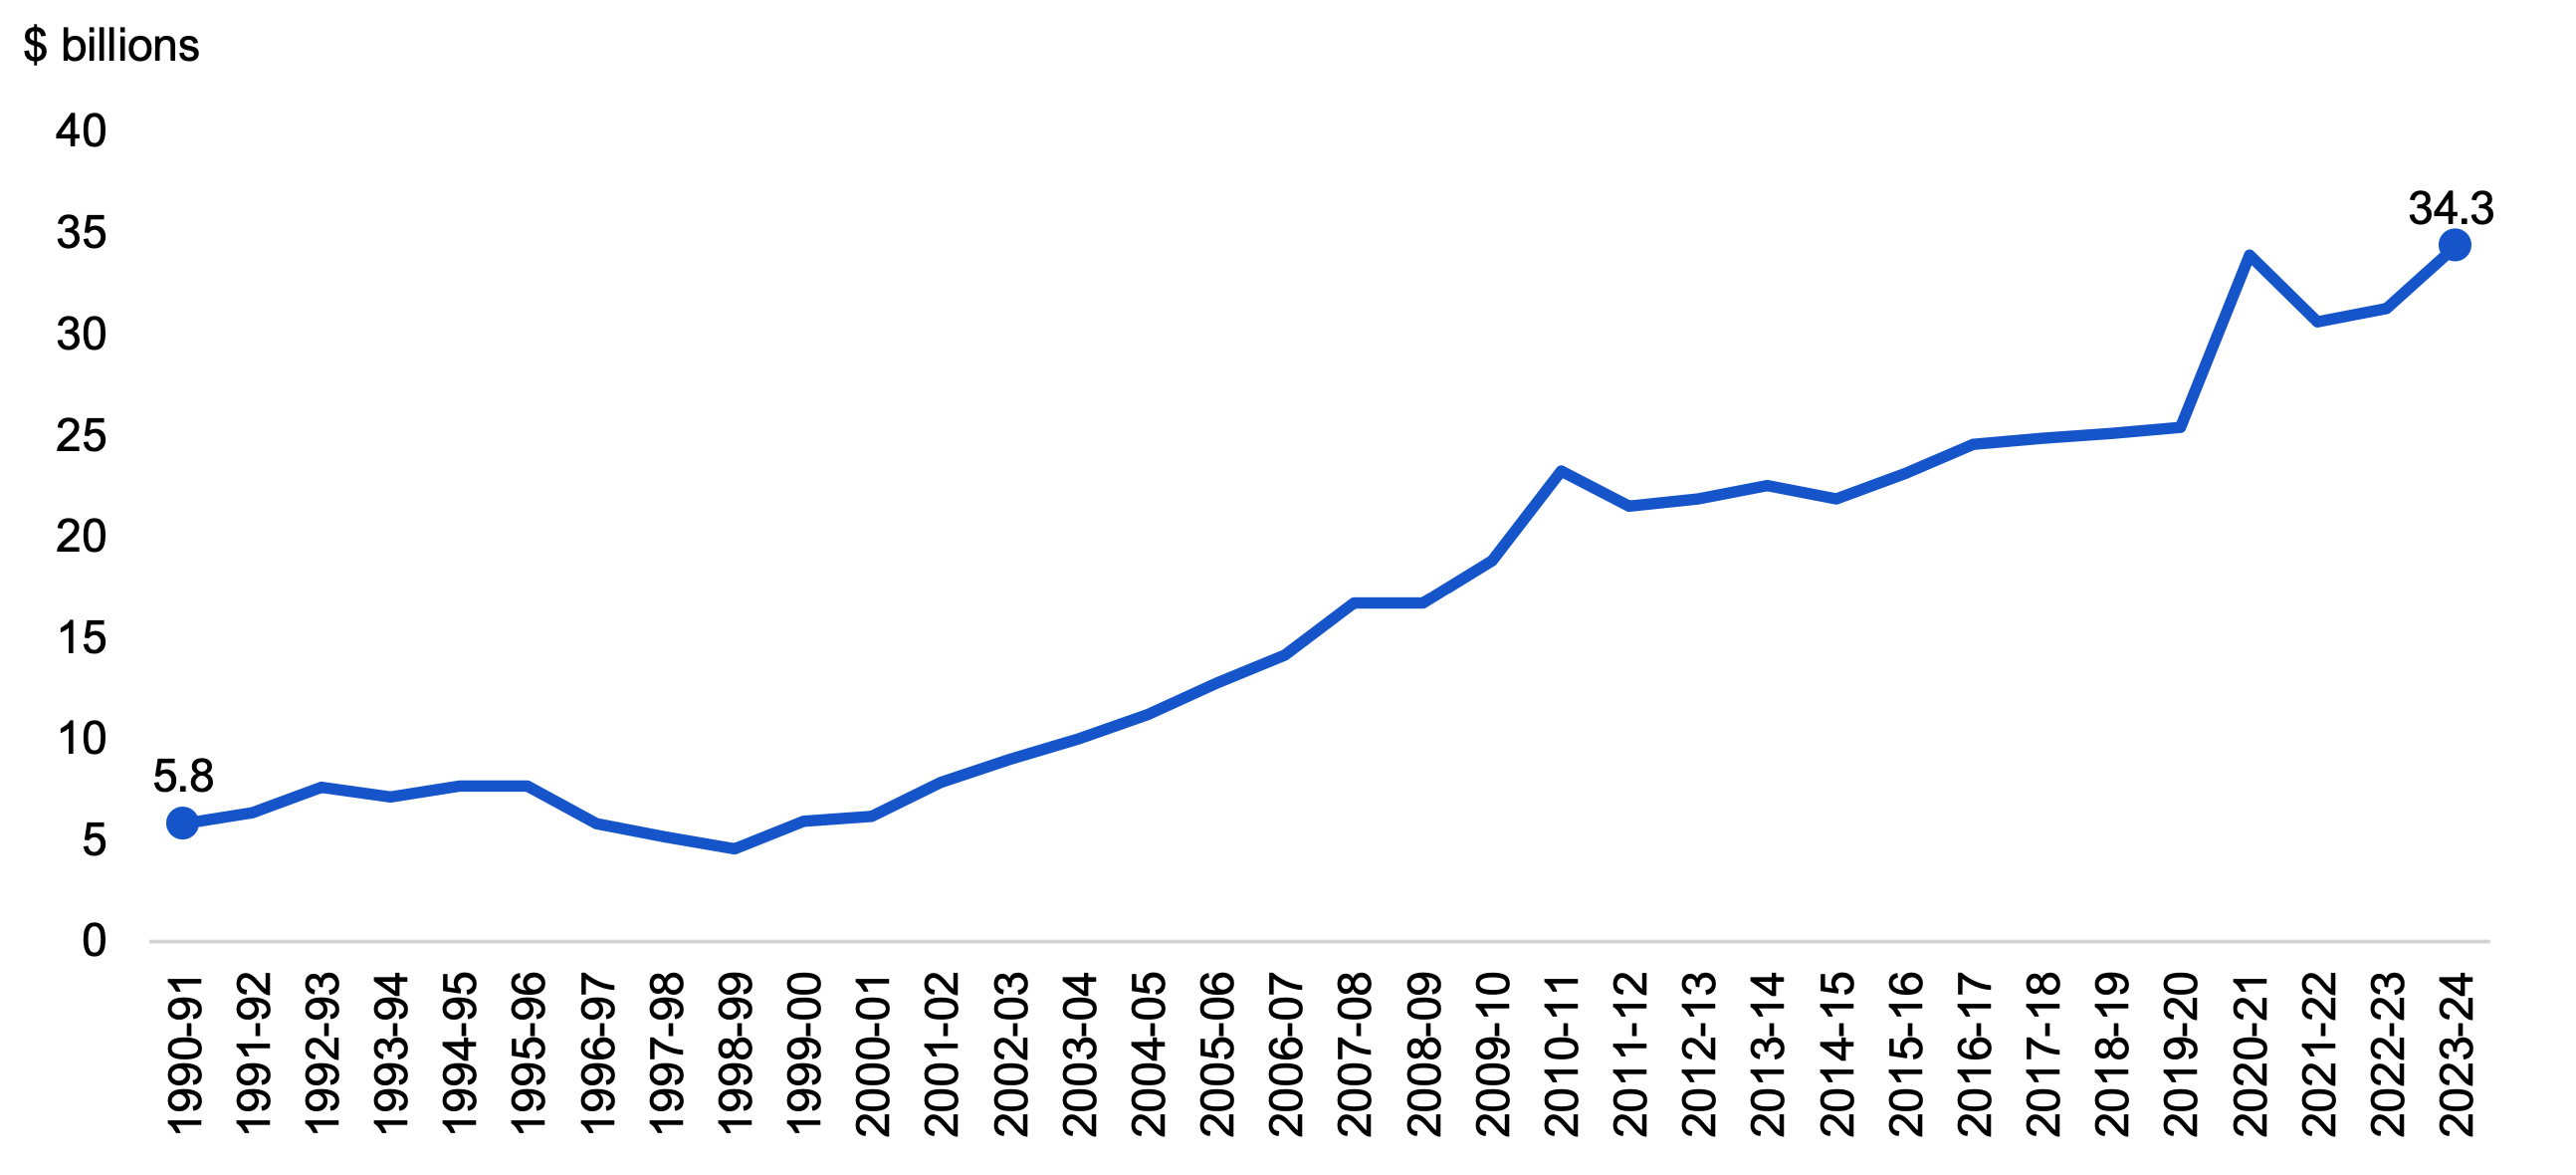
Source: Public Accounts of Ontario and FAO analysis of information provided by the Province.
Accessible version
| Fiscal Year | Total Federal Transfers to Ontario |
|---|---|
| 1990-91 | 5.8 |
| 1991-92 | 6.4 |
| 1992-93 | 7.6 |
| 1993-94 | 7.1 |
| 1994-95 | 7.7 |
| 1995-96 | 7.7 |
| 1996-97 | 5.8 |
| 1997-98 | 5.2 |
| 1998-99 | 4.6 |
| 1999-00 | 6.0 |
| 2000-01 | 6.2 |
| 2001-02 | 7.8 |
| 2002-03 | 9.0 |
| 2003-04 | 10.0 |
| 2004-05 | 11.2 |
| 2005-06 | 12.8 |
| 2006-07 | 14.2 |
| 2007-08 | 16.7 |
| 2008-09 | 16.7 |
| 2009-10 | 18.8 |
| 2010-11 | 23.2 |
| 2011-12 | 21.5 |
| 2012-13 | 21.9 |
| 2013-14 | 22.5 |
| 2014-15 | 21.9 |
| 2015-16 | 23.1 |
| 2016-17 | 24.5 |
| 2017-18 | 24.9 |
| 2018-19 | 25.1 |
| 2019-20 | 25.4 |
| 2020-21 | 33.9 |
| 2021-22 | 30.6 |
| 2022-23 | 31.3 |
| 2023-24 | 34.3 |
Real Per Capita Federal Transfers
After accounting for population growth and inflation, real per capita federal transfers increased at an average annual rate of 2.0 per cent from $1,124 in 1990-91 to $2,180 in 2023-24.
Figure 12.2 Real per capita federal transfers to Ontario, 1990-91 to 2023-24
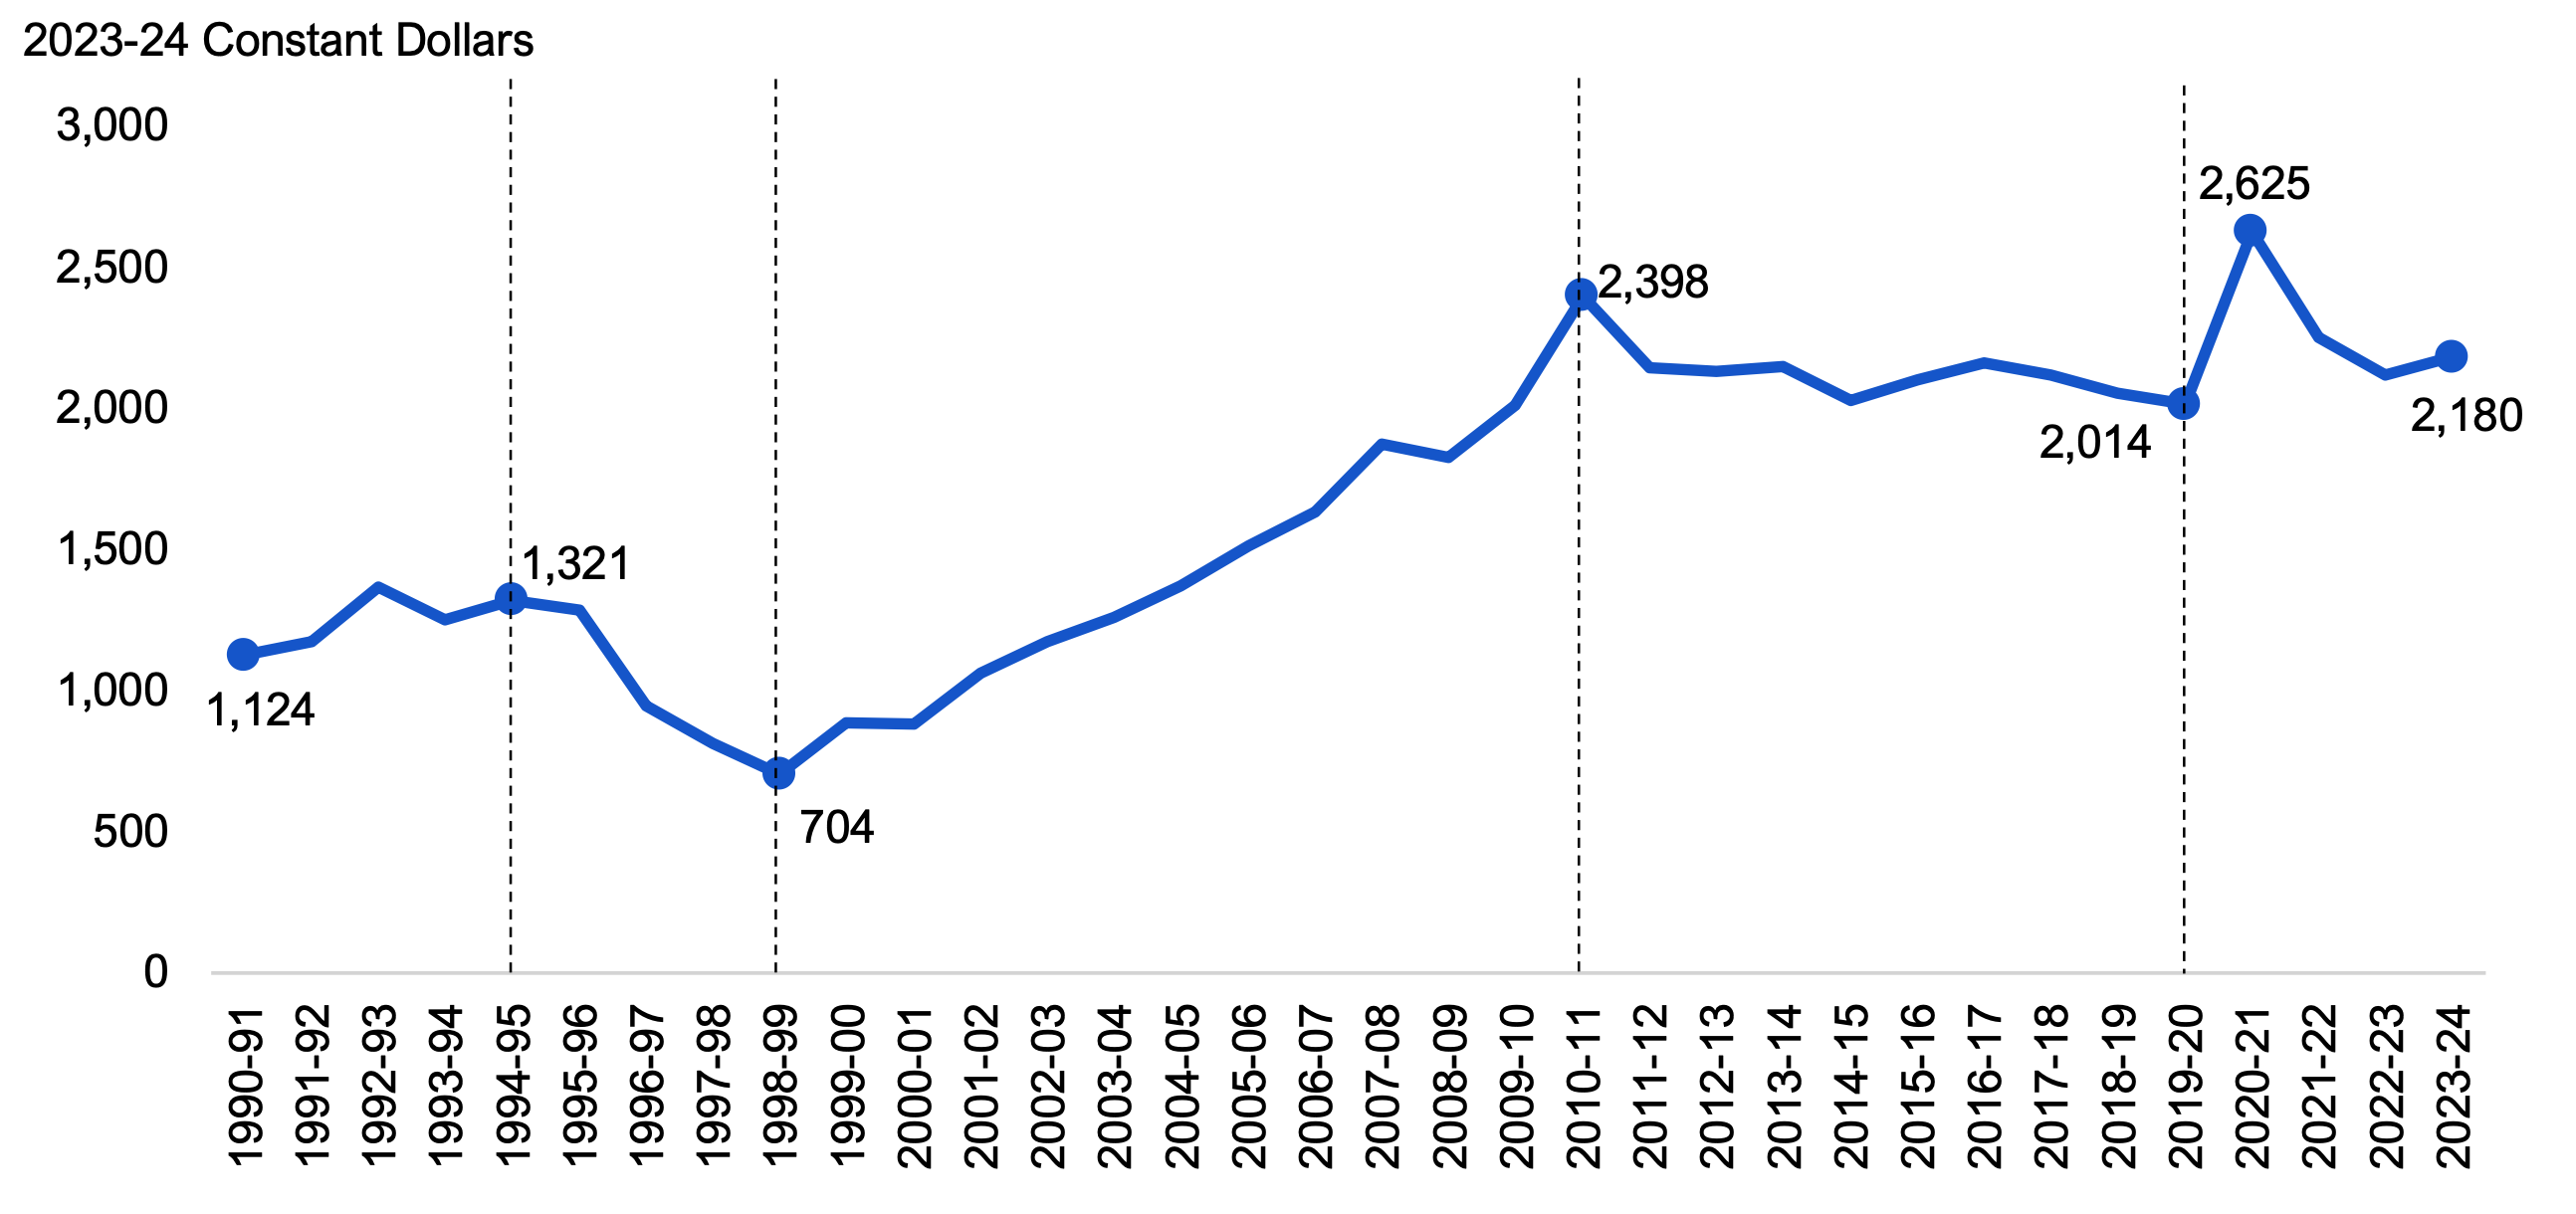
Source: FAO calculations, Statistics Canada, Public Accounts of Ontario and FAO analysis of information provided by the Province.
Accessible version
| Fiscal Year | Transfers Per Capita |
|---|---|
| 1990-91 | 1,124 |
| 1991-92 | 1,174 |
| 1992-93 | 1,368 |
| 1993-94 | 1,250 |
| 1994-95 | 1,321 |
| 1995-96 | 1,283 |
| 1996-97 | 945 |
| 1997-98 | 812 |
| 1998-99 | 704 |
| 1999-00 | 884 |
| 2000-01 | 881 |
| 2001-02 | 1,063 |
| 2002-03 | 1,174 |
| 2003-04 | 1,259 |
| 2004-05 | 1,370 |
| 2005-06 | 1,513 |
| 2006-07 | 1,630 |
| 2007-08 | 1,874 |
| 2008-09 | 1,825 |
| 2009-10 | 2,012 |
| 2010-11 | 2,398 |
| 2011-12 | 2,142 |
| 2012-13 | 2,131 |
| 2013-14 | 2,146 |
| 2014-15 | 2,027 |
| 2015-16 | 2,099 |
| 2016-17 | 2,160 |
| 2017-18 | 2,116 |
| 2018-19 | 2,053 |
| 2019-20 | 2,014 |
| 2020-21 | 2,625 |
| 2021-22 | 2,249 |
| 2022-23 | 2,119 |
| 2023-24 | 2,180 |
Between 1990-91 and 2023-24, the FAO has identified five distinct periods of trends in real per capita federal transfers.
1990-91 to 1994-95
From 1990-91 to 1994-95, real per capita transfers grew from $1,124 to $1,321 at an average annual rate of 4.1 per cent. During this period, most federal transfers were provided under the Established Programs Financing (EPF), which provided support for health care and postsecondary education programs to provinces on an equal per capita basis, and the Canada Assistance Plan (CAP), a conditional cost-sharing grant to reimburse provinces for half of their social assistance costs. From 1990-91 to 1994-95, real per capita EPF and CAP entitlements both grew at an average annual rate of 3.7 per cent.
1994-95 to 1998-99
Over the period from 1994-95 to 1998-99, real per capita transfers declined from $1,321 to $704 at an average annual rate of -14.6 per cent. This period was characterized by federal fiscal restraint as the total EPF transfers to Ontario declined by six per cent in 1995-96. Then, in 1996-97, the federal government replaced the EPF and CAP with the Canada Health and Social Transfer (CHST), which, among other changes, reduced funding for social services, postsecondary education and health care by 24 per cent in 1996-97. The federal government subsequently capped the total annual CHST envelope from 1997-98 to 1999-00, which remained fixed at $25.1 billion.
1998-99 to 2010-11
Over the period from 1998-99 to 2010-11, real per capita transfers grew from $704 to $2,398 at an average annual rate of 10.8 per cent. This period was characterized by a restructuring of the federal transfers system into its current form. In 2004, the federal government separated the CHST into the Canada Health Transfer (CHT) and the Canada Social Transfer (CST). Under this reform, total CHT funding was legislated to grow at six per cent annually starting in 2006-07. For the CST, its base was increased in 2007-08 and again in 2009-10 to include early learning and child care initiatives. Starting in 2009-10, annual CST funding was legislated to grow at three per cent. In addition, in 2006-07, Ontario began to receive funding under the Labour Market Development Agreement (LMDA) to fund labour market training programs, the funding of which was temporarily increased in 2009-10 in response to the global financial crisis.
Furthermore, during this period, Ontario received several time-limited transfers, including the 2003 Health Reform Transfer for primary health care, home care and catastrophic drug coverage; the 2004 Wait Times Reduction Transfer, which aimed to improve health care wait times; the two-year Infrastructure Stimulus Fund; and the five-year Green Infrastructure Fund to modernize and renew provincial and territorial infrastructure. In addition, Ontario began receiving Equalization program payments in 2009-10.
2010-11 to 2019-20
From 2010-11 to 2019-20, real per capita transfers declined from $2,398 to $2,014 at an average annual rate of -1.9 per cent. During this period, time-limited transfers that were introduced in response to the global financial crisis expired and, in 2017-18, the CHT annual growth rate was changed to nominal GDP growth with a guaranteed minimum increase of three per cent annually. In addition, Ontario’s Equalization payments peaked at $3.3 billion in 2012-13, then gradually declined until Ontario became ineligible for the program in 2019-20. These reductions were partially offset by additional funding from the Investing in Canada Plan, which allocated $11.8 billion to Ontario over 11 years beginning in 2017-18. Additionally, Ontario received $5.8 billion over 10 years beginning in 2018-19 to support social and community housing and address housing affordability under the National Housing Strategy, and $4.2 billion over 10 years beginning in 2017-18 under the Canada-Ontario Home and Community Care and Mental Health and Addictions Services Funding Agreement.
2019-20 to 2023-24
Over the period from 2019-20 to 2023-24, real per capita transfers grew from $2,014 to $2,180 at an average annual rate of 2.0 per cent. This period includes time-limited transfers in response to the COVID-19 pandemic, including $5.1 billion in federal funding under the Safe Restart Agreement. Furthermore, in 2022, Ontario reached a $13.2 billion six-year agreement with the federal government to fund a Canada-wide Early Learning and Child Care program. In 2023, Ontario reached a new health accord with the federal government, which increased the CHT minimum growth rate to five per cent per year until 2027-28, provided a CHT top-up of $0.8 billion in 2023-24, and included a 10-year bilateral agreement to support shared health priorities, which will provide Ontario with $0.8 billion per year.[28] Lastly, in 2023-24, Ontario qualified for the Equalization program again and received $421 million.
Figure 12.3 Average annual growth in real per capita federal transfers, 1990-91 to 2023-24
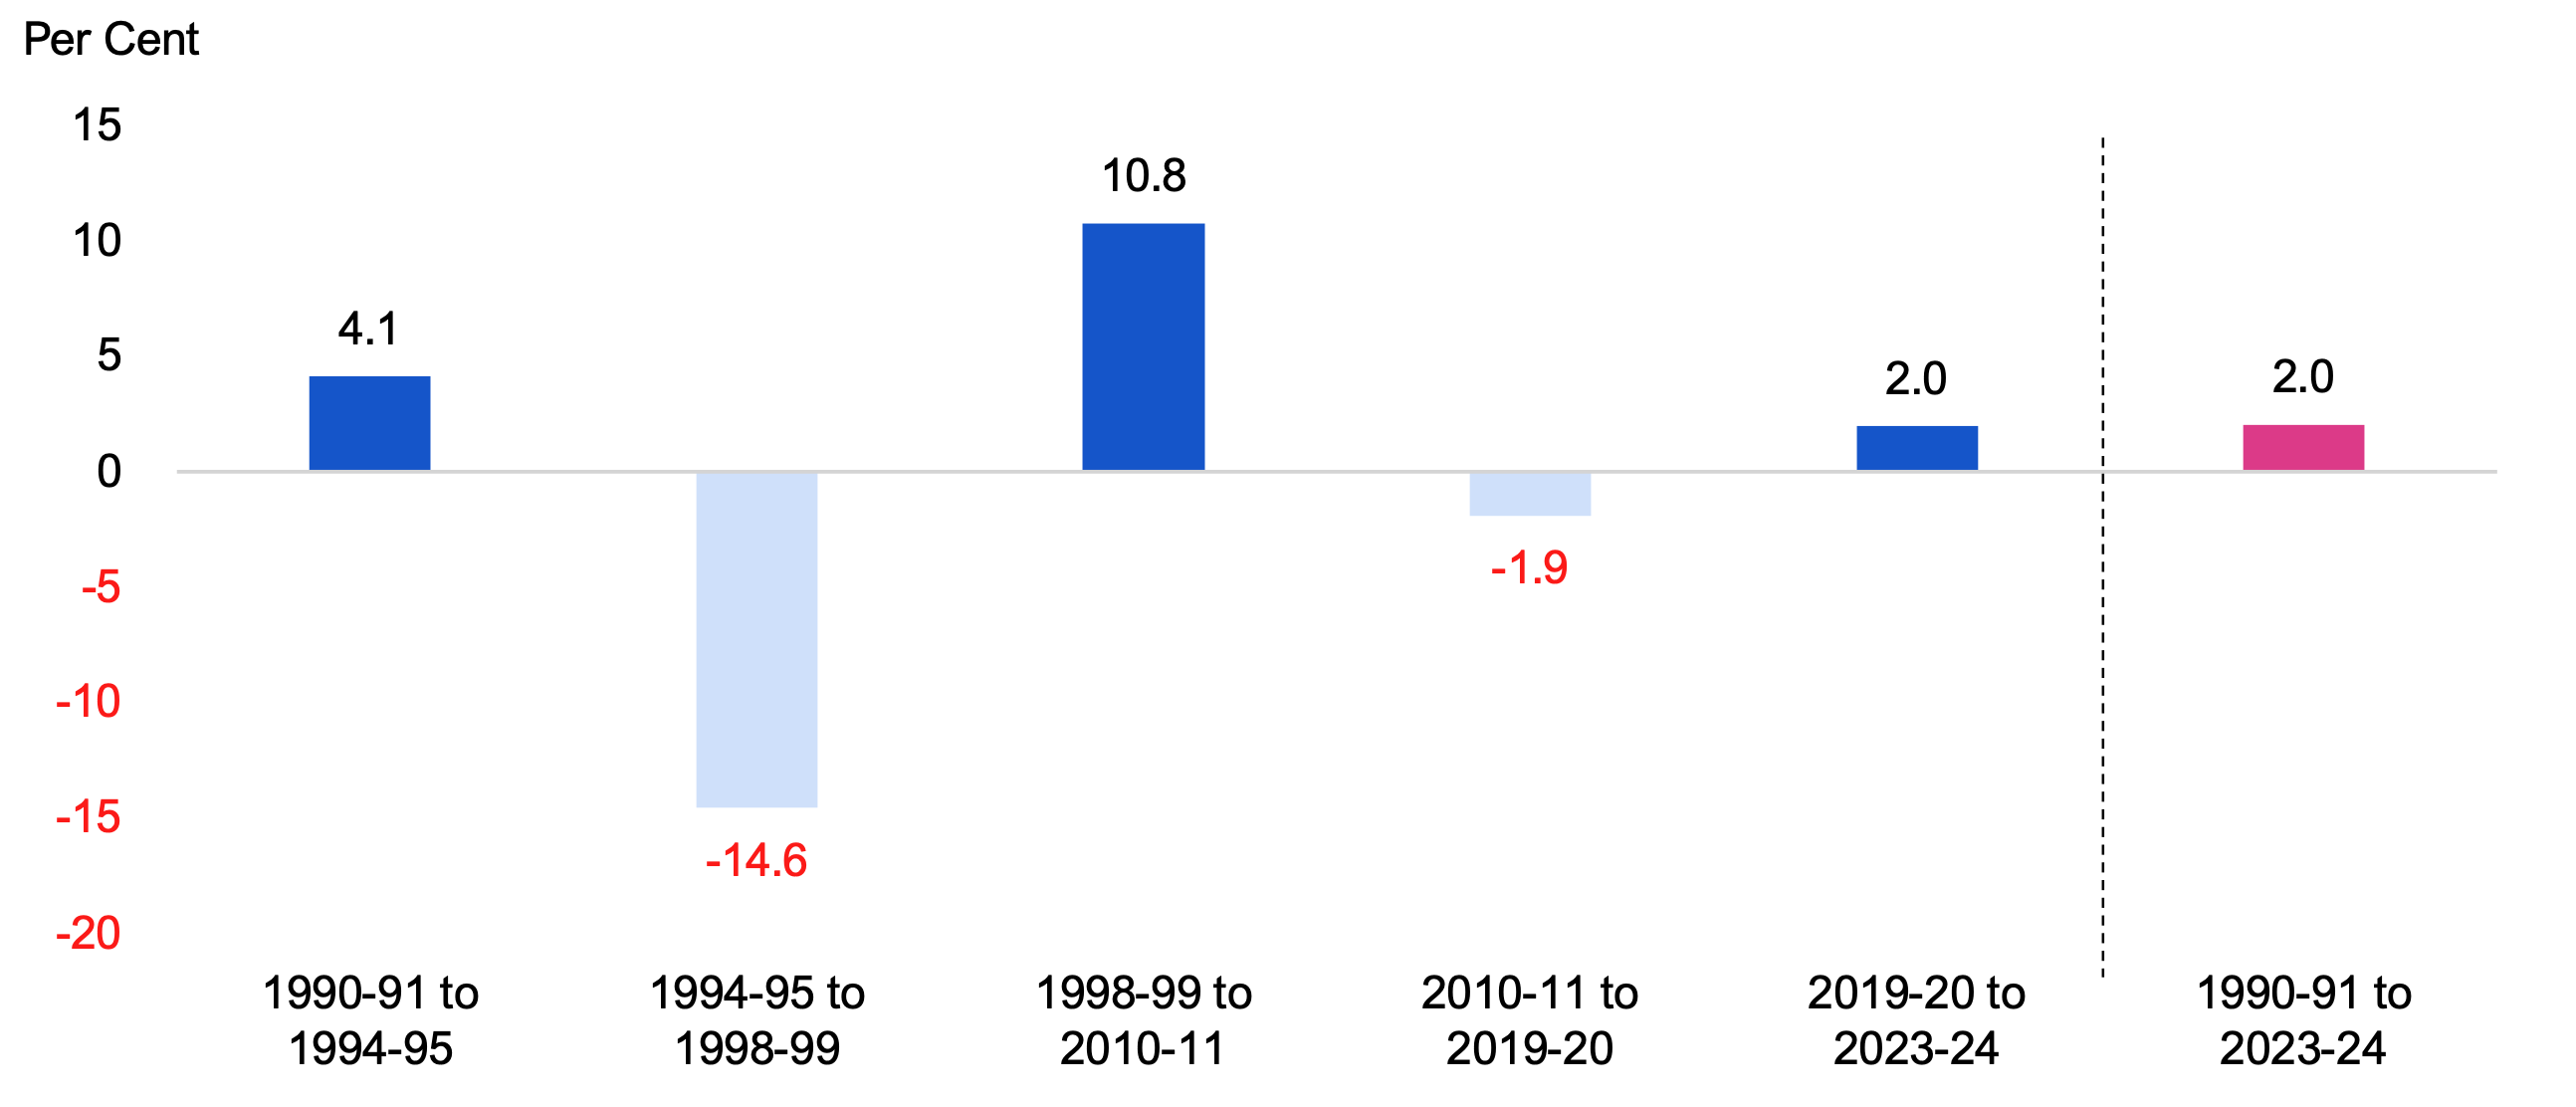
Source: FAO calculations, Statistics Canada, Public Accounts of Ontario and FAO analysis of information provided by the Province.
Accessible version
| Fiscal Years | 1990-91 to 1994-95 | 1994-95 to 1998-99 | 1998-99 to 2010-11 | 2010-11 to 2019-20 | 2019-20 to 2023-24 | 1990-91 to 2023-24 |
|---|---|---|---|---|---|---|
| Average Annual Growth | 4.1 | -14.6 | 10.8 | -1.9 | 2.0 | 2.0 |
Federal Transfers as a Share of Provincial Spending
Comparing total federal transfers to total provincial spending provides insight on the portion of provincial spending that was supported by federal transfers. From 1990-91 to 2023-24, total federal transfers as a share of provincial spending averaged 13.4 per cent, ranging from a low of 6.8 per cent in 1998-99 to a high of 18.7 per cent during the COVID-19 pandemic in 2020-21.
Figure 12.4 Total federal transfers as a share of total provincial spending, 1990-91 to 2023-24
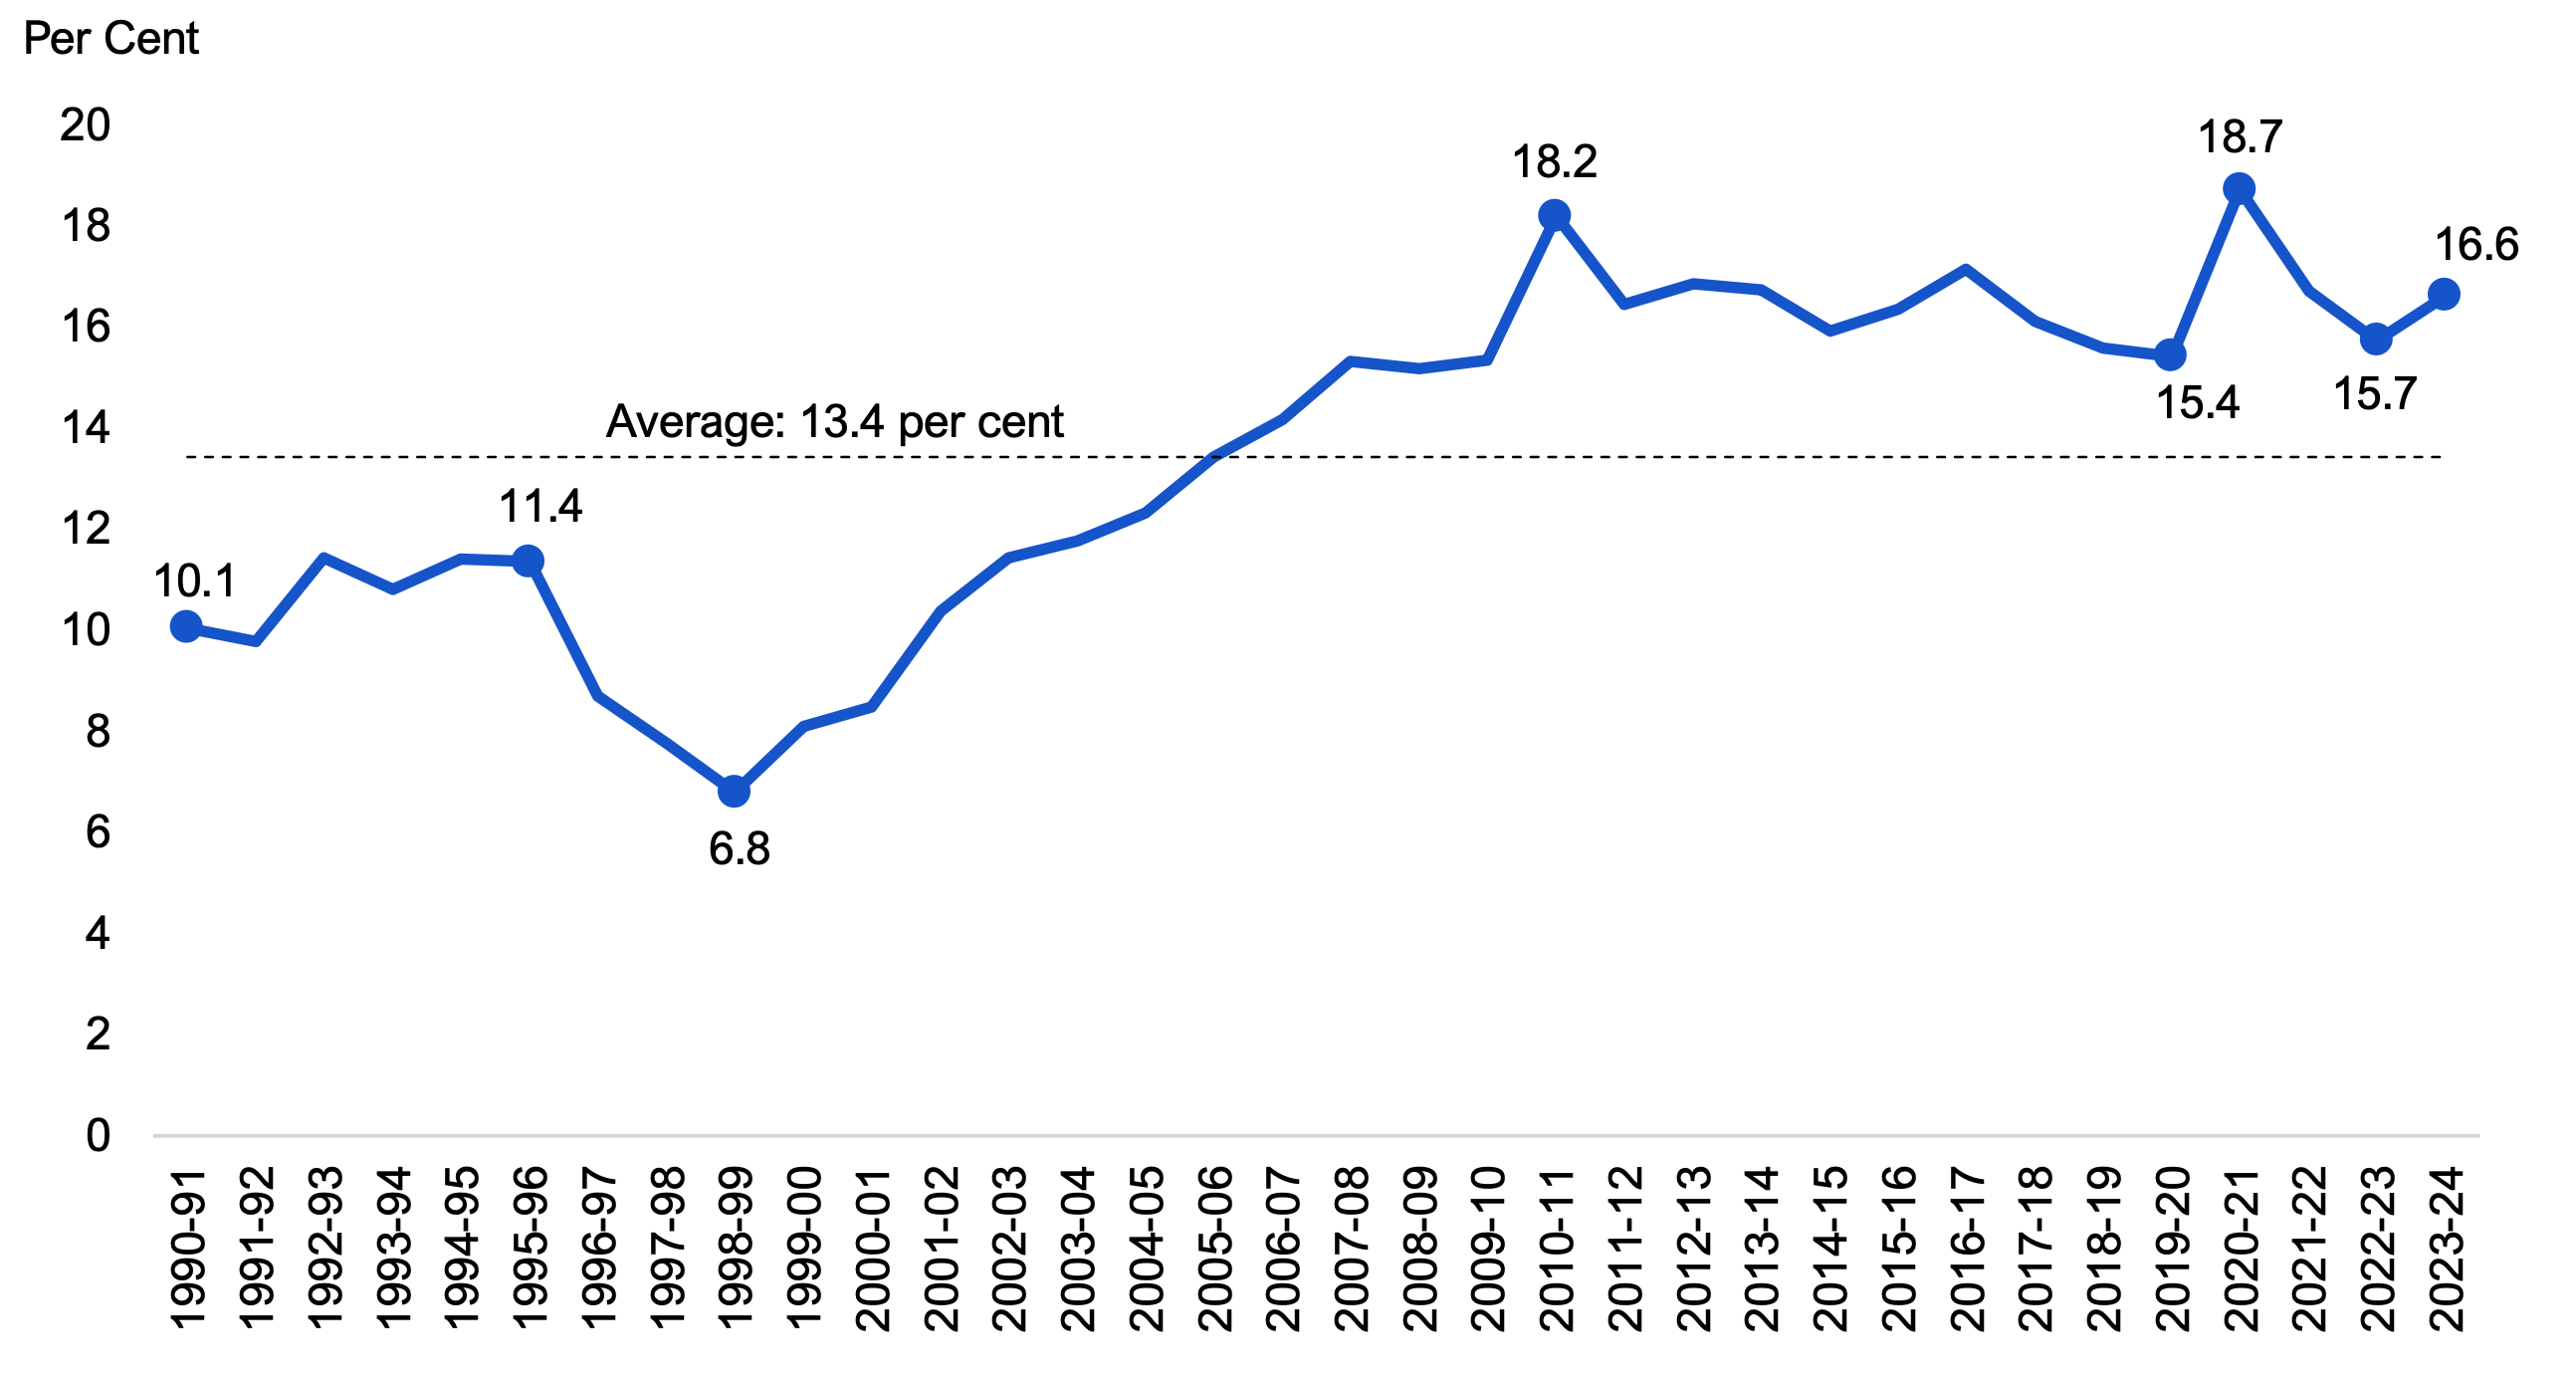
Source: FAO calculations, Public Accounts of Ontario and FAO analysis of information provided by the Province.
Accessible version
| Fiscal Year | Total Federal Transfers as a Share of Total Provincial Spending | Average |
|---|---|---|
| 1990-91 | 10.1 | 13.4 |
| 1991-92 | 9.8 | 13.4 |
| 1992-93 | 11.4 | 13.4 |
| 1993-94 | 10.8 | 13.4 |
| 1994-95 | 11.4 | 13.4 |
| 1995-96 | 11.4 | 13.4 |
| 1996-97 | 8.7 | 13.4 |
| 1997-98 | 7.8 | 13.4 |
| 1998-99 | 6.8 | 13.4 |
| 1999-00 | 8.1 | 13.4 |
| 2000-01 | 8.5 | 13.4 |
| 2001-02 | 10.4 | 13.4 |
| 2002-03 | 11.4 | 13.4 |
| 2003-04 | 11.8 | 13.4 |
| 2004-05 | 12.3 | 13.4 |
| 2005-06 | 13.4 | 13.4 |
| 2006-07 | 14.2 | 13.4 |
| 2007-08 | 15.3 | 13.4 |
| 2008-09 | 15.2 | 13.4 |
| 2009-10 | 15.3 | 13.4 |
| 2010-11 | 18.2 | 13.4 |
| 2011-12 | 16.4 | 13.4 |
| 2012-13 | 16.9 | 13.4 |
| 2013-14 | 16.7 | 13.4 |
| 2014-15 | 15.9 | 13.4 |
| 2015-16 | 16.4 | 13.4 |
| 2016-17 | 17.1 | 13.4 |
| 2017-18 | 16.1 | 13.4 |
| 2018-19 | 15.6 | 13.4 |
| 2019-20 | 15.4 | 13.4 |
| 2020-21 | 18.7 | 13.4 |
| 2021-22 | 16.7 | 13.4 |
| 2022-23 | 15.7 | 13.4 |
| 2023-24 | 16.6 | 13.4 |
Total federal transfers as a share of total provincial spending grew from 10.1 per cent in 1990-91 to 11.4 per cent in 1995-96 as the pace of growth in federal transfers to Ontario exceeded growth in provincial spending. This share decreased to a low of 6.8 per cent in 1998-99 during a period of federal fiscal restraint. In the following period, from 1998-99 to 2010-11, the share rose from 6.8 per cent to 18.2 per cent, largely due to increased federal transfers for health care and other targeted sectors. From 2010-11 to 2019-20, total federal transfers as a share of provincial spending fell to 15.4 per cent as the CHT’s legislated annual growth rate changed from six per cent to a three-year moving average of nominal GDP. In 2020-21, total federal transfers as a share of provincial spending grew to a high of 18.7 per cent due to federal government support in response to the COVID-19 pandemic. By 2022-23, the share had declined to 15.7 per cent due to the expiry of federal COVID-19-related supports. The share then increased to 16.6 per cent in 2023-24, largely due to the increase in the CHT minimum growth rate, new funding under the bilateral agreement to support shared health priorities and increased child care transfers.
Appendix A: Spending by Standard Account
Overview
The Public Accounts of Ontario also provides information on provincial spending by standard account, which categorizes spending based on the nature of the expenses, such as salaries or services, in contrast to an administrative categorization, such as by sector, ministry or program.
In 2023-24, of the $206.6 billion in total spending, transfer payments accounted for the largest share by standard account at 38.9 per cent, or $80.3 billion.[29] The next largest standard account category was salaries and wages at 27.6 per cent, or $57.1 billion, followed by other transactions (11.0 per cent, $22.7 billion), services (8.7 per cent, $18.0 billion), employee benefits (7.2 per cent, $14.8 billion), supplies and equipment (6.2 per cent, $12.8 billion) and transportation and communication (0.4 per cent, $0.9 billion).
| Standard Account Category | Definition | 2023-24 Spending ($ millions) | 2023-24 Share of Spending (%) |
|---|---|---|---|
| Transfer Payments | Payments to individuals, businesses, organizations and non-consolidated government bodies, including grants, subsidies, tax credits and shared cost agreements. Note: transfer payments to consolidated government entities are recorded at the standard account level based on the ultimate nature of the expense. | 80,294 | 38.9 |
| Salaries and Wages | Salaries and wages for government employees, as well as for workers in hospitals, school boards, colleges and other consolidated entities. | 57,101 | 27.6 |
| Services | Includes information services, repair services, and other professional and special services. | 18,047 | 8.7 |
| Employee Benefits | Includes contributions to pension plans, including for workers in hospitals, school boards and colleges, employer contributions to the Canada Pension Plan and Employment Insurance, and other employee benefit plans. | 14,818 | 7.2 |
| Supplies and Equipment | Includes spending for the maintenance of assets, such as for correctional facilities, highways and park infrastructure. | 12,758 | 6.2 |
| Transportation and Communication | Includes spending for information technology, such as for telephone and data communications, and travelling expenses. | 914 | 0.4 |
| Other Transactions | Includes spending on interest on debt, amortization expense, accounting adjustments and other items. | 22,652 | 11.0 |
| Total | 206,583 | 100.0 |
Trends
Nominal Growth Rates
For the seven-year period from 2016-17 to 2023-24,[30] total Ontario government spending grew at an average annual rate of 5.4 per cent; however, growth has varied by standard account. The fastest growing standard account was services, at 9.3 per cent average annual growth, followed by supplies and equipment (7.3 per cent), transportation and communication (7.0 per cent), transfer payments (5.3 per cent), salaries and wages (5.2 per cent), employee benefits (4.9 per cent) and other transactions (2.9 per cent).
Figure A.1 Average annual spending growth by standard account, 2016-17 to 2023-24
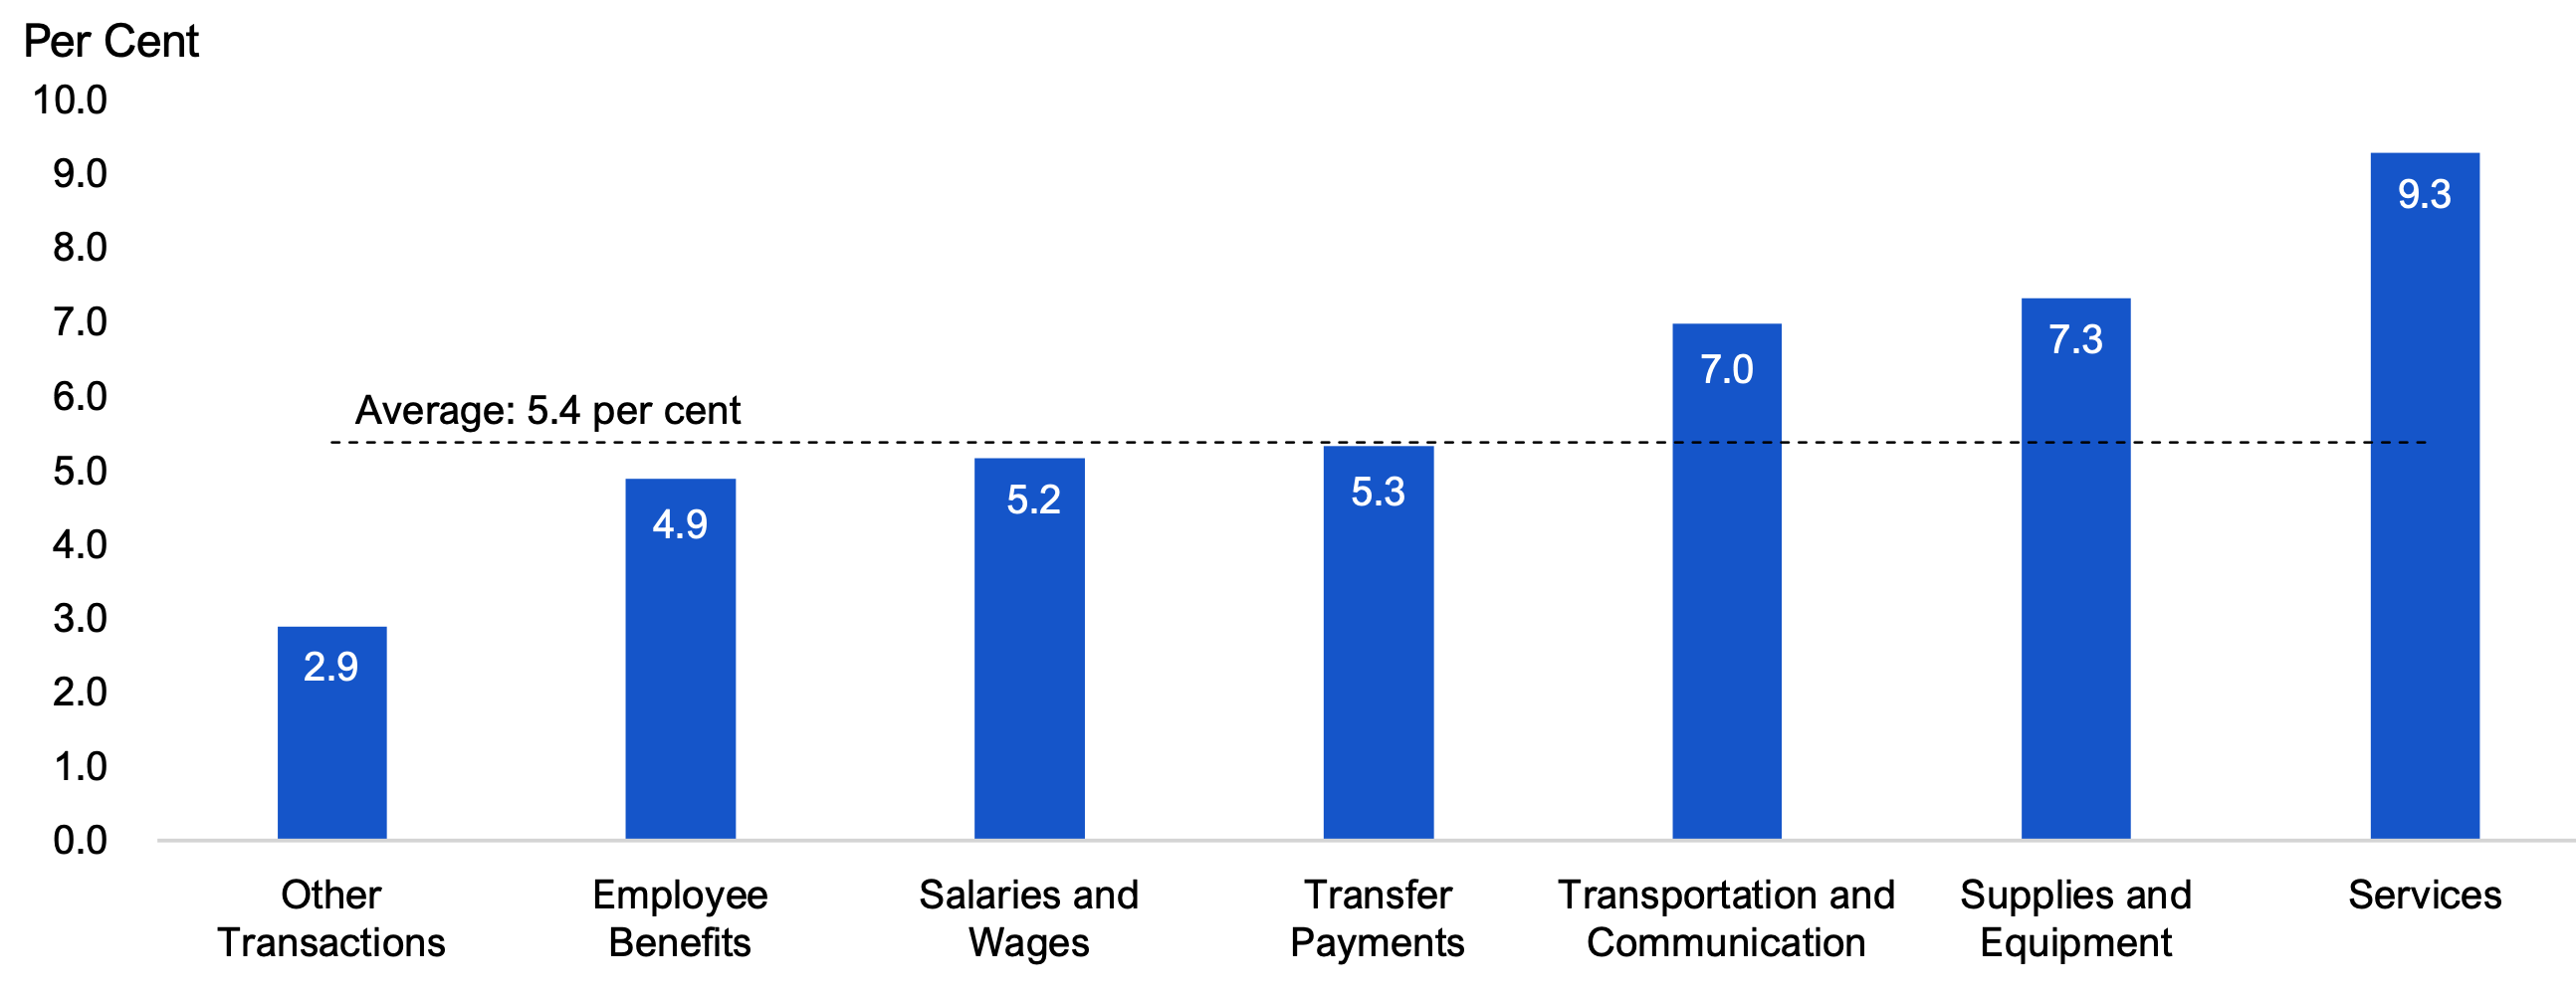
Note: Transfer payments to consolidated entities (such as hospitals, school boards, colleges, Children’s Aid Societies and applicable provincial agencies) are presented at the standard account level by the ultimate nature of the expense
SourcePublic Accounts of Ontario and FAO analysis of information provided by the Province.
Accessible version
| Standard Account | Average Annual Spending Growth |
|---|---|
| Other Transactions | 2.9 |
| Employee Benefits | 4.9 |
| Salaries and Wages | 5.2 |
| Transfer Payments | 5.3 |
| Transportation and Communication | 7.0 |
| Supplies and Equipment | 7.3 |
| Services | 9.3 |
| Average | 5.4 |
Real Per Capita Growth Rates
After adjusting for population and inflation, total Ontario government spending grew at an average annual rate of 0.6 per cent during the period from 2016-17 to 2023-24. The fastest growing standard account was services, at 4.3 per cent average annual growth, followed by supplies and equipment (2.4 per cent), transportation and communication (2.1 per cent), transfer payments (0.5 per cent), salaries and wages (0.4 per cent), employee benefits (0.1 per cent) and other transactions (-1.8 per cent).
Figure A.2 Average annual real per capita spending growth by standard account, 2016-17 to 2023-24
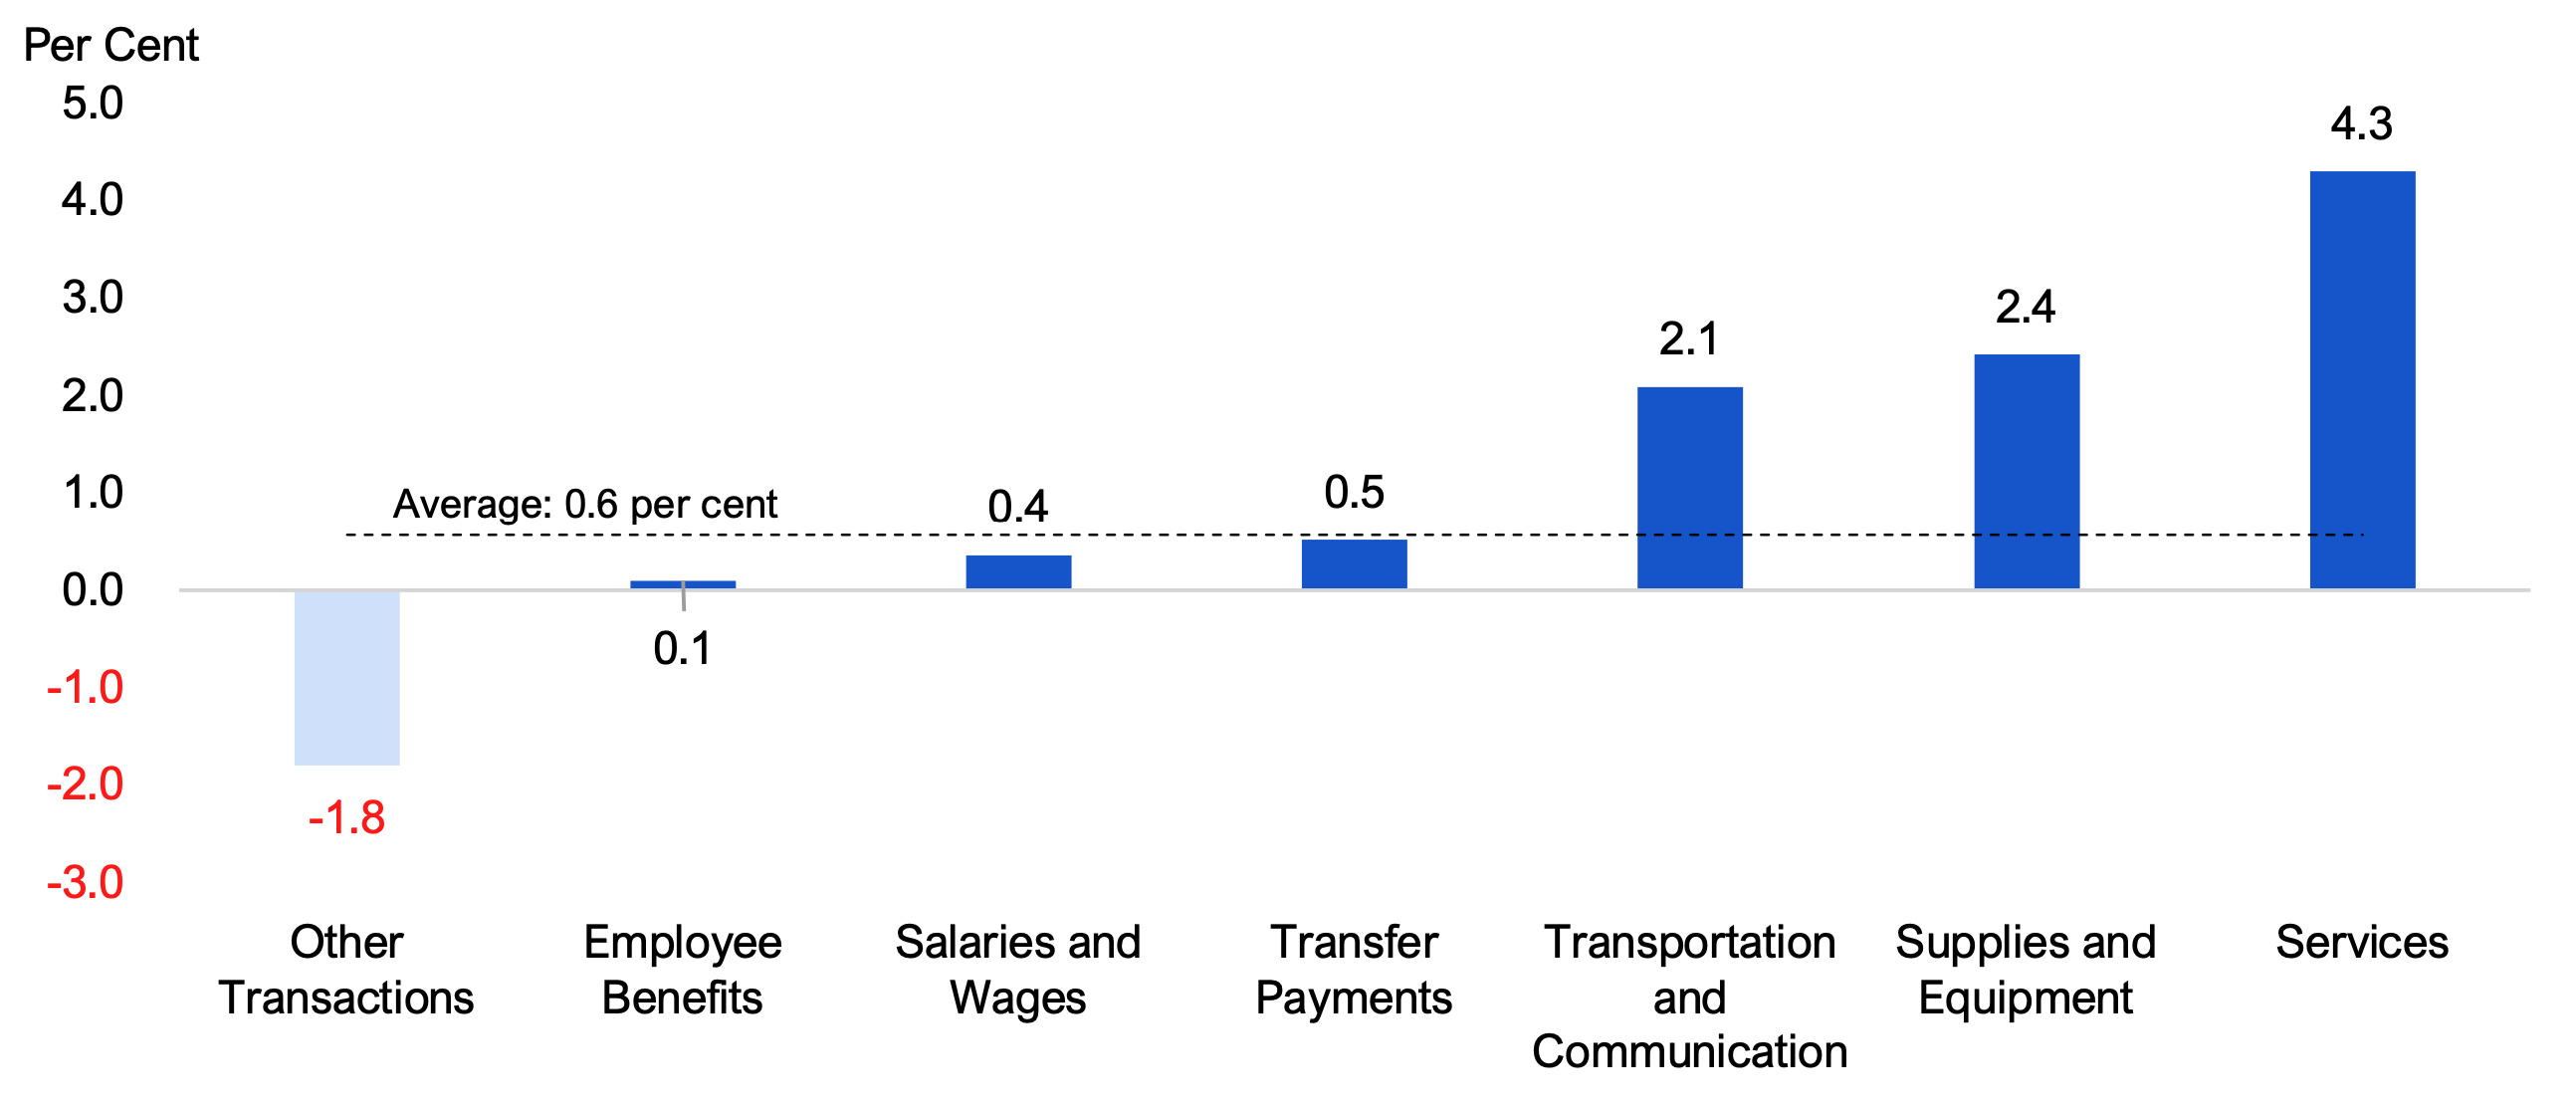
Note: Transfer payments to consolidated entities (such as hospitals, school boards, colleges, Children’s Aid Societies and applicable provincial agencies) are presented at the standard account level by the ultimate nature of the expense
SourceStatistics Canada, Public Accounts of Ontario and FAO analysis of information provided by the Province.
Accessible version
| Standard Account | Average Annual Real Per Capita Spending Growth |
|---|---|
| Other Transactions | -1.8 |
| Employee Benefits | 0.1 |
| Salaries and Wages | 0.4 |
| Transfer Payments | 0.5 |
| Transportation and Communication | 2.1 |
| Supplies and Equipment | 2.4 |
| Services | 4.3 |
| Average | 0.6 |
Shares of Total Spending
Since 2016-17, the share of total spending by standard account has remained relatively stable.
- Spending on transfer payments was 39 per cent as a share of total spending in 2016-17 and 2023-24, after peaking at 43 per cent in 2020-21 due to time-limited COVID-19-related spending.
- Spending on salaries and wages was 28 per cent as a share of total spending in 2016-17 and 2023-24, but experienced a drop to 26 per cent in 2020-21 and 2021-22, partially due to wage restraint under Bill 124 and increased spending in other standard accounts due to time-limited COVID-19-related spending.
- Spending on other transactions decreased from 13 per cent of total spending in 2016-17 to 11 per cent in 2023-24, largely due to a decline in interest on debt spending.
- From 2016-17 to 2023-24, spending on services (seven per cent to nine per cent) and supplies and equipment (five per cent to six per cent) both increased as a share of total spending.
- Spending on employee benefits and transportation and communication have both remained stable at seven per cent and less than one per cent of total spending, respectively, for most of the eight-year period.
Figure A.3 Share of Ontario government spending by consolidated standard account, 2016-17 to 2023-24
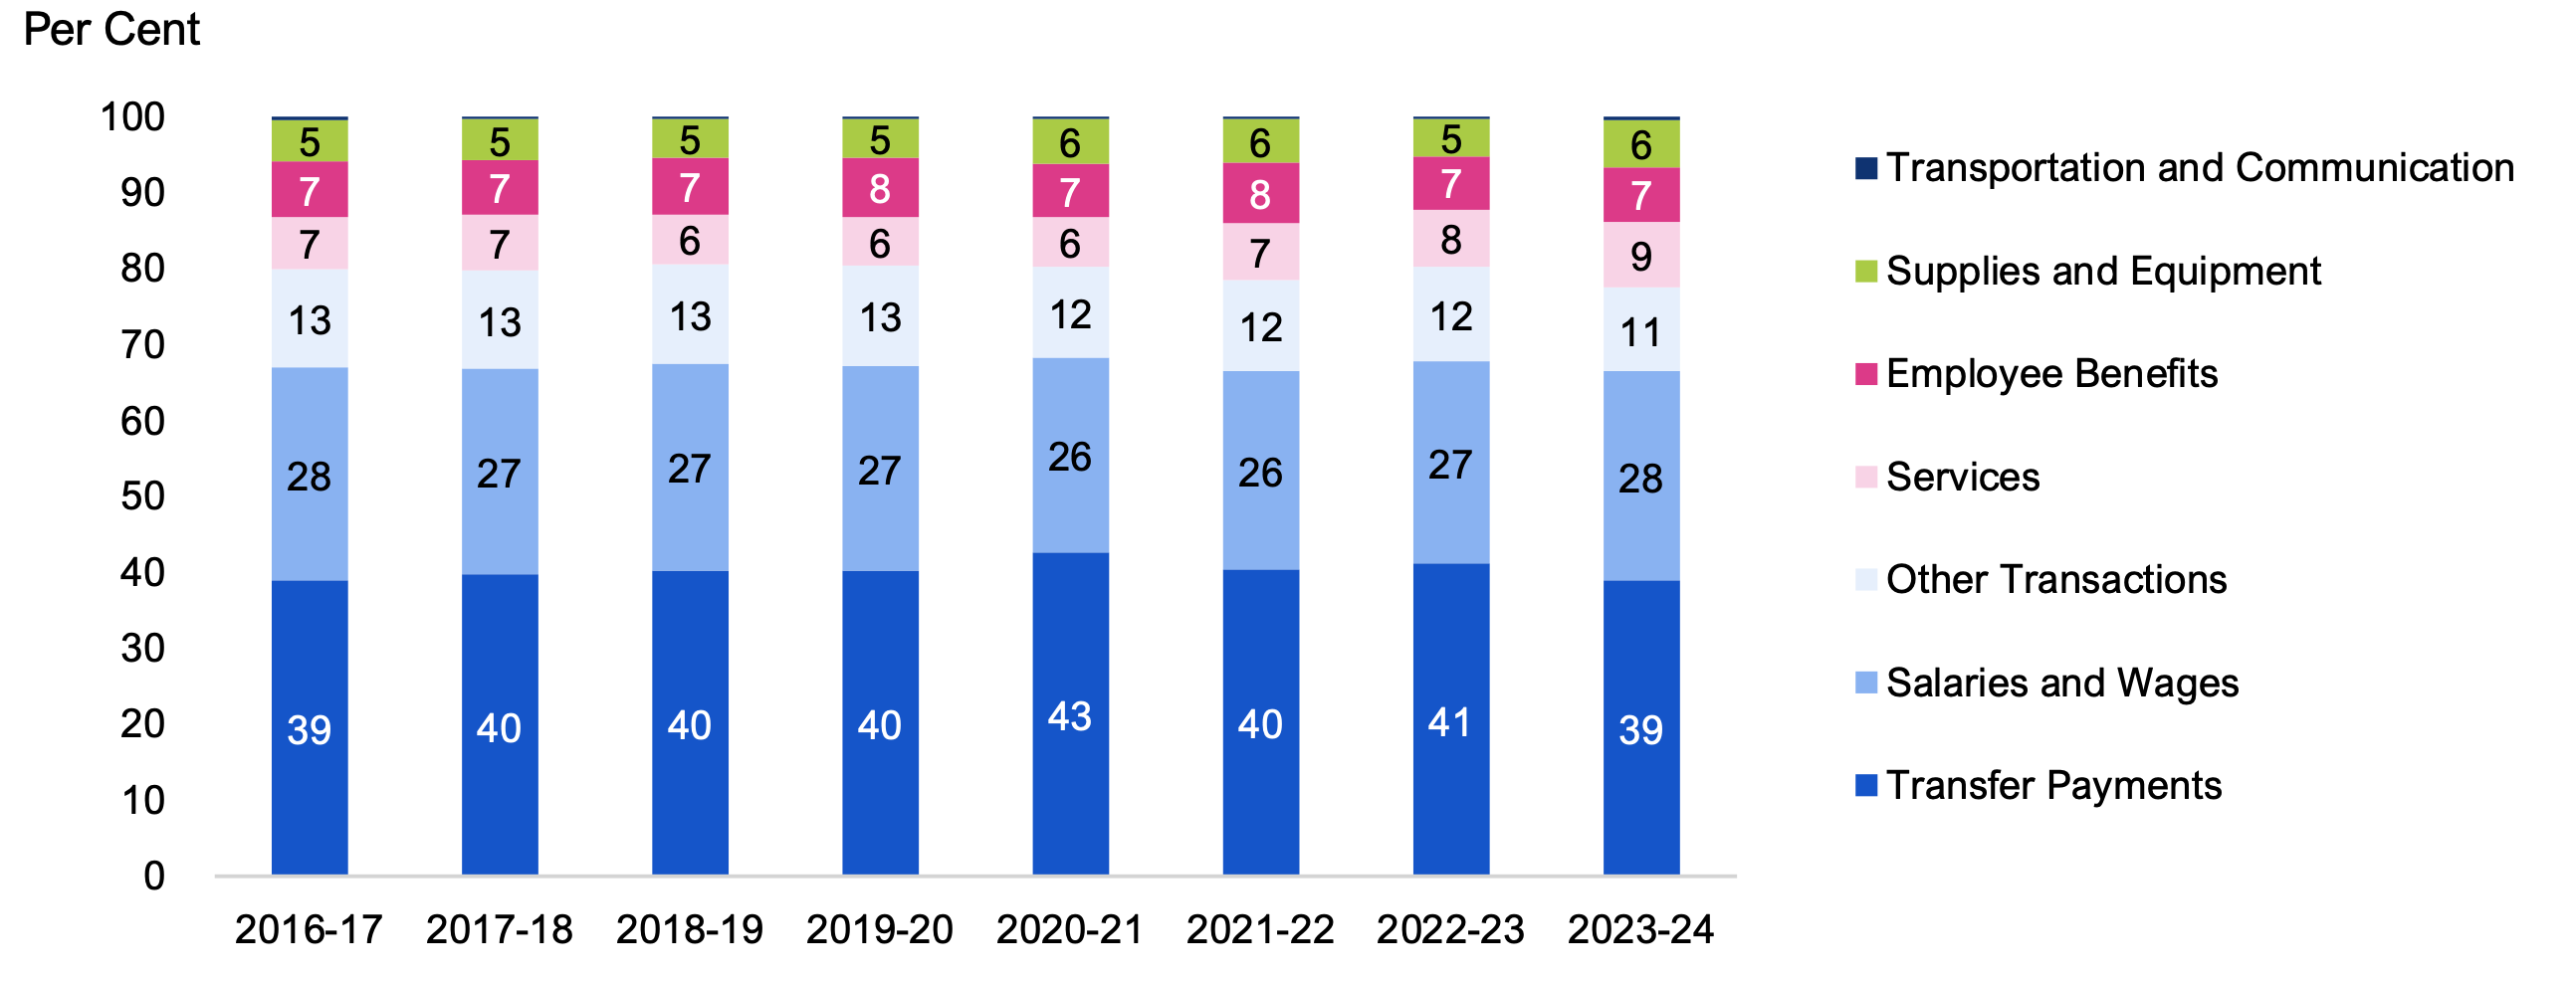
Note: Transfer payments to consolidated entities (such as hospitals, school boards, colleges, Children’s Aid Societies and applicable provincial agencies) are presented at the standard account level by the ultimate nature of the expense
SourcePublic Accounts of Ontario and FAO analysis of information provided by the Province.
Accessible version
| Standard Account | 2016-17 | 2017-18 | 2018-19 | 2019-20 | 2020-21 | 2021-22 | 2022-23 | 2023-24 |
|---|---|---|---|---|---|---|---|---|
| Transfer Payments | 39 | 40 | 40 | 40 | 43 | 40 | 41 | 39 |
| Salaries and Wages | 28 | 27 | 27 | 27 | 26 | 26 | 27 | 28 |
| Other Transactions | 13 | 13 | 13 | 13 | 12 | 12 | 12 | 11 |
| Services | 7 | 7 | 6 | 6 | 6 | 7 | 8 | 9 |
| Employee Benefits | 7 | 7 | 7 | 8 | 7 | 8 | 7 | 7 |
| Supplies and Equipment | 5 | 5 | 5 | 5 | 6 | 6 | 5 | 6 |
| Transportation and Communication | 0 | 0 | 0 | 0 | 0 | 0 | 0 | 0 |
Appendix B: Select Sector Cost Drivers
This appendix presents additional information on sector cost drivers that were discussed in Chapters 5 through 7.
Health
Population aging is an important driver of health care spending. On average, older Ontarians require more health care spending than younger Ontarians. In 2022, the Province recorded an average of $13,641 in health spending for Ontarians aged 65 and over, compared to $3,629 for Ontarians aged 20 to 64 and $2,728 for Ontarians aged 0 to 19. Since 1990, Ontario’s 65+ population has grown at an average annual rate of 2.8 per cent, more than double the 1.3 per cent growth in Ontarians aged 20 to 64 and over six times faster than the 0.4 per cent growth in Ontarians aged 0 to 19. This aging of Ontario’s population means that, over time, more health care resources are required to provide the same level of service per Ontarian.
Figure B.1 Average annual population growth by age group, 1990-91 to 2023-24 Average per capita health spending by age group, 2022
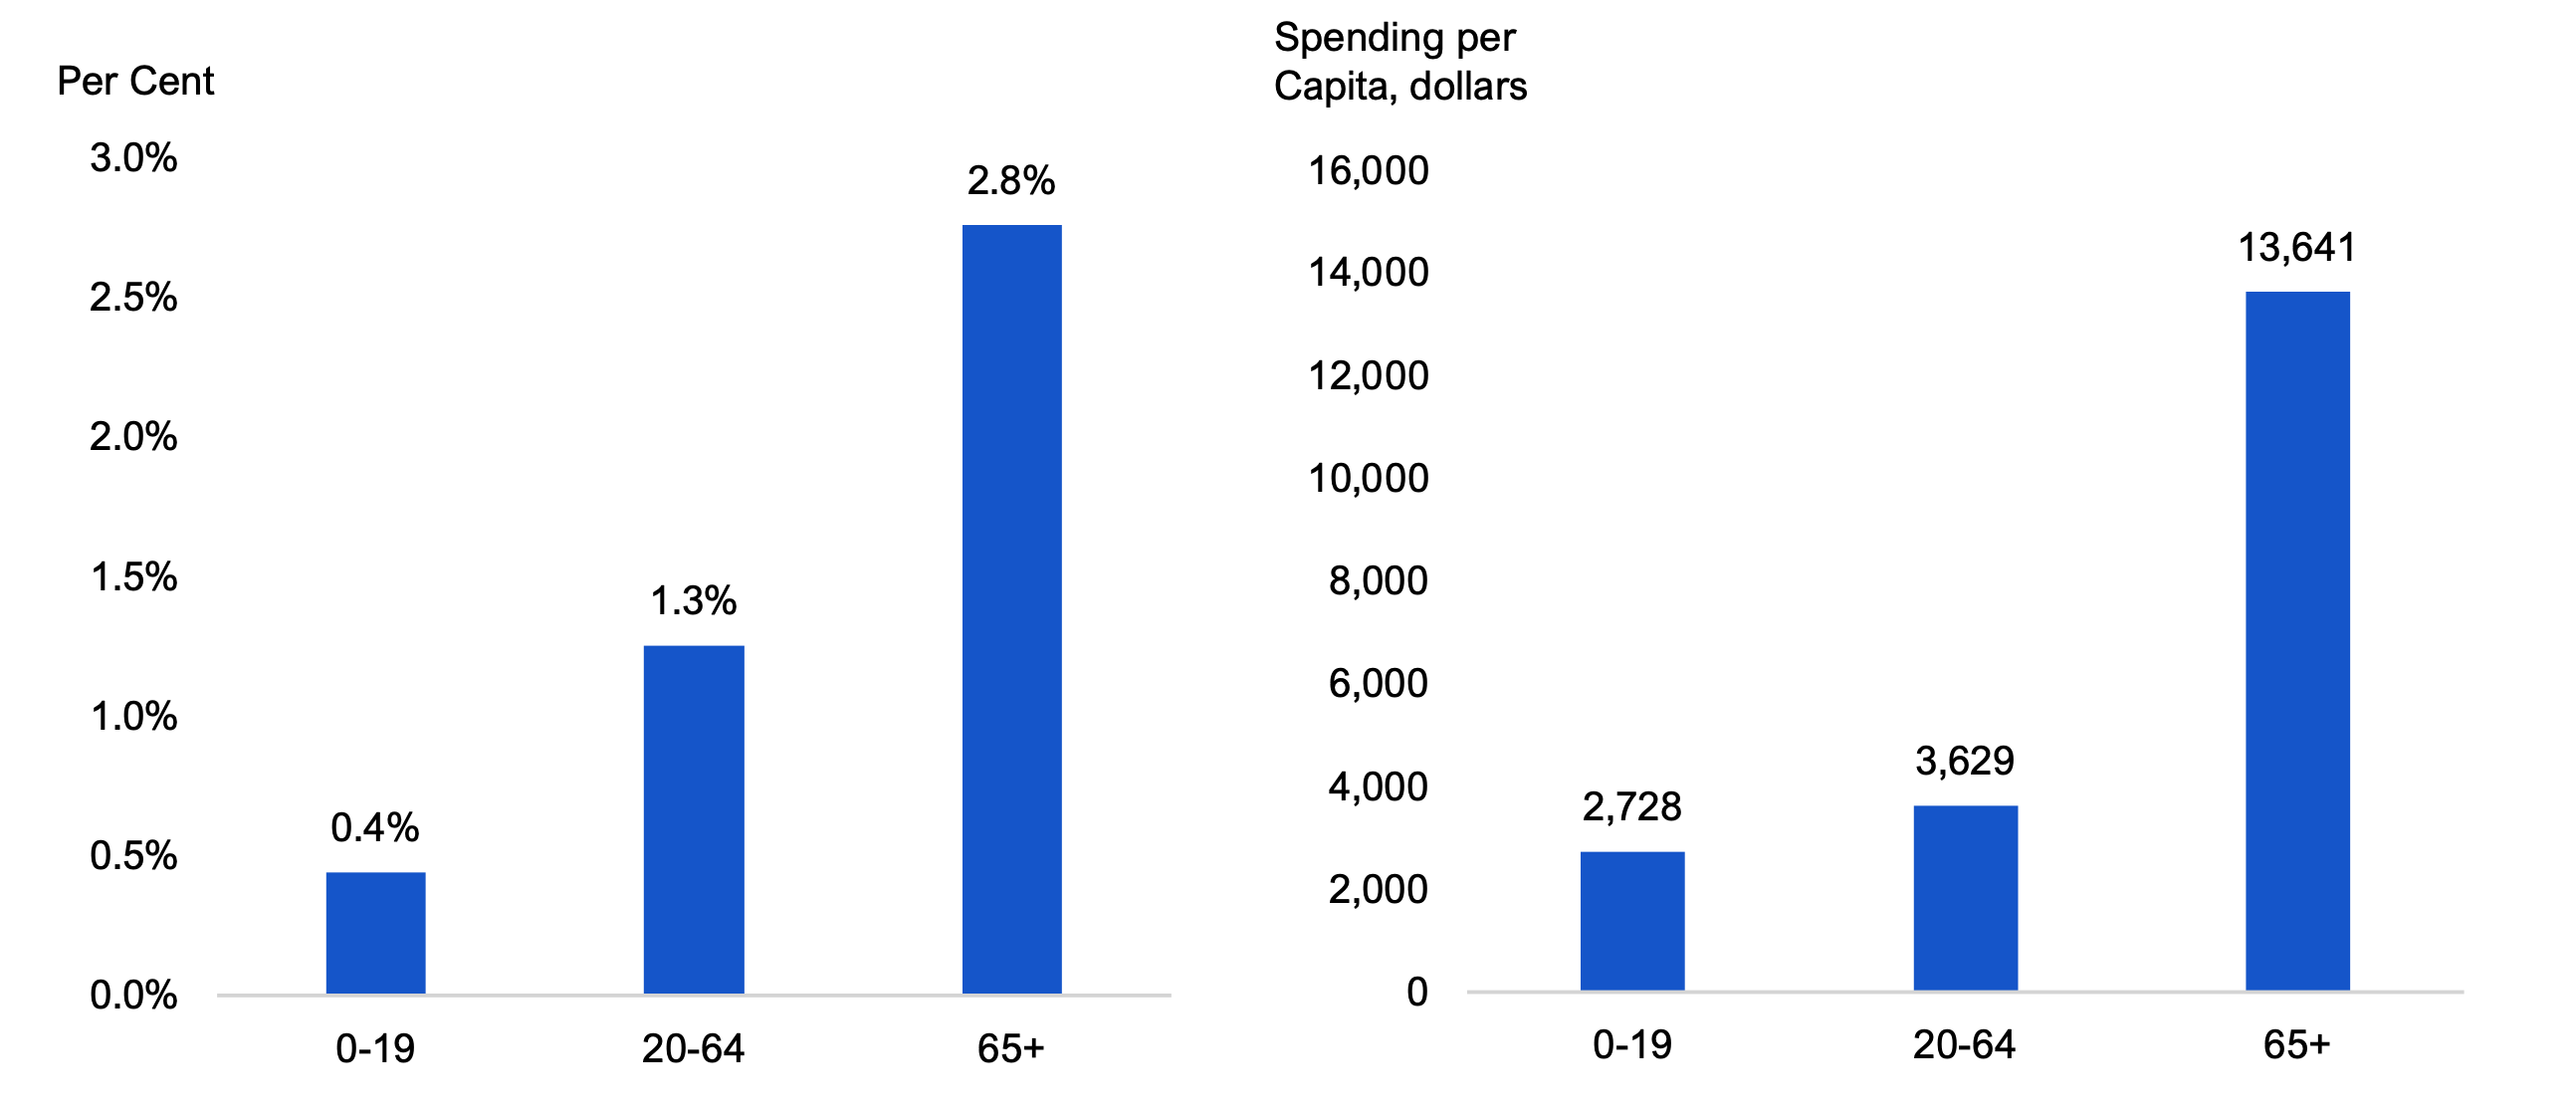
Source: FAO calculations and FAO analysis of CIHI National Health Expenditure Trends, 2024: Data Tables — Series E1 and Statistics Canada
Accessible version
| Age Group | Per Cent | Spending per Capita |
|---|---|---|
| 0-19 | 0.4% | 2,728 |
| 20-64 | 1.3% | 3,629 |
| 65+ | 2.8% | 13,641 |
Education
An important cost driver of education sector spending is the school- and child care-aged population.[31] Education and child care services are primarily provided to Ontarians under the age of 18; therefore, growth in that subset of the population drives demand for education sector services. From 1990-91 to 2023-24, the school- and child care-aged population has fluctuated, ultimately growing at an average annual rate of 0.2 per cent from 2,639,647 in 1990-91 to 2,851,224 in 2023-24. Between 1990-91 and 2002-03, the population increased from 2,639,647 in 1990-91 to 2,962,904 in 2002-03. The population then declined to 2,833,383 in 2003-04 due to the phase-out of the Ontario Academic Credit (OAC), which eliminated the fifth year of secondary education. The school- and child care-aged population continued to decline to 2,706,750 in 2014-15 before increasing to 2,851,224 in 2023-24.
Figure B.2 School- and child care-aged population, 1990-91 to 2023-24
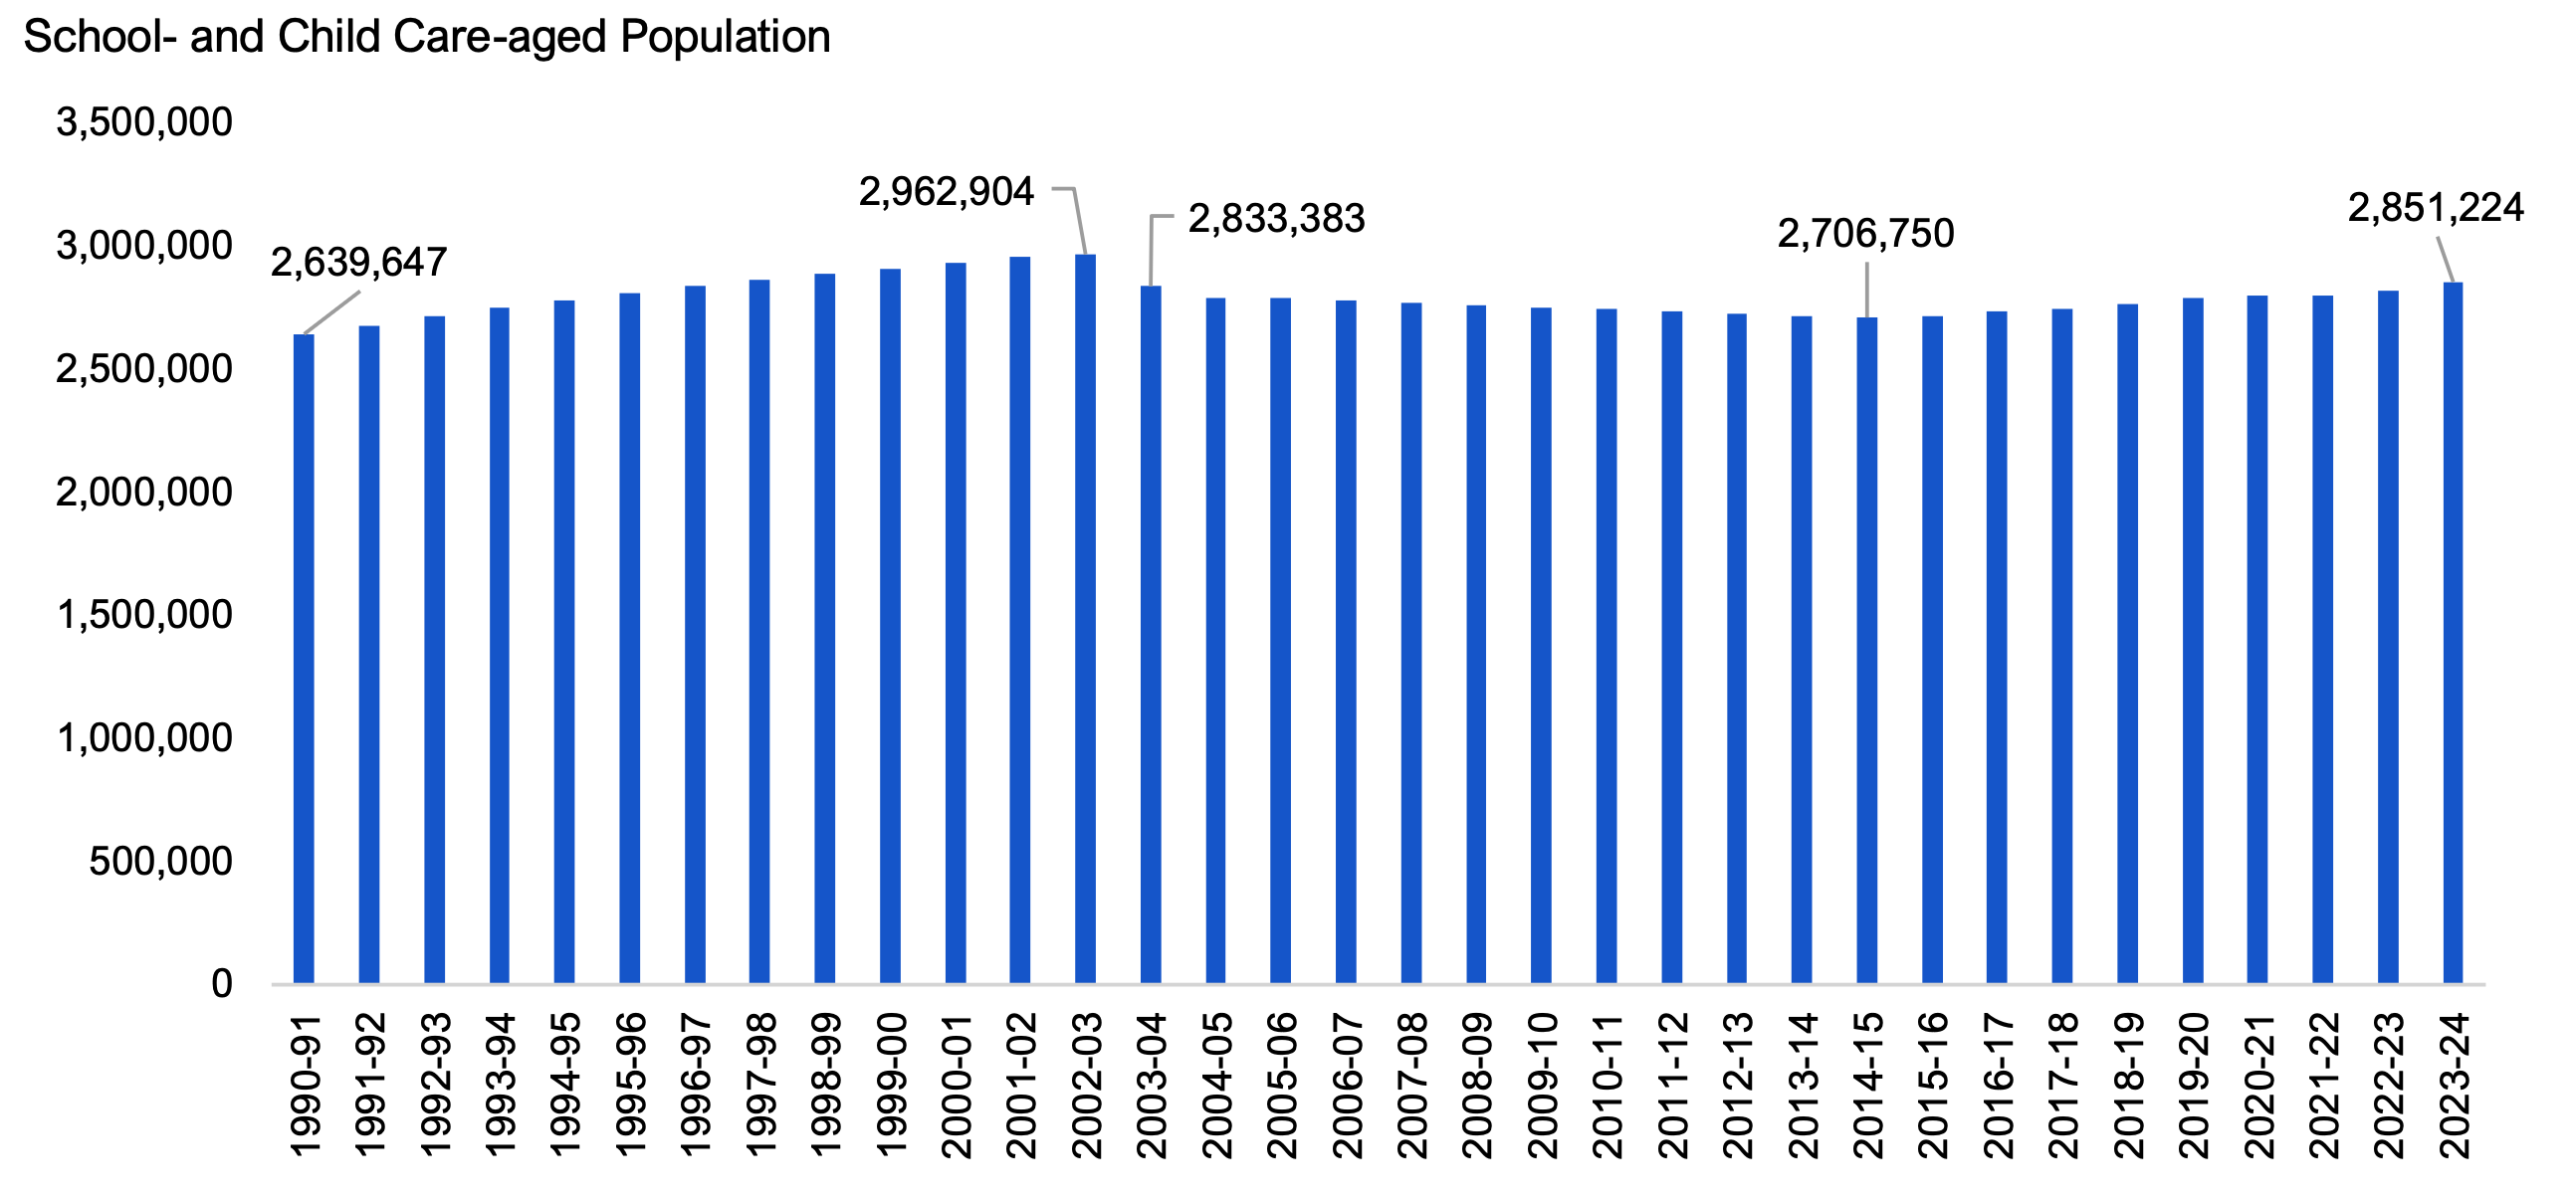
Note: From 1990-91 to 2002-03, the school- and child care-aged population reflects the population of 0- to 18-year-olds. After the phase-out of the Ontario Academic Credit (OAC), beginning in 2003-04, this age group reflects the population of 0- to 17-year-olds.
Source: FAO calculations and Statistics Canad
Accessible version
| Fiscal Year | School- and Child Care-aged Population |
|---|---|
| 1990-91 | 2,639,647 |
| 1991-92 | 2,675,100 |
| 1992-93 | 2,713,996 |
| 1993-94 | 2,744,592 |
| 1994-95 | 2,774,056 |
| 1995-96 | 2,804,623 |
| 1996-97 | 2,836,638 |
| 1997-98 | 2,861,270 |
| 1998-99 | 2,884,655 |
| 1999-00 | 2,902,804 |
| 2000-01 | 2,928,098 |
| 2001-02 | 2,952,643 |
| 2002-03 | 2,962,904 |
| 2003-04 | 2,833,383 |
| 2004-05 | 2,787,464 |
| 2005-06 | 2,783,851 |
| 2006-07 | 2,775,856 |
| 2007-08 | 2,765,017 |
| 2008-09 | 2,755,543 |
| 2009-10 | 2,747,312 |
| 2010-11 | 2,740,447 |
| 2011-12 | 2,730,378 |
| 2012-13 | 2,721,112 |
| 2013-14 | 2,711,624 |
| 2014-15 | 2,706,750 |
| 2015-16 | 2,713,394 |
| 2016-17 | 2,730,169 |
| 2017-18 | 2,741,813 |
| 2018-19 | 2,761,312 |
| 2019-20 | 2,783,925 |
| 2020-21 | 2,797,482 |
| 2021-22 | 2,798,041 |
| 2022-23 | 2,816,663 |
| 2023-24 | 2,851,224 |
Postsecondary Education
For postsecondary education, an important cost driver of spending is student enrolment in colleges and universities. From 1990-91 to 2023-24, the number of students enrolled in postsecondary education grew at an average annual rate of 2.3 per cent from 479,865 students in 1990-91 to 1,018,564 students in 2023-24. Between 1990-91 and 1999-00, student enrolment in postsecondary education declined slowly at an average annual rate of -0.3 per cent. Student enrolment then increased at an average annual rate of 4.6 per cent between 1999-00 to 2010-11, driven primarily by growth in domestic students. Total enrolment has since continued to increase by an average annual rate of 2.2 per cent. The primary driver of this enrolment growth is the number of international students, which grew at an average annual rate of 14.7 per cent between 2010-11 to 2023-24, while domestic student enrolment declined by -0.4 per cent annually over the same period.
Figure B.3 Number of students enrolled in postsecondary education in Ontario by status of student, 1990-91 to 2023-24
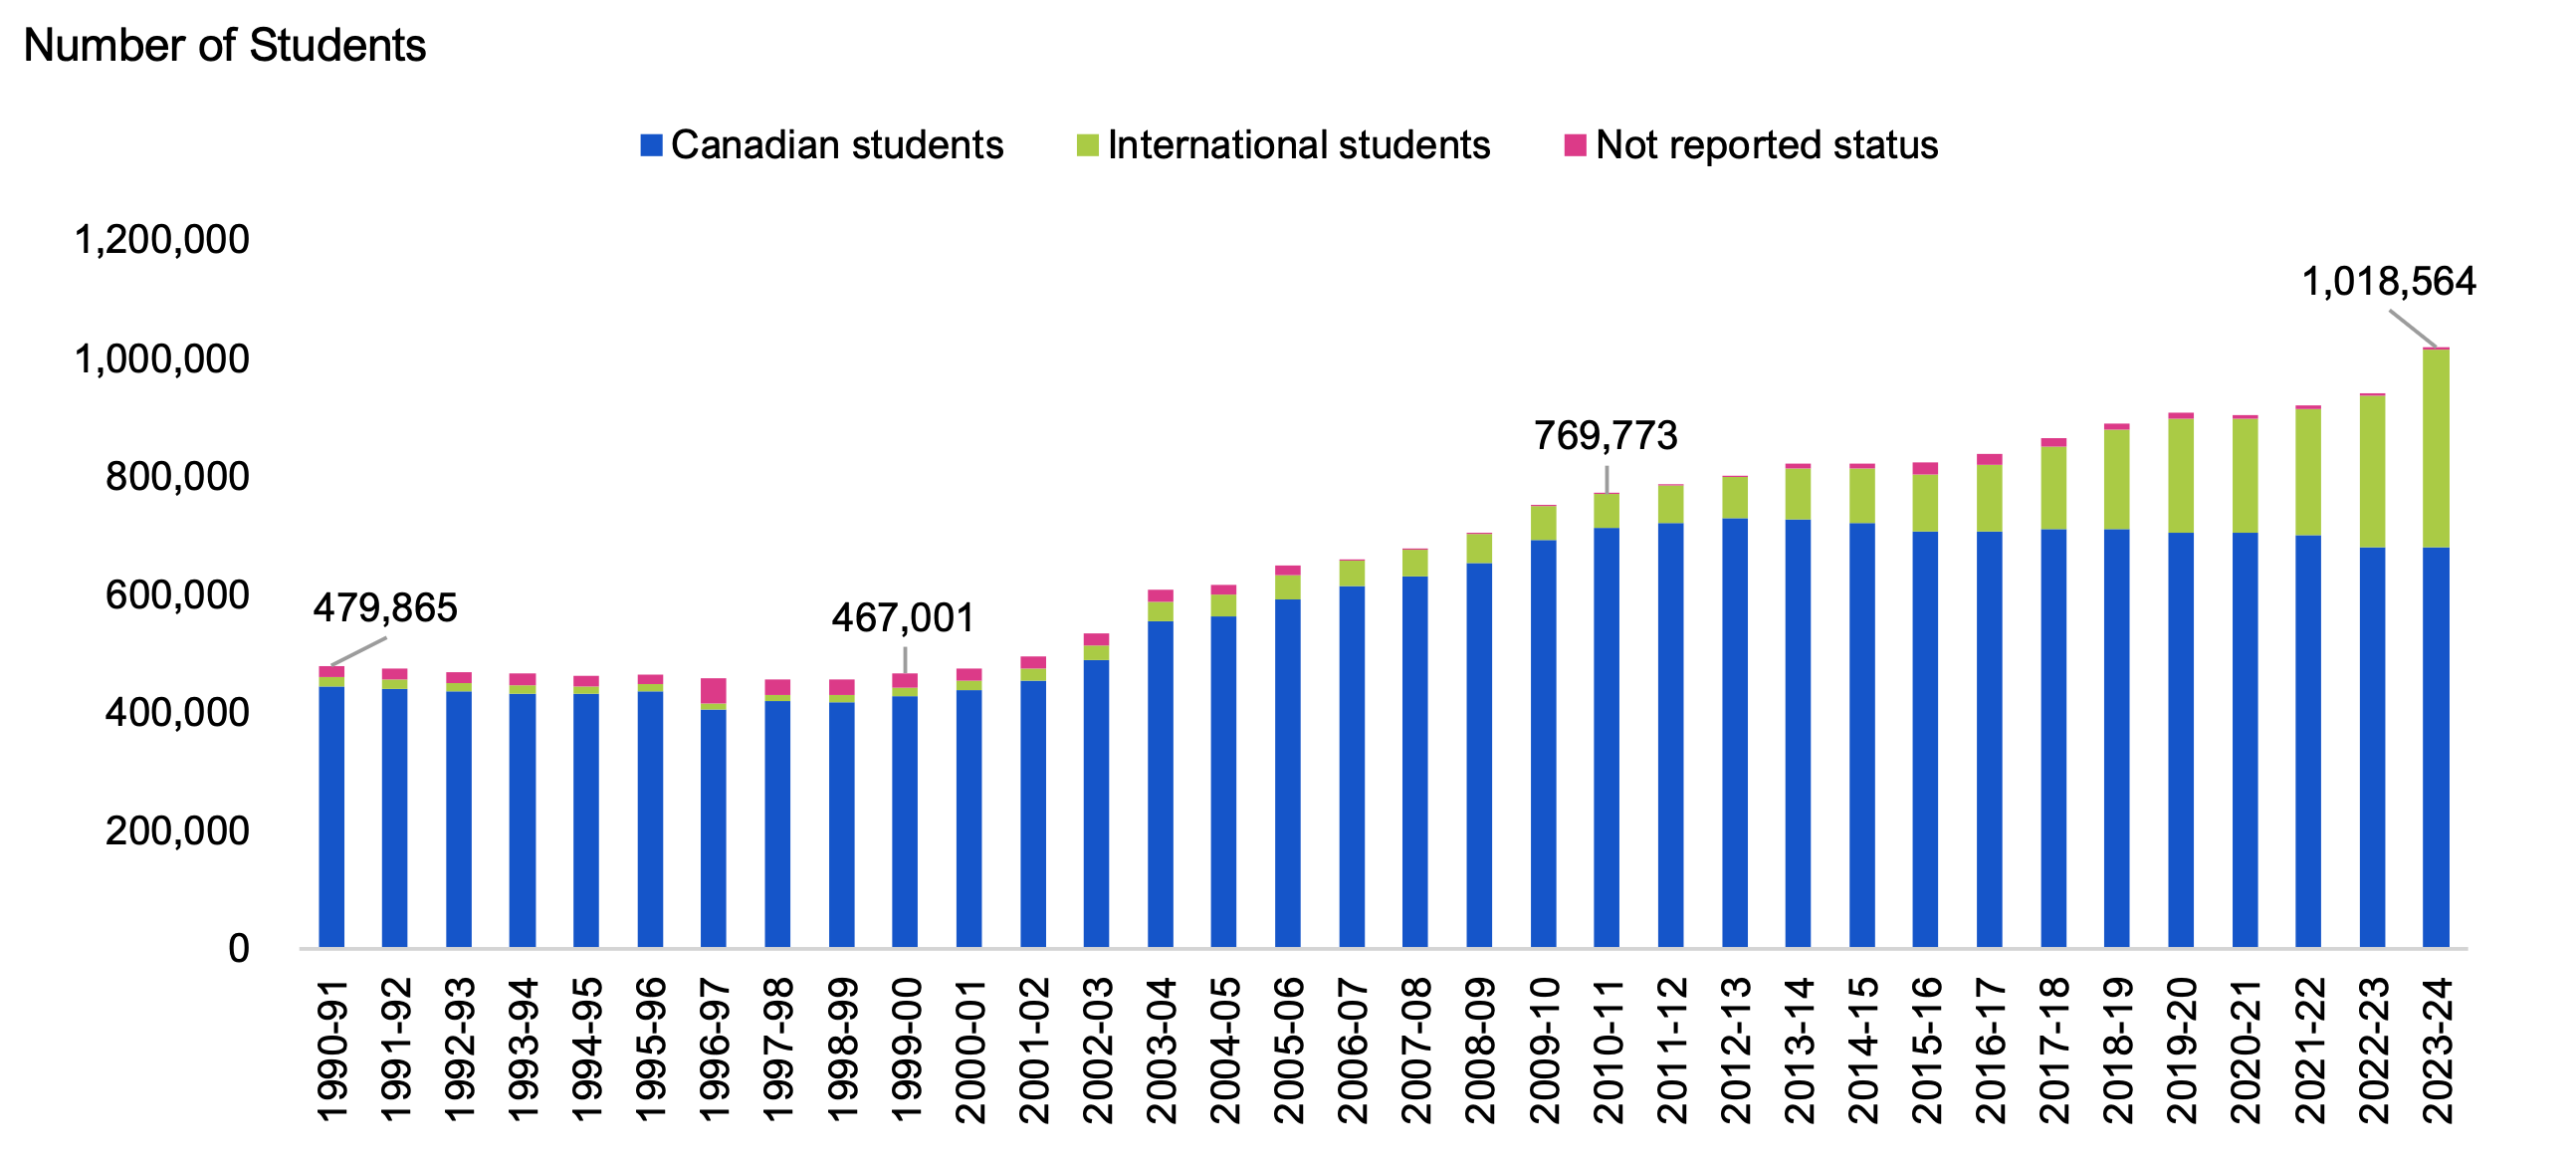
Note: Enrolment numbers for 1990-91, 1991-92 and 2023-24 are FAO estimates.
Source: Statistics Canada. Table 37-10-0018-01 Postsecondary enrolments, by registration status, institution type, status of student in Canada and gender.
Accessible version
| Fiscal Year | Total Enrolment | Canadian Students | International Students | Not Reported Status |
|---|---|---|---|---|
| 1990-91 | 479,865 | 445,025 | 16,168 | 18,672 |
| 1991-92 | 474,121 | 439,482 | 15,967 | 18,672 |
| 1992-93 | 469,305 | 434,835 | 15,798 | 18,672 |
| 1993-94 | 465,609 | 432,129 | 14,502 | 18,978 |
| 1994-95 | 463,170 | 432,132 | 12,792 | 18,246 |
| 1995-96 | 465,453 | 435,621 | 11,529 | 18,303 |
| 1996-97 | 458,871 | 405,810 | 10,389 | 42,672 |
| 1997-98 | 455,856 | 419,424 | 10,458 | 25,974 |
| 1998-99 | 455,526 | 418,206 | 11,625 | 25,695 |
| 1999-00 | 467,001 | 428,400 | 13,956 | 24,645 |
| 2000-01 | 474,600 | 438,285 | 16,932 | 19,383 |
| 2001-02 | 494,943 | 454,503 | 20,688 | 19,752 |
| 2002-03 | 533,442 | 489,408 | 25,365 | 18,669 |
| 2003-04 | 607,560 | 554,358 | 34,161 | 19,041 |
| 2004-05 | 617,271 | 562,641 | 36,606 | 18,024 |
| 2005-06 | 649,839 | 591,855 | 40,974 | 17,010 |
| 2006-07 | 658,896 | 615,396 | 41,742 | 1,758 |
| 2007-08 | 678,114 | 630,042 | 46,257 | 1,815 |
| 2008-09 | 703,557 | 652,866 | 50,655 | 36 |
| 2009-10 | 749,955 | 692,799 | 56,997 | 159 |
| 2010-11 | 769,773 | 713,682 | 56,058 | 33 |
| 2011-12 | 785,175 | 721,128 | 63,714 | 333 |
| 2012-13 | 799,479 | 728,394 | 70,710 | 375 |
| 2013-14 | 821,241 | 727,584 | 85,956 | 7,701 |
| 2014-15 | 822,471 | 721,251 | 92,376 | 8,844 |
| 2015-16 | 822,801 | 706,878 | 96,492 | 19,431 |
| 2016-17 | 838,410 | 706,740 | 113,115 | 18,555 |
| 2017-18 | 864,819 | 711,237 | 140,115 | 13,467 |
| 2018-19 | 889,755 | 711,714 | 166,989 | 11,052 |
| 2019-20 | 907,641 | 705,294 | 192,903 | 9,444 |
| 2020-21 | 903,780 | 704,976 | 191,886 | 6,918 |
| 2021-22 | 920,145 | 700,539 | 213,564 | 6,042 |
| 2022-23 | 940,722 | 679,452 | 256,335 | 4,935 |
| 2023-24 | 1,018,564 | 680,794 | 332,825 | 4,945 |
Appendix C: FAO Adjustments to Historical Spending
The FAO has adjusted historical spending as presented in the Public Accounts of Ontario to improve the comparability of spending figures over time. These adjustments can be broadly placed into three categories: changes to consolidations, other accounting changes and reclassifications of spending across sectors. The FAO adjusted historical spending if the change was considered to be material and if sufficient information was available. The following tables summarize the major adjustments made by the FAO.
Changes to Consolidations
The FAO has retroactively adjusted spending to account for changes to the accounting treatment of consolidated entities. This primarily includes retroactively adjusting spending to incorporate the financial results of consolidated broader public sector entities (hospitals, school boards, colleges and Children’s Aid Societies) on a line-by-line basis.
| Adjustment | Years | Affected Sectors | Description |
|---|---|---|---|
| Adding consolidation spending for Children’s Aid Societies | Before 2022-23 | Children, Community and Social Services | Children’s Aid Societies spending was consolidated beginning in 2022-23. The FAO has added it retroactively for all prior years. |
| Adding consolidation spending for hospitals, school boards and colleges | Before 2005-06 | Health, Education, Postsecondary Education | Hospitals, school boards and colleges spending was consolidated beginning in 2005-06. The FAO has added it retroactively for all prior years. |
| Removing the impact of revenue netting for hospitals, school boards and colleges consolidation spending | From 2005-06 to 2015-16 | Health, Education, Postsecondary Education | Over this period, spending by hospitals, school boards and colleges was reduced by third-party revenue generated by these entities. The FAO has removed this netting and increased spending for all prior years. |
| Adjustments for the Alcohol and Gaming Commission of Ontario (AGCO) | From 1998-99 to 2010-11 | Justice | AGCO spending was consolidated in 2011-12. The FAO has added it retroactively back to the creation of the agency in 1998-99. |
Other Accounting Changes
The following table summarizes other major accounting changes for which the FAO has retroactively adjusted spending.
| Adjustment | Years | Affected Sectors | Description |
|---|---|---|---|
| Adding back valuation allowance for the Ontario Teachers’ Pension Plan (OTPP) and the Ontario Public Service Employees Union Pension Plan (OPSEUPP) | Before 2017-18 | Education, Other Programs | Since 2017-18, OTPP and OPSEUPP expenses included a valuation allowance to remove the pension asset from the Province’s balance sheet. The FAO has added this adjustment retroactively for all prior years. |
| Removing the impact of netting certain tax expenditures from revenue | Before 2012-13 | Postsecondary Education, Children, Community and Social Services, Justice, Other Programs | Since 2012-13, tax expenditures that provide a financial benefit through the tax system, but are not a relief of taxes paid, are expensed. Prior to 2012-13, some of these tax expenditures were netted against revenue. The FAO has added these tax expenditures to expense prior to 2012-13. |
| Removing the impact of revenue netting in Education Property Tax (EPT) spending | Before 2009-10 | Education | Before 2009-10, Education spending was reduced by EPT revenues. The FAO has removed this netting and increased Education spending for all prior years. |
| Removing capital asset spending and adding amortization spending | Before 2002-03 | All sectors | Since 2002-03, investments in Tangible Capital Assets (TCAs) are not expensed but capitalized and then amortized over the useful life of the asset. Before 2002-03, capital asset spending was expensed and there was no amortization. The FAO has removed these expenses and added amortization for all prior years. |
| Subtracting capitalized interest from interest on debt spending | Before 2009-10 | Interest on Debt | Since 2009-10, interest expenses related to borrowing to finance the construction of TCAs have been deducted from interest on debt spending and amortized over the useful life of the asset. The FAO has retroactively accounted for this change for all prior years. |
| Adding back Electricity Sector Interest on Debt spending | From 1999-00 to 2001-02 | Interest on Debt | Over this period, interest on debt expenses for electricity sector debt were netted against revenues. The FAO has removed this netting and increased interest on debt spending. |
| Changes due to the movement from cash to accrual accounting | Before 1993-94 | All sectors | In 1993-94, the Province moved from cash to accrual-based financial reporting of spending. The FAO has estimated spending on an accrual basis for all prior years. |
Reclassification of Spending across Sectors
The FAO has adjusted spending by sector to account for the movement of programs between sectors. These adjustments do not have a net impact on total provincial spending, but only impact the classification of spending by sector and ministry.
| Adjustment | Years | Affected Sectors | Description |
|---|---|---|---|
| Transfer of Child and Youth Mental Health spending from MCCSS to Health | From 2002-03 to 2018-19 | Health and Children, Community and Social Services | Child and Youth Mental Health program expenses were moved to Health from MCCSS in 2019-20. The FAO has retroactively accounted for this transfer since the program’s introduction in 2002-03. |
| Transfer of Child Care program spending from MCCSS to Education | Before 2010-11 | Education and Children, Community and Social Services | Child Care program expenses were transferred from MCCSS to Education in 2010-11. The FAO has retroactively accounted for this transfer for all prior years. |
| Transfer of Employment Ontario program spending from PSE to Other Programs | Before 2020-21 | Postsecondary Education and Other Programs | Employment Ontario program expenses were transferred from PSE to Other Programs in 2020-21. The FAO has accounted for this transfer for all prior years. |
| Transfer of Women’s Issues spending from Other Programs to MCCSS | Before 2019-20 | Children, Community and Social Services and Other Programs | Women’s Issues program expenses were transferred from Other Programs to MCCSS in 2019-20. The FAO has accounted for this transfer for all prior years. |
| Transfer of General Real Estate Portfolio (GREP) spending from Justice to Other Programs | Before 2018-19 | Justice and Other Programs | GREP program expenses were transferred from Justice to Other Programs in 2018-19. The FAO has accounted for this transfer for all prior years. |
| Transfer of BPS interest expense from Health, Education and PSE to Interest on Debt | Before 2016-17 | Health, Education, Postsecondary Education, and Interest on Debt | BPS interest on debt expenses were recorded in interest on debt beginning in 2016-17. The FAO has accounted for this transfer for all prior years. |
Comparing Public Accounts Spending vs. FAO Adjusted Spending
Based on the adjustments discussed above, the following chart compares the FAO’s adjusted total government spending against spending reported in the Public Accounts of Ontario in each year from 1990-91 to 2023-24. On average, FAO adjusted spending is 11 per cent higher than reported in the Public Accounts of Ontario, with the relative gap growing until the start of the spending series in 1990-91. In 1990-91, FAO adjusted spending is 24 per cent higher than spending reported in the 1990-91 Public Accounts of Ontario.
Figure C.1 Total Ontario government spending, FAO adjusted spending vs. Public Accounts of Ontario, 1990-91 to 2023-24
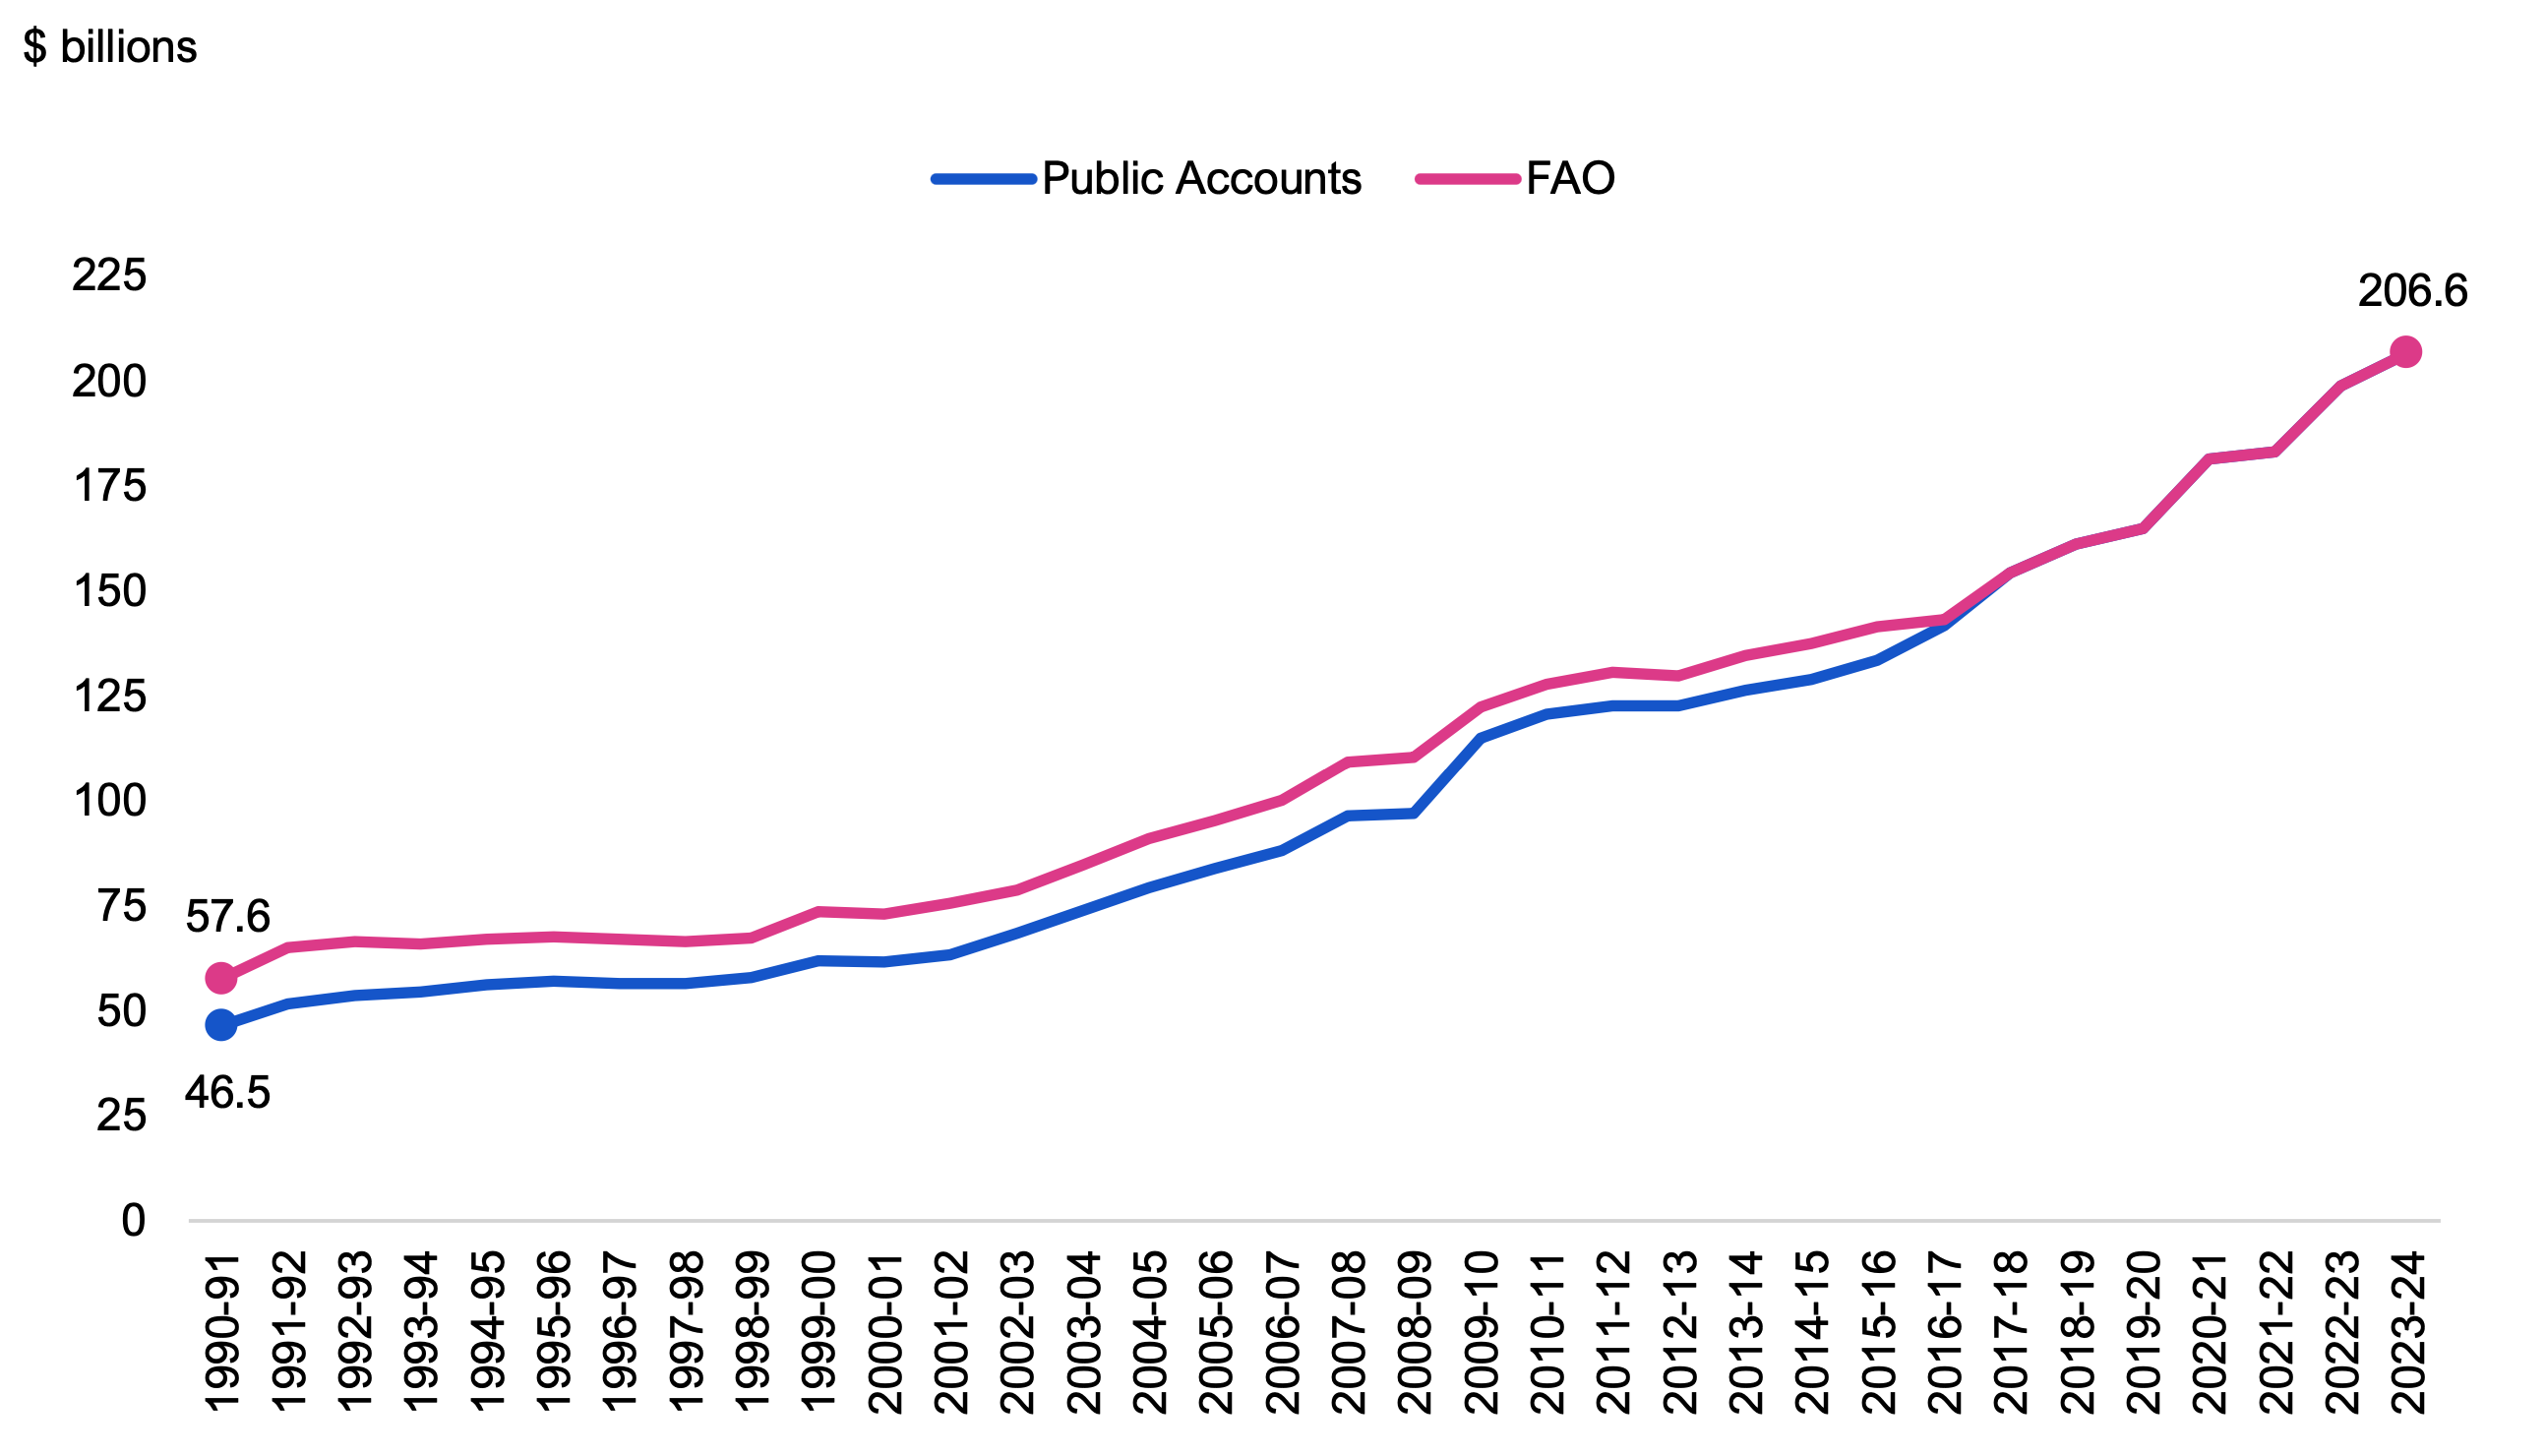
Source: Public Accounts of Ontario, Statistics Canada, and FAO analysis of information provided by the Province.
Accessible version
| Fiscal Year | Public Accounts | FAO |
|---|---|---|
| 1990-91 | 46.5 | 57.6 |
| 1991-92 | 51.7 | 65.0 |
| 1992-93 | 53.7 | 66.4 |
| 1993-94 | 54.5 | 65.8 |
| 1994-95 | 56.2 | 67.0 |
| 1995-96 | 57.1 | 67.7 |
| 1996-97 | 56.4 | 67.0 |
| 1997-98 | 56.5 | 66.5 |
| 1998-99 | 57.8 | 67.3 |
| 1999-00 | 61.9 | 73.6 |
| 2000-01 | 61.6 | 73.2 |
| 2001-02 | 63.4 | 75.5 |
| 2002-03 | 68.5 | 78.6 |
| 2003-04 | 73.9 | 84.8 |
| 2004-05 | 79.4 | 90.9 |
| 2005-06 | 83.9 | 95.2 |
| 2006-07 | 88.1 | 100.0 |
| 2007-08 | 96.5 | 109.2 |
| 2008-09 | 96.9 | 110.3 |
| 2009-10 | 115.1 | 122.5 |
| 2010-11 | 120.7 | 127.7 |
| 2011-12 | 122.7 | 130.8 |
| 2012-13 | 122.6 | 129.8 |
| 2013-14 | 126.4 | 134.5 |
| 2014-15 | 128.9 | 137.4 |
| 2015-16 | 133.4 | 141.5 |
| 2016-17 | 141.7 | 143.2 |
| 2017-18 | 154.3 | 154.4 |
| 2018-19 | 161.1 | 161.1 |
| 2019-20 | 164.8 | 164.8 |
| 2020-21 | 181.3 | 181.3 |
| 2021-22 | 183.0 | 183.1 |
| 2022-23 | 198.8 | 198.7 |
| 2023-24 | 206.6 | 206.6 |
Footnotes
[1] For more analysis on health sector programs and spending, see FAO, “Ontario Health Sector: Spending Plan Review,” 2023 and FAO “Ontario Health Sector: 2023 Budget Spending Plan Review,” 2023.
[2] See Appendix B for more details on trends in health sector cost drivers.
[3] For more information, see Goldblatt Partners LLP, Year 1 Arbitration Brief of the Ontario Medical Association, 2024.
[4] The pan-Canadian Pharmaceutical Alliance (originally the pan-Canadian Pricing Alliance) is made up of all 13 provincial and territorial jurisdictions and federal drug plans, which negotiate together to lower drug prices.
[5] For more analysis, see FAO, “Ontario Health Sector: 2019 Updated Assessment of Ontario Health Spending,” 2019.
[6] In total there were 49,391 beds in 1990-91 and 34,891 beds in 2023-24.
[7] This downsizing occurred across Canada and was due to a reduction in extended care beds, as well as a shift in focus from providing inpatient services to outpatient services. For more information, see Downsizing Canada’s hospitals, 1986-87 to 1994-95.
[8] Canadian Institute for Health Information. Hospitalization and Childbirth, 1995–1996 to 2022–2023 — Supplementary Statistics. Ottawa, ON: CIHI, 2024.
[9] Over 80 per cent of LTC residents are over the age of 75.
[10] For more analysis on education sector programs, see FAO, “Ministry of Education: Spending Plan Review,” 2022, FAO; “Ontario School Boards: Enrolment, Finances and Student Outcomes,” 2023; and FAO, “Ontario School Boards: Facility Condition, Student Capacity and Capital Budgeting,” 2024.
[11] Trends in the school- and child care-aged population are discussed in Appendix B.
[12] For more analysis on the Canada-wide Early Learning and Child Care Agreement, see FAO, “Ministry of Education: Spending Plan Review,” 2022.
[13] The student-to-teacher ratio reflects teacher FTEs for the 2010-11 to 2023-24 school years. For 2001-02 to 2009-10, the student-to-teacher ratio is an FAO estimate based on Statistics Canada salaried education workers data.
[14] Trends in student enrolment in colleges and universities are discussed in Appendix B.
[15] Includes grants through the Ontario Student Assistance Program (OSAP), but excludes loans provided through OSAP.
[16] For more analysis on children, community and social services sector programs, see FAO, “Ministry of Children, Community and Social Services: Spending Plan Review,” 2024.
[17] Prior to 2009-10, municipalities funded 20 per cent of the cost of OW and ODSP. The municipal portion of ODSP was gradually uploaded to the Province between 2009-10 and 2010-11, and the municipal portion of OW was gradually uploaded between 2009-10 and 2017-18.
[18] ODSP and OW allowance rates were frozen in 2018. The freeze in ODSP allowance rates ended in September 2022. See Select Service Levels for more information.
[19] The Province increased average annual ODSP and OW allowances by three per cent in the 2004 Budget, and by two per cent in the 2006 Budget, 2007 Budget, 2008 Budget and 2009 Budget.
[20] The Province increased average ODSP and OW allowances by one per cent in the 2011 Budget, 2013 Budget, 2014 Budget and 2015 Budget. The Province increased ODSP and OW allowances by 1.5 per cent in the 2016 Budget, and two per cent in the 2017 Budget.
[21] Auditor General of Ontario, Value-for-Money Audit, Ontario Provincial Police, December 2021.
[22] In 1991-92, there were 8,996 beds in provincial correctional facilities, which declined to 7,559 beds in 2022-23 before increasing to 8,227 in 2023-24.
[23] The incarcerated population also exceeded the number of beds in correctional facilities in 1996-97 and 2008-09.
[24] Province of Ontario Annual Report 1996-1997, pg. 14.
[25] Includes the amortization of capital assets and transfer payments to non-consolidated entities (i.e., municipalities) for capital-related costs, such as for housing, roads or water infrastructure.
[26] Includes consolidated operating spending for Metrolinx and the Ontario Northland Transportation Commission, spending for the Owen Sound Transportation Company, the Ontario Gas Tax program and time-limited supports.
[27] Government of Canada, Federal transfers to provinces and territories, 2024.
[28] For more analysis on the effect of this agreement on federal transfers to Ontario, see FAO, “Ontario Health Sector: 2023 Budget Spending Plan Review,” 2024.
[29] Excludes transfer payments that are paid to consolidated entities, which includes broader public sector (BPS) organizations (hospitals, school boards, colleges and Children’s Aid Societies), Metrolinx, and other provincially controlled agencies. Transfer payments provided to these consolidated entities are recorded in the standard account based on the ultimate nature of the expense. For example, on a consolidated basis, of the transfer payment that is provided to hospitals, the amount spent by hospitals on salaries and wages is categorized under the salaries and wages standard account.
[30] Comparable data earlier than 2016-17 are not available.
[31] From 1990-91 to 2002-03, the school- and child care-aged population reflects the population of 0- to 18-year-olds. After the phase-out of the Ontario Academic Credit (OAC), beginning in 2003-04, this age group reflects the population of 0- to 17-year-olds.