


Summary
This report examines Ontario’s trade relationship with the United States and estimates the potential impacts of US tariffs on Ontario’s exports, imports, GDP, employment and inflation.
The United States is Ontario’s most important trading partner
- The US accounts for most of Ontario’s international trade, with 77 per cent of Ontario’s total goods exports and 60 per cent of the province’s total services exports. Imports of goods from the US accounted for 68 per cent of Ontario’s total goods imports, while services imports from the US were 63 per cent of total services imports.
- Ontario’s exports to the US accounted for 13 per cent of the province’s Gross Domestic Product (GDP) in recent years, more than double the contribution of Ontario’s exports to the rest of the world.
- In 2024, an estimated 933,000 Ontario jobs were US export–related, about one in every nine jobs in the province. This was comprised of 536,000 jobs in the goods sector (one in every 15 jobs in Ontario), mostly concentrated in the manufacturing industry, and 397,000 jobs in the services sector (one in every 20 jobs in Ontario), including in professional services, trade and transportation, and all other services.
- Ontario’s manufacturing sector is the most reliant on exports to the US, with 40 per cent of its production shipped to the US. By comparison, Ontario’s trade and transportation sector exports eight per cent of its output to the US, the primary sector exports seven per cent, followed by professional services (four per cent).
- Over the 2013 to 2024 period, Ontario recorded trade deficits with the US in each year (except for 2016), averaging a trade deficit of $8 billion. In 2024, Ontario’s trade deficit with the US was an estimated $4 billion.
The FAO’s tariff scenario
- This report analyzes the impact of a tariff scenario based on trade actions announced by the US and Canada as of April 17, 2025. This includes US tariffs on steel, aluminum, automobiles and automobile parts, and Canadian retaliatory tariffs.
- Overall, under the FAO’s tariff scenario, US tariffs apply to 20 per cent of Ontario’s international exports, while the Canadian government’s retaliatory tariffs apply to 15 per cent of Ontario’s international imports.
US tariffs will slow Ontario’s economic growth, lower employment and raise consumer prices
- As US tariffs reduce demand for Ontario’s exports, the province’s economic growth will slow. In 2025, Ontario’s real GDP growth would slow to 0.6 per cent, less than half the 1.7 per cent growth expected in the absence of US tariffs. This implies that a modest recession would occur in 2025. For 2026, real GDP growth would be 1.2 per cent, compared to 1.9 per cent growth in the no tariff outlook.
- On a level basis, Ontario’s real GDP is projected to be 1.8 per cent lower than the no tariff outlook by 2026 and 2.0 per cent lower by 2029, led by heavy declines in Ontario’s steel, aluminum, auto and auto parts industries.
- In 2026, the first full year of tariffs, Ontario’s manufacturing sector would be the most impacted with real GDP reduced by 8.0 per cent. All other sectors, including services, would also be impacted through supply chain effects, as well as through broader economic impacts from lower incomes, profits, consumption and investment.
- The FAO estimates that US tariffs would result in 68,100 fewer jobs in Ontario in 2025 and 119,200 fewer jobs in 2026 compared to the no tariff scenario. By 2029, there would be 137,900 fewer jobs in Ontario.
- US tariffs are projected to raise Ontario’s unemployment rate by 1.1 percentage points over the 2025 to 2029 outlook, averaging 7.7 per cent.
- By sector, manufacturing employment is expected to be the most affected by the tariffs, with 57,700 (-6.8 per cent) fewer jobs in 2026. The manufacturing sector’s supply chain industries would also be impacted, particularly the more labour-intensive services industries, including trade and transport, and professional services.
- US tariffs on Ontario exports would negatively affect all Census Metropolitan Areas (CMAs) in the province. Windsor is expected to be impacted the most, with employment 1.6 per cent lower in 2026, followed by Guelph (-1.6 per cent lower), Brantford (-1.5 per cent lower), Kitchener-Cambridge-Waterloo (-1.5 per cent lower) and London (-1.3 per cent lower). These CMAs are more exposed to export-focused manufacturing than other Ontario CMAs.
- Under the FAO’s tariff scenario, Ontario’s Consumer Price Index (CPI) inflation rate is projected to be 0.2 percentage points higher in 2025 and 0.3 percentage points higher in 2026. Ontario’s import prices would increase due to Canada’s tariff retaliation, higher US inflation (primarily caused by US tariffs on imports from China) and a slightly weaker Canadian dollar. This would be partially offset by the impact of weaker economic activity in Ontario and lower oil prices.
Uncertainty and range of potential economic impacts
- The actual impact of tariffs on Ontario’s economy is uncertain and will depend on the magnitude, breadth and duration of tariff coverage, as well as how businesses, households and economies respond. Given this uncertainty, the FAO has developed two additional scenarios, a “low impact” and a “high impact” scenario, to account for potential changes in US and Canadian tariff policies, as well as the potential range of economic impacts to Ontario.
- The low impact scenario assumes that existing US and Canadian retaliatory tariffs are reduced from 25 per cent to 10 per cent, trade volumes are more resilient to tariffs, and the US and global economies perform better than expected.
- Under the low impact scenario, Ontario’s real GDP growth is 1.3 per cent in 2025 and 1.6 per cent in 2026, which implies that Ontario would not enter a recession. In addition, job losses and CPI inflation would be lower than under the FAO tariff scenario.
- The high impact scenario assumes that the US introduces additional tariffs on copper, lumber, semiconductors and pharmaceuticals and increases tariffs on steel, aluminum and automobiles. As well, the Canadian government introduces additional retaliatory tariffs on US imports, trade volumes respond more strongly to tariffs, and the US and global economies suffer weaker growth and higher prices from a protracted trade war.
- Under the high impact scenario, Ontario’s real GDP declines by 0.5 per cent in 2025 and grows by 0.6 per cent in 2026, which implies a deeper recession in Ontario than expected in the FAO tariff scenario. In addition, job losses and CPI inflation would be higher than projected under the FAO tariff scenario.
Introduction
This report examines Ontario’s trade relationship with the United States and estimates the potential impacts of US tariffs on Ontario’s exports, imports, GDP, employment and inflation.
Report Structure
This report begins with an overview of international trade in Ontario and discusses the importance of exports to the US for the Ontario economy. Next, based on trade actions announced as of April 17, the report estimates the impact of US tariffs and Canada’s retaliatory tariffs on Ontario’s economy. The report concludes with a brief discussion of key uncertainties and provides a range of potential impacts.
Scope
The report estimates the impact of US tariffs on Ontario’s economic output, employment and inflation over the 2025 to 2029 period. The estimated impacts reflect a scenario based on US tariff policy and Canada’s retaliatory tariffs as of April 17, 2025.
The potential impact of tariffs on the Government of Ontario’s (the Province’s) budget and finances, including the impact of any new policies introduced in response to US tariffs, is beyond the scope of this report.
Methodology
The FAO estimates changes in export and import volumes in response to tariffs based on previous academic studies. The impact on Ontario’s economy is estimated using the FAO’s macroeconomic model, with industry and job detail supplemented by the FAO’s input-output model. The tariff impacts shown in this report are expressed as a difference from a no tariff scenario unless otherwise noted. See the Appendix for more information.
The estimated impacts on the Ontario economy are subject to significant uncertainty due to the magnitude and breadth of tariffs imposed by the US and the global retaliatory response. To account for this uncertainty, the final section provides a range of potential impacts under different assumptions about tariff coverage and rates, and how economies respond.
Ontario’s Trade with the United States
The United States is Ontario’s most important trading partner
Ontario’s international trade is heavily dependent on access to the US market, due to its size, proximity to the province, and the history of successive trade agreements between Canada and the US since the 1960s.[1]
In 2024, Ontario exported $397 billion in goods and services to international markets and imported $436 billion. Goods are the largest component of Ontario’s international trade, which amounted to $287 billion in exports and $349 billion in imports in 2024. Services exports totalled $111 billion, while services imports totalled $87 billion.
Figure 1 The US accounts for most of Ontario’s international trade
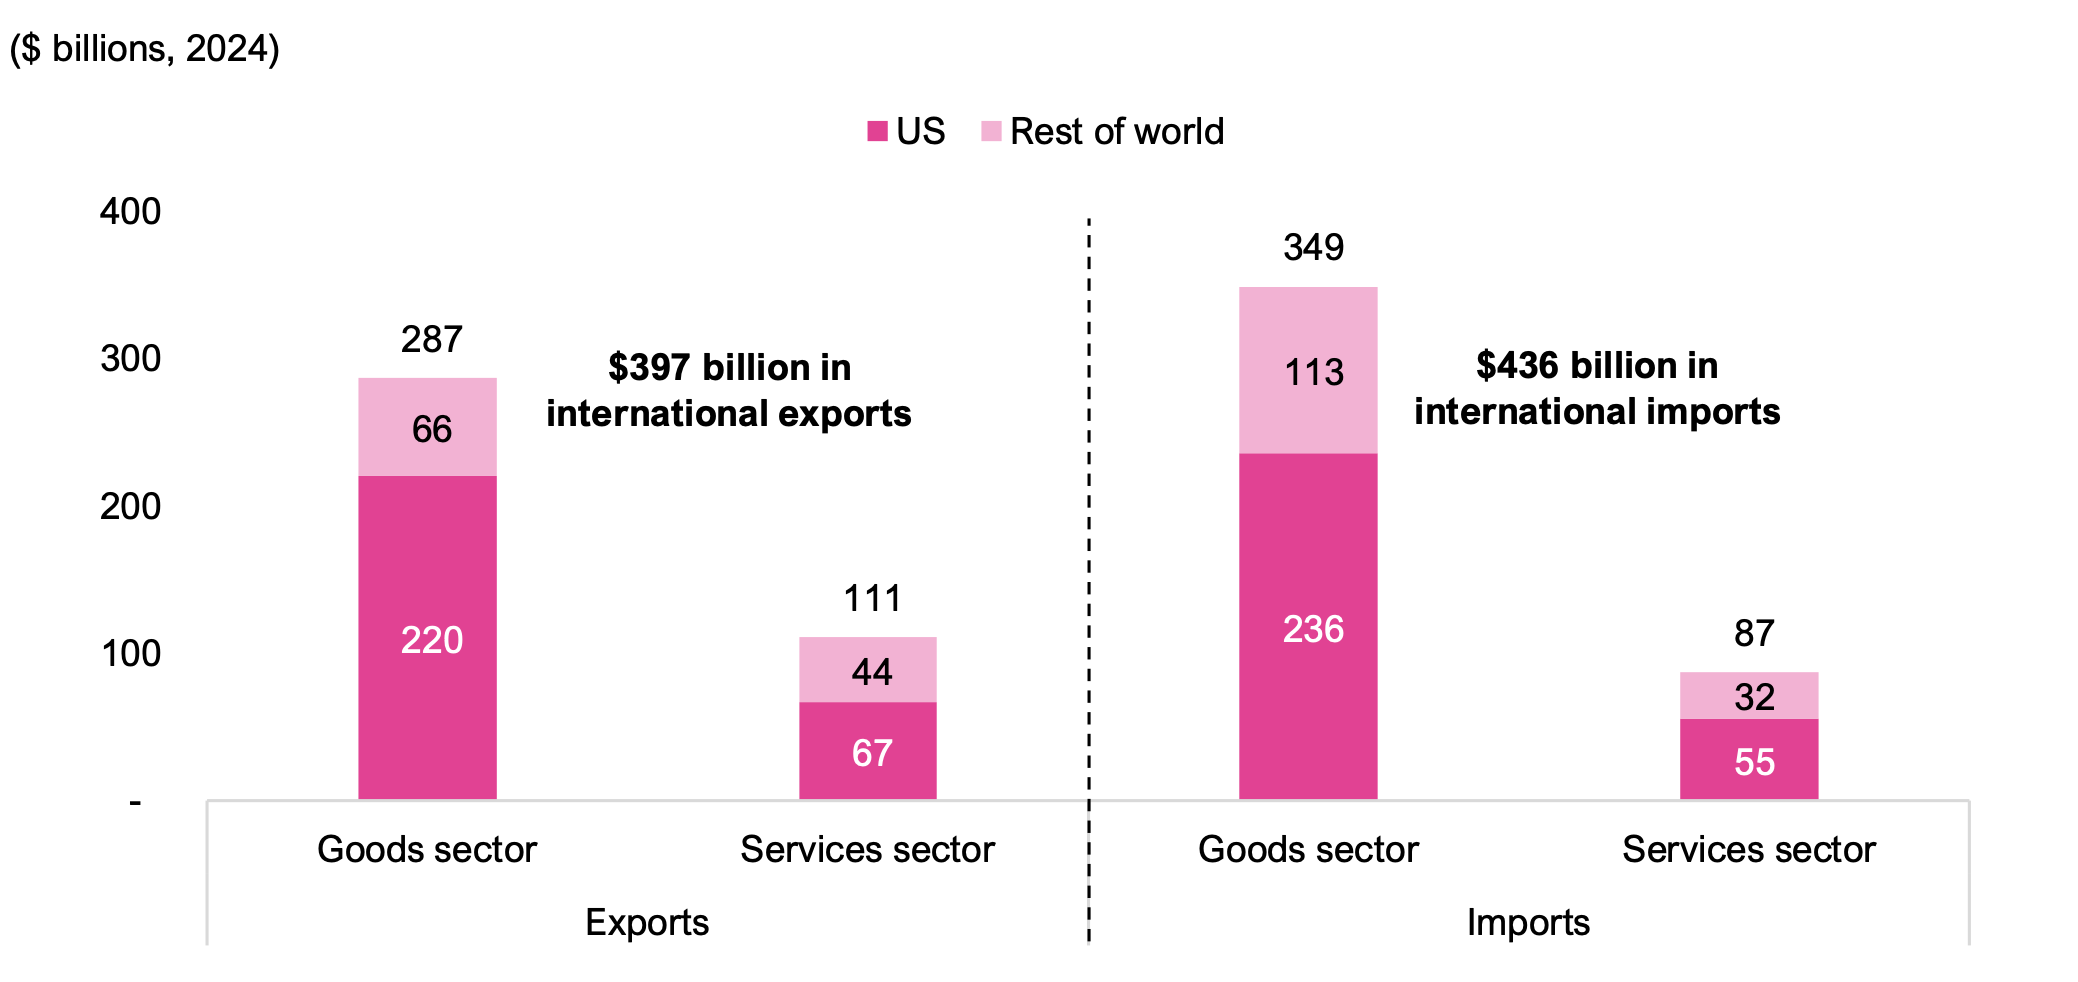
Note: Numbers may not add due to rounding.
Source: Statistics Canada Tables: 36-10-0222-01, 12-10-0100-01, Ontario Economic Accounts and FAO estimate
Accessible version
| Exports | Imports | |||
|---|---|---|---|---|
| Goods sector | Services sector | Goods sector | Services sector | |
| US | 220 | 67 | 236 | 55 |
| Rest of world | 66 | 44 | 113 | 32 |
| Total | 287 | 111 | 349 | 87 |
| $397 billion in international exports | $436 billion in international imports | |||
The US accounts for most of Ontario’s international trade. Goods exports to the US totalled $220 billion in 2024 (77 per cent of Ontario’s total goods exports), while services exports to the US totalled $67 billion (60 per cent of Ontario’s total services exports). Goods imports from the US totalled $236 billion (68 per cent of Ontario’s total goods imports), while services imports totalled $55 billion (63 per cent of total services imports).
Trade with the US is an important contributor to Ontario’s economic output and employment
Over the 2013 to 2021 period,[2] exports destined for the US accounted for 13 per cent of Ontario’s Gross Domestic Product (GDP).[3] This was more than double the contribution of exports to the rest of the world at six per cent of Ontario’s GDP. Goods exports to the US accounted for eight per cent of Ontario’s GDP, while services exports to the US accounted for five per cent.
Figure 2 Exports to the US account for 13 per cent of Ontario’s GDP
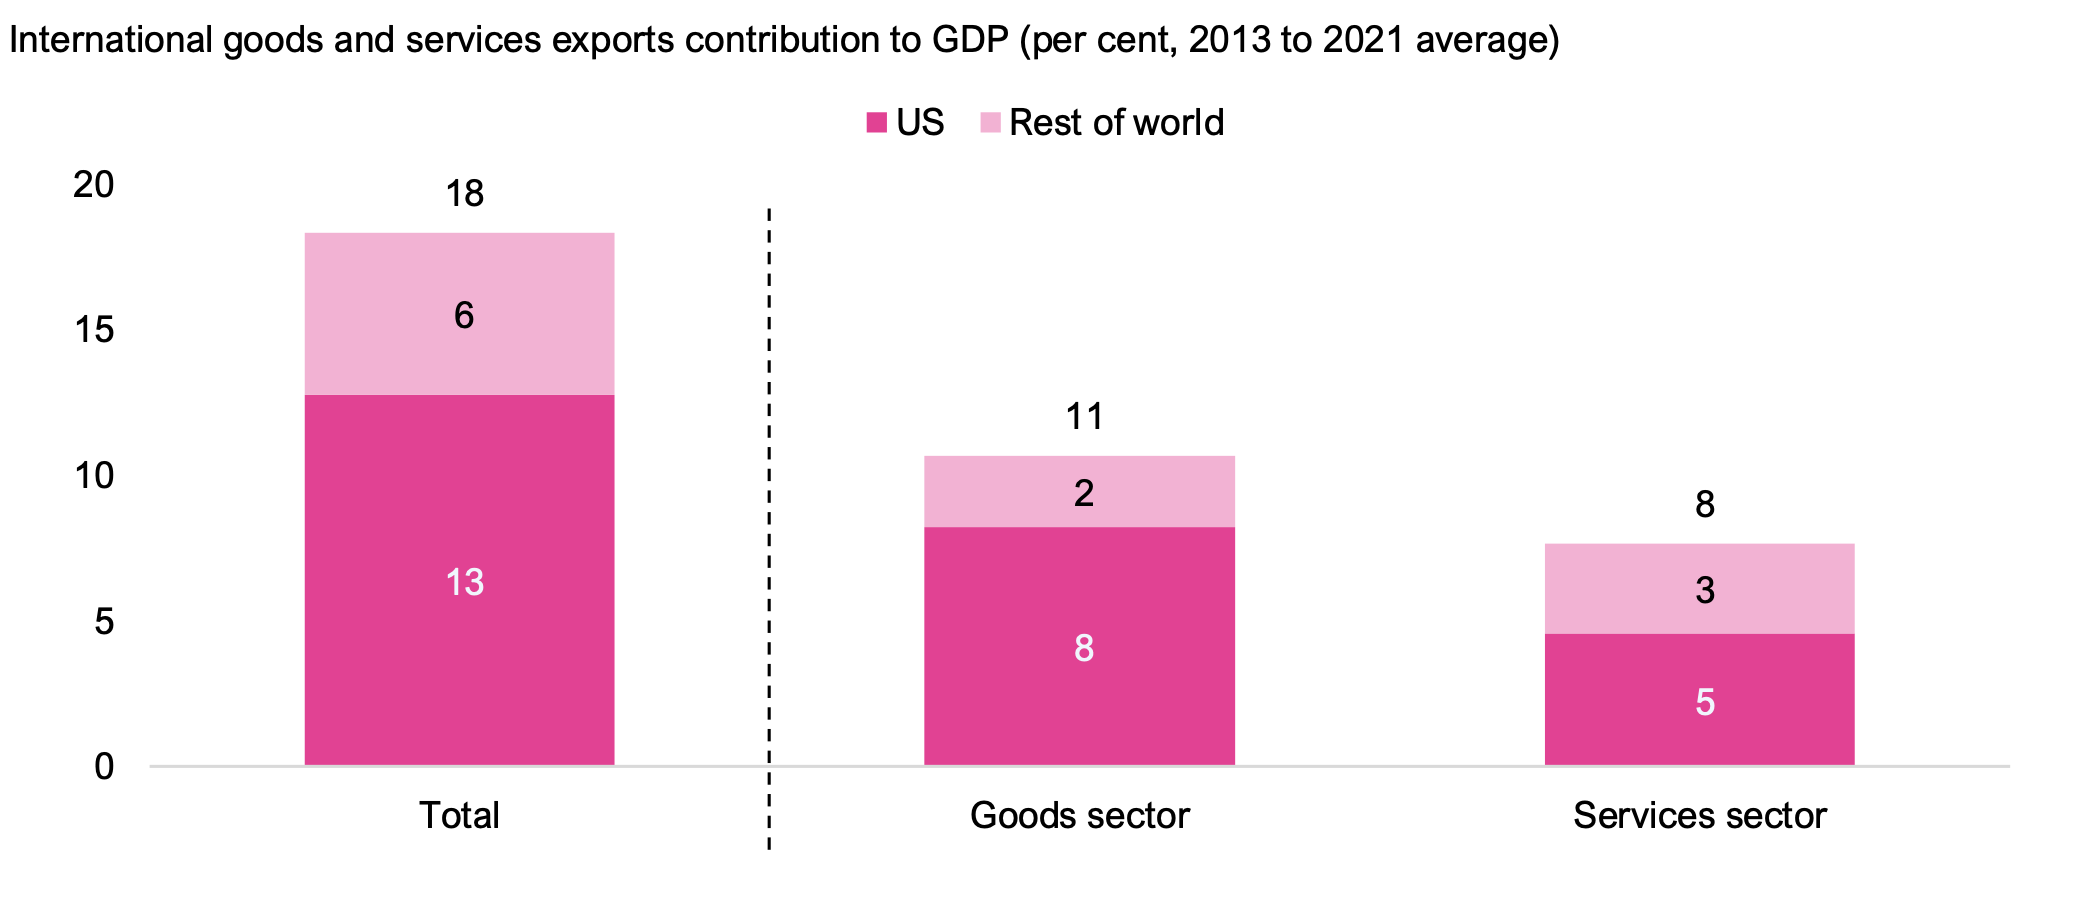
Note: Numbers may not add due to rounding.
Source: Statistics Canada Table 12-10-0100-01 and FAO
Accessible version
| Total | Goods sector | Services sector | |
|---|---|---|---|
| US | 13 | 8 | 5 |
| Rest of world | 6 | 2 | 3 |
| Total | 18 | 11 | 8 |
Total international exports accounted for an estimated 1,370,000 jobs in Ontario in 2024, of which exports to the US accounted for an estimated 933,000 jobs[4] (one out of every nine jobs in the province). Of the Ontario jobs related to US exports, 536,000 jobs were in the goods sector (one in every 15 jobs in Ontario), mostly concentrated in the manufacturing industry. The services sector had 397,000 Ontarians employed in US export–related jobs (one in every 20 jobs in Ontario), including in professional services, trade and transportation, and all other services.[5]
Exports to the rest of the world accounted for an estimated 437,000 jobs in Ontario in 2024, including 148,000 goods sector jobs and 288,000 services sector jobs.
Figure 3 Exports to the US employed 933,000 people in Ontario in 2024
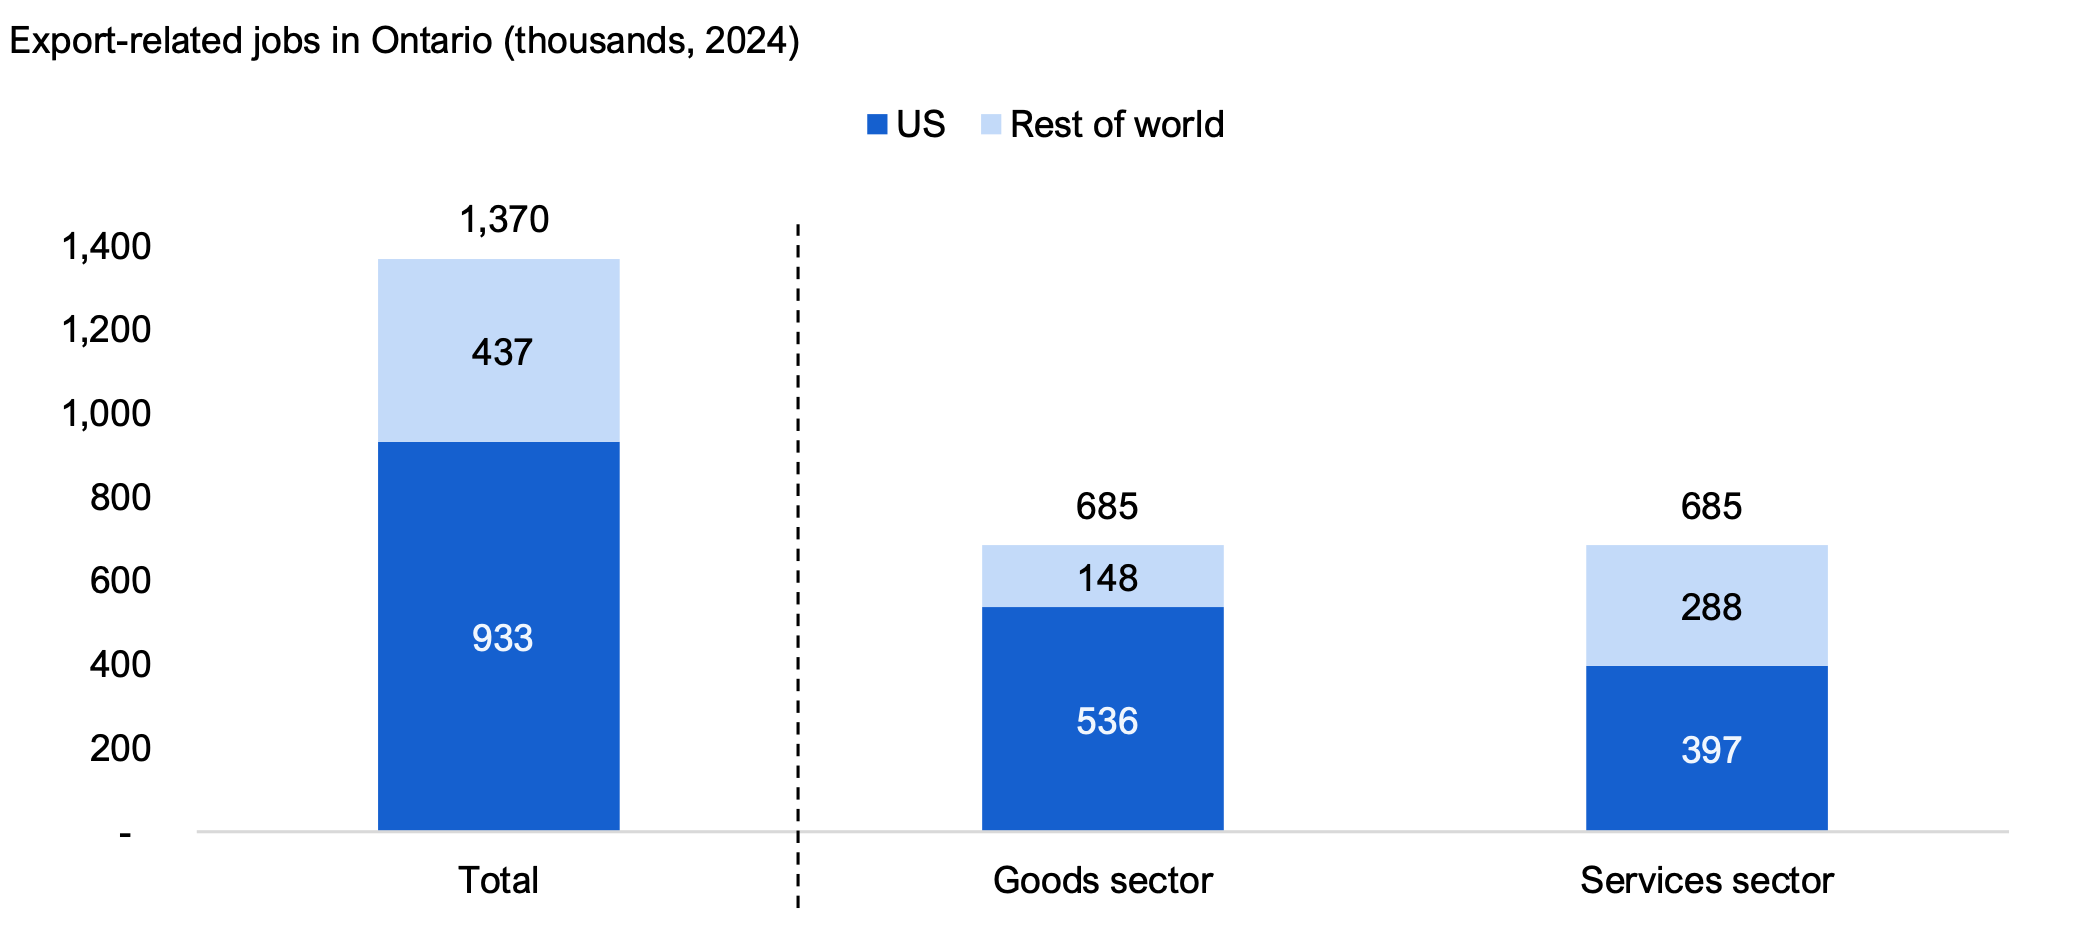
Note: Numbers may not add due to rounding.
Source: Statistics Canada Tables: 14-10-0023-01, 12-10-0100-01 and FAO estimate
Accessible version
| Total | Goods sector | Services sector | |
|---|---|---|---|
| US | 933 | 536 | 397 |
| Rest of world | 437 | 148 | 288 |
| Total | 1,370 | 685 | 685 |
Ontario manufacturers rely heavily on exports to the US
Trade exposure to the US can be measured as the share of a sector’s total output or “production”[6] that is exported to the US. On this basis, all sectors[7] of Ontario’s economy are exposed to US trade to some extent, but the manufacturing sector is the most exposed, with 40 per cent of its production exported to the US. By comparison, Ontario’s trade and transportation sector exports eight per cent of its output to the US, the primary sector exports seven per cent to the US, followed by professional services (four per cent) and all other services (three per cent).
Figure 4 Ontario’s manufacturing sector is the most reliant on exports to the US
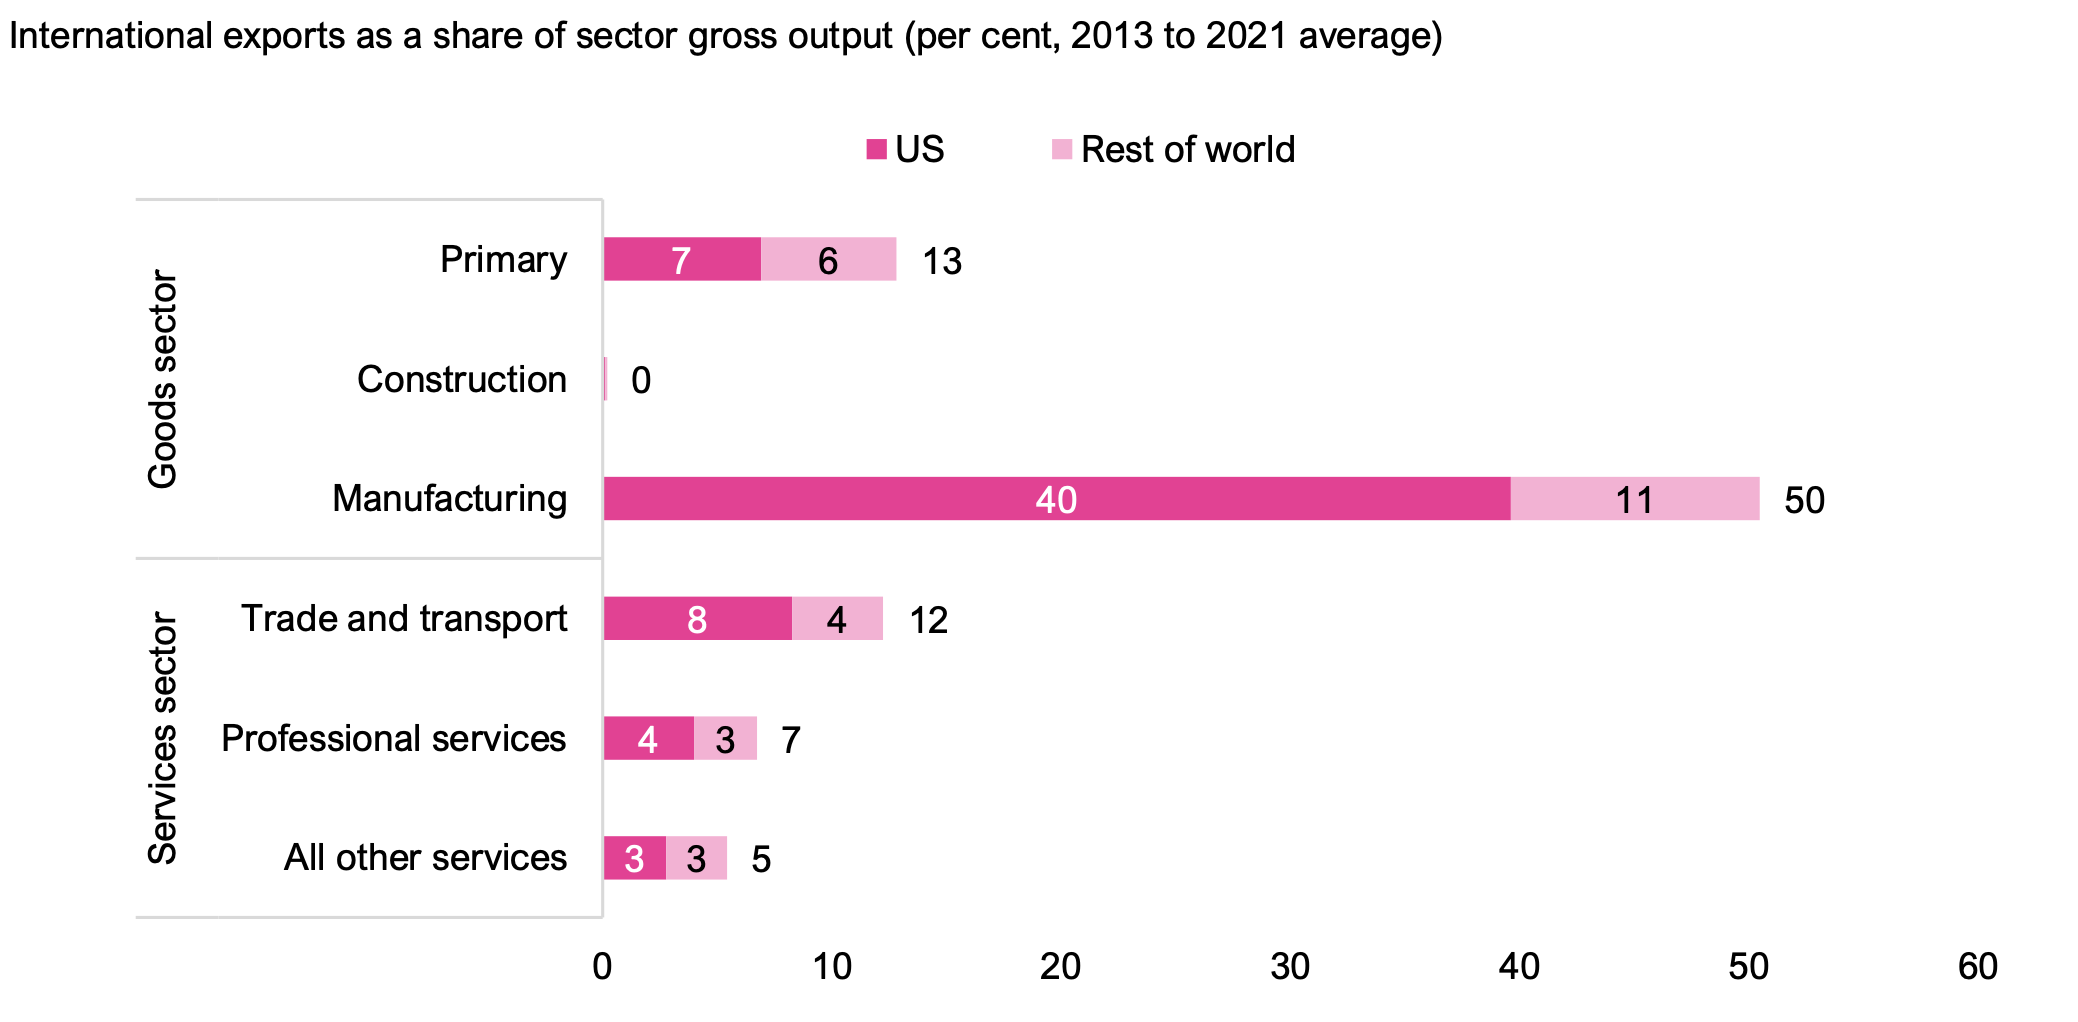
Source: Statistics Canada Tables: 12-10-010001, 36-10-0488-01 and FAO.
Accessible version
| US | Rest of world | Total | ||
|---|---|---|---|---|
| Goods sector | Primary | 7 | 6 | 13 |
| Construction | 0 | 0 | 0 | |
| Manufacturing | 40 | 11 | 50 | |
| Services sector | Trade and transport | 8 | 4 | 12 |
| Professional services | 4 | 3 | 7 | |
| All other services | 3 | 3 | 5 |
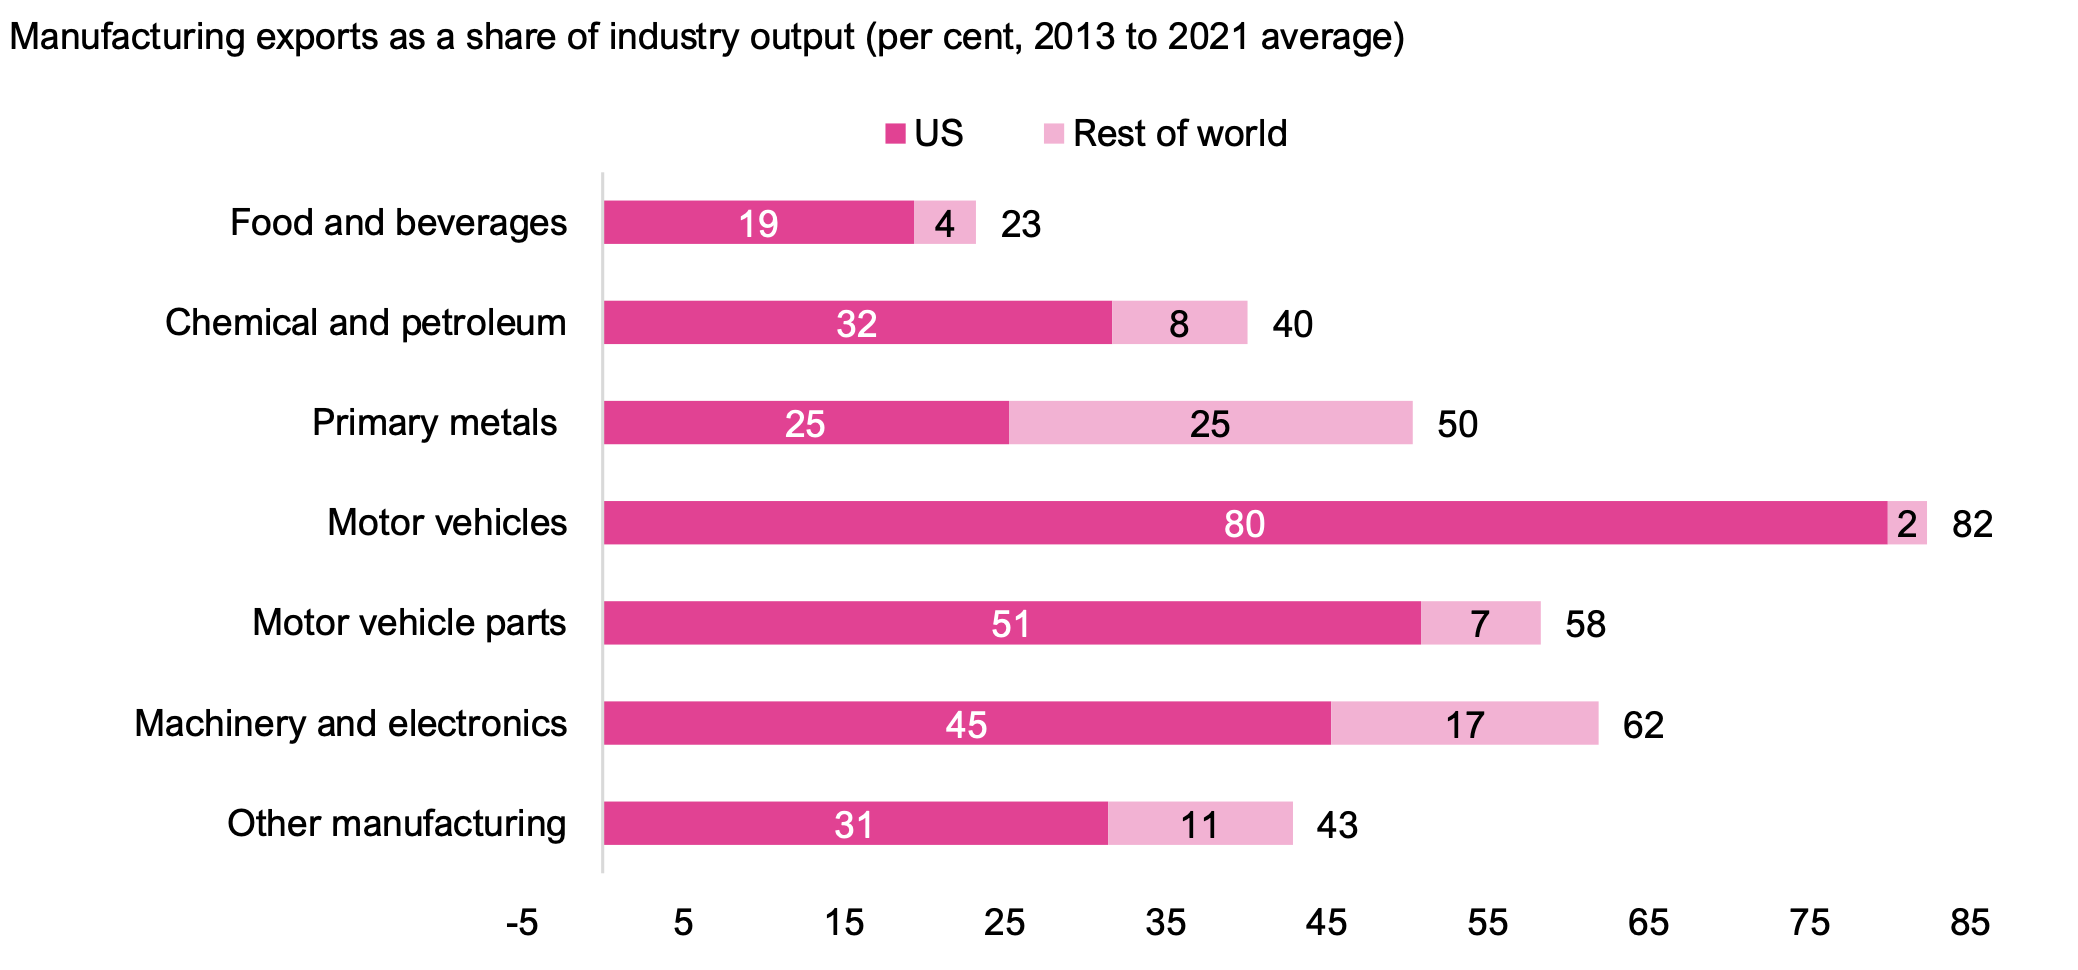
Within Ontario’s manufacturing sector, all major industries export a significant portion of their production to the US. The motor vehicle industry is the most integrated with the US, shipping 80 per cent of its output to the US, followed by motor vehicle parts (51 per cent), machinery and electronics (45 per cent), chemical and petroleum (32 per cent), other manufacturing[8] (31 per cent), primary metals (25 per cent) and food and beverage (19 per cent). All manufacturing industries export a greater share of their output to the US than to the rest of the world, except for the primary metals industry (including steel and aluminum manufacturers), which exports about the same proportion of its output to the US as to the rest of the world.
Figure 5 Ontario’s motor vehicle sector exports most of its production to the US
Source: Statistics Canada Tables: 12-10-0100-01, 36-10-0488-01 and FAO.
Accessible version
| US | Rest of world | Total | |
|---|---|---|---|
| Food and beverages | 19 | 4 | 23 |
| Chemical and petroleum | 32 | 8 | 40 |
| Primary metals | 25 | 25 | 50 |
| Motor vehicles | 80 | 2 | 82 |
| Motor vehicle parts | 51 | 7 | 58 |
| Machinery and electronics | 45 | 17 | 62 |
| Other manufacturing | 31 | 11 | 43 |
Ontario mostly has trade deficits with the US
Over the 2013 to 2024 period, Ontario has recorded trade deficits with the US in each year (except for 2016), averaging a trade deficit of $8 billion. In 2024, Ontario’s trade deficit with the US was an estimated $4 billion, as the province’s deficit in goods trade (-$15 billion) outweighed its surplus in services ($11 billion).
Figure 6 Ontario has mostly recorded trade deficits with the US since 2013
* 2022 to 2024 trade balances are estimated based on the average share of US trade in goods and services.
Source: Statistics Canada Table 12-10-0100-01, Ontario Economic Accounts and FAO Estimate
Accessible version
| Goods sector | Services sector | Total | |
|---|---|---|---|
| 2013 | -4 | 3 | -2 |
| 2014 | -13 | 4 | -8 |
| 2015 | -7 | 6 | 0 |
| 2016 | -5 | 9 | 4 |
| 2017 | -18 | 8 | -10 |
| 2018 | -21 | 9 | -12 |
| 2019 | -21 | 12 | -10 |
| 2020 | -21 | 10 | -10 |
| 2021 | -29 | 16 | -13 |
| 2022* | -31 | 8 | -23 |
| 2023* | -12 | 10 | -2 |
| 2024* | -15 | 11 | -4 |
The Potential Impact of US Tariffs on Ontario’s Economy
Starting in February 2025, the US has announced numerous tariffs on goods it imports from abroad, with many subsequent changes on the extent and timing of the tariffs. Given Ontario’s strong trade relationship with the US, these tariffs will have a significant negative impact on the province’s economy. This impact will depend on the magnitude and coverage of the US tariffs, as well as Canada’s retaliatory response.
This report analyzes the impact of a tariff scenario based on trade actions announced as of April 17, with additional assumptions by the FAO, although there is significant uncertainty about the status of US tariff policy.[9] All US tariffs and Canada’s retaliatory actions are assumed to be permanent in the FAO’s tariff scenario. In addition, the FAO’s tariff scenario excludes any announced federal or provincial measures to support sectors and workers impacted by tariffs.
The FAO’s tariff scenario
The FAO’s tariff scenario[10] includes the following US tariffs:
- For exports to the US compliant[11] with the Canada-United States-Mexico Agreement (CUSMA):
- 25 per cent tariffs on steel and aluminum.
- 25 per cent tariffs on automobiles and automobile parts, with an exclusion for the value of US content.[12] The FAO assumes that tariffs on auto parts come into effect on May 3.
- No tariffs on all other CUSMA-compliant goods.
- For non-CUSMA-compliant exports to the US:
- 25 per cent tariffs on all goods, except energy and critical minerals that are tariffed at 10 per cent.
- 50 per cent tariffs on steel and aluminum.
- 50 per cent tariffs on automobiles and automobile parts, beginning on May 3.
In response to these tariffs, the Canadian government introduced the following countermeasures,[13] which are included in the FAO’s tariff scenario:
- 25 per cent tariffs on $30 billion in imports from the US, including agricultural products, metals, consumer goods and food and beverages.
- 25 per cent tariffs on $29.8 billion in imports from the US, including steel and aluminum products, tools, computers and servers.
- 25 per cent tariffs on automobile imports, applied to the full value of non-CUSMA-compliant vehicles and to the value of non-Canadian and non-Mexican content[14] of CUSMA-compliant vehicles.
Overall, under the FAO’s tariff scenario, US tariffs will apply to 20 per cent of Ontario’s international exports, while the Canadian government’s retaliatory tariffs will apply to 15 per cent of Ontario’s international imports.
Figure 7 20 per cent of Ontario’s international exports are facing US tariffs, while retaliation affects 15 per cent of Ontario’s international imports
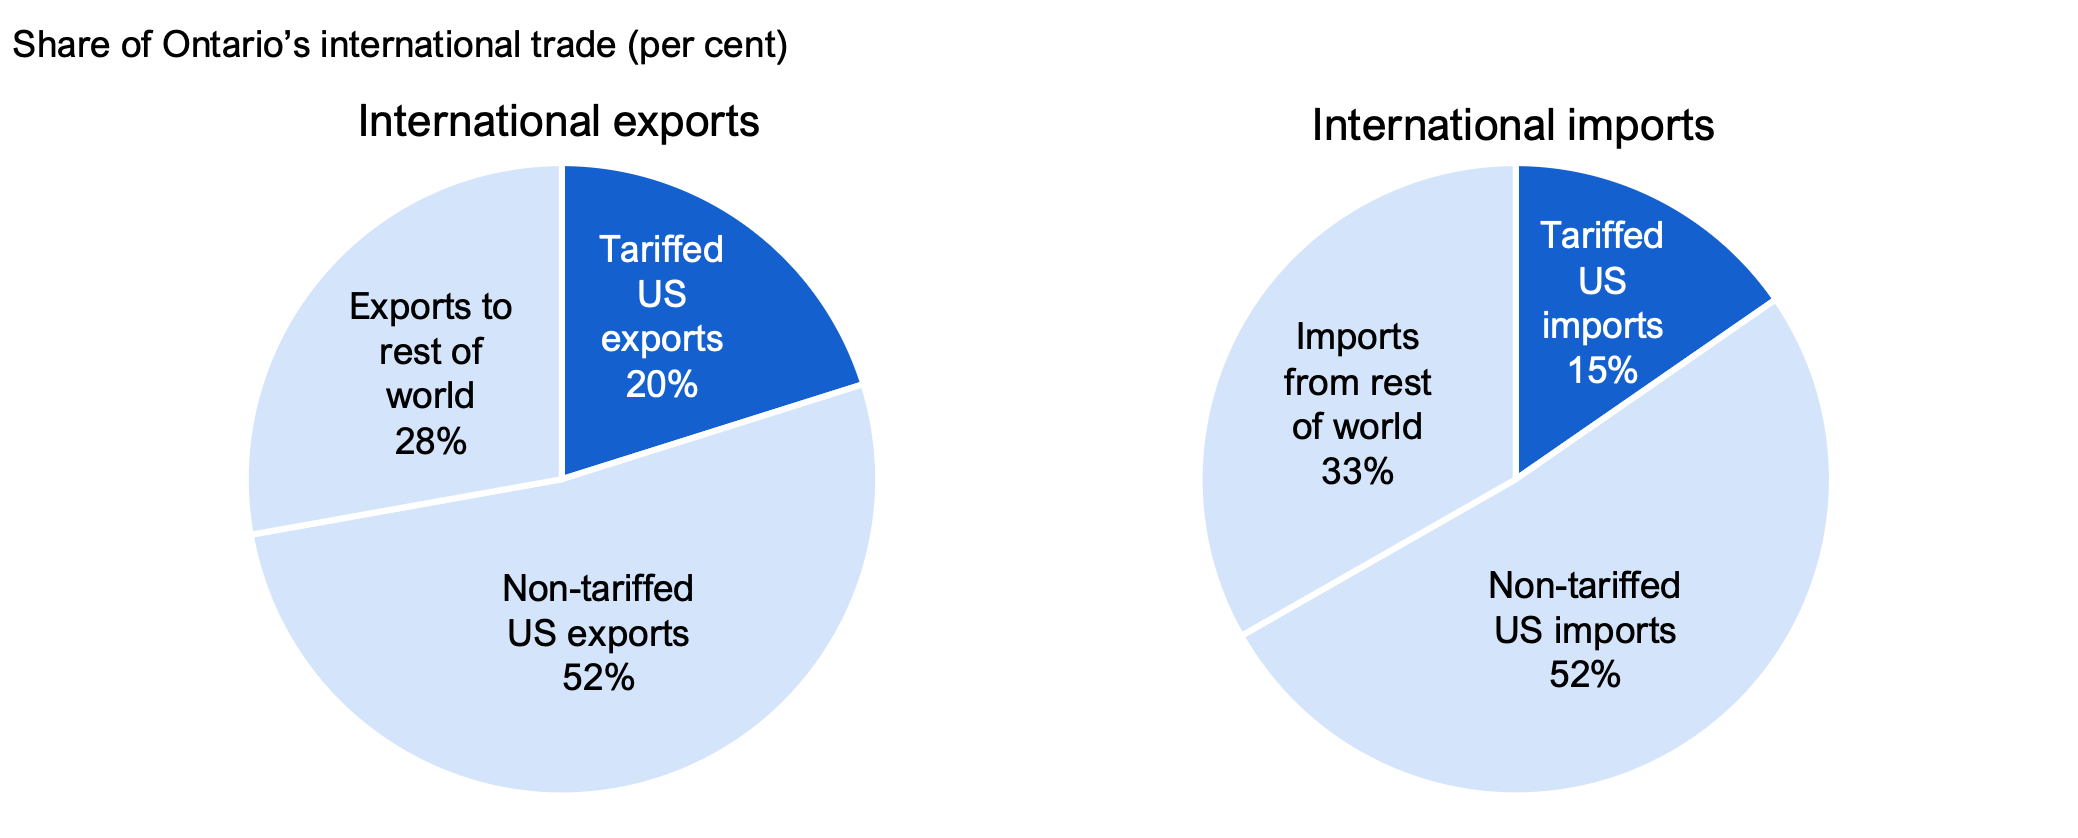
Note: Tariffed US exports and imports only include new tariffs identified in the FAO’s tariff scenario. Shares are estimated based on 2024 real international trade data.
Source: FAO
Accessible version
| International exports | |
|---|---|
| Tariffed US exports | 20% |
| Non-tariffed US exports | 52% |
| Exports to rest of world | 28% |
| International imports | |
|---|---|
| Tariffed US imports | 15% |
| Non-tariffed US imports | 52% |
| Imports to rest of world | 33% |
Finally, under the FAO’s tariff scenario, the FAO has made a number of economic and methodological assumptions, which are discussed in the Appendix.
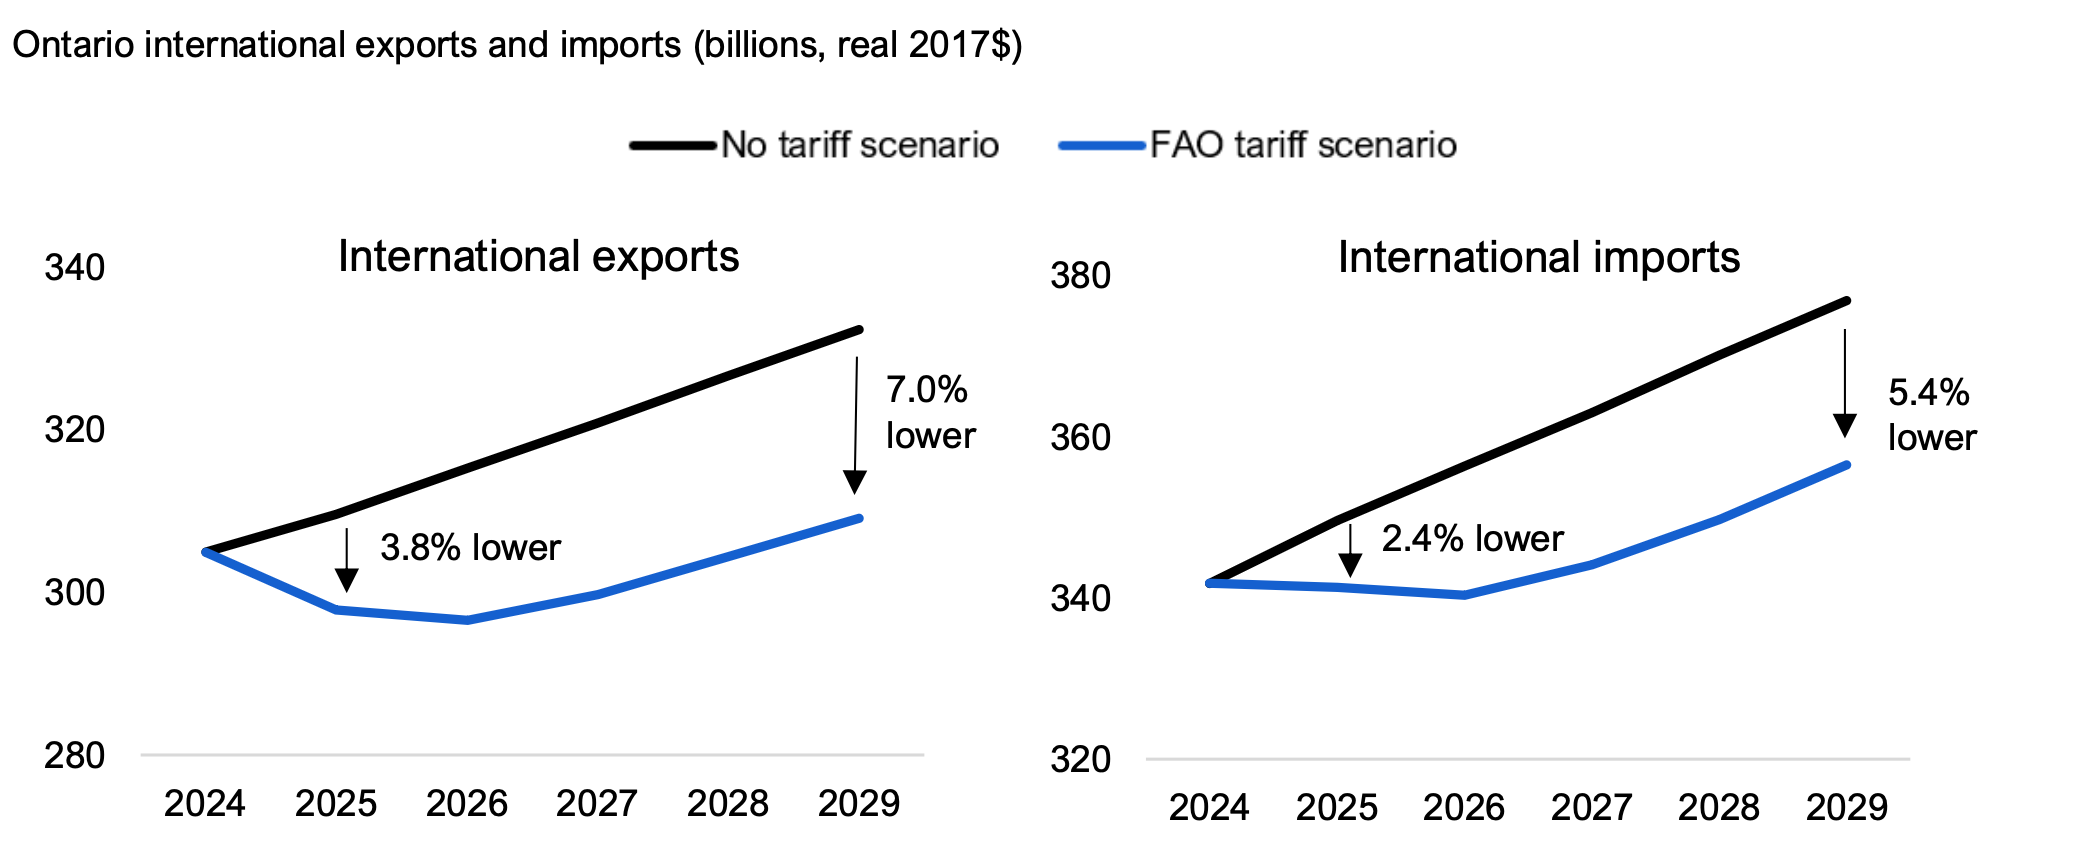
US tariffs will reduce Ontario’s international exports and imports
Under the FAO’s tariff scenario, US tariffs will reduce demand for Ontario’s exports.[15] Consequently, the FAO projects a 3.8 per cent decline in real international exports relative to a no tariff scenario in 2025. Over the following four years, the effects of US tariffs would grow, and by 2029 Ontario’s real international exports would be 7.0 per cent lower than in the no tariff scenario. By sector, Ontario’s international exports that are targeted by specific US tariffs are expected to be significantly lower, with exports of steel and aluminum almost 50 per cent lower in 2029, auto exports almost 20 per cent lower and auto parts almost 30 per cent lower.[16]
Figure 8 Ontario export and import volumes would be lower under US tariffs
Source: Ontario Economic Accounts and FAO
Accessible version
| International exports | No tariff scenario | FAO tariff scenario | |
|---|---|---|---|
| 2024 | 305.0 | 305.0 | |
| 2025 | 309.6 | 297.8 | 3.8% lower |
| 2026 | 315.3 | 296.6 | |
| 2027 | 320.9 | 299.8 | |
| 2028 | 326.7 | 304.4 | |
| 2029 | 332.3 | 309.1 | 7.0% lower |
| International imports | No tariff scenario | FAO tariff scenario | |
|---|---|---|---|
| 2024 | 341.8 | 341.8 | |
| 2025 | 349.7 | 341.3 | 2.4% lower |
| 2026 | 356.4 | 340.4 | |
| 2027 | 363.1 | 344.1 | |
| 2028 | 370.1 | 349.8 | |
| 2029 | 377.0 | 356.5 | 5.4% lower |
Retaliatory tariffs imposed by Canada would cause a reduction in imports from the US, resulting in a decline in Ontario’s real international imports of 2.4 per cent relative to the no tariff scenario in 2025. By 2029, Ontario’s international imports are projected to be 5.4 per cent lower compared to the no tariff scenario.
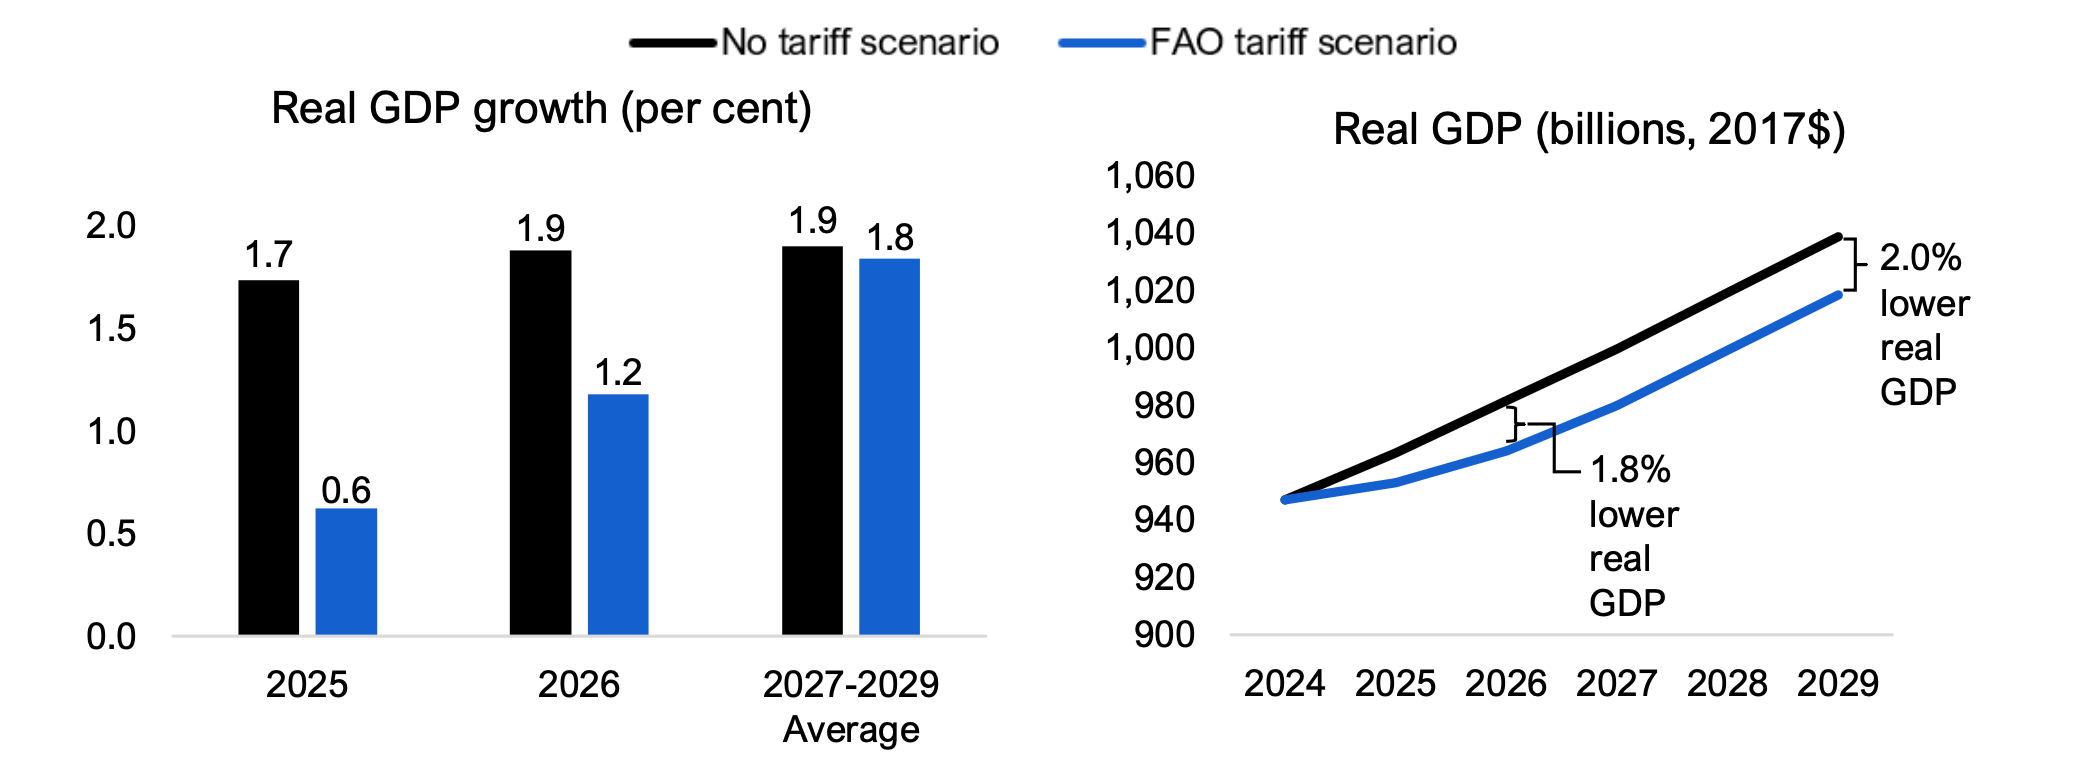
US tariffs will slow Ontario’s economic growth
As US tariffs reduce demand for Ontario’s exports, the province’s economic growth will slow. In 2025, Ontario’s real GDP growth would be 0.6 per cent, less than half the 1.7 per cent growth in the no tariff scenario. This implies that a modest recession would occur in 2025. For 2026, real GDP growth is projected to be 1.2 per cent, compared to the 1.9 per cent growth in the no tariff outlook. Over time, Ontario’s economy is expected to adjust to the impact of US tariffs and real GDP growth would improve to an average of 1.8 per cent over the 2027 to 2029 period, modestly slower than the no tariff scenario of 1.9 per cent.
Overall, under the FAO’s tariff scenario, the level of Ontario’s real GDP is projected to be 1.8 per cent lower than the no tariff scenario by 2026 and 2.0 per cent lower by 2029, as the heavy declines in Ontario’s steel, aluminum, auto and auto parts sectors are only partially offset by modest trade gains in other sectors.
Figure 9 Impact of US tariffs on Ontario real GDP relative to the no tariff scenario
Source: Ontario Economic Accounts and FAO
Accessible version
| Real GDP growth (per cent) | No tariff scenario | FAO tariff scenario |
|---|---|---|
| 2025 | 1.7 | 0.6 |
| 2026 | 1.9 | 1.2 |
| 2027-2029 Average | 1.9 | 1.8 |
| Real GDP (billions, 2017$) | No tariff scenario | FAO tariff scenario | |
|---|---|---|---|
| 2024 | 947.0 | 947.0 | |
| 2025 | 963.4 | 952.9 | |
| 2026 | 981.6 | 964.2 | 1.8% lower real GDP |
| 2027 | 999.7 | 979.8 | |
| 2028 | 1,019.2 | 999.0 | |
| 2029 | 1,038.6 | 1,018.4 | 2.0% lower real GDP |
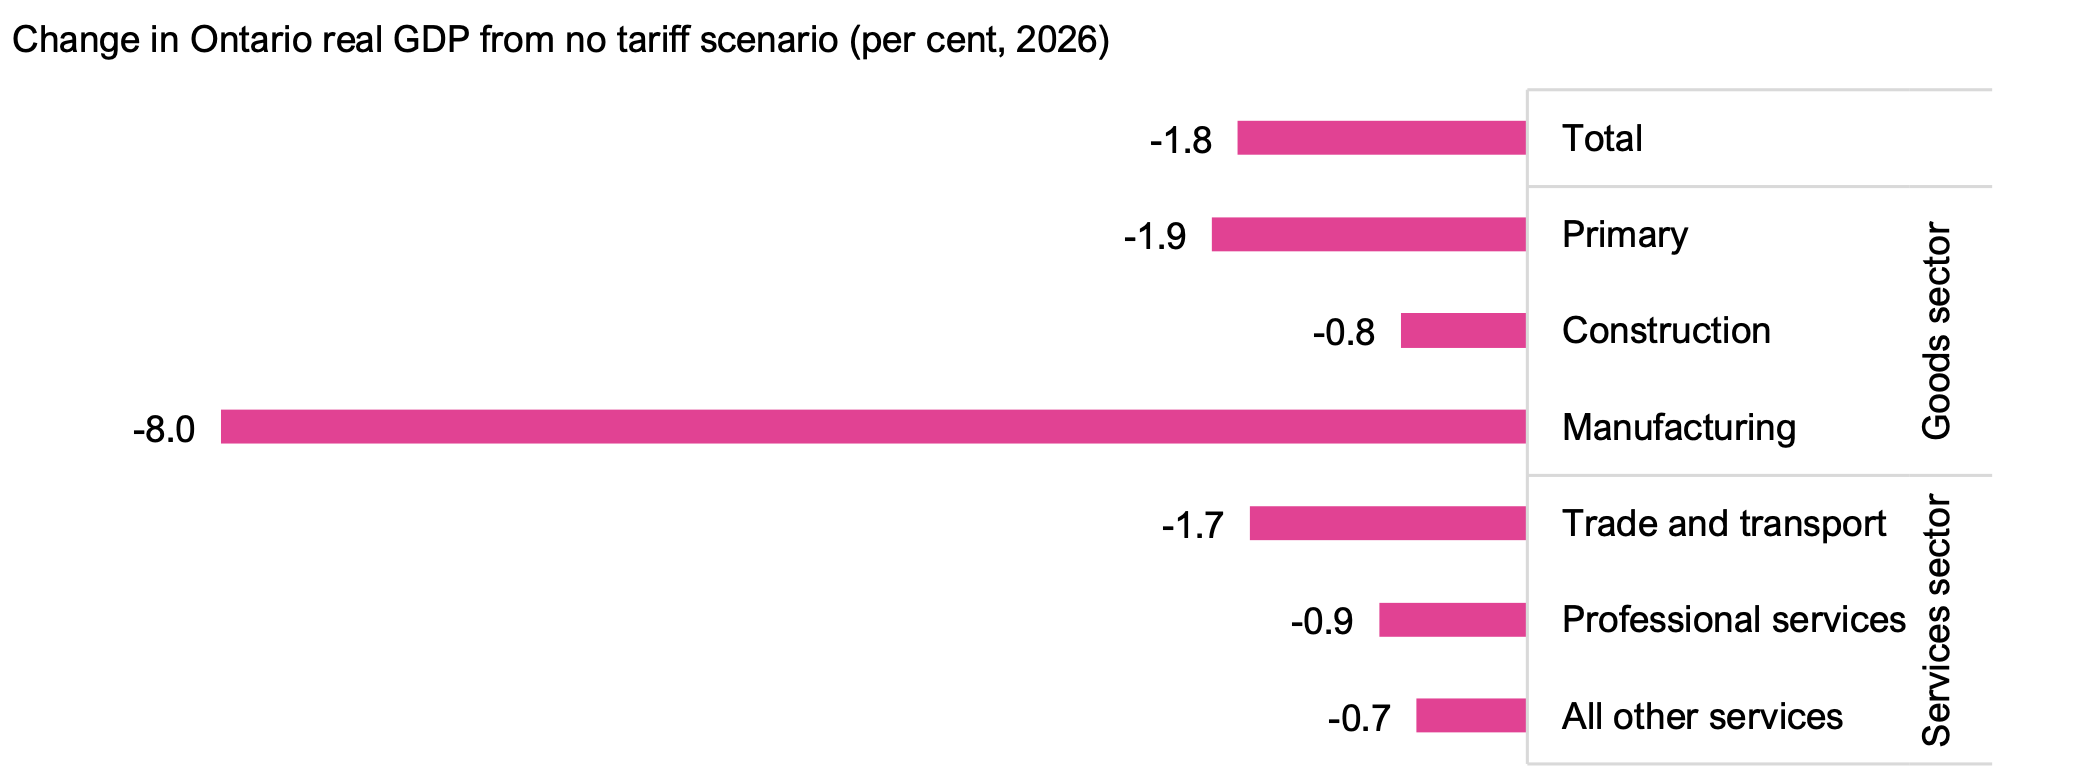
In 2026, the first full year of tariffs, Ontario’s manufacturing sector would be the most impacted with real GDP reduced by 8.0 per cent. All other sectors, including services, would also be impacted through supply chain effects, as well as through broader economic impacts from lower incomes, profits, consumption and investment.
Figure 10 Impact of US tariffs on Ontario real GDP by sector in 2026
Source: Statistics Canada Tables 36-10-0402-01, 12-10-0100-01 and FAO
Accessible version
| Total | -1.8 | |
| Goods sector | Primary | -1.9 |
| Construction | -0.8 | |
| Manufacturing | -8.0 | |
| Services sector | Trade and transport | -1.7 |
| Professional services | -0.9 | |
| All other services | -0.7 |
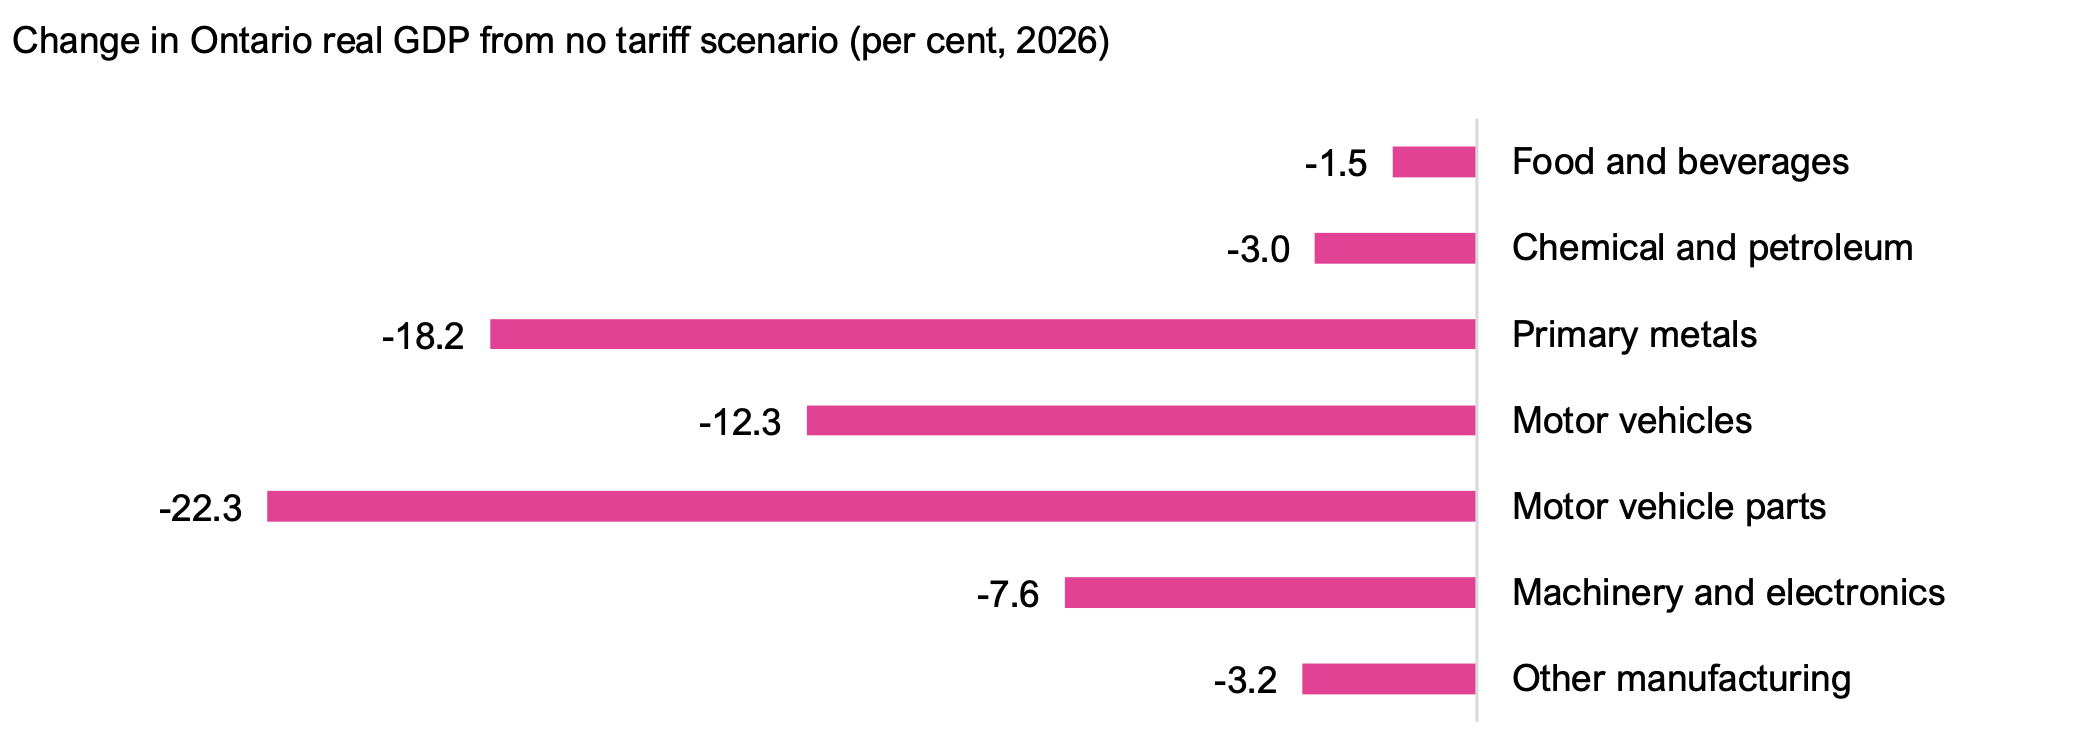
Within manufacturing, the motor vehicle parts industry would be the most impacted, with real GDP 22.3 per cent lower than in the no tariff scenario in 2026. CUSMA-compliant motor vehicle parts are assumed to be tariffed at 25 per cent of their non-US content, which implies an effective tariff rate of almost 15 per cent. Primary metals would also be heavily impacted, with 25 per cent tariffs on steel and aluminum products, and its real GDP would be 18.2 per cent lower than under the no tariff scenario. Real GDP in the motor vehicle industry would be 12.3 per cent below the no tariff scenario, reflecting the 25 per cent tariffs on autos and the exemption for US content, while the machinery and electronics industry would be 7.6 per cent lower.
Figure 11 Impact of US tariffs on Ontario real GDP in the manufacturing industry in 2026
Source: Statistics Canada Tables 36-10-0402-01, 12-10-0100-01 and FAO
Accessible version
| Food and beverages | -1.5 |
| Chemical and petroleum | -3.0 |
| Primary metals | -18.2 |
| Motor vehicles | -12.3 |
| Motor vehicle parts | -22.3 |
| Machinery and electronics | -7.6 |
| Other manufacturing | -3.2 |
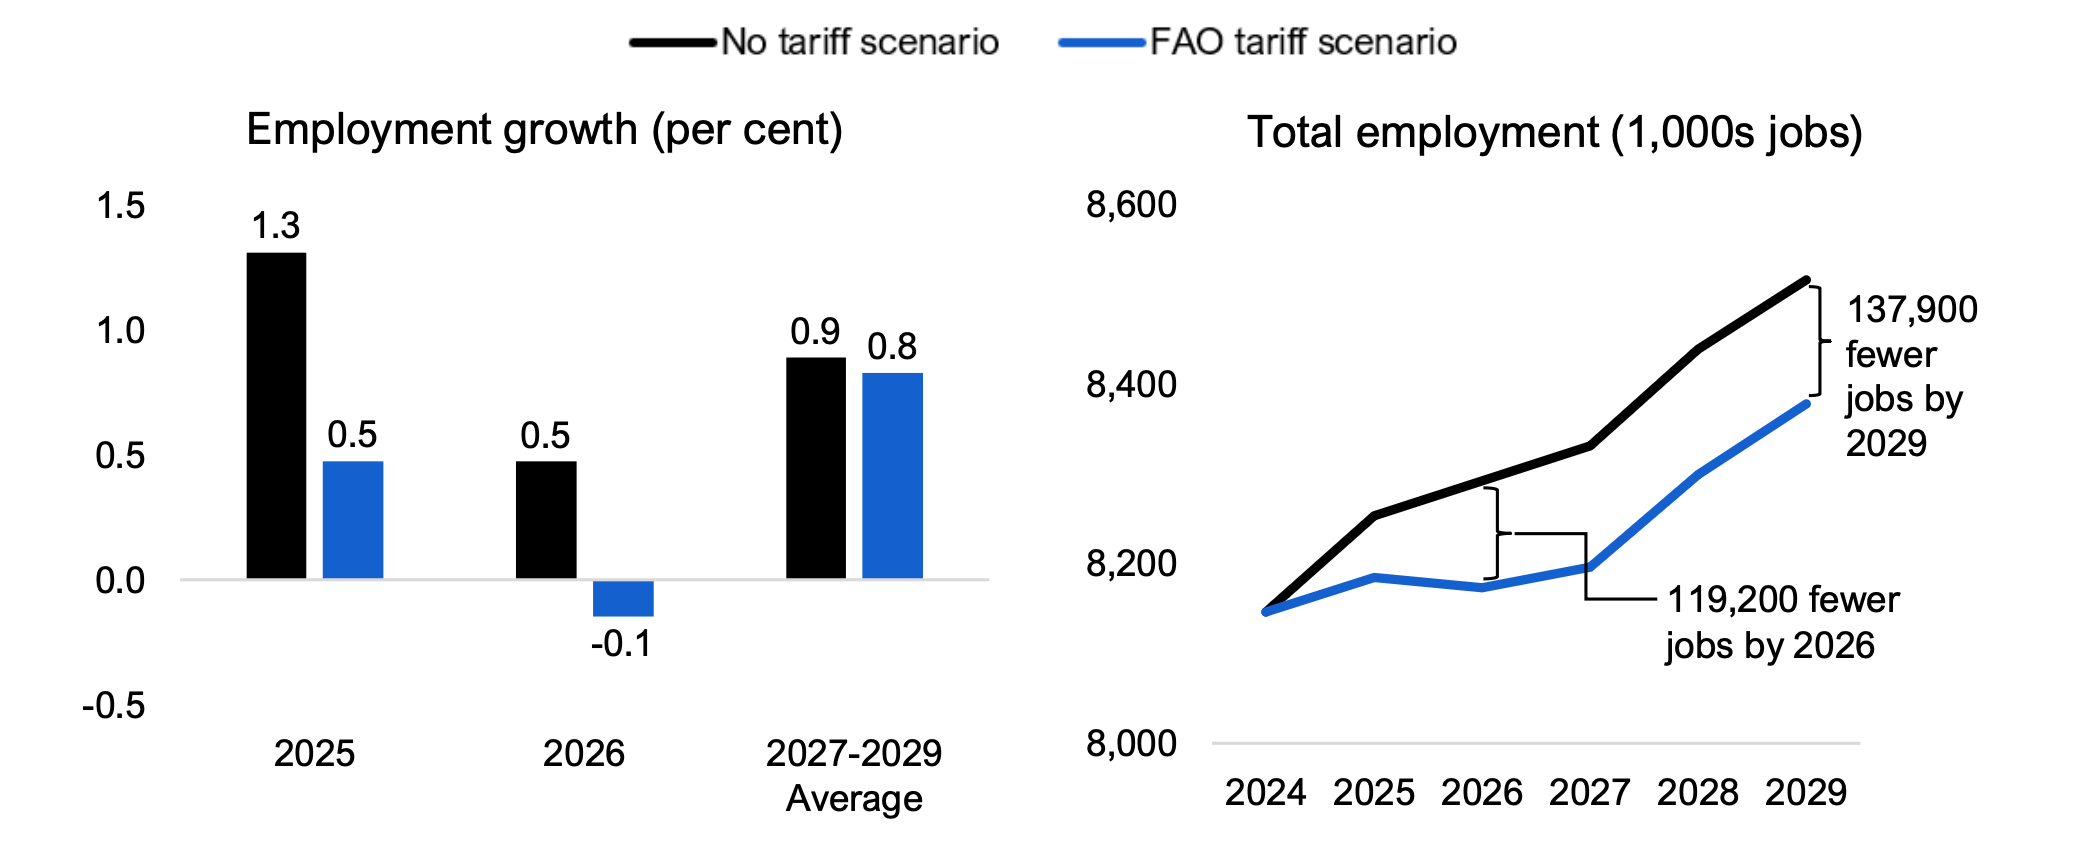
US tariffs will slow Ontario’s employment growth
The FAO estimates that US tariffs would slow employment growth to 0.5 per cent in 2025, compared to 1.3 per cent in the no tariff outlook. In 2026, the first full year of the tariff impact, employment would weaken further, declining by 0.1 per cent. Weaker job growth would result in 68,100 fewer jobs in Ontario in 2025, compared to the no tariff scenario, and 119,200 fewer jobs in 2026. By 2029, under the FAO tariff scenario, there would be 137,900 fewer jobs in Ontario compared to the no tariff scenario.
Figure 12 Impact of US tariffs on Ontario’s employment relative to the no tariff scenario
Source: Statistics Canada Table 14-10-0327-01 and FAO
Accessible version
| Employment growth (per cent) | No tariff scenario | FAO tariff scenario |
|---|---|---|
| 2025 | 1.3 | 0.5 |
| 2026 | 0.5 | -0.1 |
| 2027-2029 Average | 0.9 | 0.8 |
| Total employment (1000s jobs) | No tariff scenario | FAO tariff scenario | |
| 2024 | 8,146 | 8,146 | |
| 2025 | 8,253 | 8,185 | |
| 2026 | 8,292 | 8,173 | 119,200 fewer jobs by 2026 |
| 2027 | 8,331 | 8,195 | |
| 2028 | 8,438 | 8,299 | |
| 2029 | 8,515 | 8,378 | 137,900 fewer jobs by 2029 |
US tariffs are projected to raise Ontario’s unemployment rate by 1.1 percentage points over the 2025 to 2029 outlook, averaging 7.7 per cent, higher than the 6.6 per cent average in the no tariff scenario.
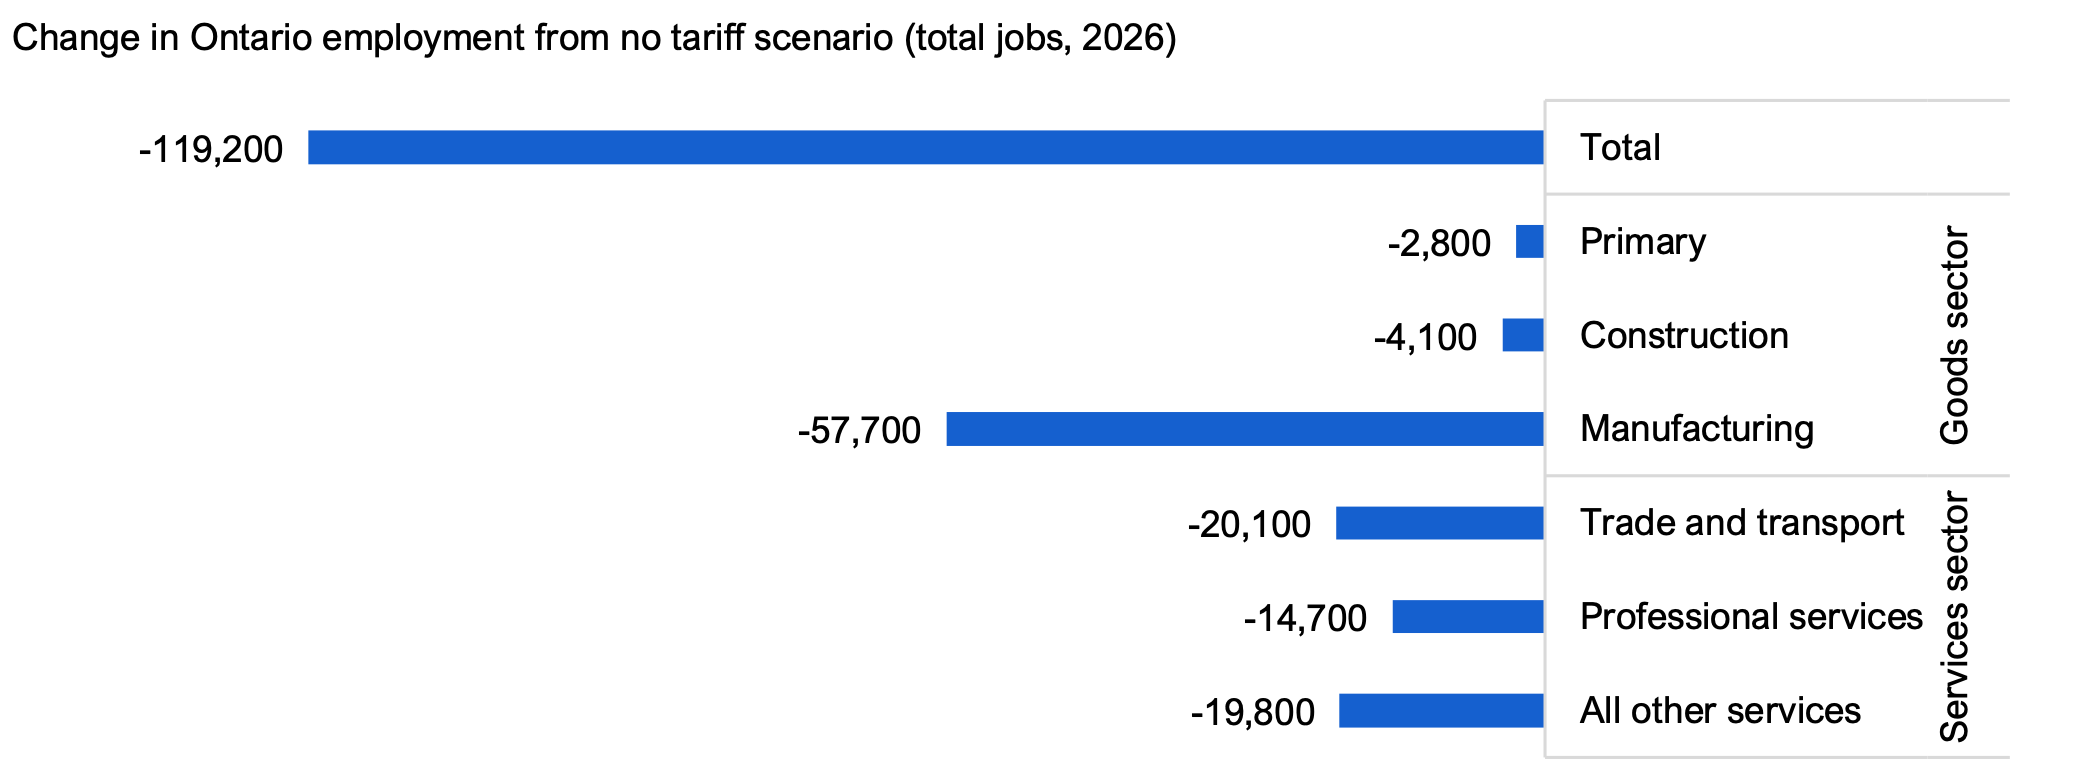
By sector, manufacturing employment is expected to be the most affected by the tariffs, with 57,700 (-6.8 per cent) fewer jobs in 2026 compared to the no tariff scenario. The manufacturing sector’s supply chain industries are also impacted, particularly the more labour-intensive services industries, including trade and transport, and professional services.
Figure 13 Impact of US tariffs on Ontario employment by sector in 2026
Source: Statistics Canada Tables 14-10-0023-01, 12-10-0100-01 and FAO
Accessible version
| Total | -119,200 | |
| Goods sector | Primary | -2,800 |
| Construction | -4,100 | |
| Manufacturing | -57,700 | |
| Services sector | Trade and transport | -20,100 |
| Professional services | -14,700 | |
| All other services | -19,800 |
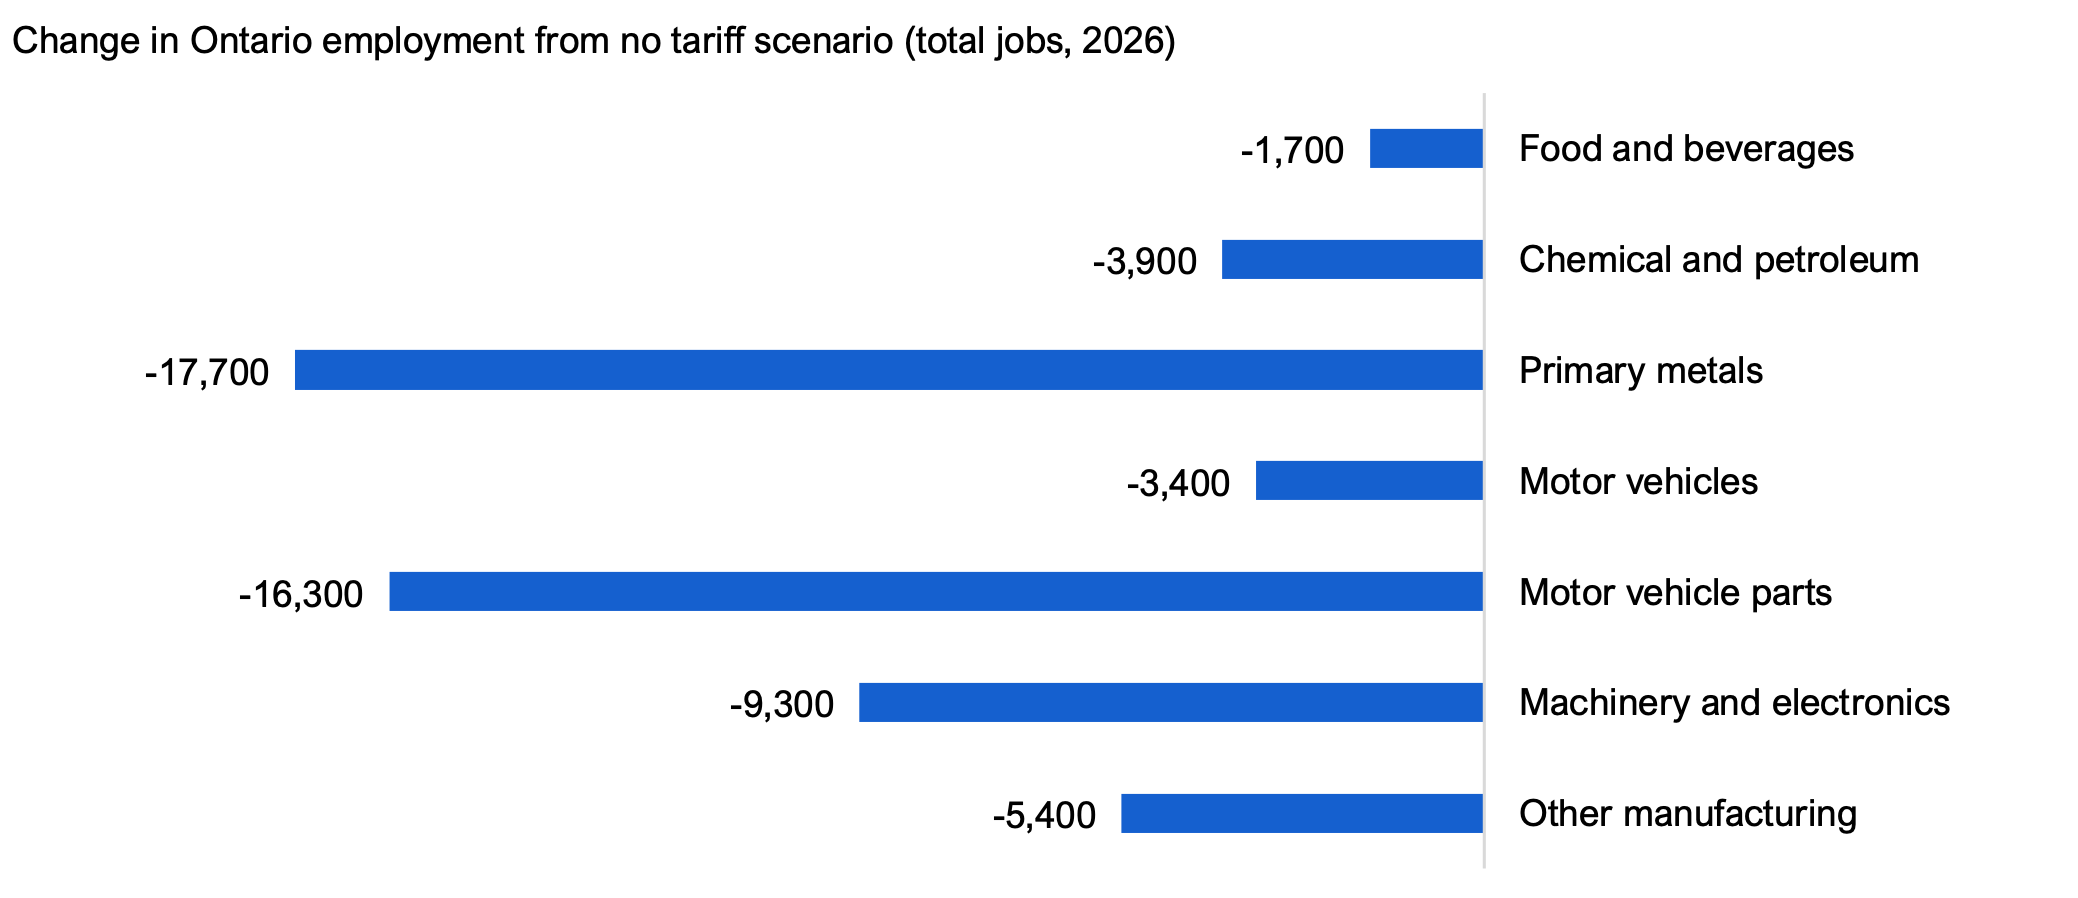
Within manufacturing, all industries would be affected. The greatest impact would be in primary metals (‑17,700 fewer jobs), motor vehicle parts (-16,300 fewer jobs) and machinery and electronics (-9,300 fewer jobs). Motor vehicle employment would be 3,400 lower due to the exemption for US-content, as well as its less labour-intensive production process.
Figure 14 Impact of US tariffs on Ontario employment in the manufacturing industry in 2026
Source: Statistics Canada Tables 14-10-0023-01, 12-10-0100-01 and FAO
Accessible version
| Food and beverages | -1,700 |
| Chemical and petroleum | -3,900 |
| Primary metals | -17,700 |
| Motor vehicles | -3,400 |
| Motor vehicle parts | -16,300 |
| Machinery and electronics | -9,300 |
| Other manufacturing | -5,400 |
Southwestern Ontario cities would be most impacted
US tariffs on Ontario exports would negatively affect employment in all Census Metropolitan Areas (CMAs) in the province. The size of the impact would depend on the industrial composition of local economies. Windsor is expected to be impacted the most, with employment 1.6 per cent lower in 2026 compared to the no tariff scenario, followed by Guelph (-1.6 per cent lower), Brantford (-1.5 per cent lower), Kitchener-Cambridge-Waterloo (-1.5 per cent lower) and London (-1.3 per cent lower). These CMAs are more exposed to export-focused manufacturing than other Ontario CMAs.
Figure 15 Impact of tariffs on Ontario employment by Census Metropolitan Area* in 2026
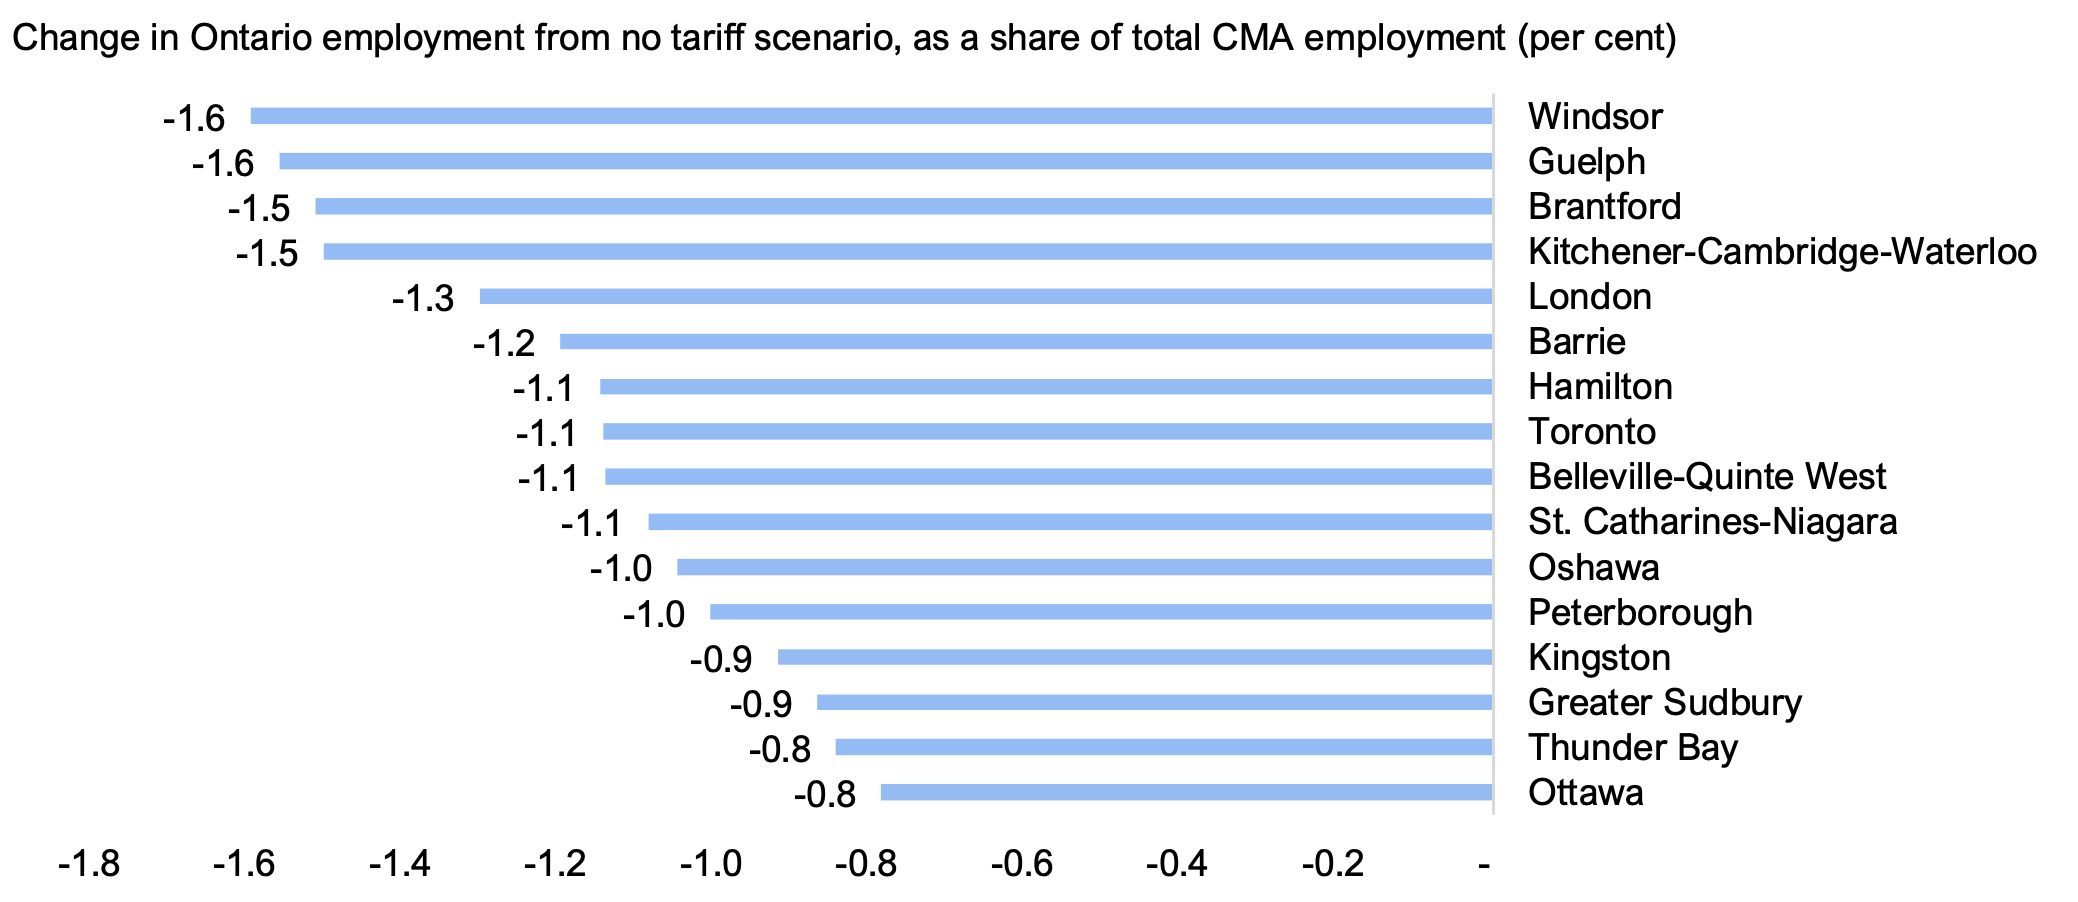
* Census Metropolitan Area represent where workers live, which may not correspond to the region in which they work.
Source: Statistics Canada Tables 14-10-0468-01, 14-10-0023-01 and FAO
Accessible version
| Windsor | -1.6 |
| Guelph | -1.6 |
| Brantford | -1.5 |
| Kitchener-Cambridge-Waterloo | -1.5 |
| London | -1.3 |
| Barrie | -1.2 |
| Hamilton | -1.1 |
| Toronto | -1.1 |
| Belleville-Quinte West | -1.1 |
| St. Catharines-Niagara | -1.1 |
| Oshawa | -1.0 |
| Peterborough | -1.0 |
| Kingston | -0.9 |
| Greater Sudbury | -0.9 |
| Thunder Bay | -0.8 |
| Ottawa | -0.8 |
Tariffs will modestly raise consumer prices in Ontario
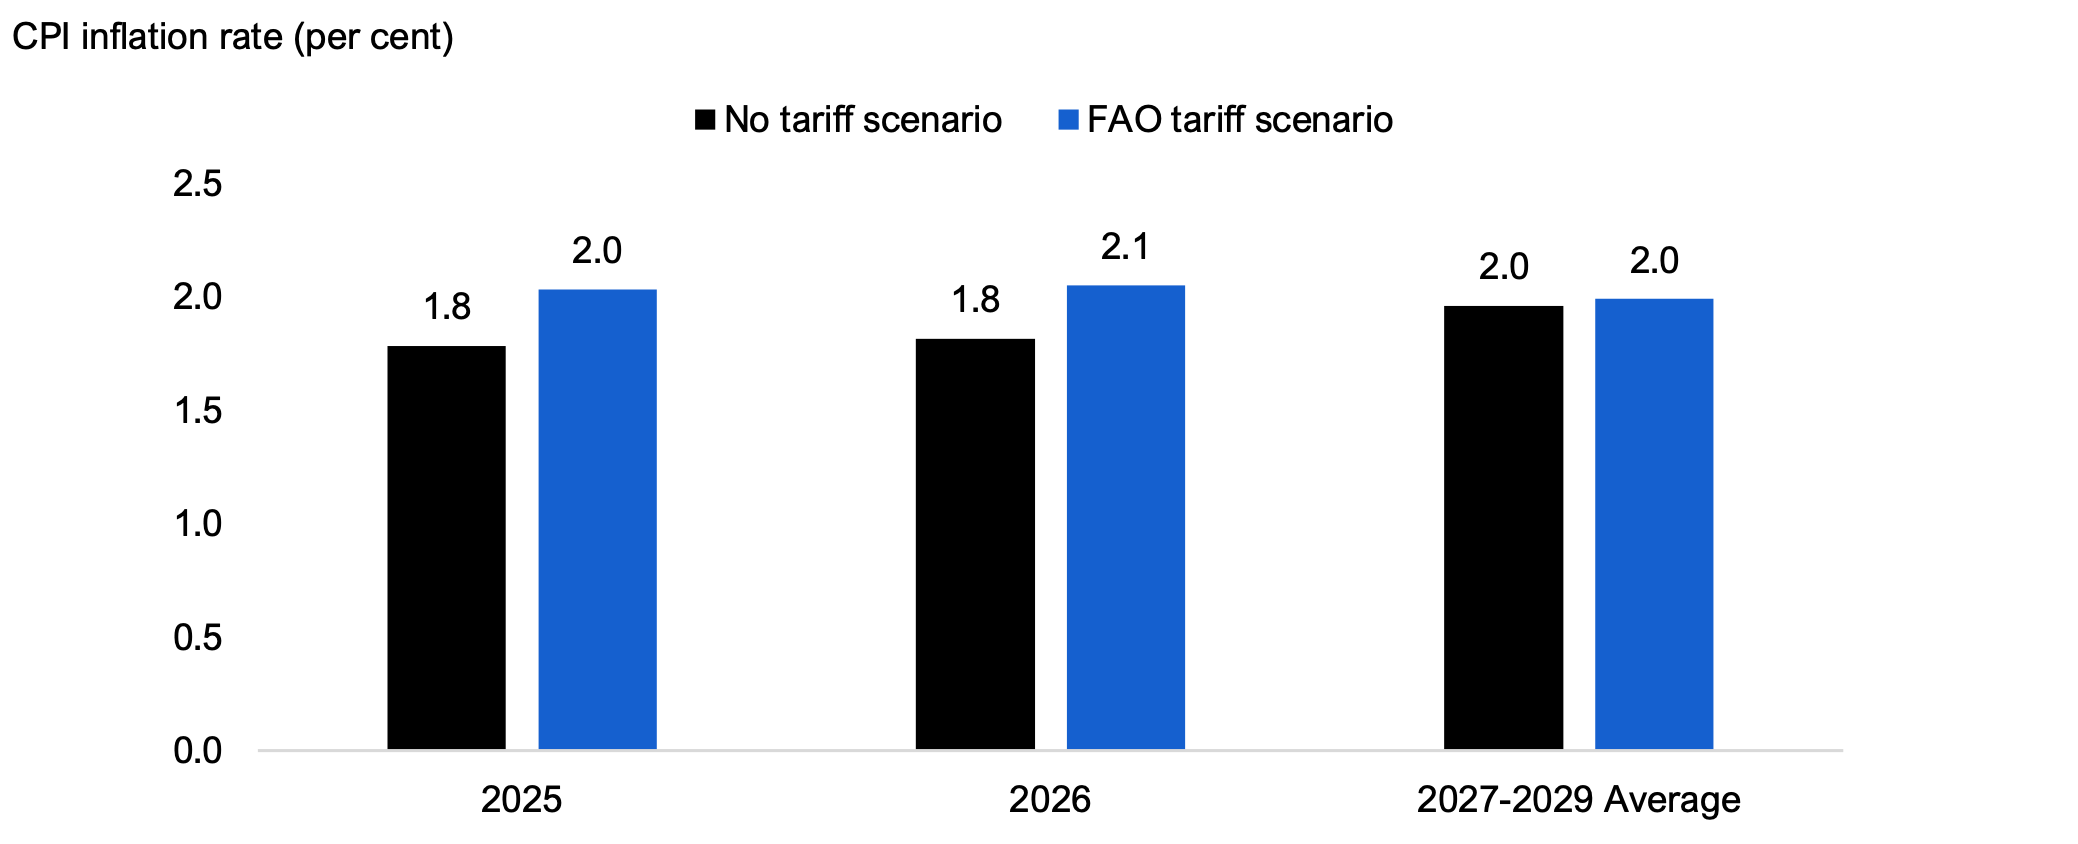
Under the FAO’s tariff scenario, Ontario’s Consumer Price Index (CPI) inflation rate is projected to be 0.2 percentage points higher in 2025 than in the no tariff scenario and 0.3 percentage points higher in 2026. Ontario’s import prices would increase due to Canada’s tariff retaliation, higher US inflation (primarily caused by US tariffs on imports from China) and a slightly weaker Canadian dollar. This would be partially offset by the impact of weaker economic activity in Ontario and lower oil prices.
Figure 16 Impact of US tariffs on Ontario inflation
Source: FAO
Accessible version
| No tariff scenario | FAO tariff scenario | |
|---|---|---|
| 2025 | 1.8 | 2.0 |
| 2026 | 1.8 | 2.1 |
| 2027-2029 Average | 2.0 | 2.0 |
Uncertainty and Range of Potential Impacts
The FAO’s tariff scenario estimates the impact of US and Canadian tariffs on Ontario’s economy based on existing trade policy as of April 17, and assumptions on how the Ontario, US and global economies could respond to these tariffs. The actual impact of tariffs on Ontario’s economy is uncertain and will depend on the magnitude, breadth and duration of tariff coverage, as well as how businesses, households and economies respond.
Given this uncertainty, the FAO has developed two additional scenarios, a “low impact” and a “high impact” scenario, to account for potential changes in US and Canadian tariff policies, as well as the potential range of economic impacts to Ontario.[17] Table 1 shows the estimated economic impacts of all scenarios.
| No Tariff Scenario | Low Impact Scenario | FAO Tariff Scenario | High Impact Scenario | |
|---|---|---|---|---|
| Real GDP growth (per cent) | ||||
| 2025 | 1.7 | 1.3 | 0.6 | -0.5 |
| 2026 | 1.9 | 1.6 | 1.2 | 0.6 |
| 2027-2029 average | 1.9 | 1.9 | 1.8 | 1.8 |
| Employment (thousands, change from no tariff scenario) | ||||
| 2025 | – | -20 | -68 | -123 |
| 2026 | – | -44 | -119 | -214 |
| 2027-2029 average | – | -56 | -138 | -234 |
| CPI growth (per cent) | ||||
| 2025 | 1.8 | 1.8 | 2.0 | 2.2 |
| 2026 | 1.8 | 1.9 | 2.1 | 2.2 |
| 2027-2029 average | 2.0 | 2.0 | 2.0 | 2.1 |
Compared to the FAO’s tariff scenario, the low impact scenario assumes that existing US and Canadian retaliatory tariffs are reduced from 25 per cent to 10 per cent, trade volumes are more resilient to tariffs, and the US and global economies perform better than expected. Under the low impact scenario, Ontario’s real GDP growth would be 1.3 per cent in 2025 and 1.6 per cent in 2026, which implies that Ontario would not enter a recession. In addition, there would be 20,000 fewer jobs in 2025 and 44,000 fewer jobs in 2026 compared to the no tariff scenario. Ontario’s CPI inflation is expected to be modestly under two per cent in 2025 and 2026 in this scenario.
The high impact scenario assumes that the US introduces additional tariffs on copper, lumber, semiconductors and pharmaceuticals, in addition to increased tariffs on steel, aluminum and automobiles. In response, the Canadian government introduces additional retaliatory tariffs on US imports, matching US tariffs on a dollar-for-dollar basis. The high impact scenario also assumes that trade volumes respond more strongly to tariffs, and that the US and global economies suffer weaker growth and higher prices from a protracted trade war. Under the high impact scenario, Ontario’s real GDP declines by 0.5 per cent in 2025 and grows by 0.6 per cent in 2026, which implies a deeper recession in Ontario than expected in the FAO’s tariff scenario. In addition, there would be 123,000 fewer jobs in 2025 and 214,000 fewer jobs in 2026, compared to the no tariff scenario, and CPI inflation would be higher at 2.2 per cent in 2025 and 2026.
Importantly, these scenarios do not include any impacts beyond those specified in the report, including any potential fiscal stimulus from federal or provincial governments to support affected industries and workers, potential tariffs on goods or services beyond those already specified, or potential changes to CUSMA during its review in 2026.
Appendix: Tariff Scenario Assumptions
FAO Tariff Scenario
Tariff assumptions
- See above section: The FAO’s tariff scenario.
Economic assumptions
- Relative to a no tariff scenario, the Bank of Canada lowers its policy interest rate by an additional 50 basis points in 2025, the Canadian dollar weakens by 1 cent relative to the US dollar in 2025 and oil prices are $5 lower per barrel on average from 2025 to 2028.
- The ongoing US trade war, including US tariffs on other countries and their retaliatory actions, lowers US real GDP growth by 0.9 percentage points to 1.1 per cent in 2025. US tariffs on China and other countries are also assumed to raise US consumer prices in 2025 by 1.1 percentage points above the no tariff scenario to a rate of 3.3 per cent.
Methodological assumptions
- For each 1.0 percentage point increase in the tariff rate, trade volumes decline by an average of 1.5 per cent over the projection.[18]
- Exporting firms find alternative markets to offset roughly 20 per cent of the decline in exports to the US.[19]
- Ontario’s importing firms pass through half of their tariff costs to consumers in 2025. By 2027, Ontario importers fully pass through all tariff-related costs.[20]
Low Impact Scenario
Tariff assumptions
- US tariffs are placed on the same goods as in the FAO tariff scenario; however, all tariff rates are reduced to 10 per cent.
- Canadian retaliatory tariffs are placed on the same goods as in the FAO tariff scenario; however, all tariff rates are reduced to 10 per cent.
Economic assumptions
- Relative to a no tariff scenario, the Bank of Canada lowers its policy interest rate by an additional 25 basis points in 2025, the Canadian dollar weakens by one cent relative to the US dollar in 2025 and oil prices are $2 lower per barrel on average from 2025 to 2028.
- The ongoing US trade war, including US tariffs on other countries and their retaliatory actions, lowers US real GDP growth by 0.5 percentage points to 1.5 per cent in 2025. US tariffs on China and other countries are also assumed to raise US consumer prices in 2025 by 0.6 percentage points above the no tariff scenario to a rate of 2.8 per cent.
Methodological assumptions
- For each 1.0 percentage point increase in the tariff rate, trade volumes decline by an average of 1.2 per cent over the projection.
- Exporting firms find alternative markets to offset roughly 25 per cent of the decline in exports to the US.
- Ontario’s importing firms pass through one quarter of their tariff costs to consumers in 2025. By 2027, Ontario importers fully pass through all tariff-related costs.
High Impact Scenario
Tariff assumptions
- Additional US tariffs of 25 per cent are placed on lumber, copper, semiconductors and pharmaceuticals. The US also increases its tariff on steel, aluminum and automobiles to 50 per cent.
- In response, Canadian retaliatory tariffs are expanded to match US tariffs on a dollar-for-dollar basis.
Economic assumptions
- Relative to a no tariff scenario, the Bank of Canada lowers its policy interest rate by an additional 75 basis points in 2025, the Canadian dollar weakens by three cents relative to the US dollar in 2025 and oil prices are $9 lower per barrel on average from 2025 to 2028.
- The ongoing US trade war, including US tariffs on other countries and their retaliatory actions, lowers US real GDP growth by 1.5 percentage points to 0.5 per cent in 2025, implying a recession. US tariffs on China and other countries are also assumed to raise US consumer prices in 2025 by 2.1 percentage points above the no tariff scenario to a rate of 4.3 per cent.
Methodological assumptions
- For each 1.0 percentage point increase in the tariff rate, trade volumes decline by an average of 1.8 per cent over the projection.
- Exporting firms find alternative markets to offset roughly 15 per cent of the decline in exports to the US.
- Ontario’s importing firms pass through half of their tariff costs to consumers in 2025. By 2027, Ontario importers fully pass through all tariff-related costs.
Appendix: Sector Classification of Industries
| Sector | Headline (NAICS codes)* | Industries |
|---|---|---|
| Goods sectors | Primary (11,21,22) | Agriculture; Forestry, fishing, mining, quarrying, oil and gas; Utilities |
| Construction (23) | Construction | |
| Manufacturing (31-33) | Manufacturing | |
| Services sectors | Trade and transport (41-49) | Wholesale and retail trade; Transportation and warehousing |
| Professional services (52-54, 55) | Finance, insurance, real estate, rental and leasing; Professional, scientific and technical services | |
| All other services (51, 56, 61, 62, 71, 72, 81, 91) | Business, building and other support services; Educational services; Health care and social assistance; Information, culture and recreation; Accommodation and food services; Other services (except public administration); Public administration | |
| Manufacturing sub-sectors | Food and beverage (311, 312) | Food manufacturing; Beverage and tobacco product manufacturing |
| Chemical and petroleum (324-326) | Petroleum and coal product manufacturing; Chemical manufacturing; Plastics and rubber products manufacturing | |
| Primary metals (331, 332) | Primary metal manufacturing; Fabricated metal product manufacturing | |
| Motor vehicles (3361) | Motor vehicle manufacturing | |
| Motor vehicle parts (3363) | Motor vehicle parts manufacturing | |
| Machinery and electronics (333-335) | Machinery manufacturing; Computer and electronic product manufacturing; Electrical equipment, appliance and component manufacturing | |
| Other manufacturing (321, 327, 3362, 3364-3369, 337, 339) | Textile and textile product mills; Clothing and leather and allied product manufacturing; Wood product manufacturing; Paper manufacturing; Printing and related support activities; Non-metallic mineral product manufacturing; Motor vehicle body and trailer manufacturing; Aerospace product and parts manufacturing; Railroad rolling stock manufacturing; Ship and boat building; Other transportation equipment manufacturing; Furniture and related product manufacturing; Miscellaneous manufacturing |
Footnotes
[1] Since the 1960s, the major trade agreements between the US and Canada have been the Canada–United States Automotive Products Agreement (1965), the Canada–United States Free Trade Agreement (1989), the North American Free Trade Agreement (1994) and the current agreement, the Canada-United States-Mexico Agreement (2020).
[2] Data on the contribution of exports to GDP were only available from 2013 to 2021.
[3] This represents the amount of income generated by Ontario’s exporters and their domestic supply chains after removing the impact of imported components and materials used in their production.
[4] This represents the FAO’s estimated number of jobs connected to Ontario’s exporters and their Ontario-based supply chains in 2024.
[5] All other services include information, culture, recreation, accommodation and food services, among others. See Appendix Table 2.
[6] This is measured as “gross output” by Statistics Canada.
[7] For a breakdown of the North American Industry Classification System (NAICS) industries included in the sectors presented in this report, see Appendix Table 2.
[8] Other manufacturing industries include textiles, wood products and furniture, among others. See Appendix Table 2.
[9] Given this uncertainty, the FAO has included a range of impacts in the following section. See Uncertainty and Range of Potential Impacts.
[10] For the economic and methodological assumptions underlying the FAO’s tariff scenario, see FAO Tariff Scenario in the Appendix.
[11] The FAO estimates that 90 per cent of Ontario’s US goods exports are CUSMA-compliant using Statistics Canada Table 12-10-0100-01.
[12] US content refers to the value of the commodity attributable to parts wholly obtained, produced entirely, or substantially transformed in the US. The FAO estimates that Ontario’s motor vehicles exports contain 50 per cent US content and motor vehicle parts exports contain 34 per cent US content using Statistics Canada Table 12-10-0100-01.
[13] On April 15, the Canadian government announced certain exemptions for tariffs on motor vehicles. However, due to limited information, the FAO has excluded this exemption from its tariff scenario.
[14] The FAO assumes that 77 per cent of US motor vehicle imports will be subject to tariffs based on OECD input-output tables.
[15] In response, some Ontario exporters will reduce their prices to limit the loss of US market share while others will seek alternative markets. Neither of these reactions are expected to fully offset the net loss in Ontario’s international exports.
[16] These declines in sectoral international exports are estimated as the direct export response to US tariffs. Additional macroeconomic impacts (such as relatively lower consumption or investment) would lower these export volumes further.
[17] For detailed assumptions on each scenario see Appendix: Tariff Scenario Assumptions.
[18] The FAO uses elasticities of substitution of -1.2 in 2025, increasing to -1.8 by 2029, consistent with the average of a number of academic studies (see Ahmad, Montgomery and Schreiber, 2021 and Bajzik et al, 2020), as well as research showing that elasticities in the short run are typically lower than in the long run (see Boehm, Levchenko and Pandalai-Nayar, 2022).
[19] The FAO assumes that Ontario exporters increase their share of goods shipped to the rest of the world by three per cent by 2029, generally in line with trade diversification observed over the past decade.
[20] These assumptions are based on the Bank of Canada’s Business Outlook Survey—First Quarter of 2025.