


Summary
This report compares 2024-25 Government of Ontario financial statistics against the other Canadian provinces based on Statistics Canada’s Government Finance Statistics (GFS). The GFS data adjust for differences in each province’s organizational structure and accounting practices, providing a standardized framework for comparing provincial budgetary results.
Ontario’s net operating balance was near the rest of Canada average
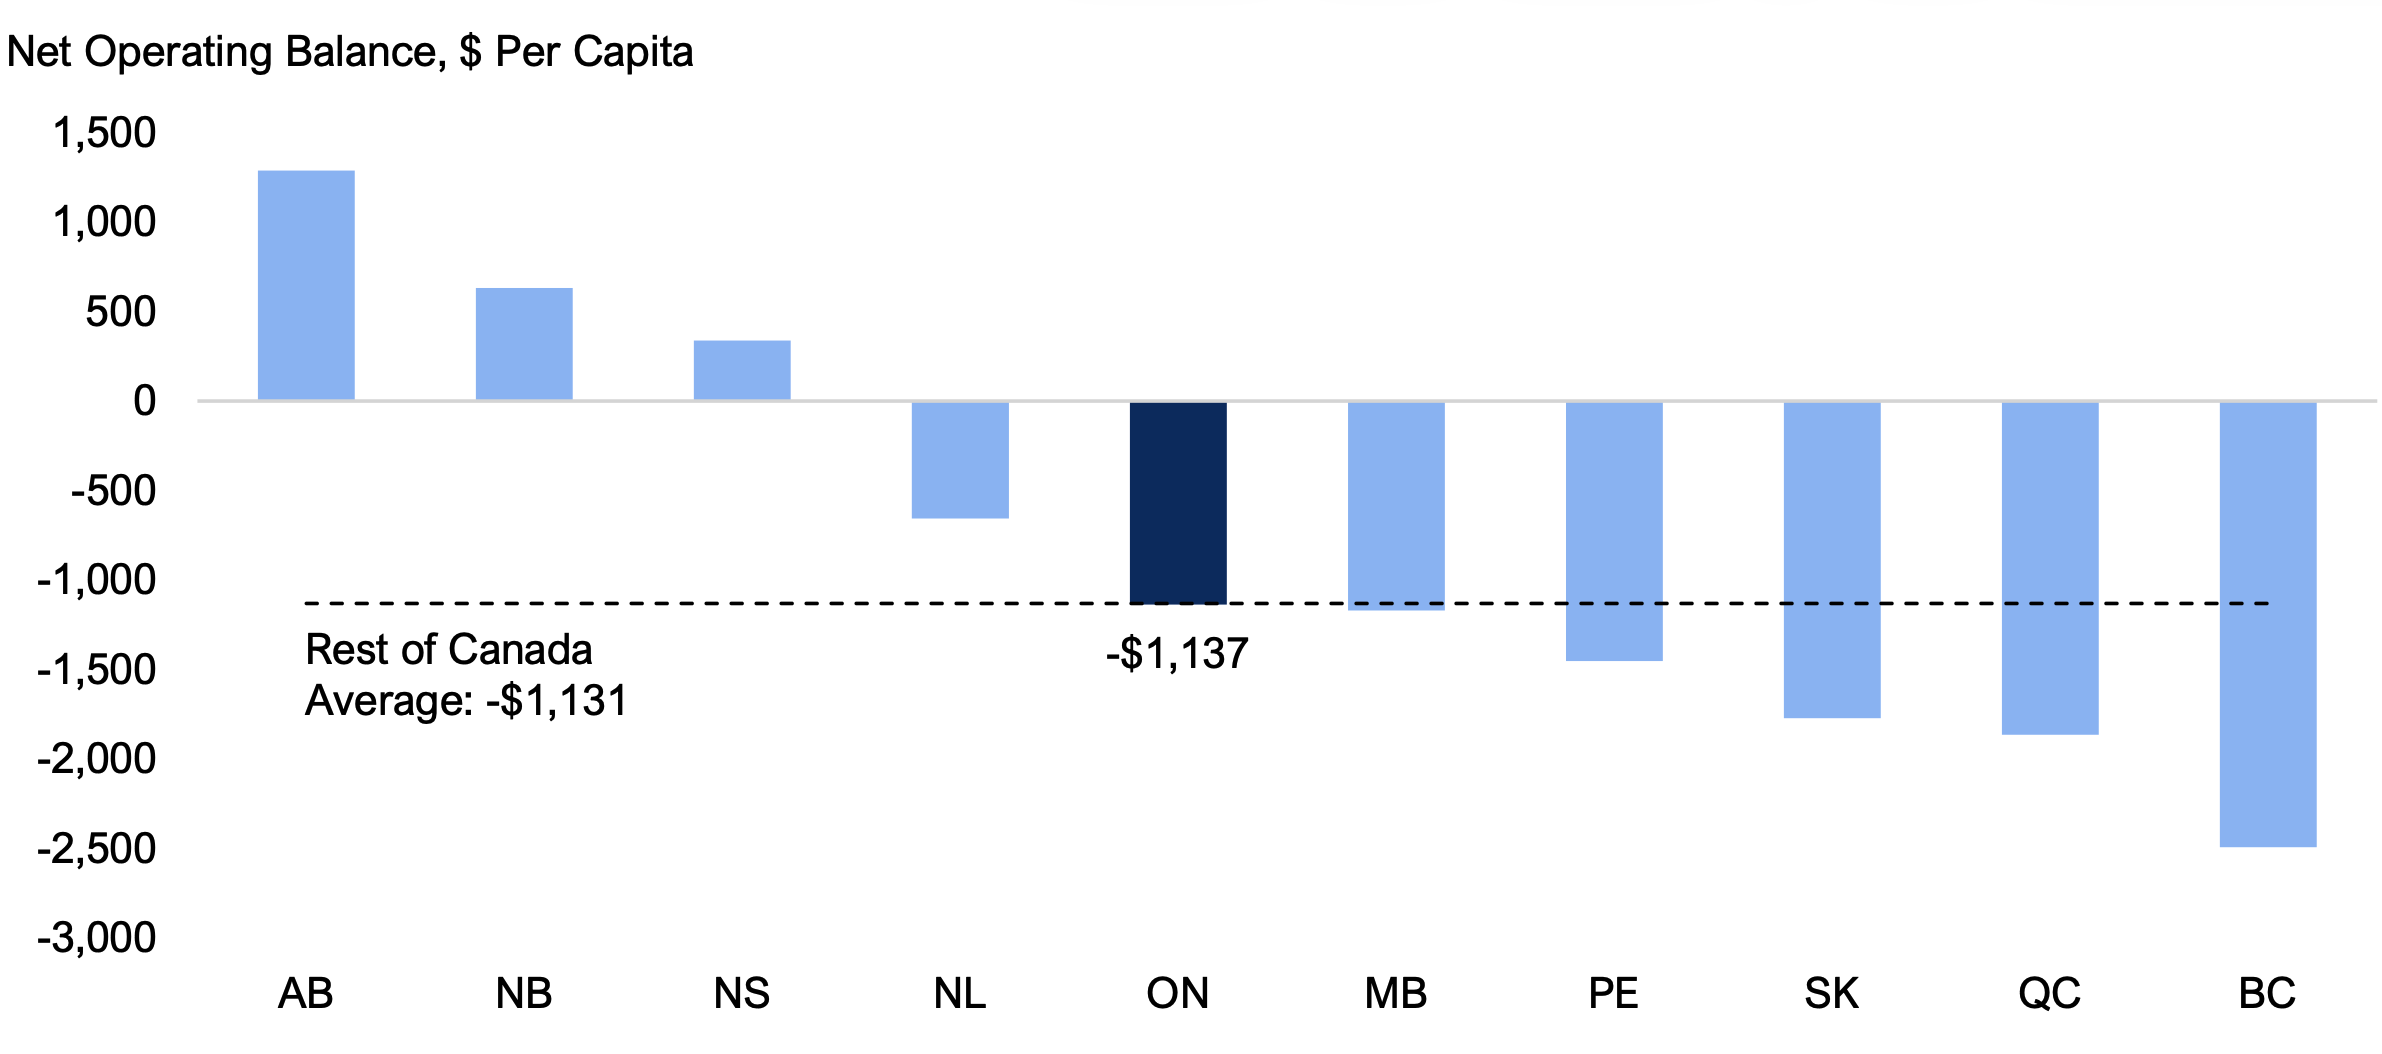
- Ontario’s net operating balance, the difference between total revenue and total spending, was a $1,137 deficit per person in 2024-25. This was similar ($6 larger) to the rest of Canada average[1] of a net operating deficit of $1,131 per capita and the sixth highest deficit among the provinces.
- Only three provinces – Alberta, New Brunswick and Nova Scotia – recorded net operating surpluses in 2024-25.
Ontario’s net financial worth per capita was the lowest in Canada
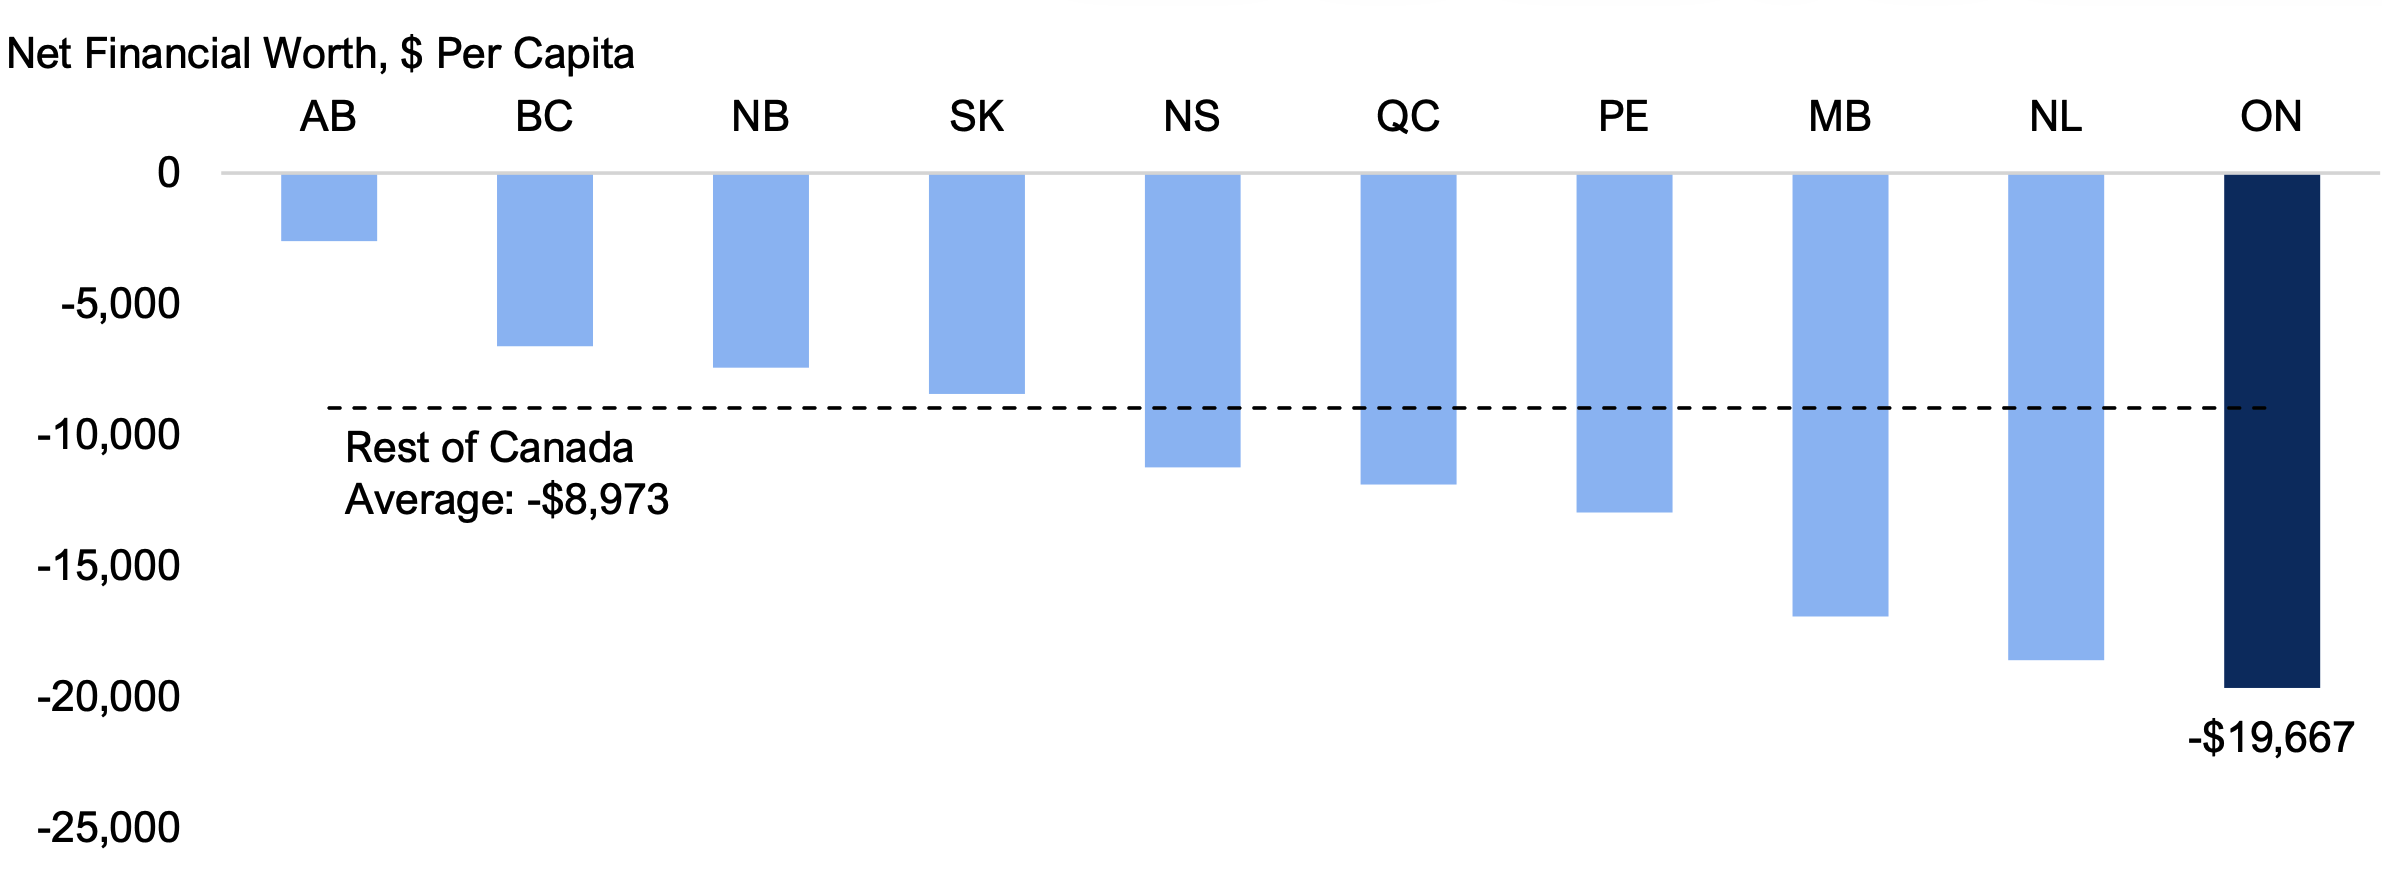
- Ontario’s net financial worth, the difference between financial assets and financial liabilities, was ‑$19,667 per person in 2024-25, the lowest among the provinces and $10,693 (119.2 per cent) below the rest of Canada average (-$8,973 per capita).
- Since 2009-10, Ontario has had the lowest or second lowest net financial worth per capita among the provinces.
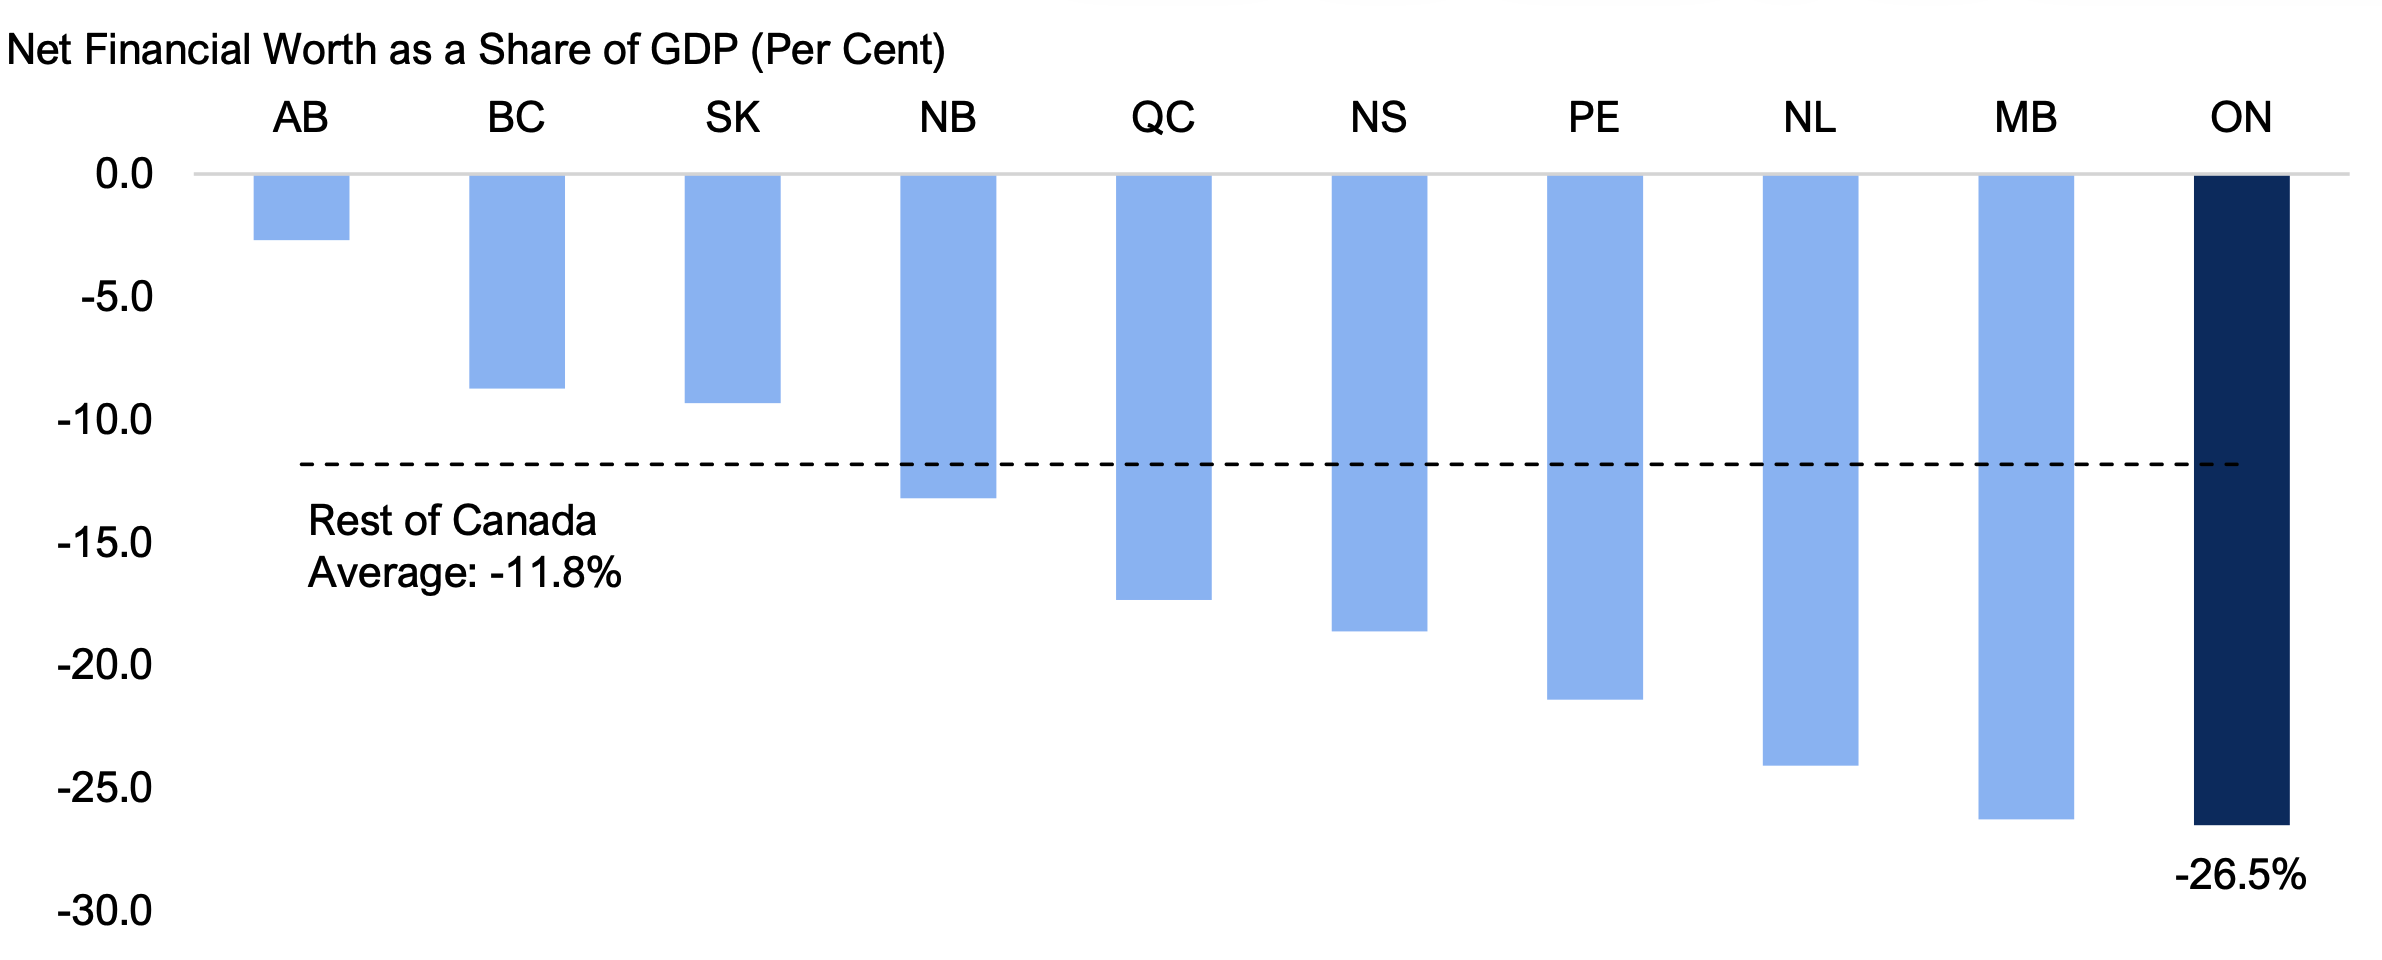
- Measured against each province’s Gross Domestic Product (GDP), Ontario’s net financial worth (‑26.5 per cent of GDP) was the lowest among the provinces and below the rest of Canada average (‑11.8 per cent).
Ontario’s total revenue per capita was the lowest in Canada
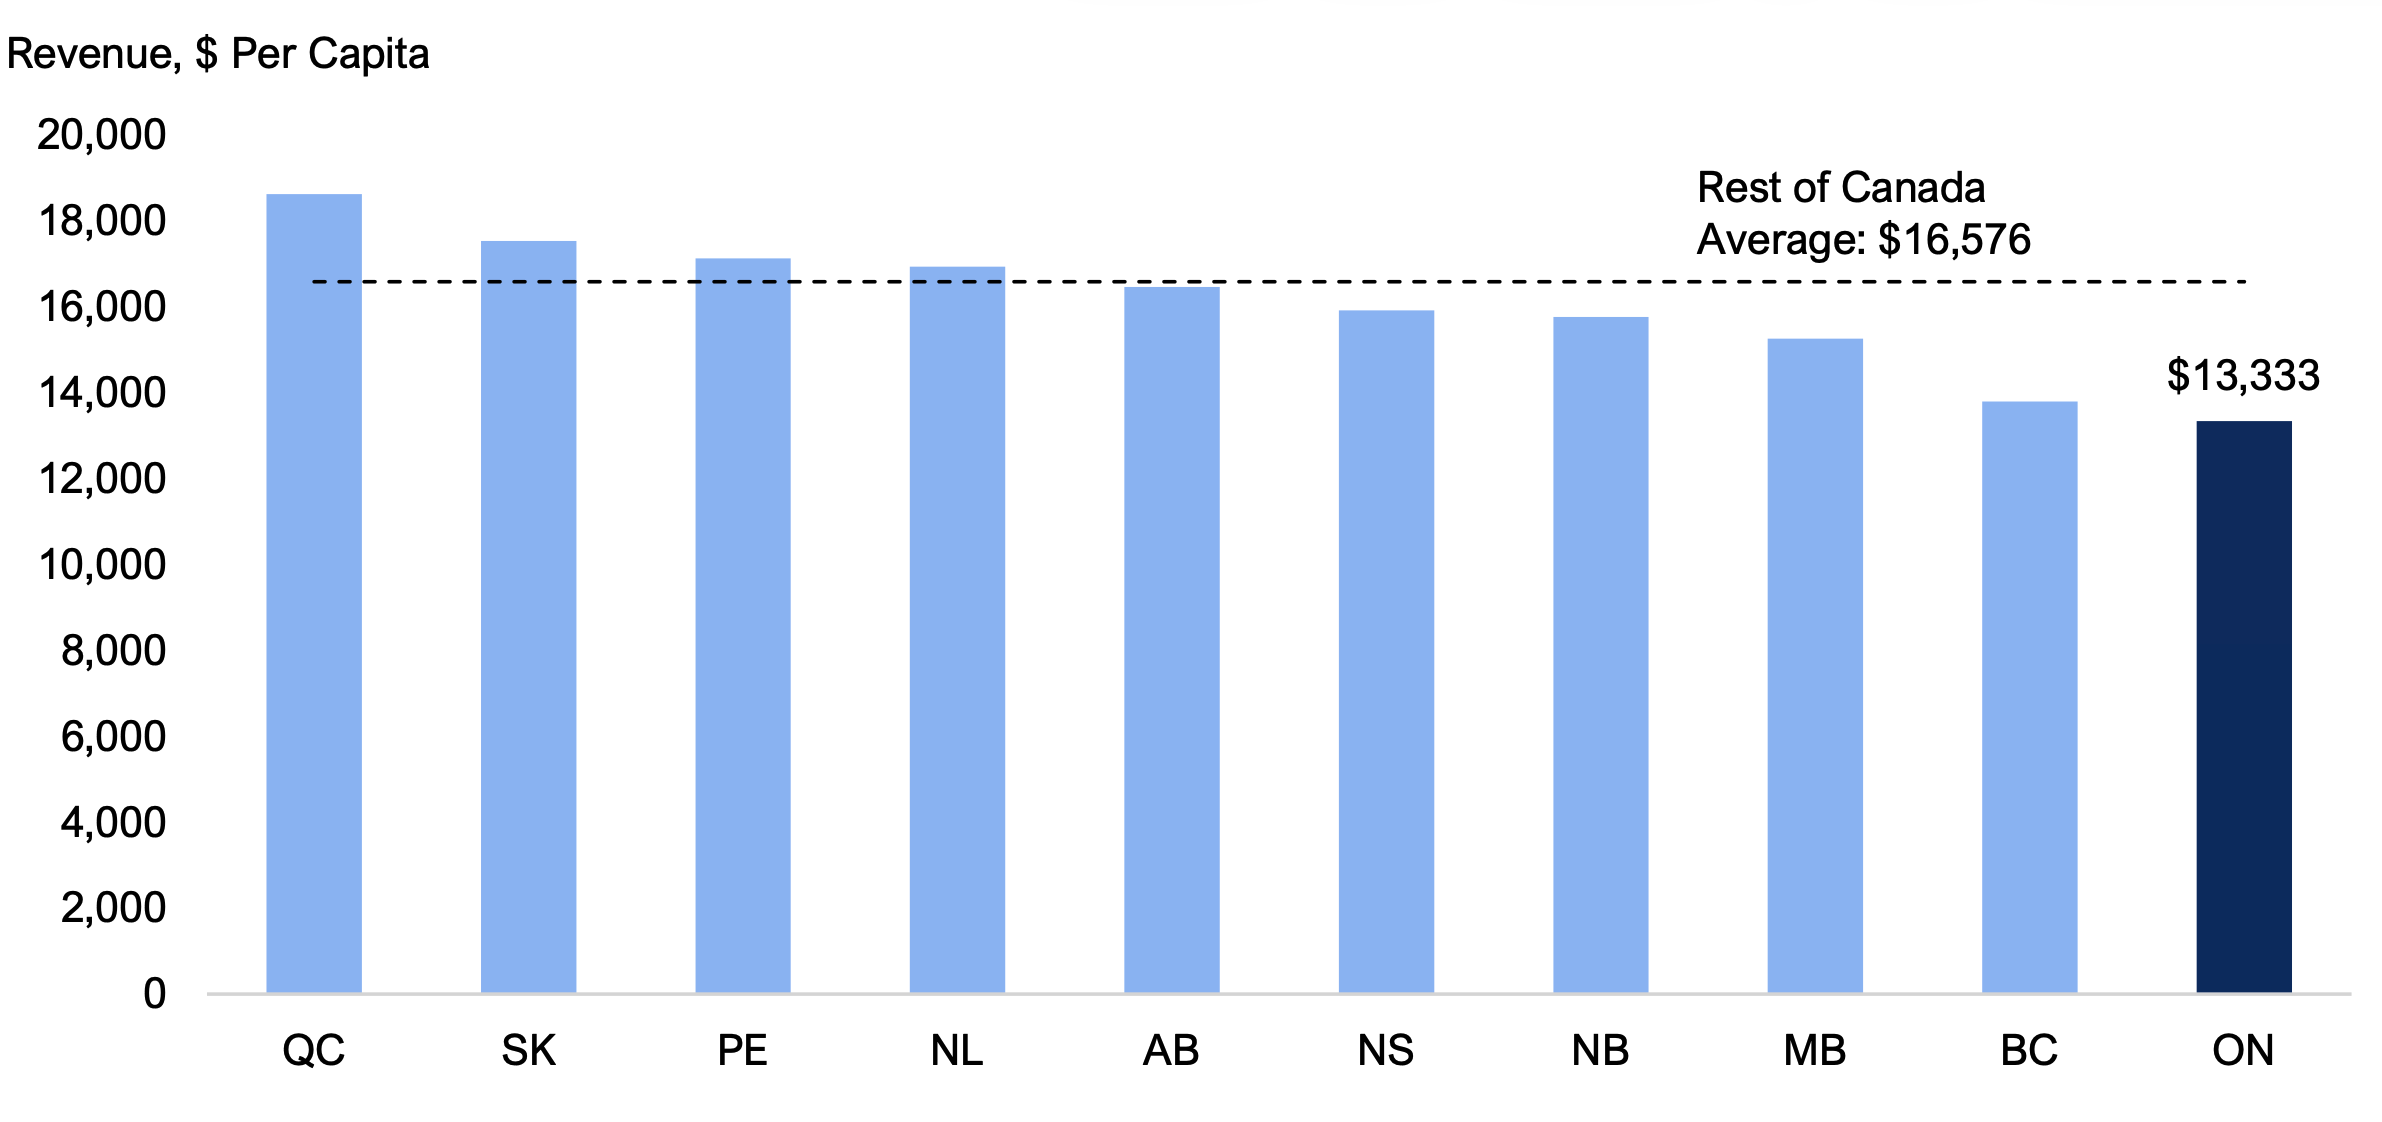
- In 2024-25, Ontario generated $13,333 in total revenue per capita, the lowest among the provinces and $3,244 (19.6 per cent) below the rest of Canada average ($16,576 per capita).
- Since 2008-09, Ontario has collected the lowest or second lowest revenue per capita among the provinces.
- Ontario’s low revenue per capita relative to the rest of Canada reflects Ontario’s below-average federal transfers and other non-tax revenue.
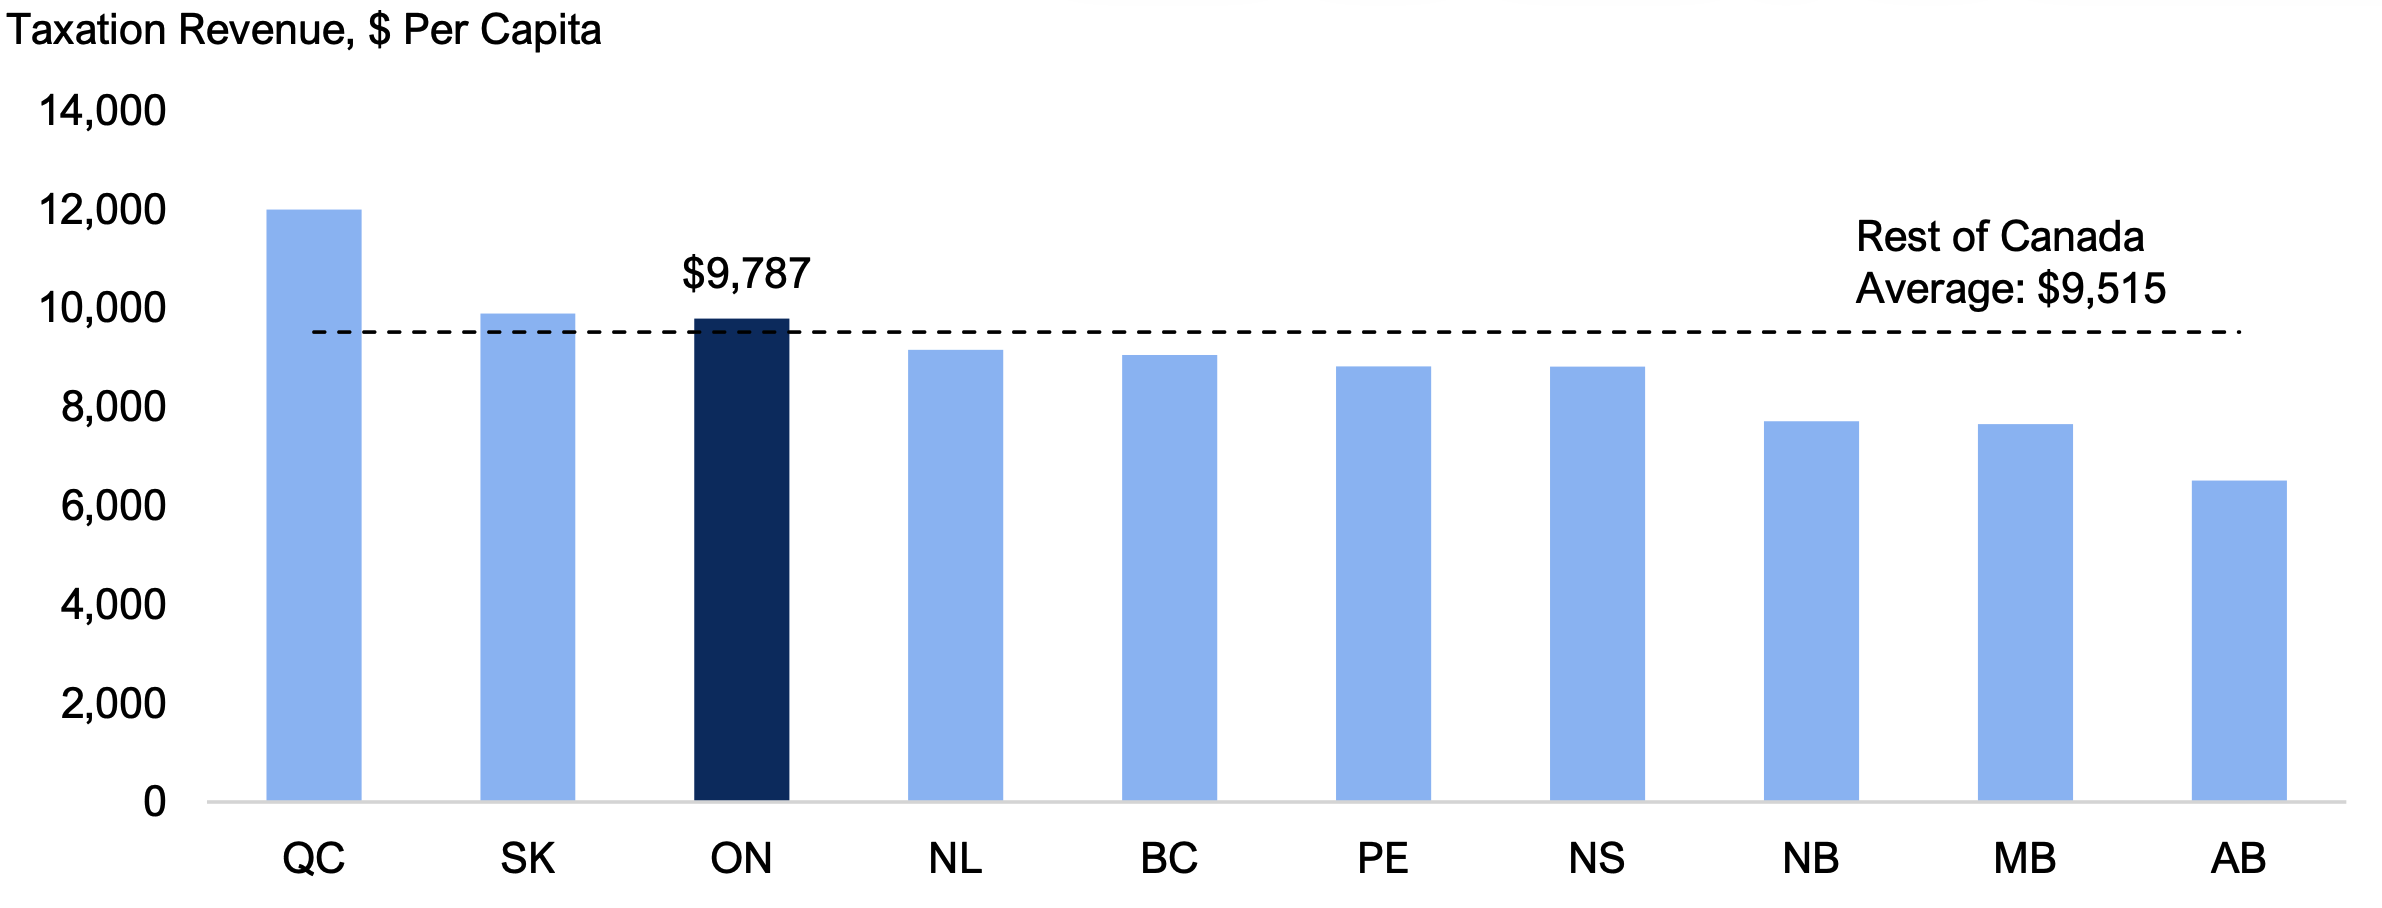
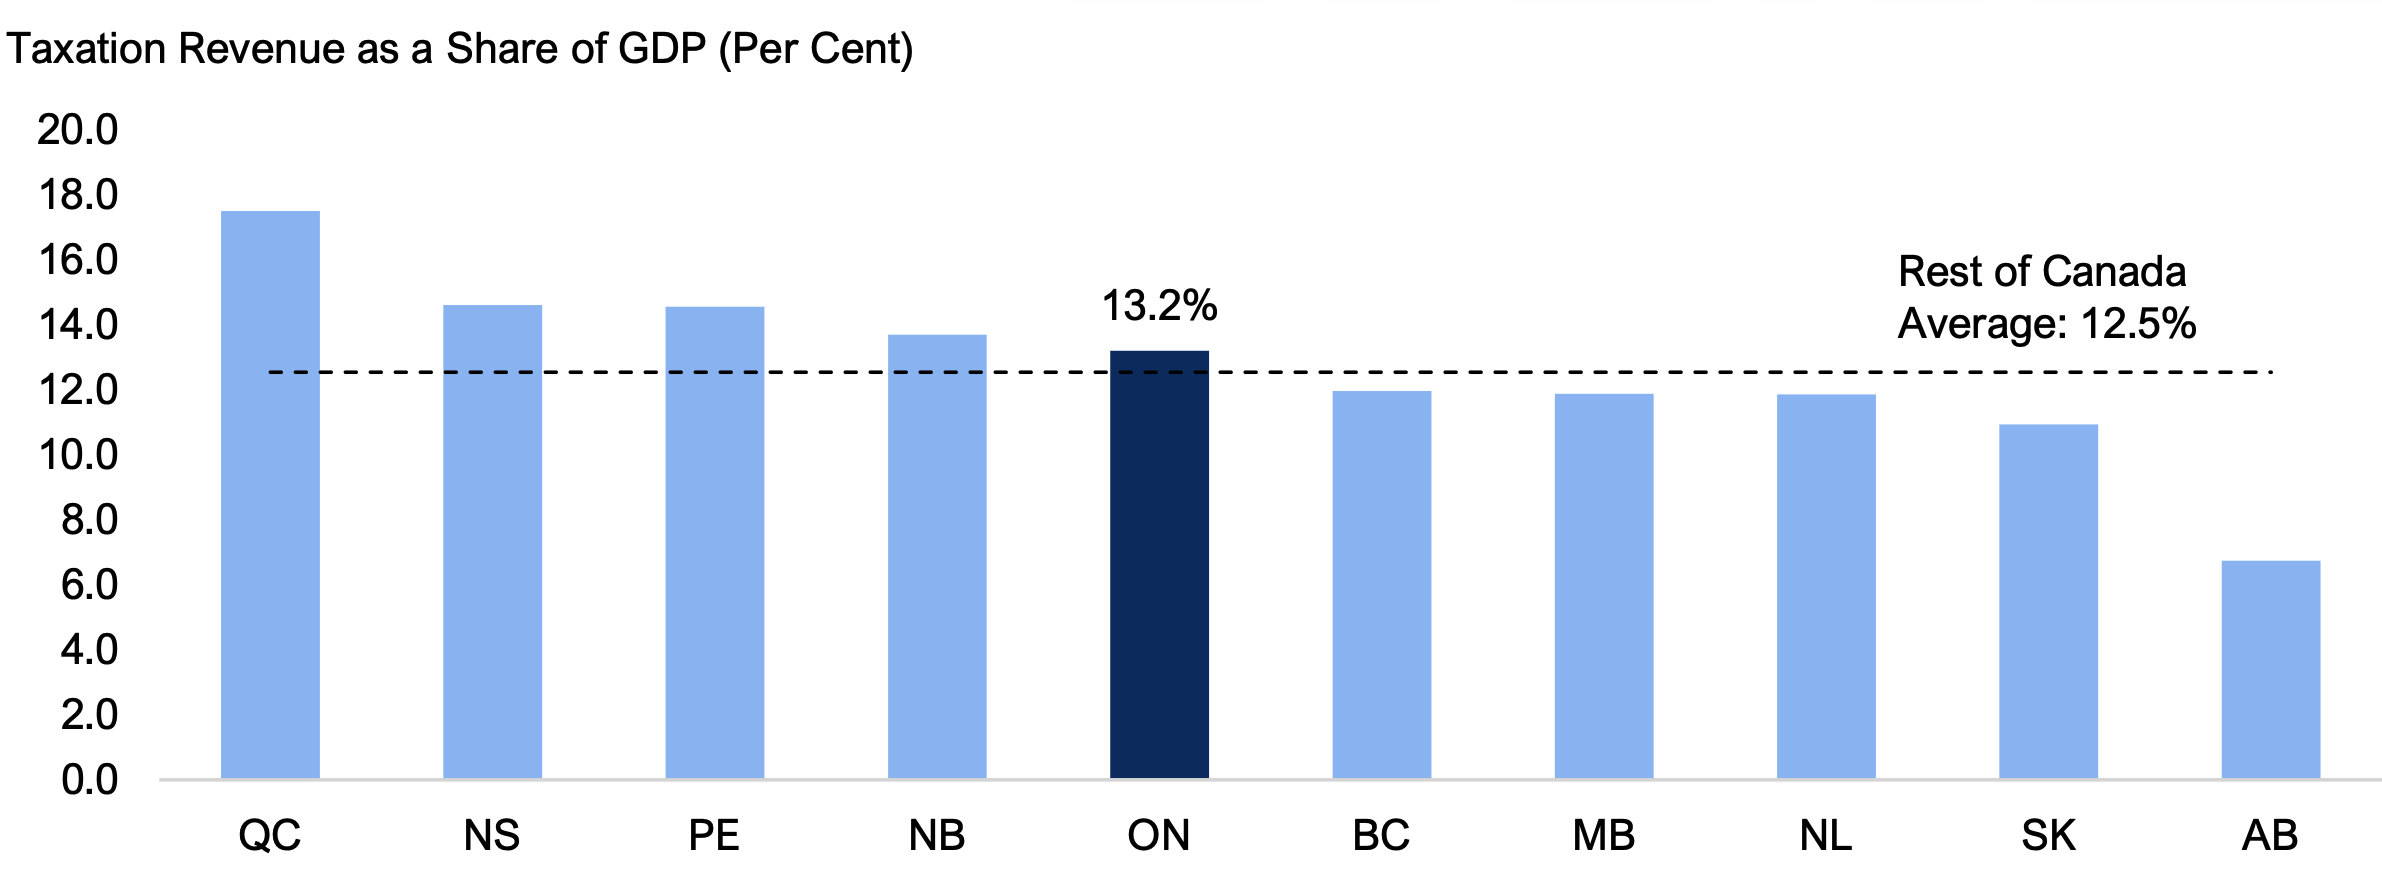
- Ontario received $9,787 per capita in taxation revenue in 2024-25, $273 (2.9 per cent) above the rest of Canada average of $9,515 per capita. Measured against each province’s GDP, Ontario’s taxation revenue (13.2 per cent of GDP) was also above the rest of Canada average (12.5 per cent of GDP).
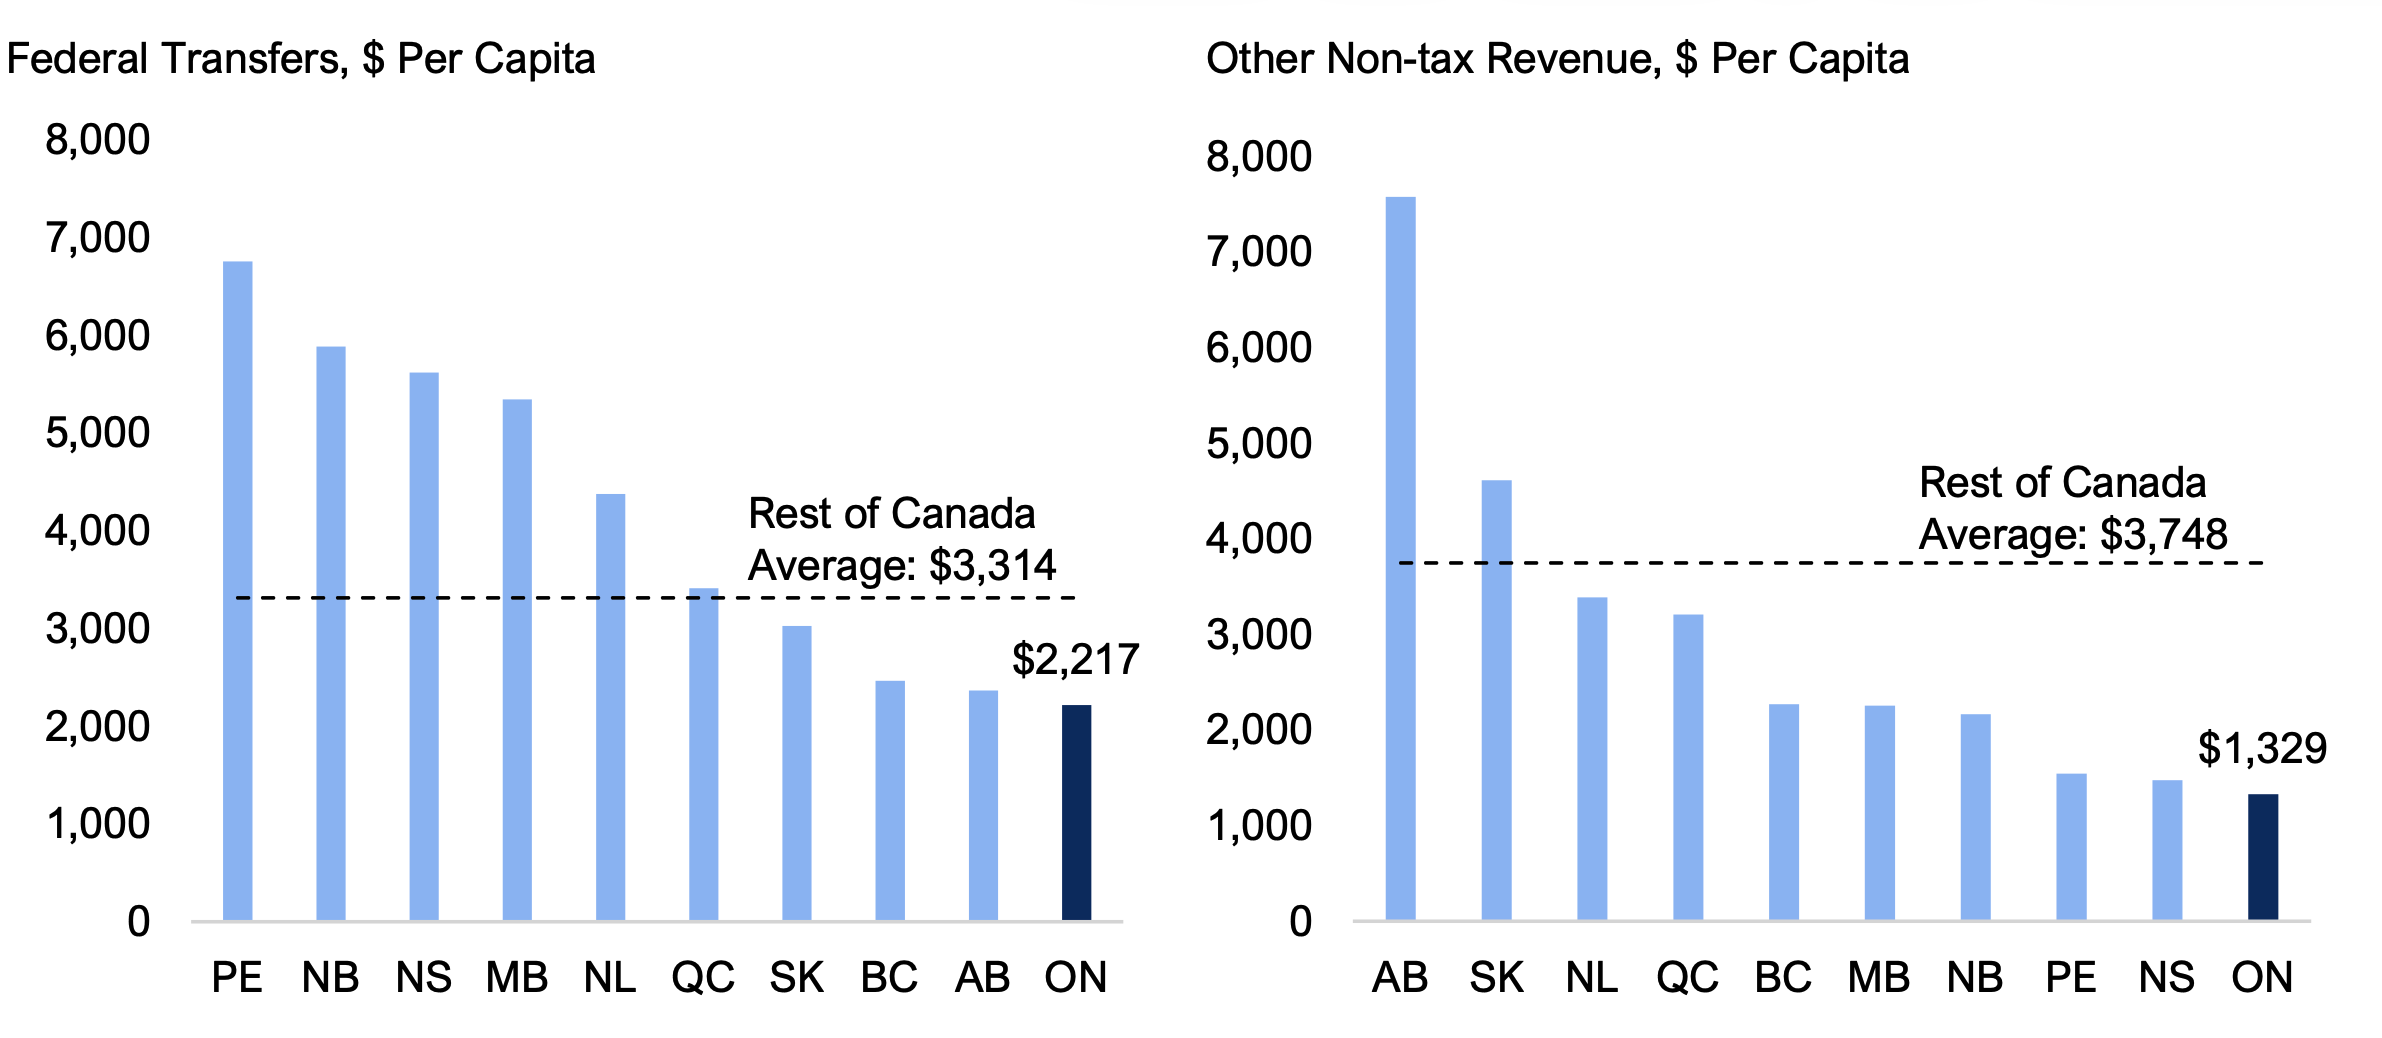
- Ontario received $2,217 per capita in federal transfers in 2024-25, the lowest among the provinces and $1,097 (33.1 per cent) below the rest of Canada average ($3,314 per capita).
- Ontario received $1,329 per capita in other non-tax revenue in 2024-25, the lowest among the provinces and $2,419 (64.5 per cent) below the rest of Canada average ($3,748 per capita).
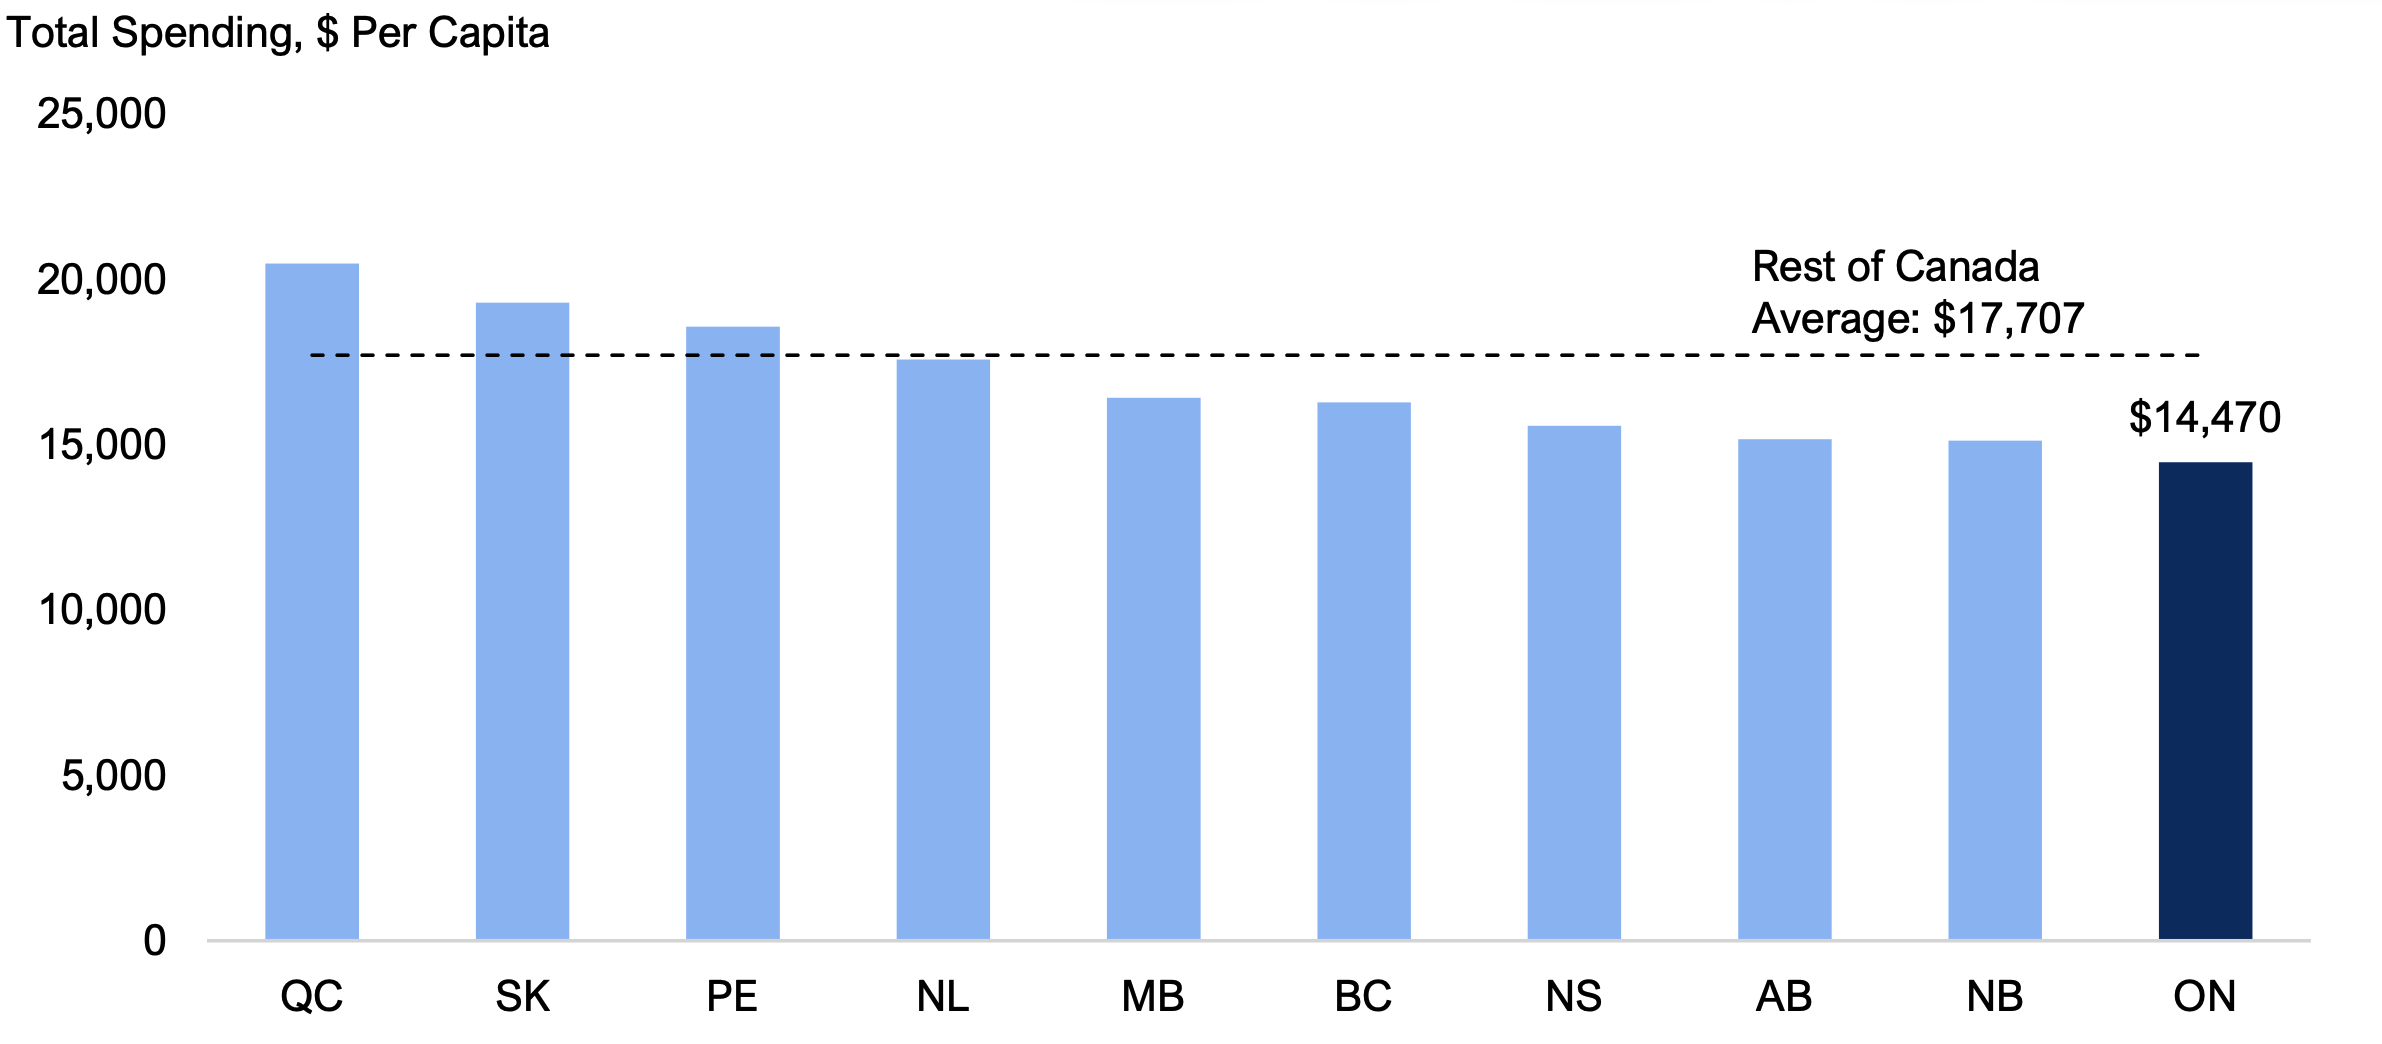
Ontario’s total spending per capita was the lowest in Canada
- In 2024-25, total spending per capita in Ontario was $14,470, the lowest among the provinces and $3,238 (18.3 per cent) below the rest of Canada average ($17,707 per capita).
- Since 2008-09, Ontario’s total spending per capita has ranked the lowest or second lowest among the provinces with the exception of 2010-11 (ranked third lowest).
- Ontario’s relatively low level of total spending per capita reflects its low program spending per capita and below-average interest on debt payments per capita.
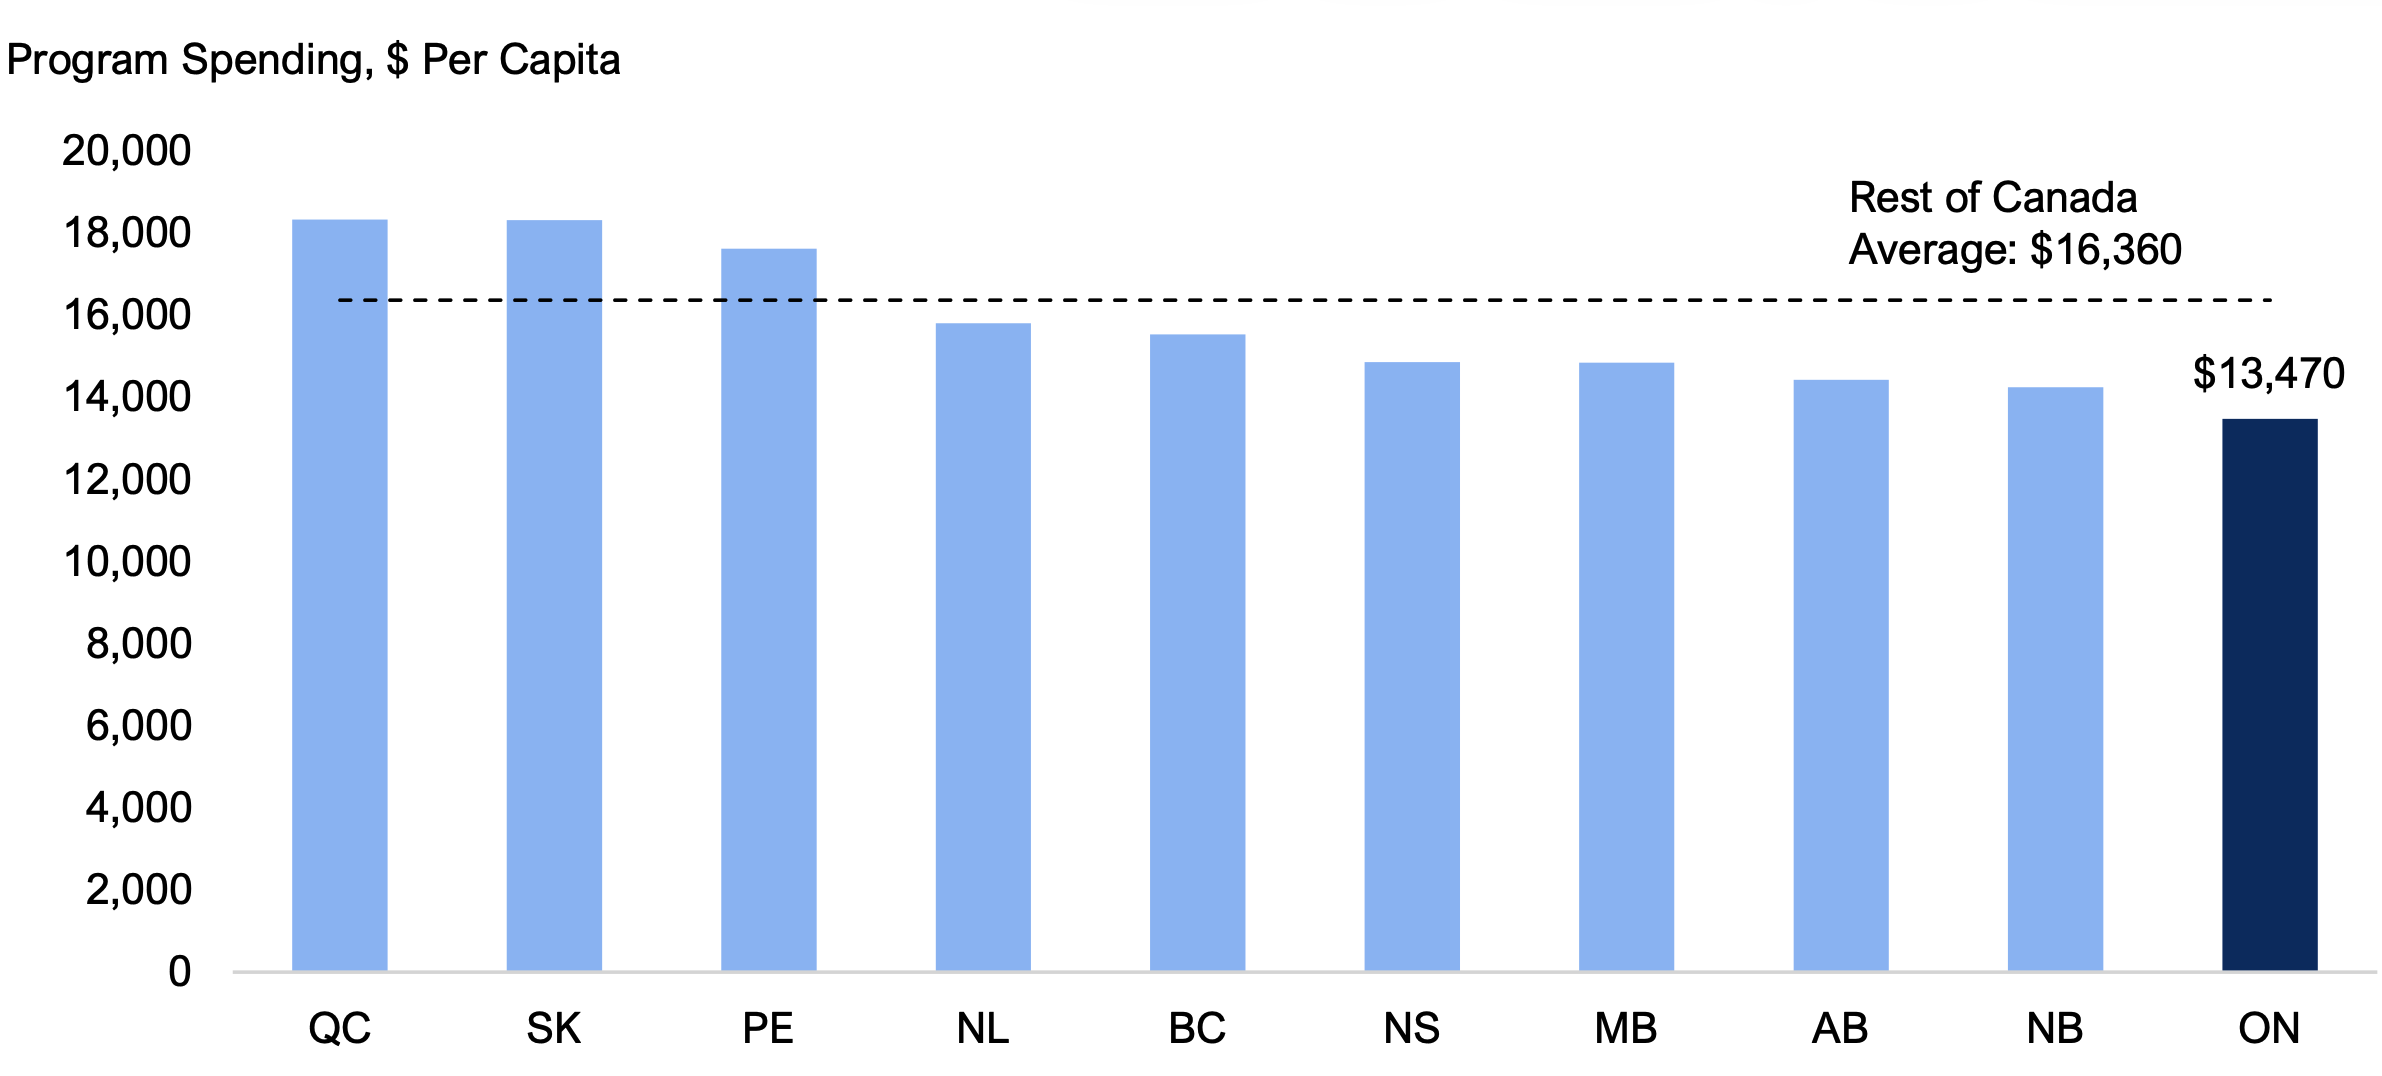
- Ontario’s program spending of $13,470 per capita in 2024-25 was the lowest among the provinces and $2,889 (17.7 per cent) lower than the rest of Canada average ($16,360 per capita). Measured against each province’s GDP, Ontario’s program spending (18.2 per cent of GDP) was the second lowest among the provinces and below the 21.6 per cent average for the rest of Canada.
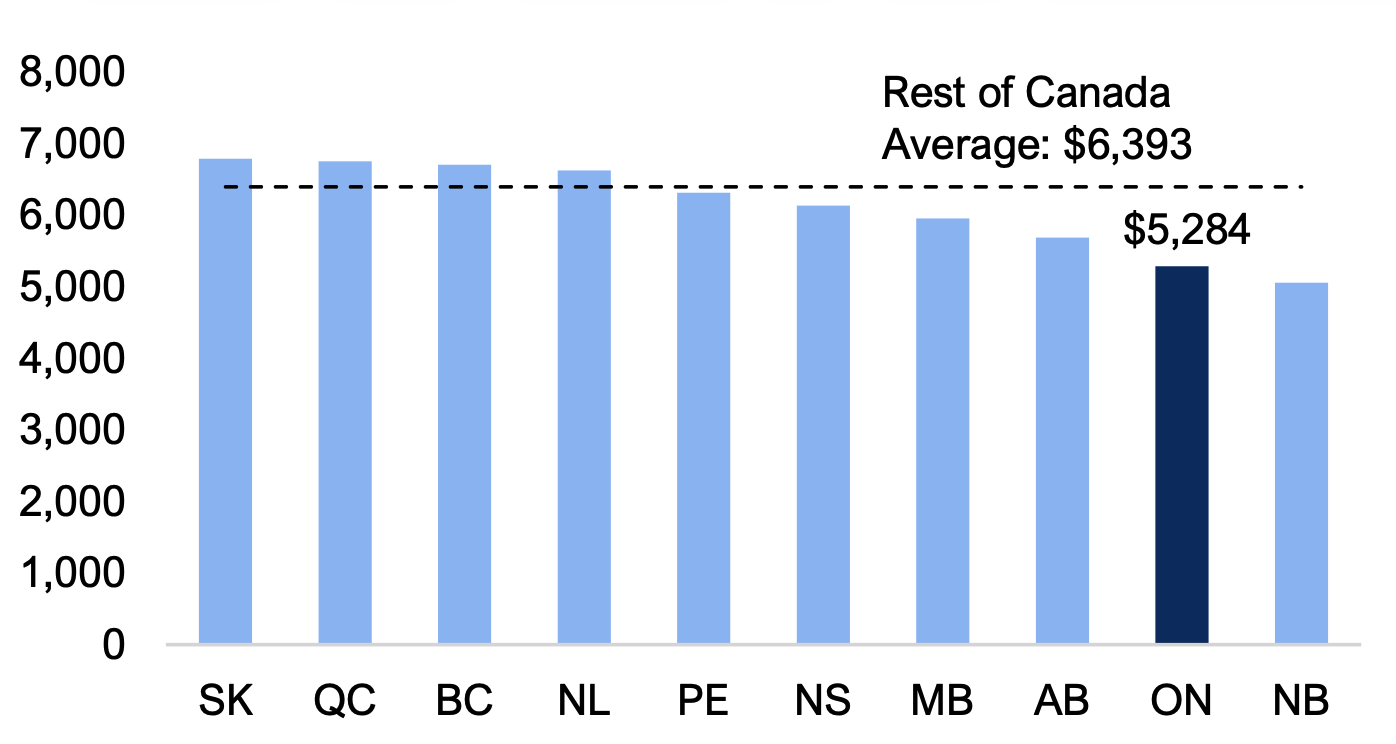
- Health spending per capita in Ontario was $5,284 in 2024-25, the second lowest among the provinces and $1,109 (17.4 per cent) below the rest of Canada average.
- Education spending, which includes spending on primary, secondary and postsecondary education programs, was $3,085 per capita in Ontario in 2024-25, the fourth highest among the provinces but $21 (0.7 per cent) below the rest of Canada average.
- All other program spending per capita in Ontario was $5,101 in 2024-25, the lowest among the provinces and $1,760 (25.6 per cent) below the rest of Canada average.
- Ontario’s interest on debt payments were $1,000 per capita in 2024-25, the fourth highest among the provinces but $348 (25.8 per cent) below the rest of Canada average ($1,348 per capita).
- Ontario’s program spending of $13,470 per capita in 2024-25 was the lowest among the provinces and $2,889 (17.7 per cent) lower than the rest of Canada average ($16,360 per capita). Measured against each province’s GDP, Ontario’s program spending (18.2 per cent of GDP) was the second lowest among the provinces and below the 21.6 per cent average for the rest of Canada.
Introduction
This report compares Government of Ontario financial statistics against the other Canadian provinces based on Statistics Canada’s Government Finance Statistics (GFS).[2] The GFS data, published since 2008-09,[3] adjust for differences in each province’s organizational structure and accounting practices, providing a standardized framework for comparing provincial budgetary results.[4]
This report reviews financial information for the 2024-25 fiscal year and provides interprovincial comparisons for:
- net operating balance and net financial worth;
- revenue, including taxation revenue, federal transfers and other non-tax revenue; and
- spending, including program spending (health, education and all other program spending) and interest on debt payments.
Notably, GFS data are prepared by Statistics Canada on a different basis than provincial Public Accounts. To improve comparability among the provinces and with the Public Accounts of Ontario, the FAO has made a limited number of adjustments to the GFS data. See Appendix A for more information.
Data in this report are presented primarily on a per capita basis to account for the impact of the size of each province’s population on financial results. Appendix B summarizes the per capita results shown throughout this report as well as financial results as a share of economic activity.
Appendix C combines the financial results of the provincial governments presented in Appendix B with the financial results of municipal and local governments, health and social service institutions, school boards, colleges and universities, among others. On this basis, Ontario’s relative financial performance compared to other provinces is similar to its provincial performance presented throughout this report.
Net Operating Balance
Ontario’s net operating balance, the difference between total revenue and total spending, was a $1,137 deficit per person in 2024-25. This was similar ($6 larger) to the rest of Canada average[5] of a net operating deficit of $1,131 per capita and the sixth highest deficit among the provinces. Only three provinces – Alberta, New Brunswick and Nova Scotia – recorded net operating surpluses in 2024-25.
Figure 1 Ontario’s net operating balance was near the rest of Canada average in 2024-25
Source: FAO analysis based on data from Statistics Canada Tables 10-10-0017-01,17-10-0005-01.
Accessible version
| Net Operating Balance, $ Per Capita | ||
|---|---|---|
| Province | Net Operating Balance, $ Per Capita | Rest of Canada Average |
| AB | 1,287 | -1,131 |
| NB | 631 | -1,131 |
| NS | 338 | -1,131 |
| NL | -656 | -1,131 |
| ON | -1,137 | -1,131 |
| MB | -1,169 | -1,131 |
| PE | -1,452 | -1,131 |
| SK | -1,772 | -1,131 |
| QC | -1,864 | -1,131 |
| BC | -2,493 | -1,131 |
Net Financial Worth
Ontario’s net financial worth, the difference between financial assets and financial liabilities, was -$19,667 per person in 2024-25, the lowest among the provinces and $10,693 (119.2 per cent) below the rest of Canada average (-$8,973 per capita). Since 2009-10, Ontario has had the lowest or second lowest net financial worth per capita among the provinces.
Figure 2 Ontario’s net financial worth per capita was the lowest among the provinces in 2024-25
Source: FAO analysis based on data from Statistics Canada Tables 10-10-0017-01,17-10-0005-01.
Accessible version
| Net Financial Worth, $ Per Capita | ||
|---|---|---|
| Province | Net Financial Worth, $ Per Capita | Rest of Canada Average |
| AB | -2,601 | -8,973 |
| BC | -6,617 | -8,973 |
| NB | -7,433 | -8,973 |
| SK | -8,442 | -8,973 |
| NS | -11,242 | -8,973 |
| QC | -11,898 | -8,973 |
| PE | -12,971 | -8,973 |
| MB | -16,939 | -8,973 |
| NL | -18,602 | -8,973 |
| ON | -19,667 | -8,973 |
When measured against each province’s Gross Domestic Product (GDP), which is the broadest measure of the tax base, Ontario’s net financial worth represented -26.5 per cent of GDP in 2024-25, the lowest among the provinces and 14.7 percentage points below the rest of Canada average (-11.8 per cent).
Figure 3 Ontario’s net financial worth as a share of GDP was the lowest among the provinces in 2024-25
Source: FAO analysis based on data from Statistics Canada Tables 10-10-0017-01, 36-10-0222-01.
Accessible version
| Net Financial Worth as a Share of GDP (Per Cent) | ||
|---|---|---|
| Province | Net Financial Worth as a Share of GDP (Per Cent) | Rest of Canada Average |
| AB | -2.7 | -11.8 |
| BC | -8.7 | -11.8 |
| SK | -9.3 | -11.8 |
| NB | -13.2 | -11.8 |
| QC | -17.4 | -11.8 |
| NS | -18.6 | -11.8 |
| PE | -21.4 | -11.8 |
| NL | -24.1 | -11.8 |
| MB | -26.3 | -11.8 |
| ON | -26.5 | -11.8 |
Revenue
Canadian provinces receive revenue from taxation, federal transfers and other non-tax sources. In 2024‑25, Ontario generated $13,333 in total revenue per capita, the lowest amount among the provinces and $3,244 (19.6 per cent) below the average for the rest of Canada ($16,576 per capita). Ontario’s low revenue per capita relative to the rest of Canada reflects Ontario’s below-average federal transfers and other non-tax revenue. Since 2008-09, Ontario has collected the lowest or second lowest total revenue per capita among the provinces.
Figure 4 Ontario’s revenue per capita was the lowest in Canada in 2024-25
Source: FAO analysis based on data from Statistics Canada Tables 10-10-0017-01, 17-10-0005-01, 10-10-0019-01, 37-10-0028-01, 37-10-0026-01.
Accessible version
| Revenue, $ Per Capita | ||
|---|---|---|
| Province | Revenue, $ Per Capita | Rest of Canada Average |
| QC | 18,618 | 16,576 |
| SK | 17,527 | 16,576 |
| PE | 17,121 | 16,576 |
| NL | 16,924 | 16,576 |
| AB | 16,452 | 16,576 |
| NS | 15,910 | 16,576 |
| NB | 15,758 | 16,576 |
| MB | 15,250 | 16,576 |
| BC | 13,787 | 16,576 |
| ON | 13,333 | 16,576 |
Taxation revenue
Ontario received $9,787 in taxation revenue per capita in 2024-25. This was the third highest among the provinces and $273 (2.9 per cent) above the rest of Canada average of $9,515. Quebec collected the highest taxation revenue per capita ($11,997), while Alberta collected the lowest ($6,509).
Figure 5 Ontario’s taxation revenue per capita was above the rest of Canada average in 2024-25
Source: FAO analysis based on data from Statistics Canada Tables 10-10-0017-01, 17-10-0005-01, 10-10-0019-01.
Accessible version
| Tax Revenue, $ Per Capita | ||
|---|---|---|
| Province | Tax Revenue, $ Per Capita | Rest of Canada Average |
| QC | 11,997 | 9,515 |
| SK | 9,887 | 9,515 |
| ON | 9,787 | 9,515 |
| NL | 9,158 | 9,515 |
| BC | 9,051 | 9,515 |
| PE | 8,820 | 9,515 |
| NS | 8,815 | 9,515 |
| NB | 7,707 | 9,515 |
| MB | 7,651 | 9,515 |
| AB | 6,509 | 9,515 |
When measured against each province’s GDP, Ontario’s taxation revenue represented 13.2 per cent of GDP in 2024-25. This was fifth highest among the provinces and above the 12.5 per cent average for the rest of Canada. On this basis, Ontario’s taxation revenue was 4.3 percentage points below Quebec (the highest ranked province at 17.5 per cent of GDP) and 6.5 percentage points above Alberta (the lowest ranked province at 6.7 per cent of GDP).
Figure 6 Ontario’s taxation revenue as a share of GDP was above the rest of Canada average in 2024-25
Source: FAO analysis based on data from Statistics Canada Tables 10-10-0017-01, 36-10-0222-01, 10-10-0019-01.
Accessible version
| Tax Revenue as a Share of GDP (Per Cent) | ||
|---|---|---|
| Province | Tax Revenue as a Share of GDP (Per Cent) | Rest of Canada Average |
| QC | 17.5 | 12.5 |
| NS | 14.6 | 12.5 |
| PE | 14.6 | 12.5 |
| NB | 13.7 | 12.5 |
| ON | 13.2 | 12.5 |
| BC | 12.0 | 12.5 |
| MB | 11.9 | 12.5 |
| NL | 11.9 | 12.5 |
| SK | 10.9 | 12.5 |
| AB | 6.7 | 12.5 |
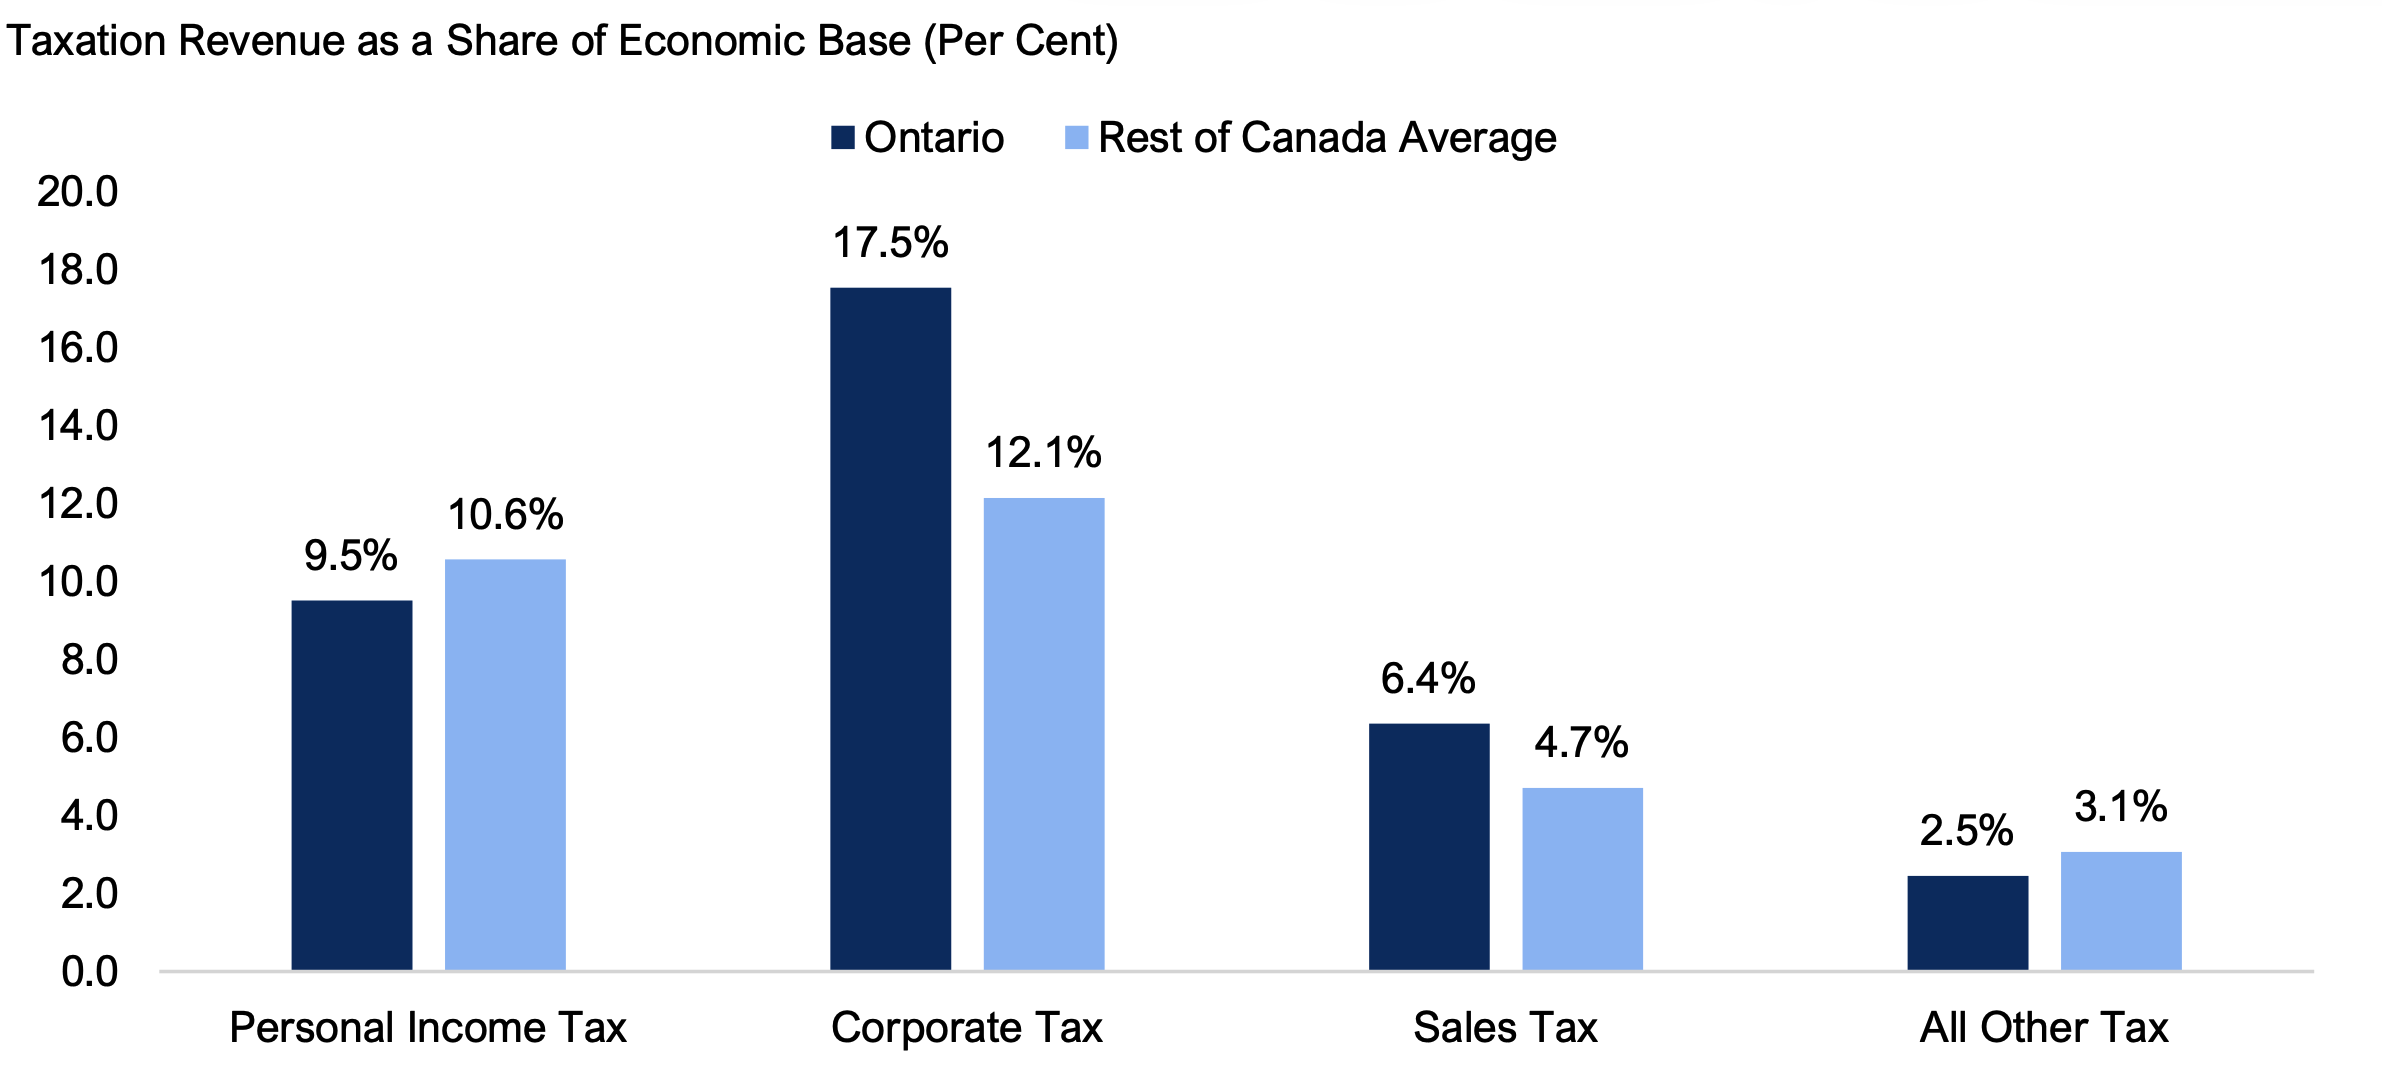
Dividing taxation revenue categories by their corresponding economic bases provides an indication of the amount of taxation revenue collected relative to economic activity. The economic bases of personal income tax, corporate tax and sales tax revenues are labour income, corporate profits and household spending, respectively.[6] While these economic bases are not complete measures of the actual tax base, they can be used as proxies to evaluate each province on a common basis.[7]
- Personal income tax revenue equalled 9.5 per cent of labour income in Ontario in 2024-25, the fifth highest among the provinces and below the rest of Canada average of 10.6 per cent.
- Corporate tax revenue equalled 17.5 per cent of corporate profits in Ontario, the fourth highest among the provinces and higher than the rest of Canada average of 12.1 per cent.
- Sales tax revenue equalled 6.4 per cent of household spending in Ontario, the sixth highest among the provinces and above the rest of Canada average of 4.7 per cent.
- All other tax revenue equalled 2.5 per cent of GDP[8] in Ontario, the sixth highest among the provinces and below the rest of Canada average of 3.1 per cent.
Figure 7 Ontario’s taxation revenue as a share of economic bases compared to the rest of Canada average in 2024‑25
Note: The economic bases of personal income tax, corporate tax and sales tax revenues are labour income (total compensation of employees), corporate profits (net operating surplus of corporations) and household spending (household final consumption expenditure), respectively. All other tax revenue is compared against the overall tax base as measured by GDP.
Source: FAO analysis based on data from Statistics Canada Tables 10-10-0017-01, 36-10-0221-01, 36-10-0222-01, 10-10-0019-01.
Accessible version
| Tax Revenue as a Share of Economic Base (Per Cent) | ||
|---|---|---|
| Tax Revenue Category | Ontario | Rest of Canada Average |
| Personal Income Tax | 9.5 | 10.6 |
| Corporations Tax | 17.5 | 12.1 |
| Sales Tax | 6.4 | 4.7 |
| All Other Tax | 2.5 | 3.1 |
Although these shares vary over time, since 2008-09, Ontario’s tax revenues as shares of its economic base for personal income tax and all other tax have generally been below the rest of Canada average, while corporate tax and sales tax shares have generally been above the rest of Canada average.
Federal transfers and other non-tax revenues
Provincial governments receive transfers from the federal government through the Canada Health Transfer, Canada Social Transfer, the Equalization Program and other federal transfer programs, including those for infrastructure and labour market programs. In 2024-25, Ontario received $2,217 per capita in federal transfers, the lowest among the provinces and $1,097 (33.1 per cent) below the rest of Canada average ($3,314). Ontario’s lower federal transfers in 2024-25 reflect its low level of Equalization Program payments[9] and its below-average revenue from other federal transfer programs.[10]
Provinces also collect revenues from other non-tax sources,[11] such as resource royalties, service fees, dividends, fines and penalties, among others. Ontario collected the lowest amount of other non-tax revenue in the country ($1,329 per capita in Ontario versus $3,748 per capita in the rest of Canada). This difference largely reflects Ontario’s limited resource royalties[12] and lower revenues generated from the Province’s ownership of financial assets and from the sale of goods and services.[13]
Figure 8 Ontario had the lowest federal transfers and other non-tax revenue per capita in 2024-25
Source: FAO analysis based on data from Statistics Canada Tables 10-10-0017-01, 17-10-0005-01, 10-10-0019-01.
Accessible version
| Federal Transfers, $ Per Capita | Other Non-tax Revenue, $ Per Capita | ||||
|---|---|---|---|---|---|
| Province | Federal Transfers, $ Per Capita | Rest of Canada Average | Province | Other Non-tax Revenue, $ Per Capita | Rest of Canada Average |
| PE | 6,755 | 3,314 | AB | 7,578 | 3,748 |
| NB | 5,886 | 3,314 | SK | 4,613 | 3,748 |
| NS | 5,618 | 3,314 | NL | 3,388 | 3,748 |
| MB | 5,344 | 3,314 | QC | 3,207 | 3,748 |
| NL | 4,378 | 3,314 | BC | 2,271 | 3,748 |
| QC | 3,413 | 3,314 | MB | 2,255 | 3,748 |
| SK | 3,027 | 3,314 | NB | 2,165 | 3,748 |
| BC | 2,465 | 3,314 | PE | 1,545 | 3,748 |
| AB | 2,365 | 3,314 | NS | 1,477 | 3,748 |
| ON | 2,217 | 3,314 | ON | 1,329 | 3,748 |
Spending
In 2024-25, total spending per capita in Ontario was $14,470, the lowest among the provinces and $3,238 (18.3 per cent) lower than the rest of Canada average ($17,707 per capita). Ontario’s relatively low level of total spending per capita reflects its low program spending per capita and below-average interest on debt payments per capita. Since 2008-09, Ontario’s total spending per capita has ranked the lowest or second lowest among the provinces with the exception of 2010-11 (ranked third lowest).
Figure 9 Ontario’s total spending per capita was the lowest in Canada in 2024-25
Source: FAO analysis based on data from Statistics Canada Tables 10-10-0017-01, 17-10-0005-01, 10-10-0019-01, 37-10-0028-01, 37‑10‑0026‑01.
Accessible version
| Total Spending, $ Per Capita | ||
|---|---|---|
| Province | Total Spending, $ Per Capita | Rest of Canada Average |
| QC | 20,482 | 17,707 |
| SK | 19,298 | 17,707 |
| PE | 18,573 | 17,707 |
| NL | 17,580 | 17,707 |
| MB | 16,420 | 17,707 |
| BC | 16,280 | 17,707 |
| NS | 15,572 | 17,707 |
| AB | 15,165 | 17,707 |
| NB | 15,127 | 17,707 |
| ON | 14,470 | 17,707 |
Program spending
In 2024-25, program spending per capita in Ontario was $13,470, the lowest among the provinces and $2,889 (17.7 per cent) lower than the average for the rest of Canada ($16,360 per capita). Since 2008-09, Ontario’s program spending per capita has ranked the lowest or second lowest among the provinces with the exception of 2010-11 (ranked third lowest).
Figure 10 Ontario’s program spending per capita was the lowest in Canada in 2024-25
Source: FAO analysis based on data from Statistics Canada Tables 10-10-0017-01,17-10-0005-01, 10-10-0019-01, 37-10-0028-01, 37‑10‑0026-01.
Accessible version
| Program Spending, $ Per Capita | ||
|---|---|---|
| Province | Program Spending, $ Per Capita | Rest of Canada Average |
| QC | 18,319 | 16,360 |
| SK | 18,310 | 16,360 |
| PE | 17,616 | 16,360 |
| NL | 15,799 | 16,360 |
| BC | 15,523 | 16,360 |
| NS | 14,854 | 16,360 |
| MB | 14,838 | 16,360 |
| AB | 14,420 | 16,360 |
| NB | 14,243 | 16,360 |
| ON | 13,470 | 16,360 |
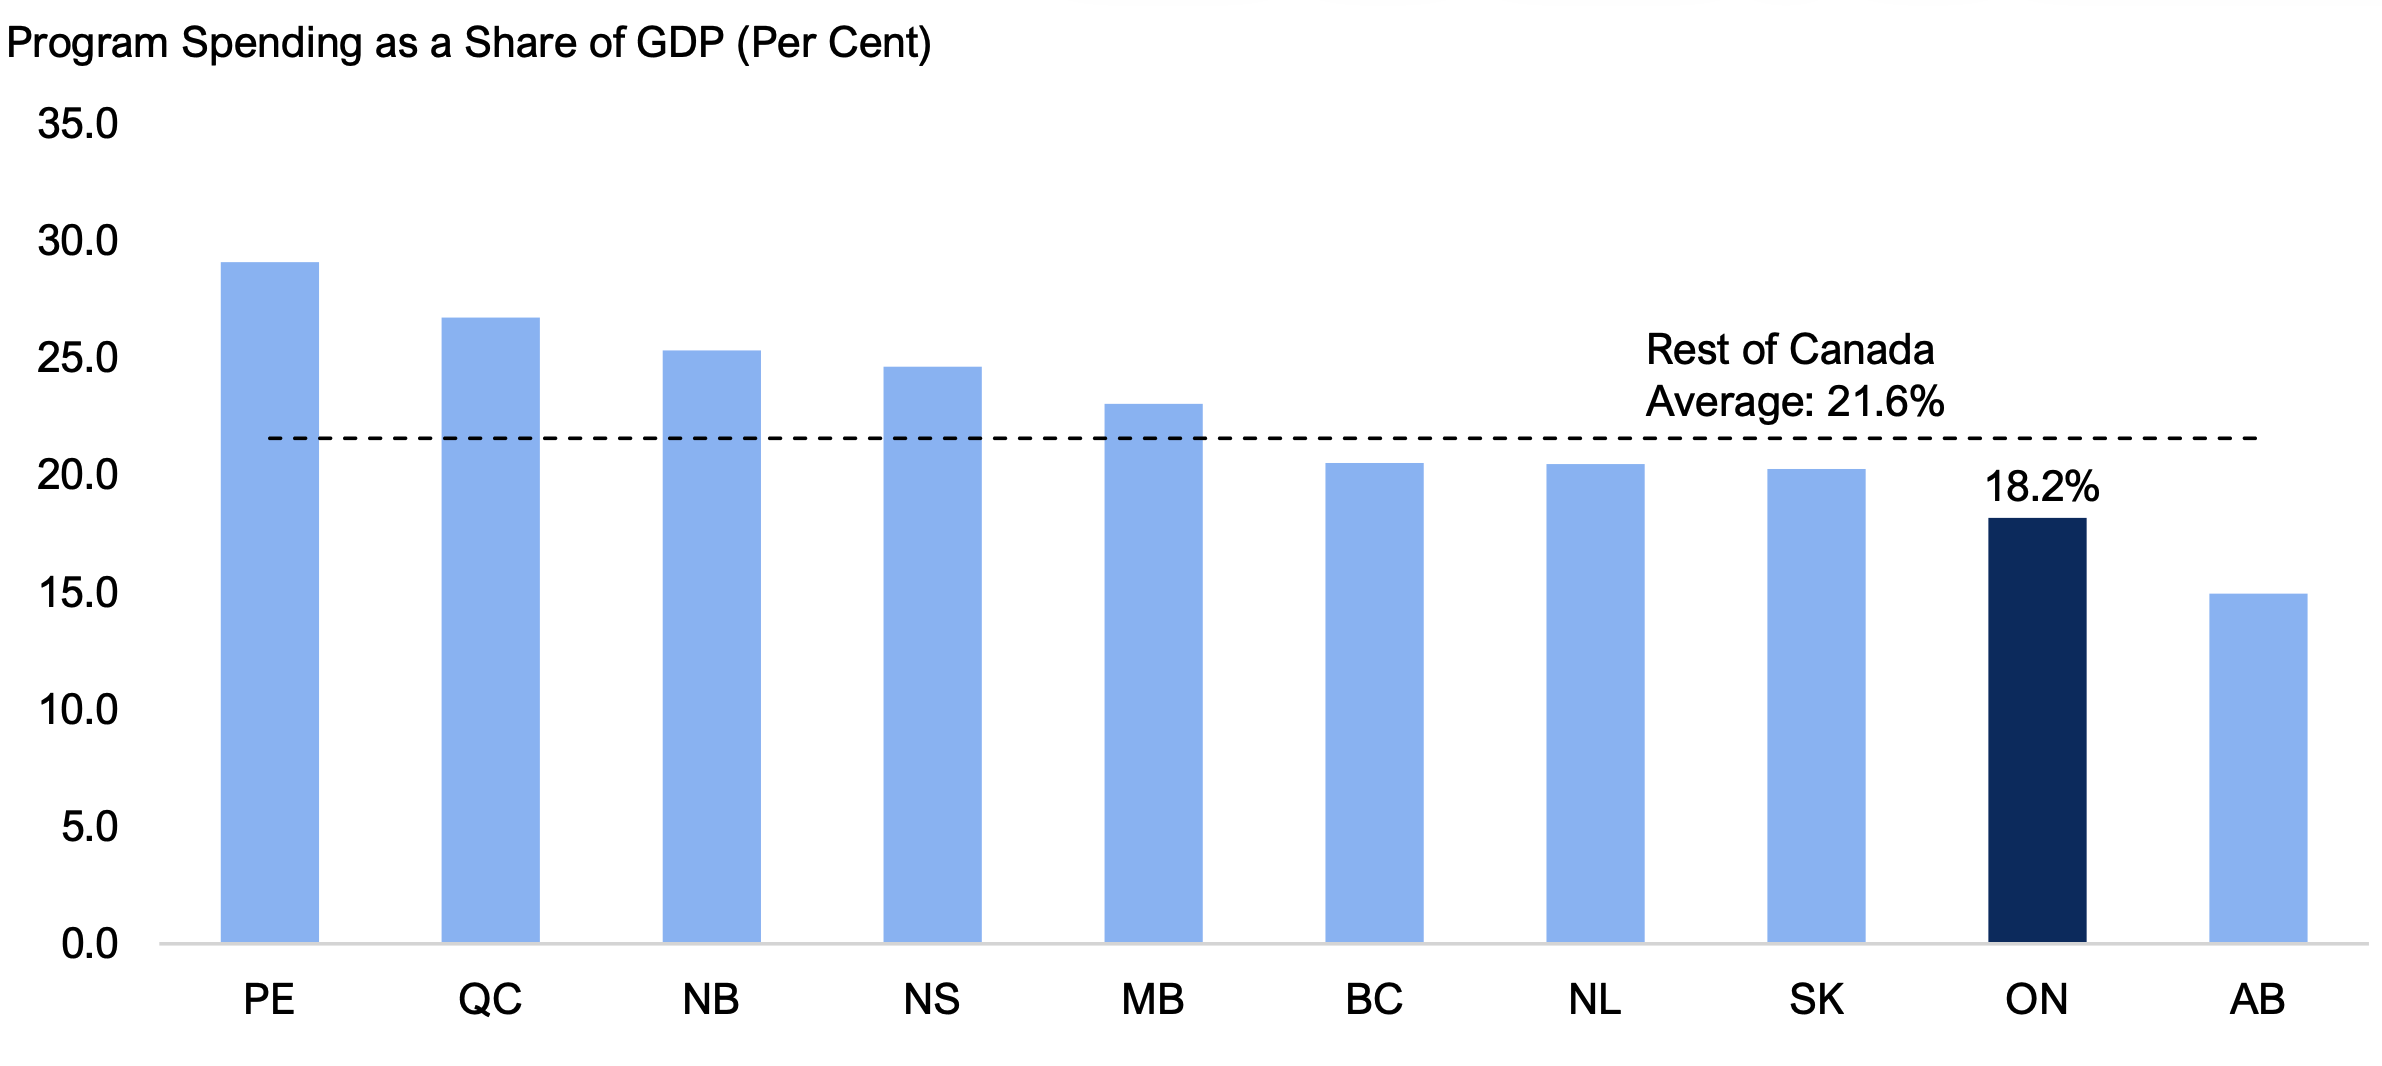
When measured against each province’s Gross Domestic Product (GDP), Ontario’s program spending represented 18.2 per cent of GDP in 2024-25. This was the second lowest among the provinces and below the 21.6 per cent average for the rest of Canada.
Figure 11 Ontario’s program spending as a share of GDP was the second lowest in Canada in 2024-25
Source: FAO analysis based on data from Statistics Canada Tables 10-10-0017-01, 36-10-0222-01, 17-10-0005-01, 10-10-0019-01, 37‑10‑0028-01, 37-10-0026-01.
Accessible version
| Program Spending as a Share of GDP (Per Cent) | ||
|---|---|---|
| Province | Program Spending as a Share of GDP (Per Cent) | Rest of Canada Average |
| PE | 29.1 | 21.6 |
| QC | 26.7 | 21.6 |
| NB | 25.3 | 21.6 |
| NS | 24.6 | 21.6 |
| MB | 23.0 | 21.6 |
| BC | 20.5 | 21.6 |
| NL | 20.5 | 21.6 |
| SK | 20.2 | 21.6 |
| ON | 18.2 | 21.6 |
| AB | 14.9 | 21.6 |
Based on Statistics Canada’s GFS data, the FAO has divided program spending into three categories: health, education and all other program spending.
Health[14]
Figure 12 Health spending per capita in 2024-25
Source: FAO analysis based on data from Statistics Canada Tables 10-10-0024-01, 17-10-0005-01.
Accessible version
| Health Spending, $ Per Capita | ||
|---|---|---|
| Province | Health Spending, $ Per Capita | Rest of Canada Average |
| SK | 6,787 | 6,393 |
| QC | 6,751 | 6,393 |
| BC | 6,701 | 6,393 |
| NL | 6,623 | 6,393 |
| PE | 6,310 | 6,393 |
| NS | 6,132 | 6,393 |
| MB | 5,953 | 6,393 |
| AB | 5,685 | 6,393 |
| ON | 5,284 | 6,393 |
| NB | 5,054 | 6,393 |
- Health spending includes transfer payments to hospitals, outpatient services, drug programs and public health services.[15]
- Health spending per capita in Ontario was $5,284 in 2024-25, the second lowest in Canada and $1,109 (17.4 per cent) below the rest of Canada average.
- Since 2008-09, Ontario’s health spending per capita has ranked first, second or third lowest in Canada.
Education[16]
Figure 13 Education spending per capita in 2024-25
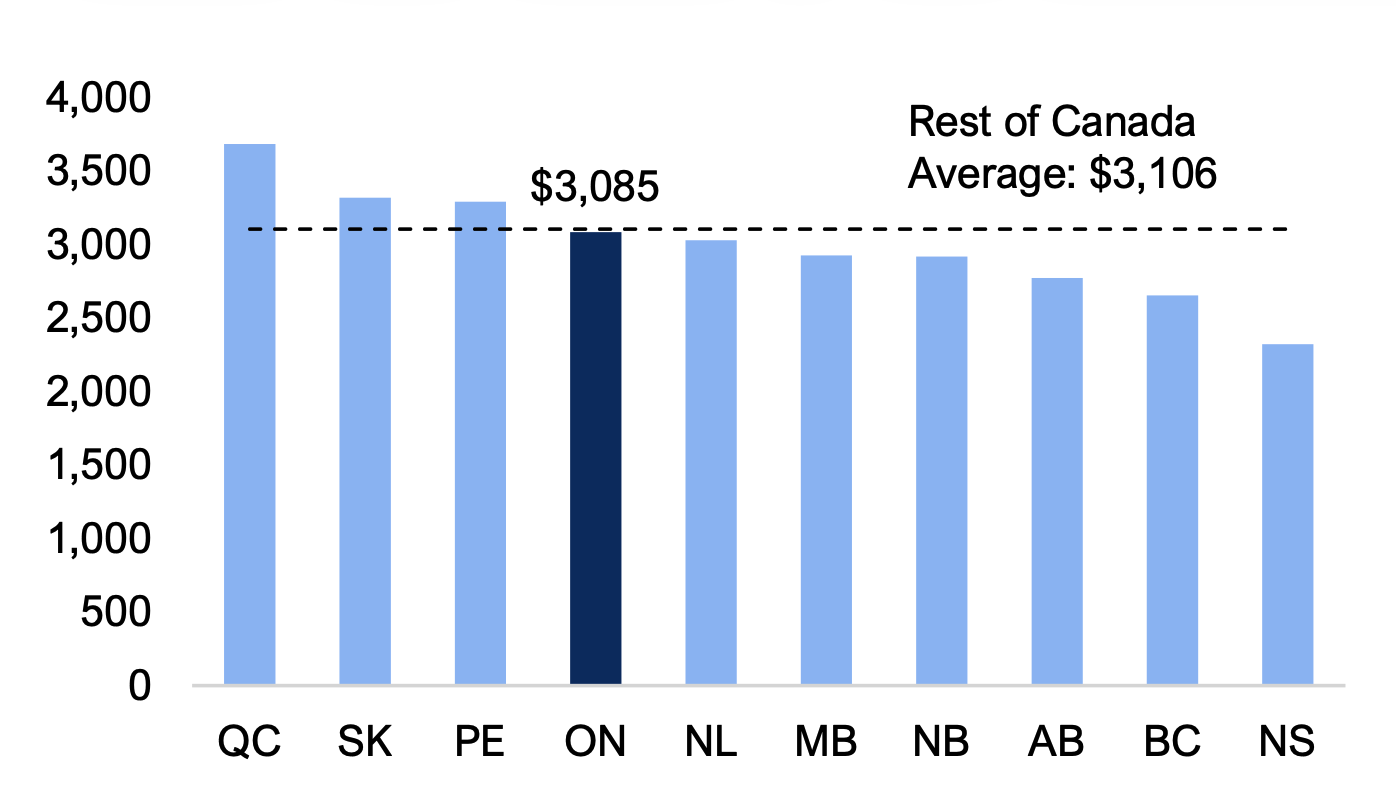
Source: FAO analysis based on data from Statistics Canada Tables 10-10-0024-01, 17-10-0005-01, 10-10-0019-01, 37-10-0028-01, 37-10-0026-01.
Accessible version
| Education Spending, $ Per Capita | ||
|---|---|---|
| Province | Education Spending, $ Per Capita | Rest of Canada Average |
| QC | 3,684 | 3,106 |
| SK | 3,320 | 3,106 |
| PE | 3,293 | 3,106 |
| ON | 3,085 | 3,106 |
| NL | 3,030 | 3,106 |
| MB | 2,928 | 3,106 |
| NB | 2,919 | 3,106 |
| AB | 2,773 | 3,106 |
| BC | 2,654 | 3,106 |
| NS | 2,323 | 3,106 |
- Education spending includes primary, secondary and postsecondary expenses.[17]
- Education spending in Ontario was $3,085 per capita in 2024-25, the fourth highest among the provinces but $21 (0.7 per cent) below the rest of Canada average.
- Since 2010-11, Ontario has had above-average education spending, except in 2024-25 when it fell below the rest of Canada average.
All other program spending
Figure 14 All other program spending per capita in 2024-25
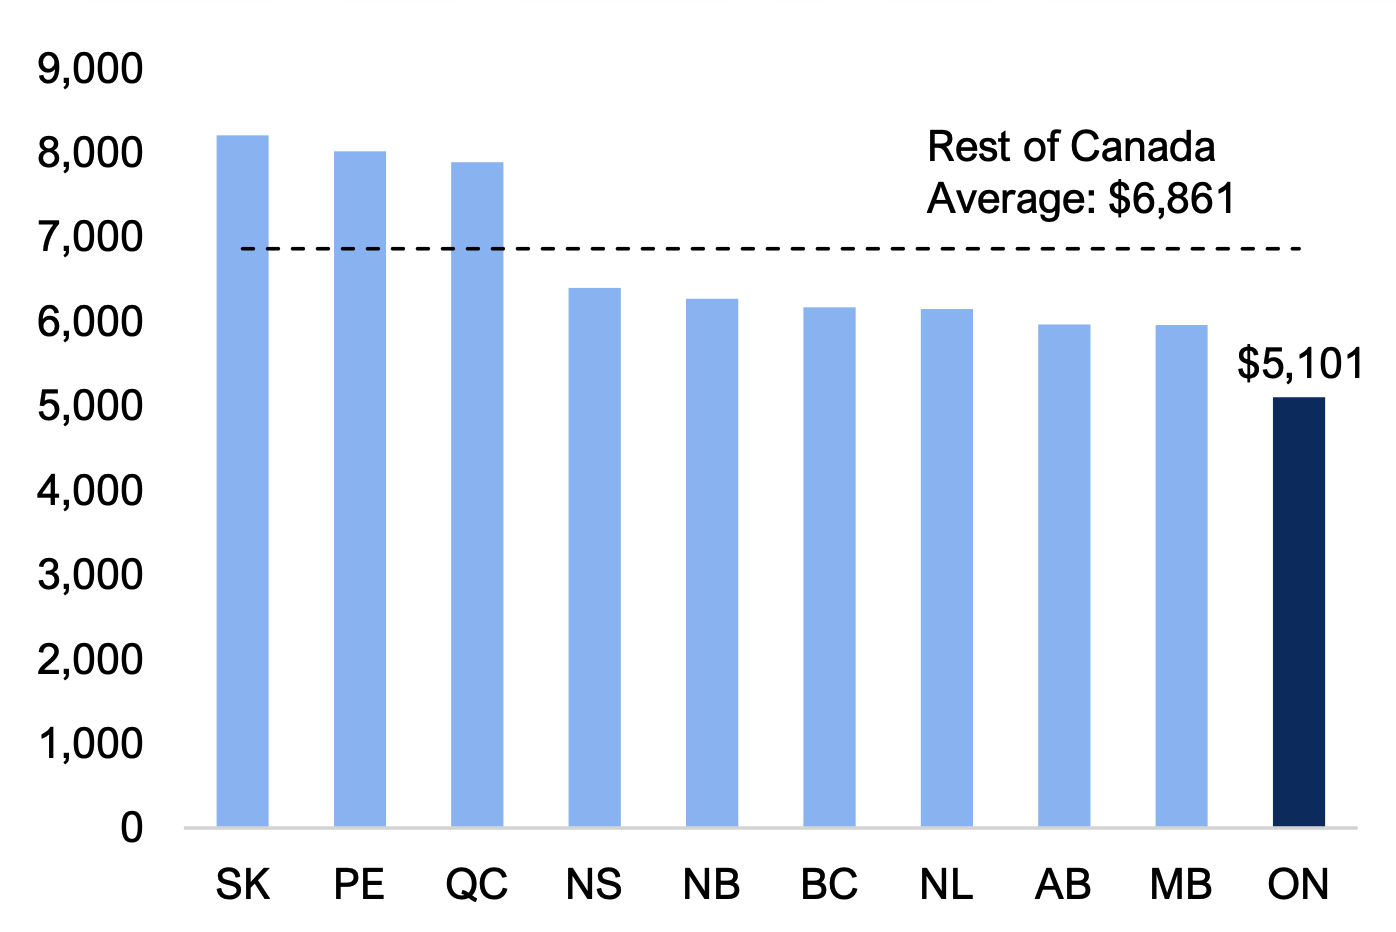
Note: All other program spending is calculated by subtracting health and education spending from total program spending.
Source: FAO analysis based on data from Statistics Canada Tables 10-10-0017-01, 10-10-0024-01, 17-10-0005-01, 10-10-0019-01.
Accessible version
| All Other Program Spending, $ Per Capita | ||
|---|---|---|
| Province | All Other Program Spending, $ Per Capita | Rest of Canada Average |
| SK | 8,204 | 6,861 |
| PE | 8,013 | 6,861 |
| QC | 7,884 | 6,861 |
| NS | 6,398 | 6,861 |
| NB | 6,269 | 6,861 |
| BC | 6,168 | 6,861 |
| NL | 6,146 | 6,861 |
| AB | 5,963 | 6,861 |
| MB | 5,958 | 6,861 |
| ON | 5,101 | 6,861 |
- All other program spending includes expenses for social assistance and disability supports,[18] child care,[19] transportation and infrastructure, business supports and energy programs, policing and correctional services, amortization expense of capital assets,[20] capital transfer payments,[21] and subsidized housing.[22]
- All other program spending per capita in Ontario was $5,101 in 2024-25, the lowest among the provinces and $1,760 (25.6 per cent) below the rest of Canada average.
- Since 2008-09, Ontario’s all other program spending per capita has ranked the lowest or second lowest in Canada.
Interest on debt payments
In 2024-25, Ontario’s interest on debt payments were $1,000 per capita, the fourth highest among the provinces. Although Ontario has the lowest net financial worth per capita among the provinces, indicating a higher debt burden, Ontario’s interest on debt payments of $1,000 per capita were $348 (25.8 per cent) lower than the rest of Canada average ($1,348).
Figure 15 Ontario’s interest on debt payments per capita were below the rest of Canada average in 2024-25
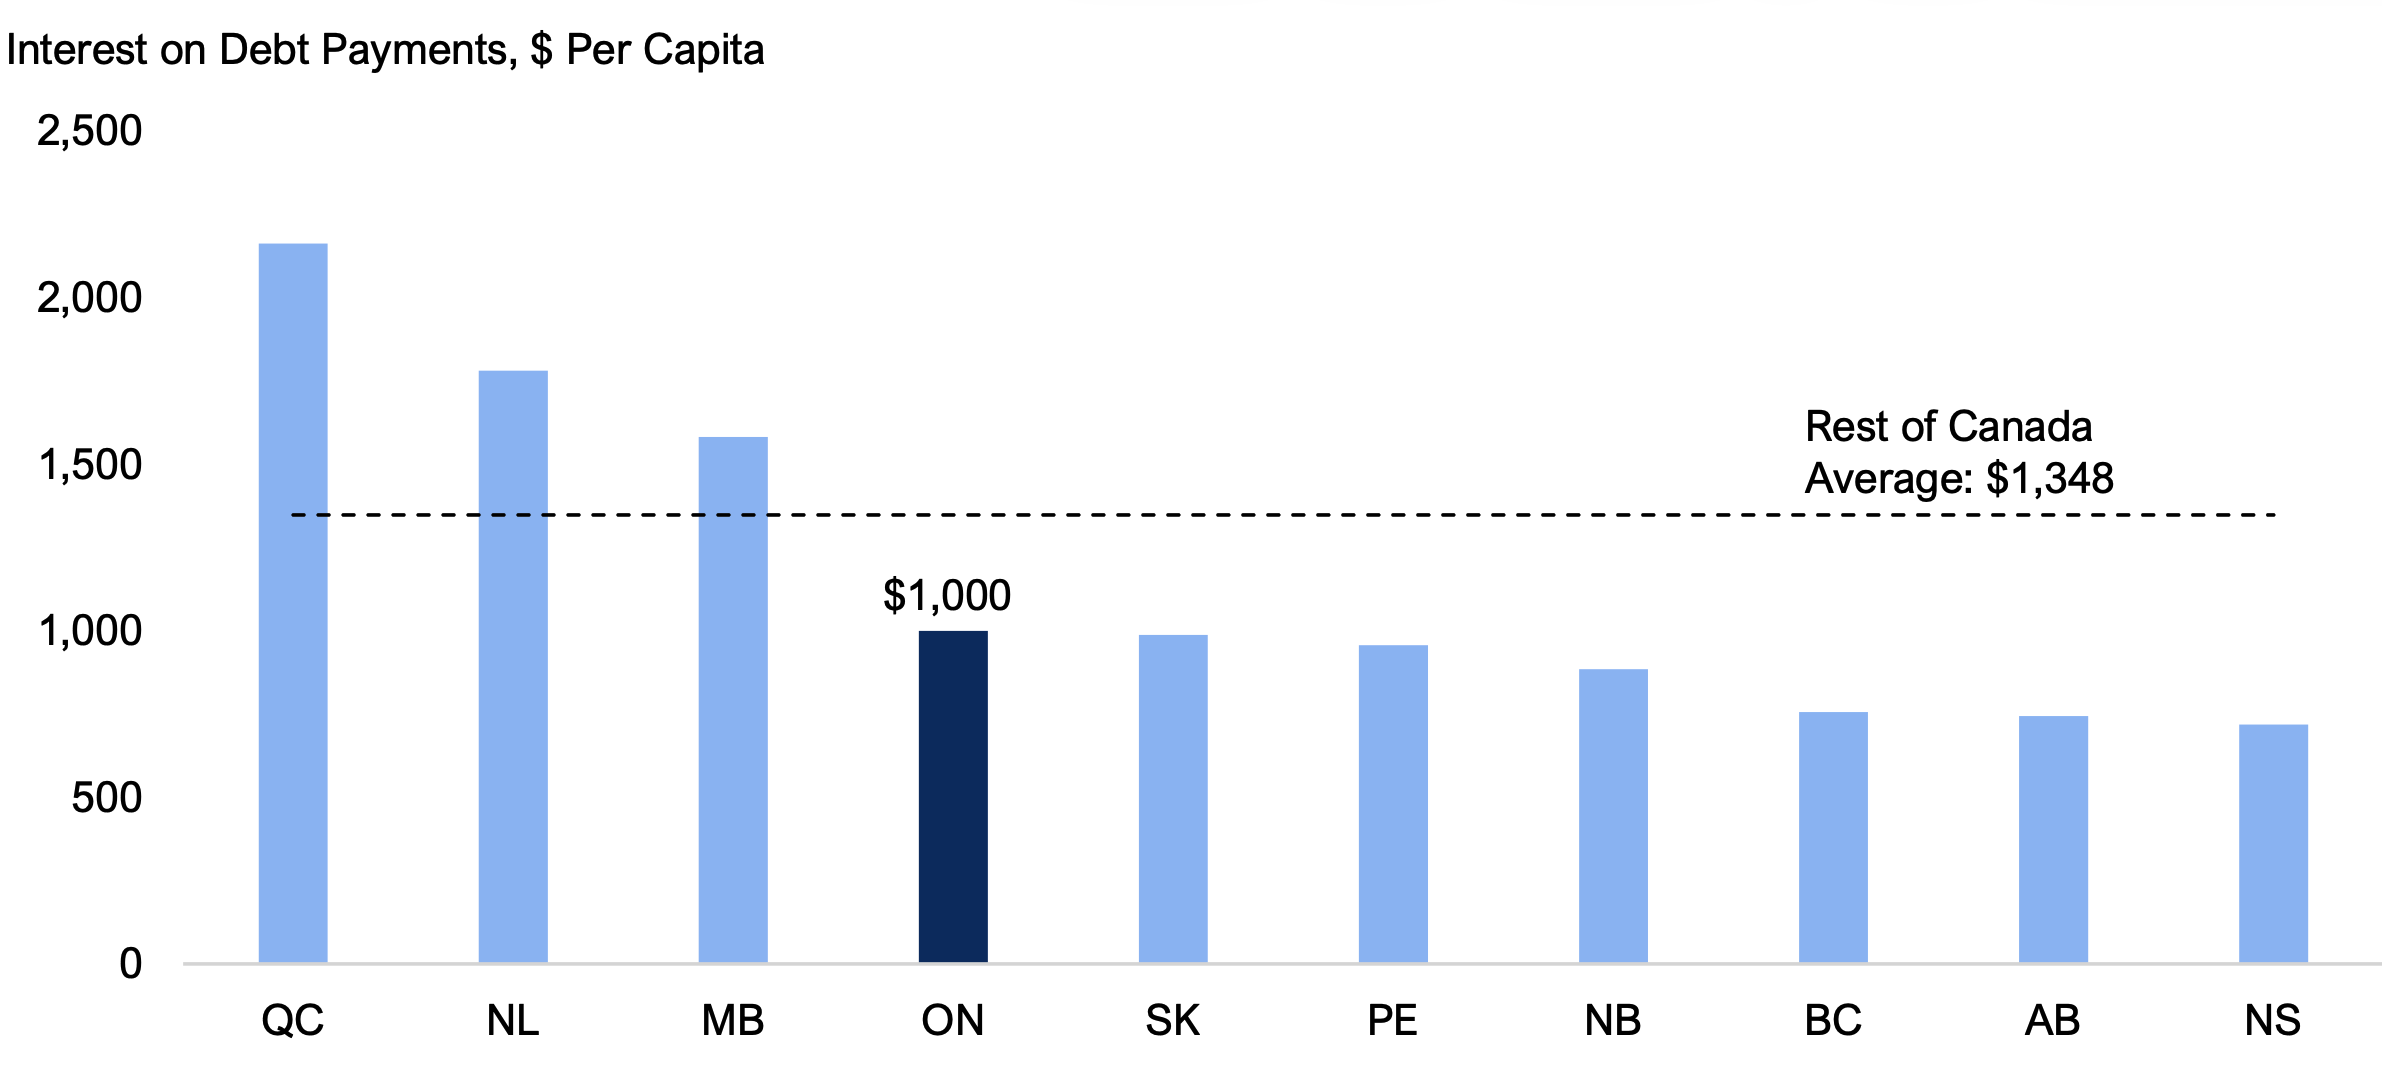
Source: FAO analysis based on data from Statistics Canada Tables 10-10-0017-01,17-10-0005-01.
Accessible version
| Interest on Debt Payments, $ Per Capita | ||
|---|---|---|
| Province | Interest on Debt Payments, $ Per Capita | Rest of Canada Average |
| QC | 2,162 | 1,348 |
| NL | 1,781 | 1,348 |
| MB | 1,582 | 1,348 |
| ON | 1,000 | 1,348 |
| SK | 987 | 1,348 |
| PE | 957 | 1,348 |
| NB | 884 | 1,348 |
| BC | 756 | 1,348 |
| AB | 744 | 1,348 |
| NS | 719 | 1,348 |
Appendix A: Methodology
This report uses data from Statistics Canada’s provincial and territorial governments GFS Tables 10‑10‑0017‑01 and 10-10- 0024-01. GFS data present provincial financial information on a different basis than the provinces’ Public Accounts. Generally, Statistics Canada’s GFS provincial data have a narrower scope of government than the provincial Public Accounts due to the exclusion of consolidated entities. Examples of the differences between GFS provincial data and provincial Public Accounts include:
- GFS provincial data are presented on an unconsolidated basis (e.g., in Ontario, GFS data exclude revenue and spending by provincial agencies and broader public sector organizations such as hospitals, colleges, school boards and children’s aid societies);
- GFS provincial data exclude municipal education property tax revenue and associated spending; and
- GFS provincial data include workers’ compensation insurance programs (e.g., in Ontario, the Workplace Safety and Insurance Board (WSIB)).
To ensure consistency in GFS data among the provinces, and to better align the GFS provincial data with provincial Public Accounts, the FAO made the following adjustments to the GFS provincial data:
- The FAO included municipal education property tax and school boards’ and colleges’ tuition fees in total provincial revenue and the associated spending in total provincial spending (education spending); and
- The FAO removed provincial workers’ compensation insurance programs (e.g., WSIB in Ontario) from total provincial revenue and spending and, for Quebec, the Parental Insurance Plan.
Significant differences remain between the adjusted GFS provincial data and the Public Accounts of Ontario, primarily due to the exclusion of hospitals’ own direct spending[23] and the exclusion of the amortization of capital assets of broader public sector organizations.
Appendix B: Provincial Government Finance Statistics
The tables in Appendix B summarize the information presented in this report.
| NL | PE | NS | NB | QC | ON | MB | SK | AB | BC | Provincial Average* | Rest of Canada Average* | |
|---|---|---|---|---|---|---|---|---|---|---|---|---|
| Net Operating Balance | -656 | -1,452 | 338 | 631 | -1,864 | -1,137 | -1,169 | -1,772 | 1,287 | -2,493 | -1,133 | -1,131 |
| Net Financial Worth | -18,602 | -12,971 | -11,242 | -7,433 | -11,898 | -19,667 | -16,939 | -8,442 | -2,601 | -6,617 | -13,171 | -8,973 |
| Total Revenue | 16,924 | 17,121 | 15,910 | 15,758 | 18,618 | 13,333 | 15,250 | 17,527 | 16,452 | 13,787 | 15,303 | 16,576 |
| Taxes | 9,158 | 8,820 | 8,815 | 7,707 | 11,997 | 9,787 | 7,651 | 9,887 | 6,509 | 9,051 | 9,622 | 9,515 |
| Federal Transfers | 4,378 | 6,755 | 5,618 | 5,886 | 3,413 | 2,217 | 5,344 | 3,027 | 2,365 | 2,465 | 2,883 | 3,314 |
| Other Non-tax Revenue | 3,388 | 1,545 | 1,477 | 2,165 | 3,207 | 1,329 | 2,255 | 4,613 | 7,578 | 2,271 | 2,798 | 3,748 |
| Total Spending | 17,580 | 18,573 | 15,572 | 15,127 | 20,482 | 14,470 | 16,420 | 19,298 | 15,165 | 16,280 | 16,436 | 17,707 |
| Program Spending | 16,360 | 17,616 | 14,854 | 14,243 | 18,319 | 13,470 | 14,838 | 18,310 | 14,420 | 15,523 | 15,225 | 16,360 |
| Health | 6,623 | 6,310 | 6,132 | 5,054 | 6,751 | 5,284 | 5,958 | 6,787 | 5,685 | 6,701 | 5,958 | 6,393 |
| Education | 3,030 | 3,293 | 2,323 | 2,919 | 3,684 | 3,085 | 2,928 | 3,320 | 2,773 | 2,654 | 3,098 | 3,106 |
| All Other Program Spending | 6,146 | 8,013 | 6,398 | 6,269 | 7,884 | 5,101 | 5,958 | 8,204 | 5,963 | 6,168 | 6,170 | 6,861 |
| Interest on Debt Payments | 1,781 | 957 | 719 | 884 | 2,162 | 1,000 | 1,582 | 987 | 744 | 756 | 1,211 | 1,348 |
| NL | PE | NS | NB | QC | ON | MB | SK | AB | BC | Provincial Average* | Rest of Canada Average* | |
|---|---|---|---|---|---|---|---|---|---|---|---|---|
| Net Operating Balance | -0.9 | -2.4 | 0.6 | 1.1 | -2.7 | -1.5 | -1.8 | -2.0 | 1.3 | -3.3 | -1.5 | -1.5 |
| Net Financial Worth | -24.1 | -21.4 | -18.6 | -13.2 | -17.4 | -26.5 | -26.3 | -9.3 | -2.7 | -8.7 | -17.5 | -11.8 |
| Total Revenue | 21.9 | 28.3 | 26.4 | 28.0 | 27.2 | 18.0 | 23.7 | 19.4 | 17.0 | 18.2 | 20.4 | 21.8 |
| Taxes | 11.9 | 14.6 | 14.6 | 13.7 | 17.5 | 13.2 | 11.9 | 10.9 | 6.7 | 12.0 | 12.8 | 12.5 |
| Federal Transfers | 5.7 | 11.1 | 9.3 | 10.5 | 5.0 | 3.0 | 8.3 | 3.3 | 2.4 | 3.3 | 3.8 | 4.4 |
| Other Non-tax Revenue | 4.4 | 2.6 | 2.4 | 3.8 | 4.7 | 1.8 | 3.5 | 5.1 | 7.8 | 3.0 | 3.7 | 4.9 |
| Total Spending | 22.8 | 30.7 | 25.8 | 26.9 | 29.9 | 19.5 | 25.5 | 21.3 | 15.7 | 21.5 | 21.9 | 23.3 |
| Program Spending | 20.5 | 29.1 | 24.6 | 25.3 | 26.7 | 18.2 | 23.0 | 20.2 | 14.9 | 20.5 | 20.2 | 21.6 |
| Health | 8.6 | 10.4 | 10.2 | 9.0 | 9.8 | 7.1 | 9.2 | 7.5 | 5.9 | 8.9 | 7.9 | 8.4 |
| Education | 3.9 | 5.4 | 3.8 | 5.2 | 5.4 | 4.2 | 4.5 | 3.7 | 2.9 | 3.5 | 4.1 | 4.1 |
| All Other Program Spending | 8.0 | 13.2 | 10.6 | 11.1 | 11.5 | 6.9 | 9.2 | 9.1 | 6.2 | 8.2 | 8.2 | 9.0 |
| Interest on Debt Payments | 2.3 | 1.6 | 1.2 | 1.6 | 3.2 | 1.3 | 2.5 | 1.1 | 0.8 | 1.0 | 1.6 | 1.8 |
| NL | PE | NS | NB | QC | ON | MB | SK | AB | BC | Provincial Average* | Rest of Canada Average* | |
|---|---|---|---|---|---|---|---|---|---|---|---|---|
| Personal Income Tax | 11.3 | 11.5 | 14.0 | 9.4 | 14.0 | 9.5 | 9.3 | 8.3 | 8.0 | 8.0 | 10.1 | 10.6 |
| Corporate Tax | 8.3 | 10.7 | 19.8 | 26.7 | 15.4 | 17.5 | 10.9 | 5.8 | 7.6 | 22.9 | 14.0 | 12.1 |
| Sales Tax | 7.1 | 6.8 | 6.3 | 6.8 | 7.1 | 6.4 | 5.1 | 6.7 | 0.0 | 4.0 | 5.4 | 4.7 |
| All Other Taxes | 1.8 | 3.3 | 1.4 | 2.4 | 4.1 | 2.5 | 2.9 | 3.4 | 1.6 | 3.6 | 2.8 | 3.1 |
Appendix C: Combined Government Finance Statistics
The tables in Appendix C combine the provincial financial statistics from Appendix B with the financial statistics of municipal and local governments, health and social service institutions, school boards, colleges and universities, among others. The combined financial statistics eliminate any differences in how responsibilities are divided between provincial and local governments.
| NL | PE | NS | NB | QC | ON | MB | SK | AB | BC | Provincial Average* | Rest of Canada Average* | |
|---|---|---|---|---|---|---|---|---|---|---|---|---|
| Net Operating Balance | -1,743 | -440 | 587 | -954 | -1,012 | -575 | -1,847 | -1,123 | 1,333 | -1,287 | -596 | -610 |
| Net Financial Worth | -20,641 | -13,271 | -8,259 | -6,721 | -17,947 | -18,086 | -19,532 | -6,425 | -2,013 | -2,885 | -13,257 | -10,136 |
| Total Revenue | 19,944 | 19,081 | 19,972 | 18,476 | 21,504 | 18,093 | 18,353 | 21,401 | 20,829 | 18,549 | 19,425 | 20,285 |
| Taxes | 10,193 | 9,254 | 10,480 | 8,892 | 13,488 | 11,928 | 8,683 | 11,263 | 8,732 | 10,834 | 11,463 | 11,162 |
| Federal Transfers | 4,577 | 6,906 | 5,895 | 6,018 | 3,563 | 2,408 | 5,548 | 3,418 | 2,600 | 2,598 | 3,070 | 3,497 |
| Other Non-tax Revenue | 5,175 | 2,921 | 3,597 | 3,566 | 4,453 | 3,757 | 4,122 | 6,719 | 9,498 | 5,117 | 4,892 | 5,626 |
| Total Spending | 21,687 | 19,520 | 19,384 | 19,430 | 22,515 | 18,668 | 20,200 | 22,524 | 19,496 | 19,837 | 20,021 | 20,895 |
| Program Spending | 19,842 | 18,508 | 18,654 | 18,526 | 20,319 | 17,565 | 18,488 | 21,489 | 18,777 | 19,000 | 18,746 | 19,509 |
| Health | 8,064 | 6,204 | 7,307 | 7,107 | 6,545 | 5,718 | 7,025 | 6,643 | 5,785 | 6,935 | 6,255 | 6,601 |
| Education | 3,288 | 3,372 | 3,282 | 3,301 | 3,100 | 3,266 | 3,162 | 3,641 | 3,159 | 2,769 | 3,158 | 3,088 |
| All Other Program Spending | 8,490 | 8,931 | 8,065 | 8,118 | 10,674 | 8,581 | 8,301 | 11,205 | 9,832 | 9,296 | 9,333 | 9,819 |
| Interest on Debt Payments | 1,845 | 1,013 | 730 | 904 | 2,196 | 1,103 | 1,712 | 1,035 | 719 | 836 | 1,275 | 1,386 |
| NL | PE | NS | NB | QC | ON | MB | SK | AB | BC | Provincial Average* | Rest of Canada Average* | |
|---|---|---|---|---|---|---|---|---|---|---|---|---|
| Net Operating Balance | -2.3 | -0.7 | 1.0 | -1.7 | -1.5 | -0.8 | -2.9 | -1.2 | 1.4 | -1.7 | -0.8 | -0.8 |
| Net Financial Worth | -26.7 | -21.9 | -13.7 | -11.9 | -26.2 | -24.4 | -30.3 | -7.1 | -2.1 | -3.8 | -17.6 | -13.4 |
| Total Revenue | 25.8 | 31.5 | 33.1 | 32.8 | 31.4 | 24.4 | 28.5 | 23.7 | 21.6 | 24.5 | 25.8 | 26.7 |
| Taxes | 13.2 | 15.3 | 17.4 | 15.8 | 19.7 | 16.1 | 13.5 | 12.5 | 9.0 | 14.3 | 15.2 | 14.7 |
| Federal Transfers | 5.9 | 11.4 | 9.8 | 10.7 | 5.2 | 3.2 | 8.6 | 3.8 | 2.7 | 3.4 | 4.1 | 4.6 |
| Other Non-tax Revenue | 6.7 | 4.8 | 6.0 | 6.3 | 6.5 | 5.1 | 6.4 | 7.4 | 9.8 | 6.8 | 6.5 | 7.4 |
| Total Spending | 28.1 | 32.2 | 32.1 | 34.5 | 32.8 | 25.2 | 31.4 | 24.9 | 20.2 | 26.2 | 26.6 | 27.5 |
| Program Spending | 25.7 | 30.5 | 30.9 | 32.9 | 29.6 | 23.7 | 28.7 | 23.8 | 19.4 | 25.1 | 24.9 | 25.7 |
| Health | 10.4 | 10.2 | 12.1 | 12.6 | 9.5 | 7.7 | 10.9 | 7.3 | 6.0 | 9.2 | 8.3 | 8.7 |
| Education | 4.3 | 5.6 | 5.4 | 5.9 | 4.5 | 4.4 | 4.9 | 4.0 | 3.3 | 3.7 | 4.2 | 4.1 |
| All Other Program Spending | 11.0 | 14.7 | 13.4 | 14.4 | 15.6 | 11.6 | 12.9 | 12.4 | 10.2 | 12.3 | 12.4 | 12.9 |
| Interest on Debt Payments | 2.4 | 1.7 | 1.2 | 1.6 | 3.2 | 1.5 | 2.7 | 1.1 | 0.7 | 1.1 | 1.7 | 1.8 |
Footnotes
[1] Rest of Canada average is a weighted average which includes all provinces except Ontario.
[2] See Consolidated Canadian Government Finance Statistics, 2024.
[3] Some GFS data are available from 2007-08; however, the majority of provincial data are only available from 2008-09.
[4] When the latest GFS data are released, data from previous years are also revised to reflect information not available at the time of the previous release. As a result, figures in this report may not align with those presented in previous reports.
[5] Rest of Canada average is a weighted average which includes all provinces except Ontario.
[6] In the provincial economic accounts, labour income corresponds to total compensation of employees, corporate profits to net operating surplus of corporations and household spending to household final consumption expenditure.
[7] The actual tax bases for personal income tax and corporate tax are personal taxable income and corporate taxable income, respectively. These tax bases were not available for 2024-25 at the time of this report’s publication. The actual tax base for sales tax includes household spending in addition to taxes generated on expenditures from residential construction, businesses and governments. For simplicity, only household consumption is shown.
[8] Since there are many different bases for all other tax revenue, this category is compared against the overall tax base as measured by GDP.
[9] Equalization payments are determined by a province’s fiscal capacity to raise revenues through five broad revenue categories: personal income taxes, business taxes, consumption taxes, property taxes and natural resource revenues.
[10] Other federal transfers were lower in Ontario on a per capita basis ($509) compared to the rest of Canada average ($654).
[11] The FAO calculates ‘other non-tax revenues’ in this report as the sum of Profits of Fiscal Monopolies, Other Social Contributions and Other Revenue categories in the GFS. These items comprise revenue from other social contributions, resource royalties, the ownership of assets, in addition to revenue generated from the sales of goods and services (including services fees), dividends, fines and penalties, and voluntary transfers as well as other miscellaneous revenues. For more information on GFS categories, see the Government Financial Statistics Manual 2014.
[12] In 2024-25, Ontario collected $16 in resource revenues per capita, below the rest of Canada average of $1,163 per capita.
[13] Ontario’s ownership of financial assets generated $344 in revenue per capita, below the average of $1,093 per capita generated in the rest of Canada. The sale of goods and services generated $261 per capita in Ontario, lower than the rest of Canada average of $686 per capita.
[14] For more detailed information on Ontario’s health spending, please see the FAO’s Ontario Health Sector: 2025 Spending Plan Review.
[15] Health spending excludes capital transfer payments and amortization expense.
[16] For more detailed information on Ontario’s education spending, please see the FAO’s Ministry of Education: 2025 Spending Plan Review and the FAO’s Ministry of Colleges, Universities, Research Excellence and Security: 2025 Spending Plan Review.
[17] Education spending reflects spending by school boards and colleges, provincial transfer payments to universities, and student assistance grants. Education spending excludes capital transfer payments and amortization expense.
[18] For more detailed information on Ontario’s social assistance and disability supports spending, please see the FAO’s Ministry of Children, Community and Social Services: 2025 Spending Plan Review.
[19] For more detailed information on Ontario’s child care spending, please see the FAO’s Ministry of Education: 2025 Spending Plan Review.
[20] All other spending includes the amortization expense of provincial governments but excludes the amortization expense recorded by hospitals, school boards, colleges and children’s aid societies.
[21] For more detailed information on Ontario’s capital spending, please see the FAO’s 2025 Capital Plan: Spending Plan Review.
[22] For more detailed information on Ontario’s subsidized housing spending, please see the FAO’s An Update on Subsidized Housing Programs in Ontario.
[23] Due to data limitations, the FAO is unable to include third-party revenue and spending of hospitals in its adjusted data.