


Summary
This report provides a review of Ontario’s labour market performance in 2024. It presents a summary of the overall labour market in the province, and information for demographic groups, industries, occupations, major cities, other provinces and wage growth compared to inflation.
Ontario’s labour market continued to moderate in 2024
- The pace of Ontario’s job creation continued to moderate in 2024 with employment rising by 140,000 (1.7 per cent), down from 242,000 jobs (3.1 per cent) added in 2023 and record gains in 2021 and 2022.
- Job creation did not keep pace with the increase in the number of people looking for work, causing the annual unemployment rate in Ontario to increase to 7.0 per cent in 2024, up from 5.6 per cent in 2023 and the highest since 2014 (excluding the pandemic period).
Most groups of workers saw job gains
- In 2024, job gains were concentrated among core-aged workers (aged 25-54), as their employment rose 2.8 per cent. In contrast, employment declined by 0.6 per cent for youth (aged 15-24) while older workers (aged 55 years and over) experienced modestly lower employment (-0.1 per cent). Among both younger and older workers, all the job losses were experienced by males.
- Employment grew across all major categories except for temporary workers. Employment in full-time positions (1.2 per cent) grew at a slower pace than part-time positions (4.5 per cent).
- Employment in the private sector increased by 1.0 per cent, slower than the 3.3 per cent rise in the public sector. The post-pandemic period has seen strong gains in public sector employment, notably in health care, educational services and public administration.
- Of the 16 major industries in Ontario, 11 saw an increase in employment. Professional, scientific and technical services recorded the largest increase in employment (63,100 or 7.5 per cent), followed by health care and social assistance (26,000 or 2.7 per cent). Construction saw the largest decrease in employment (-26,500 or -4.4 per cent).
Job vacancies trended lower in 2024
- Job vacancies continued to trend lower, declining 24.4 per cent compared to the previous year, with fewer job vacancies in all industries except public administration.
Unemployment rate increased in all Census Metropolitan Areas and all provinces
- The unemployment rate increased in all Ontario Census Metropolitan Areas (CMAs), and employment increased in nine out of the 15 CMAs in Ontario. Kitchener-Cambridge-Waterloo had the fastest pace of job creation (6.5 per cent), particularly in construction and professional, scientific and technical services. Barrie experienced the sharpest decline in employment (-2.8 per cent) with job losses in construction, manufacturing and accommodation and food services.
- All provinces experienced both job gains and an increase in their unemployment rate in 2024. Ontario’s employment growth (1.7 per cent) was the second slowest among all provinces, and Ontario’s unemployment rate (7.0 per cent) was the third highest in the country.
Wage growth in Ontario outpaced inflation in 2024 for most groups of workers
- The average hourly wage of Ontarians increased 5.2 per cent to $36.44 in 2024, the third fastest pace on record back to 1998 and more than double the 2.4 per cent annual consumer price index (CPI) inflation rate. Wages in 14 out of 16 industry groups and 24 out of 34 occupations grew above inflation.
Ontario’s labour market continued to moderate in 2024
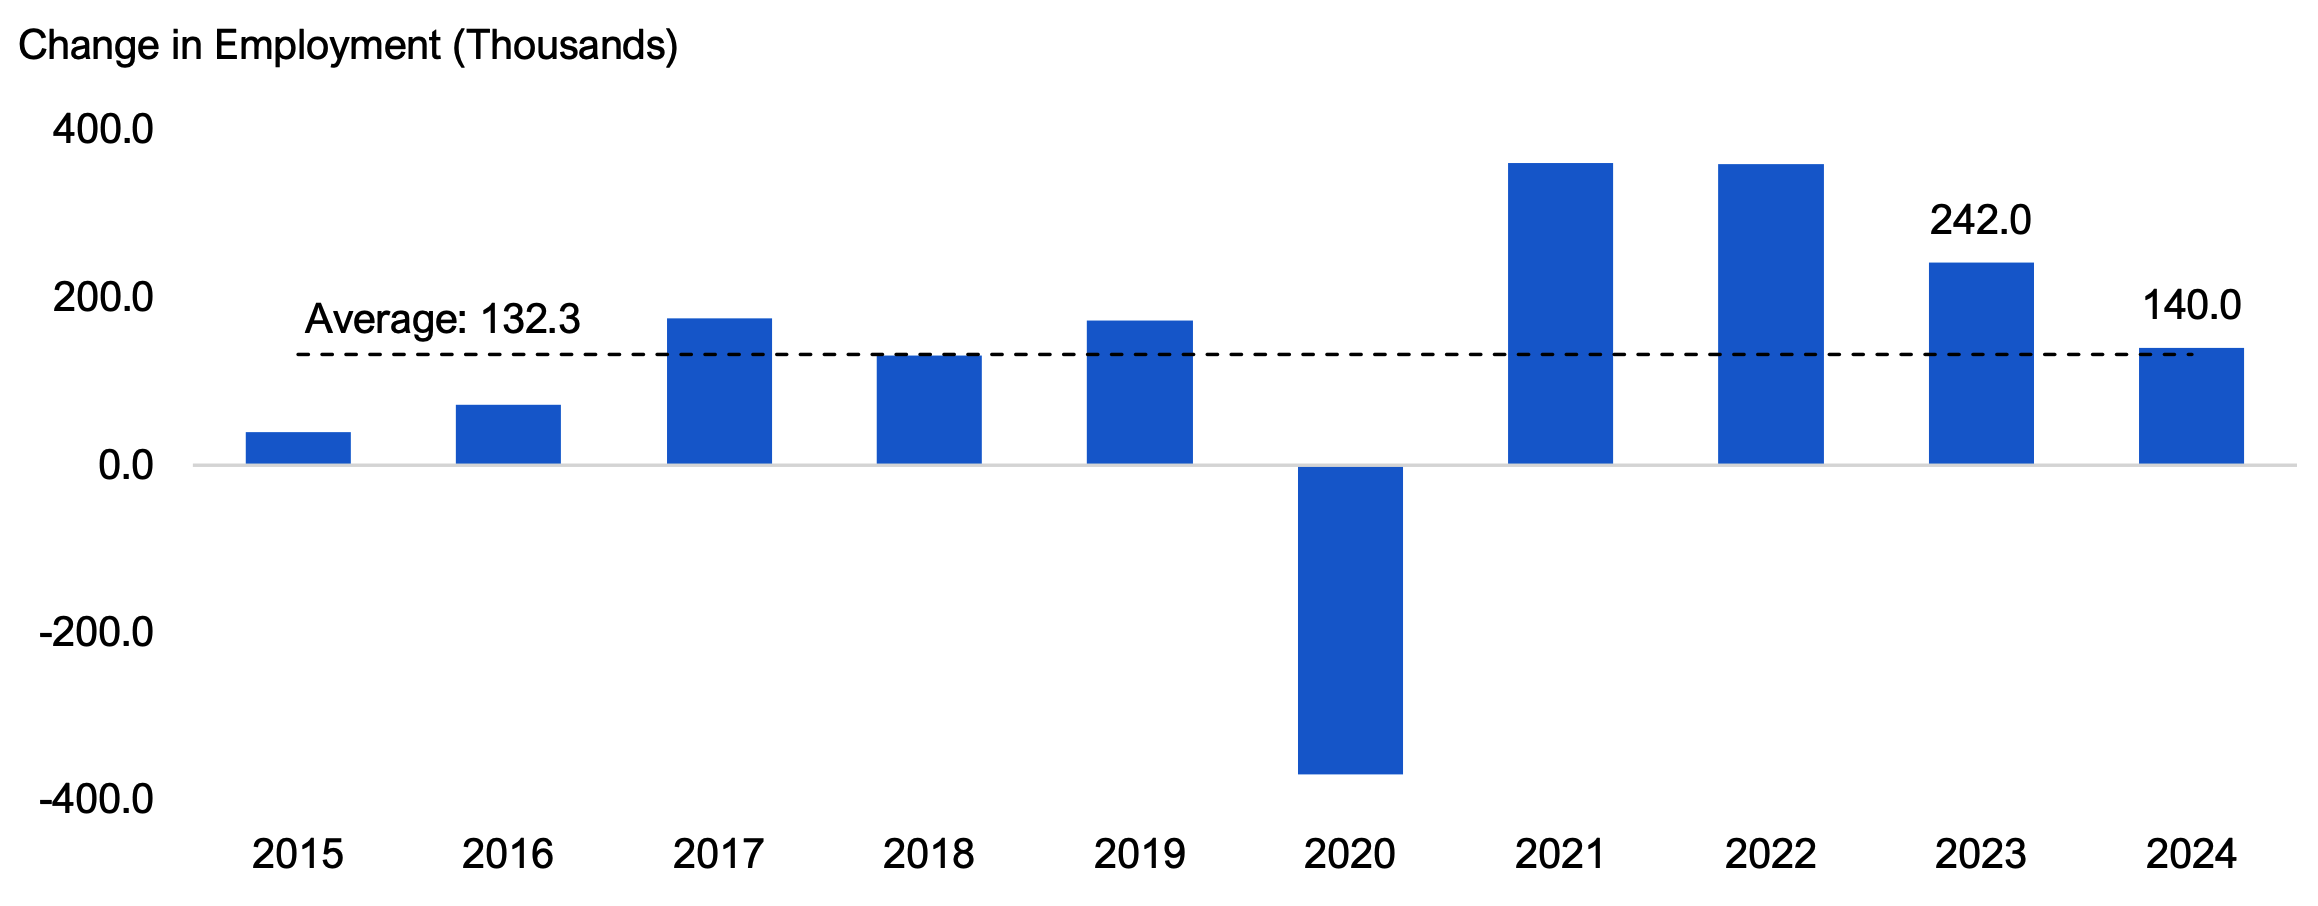
The pace of Ontario’s job creation continued to moderate in 2024 with employment rising by 140,000 (1.7 per cent), down from 242,000 jobs (3.1 per cent) added in 2023 and record gains in 2021 and 2022.[1] Job gains in 2024 were recorded among core-aged workers, in service industries and in nine out of the province’s 15 major cities.
Figure 1 Ontario gained 140,000 jobs in 2024
Source: Statistics Canada: Labour Force Survey: Table 14-10-0327-01
Accessible version
| Year | Change in Employment (Thousands) |
|---|---|
| 2015 | 39.3 |
| 2016 | 71.8 |
| 2017 | 174.7 |
| 2018 | 131.2 |
| 2019 | 172.5 |
| 2020 | -369.5 |
| 2021 | 361.4 |
| 2022 | 359.3 |
| 2023 | 242.0 |
| 2024 | 140.0 |
| Average | 132.3 |
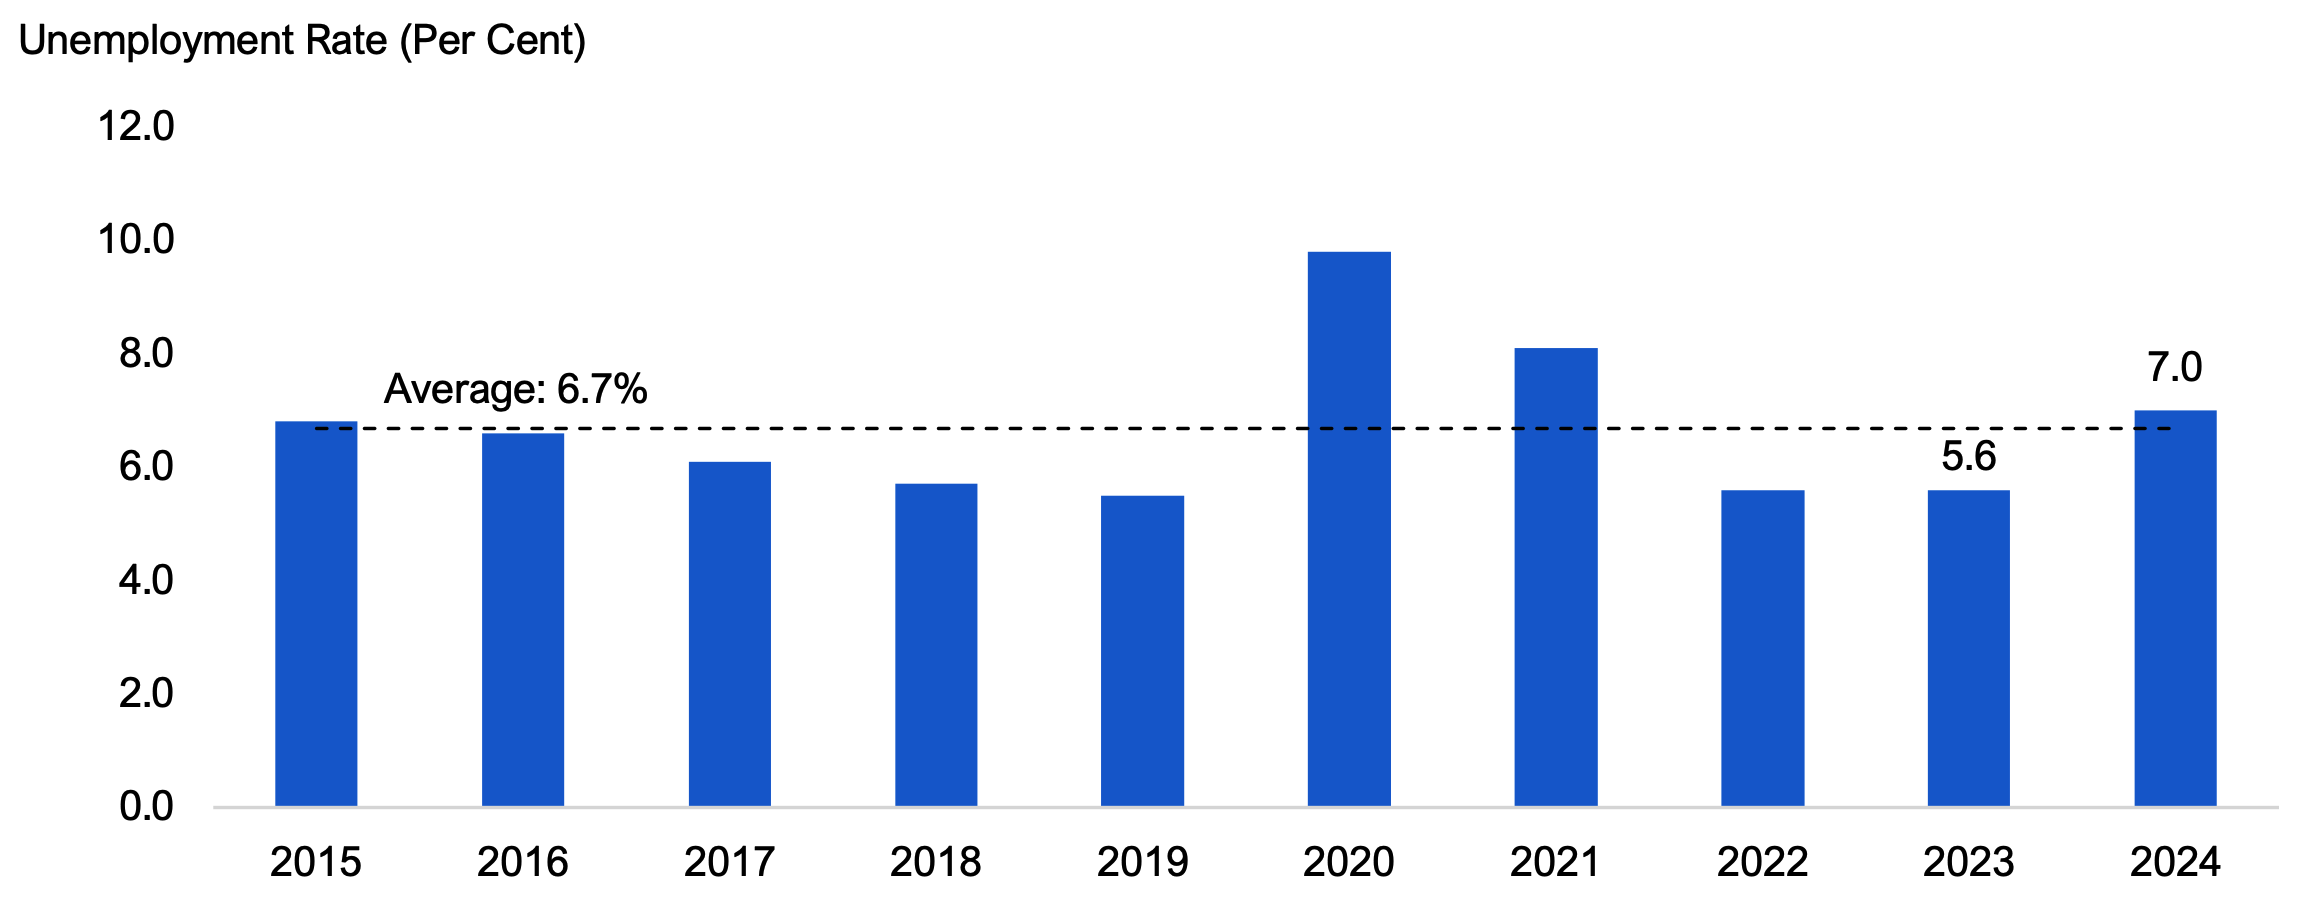
Job creation did not keep pace with the increase in the number of people looking for work, causing Ontario’s annual unemployment rate to increase to 7.0 per cent in 2024, up from 5.6 per cent in 2023 and the highest since 2014 (excluding the pandemic period). This marked the first time on record back to the mid-1970s that Ontario’s annual unemployment rate increased by more than one percentage point while employment was rising. In all other years when the unemployment rate increased by at least one percentage point, the economy was in a recession and experienced job losses.
Figure 2 Unemployment rate in Ontario increased in 2024
Source: Statistics Canada: Labour Force Survey: Table 14-10-0327-01
Accessible version
| Year | Unemployment Rate (Per Cent) |
|---|---|
| 2015 | 6.8 |
| 2016 | 6.6 |
| 2017 | 6.1 |
| 2018 | 5.7 |
| 2019 | 5.5 |
| 2020 | 9.8 |
| 2021 | 8.1 |
| 2022 | 5.6 |
| 2023 | 5.6 |
| 2024 | 7.0 |
| Average | 6.7 |
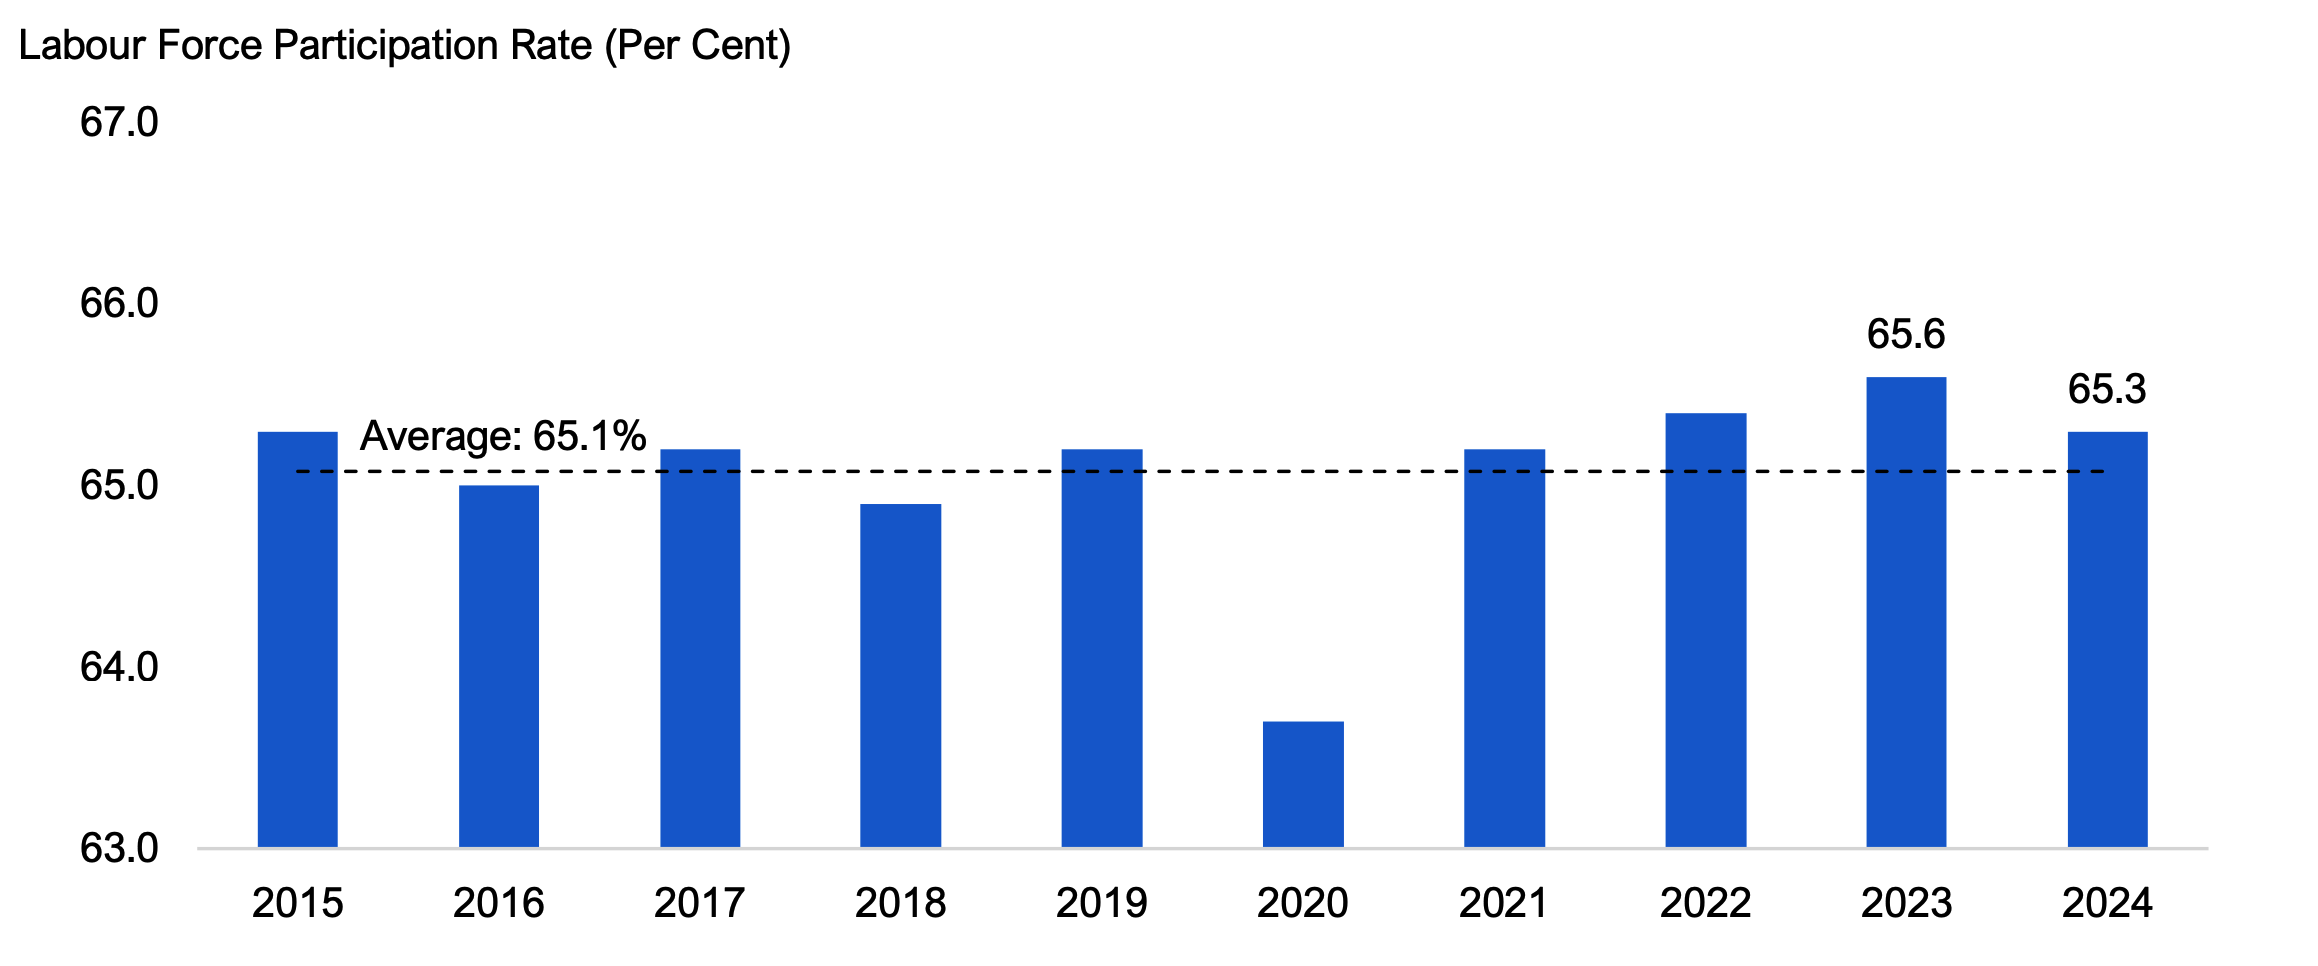
Ontario’s labour force participation rate[2] declined modestly from 65.6 per cent in 2023 to 65.3 per cent in 2024 as labour force growth (3.2 per cent) trailed the increase in Ontario’s population aged 15 years and older (3.8 per cent[3]).
Figure 3 Ontario’s labour force participation rate trended down in 2024
Source: Statistics Canada: Labour Force Survey: Table 14-10-0327-01
Accessible version
| Year | Labour Force Participation Rate (Per Cent) |
|---|---|
| 2015 | 65.3 |
| 2016 | 65.0 |
| 2017 | 65.2 |
| 2018 | 64.9 |
| 2019 | 65.2 |
| 2020 | 63.7 |
| 2021 | 65.2 |
| 2022 | 65.4 |
| 2023 | 65.6 |
| 2024 | 65.3 |
| Average | 65.1 |
Core-aged workers experienced strong job gains while young and older male workers saw job losses
In 2024, job gains were concentrated among core-aged workers (aged 25-54), while employment declined for youth (aged 15-24) and older workers (aged 55 years and over). Among both younger and older workers, all the job losses[4] were experienced by males.
Core-aged workers experienced employment growth of 2.8 per cent in 2024, with job gains for males (3.1 per cent) modestly faster than for females (2.5 per cent). The employment rate[5] and labour force participation rate of core-aged workers declined in 2024 to 83.0 per cent and 88.1 per cent, respectively, after reaching record highs in 2023 of 84.1 per cent and 88.2 per cent.
Employment among older workers declined by 0.1 per cent, as job losses by older males (-0.6 per cent) were larger than gains by older females (0.4 per cent). Industries with the largest job losses among older male workers were construction (-8,300) and manufacturing (-7,200),[6] as those sectors experienced lower output in 2024.
Youth employment declined by 0.6 per cent, as female youth job growth of 1.1 per cent was outweighed by a 2.2 per cent decline in male youth employment. The drop in male youth employment was led by a combined 17,900 fewer positions in wholesale and retail trade, accommodation and food services, and construction industries, which together employed over half of young male workers in 2024.[7] The labour force participation rate of youth fell to 59.7 per cent, down from 62.2 per cent in 2023 and the lowest on record excluding the pandemic period. Ontario youth had the lowest labour participation rate among the provinces in 2024 and have been below the Canada average since 2003.
The unemployment rate of core-aged workers increased from 4.7 per cent in 2023 to 5.8 per cent in 2024, while for young workers the unemployment rate increased by 3.2 percentage points to 15.7 per cent, the highest since 2012 excluding the pandemic. Older workers saw their unemployment rate increase from 4.1 per cent in 2023 to 4.7 per cent in 2024.
| Age and Gender | Annual Employment Change in 2024 (Thousands) |
Annual Employment Change in 2024 (Per Cent) |
Unemployment Rate (Per Cent) |
||
|---|---|---|---|---|---|
| 2022 | 2023 | 2024 | |||
| Youth (15-24 years) | -6.5 | -0.6 | 11.4 | 12.5 | 15.7 |
| Males | -11.7 | -2.2 | 12.4 | 12.7 | 17.6 |
| Females | 5.2 | 1.1 | 10.4 | 12.2 | 13.6 |
| Core (25-54 years) | 148.8 | 2.8 | 4.6 | 4.7 | 5.8 |
| Males | 85.5 | 3.1 | 4.3 | 4.4 | 5.9 |
| Females | 63.3 | 2.5 | 4.9 | 5.0 | 5.7 |
| Older (55 years and over) | -2.2 | -0.1 | 4.6 | 4.1 | 4.7 |
| Males | -5.7 | -0.6 | 4.5 | 4.2 | 4.9 |
| Females | 3.4 | 0.4 | 4.7 | 4.0 | 4.5 |
| Total | 140.0 | 1.7 | 5.6 | 5.6 | 7.0 |
Ontario saw job gains across most types of employment categories
Employment grew across all major categories except for temporary workers. Employment in full-time positions (1.2 per cent) grew at a slower pace in 2024 than part-time positions (4.5 per cent), as both youths and older workers experienced job losses in full-time employment that were partially offset by job gains in part-time employment.
Employment in the private sector increased by 1.0 per cent, slower than the 3.3 per cent rise in the public sector in 2024. The post-pandemic period has seen strong gains in public sector employment, notably in health care, educational services and public administration. As a result, the share of public sector workers in total employment reached 19.9 per cent in 2024, the highest since 1994.
The number of self-employed Ontarians increased by 3.1 per cent in 2024, after declining by 6.1 per cent over the 2020 to 2023 period. As a result, self-employment in Ontario in 2024 was 3.1 per cent below its 2019 pre-pandemic level.
Employment growth in permanent positions (1.8 per cent) outpaced temporary jobs (-0.2 per cent), and the share of workers in permanent positions remained at a record high of 77.0 per cent in 2024.
| Job Category | Annual Employment Change in 2024 (Thousands) |
Annual Employment Change in 2024 (Per Cent) |
|---|---|---|
| Type of Employment | ||
| Full-time | 78.6 | 1.2 |
| Part-time | 61.3 | 4.5 |
| Class of Workers | ||
| Private | 54.4 | 1.0 |
| Public | 52.1 | 3.3 |
| Self-employed | 33.5 | 3.1 |
| Job Permanency of Paid Employment* | ||
| Permanent | 108.4 | 1.8 |
| Temporary | -1.9 | -0.2 |
| Total | 140.0 | 1.7 |
Over half of Ontario’s industries saw job growth
Of the 16 major industries in Ontario, 11 saw an increase in employment in 2024. Professional, scientific and technical services recorded the largest increase in employment (63,100 or 7.5 per cent), followed by health care and social assistance (26,000 or 2.7 per cent) and educational services (25,700 or 4.4 per cent). At the opposite end, construction saw the largest decrease in employment (-26,500 or -4.4 per cent), reflecting a steep decline in housing starts. Other notable job losses were recorded in wholesale and retail trade (-13,600 or -1.2 per cent) and agriculture (-5,600 or -7.2 per cent).
| Industry | Annual Employment Change in 2024 (Thousands) |
Annual Employment Change in 2024 (Per Cent) |
|---|---|---|
| Professional, scientific and technical services | 63.1 | 7.5 |
| Health care and social assistance | 26.0 | 2.7 |
| Educational services | 25.7 | 4.4 |
| Finance, insurance, real estate, rental and leasing | 23.9 | 3.5 |
| Transportation and warehousing | 19.8 | 4.9 |
| Other services | 16.4 | 6.0 |
| Business, building and other support services | 9.6 | 3.4 |
| Public administration | 9.4 | 2.0 |
| Manufacturing | 1.7 | 0.2 |
| Information, culture and recreation | 0.1 | 0.0 |
| Forestry, fishing, mining, quarrying, oil and gas | 0.1 | 0.2 |
| Accommodation and food services | -5.0 | -1.2 |
| Utilities | -5.0 | -7.8 |
| Agriculture | -5.6 | -7.2 |
| Wholesale and retail trade | -13.6 | -1.2 |
| Construction | -26.5 | -4.4 |
While Ontario’s total employment compared to the 2019 pre-pandemic level has increased by 733,200 jobs (9.9 per cent), not all industries have experienced gains. Industries with lower employment in 2024 compared to 2019 include accommodation and food services (-37,100 or -8.1 per cent), business, building and other support services (-18,700 or -6.0 per cent), agriculture (-2,800 or -3.8 per cent) and other services[8] (-1,300 or -0.4 per cent).
Job vacancies trended lower in 2024
In tandem with the slower pace of employment gains, job vacancies declined by 64,100 (24.4 per cent) in 2024, and the overall job vacancy rate[9] fell from 3.8 per cent in 2023 to 2.9 per cent in 2024. Job vacancies have been declining steadily since the second quarter of 2022, and the unemployment-to-job vacancy ratio[10] increased from 1.8 in 2023 to 3.1 in 2024, indicating softer labour market conditions.
Job vacancies in 2024 declined in all industries except public administration. Of the 16 major industries in Ontario, health care and social assistance had the highest number of job vacancies (44,200) and the highest job vacancy rate (5.0 per cent), followed by wholesale and retail trade (25,500) and accommodation and food services (19,800). Utilities had the lowest number of job vacancies (800), while educational services had the lowest job vacancy rate (1.5 per cent).
| Industry | Annual Change in Job Vacancies in 2024 (Thousands) |
Job Vacancies in 2024 (Thousands) |
Job Vacancy Rate in 2024 (Per Cent) |
|---|---|---|---|
| Wholesale and retail trade | -11.4 | 25.5 | 2.3 |
| Accommodation and food services | -9.5 | 19.8 | 3.9 |
| Health care and social assistance | -7.4 | 44.2 | 5.0 |
| Business, building and other support services | -7.3 | 13.9 | 3.2 |
| Construction | -6.2 | 11.2 | 2.7 |
| Manufacturing | -5.8 | 13.3 | 1.9 |
| Information, culture and recreation | -3.8 | 6.8 | 2.5 |
| Transportation and warehousing | -2.8 | 10.2 | 3.2 |
| Other services | -2.7 | 8.4 | 3.9 |
| Finance, insurance, real estate, rental and leasing | -2.5 | 12.1 | 2.3 |
| Professional, scientific and technical services | -2.2 | 15.5 | 2.8 |
| Educational services | -1.0 | 8.4 | 1.5 |
| Agriculture, forestry, fishing, hunting | -0.7 | 2.6 | 3.9 |
| Utilities | -0.6 | 0.8 | 1.6 |
| Mining, quarrying, and oil and gas extraction | -0.2 | 0.9 | 2.8 |
| Public administration | 0.0 | 5.1 | 2.2 |
| All Industries | -64.1 | 198.6 | 2.9 |
Unemployment rate increased in all Census Metropolitan Areas
Employment increased in nine out of the 15 census metropolitan areas (CMAs) in Ontario in 2024.[11] Kitchener-Cambridge-Waterloo (6.5 per cent) had the fastest pace of job creation, particularly in construction and professional, scientific and technical services.[12] Job gains above the provincial increase were also recorded in Oshawa (2.8 per cent), Ottawa (2.4 per cent), Windsor (2.1 per cent), Hamilton (2.0 per cent) and London (1.9 per cent). In contrast, Barrie experienced the sharpest decline in employment (-2.8 per cent) with job losses concentrated in construction, manufacturing, and accommodation and food services. Employment also declined in Peterborough (-1.6 per cent), Greater Sudbury (-1.3 per cent), Thunder Bay (-0.6 per cent) and Guelph (-0.6 per cent).
The unemployment rate increased in all Ontario CMAs. Across the CMAs, the highest unemployment rates in 2024 were recorded in Windsor (8.3 per cent), Toronto (8.0 per cent) and St. Catharines-Niagara (7.5 per cent). The lowest unemployment rate was recorded in Thunder Bay (4.3 per cent), followed by Peterborough (4.8 per cent) and Guelph (5.0 per cent).
| Census Metropolitan Area | Annual Employment Change in 2024 (Per Cent) |
Unemployment Rate (Per Cent) |
||
|---|---|---|---|---|
| 2022 | 2023 | 2024 | ||
| Kitchener-Cambridge-Waterloo | 6.5 | 5.7 | 6.0 | 7.2 |
| Oshawa | 2.8 | 5.2 | 5.6 | 6.8 |
| Ottawa-Gatineau, Ontario part | 2.4 | 4.2 | 4.5 | 5.7 |
| Windsor | 2.1 | 7.3 | 6.2 | 8.3 |
| Hamilton | 2.0 | 4.9 | 5.4 | 6.8 |
| London | 1.9 | 5.7 | 5.2 | 6.6 |
| Toronto | 1.6 | 6.3 | 6.3 | 8.0 |
| Brantford | 1.1 | 5.1 | 4.6 | 5.4 |
| St. Catharines-Niagara | 0.2 | 5.2 | 5.8 | 7.5 |
| Kingston | 0.0 | 5.5 | 4.7 | 6.3 |
| Guelph | -0.6 | 4.2 | 4.5 | 5.0 |
| Thunder Bay | -0.6 | 4.8 | 4.1 | 4.3 |
| Greater Sudbury | -1.3 | 4.1 | 4.9 | 5.5 |
| Peterborough | -1.6 | 4.5 | 4.6 | 4.8 |
| Barrie | -2.8 | 5.5 | 4.8 | 6.1 |
Unemployment rate increased in all provinces
All provinces experienced job gains in 2024. Prince Edward Island had the fastest pace of job creation (3.6 per cent) for the third year in a row, while Quebec’s employment growth (1.0 per cent) was the slowest. Ontario’s employment growth (1.7 per cent) was the second slowest among all provinces and the lowest rank since 2009.
In 2024, the unemployment rate increased in all provinces. Newfoundland and Labrador continued to have the highest unemployment rate among the provinces (10.0 per cent), while Quebec had the lowest (5.3 per cent). Ontario recorded the third highest (7.0 per cent) unemployment rate in the country, tied with Alberta and New Brunswick. This marked Ontario’s highest provincial unemployment rate ranking on record.
| Province | Annual Employment Change in 2024 (Per Cent) |
Unemployment Rate (Per Cent) |
||
|---|---|---|---|---|
| 2022 | 2023 | 2024 | ||
| Prince Edward Island | 3.6 | 7.7 | 7.2 | 8.0 |
| Nova Scotia | 3.2 | 6.6 | 6.4 | 6.5 |
| Alberta | 3.1 | 5.8 | 5.9 | 7.0 |
| New Brunswick | 2.9 | 7.2 | 6.6 | 7.0 |
| Newfoundland and Labrador | 2.8 | 11.3 | 9.9 | 10.0 |
| Saskatchewan | 2.6 | 4.6 | 4.7 | 5.4 |
| Manitoba | 2.5 | 4.5 | 4.9 | 5.4 |
| British Columbia | 2.3 | 4.6 | 5.2 | 5.6 |
| Ontario | 1.7 | 5.6 | 5.6 | 7.0 |
| Quebec | 1.0 | 4.3 | 4.5 | 5.3 |
| Canada | 1.9 | 5.3 | 5.4 | 6.3 |
Wage growth in Ontario outpaced inflation in 2024
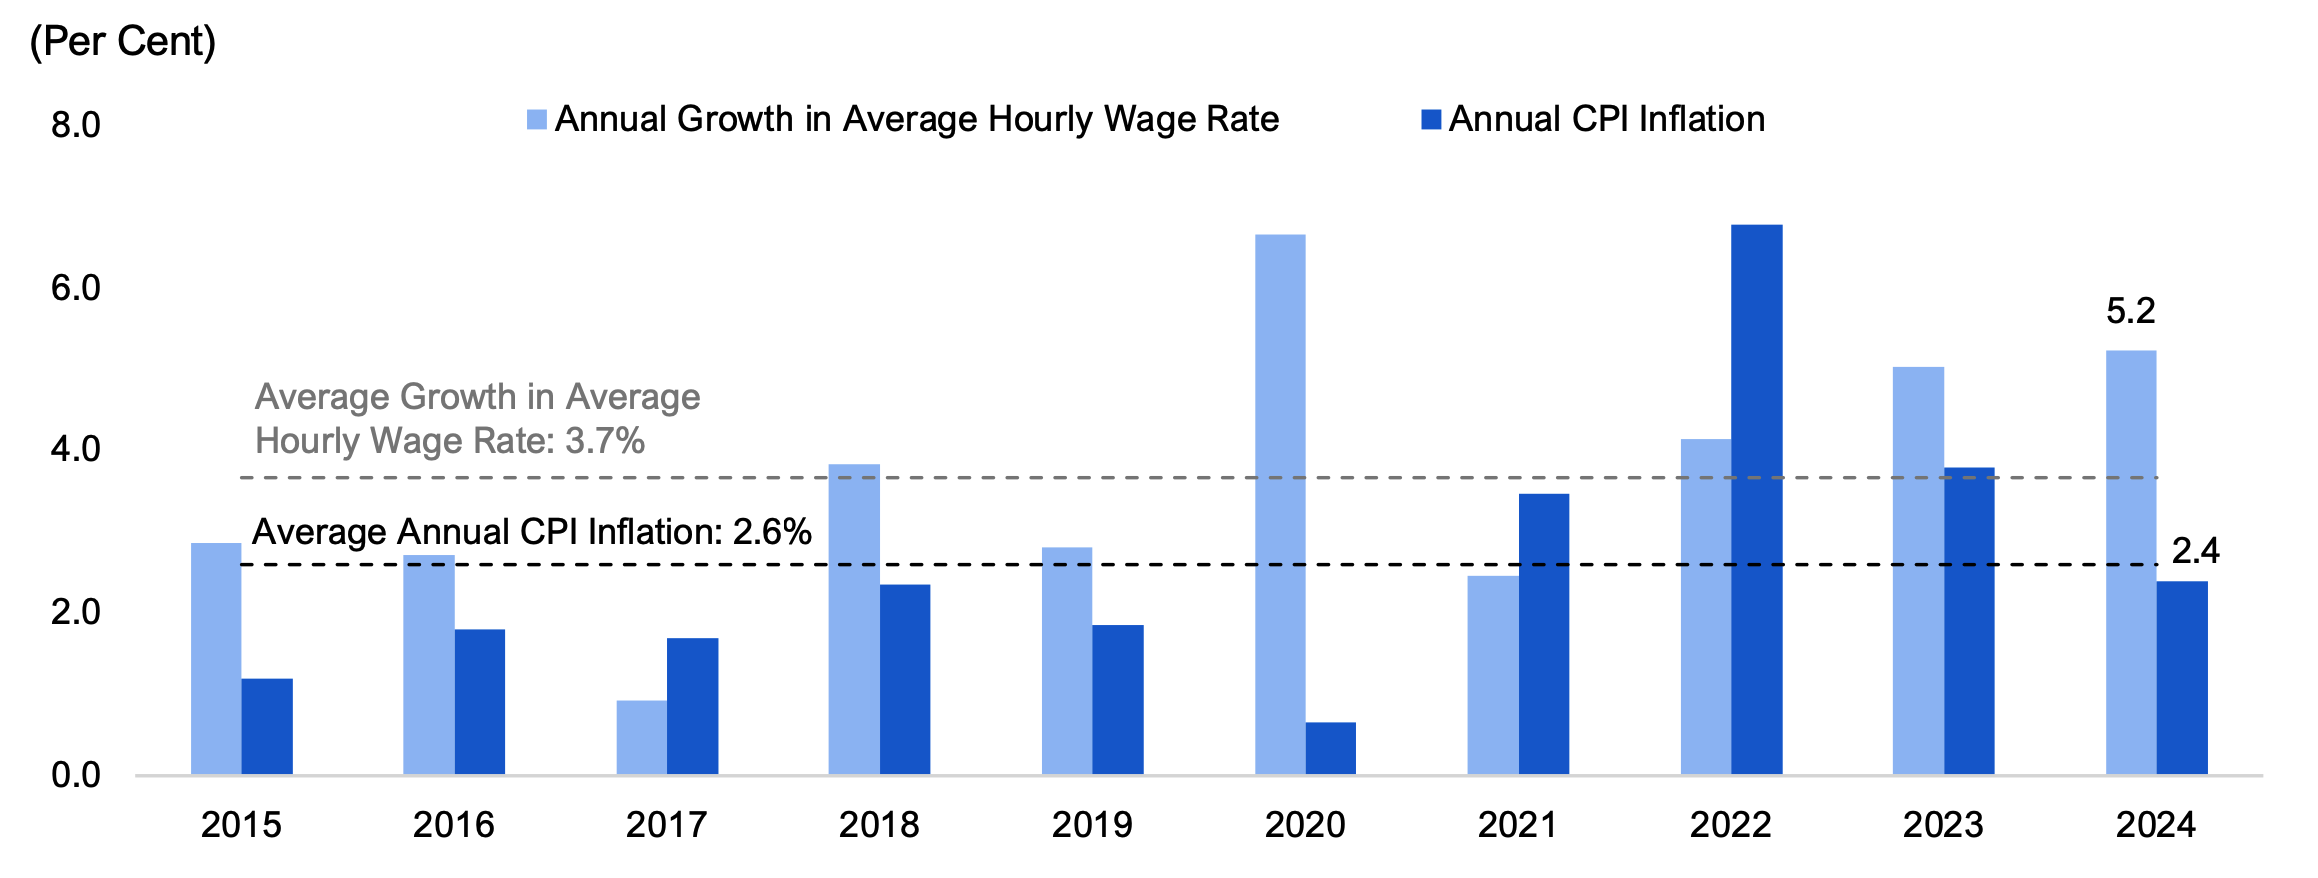
The average hourly wage of Ontarians increased 5.2 per cent to $36.44 in 2024, the third fastest pace on record back to 1998 and more than double the 2.4 per cent annual CPI inflation rate. Ontario’s average hourly wage gains exceeded the CPI inflation rate in 2023 and 2024, after trailing inflation in 2021 and 2022.
Figure 4 Average hourly wage growth outpaced inflation in 2024
Source: Statistics Canada: Labour Force Survey: Table 14-10-0064-01 and Consumer Price Index: Table 18-10-0005-01
Accessible version
| Year | Annual Growth in Average Hourly Wage Rate (Per Cent) |
Annual CPI Inflation (Per Cent) |
|---|---|---|
| 2015 | 2.9 | 1.2 |
| 2016 | 2.7 | 1.8 |
| 2017 | 0.9 | 1.7 |
| 2018 | 3.8 | 2.4 |
| 2019 | 2.8 | 1.9 |
| 2020 | 6.7 | 0.7 |
| 2021 | 2.5 | 3.5 |
| 2022 | 4.1 | 6.8 |
| 2023 | 5.0 | 3.8 |
| 2024 | 5.2 | 2.4 |
| Average | 3.7 | 2.6 |
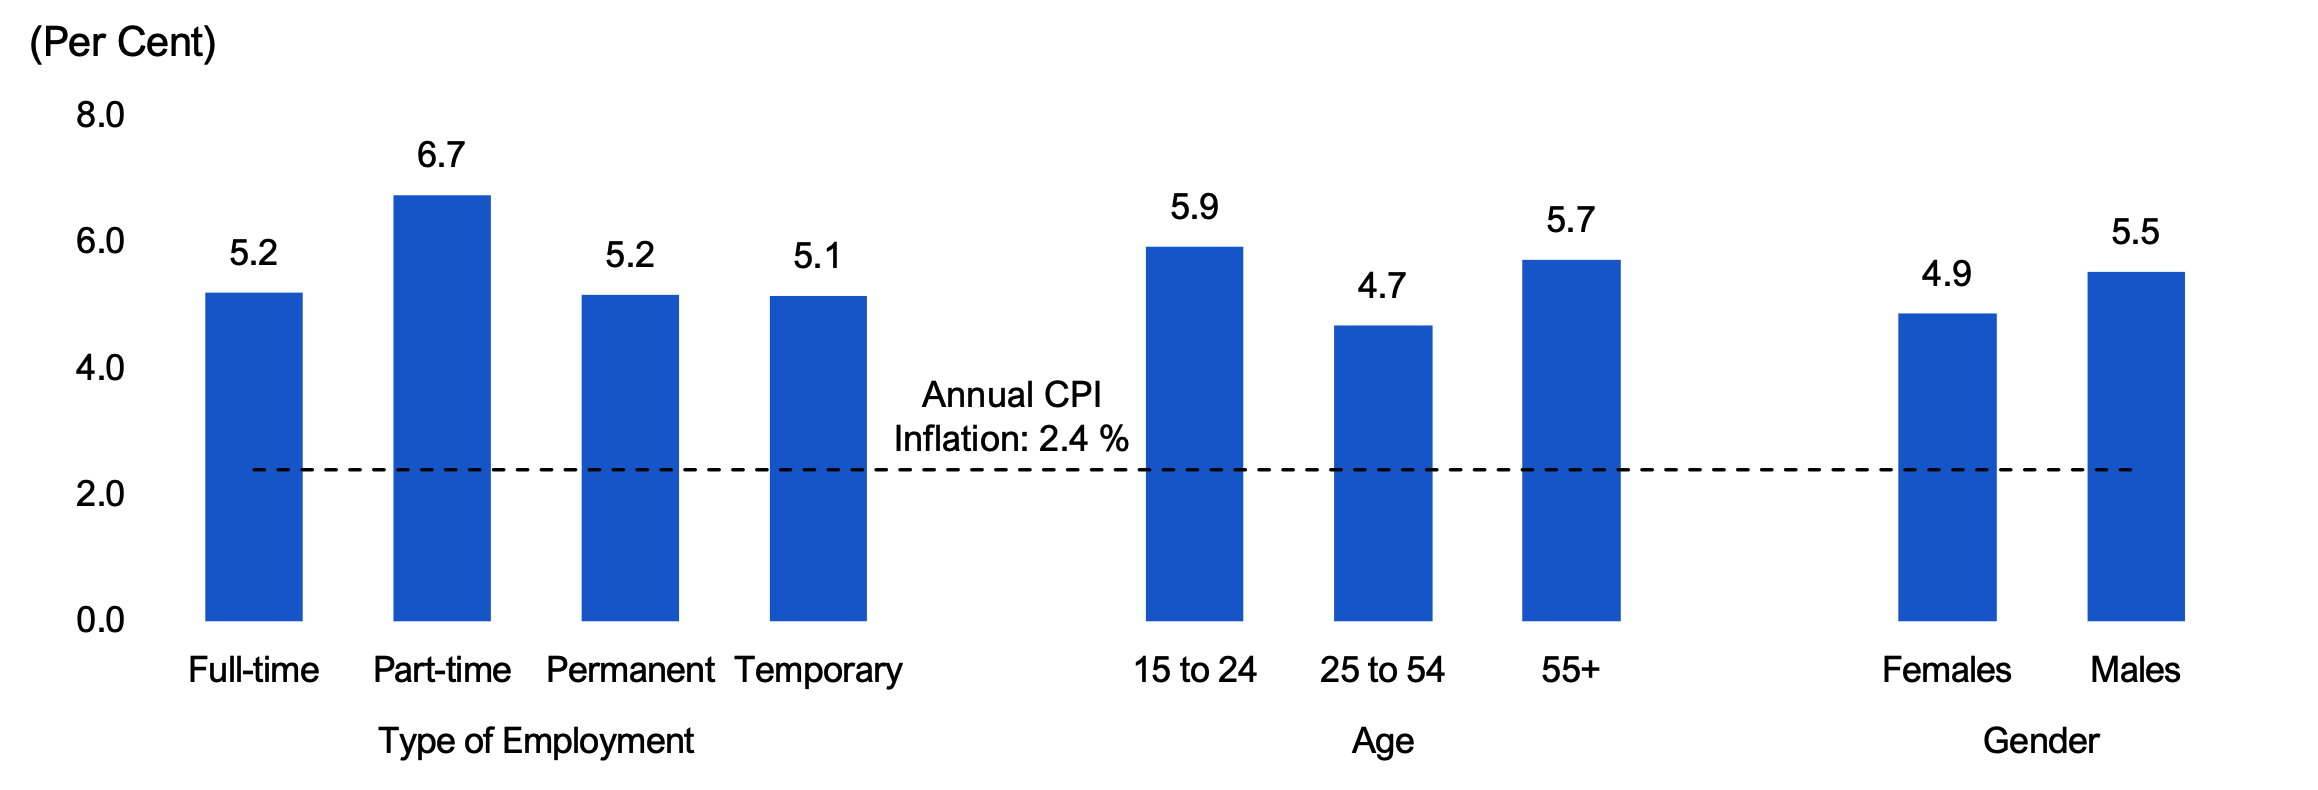
Wage growth was above the 2.4 per cent inflation rate for all major groups of workers. Wages for part-time employees increased by 6.7 per cent, above the 5.2 per cent growth among full-time workers. Wages for temporary workers increased by 5.1 per cent, similar to the 5.2 per cent gain among permanent workers. Across the broader age groups, youth saw the fastest average wage gains of 5.9 per cent, followed by older workers (5.7 per cent) and core-aged workers (4.7 per cent). Average wage growth for male workers (5.5 per cent) outpaced that for female workers (4.9 per cent).
Figure 5 Average hourly wage growth was above inflation for all major groups in 2024
Source: Statistics Canada: Labour Force Survey: Tables 14-10-0064-01 and 14-10-0066-01
Accessible version
| Annual Growth in Average Hourly Wage Rate (Per Cent) |
Annual CPI Inflation (Per Cent) |
||
|---|---|---|---|
| Type of Employment | Full-time | 5.2 | 2.4 |
| Part-time | 6.7 | ||
| Permanent | 5.2 | ||
| Temporary | 5.1 | ||
| Age | 15 to 24 | 5.9 | |
| 25 to 54 | 4.7 | ||
| 55+ | 5.7 | ||
| Gender | Females | 4.9 | |
| Males | 5.5 |
Wage growth in majority of industries and occupation groups exceeded inflation
Of the 16 major industry groups, 14 industries saw their average hourly wage rate increase faster than inflation. Utilities, the group with the highest average hourly wage rate among all industries, recorded the strongest annual wage growth (12.6 per cent). The second highest wage growth (7.0 per cent) was in professional, scientific and technical services, which had the second highest average hourly wage rate among all industries as well as the largest increase in employment in 2024. Workers in agriculture and business, building and other support services, which had some of the lowest average hourly wage rates among all industries, saw their average hourly wage rates decline in 2024.
| Industry | Average Hourly Wage Rate in 2024 ($) |
Annual Change in Average Hourly Wage Rate in 2024 (Per Cent) |
|---|---|---|
| Utilities | 57.13 | 12.6 |
| Professional, scientific and technical services | 49.67 | 7.0 |
| Other services | 31.17 | 6.5 |
| Health care and social assistance | 34.41 | 5.9 |
| Accommodation and food services | 20.49 | 5.3 |
| Transportation and warehousing | 33.24 | 5.1 |
| Wholesale and retail trade | 28.07 | 5.0 |
| Public administration | 46.65 | 4.6 |
| Construction | 37.49 | 4.5 |
| Manufacturing | 34.74 | 4.5 |
| Finance, insurance, real estate, rental and leasing | 44.99 | 4.0 |
| Forestry, fishing, mining, quarrying, oil and gas | 46.40 | 4.0 |
| Information, culture and recreation | 33.40 | 3.9 |
| Educational services | 41.24 | 3.4 |
| Business, building and other support services | 26.19 | -1.4 |
| Agriculture | 24.54 | -4.6 |
| Total employees, all industries | 36.44 | 5.2 |
Across 34 different occupation groups, the average hourly wage for 24 occupations increased above inflation in 2024. Those with the strongest wage growth were professional occupations in art and culture (15.3 per cent), middle management occupations in retail and wholesale trade and customer services (13.7 per cent), and middle management occupations in trades, transportation, production and utilities (7.2 per cent). Average hourly wages in three groups declined in 2024, including occupations (-13.4 per cent) and support occupations (-2.2 per cent) in art, culture and sport, and workers and labourers in natural resources, agriculture and related production (-3.0 per cent).
| National Occupational Classification (NOC) | Average Hourly Wage Rate in 2024 ($) |
Annual Change in Average Hourly Wage Rate in 2024 (Per Cent) |
|---|---|---|
| Management occupations | 63.70 | 6.8 |
| Legislative and senior management occupations | 96.75 | 3.3 |
| Specialized middle management occupations | 65.95 | 5.6 |
| Middle management occupations in retail and wholesale trade and customer services | 51.99 | 13.7 |
| Middle management occupations in trades, transportation, production and utilities | 59.48 | 7.2 |
| Business, finance and administration occupations except management | 35.09 | 3.2 |
| Professional occupations in finance and business | 44.85 | 2.7 |
| Administrative and financial supervisors and specialized administrative occupations | 35.27 | 2.6 |
| Administrative occupations and transportation logistics occupations | 30.69 | 2.1 |
| Administrative and financial support and supply chain logistics occupations | 25.66 | 3.3 |
| Natural and applied sciences and related occupations except management | 47.89 | 4.5 |
| Professional occupations in natural and applied sciences | 52.80 | 5.2 |
| Technical occupations related to natural and applied sciences | 36.27 | 4.9 |
| Health occupations except management | 36.77 | 6.0 |
| Professional occupations in health | 45.60 | 6.3 |
| Technical occupations in health | 36.55 | 6.2 |
| Assisting occupations in support of health services | 24.96 | 4.6 |
| Occupations in education, law and social, community and government services except management | 41.43 | 2.6 |
| Professional occupations in law, education, social, community and government services | 47.26 | 2.4 |
| Front-line public protection services and paraprofessional occupations in legal, social, community, education services | 32.61 | 4.5 |
| Assisting occupations in education and in legal and public protection | 29.67 | 1.3 |
| Care providers and public protection support occupations and student monitors, crossing guards and related occupations | 22.23 | 5.3 |
| Occupations in art, culture, recreation and sport except management | 30.04 | 2.2 |
| Professional occupations in art and culture | 41.45 | 15.3 |
| Technical occupations in art, culture and sport | 34.10 | 2.8 |
| Occupations in art, culture and sport | 23.46 | -13.4 |
| Support occupations in art, culture and sport | 21.20 | -2.2 |
| Sales and service occupations except management | 23.51 | 5.9 |
| Retail sales and service supervisors and specialized occupations in sales and services | 29.60 | 5.4 |
| Occupations in sales and services | 26.45 | 4.4 |
| Sales and service representatives and other customer and personal services occupations | 24.56 | 5.8 |
| Sales and service support occupations | 19.06 | 5.5 |
| Trades, transport and equipment operators and related occupations except management | 31.48 | 2.4 |
| Technical trades and transportation officers and controllers | 36.52 | 2.7 |
| General trades | 28.78 | 4.5 |
| Mail and message distribution, other transport equipment operators and related maintenance workers | 27.73 | 1.1 |
| Helpers and labourers and other transport drivers, operators and labourers | 24.35 | 1.2 |
| Natural resources, agriculture and related production occupations except management | 26.97 | 1.0 |
| Supervisors and occupations in natural resources, agriculture and related production | 37.74 | 0.8 |
| Workers and labourers in natural resources, agriculture and related production | 22.36 | -3.0 |
| Occupations in manufacturing and utilities except management | 28.42 | 4.4 |
| Supervisors, central control and process operators in processing, manufacturing and utilities and aircraft assemblers and inspectors | 40.22 | 2.4 |
| Machine operators, assemblers and inspectors in processing, manufacturing and printing | 26.01 | 5.9 |
| Labourers in processing, manufacturing and utilities | 22.24 | 5.4 |
| Total employees, all occupations | 36.44 | 5.2 |
Footnotes
[1] As the economy recovered from the COVID-19 pandemic shutdowns, employment in Ontario increased by 361,400 (5.1 per cent) in 2021 and 359,300 (4.9 per cent) in 2022, the fastest two-year job gain on record back to 1976.
[2] Defined as the percentage of the working-age population (15 years and older) who are participating in the labour market whether employed or unemployed and looking for work.
[3] The increase in Ontario’s working-age population in 2024 was the largest on record in the Labour Force Survey back to 1976.
[4] Job losses include layoffs and dismissals as well as voluntary exits such as returning to school and retiring.
[5] Defined as the percentage of the working-age population who are employed.
[6] Statistics Canada: Labour Force Survey: Table 14-10-0023-01.
[7] Of the 528,200 male youth who were employed in 2024, 131,000 worked in wholesale and retail trade, 78,900 worked in accommodation and food services, and 59,400 worked in construction, for a total of 269,300, representing 51.0 per cent of employed male youths. These industries employed 22.9 per cent of all non-youth workers in 2024.
[8] Other services include industries related to repair and maintenance of motor vehicles, machinery and equipment and other products; personal care services, funeral services, laundry services, and other services to individuals; religious, grant-making, civic, and professional and similar organizations; as well as private households engaged in employing workers, such as cooks, maids, gardeners or caretakers, and babysitting. For details, see North American Industry Classification System (NAICS) Canada 2022 Version 1.0.
[9] Defined as the number of job vacancies expressed as a percentage of labour demand, that is, all occupied and vacant jobs.
[10] The ratio can be interpreted as the number of unemployed people per job vacancy.
[11] The CMA Belleville – Quinte West was excluded due to high volatility in its labour market data.
[12] Statistics Canada: Labour Force Survey: Table 14-10-0468-01.