


Summary
- This report describes Ontario’s recent economic performance based on the latest economic indicators.
- In the fourth quarter of 2024, Ontario’s real Gross Domestic Product (GDP), the broadest measure of economic activity, increased by a solid 0.6% from the previous quarter, led by gains in household spending, international exports and residential investment, partially offset by a reduction in inventories.
- The latest economic indicators suggest mostly positive results for Ontario’s economy in the first quarter of 2025, with gains in employment, retail and wholesale trade, manufacturing sales, and exports. However, housing market activity showed significant weakness, with both home resales and housing starts sharply lower.
- In an April 2025 report, which reviewed the potential impacts of US tariffs on Ontario’s economy, the FAO estimated that Ontario’s annual real GDP growth would slow to 0.6% in 2025.[1] Economic indicators for 2025 Q1 are largely consistent with that projection; however, subsequent tariff changes[2] are expected to have both positive and negative impacts. The FAO will continue to monitor Ontario’s economic performance and will update its forecast for economic growth in its next Economic and Budget Outlook report.
Introduction and Background
The Ontario Economic Monitor presents an overview of the latest trends in the Ontario economy based on the most recent economic data as of May 23, 2025.
Each quarter, the Government of Ontario (the Province) releases the Ontario Economic Accounts (OEA), which provides data on GDP, a comprehensive measure of economic activity in Ontario. The OEA is produced by the Ontario Ministry of Finance and released approximately four months after the quarter closes.[3] The OEA is available on the Province’s Ontario Economic Accounts website.
In addition, Statistics Canada and other organizations produce many monthly economic indicators that provide insight into Ontario’s economy. These form part of the underlying data used to produce the OEA. This report focusses on these indicators, which are typically released one to two months after the data are collected, and provides more up-to-date information on Ontario’s economic performance in the most recent quarter.[4]
The report contains the following sections:
- a summary of the OEA describing the province’s economic performance in the fourth quarter of 2024 (2024 Q4);
- a summary of the most recent monthly economic indicators for Ontario’s households and businesses in 2025 Q1; and
- an assessment of the FAO’s “tariff scenario” economic outlook[5] based on recent economic trends.
For definitions of the various economic indicators covered in this report, as well as technical definitions of economic concepts, see the report’s Glossary. For information on the data used, see the report’s Methodology.
2024 Fourth Quarter Ontario Economic Accounts
The Ontario Economic Accounts (OEA) for the fourth quarter (October to December) of 2024 were released on April 11, 2025. The OEA provides a comprehensive assessment of Ontario’s recent economic performance.
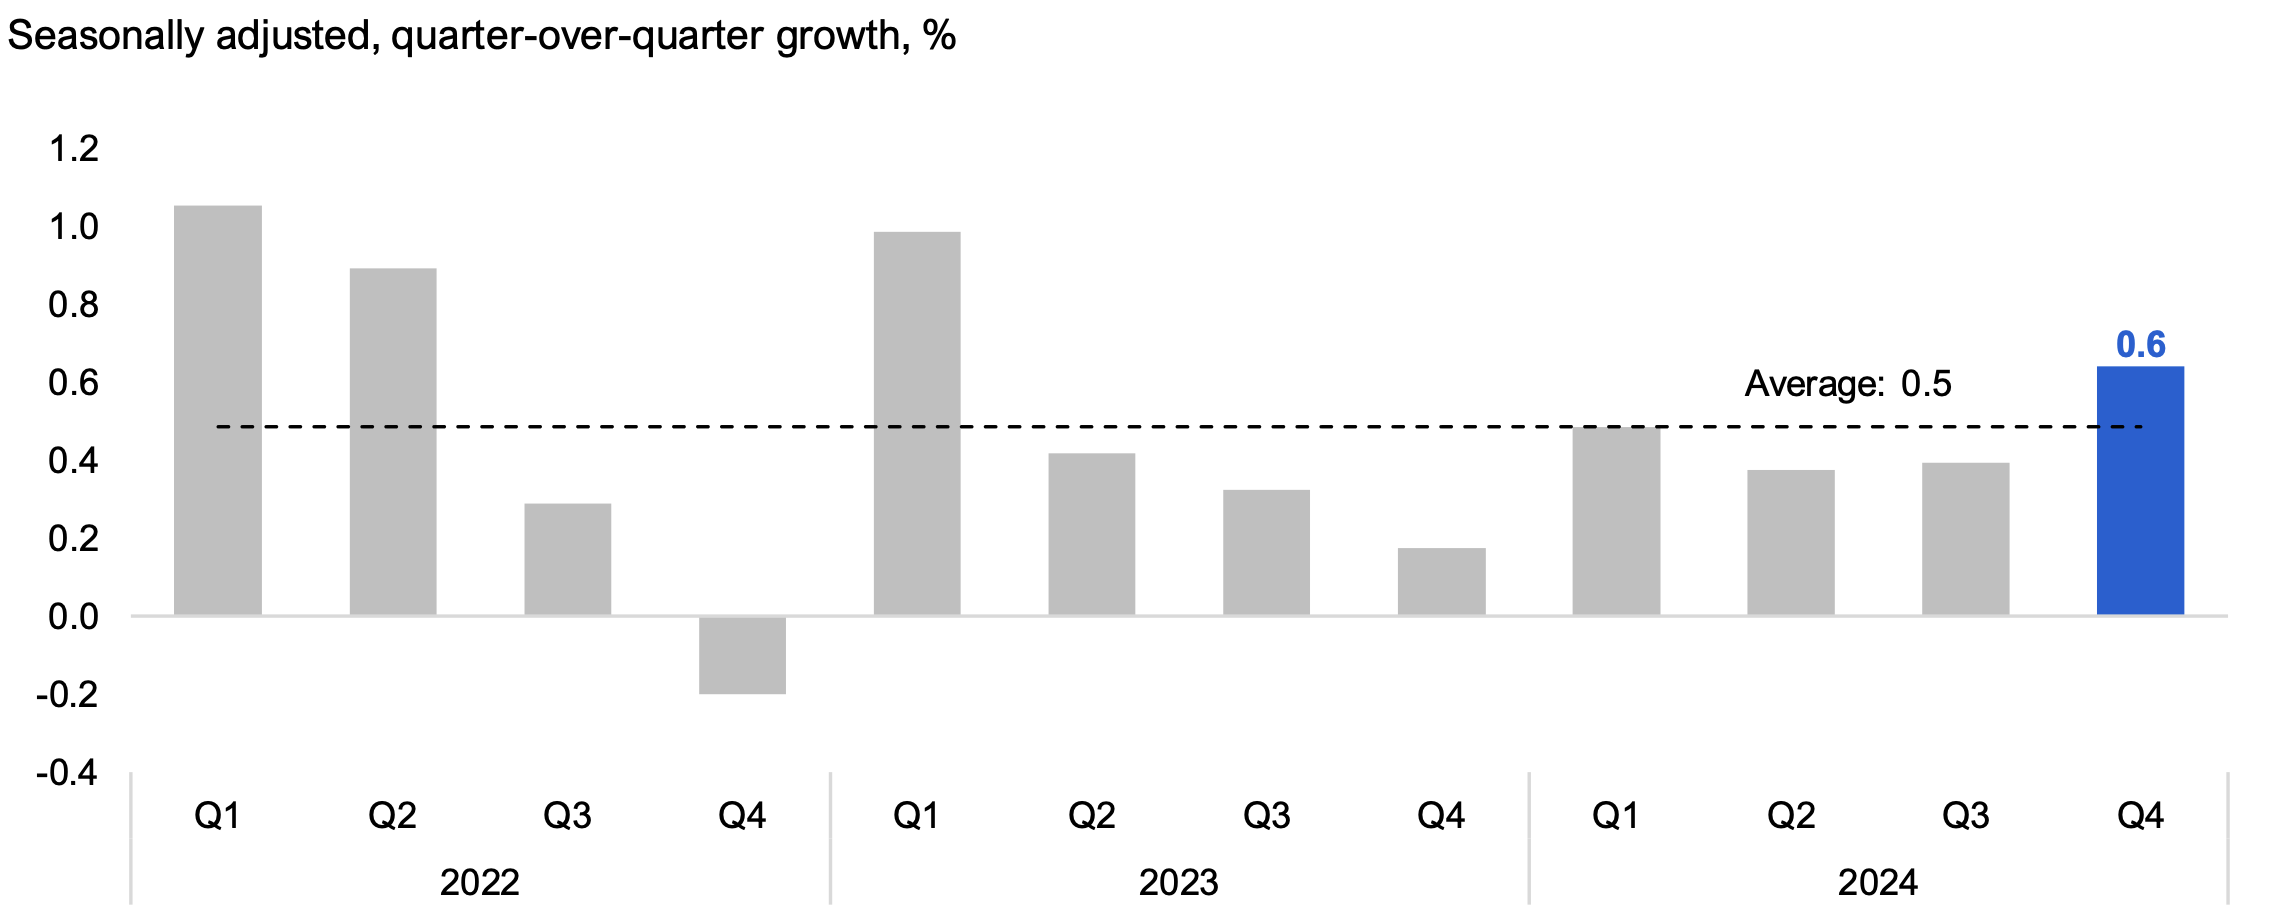
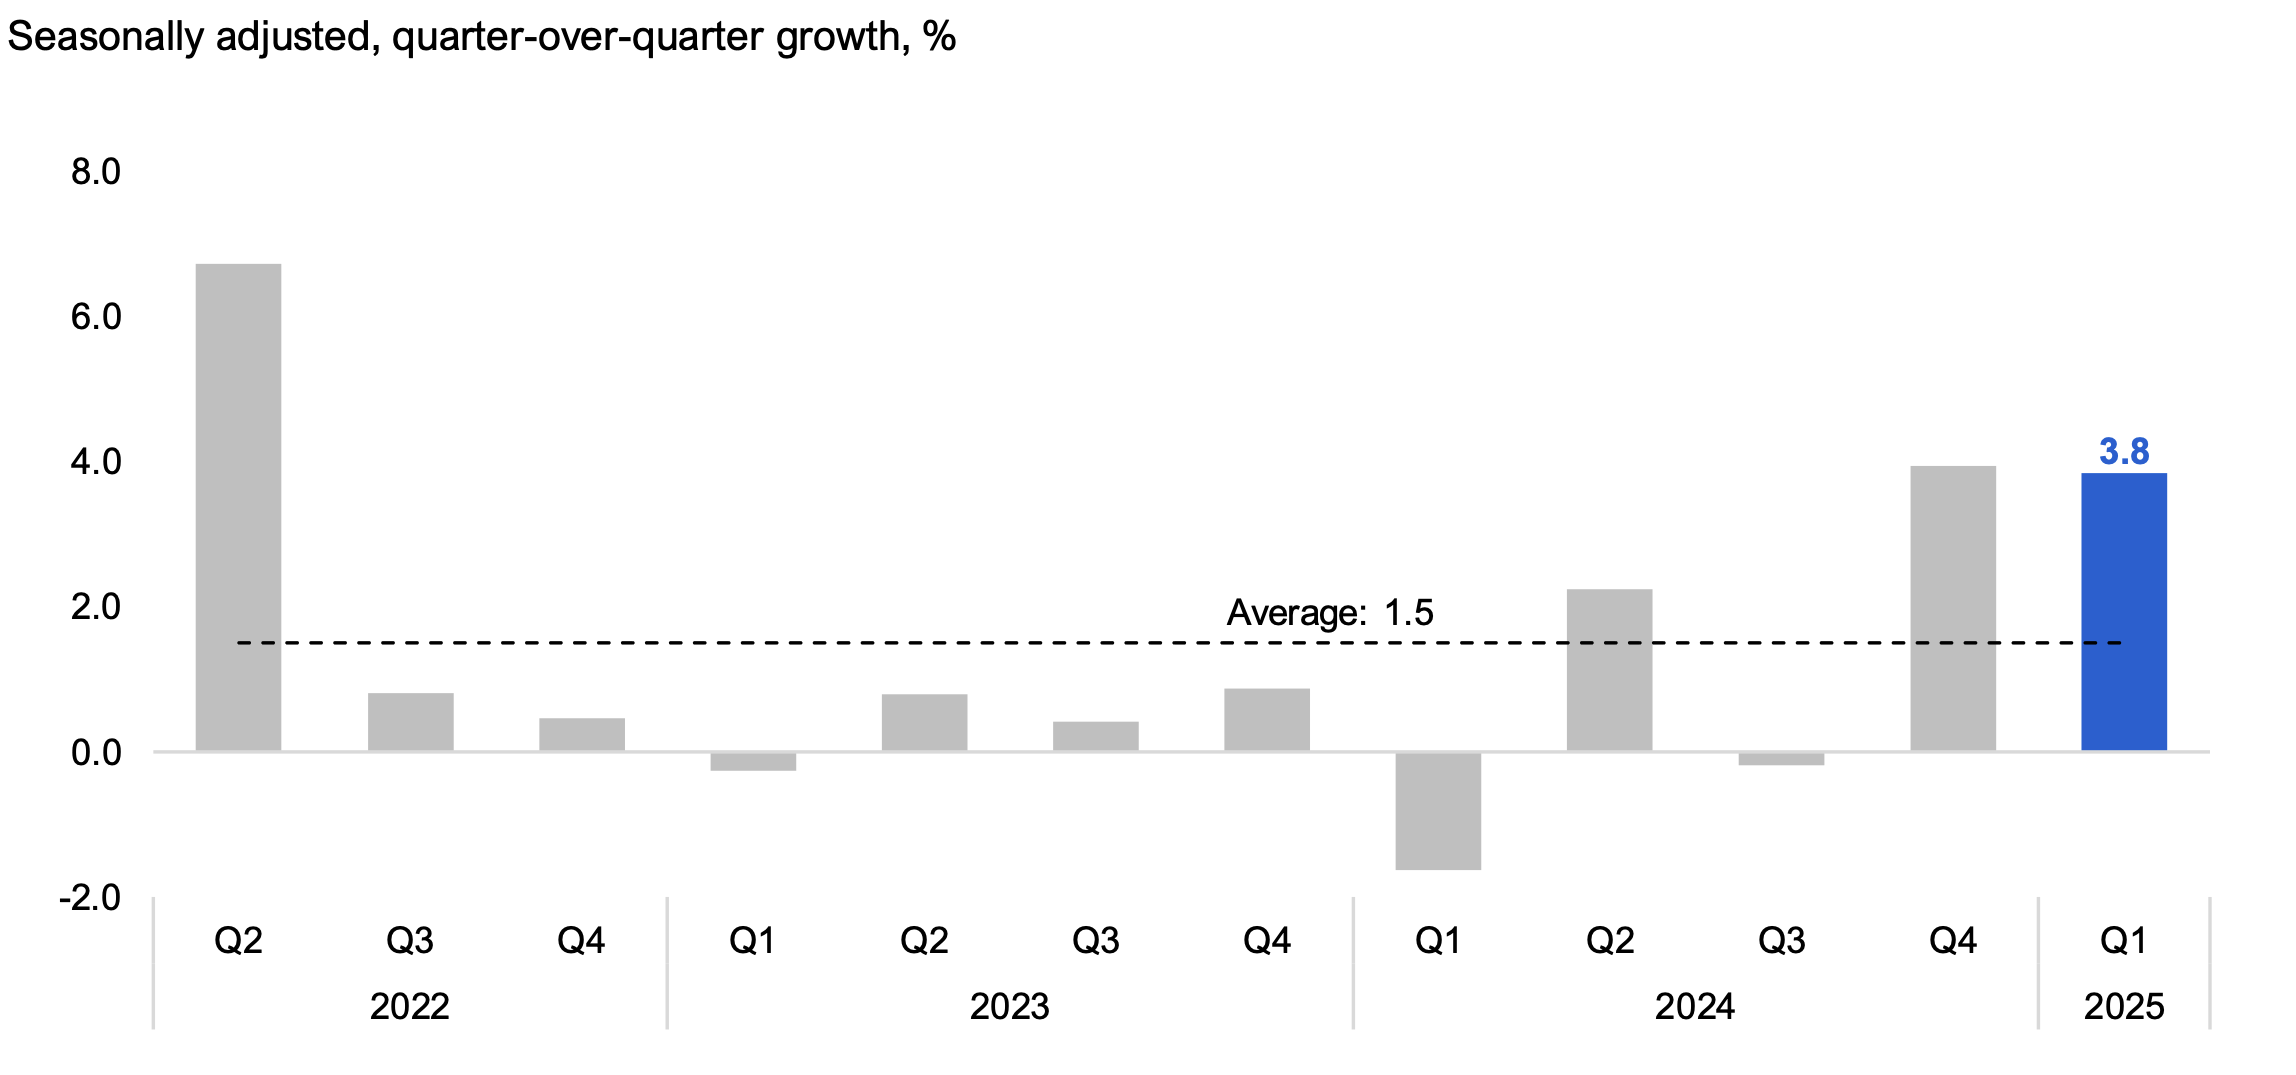
Real Gross Domestic Product (GDP), the broadest measure of economic activity, grew by a solid 0.6% in 2024 Q4, up from a 0.4% increase in 2024 Q3, as gains in household consumption, international exports and residential investment were partially offset by a reduction in inventories. Lower interest rates and ongoing job gains helped both real household spending (1.7%) and residential investment (4.6%) to record their strongest increases in more than two years. Exports also contributed to overall economic growth, rising by 1.9% following two consecutive quarterly declines.[6] Imports were little changed in the quarter, edging up by 0.5%. Overall growth was constrained by a reduction in inventories, as firms met demand by running down stock levels.
Figure 1 Real GDP grew by a strong 0.6% in 2024 Q4
Source: Ontario Economic Accounts and FAO.
Accessible version
| Seasonally adjusted, quarter-over-quarter growth, % | Average | |
|---|---|---|
| 2022 Q1 | 1.1 | 0.5 |
| 2022 Q2 | 0.9 | 0.5 |
| 2022 Q3 | 0.3 | 0.5 |
| 2022 Q4 | -0.2 | 0.5 |
| 2023 Q1 | 1.0 | 0.5 |
| 2023 Q2 | 0.4 | 0.5 |
| 2023 Q3 | 0.3 | 0.5 |
| 2023 Q4 | 0.2 | 0.5 |
| 2024 Q1 | 0.5 | 0.5 |
| 2024 Q2 | 0.4 | 0.5 |
| 2024 Q3 | 0.4 | 0.5 |
| 2024 Q4 | 0.6 | 0.5 |
For 2025 Q1, most economic indicators showed positive results except the housing market (see Ontario’s 2025 First Quarter Economic Indicators), suggesting that real GDP growth continued in the quarter.
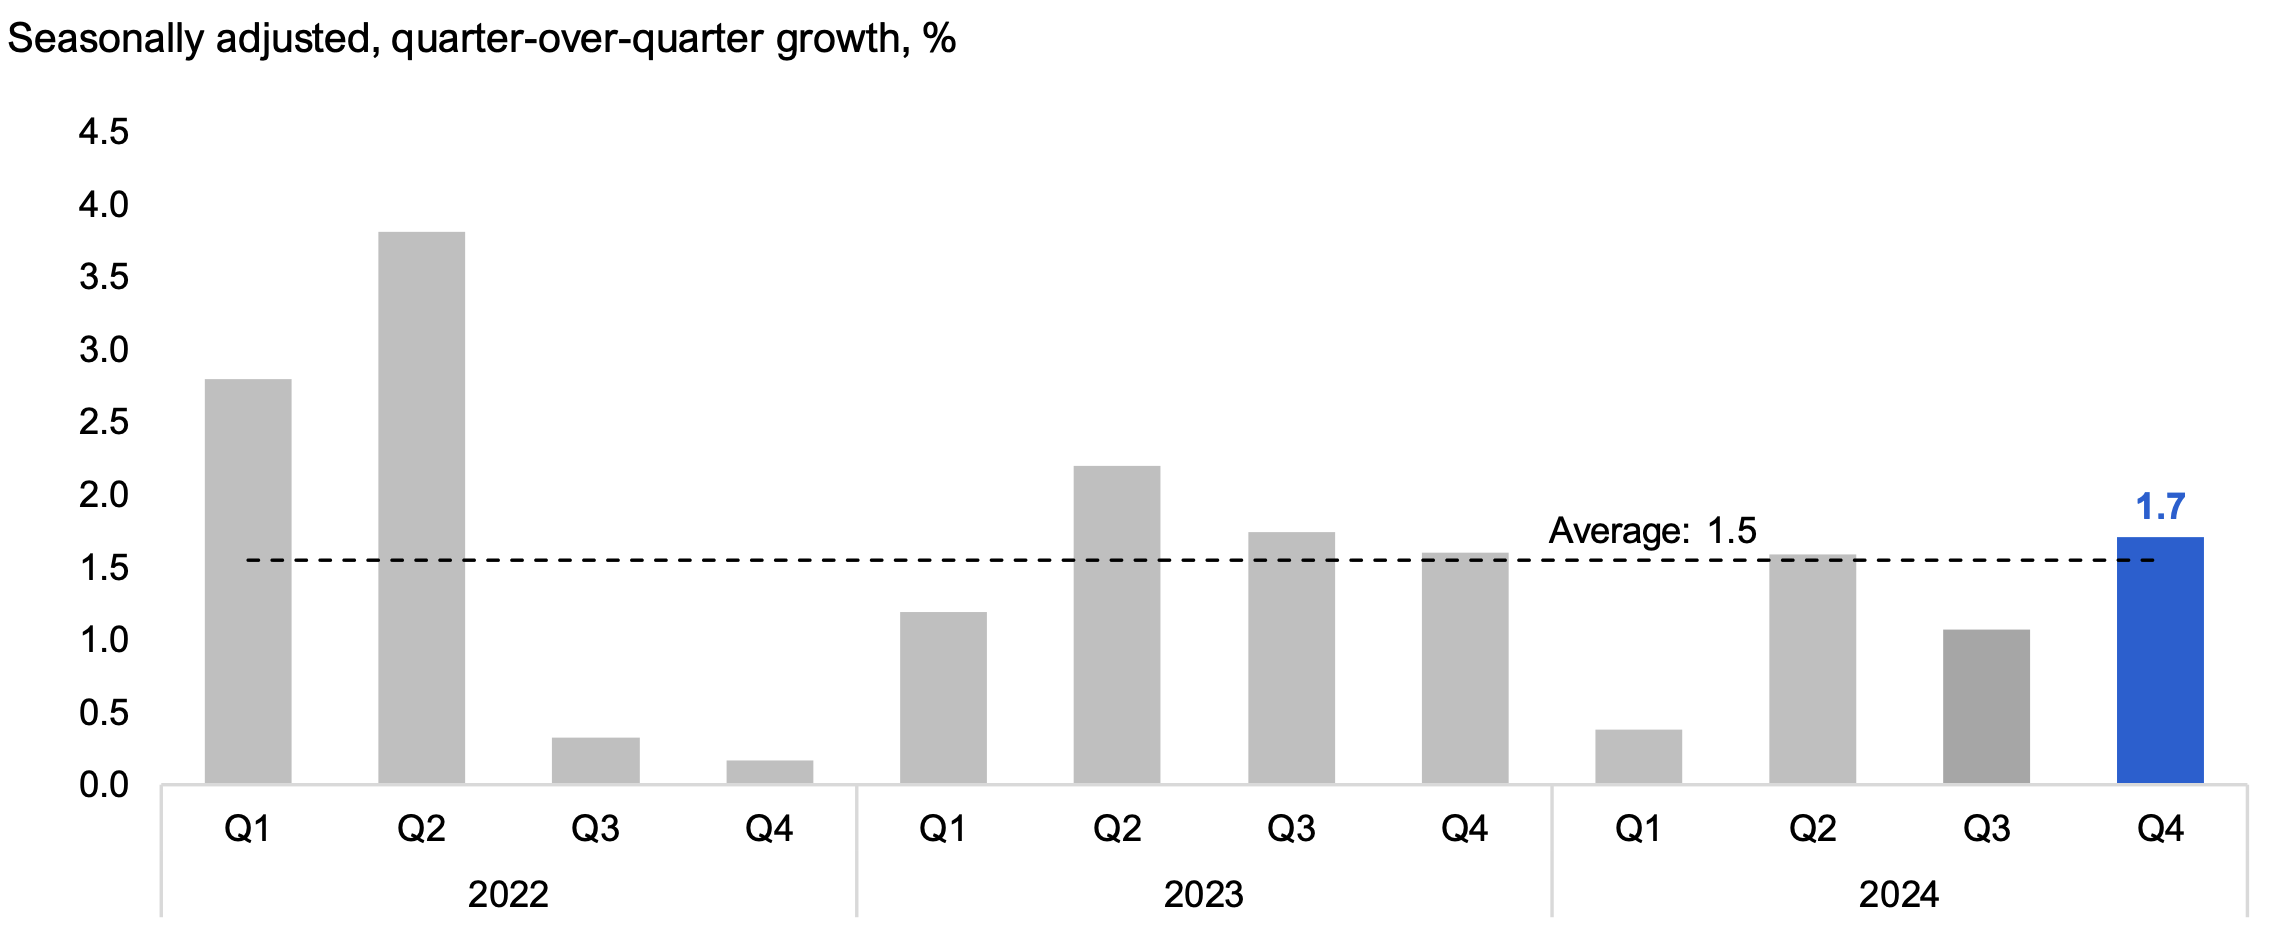
Nominal GDP, the broadest measure of the tax base and which includes inflation, increased by a strong 1.7% in 2024 Q4, up from growth of 1.1% in 2024 Q3. The increase in nominal GDP in 2024 Q4 reflected gains in corporate profits (7.6%), labour income (1.3%) and unincorporated business, farm and rental income (2.9%).
Figure 2 Nominal GDP increased by a solid 1.7% in 2024 Q4
Source: Ontario Economic Accounts and FAO.
Accessible version
| Seasonally adjusted, quarter-over-quarter growth, % | Average | |
|---|---|---|
| 2022 Q1 | 2.8 | 1.5 |
| 2022 Q2 | 3.8 | 1.5 |
| 2022 Q3 | 0.3 | 1.5 |
| 2022 Q4 | 0.2 | 1.5 |
| 2023 Q1 | 1.2 | 1.5 |
| 2023 Q2 | 2.2 | 1.5 |
| 2023 Q3 | 1.7 | 1.5 |
| 2023 Q4 | 1.6 | 1.5 |
| 2024 Q1 | 0.4 | 1.5 |
| 2024 Q2 | 1.6 | 1.5 |
| 2024 Q3 | 1.1 | 1.5 |
| 2024 Q4 | 1.7 | 1.5 |
For more detailed information on Ontario’s economic performance in 2024 Q4, see the Ontario Economic Accounts.
Ontario’s 2025 First Quarter Economic Indicators
The latest economic indicators suggest mostly positive results for Ontario’s economy in 2025 Q1. However, housing market activity showed significant weakness.
Households
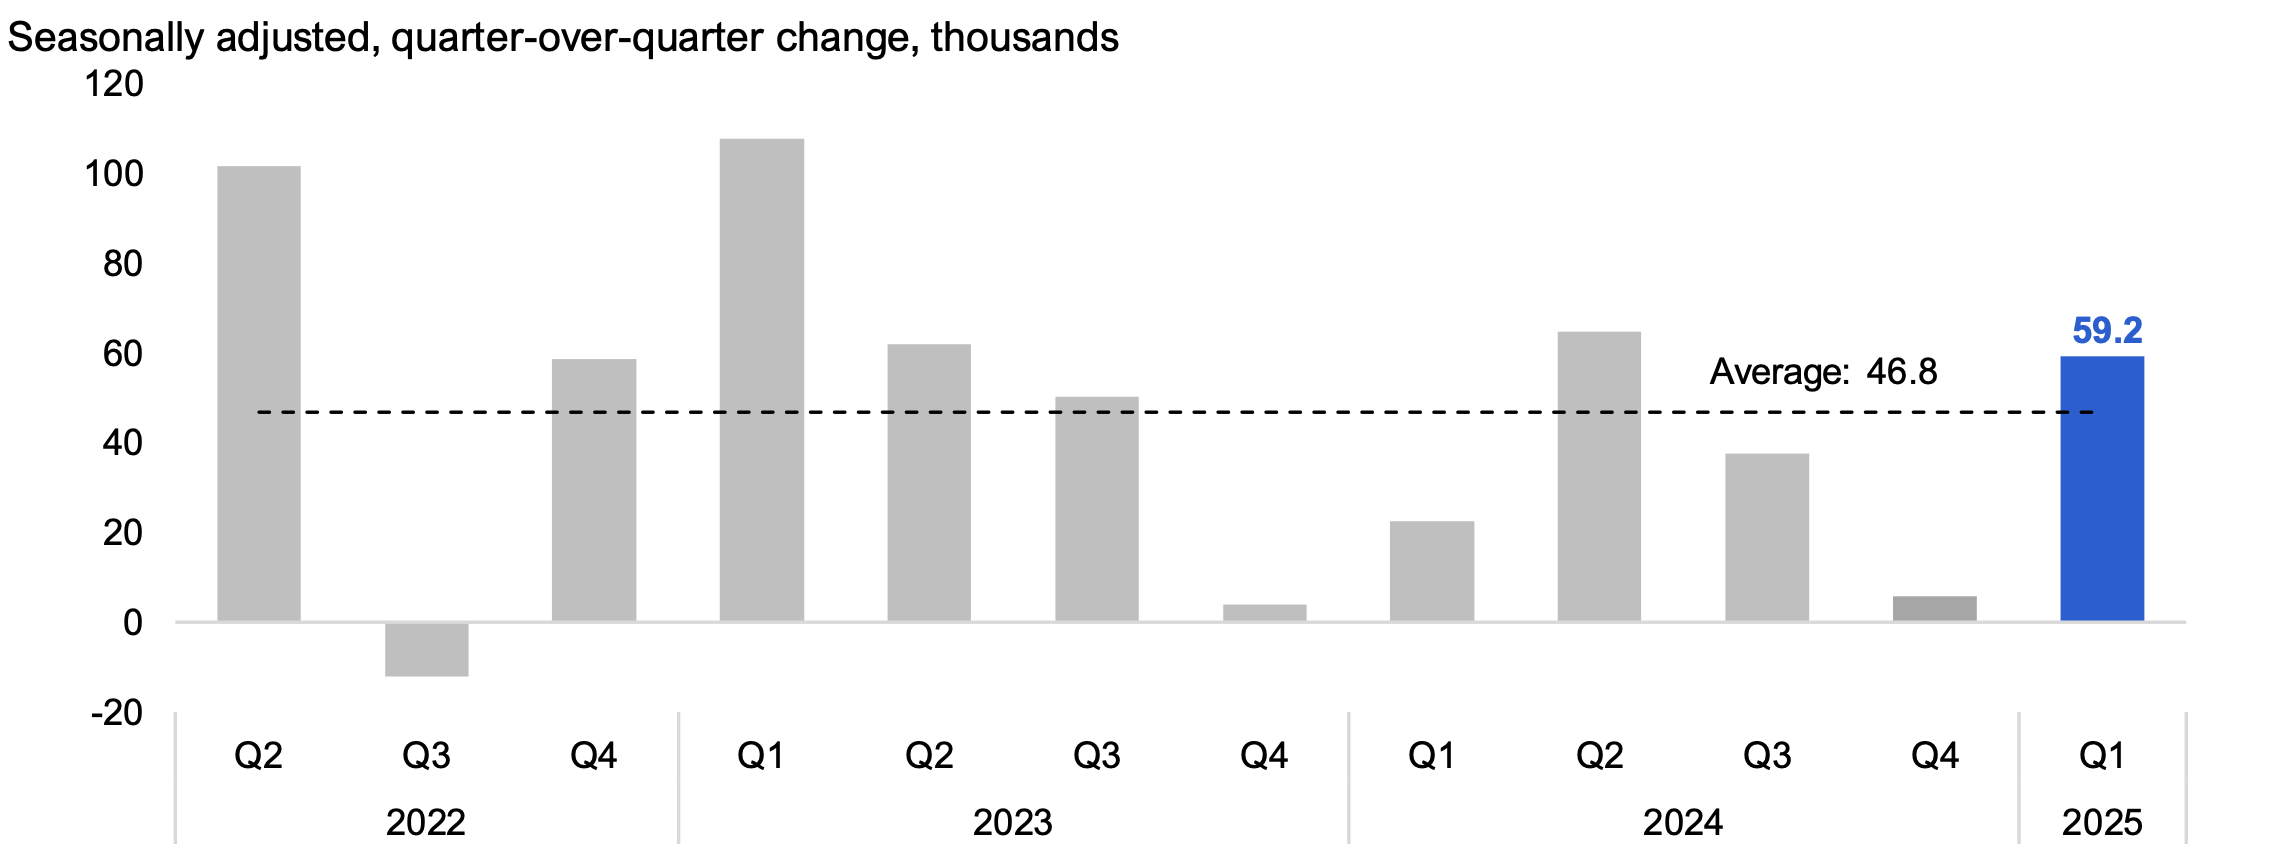
Employment in Ontario rose by a strong 59,200 (or 0.7%) in 2025 Q1, following modest job gains in 2024 Q4 (5,800, or 0.1%). Both part-time employment (+40,000) and full-time employment (+19,100) increased in 2025 Q1. Job gains were observed mainly in the private sector (+51,800), with smaller gains in the public sector (+10,400). Self-employment declined (-3,000) in 2025 Q1, following three consecutive quarterly increases.
Figure 3 Employment rose by 59,200 jobs in 2025 Q1
Source: Statistics Canada Table 14-10-0287-01 and FAO.
Accessible version
| Seasonally adjusted, quarter-over-quarter change, thousands | Average | |
|---|---|---|
| 2022 Q2 | 101.7 | 46.8 |
| 2022 Q3 | -12.0 | 46.8 |
| 2022 Q4 | 58.5 | 46.8 |
| 2023 Q1 | 107.6 | 46.8 |
| 2023 Q2 | 62.0 | 46.8 |
| 2023 Q3 | 50.1 | 46.8 |
| 2023 Q4 | 3.9 | 46.8 |
| 2024 Q1 | 22.4 | 46.8 |
| 2024 Q2 | 64.6 | 46.8 |
| 2024 Q3 | 37.6 | 46.8 |
| 2024 Q4 | 5.8 | 46.8 |
| 2025 Q1 | 59.2 | 46.8 |
Employment of core-age workers (aged 25 to 54) rose by 44,500 (0.8%), and youth (aged 15 to 24) saw job gains of 15,000 (1.4%) in 2025 Q1. Employment of workers aged 55 and older was essentially unchanged.
By industry, the largest employment gains in 2025 Q1 were recorded in manufacturing (+25,200), accommodation and food services (+16,100), information, culture and recreation (+14,800), health care and social assistance (+9,800), and construction (+6,200). Notably, manufacturing job creation rebounded strongly (+3.1%) in 2025 Q1 after steep declines in the previous two quarters, leaving the sector’s employment level largely unchanged since 2023 Q3. While construction employment has increased in both 2024 Q4 and 2025 Q1, it remains 4.8% below the peak reached in 2023 Q2, reflecting in part weak home building activity.
In 2025 Q1, job losses were reported in professional, scientific and technical services (-10,900), business, building and other support services (-4,700), and finance, insurance and real estate (-3,700).
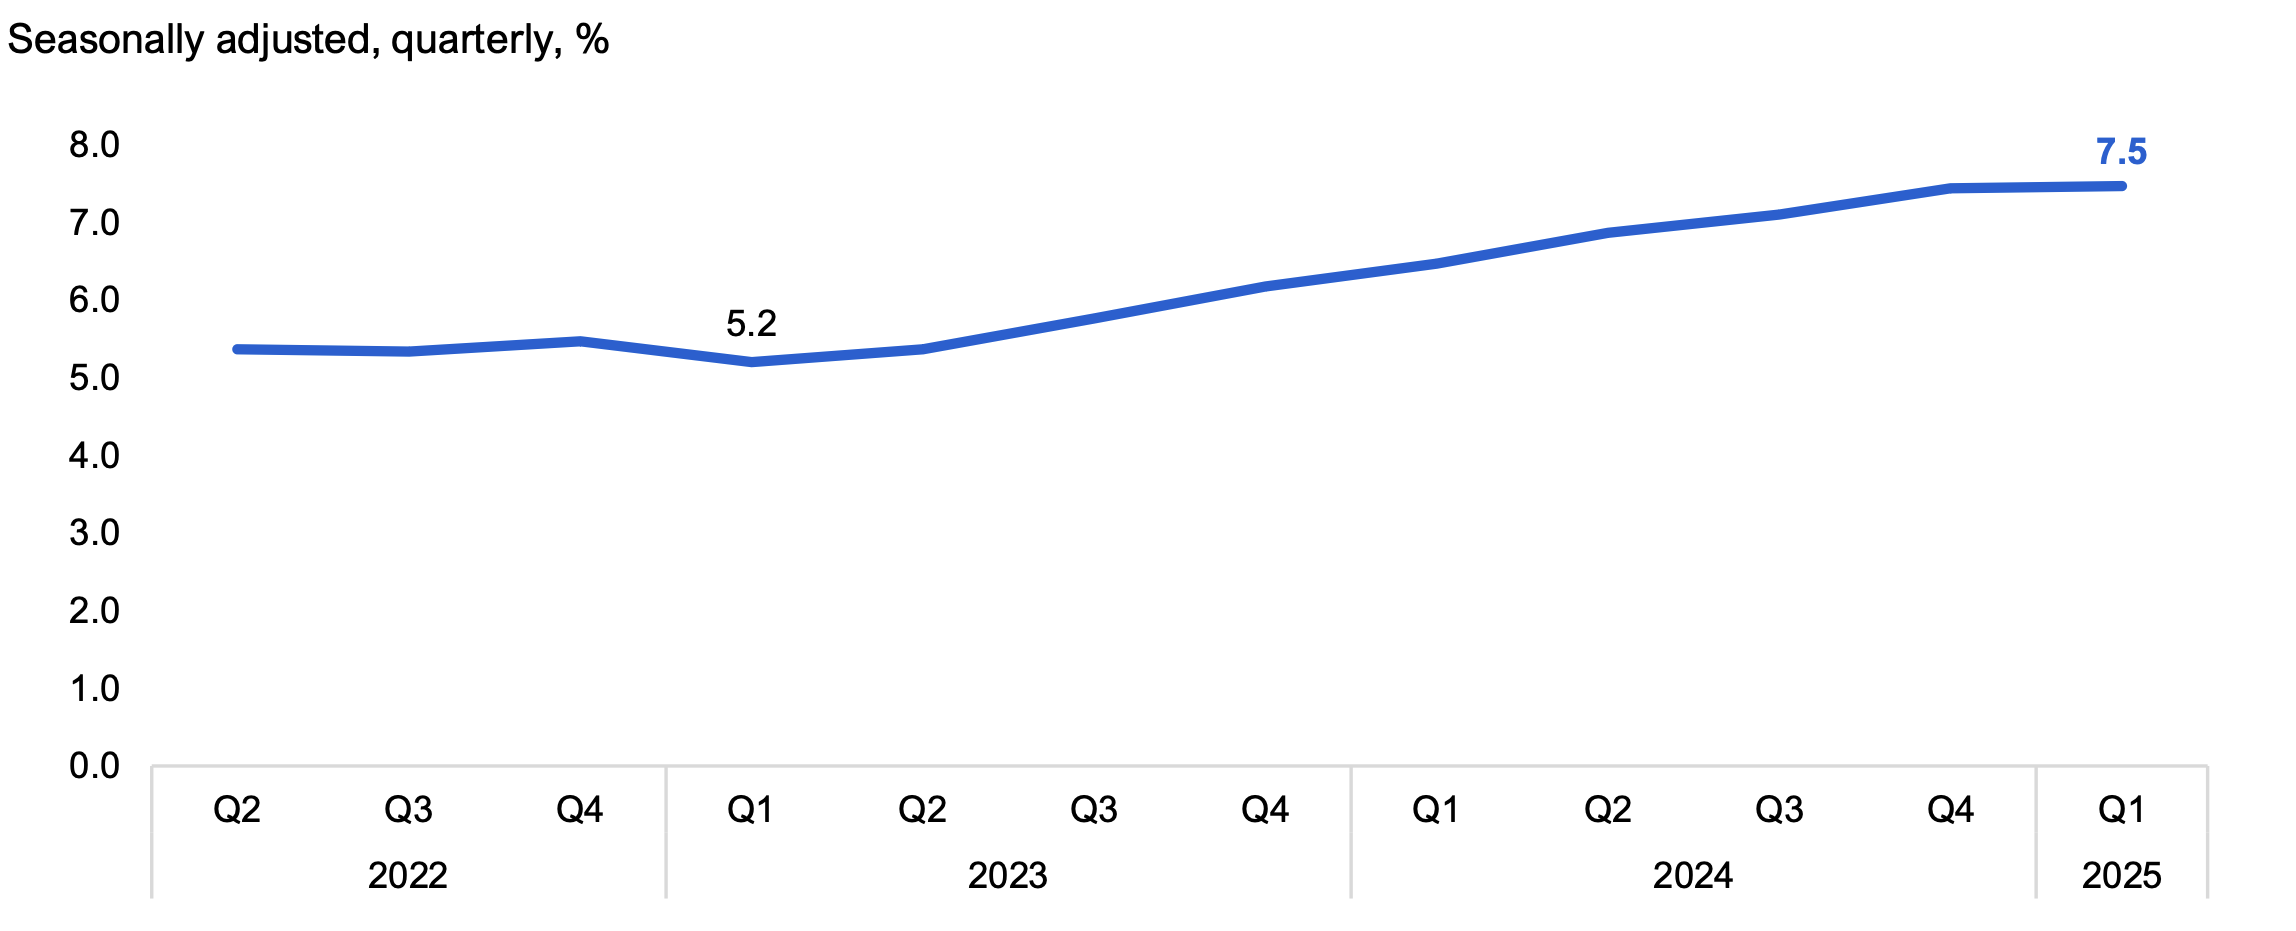
In the first quarter of 2025, more people entered the labour market than were hired. As a result, the unemployment rate rose for the eighth consecutive quarter, reaching 7.5%. This is 2.3 percentage points higher than the low of 5.2% recorded in 2023 Q1, and marks the highest unemployment rate since mid-2014, excluding the pandemic. The continued rise in the unemployment rate indicates that people entering the job market are having a harder time finding employment. In 2025 Q1, long-term unemployment accounted for 26.8% of total unemployment, reaching the highest share since mid-1997, excluding the pandemic.[7]
Figure 4 Unemployment rate rose for the eighth consecutive quarter reaching 7.5%
Source: Statistics Canada Table 14-10-0287-01 and FAO.
Accessible version
| Seasonally adjusted, quarterly, % | |
|---|---|
| 2022 Q2 | 5.4 |
| 2022 Q3 | 5.3 |
| 2022 Q4 | 5.5 |
| 2023 Q1 | 5.2 |
| 2023 Q2 | 5.4 |
| 2023 Q3 | 5.8 |
| 2023 Q4 | 6.2 |
| 2024 Q1 | 6.5 |
| 2024 Q2 | 6.9 |
| 2024 Q3 | 7.1 |
| 2024 Q4 | 7.4 |
| 2025 Q1 | 7.5 |
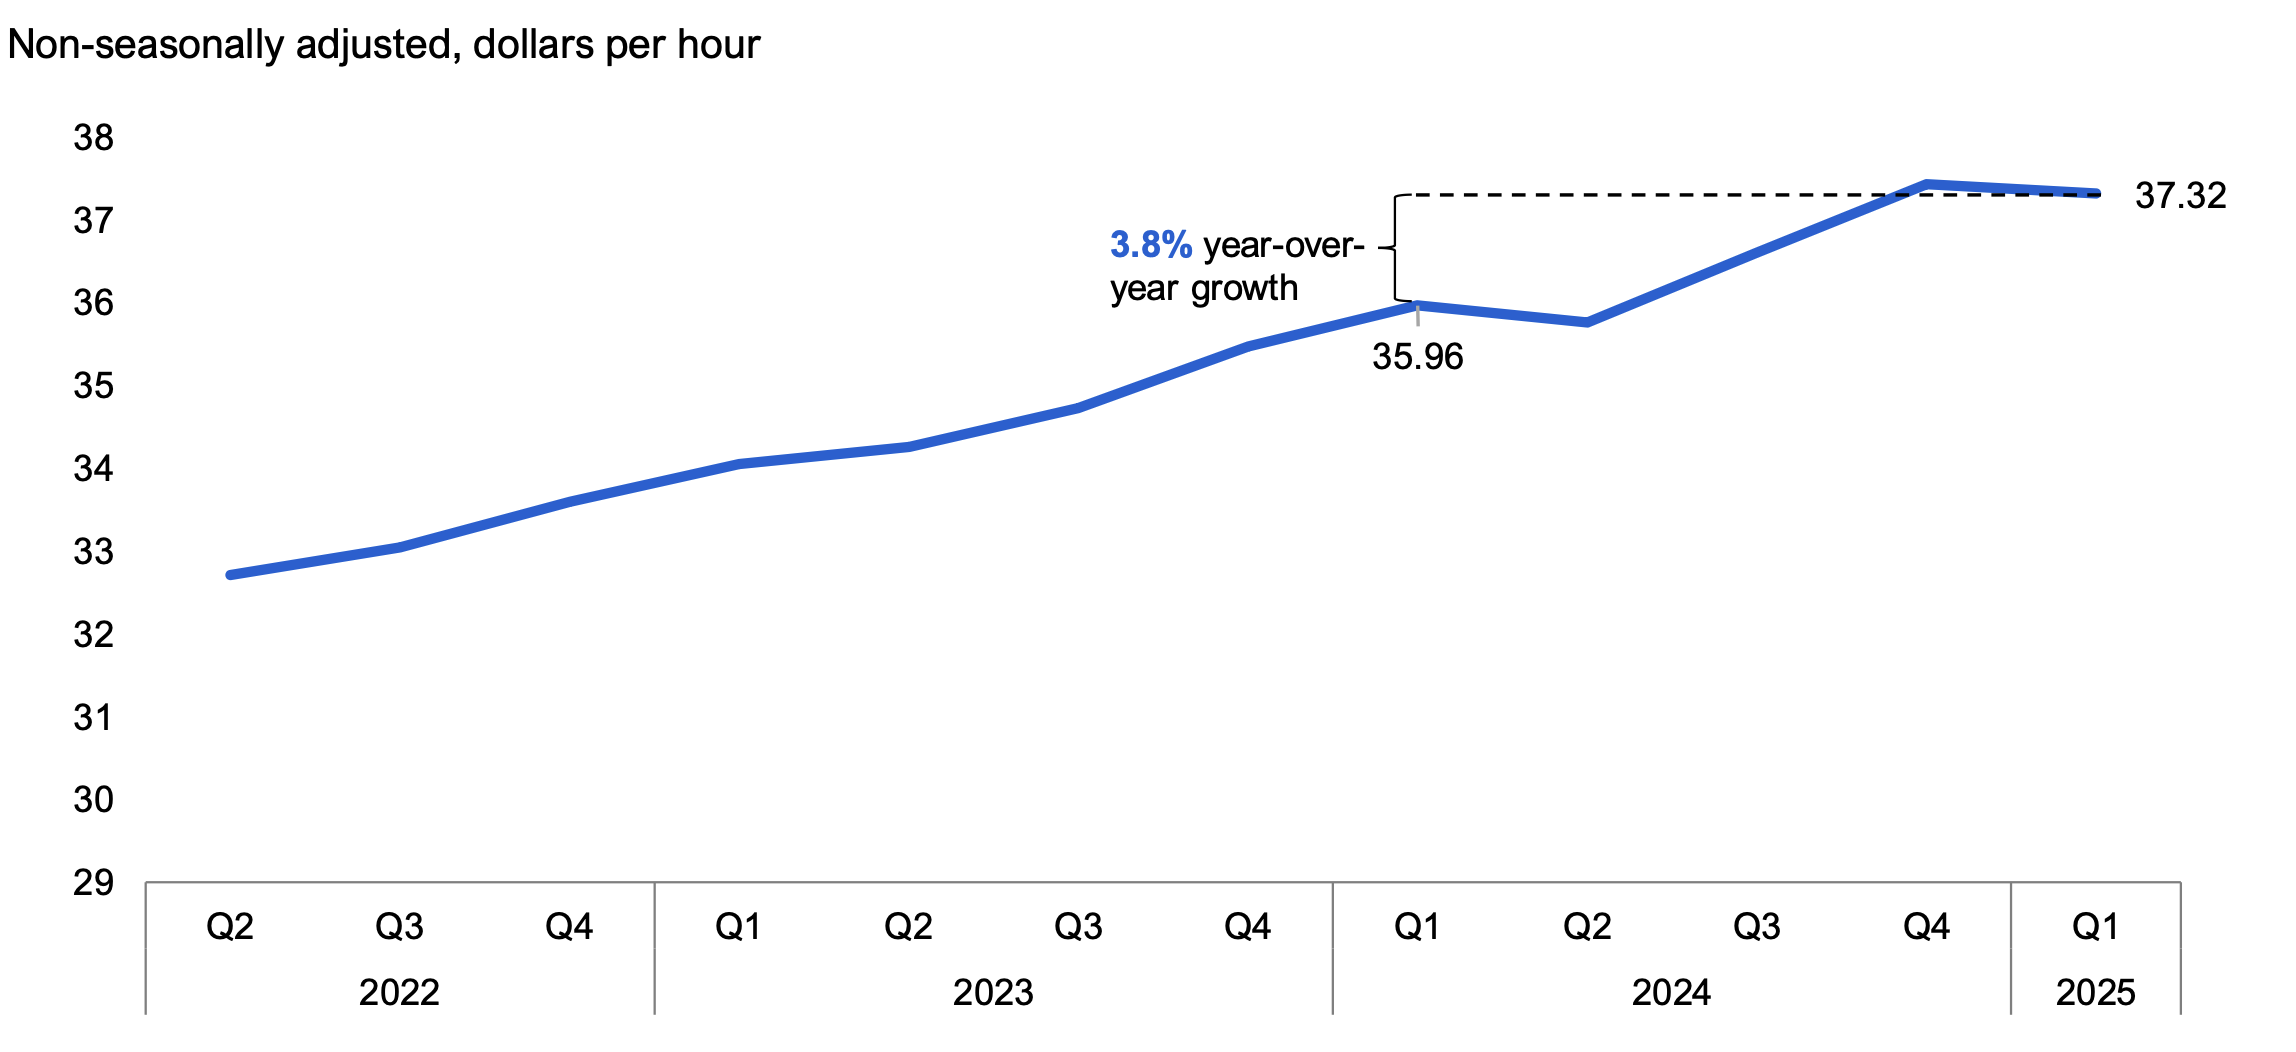
Average hourly wages grew 3.8% in 2025 Q1 compared to 2024 Q1, reaching $37.32 an hour. Hourly wage growth was broad-based across most major industries, with wages in services-producing industries rising 4.0% and goods-producing industries increasing 2.7%. Industries with the fastest wage growth were agriculture; information, culture and recreation; utilities; forestry, fishing and mining; and public administration.
Figure 5 Average hourly wagesgrew 3.8% in 2025 Q1 compared to 2024 Q1
Source: Statistics Canada Table 14-10-0063-01 and FAO.
Accessible version
| Non-seasonally adjusted, dollars per hour | Growth | |
|---|---|---|
| 2022 Q2 | 32.71 | |
| 2022 Q3 | 33.05 | |
| 2022 Q4 | 33.59 | |
| 2023 Q1 | 34.05 | |
| 2023 Q2 | 34.26 | |
| 2023 Q3 | 34.72 | |
| 2023 Q4 | 35.48 | |
| 2024 Q1 | 35.96 | 3.8% year-over-year growth |
| 2024 Q2 | 35.76 | |
| 2024 Q3 | 36.60 | |
| 2024 Q4 | 37.43 | |
| 2025 Q1 | 37.32 |
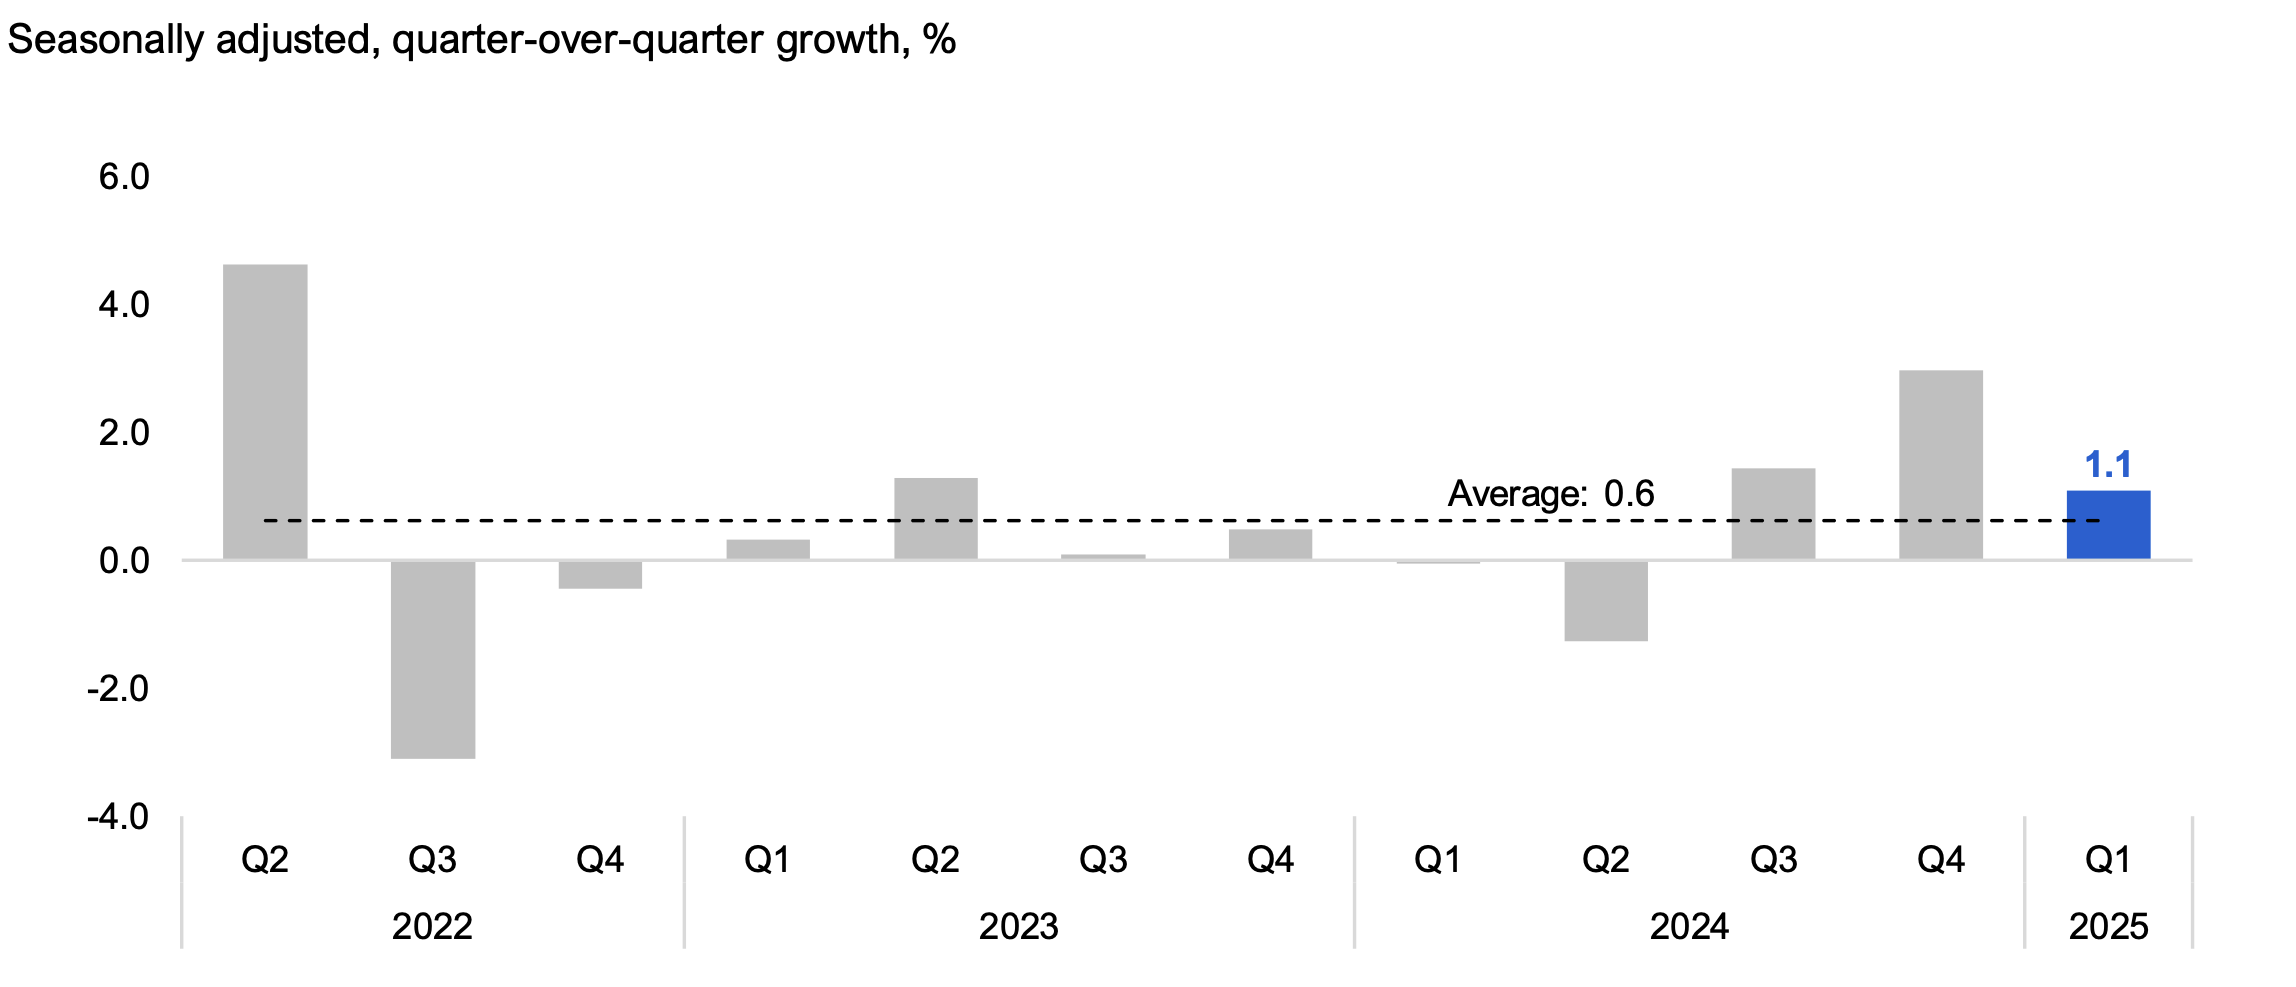
Retail sales rose by 1.1% in 2025 Q1 in Ontario, slowing from a gain of 3.0% in 2024 Q4. Higher sales in general merchandise, health and personal care, and gasoline and fuel led the increase in 2025 Q1. Although the temporary sales tax holiday on selected items was in effect for part of the quarter,[8] consumer spending was tempered by economic uncertainty related to trade conflicts, prompting more cautious spending behaviour.[9]
Figure 6 Retail sales rose by 1.1% in 2025 Q1
Source: Statistics Canada Table 20-10-0056-01 and FAO.
Accessible version
| Seasonally adjusted, quarter-over-quarter growth, % | Average | |
|---|---|---|
| 2022 Q2 | 4.6 | 0.6 |
| 2022 Q3 | -3.1 | 0.6 |
| 2022 Q4 | -0.4 | 0.6 |
| 2023 Q1 | 0.3 | 0.6 |
| 2023 Q2 | 1.3 | 0.6 |
| 2023 Q3 | 0.1 | 0.6 |
| 2023 Q4 | 0.5 | 0.6 |
| 2024 Q1 | 0.0 | 0.6 |
| 2024 Q2 | -1.3 | 0.6 |
| 2024 Q3 | 1.4 | 0.6 |
| 2024 Q4 | 3.0 | 0.6 |
| 2025 Q1 | 1.1 | 0.6 |
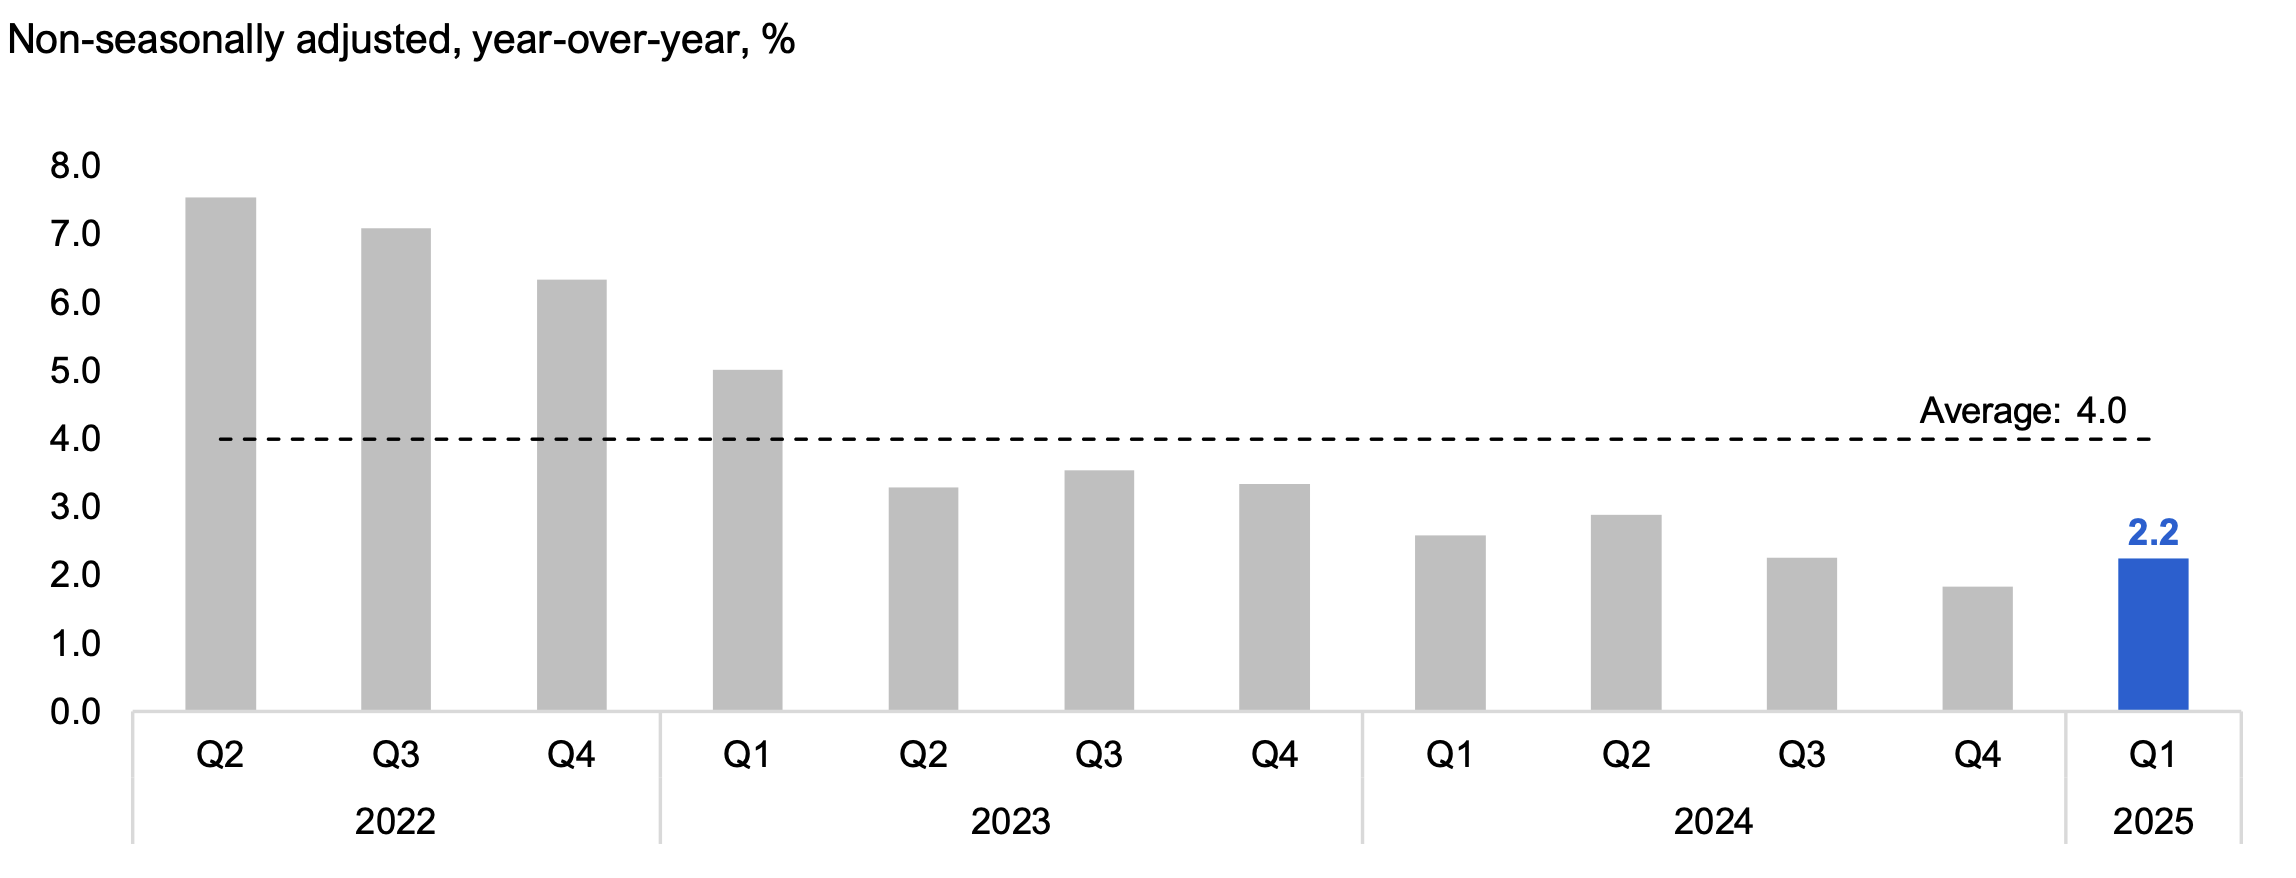
The Ontario Consumer Price Index (CPI) inflation rate[10] was 2.2% in 2025 Q1, up from 1.8% in 2024 Q4. Of the major CPI components, shelter (3.9%), health and personal care (3.2%) and transportation (3.0%) increased at rates faster than headline inflation in 2025 Q1. Food prices rose by 0.7% in 2025 Q1, the slowest increase since mid-2017.
In contrast, prices were lower in 2025 Q1 for alcohol, tobacco and recreational cannabis (-1.1%) and clothing (-0.1%) compared to a year earlier.
Figure 7 CPI inflation rate up to 2.2% in 2025 Q1
Source: Statistics Canada Table 18-10-0004-01 and FAO.
Accessible version
| Non-seasonally adjusted, year-over-year, % | Average | |
|---|---|---|
| 2022 Q2 | 7.5 | 4.0 |
| 2022 Q3 | 7.1 | 4.0 |
| 2022 Q4 | 6.3 | 4.0 |
| 2023 Q1 | 5.0 | 4.0 |
| 2023 Q2 | 3.3 | 4.0 |
| 2023 Q3 | 3.5 | 4.0 |
| 2023 Q4 | 3.3 | 4.0 |
| 2024 Q1 | 2.6 | 4.0 |
| 2024 Q2 | 2.9 | 4.0 |
| 2024 Q3 | 2.3 | 4.0 |
| 2024 Q4 | 1.8 | 4.0 |
| 2025 Q1 | 2.2 | 4.0 |
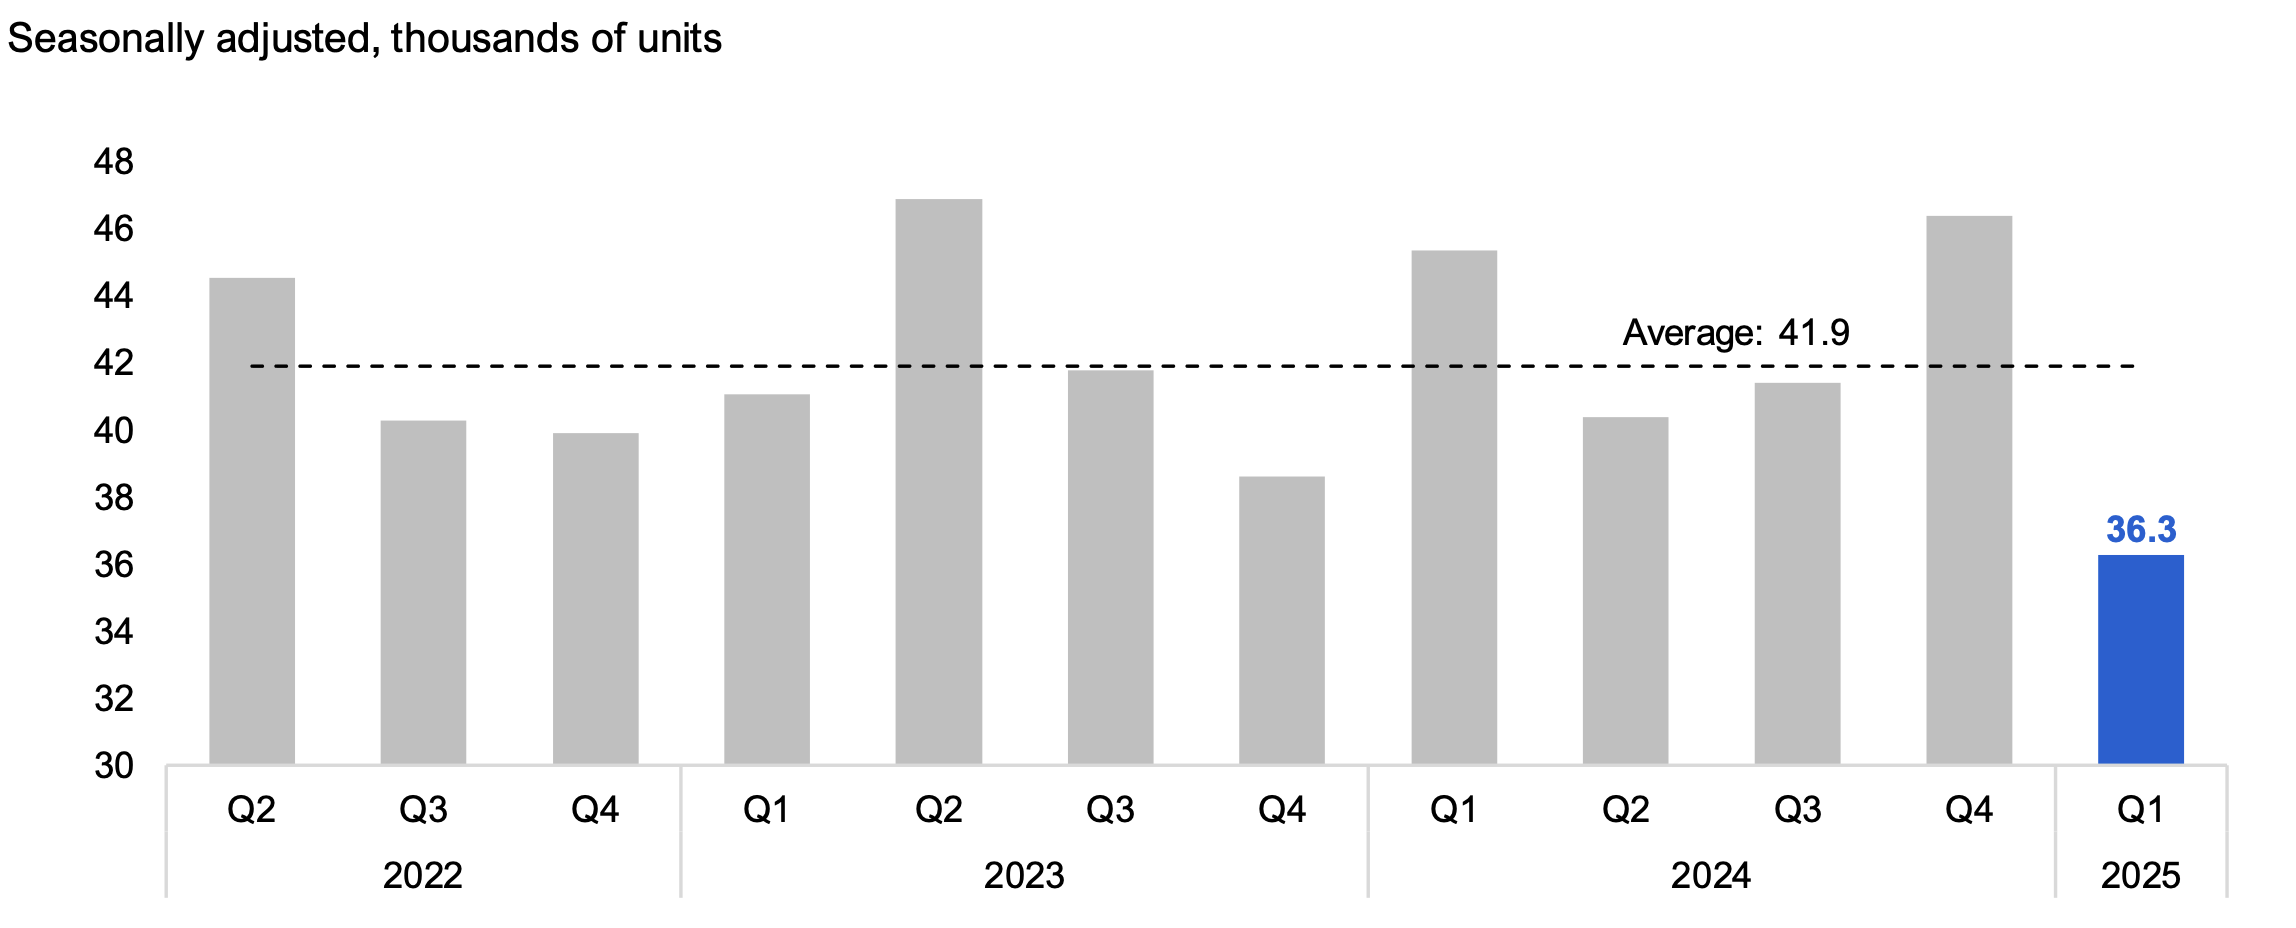
Despite declining mortgage rates, Ontario home resales dropped by 21.8% in 2025 Q1 from the previous quarter, with 36,300 units sold, the lowest non-recessionary level since mid-2000.[11] The decline likely reflects uncertainty related to the threat of US tariffs, which has increased consumer concerns about job security and personal finances.[12]
Figure 8 Housing resales dropped to 36,300 units in 2025 Q1
Source: Canadian Real Estate Association and FAO.
Accessible version
| Seasonally adjusted, thousands of units | Average | |
|---|---|---|
| 2022 Q2 | 44.5 | 41.9 |
| 2022 Q3 | 40.3 | 41.9 |
| 2022 Q4 | 39.9 | 41.9 |
| 2023 Q1 | 41.1 | 41.9 |
| 2023 Q2 | 46.9 | 41.9 |
| 2023 Q3 | 41.8 | 41.9 |
| 2023 Q4 | 38.6 | 41.9 |
| 2024 Q1 | 45.3 | 41.9 |
| 2024 Q2 | 40.4 | 41.9 |
| 2024 Q3 | 41.4 | 41.9 |
| 2024 Q4 | 46.4 | 41.9 |
| 2025 Q1 | 36.3 | 41.9 |
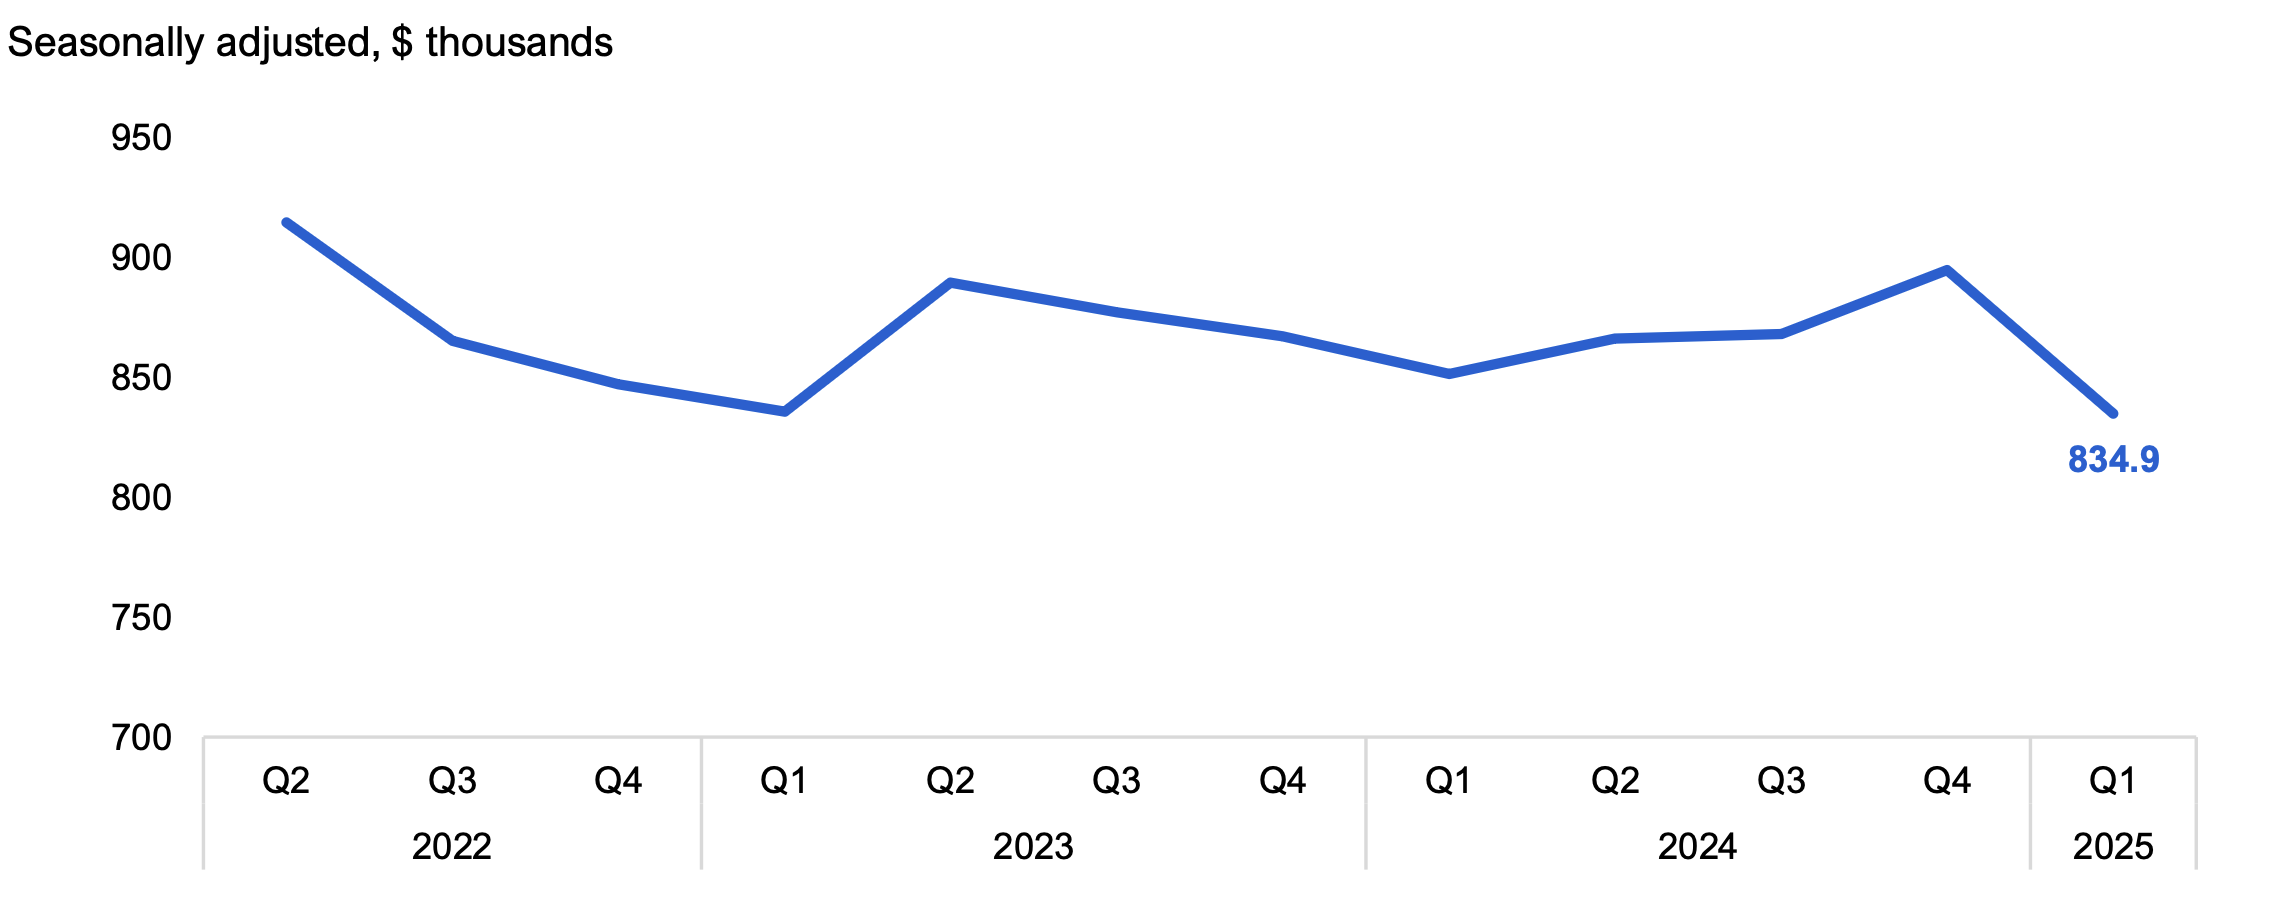
Home resale prices in Ontario averaged $834,900 in 2025 Q1, a 6.7% decrease from the previous quarter and the lowest since 2021. In 2025 Q1, the average resale home price was $196,600 (or ‑19.1%) below the peak of $1,031,400 reached in 2022 Q1.
Figure 9 Home resale prices decreased to $834,900 in 2025 Q1
Source: Canadian Real Estate Association and FAO.
Accessible version
| Seasonally adjusted, $ thousands | |
|---|---|
| 2022 Q2 | 914.6 |
| 2022 Q3 | 865.0 |
| 2022 Q4 | 846.9 |
| 2023 Q1 | 835.7 |
| 2023 Q2 | 889.3 |
| 2023 Q3 | 877.2 |
| 2023 Q4 | 867.3 |
| 2024 Q1 | 851.5 |
| 2024 Q2 | 866.2 |
| 2024 Q3 | 867.9 |
| 2024 Q4 | 894.5 |
| 2025 Q1 | 834.9 |
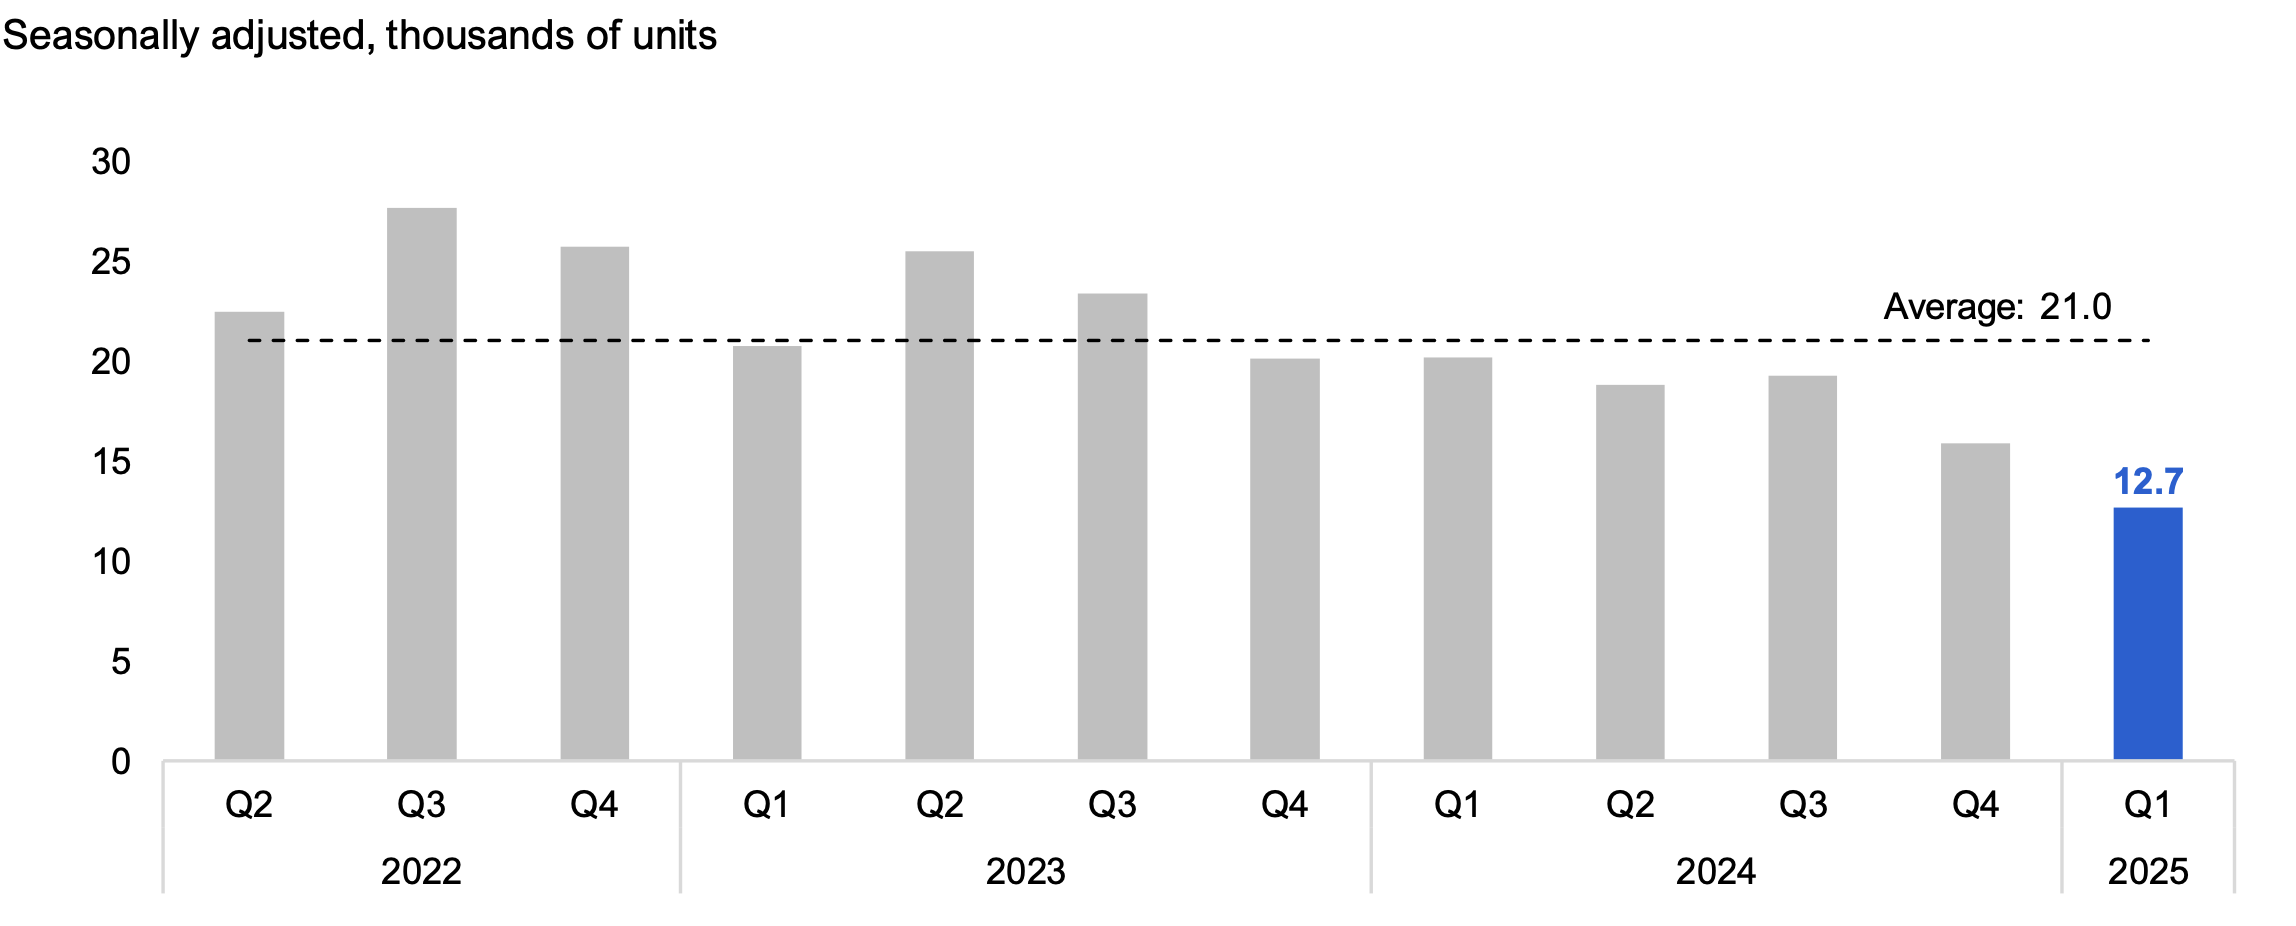
Housing starts[13] in 2025 Q1 totalled 12,700 units in Ontario, a 20.2% drop from the 15,900 units started in 2024 Q4. This marked the lowest level of housing starts since 2009 Q4. In 2025 Q1, 80% of total housing starts were multiple unit dwellings, while 20% were single detached homes.[14] Home building has been negatively affected by high construction costs and weak sales as households continue to face housing affordability challenges.[15]
Figure 10 Housing starts declined 20.2% from 2024 Q4 to 12,700 units
Source: Canada Mortgage and Housing Corporation (CMHC) and FAO.
Accessible version
| Seasonally adjusted, thousands of units | Average | |
|---|---|---|
| 2022 Q2 | 22.4 | 21.0 |
| 2022 Q3 | 27.6 | 21.0 |
| 2022 Q4 | 25.7 | 21.0 |
| 2023 Q1 | 20.7 | 21.0 |
| 2023 Q2 | 25.5 | 21.0 |
| 2023 Q3 | 23.4 | 21.0 |
| 2023 Q4 | 20.2 | 21.0 |
| 2024 Q1 | 20.2 | 21.0 |
| 2024 Q2 | 18.8 | 21.0 |
| 2024 Q3 | 19.2 | 21.0 |
| 2024 Q4 | 15.9 | 21.0 |
| 2025 Q1 | 12.7 | 21.0 |
Businesses
Manufacturing sales rose by a strong 2.8% in 2025 Q1, building on a 0.6% rise in 2024 Q4. The growth in manufacturing sales was concentrated in transportation equipment, petroleum and coal products, computer and electronic products, fabricated metal products, and food. Increased activity in manufacturing in 2025 Q1 likely reflected stronger demand ahead of US tariffs and the rebound in the motor vehicle industry, which resumed operations after planned shutdowns in December 2024. Lower sales were recorded in chemicals, machinery, printing, electrical equipment, wood products and textile products.
Figure 11 Manufacturing sales up by a strong 2.8% in 2025 Q1

Source: Statistics Canada Table 16-10-0048-01 and FAO.
Accessible version
| Seasonally adjusted, quarter-over-quarter growth, % | Average | |
|---|---|---|
| 2022 Q2 | 4.8 | 0.6 |
| 2022 Q3 | -0.3 | 0.6 |
| 2022 Q4 | 2.1 | 0.6 |
| 2023 Q1 | 1.2 | 0.6 |
| 2023 Q2 | 2.8 | 0.6 |
| 2023 Q3 | 1.0 | 0.6 |
| 2023 Q4 | -4.1 | 0.6 |
| 2024 Q1 | -1.7 | 0.6 |
| 2024 Q2 | -0.7 | 0.6 |
| 2024 Q3 | -1.4 | 0.6 |
| 2024 Q4 | 0.6 | 0.6 |
| 2025 Q1 | 2.8 | 0.6 |
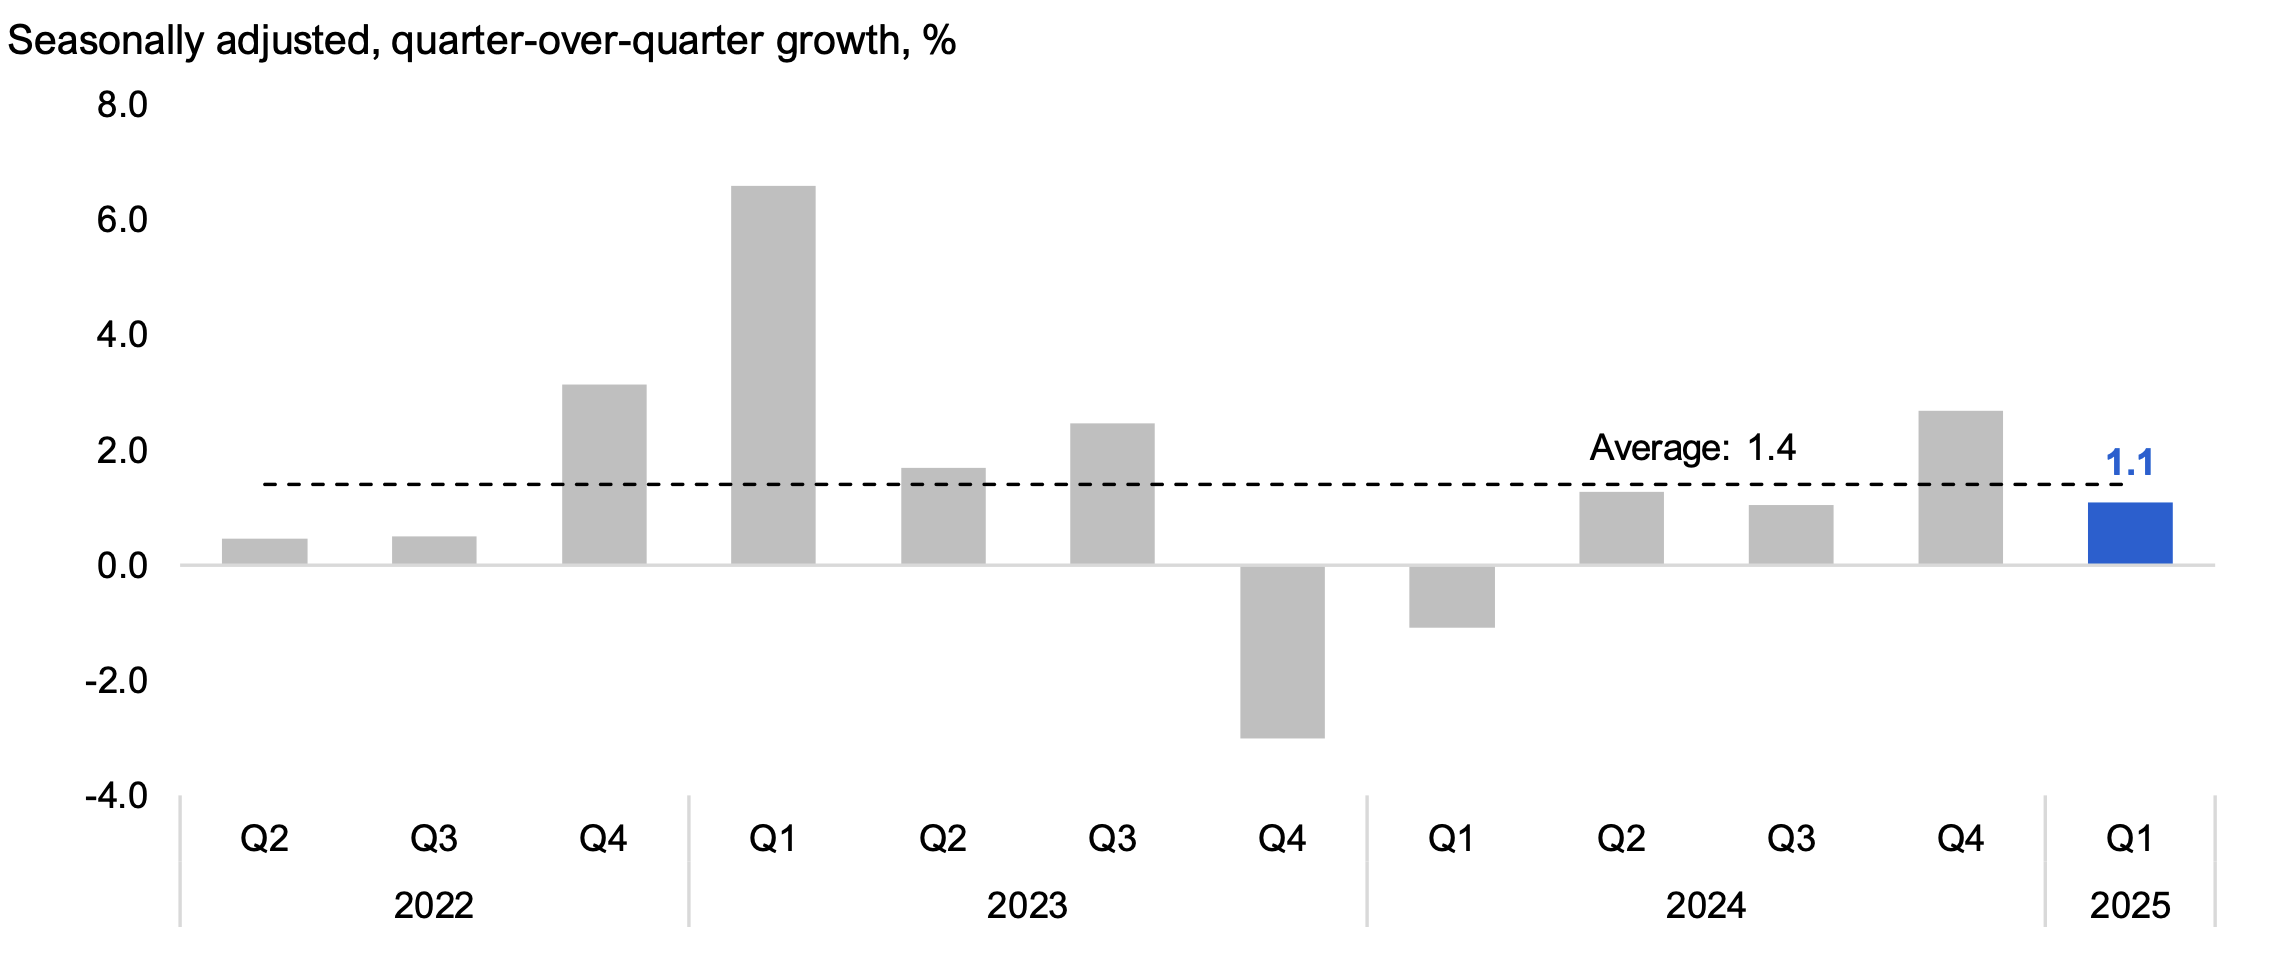
Wholesale trade, which measures sales of bulk items, increased by 1.1% in 2025 Q1, slowing from a strong gain in 2024 Q4 (2.7%). The 2025 Q1 increase was largely the result of higher sales of machinery and equipment, motor vehicles and parts, personal and household goods, food, beverage and tobacco, and building materials, which outweighed declines in the sales of farm products and petroleum products.
Figure 12 Wholesale trade increased by 1.1% in 2025 Q1
Source: Statistics Canada Table 20-10-0074-01 and FAO.
Accessible version
| Seasonally adjusted, quarter-over-quarter growth, % | Average | |
|---|---|---|
| 2022 Q2 | 0.5 | 1.4 |
| 2022 Q3 | 0.5 | 1.4 |
| 2022 Q4 | 3.1 | 1.4 |
| 2023 Q1 | 6.6 | 1.4 |
| 2023 Q2 | 1.7 | 1.4 |
| 2023 Q3 | 2.5 | 1.4 |
| 2023 Q4 | -3.0 | 1.4 |
| 2024 Q1 | -1.1 | 1.4 |
| 2024 Q2 | 1.3 | 1.4 |
| 2024 Q3 | 1.0 | 1.4 |
| 2024 Q4 | 2.7 | 1.4 |
| 2025 Q1 | 1.1 | 1.4 |
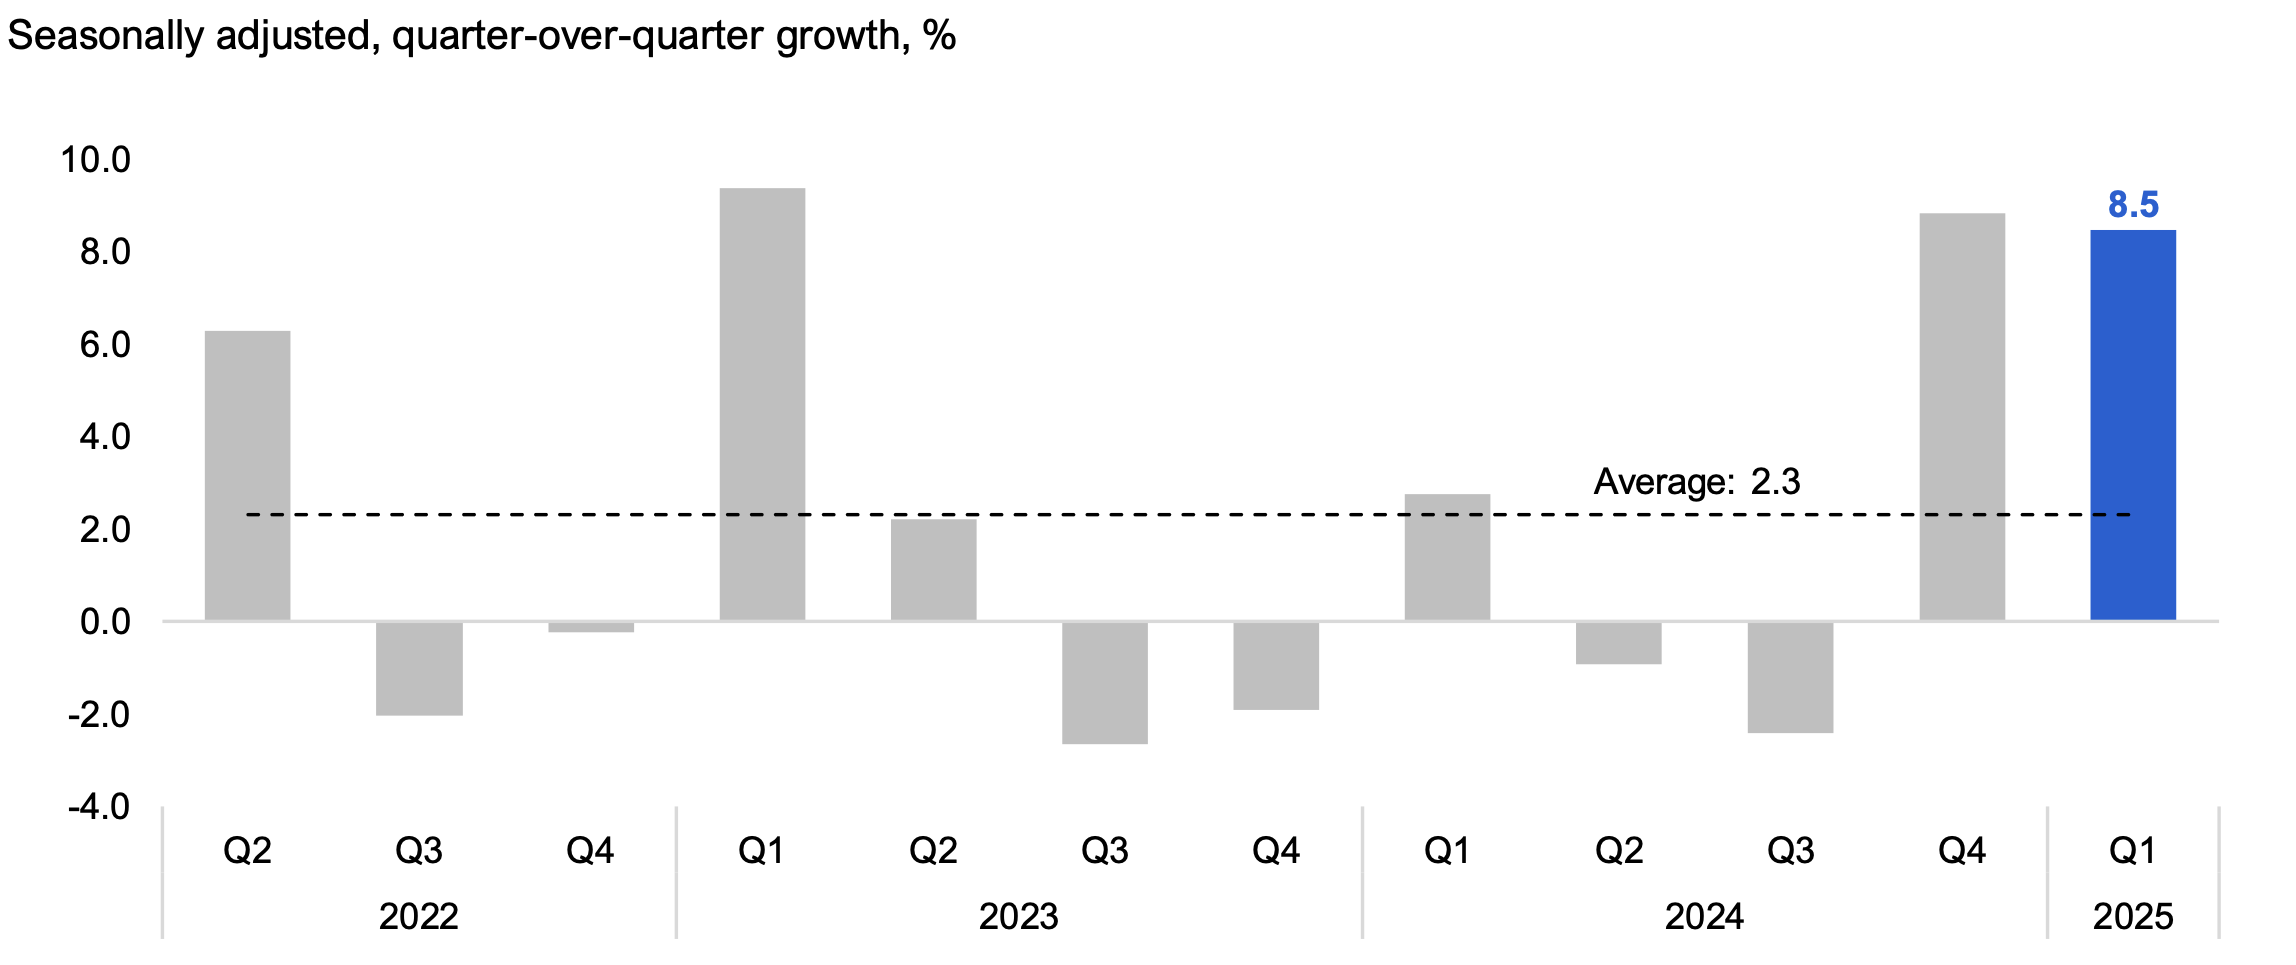
International merchandise exports, which account for all goods leaving the country through Ontario, jumped by 8.5% in 2025 Q1, the second strong quarterly gain in the period leading up to the imposition of US tariffs. The Q1 increase in exports mainly reflected growth in motor vehicles and parts, metal and non-metallic mineral products, industrial machinery, consumer goods, and aircraft and other transportation equipment. Exports of motor vehicles and parts rose by 13.7%, reflecting increased demand ahead of US tariffs on imported vehicles that came into effect in April.
Figure 13 International merchandise exports increased by 8.5% in 2025 Q1
Source: Statistics Canada Table 12-10-0175-01, Table 12-10-0163-01 and FAO estimate.
Accessible version
| Seasonally adjusted, quarter-over-quarter growth, % | Average | |
|---|---|---|
| 2022 Q2 | 6.3 | 2.3 |
| 2022 Q3 | -2.0 | 2.3 |
| 2022 Q4 | -0.2 | 2.3 |
| 2023 Q1 | 9.4 | 2.3 |
| 2023 Q2 | 2.2 | 2.3 |
| 2023 Q3 | -2.7 | 2.3 |
| 2023 Q4 | -1.9 | 2.3 |
| 2024 Q1 | 2.8 | 2.3 |
| 2024 Q2 | -0.9 | 2.3 |
| 2024 Q3 | -2.4 | 2.3 |
| 2024 Q4 | 8.8 | 2.3 |
| 2025 Q1 | 8.5 | 2.3 |
International merchandise imports, which measures international goods entering Ontario, increased by 3.8% in 2025 Q1, after a 3.9% increase in the previous quarter. The increase reflected higher imports of motor vehicles and parts, industrial machinery, consumer goods, aircraft and other transportation equipment, and electronic and electrical equipment. Similar to exports, the strong increase in imports in Q1 suggests that businesses accelerated shipments in anticipation of tariffs.
Figure 14 International merchandise imports increased by 3.8% in 2025 Q1
Source: Statistics Canada Table 12-10-0175-01, Table 12-10-0163-01 and FAO estimate.
Accessible version
| Seasonally adjusted, quarter-over-quarter growth, % | Average | |
|---|---|---|
| 2022 Q2 | 6.7 | 1.5 |
| 2022 Q3 | 0.8 | 1.5 |
| 2022 Q4 | 0.5 | 1.5 |
| 2023 Q1 | -0.3 | 1.5 |
| 2023 Q2 | 0.8 | 1.5 |
| 2023 Q3 | 0.4 | 1.5 |
| 2023 Q4 | 0.9 | 1.5 |
| 2024 Q1 | -1.6 | 1.5 |
| 2024 Q2 | 2.2 | 1.5 |
| 2024 Q3 | -0.2 | 1.5 |
| 2024 Q4 | 3.9 | 1.5 |
| 2025 Q1 | 3.8 | 1.5 |
Implications of Recent Economic Trends
In an April 2025 report, the FAO analyzed the potential impacts of US and Canadian tariffs on Ontario’s economy, based on tariff policy as of April 17.[16] Under this scenario, the FAO estimates that Ontario’s real GDP growth could slow to 0.6% in 2025.
2025 Q1 economic trends are largely consistent with real GDP growth of 0.6% in 2025. However, subsequent tariff changes announced after April 17 are expected to have both positive and negative impacts.[17] The FAO will continue to monitor Ontario’s economic performance and will update its forecast for economic growth in its next Economic and Budget Outlook report.
Figure 15 2025 Ontario real GDP growth projection under the FAO tariff scenario
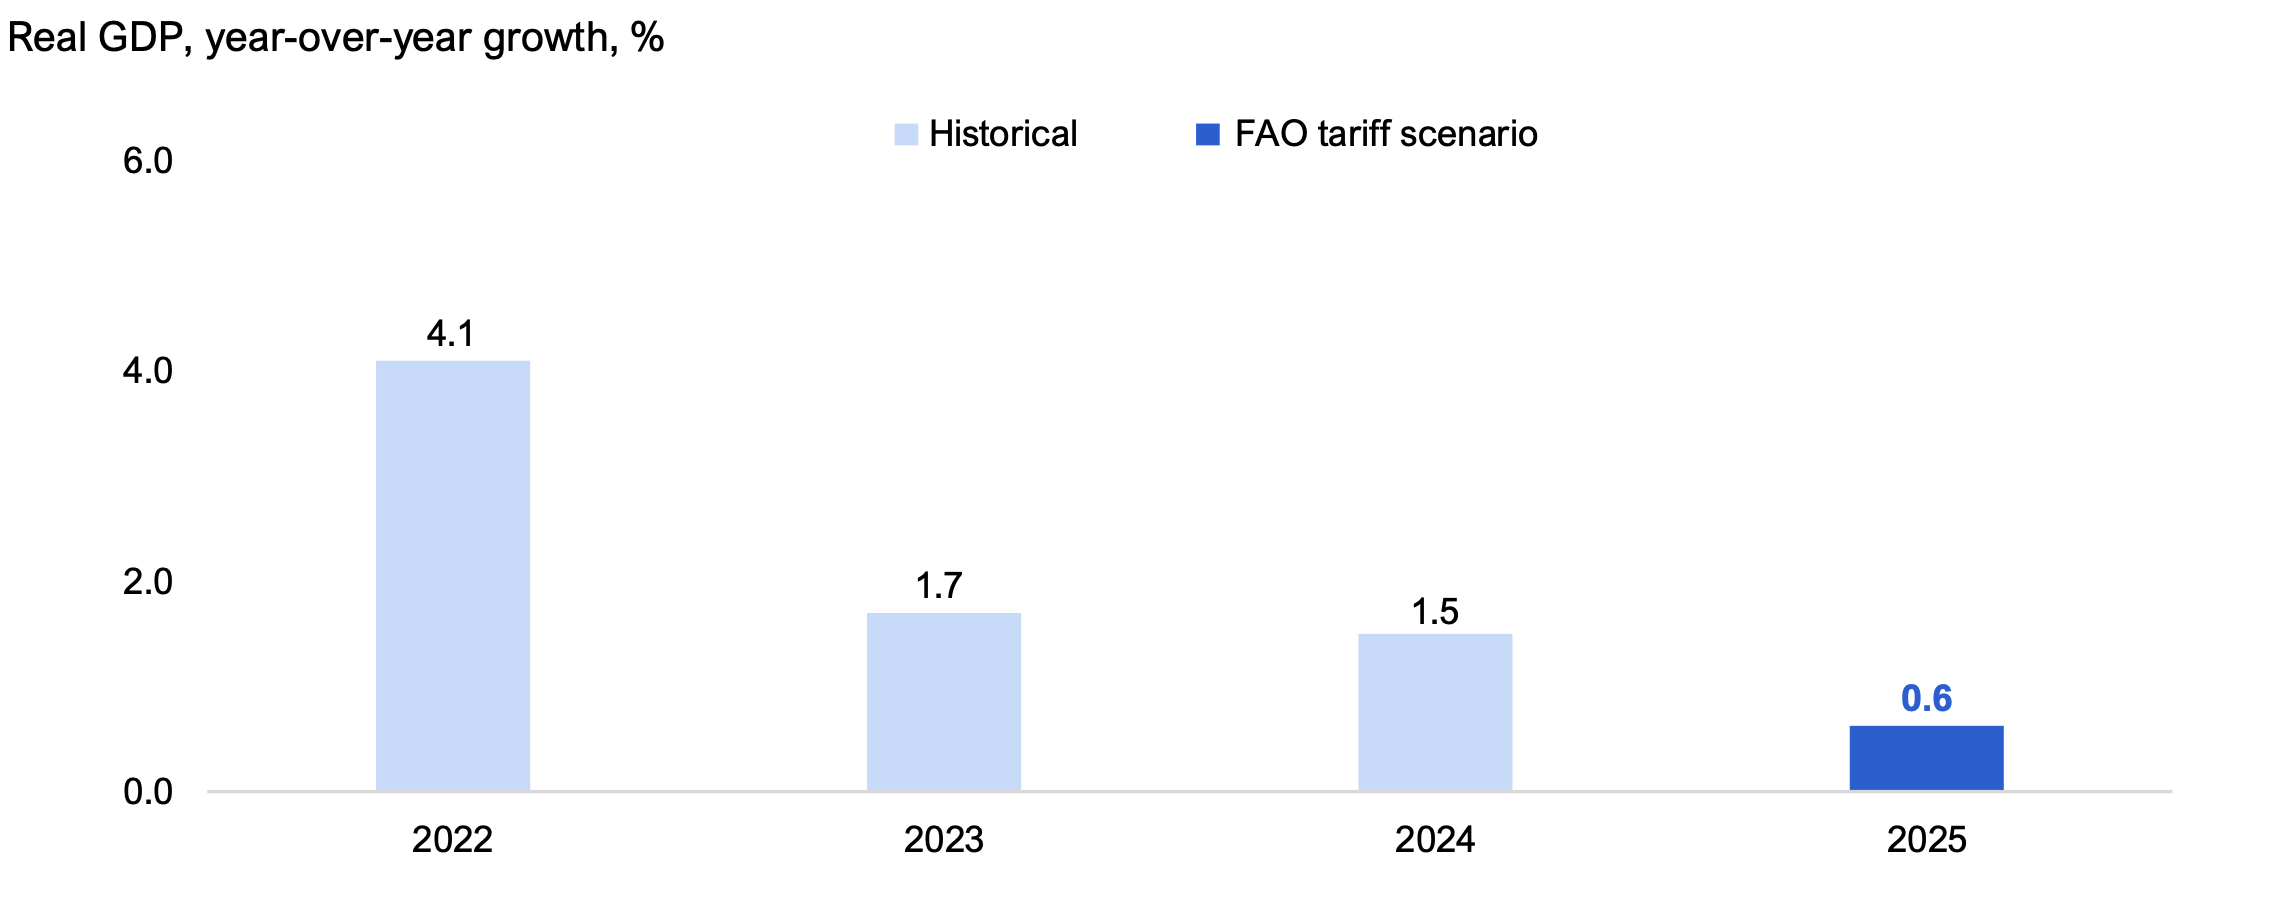
Note: The FAO tariff scenario estimates the potential impact of US and Canadian tariffs on Ontario’s economy, based on tariff policy as of April 17. See, the FAO’s The Potential Impacts of US Tariffs on the Ontario Economy.
Source: Ontario Economic Accounts and FAO.
Accessible version
| Real GDP, year-over-year growth, % | Historical | FAO tariff scenario |
|---|---|---|
| 2022 | 4.1 | |
| 2023 | 1.7 | |
| 2024 | 1.5 | |
| 2025 | 0.6 |
Glossary
Economic Indicators
- Gross Domestic Product (GDP)
- GDP is a broad indicator of economic activity that measures the value of goods and services produced by an economy. GDP is measured on both an expenditure and income basis.
- Employment and unemployment rate
- Employment from Statistics Canada’s Labour Force Survey estimates the number of individuals who did any work at a job or business (whether paid or unpaid) or those who had a job but were not at work due to factors unrelated to their job (e.g., their own illness or a labour dispute). The unemployment rate represents the number of people actively looking for work but not having a job as a proportion of the labour force. These two indicators are the most common measures of labour market performance.
- Average hourly wages
- Hourly wages are measured before taxes and other deductions, and include tips, commissions and bonuses for both hourly and salaried workers. This metric indicates wage inflation and labour market tightness.
- Retail sales
- Retail sales are the value of finished goods sold by retailers to the general public. This metric provides information on household spending by major commodity type.
- Housing resales
- Home resales data show the number of existing houses sold and is the most common measure of housing market activity.
- Housing prices
- The average price of existing houses sold. This metric is the most common measure of home prices that provides an indication of housing market strength.
- Housing starts
- Housing starts measures the number of housing units where construction has been started, including single and multiple unit dwellings. This metric provides a measure of change in the level of housing stock and can be compared to population growth to provide information on housing supply adequacy.
- Manufacturing sales
- The value of goods manufactured in Ontario that have been shipped to a customer.This metric is a measure of industrial production.
- Wholesale trade
- The value of merchandise sold in large quantities to retailers, businesses and institutional clients, such as governments. This metric provides insight into general business sector activity.
- International merchandise exports and imports
- The value of merchandise shipped out of the country from Ontario (exports) or into Ontario from outside the country (imports). International merchandise trade plays an important role in economic growth and provides information on the province’s competitiveness with other jurisdictions.
Technical Definitions
- Real dollars
- Values reflect prices after adjusting for inflation.
- Seasonally adjusted
- Data have been adjusted to reflect seasonal factors that may impact the data.
- Non-seasonally adjusted
- Data have not been adjusted to reflect seasonal factors.
- Year-over-year (Y/Y)
- Data from a particular time period are compared with data from the same time period a year ago. For example, Y/Y growth in 2023 Q4 would compare 2023 Q4 data with 2022 Q4 data. Using Y/Y data mostly removes the impact of seasonal factors.
- Quarter-over-quarter (Q/Q)
- Data compared from one quarter to the next. Q/Q growth in 2023 Q4 would compare 2023 Q4 data with 2023 Q3 data. Q/Q growth may suffer from seasonal factors unless data are seasonally adjusted.
Methodology
Data used in this report are primarily presented on a quarterly basis. For economic indicators that are adjusted for seasonality, growth is presented from one quarter to the next (Q/Q). For indicators that are not seasonally adjusted, growth is presented from the same quarter of the previous year (Y/Y) to avoid the impact of seasonal factors on economic trends. Indicators are presented in current dollars unless otherwise specified.
For some economic data, including retail sales, manufacturing sales and wholesale trade, the final month of the quarter may not yet be available at the time of the report’s publication. In these cases, Statistics Canada’s national preliminary estimate is used to estimate Ontario’s growth in that month.
Footnotes
[1] See the FAO’s The Potential Impacts of US Tariffs on the Ontario Economy.
[2] Examples of tariff changes include: temporary exemptions for specific Canadian retaliatory tariffs, the removal of US tariffs on auto parts compliant with the Canada-United States-Mexico Agreement, the temporary pause on substantial Chinese-US tariffs, and the increase in US tariffs on steel and aluminum.
[3] For example, the April 2025 OEA release describes economic activity up to the fourth quarter (October to December) of 2024. The Fiscal Sustainability, Transparency and Accountability Act, 2019 states that the quarterly Ontario Economic Accounts should be released within 45 days of the Statistics Canada release of the National Income and Expenditure Accounts.
[4] Some of these data are regularly revised, and the growth rates presented in this report may differ from updated data published at a later date.
[5] See the FAO’s The Potential Impacts of US Tariffs on the Ontario Economy.
[6] A 3.2% increase in international exports outweighed a 0.7% decline in interprovincial exports.
[7] Long-term unemployment includes those unemployed who were looking for work or laid-off for 27 weeks or more. Statistics Canada Table 14-10-0342-01.
[8] The GST/HST temporary reduction lasted from December 14, 2024 to February 15, 2025. See Government of Canada’s GST/HST break.
[9] See Bank of Canada’s Canadian Survey of Consumer Expectations—First Quarter of 2025.
[10] Measured on a year-over-year basis.
[11] Excluding the 2008-2009 global financial crisis and the pandemic period.
[12] See Bank of Canada’s Canadian Survey of Consumer Expectations—First Quarter of 2025.
[13] Canada Mortgage and Housing Corporation (CMHC) defines a housing unit as being a “structurally separate set of self-contained living premises [with] … a private entrance from outside the building or from a common hall, lobby or stairway inside the building. The entrance must be one that can be used without passing through another separate […] unit”. See CMHC’s Starts and Completions Survey and Market Absorption Survey Methodology.
[14] According to the non-seasonally adjusted data in Statistics Canada Table 34-10-0135-01, the share of single detached housing starts has been declining since the 1990s, reflecting affordability challenges, changes in household preferences and planning efforts aimed at increasing density. Construction of single detached homes has been weak, with 2024 having the lowest level of annual starts on record back to 1955.
[15] See 2025 Q1 Housing Market Index, Canadian Home Builders Association.
[16] See the FAO’s The Potential Impacts of US Tariffs on the Ontario Economy.
[17] Examples of tariff changes after April 17, 2025 include: temporary exemptions for specific Canadian retaliatory tariffs, the removal of US tariffs on auto parts compliant with the Canada-United States-Mexico Agreement, the temporary pause on substantial Chinese-US tariffs, and the increase in US tariffs on steel and aluminum.