


Summary
- This report describes Ontario’s recent economic performance based on the latest economic indicators.
- In the first quarter of 2025, Ontario’s real Gross Domestic Product (GDP), the broadest measure of economic activity, increased by a solid 0.6% from the previous quarter, led by gains in international exports, household consumption and business investment in machinery and equipment, partially offset by lower residential investment.
- The latest economic indicators suggest mostly negative results for Ontario’s economy in the second quarter of 2025, with losses in employment, manufacturing sales, wholesale and retail trade, and international exports.
- In an April 2025 report, which reviewed the potential impacts of US tariffs on Ontario’s economy, the FAO estimated that Ontario’s annual real GDP growth would slow to 0.6% in 2025.[1] While Ontario’s economic indicators in 2025 Q2 were consistent with the FAO projection, real GDP growth in the first quarter was stronger than expected. Taken together, these results pose modest upside risks to the FAO’s outlook, while subsequent tariff changes are expected to have both positive and negative impacts. The FAO will continue to monitor Ontario’s economic performance and will update its forecast for economic growth in its next Economic and Budget Outlook report, expected to be released in September 2025.
Introduction and Background
The Ontario Economic Monitor presents an overview of the latest trends in the Ontario economy based on the most recent economic data as of August 5, 2025.
Each quarter, the Government of Ontario (the Province) releases the Ontario Economic Accounts (OEA), which provides data on GDP, a comprehensive measure of economic activity in Ontario. The OEA is produced by the Ontario Ministry of Finance and released approximately four months after the quarter closes.[2] The OEA is available on the Province’s Ontario Economic Accounts website.
In addition, Statistics Canada and other organizations produce many monthly economic indicators that provide insight into Ontario’s economy. These form part of the underlying data used to produce the OEA. This report focusses on these indicators, which are typically released one to two months after the data are collected, and provides more up-to-date information on Ontario’s economic performance in the most recent quarter.[3]
The report contains the following sections:
- a summary of the OEA describing the province’s economic performance in the first quarter of 2025 (2025 Q1);
- a summary of the most recent monthly economic indicators for Ontario’s households and businesses in 2025 Q2; and
- an assessment of the FAO’s “tariff scenario” economic outlook[4] based on recent economic trends.
For definitions of the various economic indicators covered in this report, as well as technical definitions of economic concepts, see the report’s Glossary. For information on the data used, see the report’s Methodology.
2025 First Quarter Ontario Economic Accounts
The Ontario Economic Accounts (OEA) for the first quarter (January to March) of 2025 were released on July 10, 2025. The OEA provides a comprehensive assessment of Ontario’s recent economic performance.
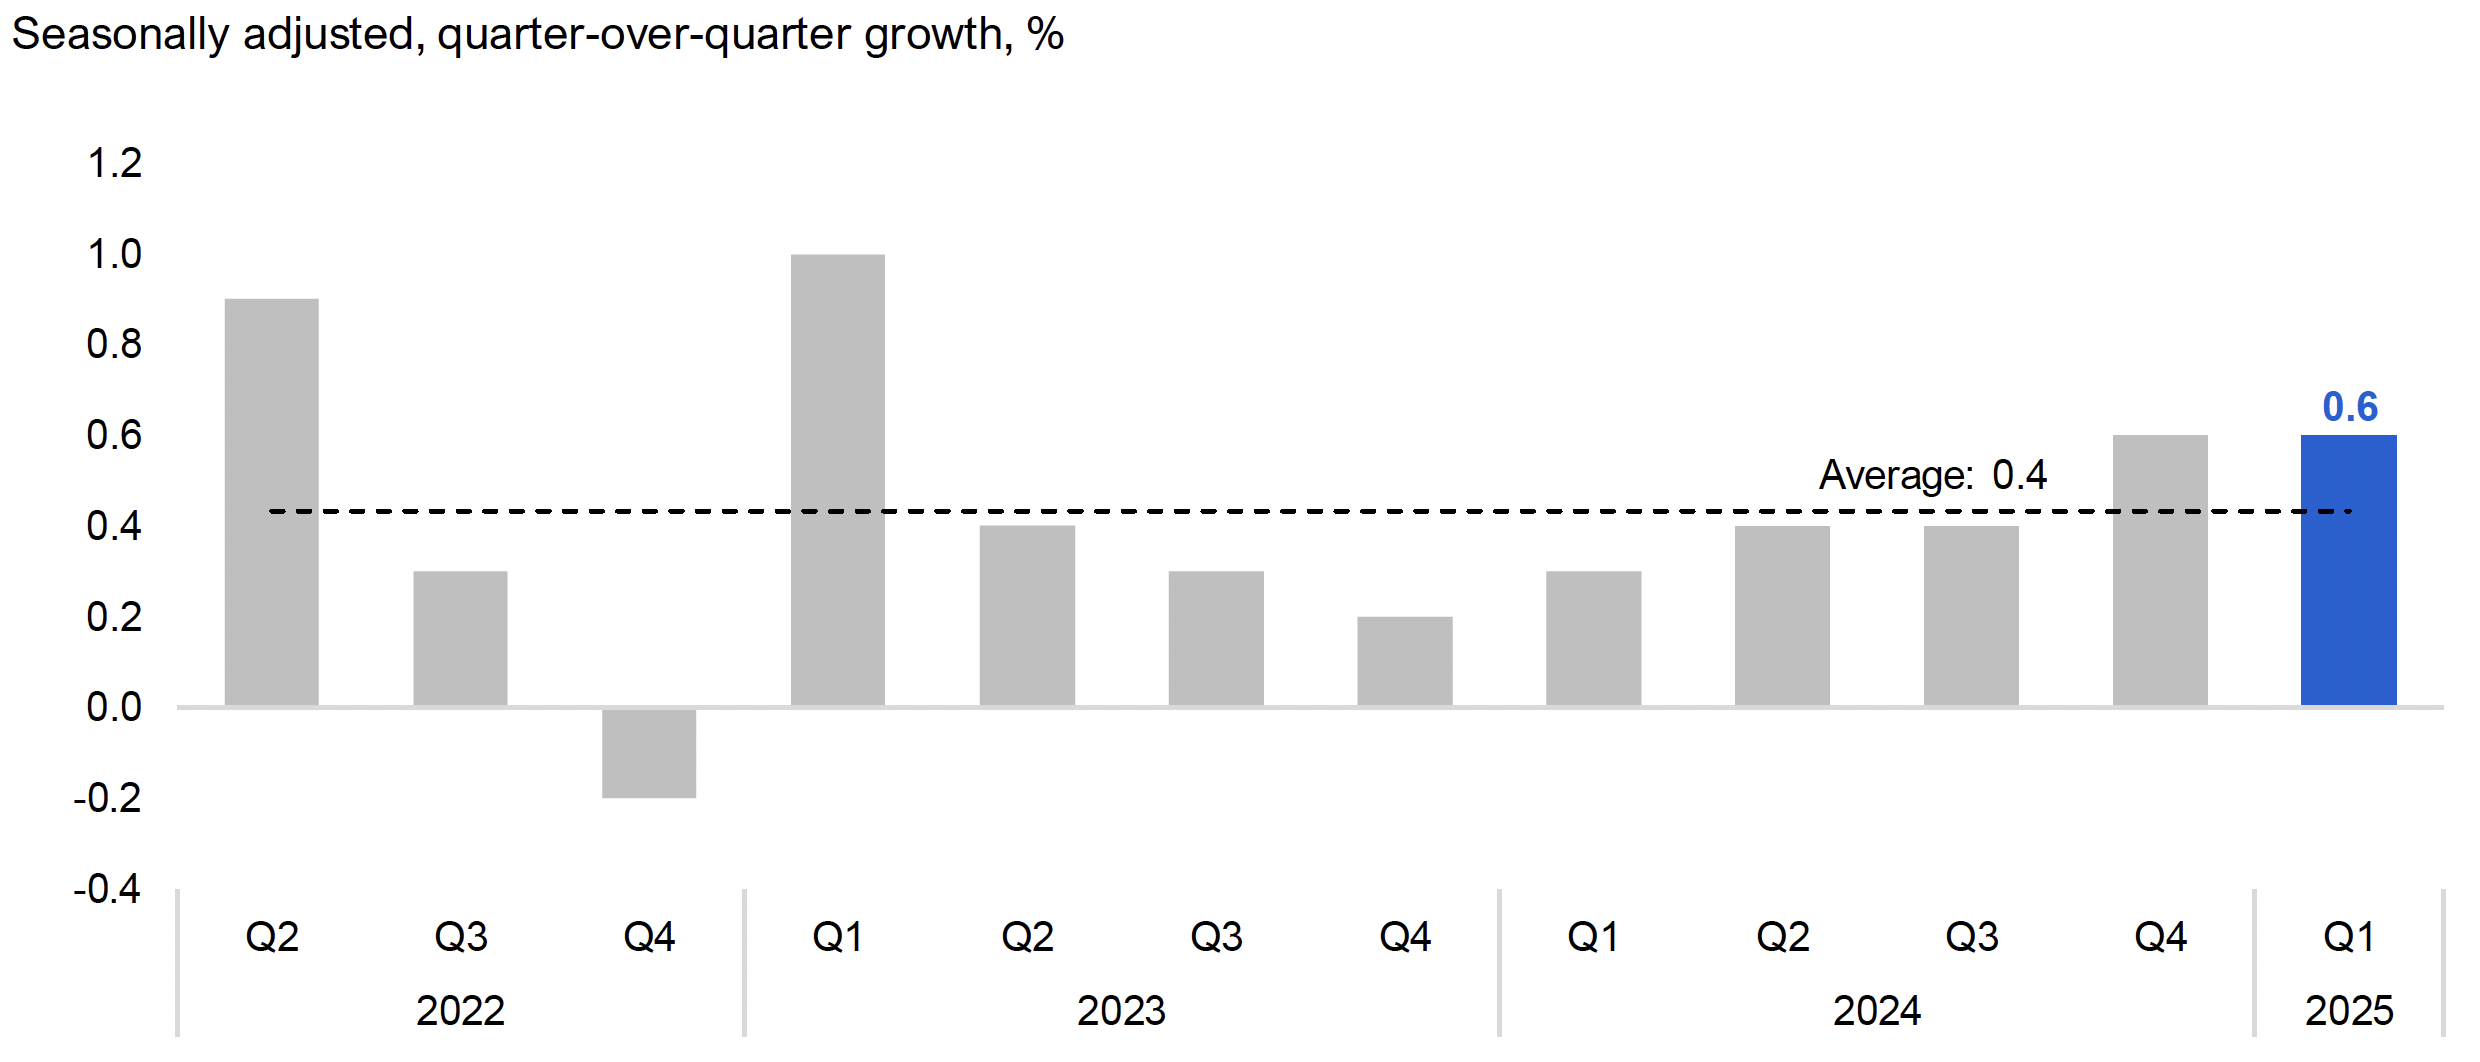
Real Gross Domestic Product (GDP), the broadest measure of economic activity, grew by a solid 0.6% in 2025 Q1, the same growth rate as in 2024 Q4, as gains in international exports, household consumption and business investment in machinery and equipment were partially offset by lower residential investment. Exports continued to rise at a robust pace, up 1.8% in 2025 Q1,[5] the second strong quarterly gain in the period leading up to the imposition of US tariffs. Household consumption increased by 0.4% in 2025 Q1, slowing from growth of 1.6% in 2024 Q4 as economic uncertainty related to the Canada-US trade conflict weighed on consumer confidence and spending.[6] Overall economic growth in 2025 Q1 was constrained by a 3.8% decline in investment in residential construction due to significant weakness in both home resales and housing starts.
Figure 1 Real GDP grew by a solid 0.6% in 2025 Q1
Source: Ontario Economic Accounts and FAO.
Accessible version
| Seasonally adjusted, quarter-over-quarter growth, % | Average | |
|---|---|---|
| 2022 Q2 | 0.9 | 0.4 |
| 2022 Q3 | 0.3 | 0.4 |
| 2022 Q4 | -0.2 | 0.4 |
| 2023 Q1 | 1.0 | 0.4 |
| 2023 Q2 | 0.4 | 0.4 |
| 2023 Q3 | 0.3 | 0.4 |
| 2023 Q4 | 0.2 | 0.4 |
| 2024 Q1 | 0.3 | 0.4 |
| 2024 Q2 | 0.4 | 0.4 |
| 2024 Q3 | 0.4 | 0.4 |
| 2024 Q4 | 0.6 | 0.4 |
| 2025 Q1 | 0.6 | 0.4 |
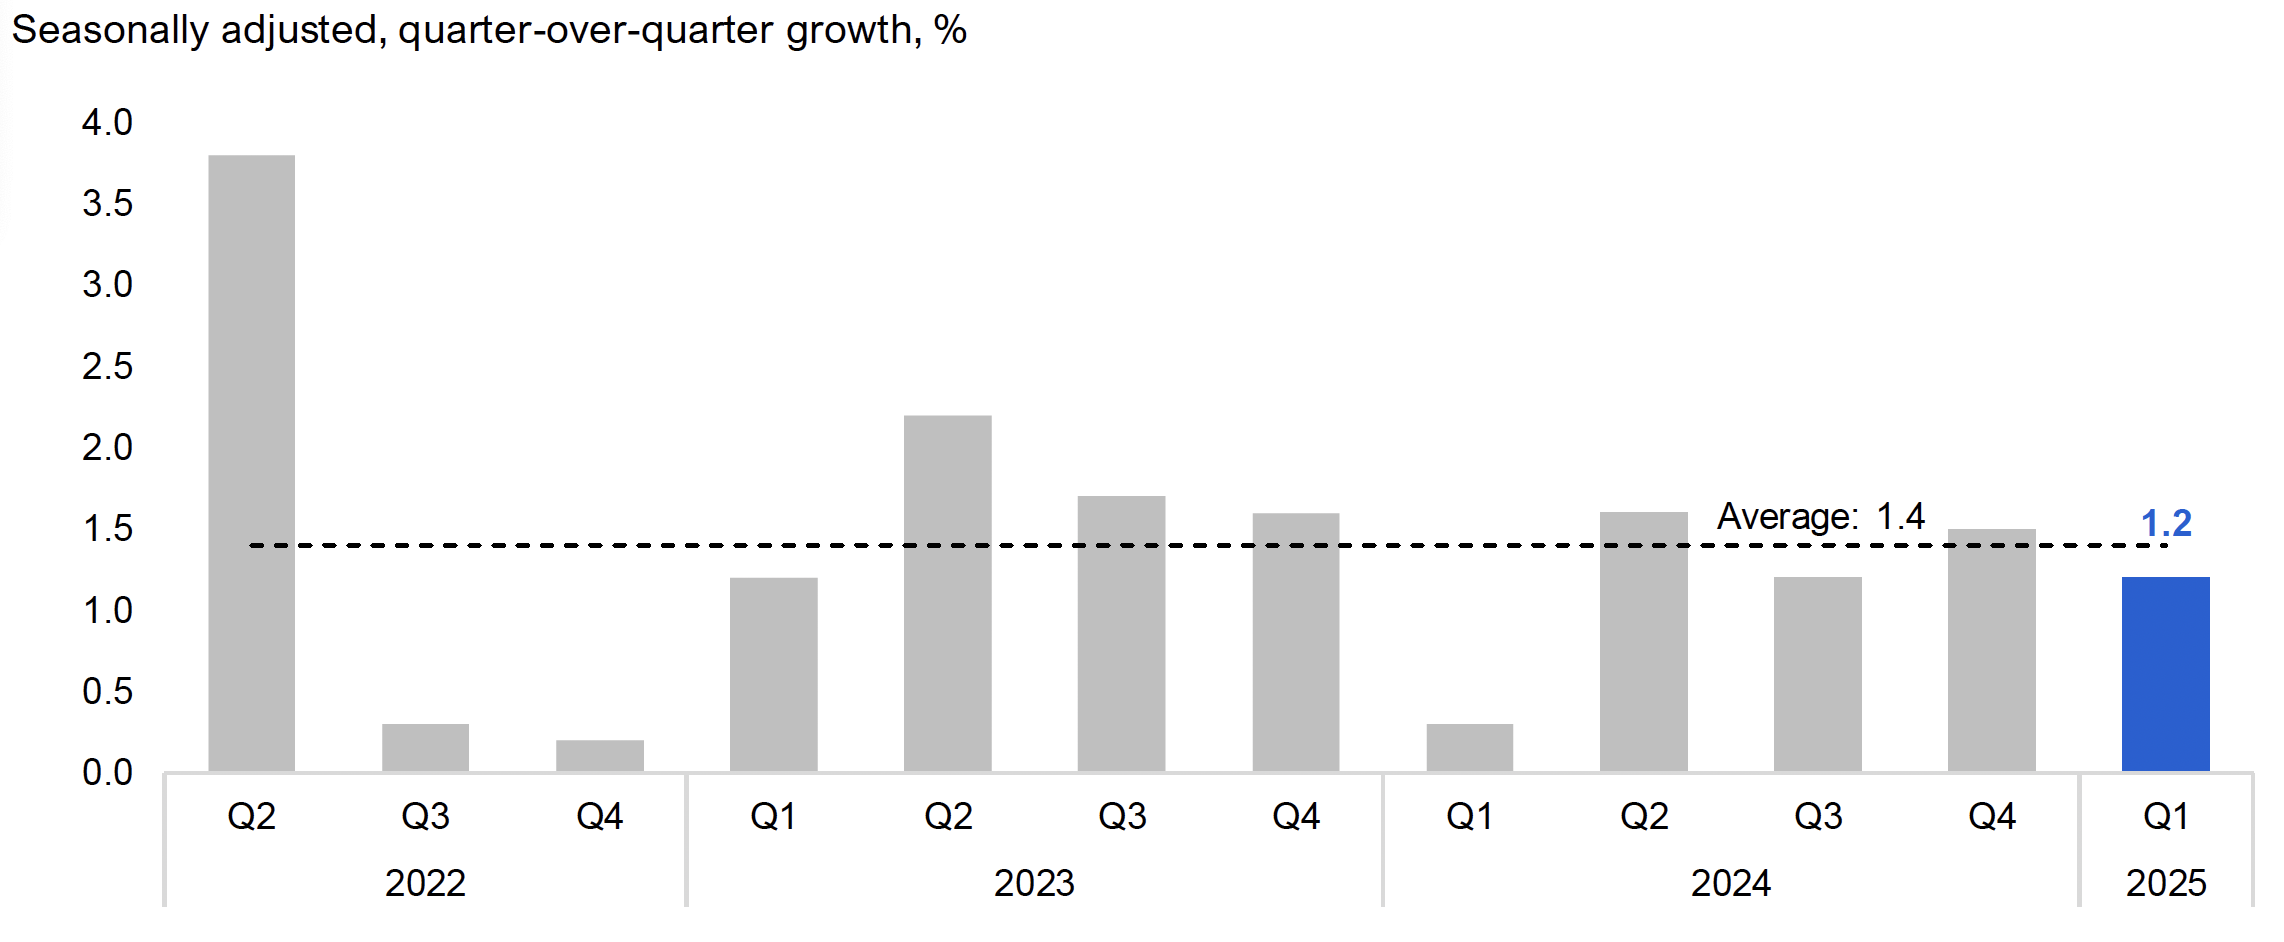
Nominal GDP, the broadest measure of the tax base and which includes inflation, increased by a solid 1.2% in 2025 Q1, slowing from growth of 1.5% in 2024 Q4. The slowdown in nominal GDP growth in 2025 Q1 reflected moderating gains in both labour income (0.5%) and corporate profits (0.1%).
Figure 2 Nominal GDP increased by 1.2% in 2025 Q1
Source: Ontario Economic Accounts and FAO.
Accessible version
| Seasonally adjusted, quarter-over-quarter growth, % | Average | |
|---|---|---|
| 2022 Q2 | 3.8 | 1.4 |
| 2022 Q3 | 0.3 | 1.4 |
| 2022 Q4 | 0.2 | 1.4 |
| 2023 Q1 | 1.2 | 1.4 |
| 2023 Q2 | 2.2 | 1.4 |
| 2023 Q3 | 1.7 | 1.4 |
| 2023 Q4 | 1.6 | 1.4 |
| 2024 Q1 | 0.3 | 1.4 |
| 2024 Q2 | 1.6 | 1.4 |
| 2024 Q3 | 1.2 | 1.4 |
| 2024 Q4 | 1.5 | 1.4 |
| 2025 Q1 | 1.2 | 1.4 |
For more detailed information on Ontario’s economic performance in 2025 Q1, see the Ontario Economic Accounts.
Ontario’s 2025 Second Quarter Economic Indicators
The latest economic indicators suggest mostly negative results for Ontario’s economy in 2025 Q2, with losses in employment, manufacturing sales, wholesale and retail trade, and international exports. In contrast, the housing market rebounded in the second quarter, with both home resales and housing starts increasing.
Households
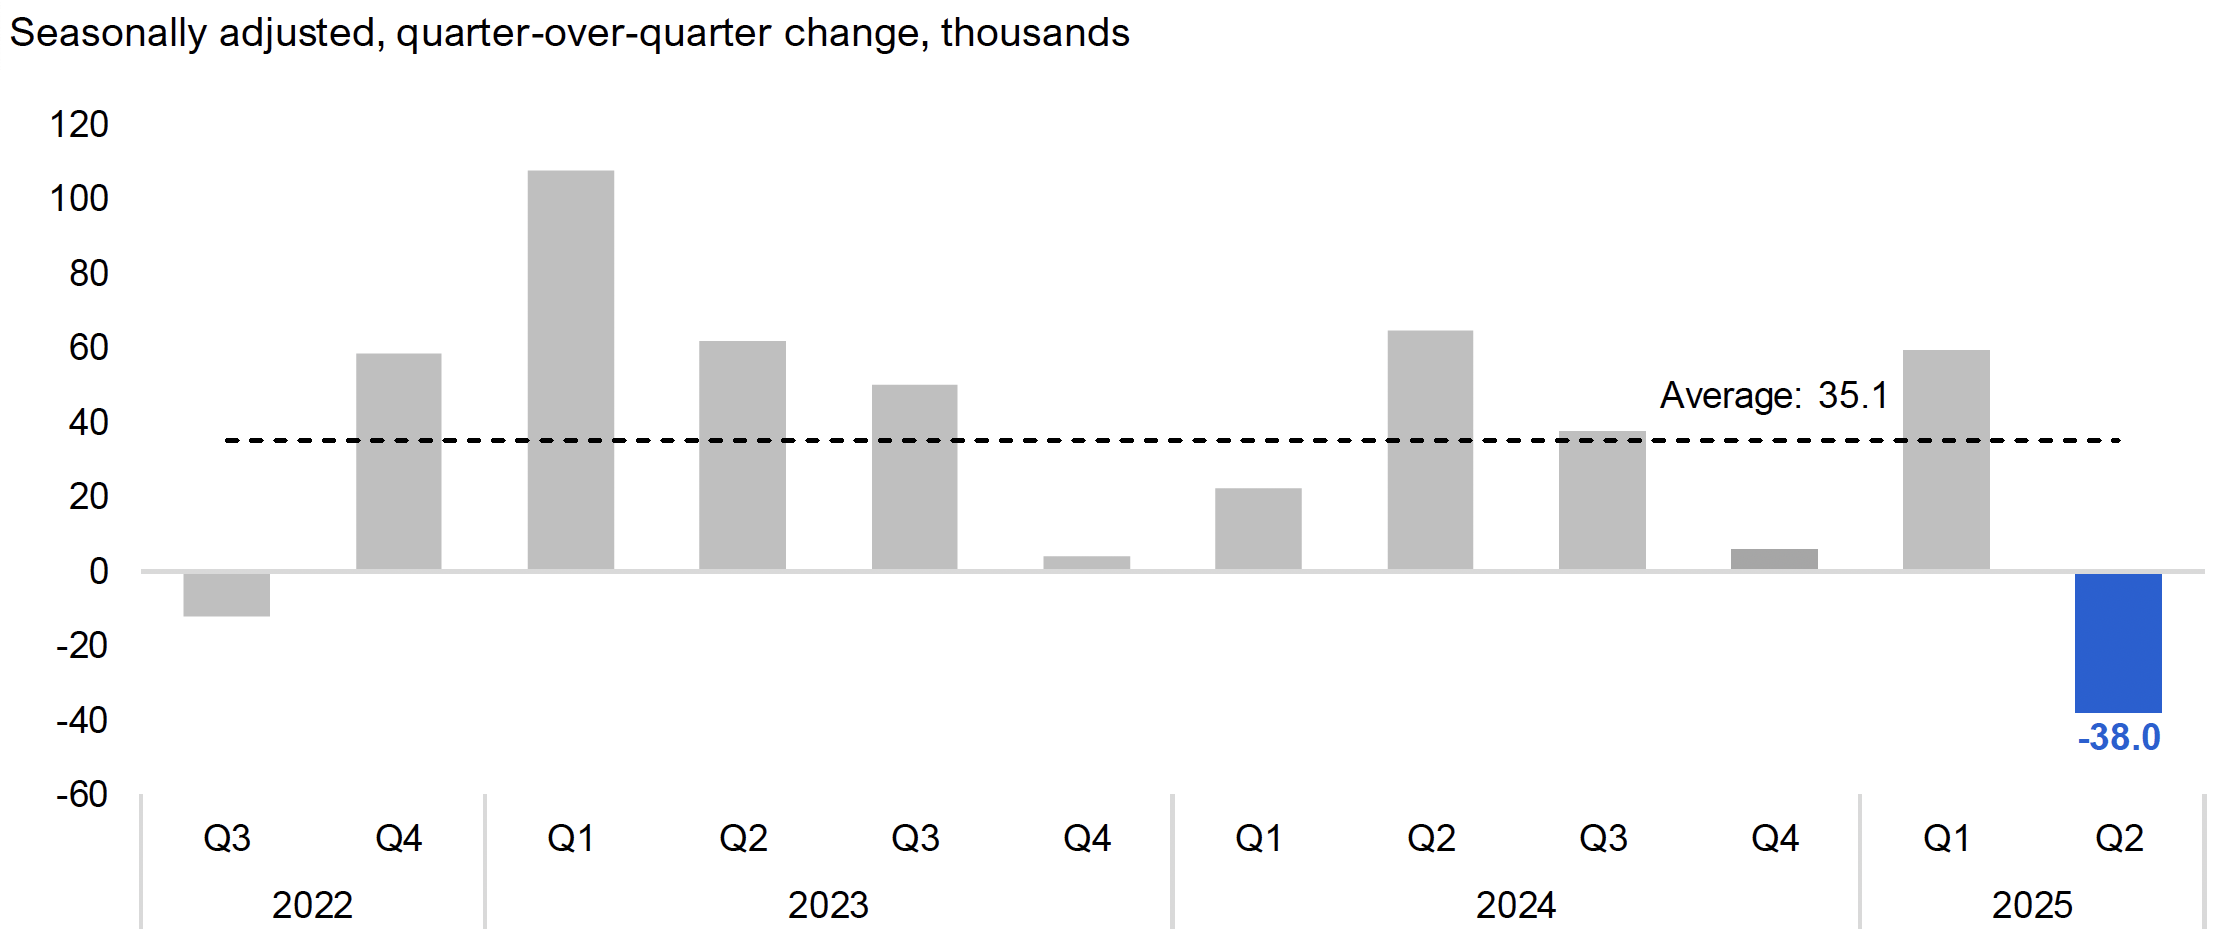
Employment in Ontario declined significantly by 38,000 (or -0.5%) in 2025 Q2, the first quarterly loss in nearly three years. The relative size of the decline in employment of -0.5% has only previously been recorded in recessions or periods of weak economic growth.[7] Full-time employment decreased by 56,600, while part-time employment increased by 18,700. Job losses were concentrated in the private sector (-30,100), with smaller losses in self-employment (-5,800) and the public sector (-2,000).[8]
Figure 3 Employment declined by 38,000 jobs in 2025 Q2
Source: Statistics Canada Table 14-10-0287-01 and FAO.
Accessible version
| Seasonally adjusted, quarter-over-quarter change, thousands | Average | |
|---|---|---|
| 2022 Q3 | -12.0 | 35.1 |
| 2022 Q4 | 58.5 | 35.1 |
| 2023 Q1 | 107.6 | 35.1 |
| 2023 Q2 | 62.0 | 35.1 |
| 2023 Q3 | 50.1 | 35.1 |
| 2023 Q4 | 3.9 | 35.1 |
| 2024 Q1 | 22.4 | 35.1 |
| 2024 Q2 | 64.6 | 35.1 |
| 2024 Q3 | 37.6 | 35.1 |
| 2024 Q4 | 5.8 | 35.1 |
| 2025 Q1 | 59.2 | 35.1 |
| 2025 Q2 | -38.0 | 35.1 |
Employment in 2025 Q2 declined across all major age groups, with workers aged 55 and older recording job losses of 23,300 (-1.3%), core-age workers (aged 25 to 54) down by 9,900 jobs (-0.2%) and youth (aged 15 to 24) down by 4,700 jobs (-0.4%).
By industry, the largest employment loss in 2025 Q2 was recorded in manufacturing (-29,400), followed by business, building and other support services (-14,900), information, culture and recreation (-12,900), transportation and warehousing (-8,600) and agriculture (-8,500). After a strong 3.1% gain in 2025 Q1, manufacturing employment fell by -3.5% in 2025 Q2 as newly imposed US tariffs on exports began to weigh on the sector.[9]
In 2025 Q2, job gains were recorded in finance, insurance and real estate (+22,800), wholesale and retail trade (+16,200), professional, scientific and technical services (+13,300) and utilities (+6,200).
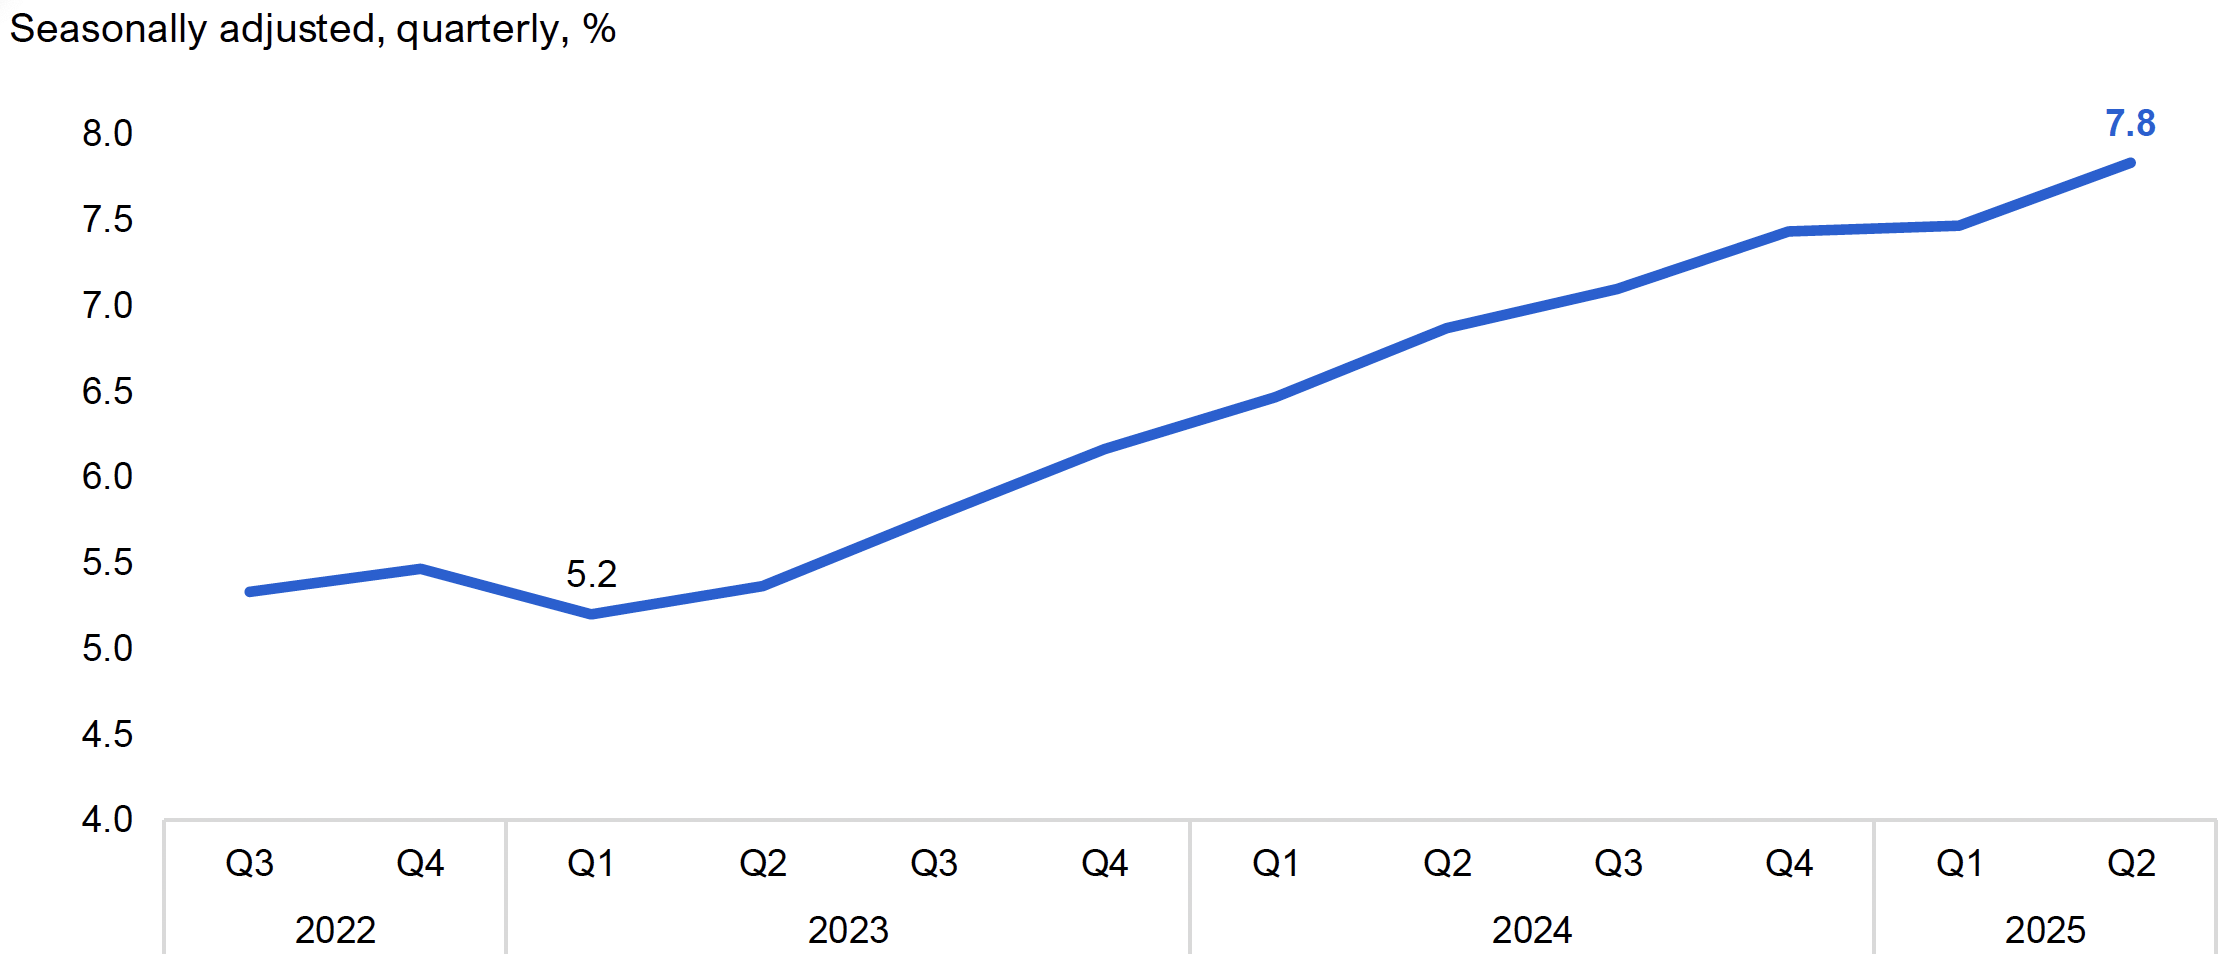
The unemployment rate rose for the ninth consecutive quarter, reaching 7.8% in 2025 Q2. This is 2.6 percentage points higher than the low of 5.2% recorded in 2023 Q1, and marks the highest unemployment rate since late 2012, excluding the pandemic. Among the major age groups, the unemployment rate of core-age workers (25-54 years) rose 0.5 percentage points to 6.9% in 2025 Q2, the highest rate in 14 years, excluding the pandemic.
Figure 4 Unemployment rate rose for the ninth consecutive quarter, reaching 7.8%
Source: Statistics Canada Table 14-10-0287-01 and FAO.
Accessible version
| Seasonally adjusted, quarterly, % | |
|---|---|
| 2022 Q3 | 5.3 |
| 2022 Q4 | 5.5 |
| 2023 Q1 | 5.2 |
| 2023 Q2 | 5.4 |
| 2023 Q3 | 5.8 |
| 2023 Q4 | 6.2 |
| 2024 Q1 | 6.5 |
| 2024 Q2 | 6.9 |
| 2024 Q3 | 7.1 |
| 2024 Q4 | 7.4 |
| 2025 Q1 | 7.5 |
| 2025 Q2 | 7.8 |
Tariffs are beginning to affect employment, particularly in manufacturing and in Windsor
In an April 2025 report, The Potential Impacts of US Tariffs on the Ontario Economy, the FAO analyzed the potential impact of US tariffs on employment in Ontario and its Census Metropolitan Areas (CMAs). The report showed that manufacturing was expected to be the most affected industry in Ontario, and Windsor was expected to experience the steepest job losses among the CMAs.
As tariffs were implemented, Ontario experienced significant declines in employment in 2025 Q2, with manufacturing job losses amounting to 29,400. This represented a 3.5% drop in Ontario’s manufacturing employment, the sharpest quarterly job loss since 2009 Q2, excluding the pandemic. The change in employment in 2025 Q2 would include the early impacts of tariffs as well as broader economic factors.
Figure 5 Ontario employment changes by sector in 2025 Q2
Changes from 2025 Q1 to Q2, number of jobs
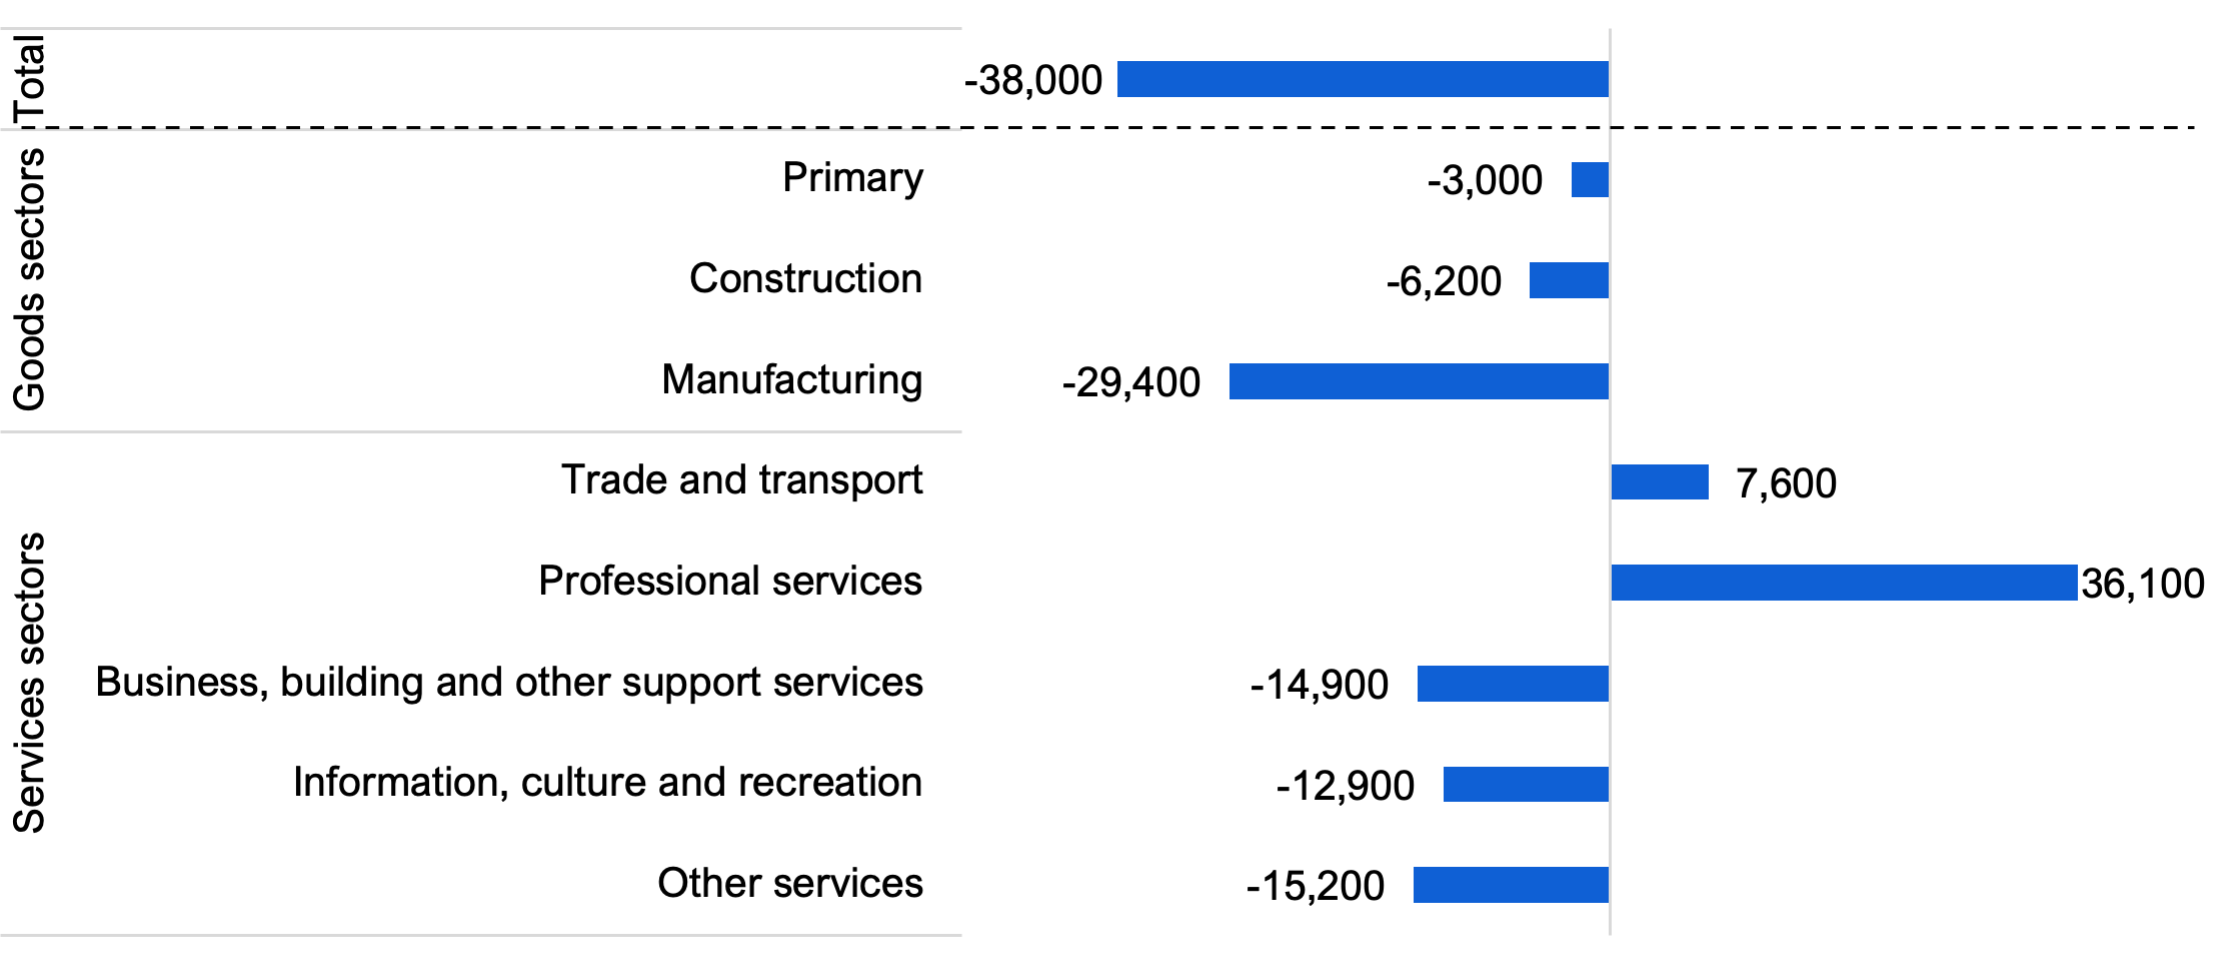
Note: For a breakdown of the North American Industry Classification System (NAICS) industries included in the sectors presented in this figure, see Appendix Table 1.
Source: Statistics Canada Table 14-10-0355-01 and FAO.
Accessible version
| Changes from 2025 Q1 to Q2, number of jobs | ||
|---|---|---|
| Total | -38,000 | |
| Goods sector | Primary | -3,000 |
| Construction | -6,200 | |
| Manufacturing | -29,400 | |
| Services sector | Trade and transport | 7,600 |
| Professional services | 36,100 | |
| Business, building, and other support services | -14,900 | |
| Information, culture and recreation | -12,900 | |
| All other services | -15,200 |
Among the CMAs, Windsor saw the sharpest employment decline (-4.3%) in 2025 Q2, followed by Kingston (-4.2%), Guelph (-3.0%) and Oshawa (-2.5%). Windsor’s unemployment rate increased by 1.9 percentage points in 2025 Q2, reaching 11.2%, the highest rate among all Canadian CMAs.
Figure 6 Ontario employment changes by census metropolitan area* in 2025 Q2
Changes from 2025 Q1 to Q2, %
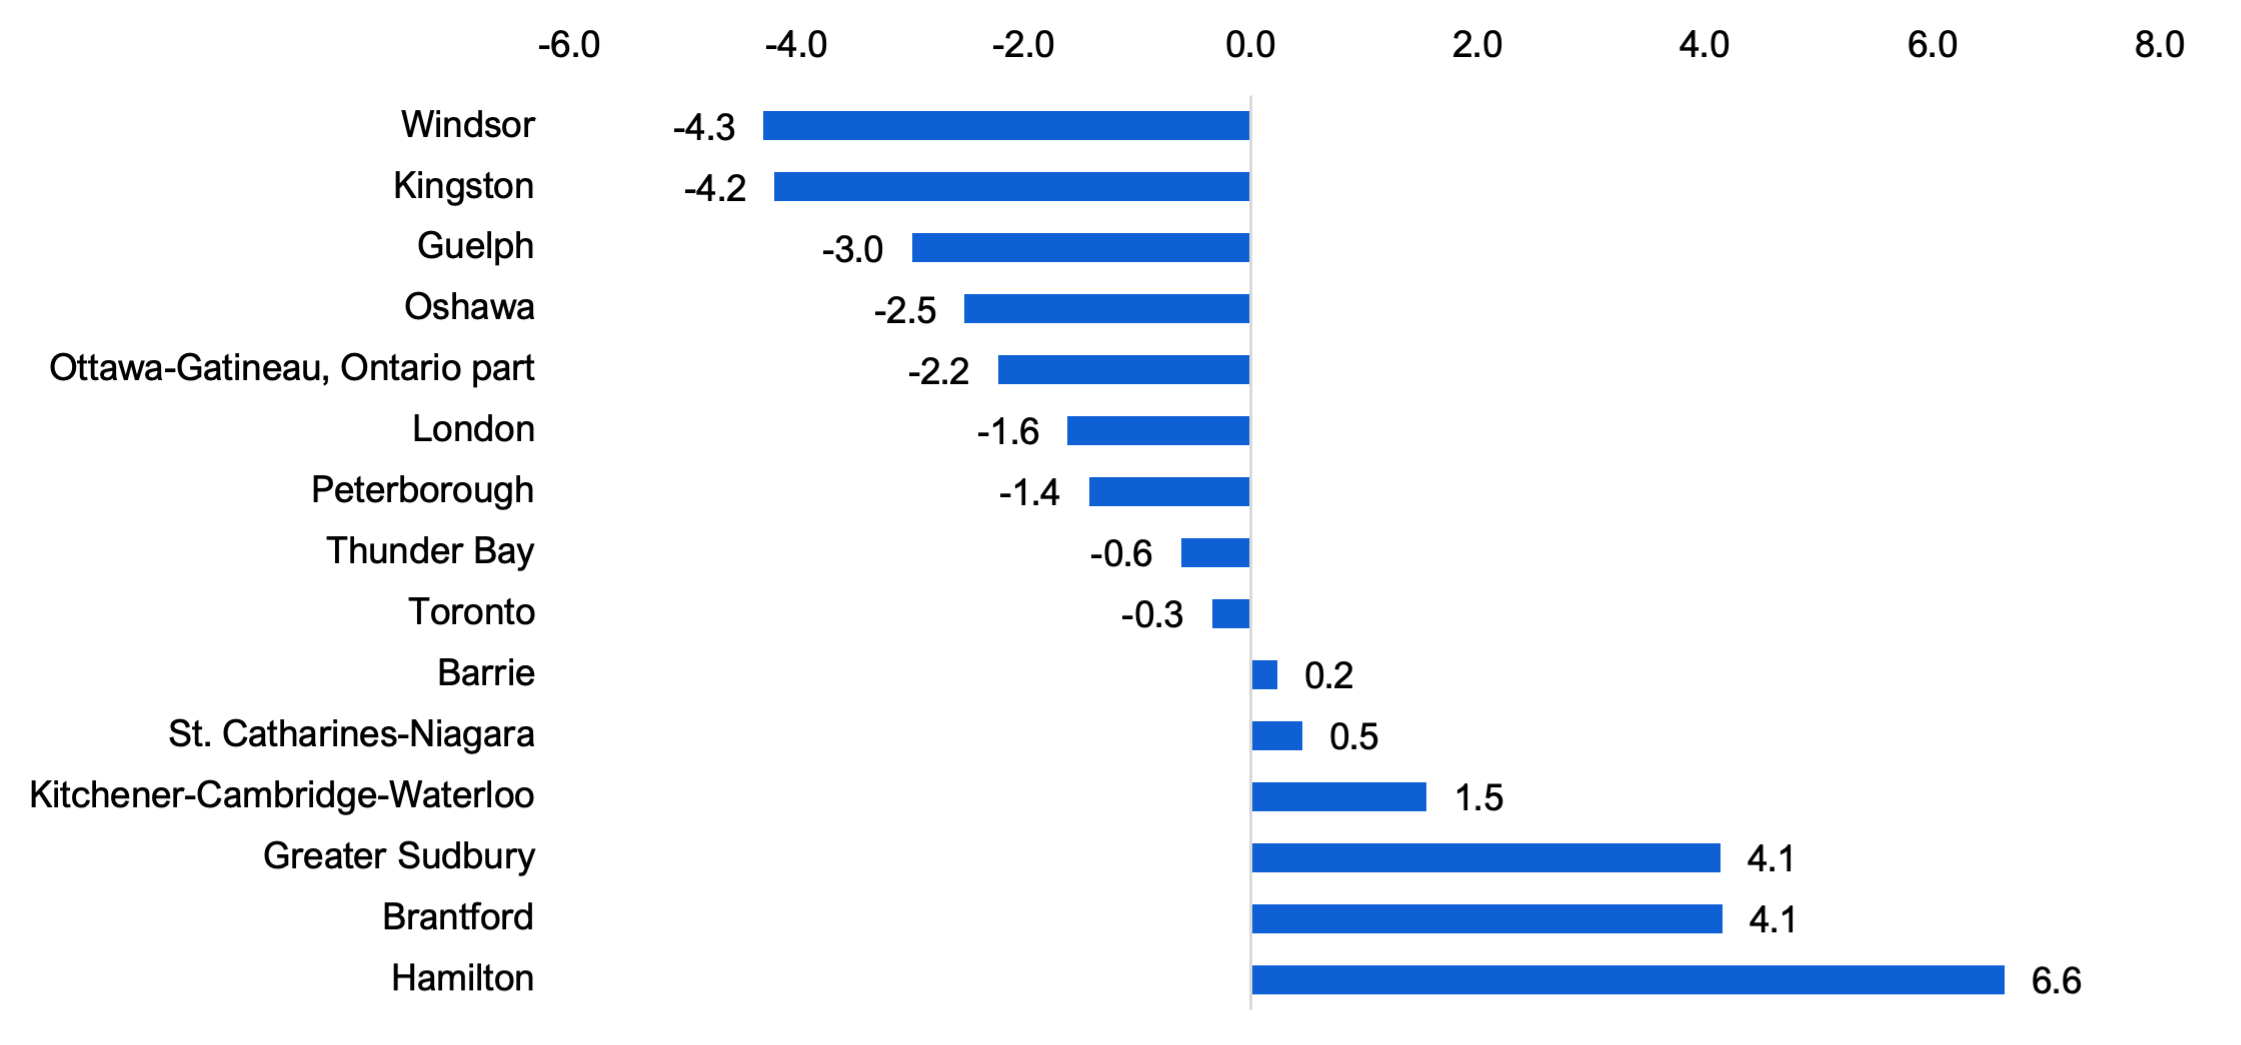
* Census metropolitan area represents where workers live, which may not correspond to the region in which they work.
Note: The CMA Belleville – Quinte West was excluded due to high volatility in its labour market data.
Source: Statistics Canada Table 14-10-0459-01 and FAO.
Accessible version
| Changes from 2025 Q1 to Q2, % | |
|---|---|
| Windsor | -4.3 |
| Kingston | -4.2 |
| Guelph | -3.0 |
| Oshawa | -2.5 |
| Ottawa-Gatineau, Ontario part | -2.2 |
| London | -1.6 |
| Peterborough | -1.4 |
| Thunder Bay | -0.6 |
| Toronto | -0.3 |
| Barrie | 0.2 |
| St. Catharines-Niagara | 0.5 |
| Kitchener-Cambridge-Waterloo | 1.5 |
| Greater Sudbury | 4.1 |
| Brantford | 4.1 |
| Hamilton | 6.6 |
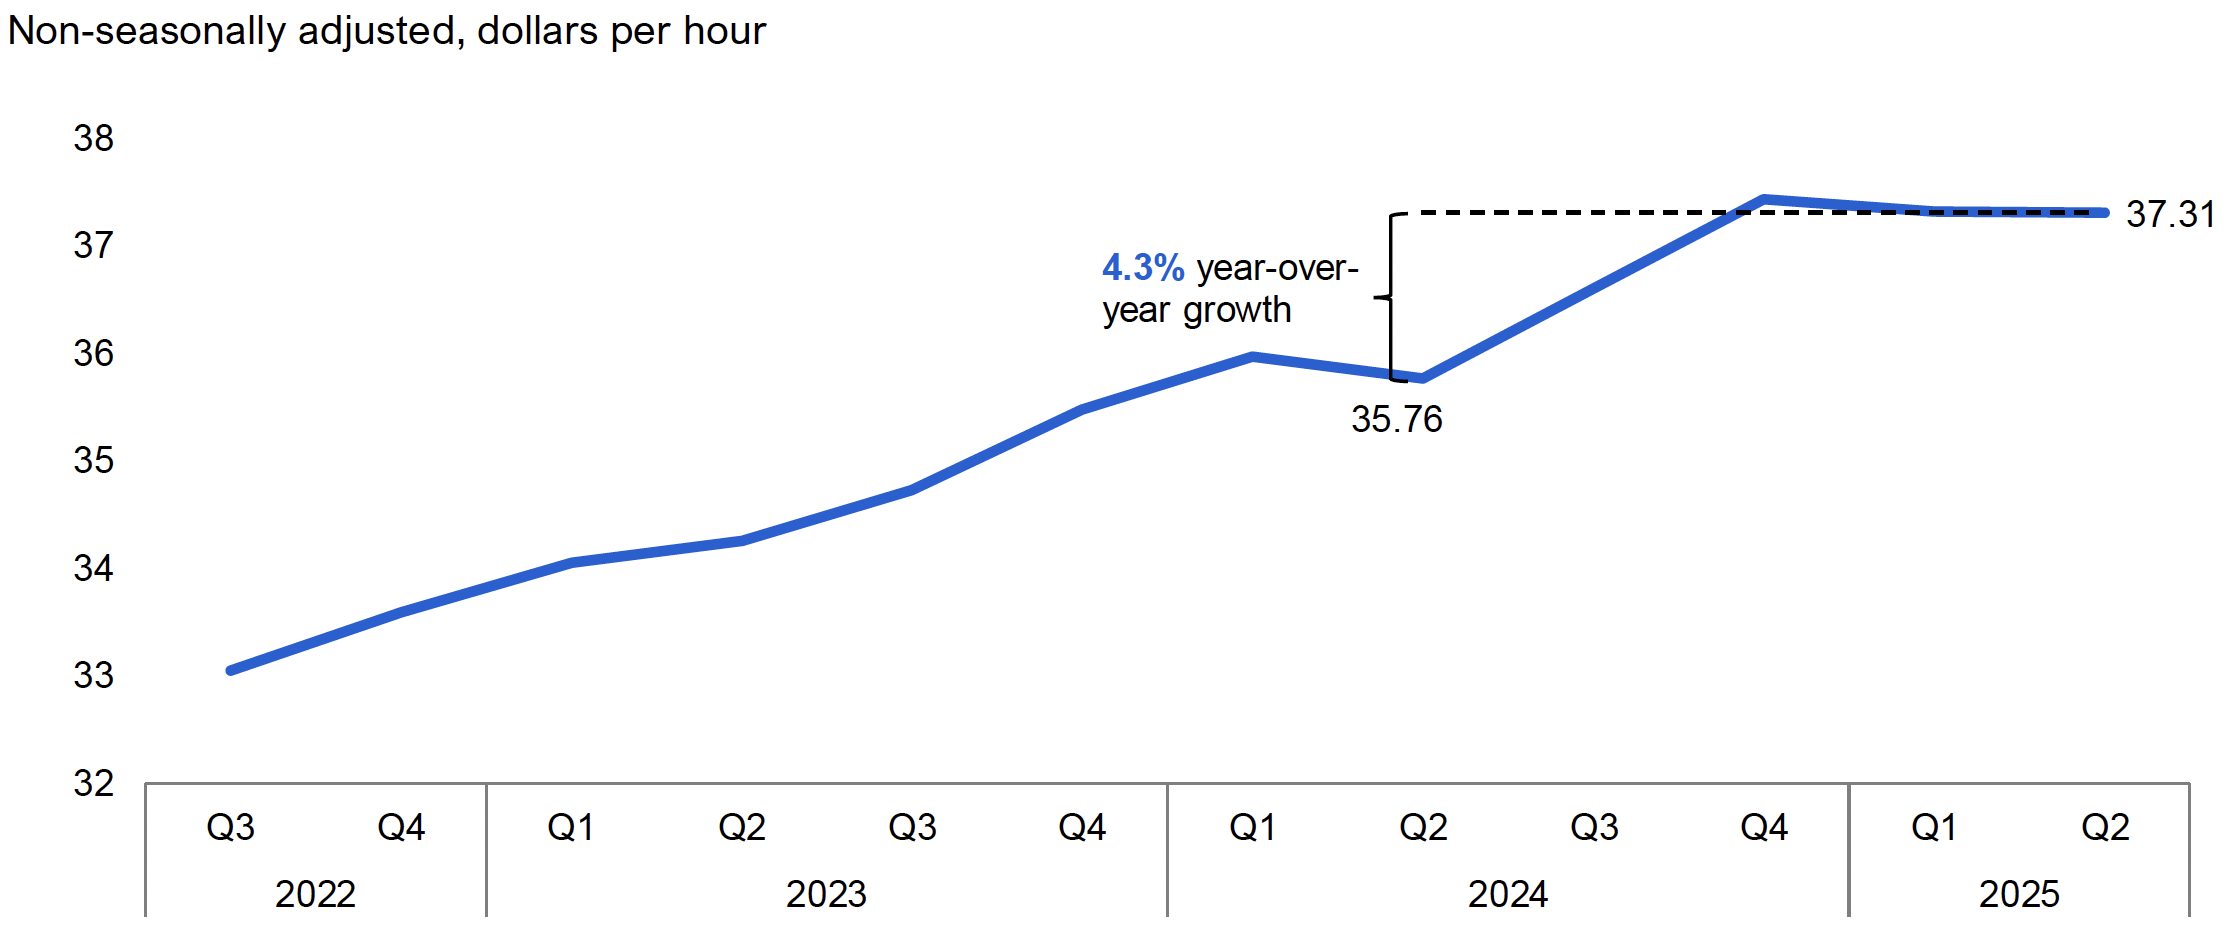
Average hourly wages grew 4.3% in 2025 Q2 compared to 2024 Q2, reaching $37.31 an hour. Hourly wage growth was broad-based across most major industries, with wages in services-producing industries rising 4.6% and goods-producing industries increasing 3.0%. Industries with the fastest wage growth were information, culture and recreation; agriculture; business, building and other support services; health care and social assistance; educational services; utilities; and public administration.
Figure 7 Average hourly wages grew 4.3% in 2025 Q2 compared to 2024
Source: Statistics Canada Table 14-10-0063-01 and FAO.
Accessible version
| Non-seasonally adjusted, dollars per hour | Growth | |
|---|---|---|
| 2022 Q3 | 33.05 | |
| 2022 Q4 | 33.59 | |
| 2023 Q1 | 34.05 | |
| 2023 Q2 | 34.26 | |
| 2023 Q3 | 34.72 | |
| 2023 Q4 | 35.48 | |
| 2024 Q1 | 35.96 | |
| 2024 Q2 | 35.76 | 4.3% year-over-year growth |
| 2024 Q3 | 36.60 | |
| 2024 Q4 | 37.43 | |
| 2025 Q1 | 37.32 | |
| 2025 Q2 | 37.31 |
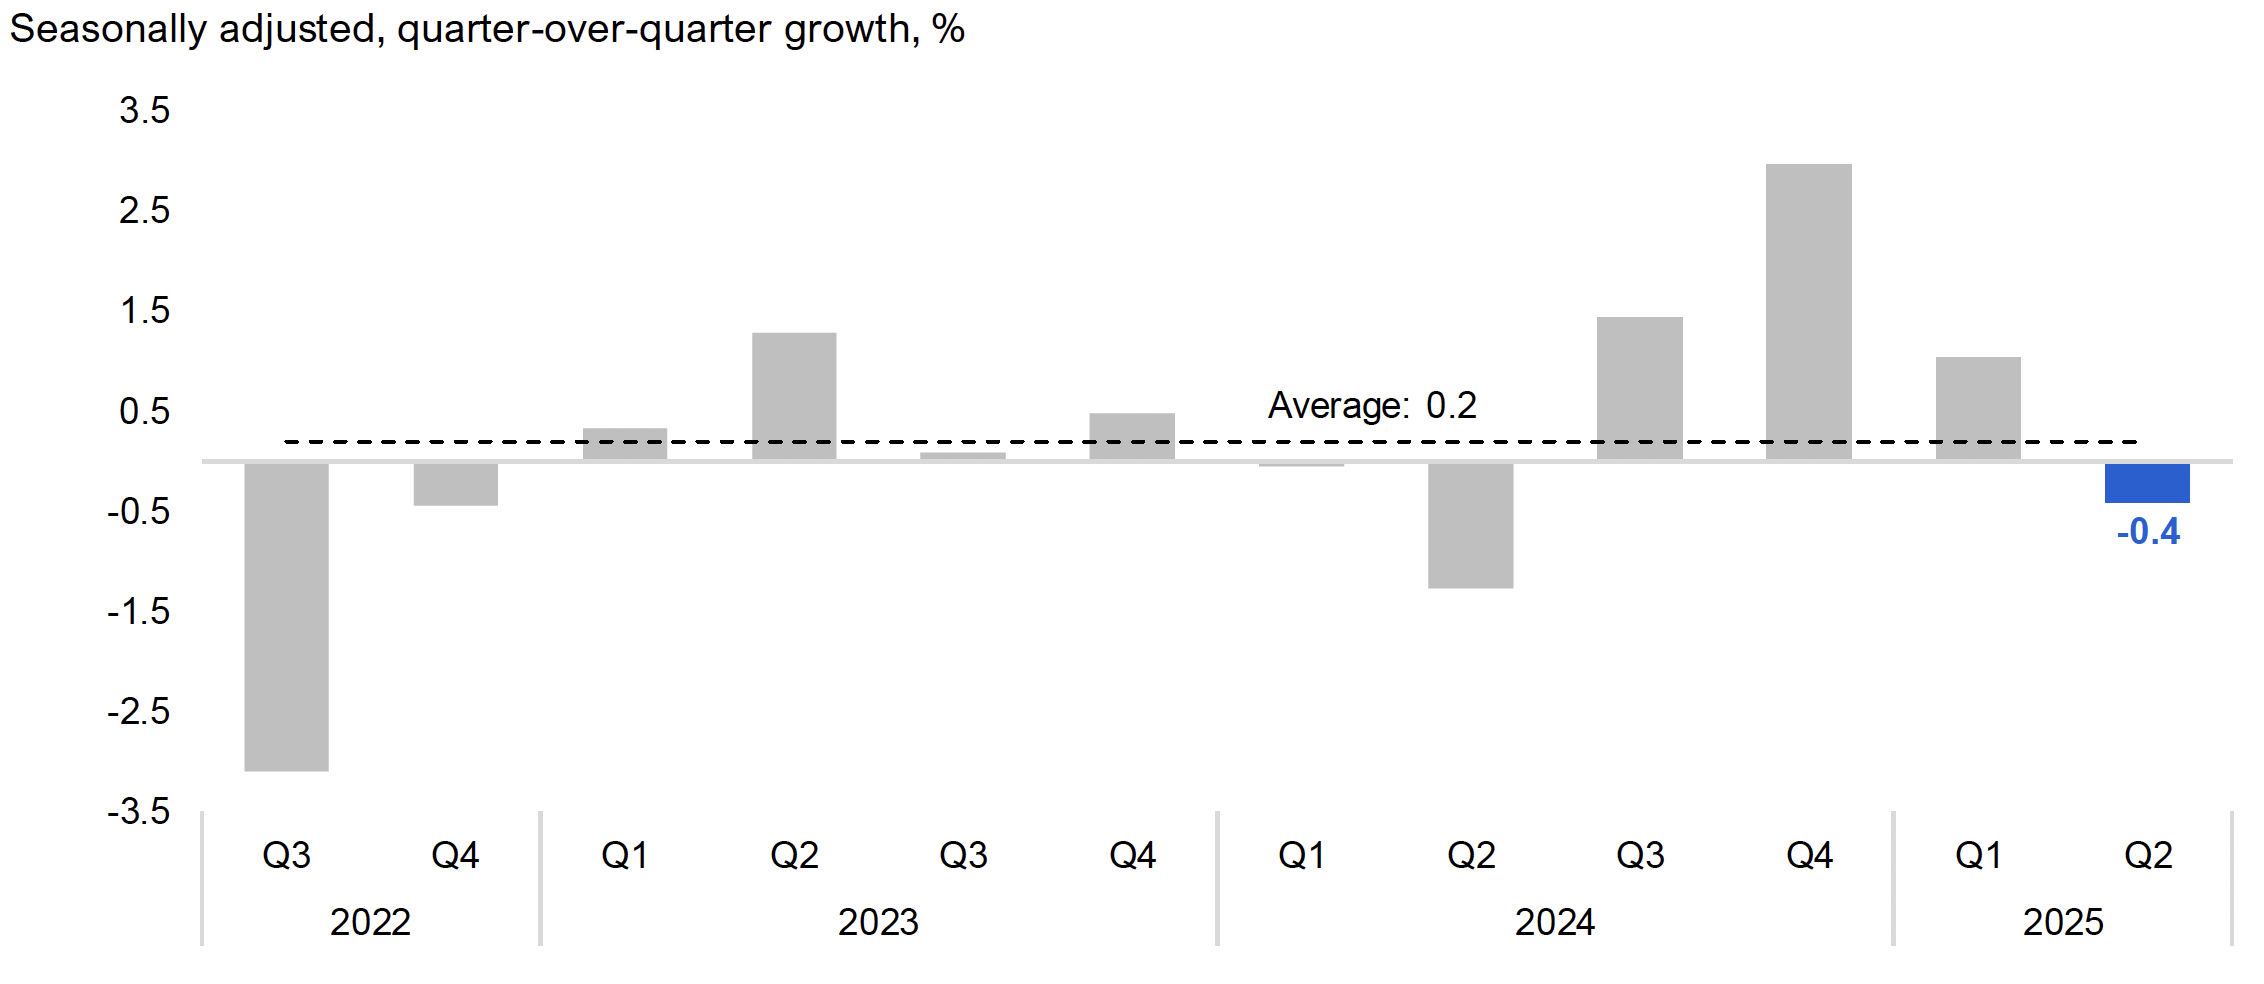
Retail sales[10] declined by 0.4% in 2025 Q2 in Ontario, following strong gains in the previous three quarters. Lower sales in gasoline and fuel, general merchandise, and food and beverage led the decline in 2025 Q2, partially offset by higher sales in motor vehicles and parts, building and garden supplies, health and personal care, and furniture, electronics and appliances. Economic uncertainty related to the trade conflict continued to weigh on consumers, raising concerns about personal finances and negatively affecting their spending plans.[11]
Figure 8 Retail sales declined by 0.4% in 2025 Q2
Source: Statistics Canada Table 20-10-0056-01 and FAO.
Accessible version
| Seasonally adjusted, quarter-over-quarter growth, % | Average | |
|---|---|---|
| 2022 Q3 | -3.1 | 0.2 |
| 2022 Q4 | -0.4 | 0.2 |
| 2023 Q1 | 0.3 | 0.2 |
| 2023 Q2 | 1.3 | 0.2 |
| 2023 Q3 | 0.1 | 0.2 |
| 2023 Q4 | 0.5 | 0.2 |
| 2024 Q1 | 0.0 | 0.2 |
| 2024 Q2 | -1.3 | 0.2 |
| 2024 Q3 | 1.4 | 0.2 |
| 2024 Q4 | 3.0 | 0.2 |
| 2025 Q1 | 1.0 | 0.2 |
| 2025 Q2 | -0.4 | 0.2 |
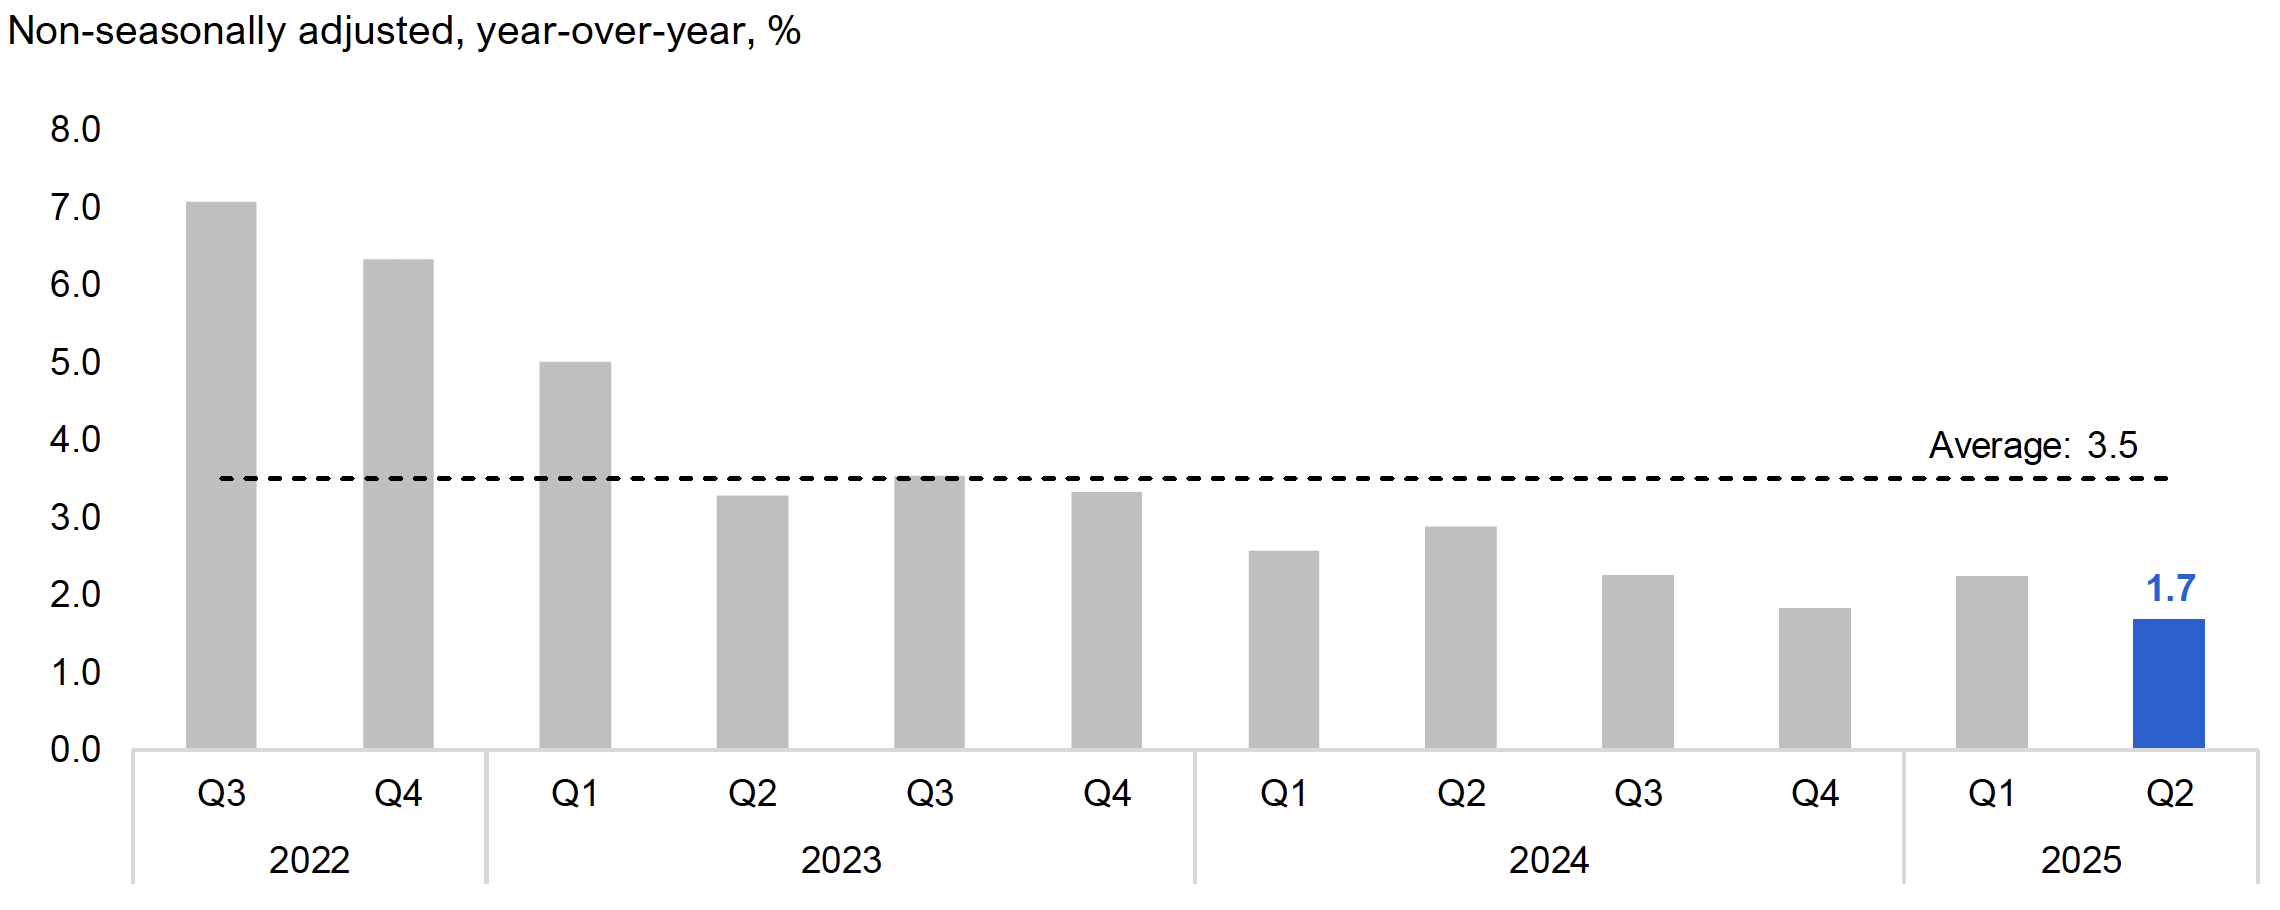
The Ontario Consumer Price Index (CPI) inflation rate[12] was 1.7% in 2025 Q2, down from 2.2% in 2025 Q1, reflecting in part the removal of the Canadian consumer carbon tax in April.[13] Of the major CPI components, food (3.4%), health and personal care (2.5%) and shelter (2.4%) increased at rates faster than headline inflation in 2025 Q2. In contrast, prices were lower in 2025 Q2 for transportation (-1.4%) compared to a year earlier.
Figure 9 CPI inflation rate down to 1.7% in 2025 Q2
Source: Statistics Canada Table 18-10-0004-01 and FAO.
Accessible version
| Non-seasonally adjusted, year-over-year, % | Average | |
|---|---|---|
| 2022 Q3 | 7.1 | 3.5 |
| 2022 Q4 | 6.3 | 3.5 |
| 2023 Q1 | 5.0 | 3.5 |
| 2023 Q2 | 3.3 | 3.5 |
| 2023 Q3 | 3.5 | 3.5 |
| 2023 Q4 | 3.3 | 3.5 |
| 2024 Q1 | 2.6 | 3.5 |
| 2024 Q2 | 2.9 | 3.5 |
| 2024 Q3 | 2.3 | 3.5 |
| 2024 Q4 | 1.8 | 3.5 |
| 2025 Q1 | 2.2 | 3.5 |
| 2025 Q2 | 1.7 | 3.5 |
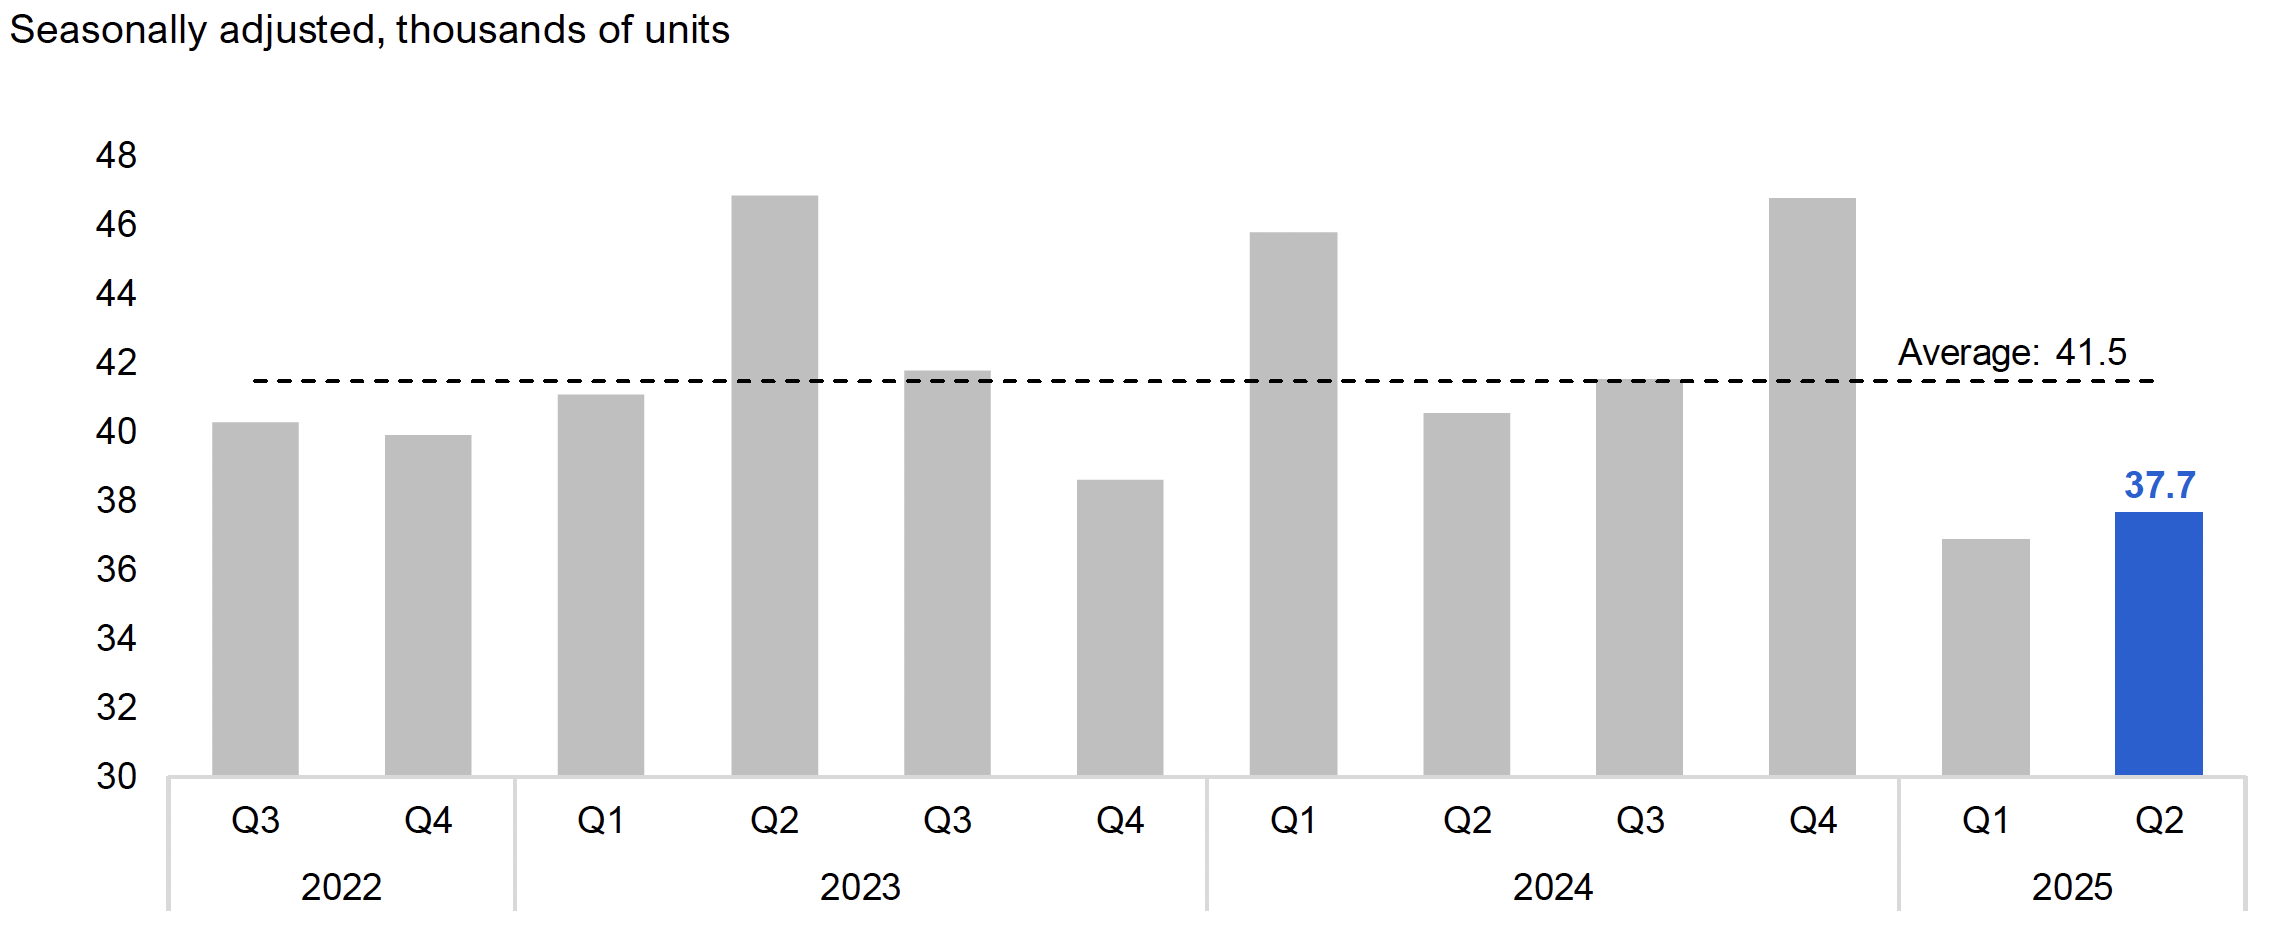
Ontario home resales increased by 2.1% in 2025 Q2 from the previous quarter’s low, with 37,700 units sold. Home resales in 2025 Q1 and Q2 marked the lowest two-quarter sales level since the 2008-09 financial crisis. Uncertainty about job security and personal finances continued to affect housing market activity.
Figure 10 Housing resales increased to 37,700 units in 2025 Q2
Source: Canadian Real Estate Association and FAO.
Accessible version
| Seasonally adjusted, thousands of units | Average | |
|---|---|---|
| 2022 Q3 | 40.3 | 41.5 |
| 2022 Q4 | 39.9 | 41.5 |
| 2023 Q1 | 41.1 | 41.5 |
| 2023 Q2 | 46.9 | 41.5 |
| 2023 Q3 | 41.8 | 41.5 |
| 2023 Q4 | 38.6 | 41.5 |
| 2024 Q1 | 45.8 | 41.5 |
| 2024 Q2 | 40.6 | 41.5 |
| 2024 Q3 | 41.5 | 41.5 |
| 2024 Q4 | 46.8 | 41.5 |
| 2025 Q1 | 36.9 | 41.5 |
| 2025 Q2 | 37.7 | 41.5 |
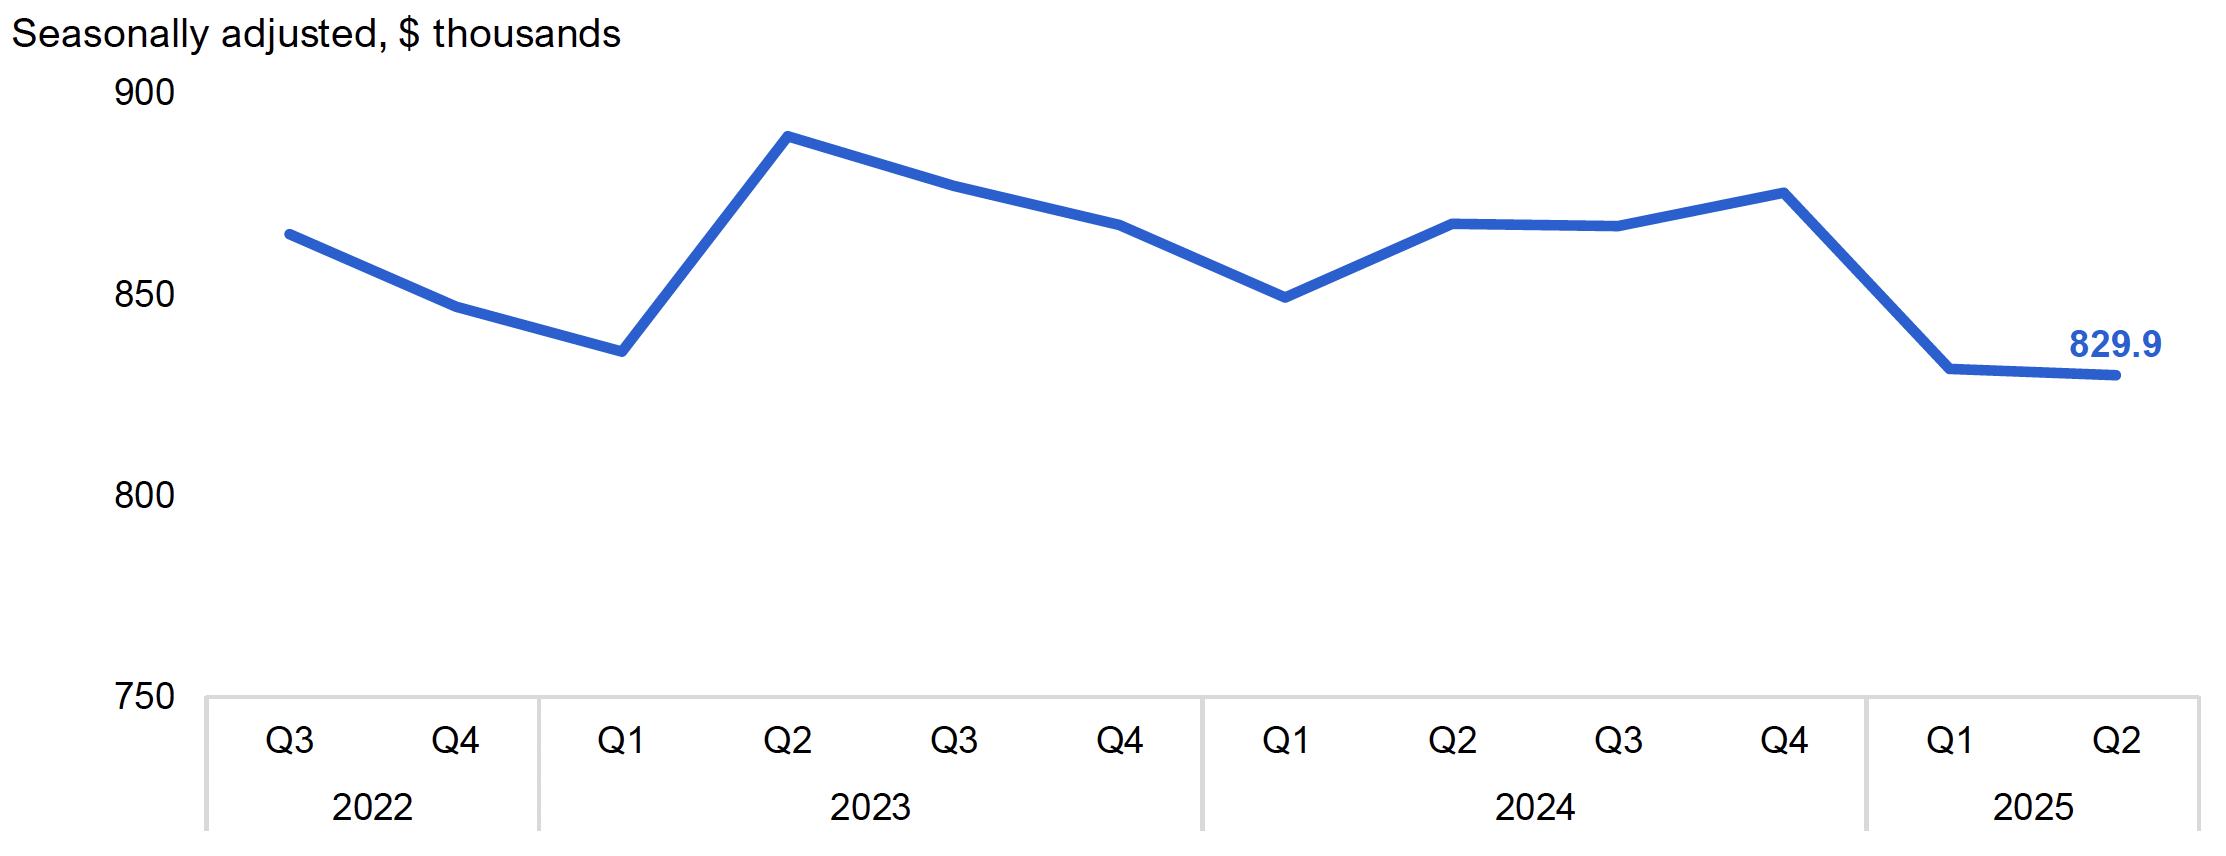
Home resale prices in Ontario averaged $829,900 in 2025 Q2, a 0.2% decrease from the previous quarter and the lowest since late 2020. In 2025 Q2, the average resale home price was $201,500 (or ‑19.5%) below the peak of $1,031,400 reached in 2022 Q1.
Figure 11 Home resale prices edged down to $829,900 in 2025 Q2
Source: Canadian Real Estate Association and FAO.
Accessible version
| Seasonally adjusted, $ thousands | |
|---|---|
| 2022 Q3 | 865.0 |
| 2022 Q4 | 846.9 |
| 2023 Q1 | 835.7 |
| 2023 Q2 | 889.3 |
| 2023 Q3 | 877.2 |
| 2023 Q4 | 867.3 |
| 2024 Q1 | 849.2 |
| 2024 Q2 | 867.7 |
| 2024 Q3 | 866.9 |
| 2024 Q4 | 875.3 |
| 2025 Q1 | 831.6 |
| 2025 Q2 | 829.9 |
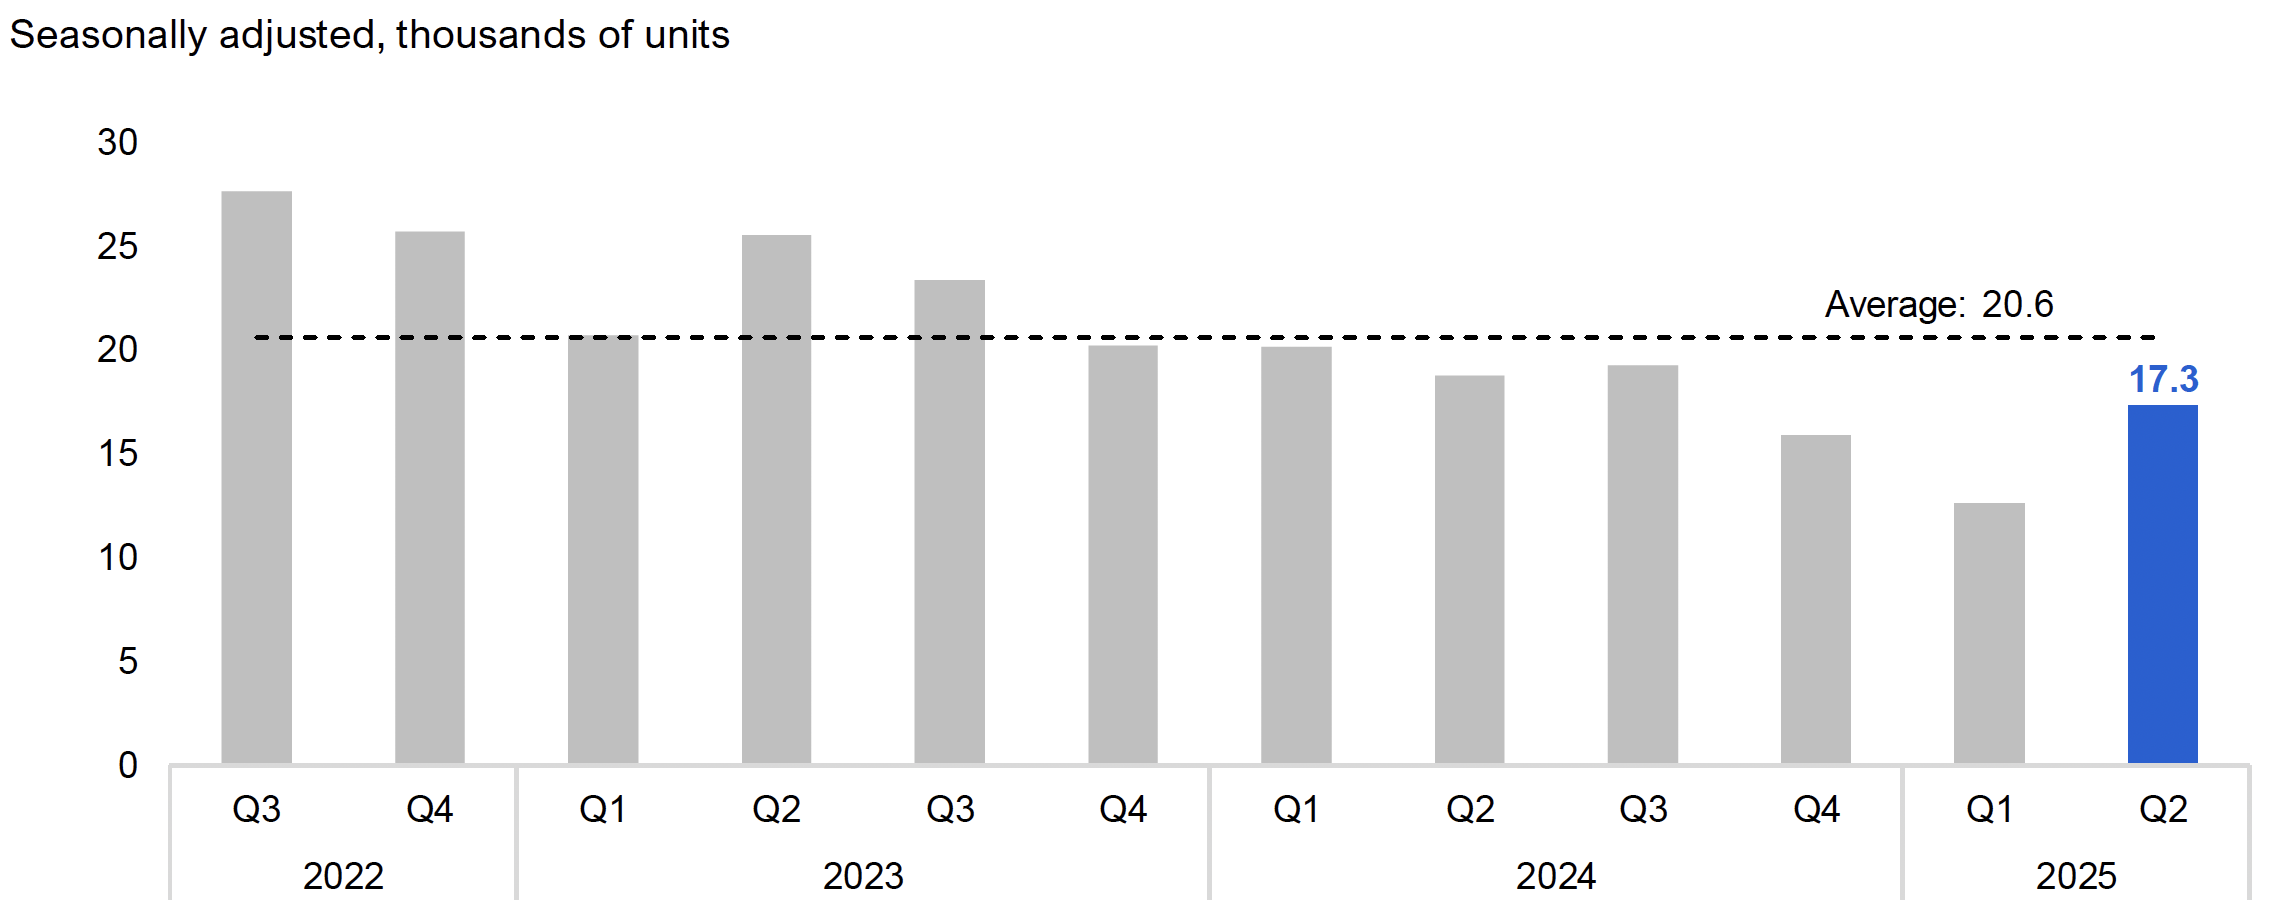
Housing starts[14] in 2025 Q2 totalled 17,300 units in Ontario, a 37.3% increase from the low of 12,600 units started in 2025 Q1. In 2025 Q2, 80% of total housing starts were multiple unit dwellings, while 20% were single detached homes.[15] Home building has been negatively affected by weak consumer confidence and high construction costs.[16]
Figure 12 Housing starts increased to 17,300 units in 2025 Q2
Source: Statistics Canada Table 34-10-0141-01 and FAO.
Accessible version
| Seasonally adjusted, thousands of units | Average | |
|---|---|---|
| 2022 Q3 | 27.6 | 20.6 |
| 2022 Q4 | 25.7 | 20.6 |
| 2023 Q1 | 20.7 | 20.6 |
| 2023 Q2 | 25.5 | 20.6 |
| 2023 Q3 | 23.4 | 20.6 |
| 2023 Q4 | 20.2 | 20.6 |
| 2024 Q1 | 20.2 | 20.6 |
| 2024 Q2 | 18.8 | 20.6 |
| 2024 Q3 | 19.2 | 20.6 |
| 2024 Q4 | 15.9 | 20.6 |
| 2025 Q1 | 12.6 | 20.6 |
| 2025 Q2 | 17.3 | 20.6 |
Businesses
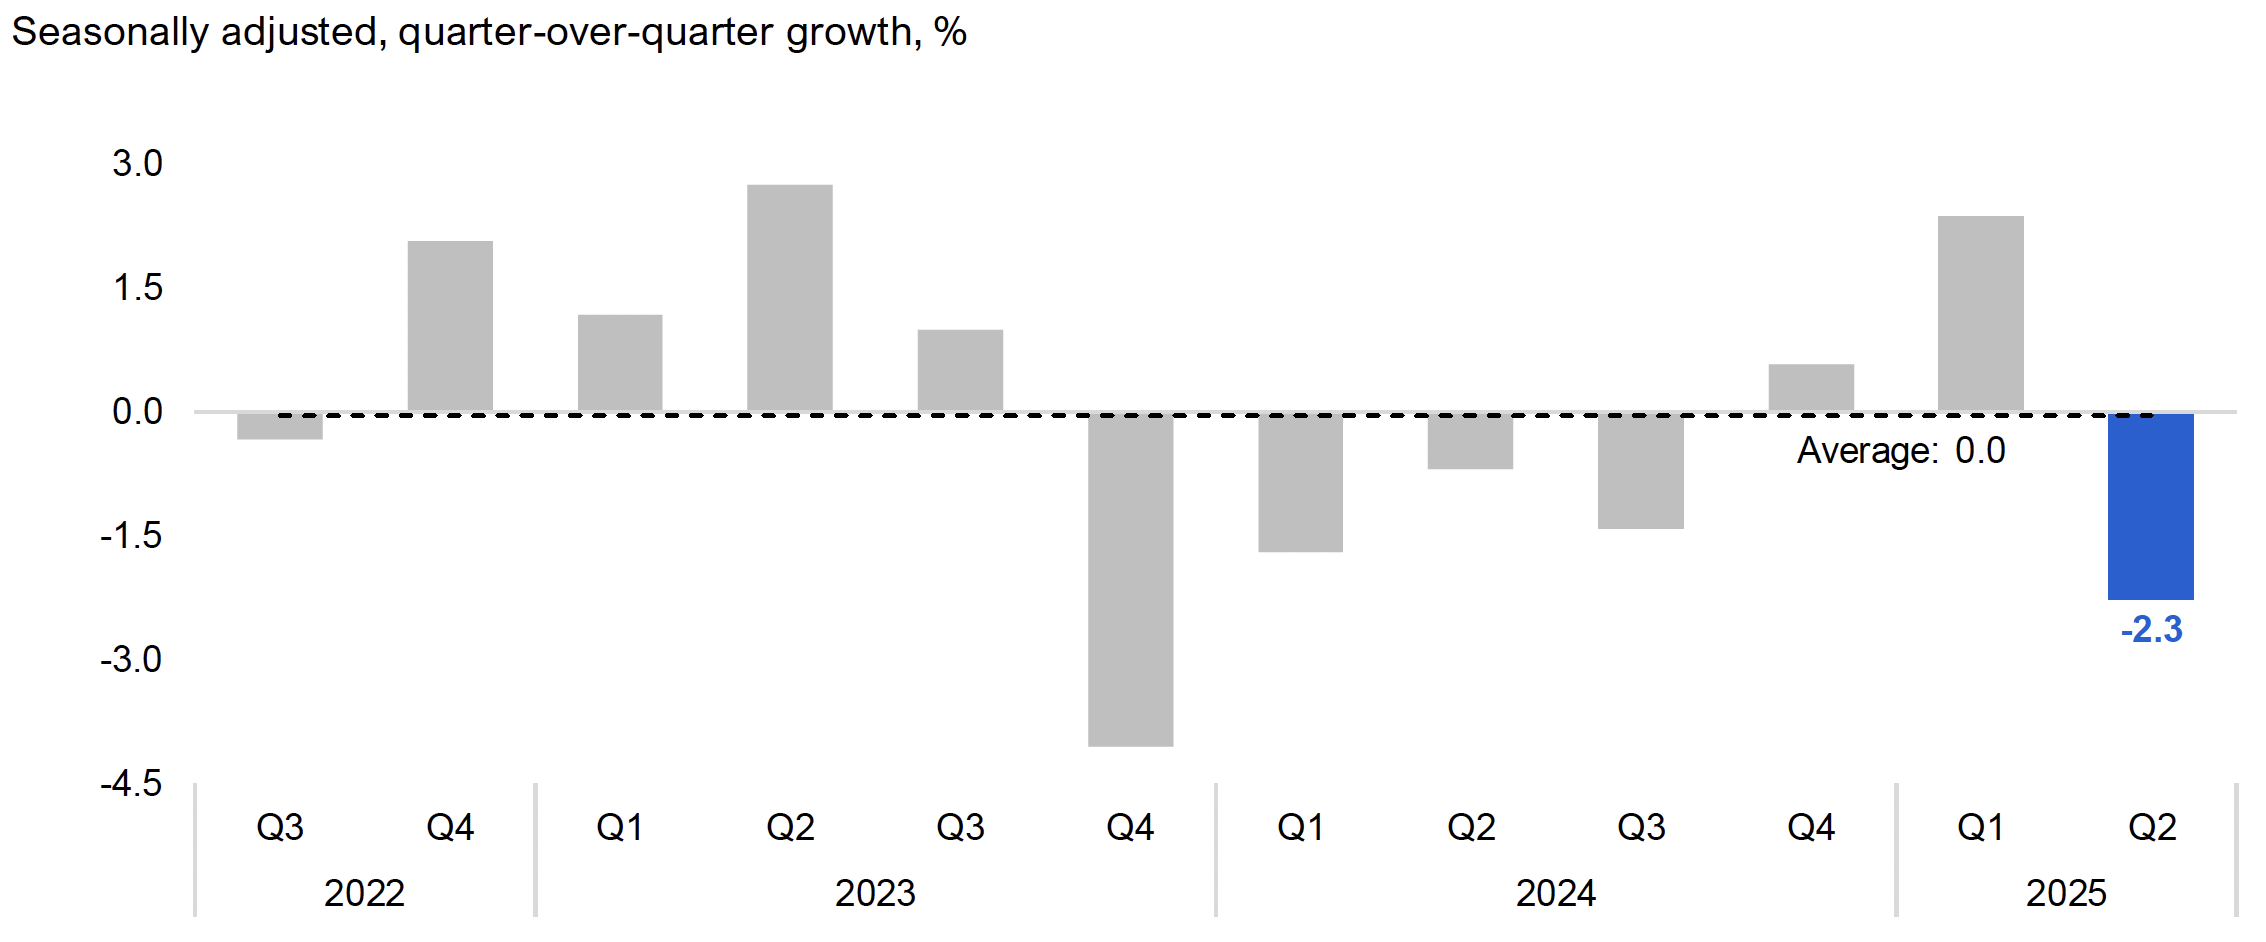
Manufacturing sales[17] fell by 2.3% in 2025 Q2, following a 2.4% gain in 2025 Q1, when sales surged ahead of US tariffs. Following the implementation of US tariffs, manufacturing sales pulled back sharply in 2025 Q2, with the decline concentrated in transportation equipment, petroleum and coal products, primary metal, and fabricated metal products. Higher sales were recorded in chemicals, paper, printing, plastics and rubber products, furniture, and non-metallic mineral products.
Figure 13 Manufacturing sales fell by 2.3% in 2025 Q2
Source: Statistics Canada Table 16-10-0048-01 and FAO.
Accessible version
| Seasonally adjusted, quarter-over-quarter growth, % | Average | |
|---|---|---|
| 2022 Q3 | -0.3 | 0.0 |
| 2022 Q4 | 2.1 | 0.0 |
| 2023 Q1 | 1.2 | 0.0 |
| 2023 Q2 | 2.8 | 0.0 |
| 2023 Q3 | 1.0 | 0.0 |
| 2023 Q4 | -4.1 | 0.0 |
| 2024 Q1 | -1.7 | 0.0 |
| 2024 Q2 | -0.7 | 0.0 |
| 2024 Q3 | -1.4 | 0.0 |
| 2024 Q4 | 0.6 | 0.0 |
| 2025 Q1 | 2.4 | 0.0 |
| 2025 Q2 | -2.3 | 0.0 |
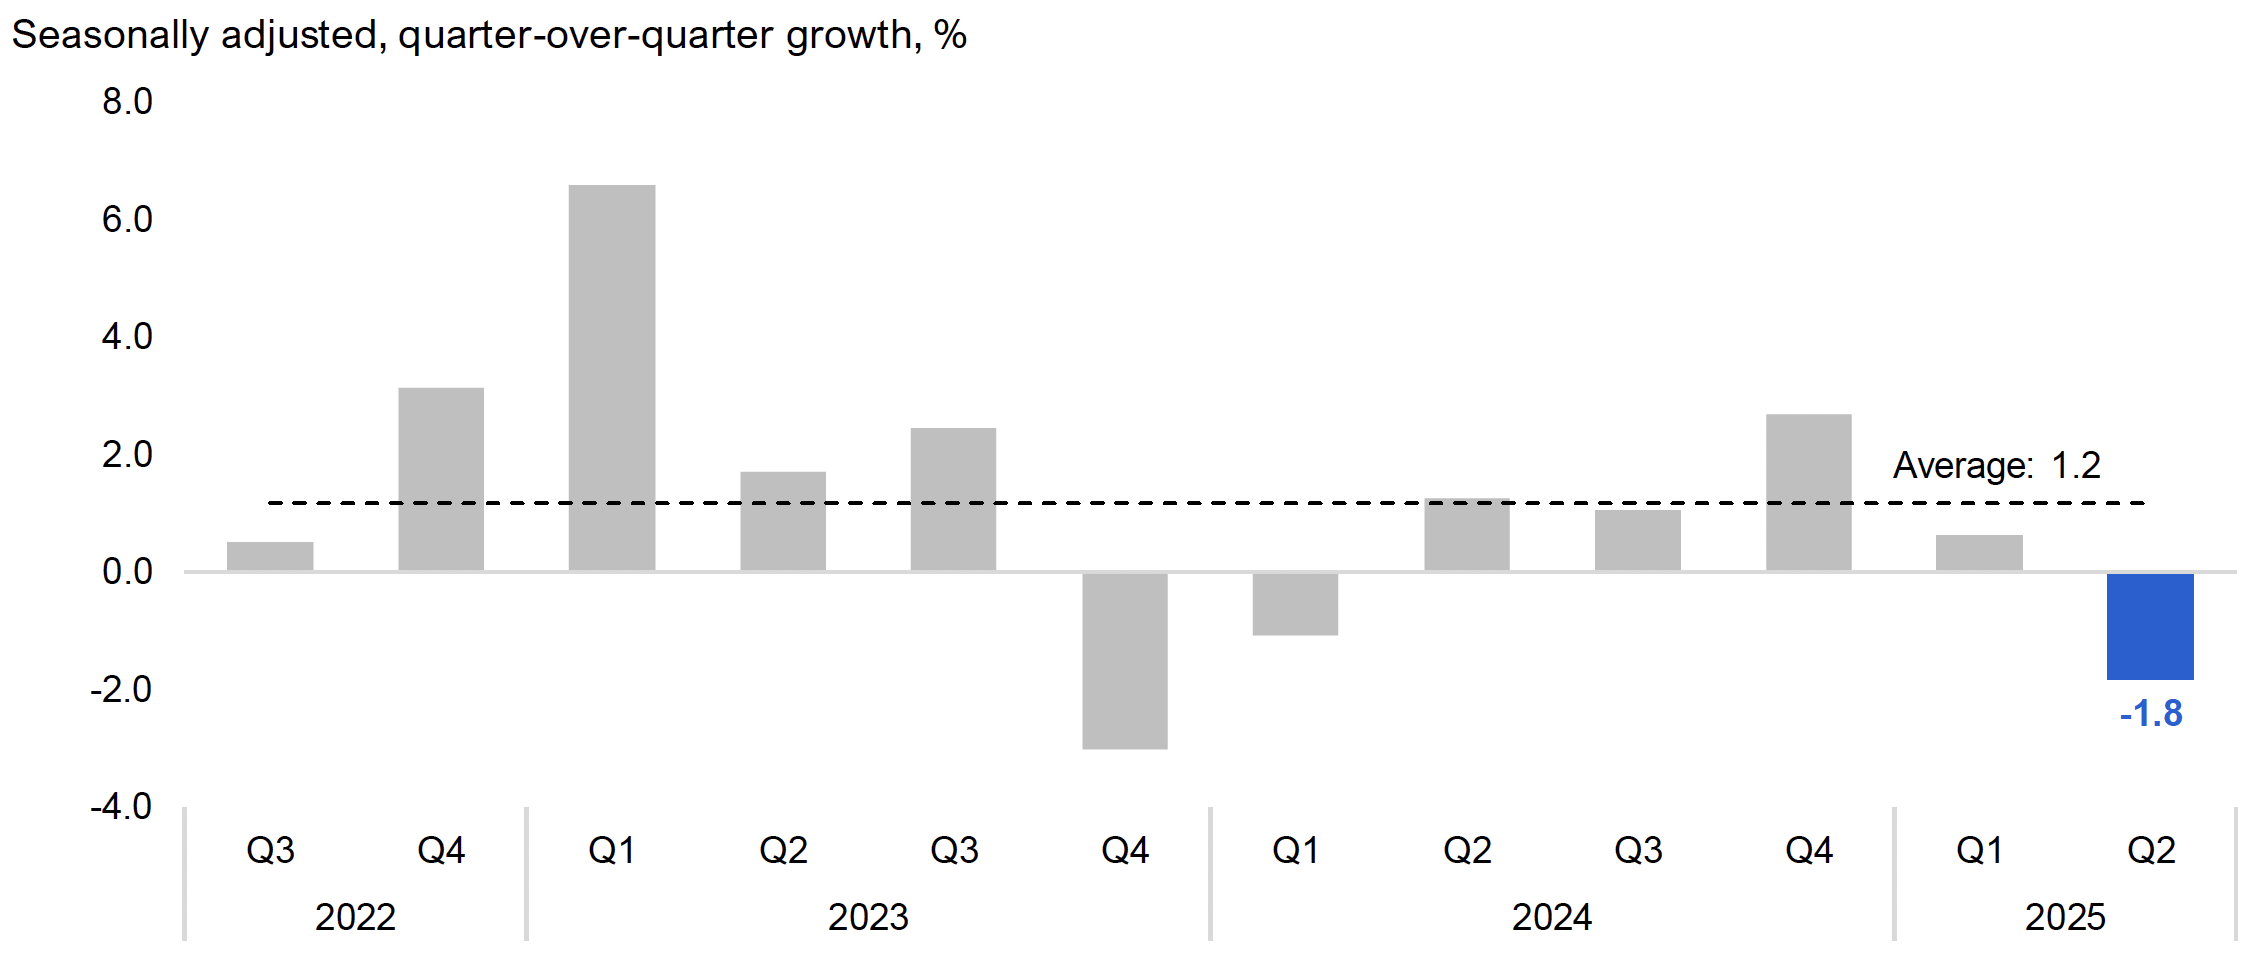
Wholesale trade,[18] which measures sales of bulk items, dropped by 1.8% in 2025 Q2, following four consecutive quarterly gains. The 2025 Q2 decrease was largely the result of lower sales of motor vehicles and parts, petroleum products, personal and household goods, machinery and equipment, building materials, and food, beverage and tobacco, which outweighed increases in the sales of farm products.
Figure 14 Wholesale trade dropped by 1.8% in 2025 Q2
Source: Statistics Canada Table 20-10-0074-01 and FAO.
Accessible version
| Seasonally adjusted, quarter-over-quarter growth, % | Average | |
|---|---|---|
| 2022 Q3 | 0.5 | 1.2 |
| 2022 Q4 | 3.1 | 1.2 |
| 2023 Q1 | 6.6 | 1.2 |
| 2023 Q2 | 1.7 | 1.2 |
| 2023 Q3 | 2.5 | 1.2 |
| 2023 Q4 | -3.0 | 1.2 |
| 2024 Q1 | -1.1 | 1.2 |
| 2024 Q2 | 1.3 | 1.2 |
| 2024 Q3 | 1.0 | 1.2 |
| 2024 Q4 | 2.7 | 1.2 |
| 2025 Q1 | 0.6 | 1.2 |
| 2025 Q2 | -1.8 | 1.2 |
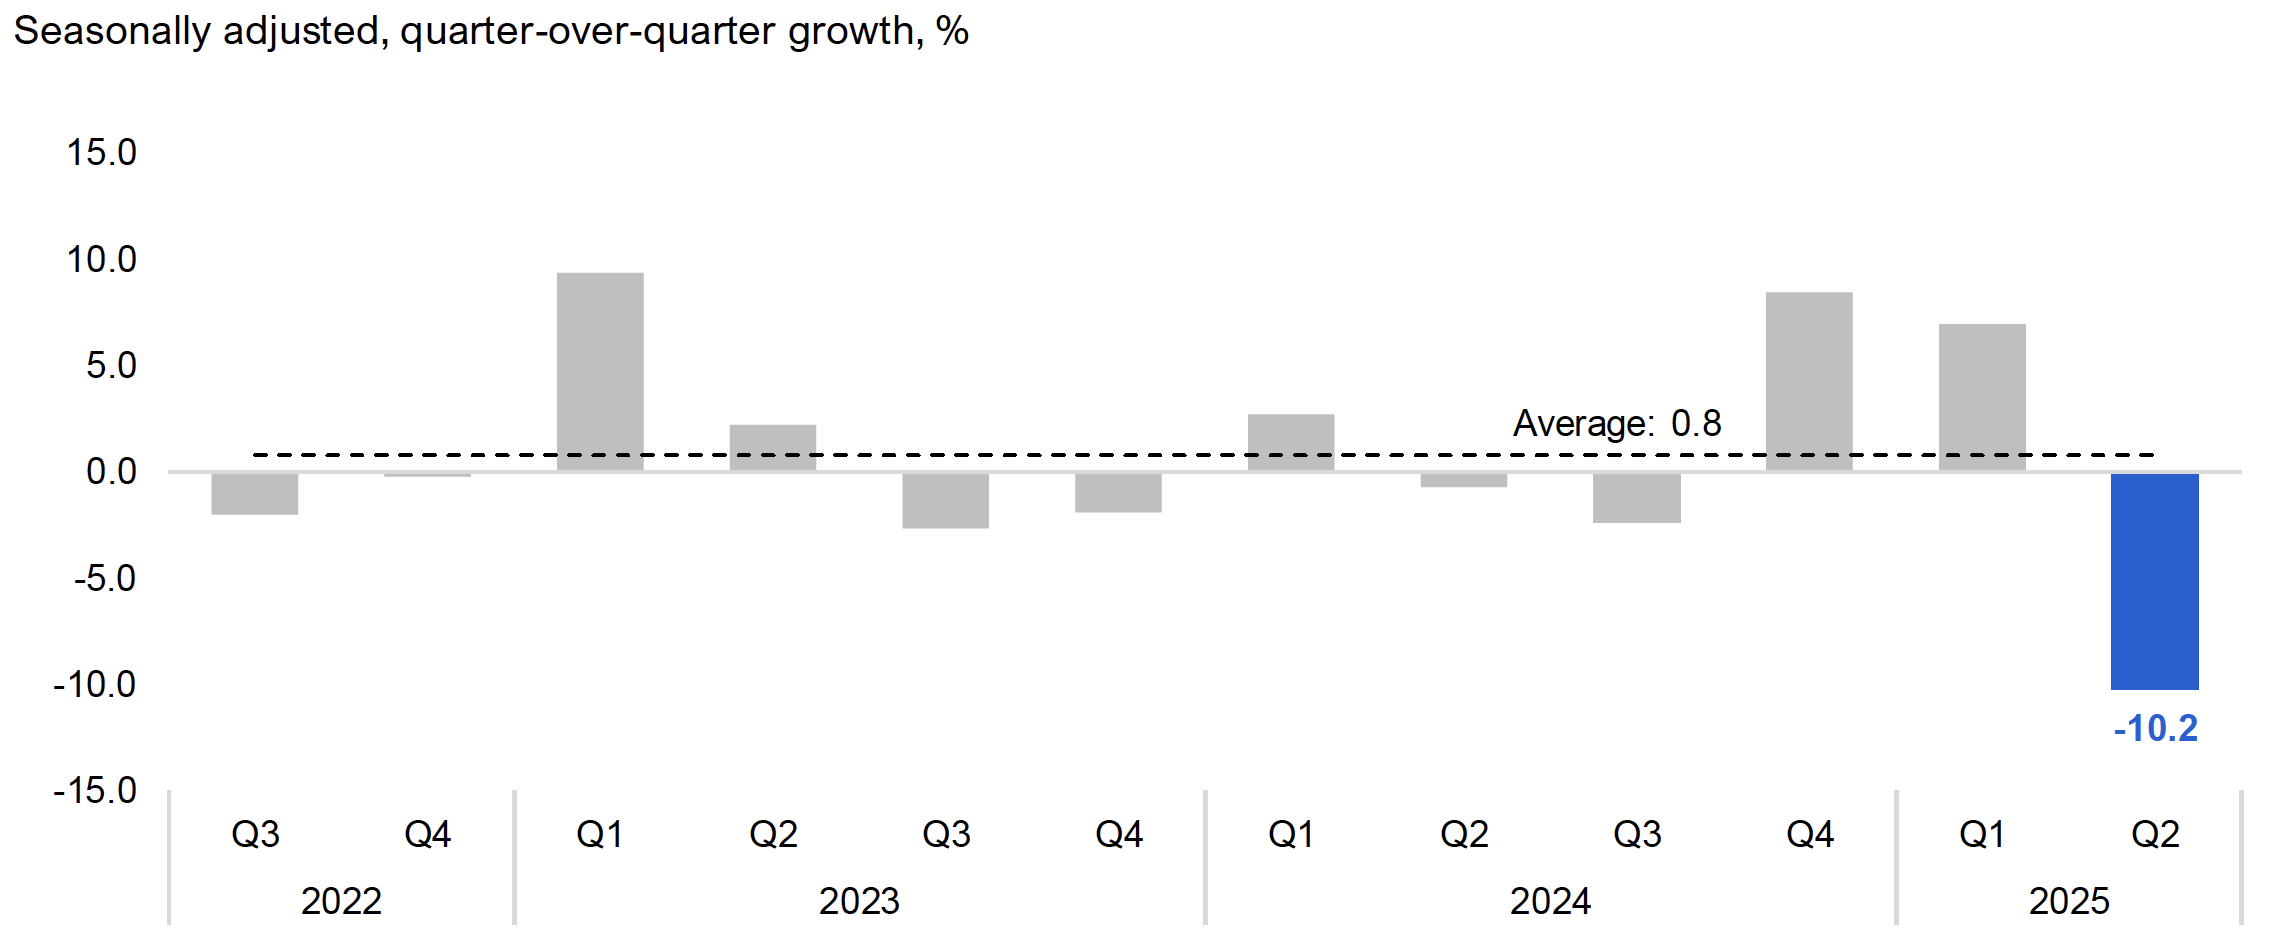
International merchandise exports, which account for all goods leaving the country through Ontario, dropped dramatically by 10.2% in 2025 Q2. The sharp drop reflected the impact of newly imposed US tariffs, as well as a pullback in trade activity that had accelerated ahead of the implementation of tariffs – international exports jumped 6.9% in 2025 Q1 and 8.4% in 2024 Q4. The decline in 2025 Q2 was broad-based, with lower exports across most categories, notably motor vehicles and parts, consumer goods, industrial machinery, and chemical products.
Figure 15 International merchandise exports dropped by 10.2% in 2025 Q2
Source: Statistics Canada Table 12-10-0175-01, Table 12-10-0163-01 and FAO estimate.
Accessible version
| Seasonally adjusted, quarter-over-quarter growth, % | Average | |
|---|---|---|
| 2022 Q3 | -2.0 | 0.8 |
| 2022 Q4 | -0.2 | 0.8 |
| 2023 Q1 | 9.4 | 0.8 |
| 2023 Q2 | 2.2 | 0.8 |
| 2023 Q3 | -2.7 | 0.8 |
| 2023 Q4 | -1.9 | 0.8 |
| 2024 Q1 | 2.7 | 0.8 |
| 2024 Q2 | -0.7 | 0.8 |
| 2024 Q3 | -2.4 | 0.8 |
| 2024 Q4 | 8.4 | 0.8 |
| 2025 Q1 | 6.9 | 0.8 |
| 2025 Q2 | -10.2 | 0.8 |
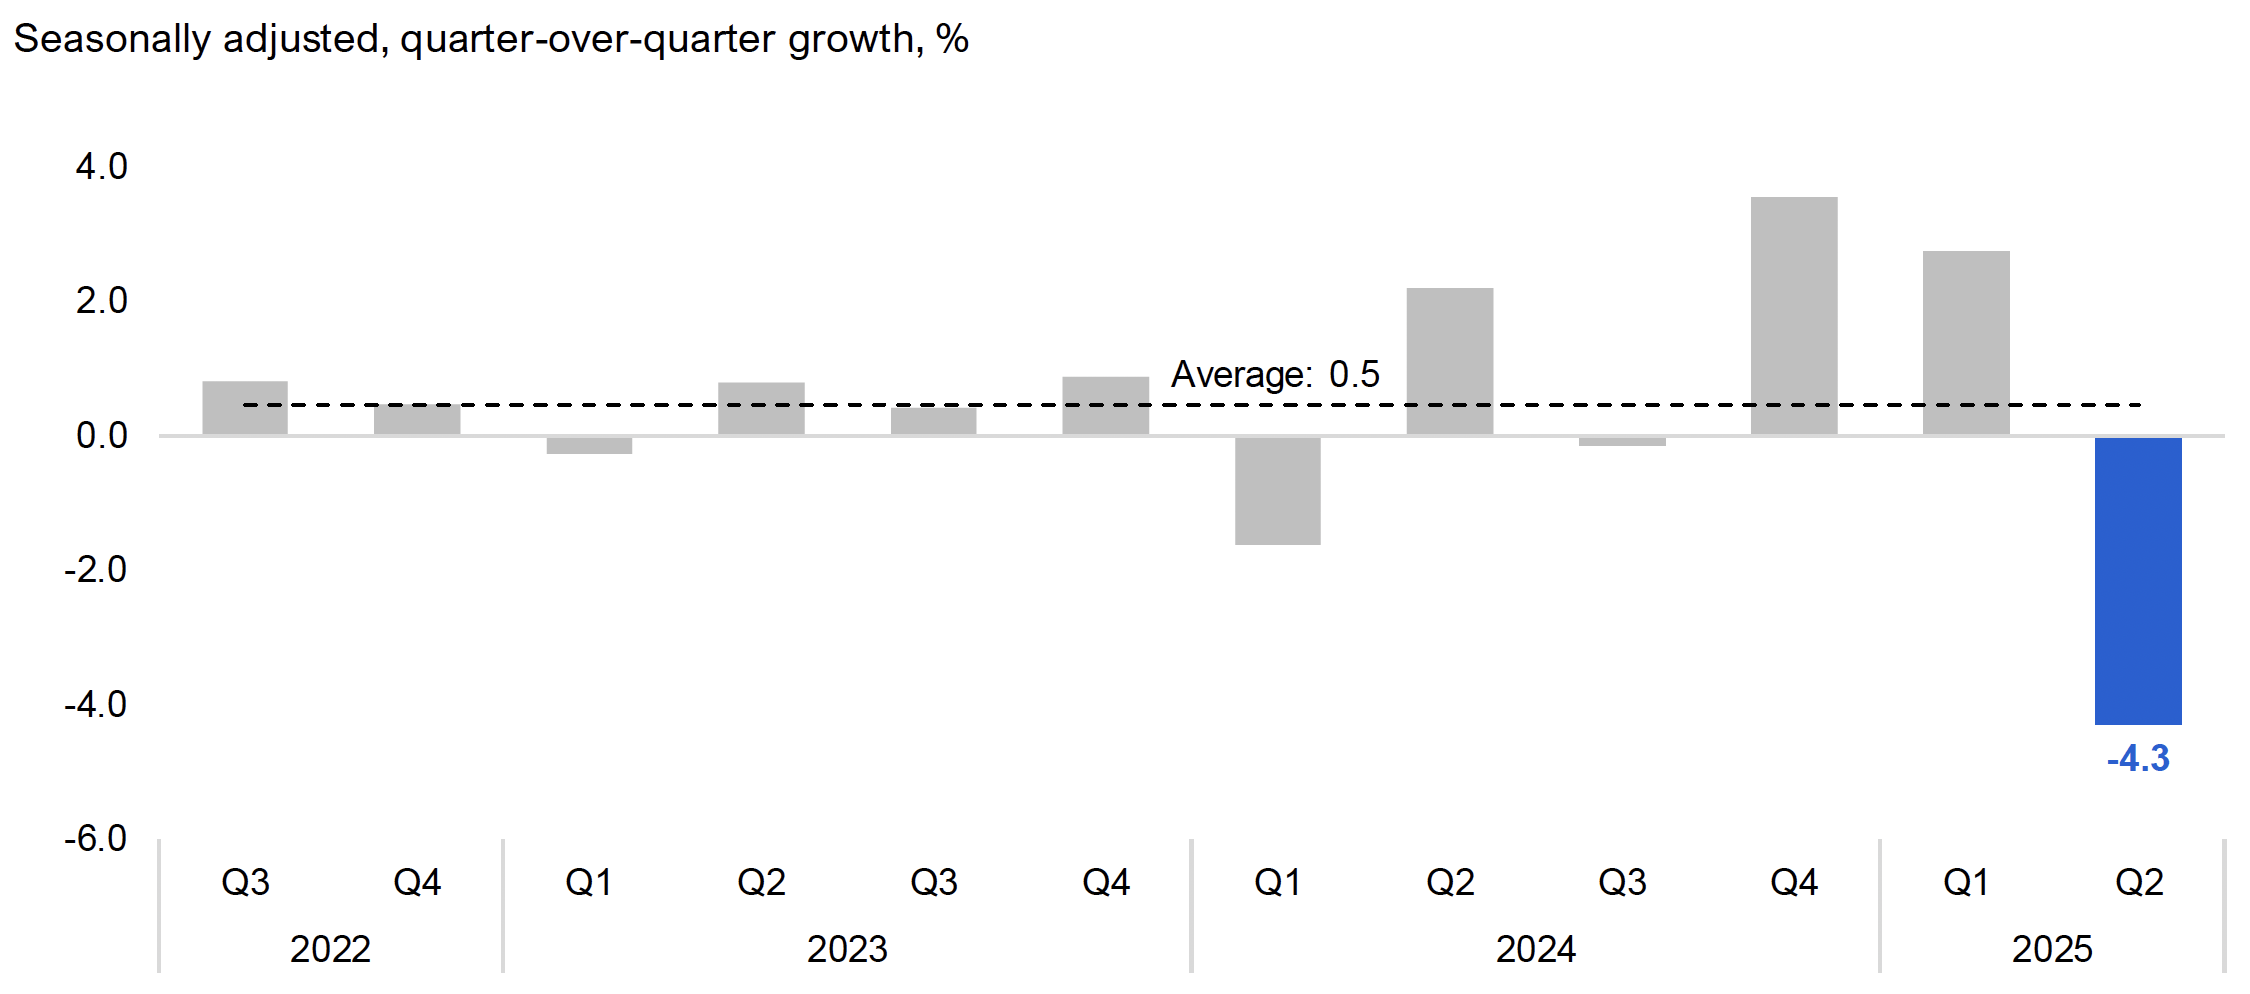
International merchandise imports, which measures international goods entering Ontario, decreased significantly by 4.3% in 2025 Q2, following two large consecutive quarterly increases. The decline reflected lower imports of motor vehicles and parts, consumer goods, industrial machinery, electronic and electrical equipment, and forestry products. The pullback in imports in 2025 Q2 reflected the impacts of Canadian tariffs on imports from the United States and the earlier sharp acceleration of purchases in anticipation of US tariffs.
Figure 16 International merchandise imports declined by 4.3% in 2025 Q2
Source: Statistics Canada Table 12-10-0175-01, Table 12-10-0163-01 and FAO estimate.
Accessible version
| Seasonally adjusted, quarter-over-quarter growth, % | Average | |
|---|---|---|
| 2022 Q3 | 0.8 | 0.5 |
| 2022 Q4 | 0.5 | 0.5 |
| 2023 Q1 | -0.3 | 0.5 |
| 2023 Q2 | 0.8 | 0.5 |
| 2023 Q3 | 0.4 | 0.5 |
| 2023 Q4 | 0.9 | 0.5 |
| 2024 Q1 | -1.6 | 0.5 |
| 2024 Q2 | 2.2 | 0.5 |
| 2024 Q3 | -0.1 | 0.5 |
| 2024 Q4 | 3.5 | 0.5 |
| 2025 Q1 | 2.7 | 0.5 |
| 2025 Q2 | -4.3 | 0.5 |
Implications of Recent Economic Trends
In an April 2025 report, the FAO analyzed the potential impacts of US and Canadian tariffs on Ontario’s economy, based on tariff policy as of April 17.[19] Under this scenario, the FAO estimates that Ontario’s real GDP growth could slow to 0.6% in 2025.
While Ontario’s economic indicators in 2025 Q2 were consistent with the FAO projection, real GDP growth in the first quarter was stronger than expected. Taken together, these results pose modest upside risks to the FAO’s outlook, while subsequent tariff changes are expected to have both positive and negative impacts. The FAO will continue to monitor Ontario’s economic performance and will update its forecast for economic growth in its next Economic and Budget Outlook report, expected in September 2025.
Figure 17 2025 Ontario real GDP growth projection under the FAO tariff scenario Real GDP, year-over-year growth, %
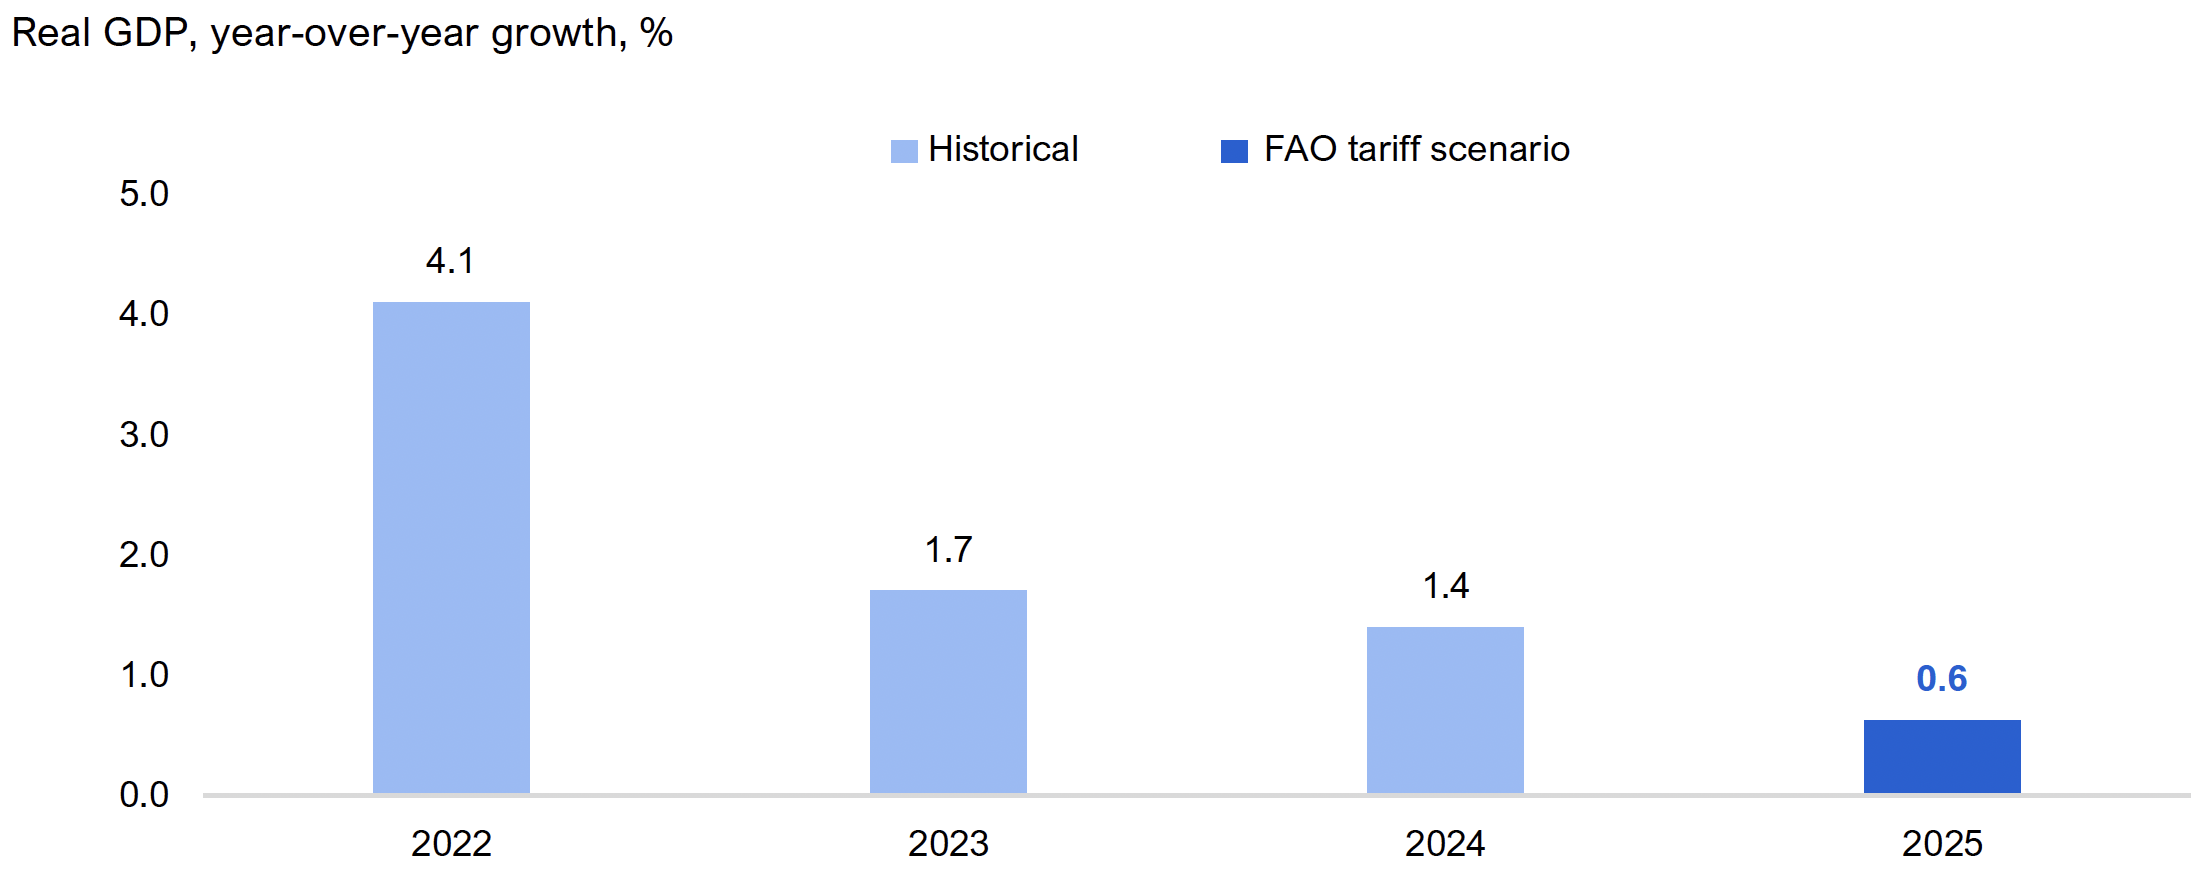
Note: The FAO tariff scenario estimates the potential impact of US and Canadian tariffs on Ontario’s economy, based on tariff policy as of April 17. See the FAO’s The Potential Impacts of US Tariffs on the Ontario Economy.
Source: Ontario Economic Accounts and FAO.
Accessible version
| Real GDP year-over-year growth, % | Historical | FAO tariff scenario |
|---|---|---|
| 2022 | 4.1 | |
| 2023 | 1.7 | |
| 2024 | 1.4 | |
| 2025 | 0.6 |
Appendix: Sector Classification of Industries in Figure 5
| Sector | Headline (NAICS codes)* | Industries |
|---|---|---|
| Goods sectors | Primary (11, 21, 22) | Agriculture; Forestry, fishing, mining, quarrying, oil and gas; Utilities |
| Construction (23) | Construction | |
| Manufacturing (31-33) | Manufacturing | |
| Services sectors | Trade and transport (41-49) | Wholesale and retail trade; Transportation and warehousing |
| Professional services (52-54) | Finance, insurance, real estate, rental and leasing; Professional, scientific and technical services | |
| Business, building and other support services (55, 56) | Management of companies and enterprises; Administrative and support, waste management and remediation services | |
| Information, culture and recreation (51, 71) | Information and cultural industries; Arts, entertainment and recreation | |
| Other services (61, 62, 72, 81, 91) | Educational services; Health care and social assistance; Accommodation and food services; Other services (except public administration); Public administration |
Glossary
Economic Indicators
Gross Domestic Product (GDP)
GDP is a broad indicator of economic activity that measures the value of goods and services produced by an economy. GDP is measured on both an expenditure and income basis.
Employment and unemployment rate
Employment from Statistics Canada’s Labour Force Survey estimates the number of individuals who did any work at a job or business (whether paid or unpaid) or those who had a job but were not at work due to factors unrelated to their job (e.g., their own illness or a labour dispute). The unemployment rate represents the number of people actively looking for work but not having a job as a proportion of the labour force. These two indicators are the most common measures of labour market performance.
Average hourly wages
Hourly wages are measured before taxes and other deductions, and include tips, commissions and bonuses for both hourly and salaried workers. This metric indicates wage inflation and labour market tightness.
Retail sales
Retail sales are the value of finished goods sold by retailers to the general public. This metric provides information on household spending by major commodity type.
Housing resales
Home resales data show the number of existing houses sold and is the most common measure of housing market activity.
Housing prices
The average price of existing houses sold. This metric is the most common measure of home prices that provides an indication of housing market strength.
Housing starts
Housing starts measures the number of housing units where construction has been started, including single and multiple unit dwellings. This metric provides a measure of change in the level of housing stock and can be compared to population growth to provide information on housing supply adequacy.
Manufacturing sales
The value of goods manufactured in Ontario that have been shipped to a customer.This metric is a measure of industrial production.
Wholesale trade
The value of merchandise sold in large quantities to retailers, businesses and institutional clients, such as governments. This metric provides insight into general business sector activity.
International merchandise exports and imports
The value of merchandise shipped out of the country from Ontario (exports) or into Ontario from outside the country (imports). International merchandise trade plays an important role in economic growth and provides information on the province’s competitiveness with other jurisdictions.
Technical Definitions
Real dollars
Values reflect prices after adjusting for inflation.
Seasonally adjusted
Data have been adjusted to reflect seasonal factors that may impact the data.
Non-seasonally adjusted
Data have not been adjusted to reflect seasonal factors.
Year-over-year (Y/Y)
Data from a particular time period are compared with data from the same time period a year ago. For example, Y/Y growth in 2023 Q4 would compare 2023 Q4 data with 2022 Q4 data. Using Y/Y data mostly removes the impact of seasonal factors.
Quarter-over-quarter (Q/Q)
Data compared from one quarter to the next. Q/Q growth in 2023 Q4 would compare 2023 Q4 data with 2023 Q3 data. Q/Q growth may suffer from seasonal factors unless data are seasonally adjusted.
Methodology
Data used in this report are primarily presented on a quarterly basis. For economic indicators that are adjusted for seasonality, growth is presented from one quarter to the next (Q/Q). For indicators that are not seasonally adjusted, growth is presented from the same quarter of the previous year (Y/Y) to avoid the impact of seasonal factors on economic trends. Indicators are presented in current dollars unless otherwise specified.
For some economic data, including retail sales, manufacturing sales and wholesale trade, the final month of the quarter may not yet be available at the time of the report’s publication. In these cases, Statistics Canada’s national preliminary estimate is used to estimate Ontario’s growth in that month.
Footnotes
[1] See the FAO’s The Potential Impacts of US Tariffs on the Ontario Economy.
[2] The Fiscal Sustainability, Transparency and Accountability Act, 2019 states that the quarterly Ontario Economic Accounts should be released within 45 days of the Statistics Canada release of the National Income and Expenditure Accounts.
[3] Some of these data are regularly revised, and the growth rates presented in this report may differ from updated data published at a later date.
[4] See the FAO’s The Potential Impacts of US Tariffs on the Ontario Economy.
[5] A 2.9% increase in international exports outweighed a 0.5% decline in interprovincial exports.
[6] See Bank of Canada’s Canadian Survey of Consumer Expectations—First Quarter of 2025.
[7] Recessions and weak periods of economic growth include 1982, 1990-1993, 2008-2009, and 2020-2021.
[8] Source: Statistics Canada Table 14-10-0288-01 and FAO.
[9] Source: Statistics Canada Table 14-10-0355-01 and FAO.
[10] As June data were not available at the time of publication, Statistics Canada’s Canadian advance retail indicator was used to calculate the 2025 Q2 Ontario value. See Statistics Canada’s Retail trade, May 2025.
[11] See Bank of Canada’s Canadian Survey of Consumer Expectations—Second Quarter of 2025.
[12] Measured on a year-over-year basis.
[13] At the Canada level, the all-items CPI inflation rate declined from 2.3% in 2025 Q1 to 1.8% in 2025 Q2, reflecting the removal of the consumer carbon tax. Excluding the impact of indirect taxes, inflation in Canada was 2.4% in 2025 Q2, largely unchanged from the 2.5% rate recorded in 2025 Q1.
[14] Canada Mortgage and Housing Corporation (CMHC) defines a housing unit as being a “structurally separate set of self-contained living premises [with] … a private entrance from outside the building or from a common hall, lobby or stairway inside the building. The entrance must be one that can be used without passing through another separate […] unit”. See CMHC’s Starts and Completions Survey and Market Absorption Survey Methodology.
[15] In 2024, the construction of single detached homes was at the lowest level on record back to 1955. The share of single detached housing starts has been declining since late 1990s, reflecting affordability challenges, changes in household preferences and planning efforts aimed at increasing density.
[16] See 2025 Q2 Housing Market Index, Canadian Home Builders’ Association.
[17] As June data were not available at the time of publication, Statistics Canada’s Canadian flash estimate was used to calculate the 2025 Q2 Ontario value. See Statistics Canada’s Monthly Survey of Manufacturing: Advance indicator, June 2025.
[18] As June data were not available at the time of publication, Statistics Canada’s Canadian early indicator was used to calculate the 2025 Q2 Ontario value. See Statistics Canada’s Wholesale trade: Early indicator, June 2025.
[19] See the FAO’s The Potential Impacts of US Tariffs on the Ontario Economy.