


Summary
- This report describes Ontario’s recent economic performance based on the latest economic indicators.
- In the third quarter of 2025, Ontario’s real Gross Domestic Product (GDP), the broadest measure of economic activity, increased by 0.5%, rebounding from a 0.7% decline in 2025 Q2 when the imposition of US tariffs began to impact Ontario’s economy. The rise in real GDP in 2025 Q3 reflected an improvement in the province’s net trade and a gain in residential investment as housing market activity increased.
- The latest economic indicators suggest Ontario’s economy was little changed in the fourth quarter of 2025, with gains in employment and net trade met with declines in retail sales, manufacturing sales, wholesale trade and the housing market.
- The FAO’s latest Economic and Budget Outlook[1] report projected that Ontario’s annual real GDP growth would slow from 1.6% in 2024 to 1.3% in 2025. Economic activity in the fourth quarter of 2025 is largely consistent with this projection. The FAO will continue to monitor Ontario’s economic performance and will update its forecast for economic growth in its next Economic and Budget Outlook report.
Introduction and Background
The Ontario Economic Monitor presents an overview of the latest trends in the Ontario economy based on the most recent economic data as of February 20, 2026.
Each quarter, the Government of Ontario (the Province) releases the Ontario Economic Accounts (OEA), which provides data on GDP, a comprehensive measure of economic activity in Ontario. The OEA is produced by the Ontario Ministry of Finance and released approximately four months after the quarter closes.[2] The OEA is available on the Province’s Ontario Economic Accounts website.
In addition, Statistics Canada and other organizations produce many monthly economic indicators that provide insight into Ontario’s economy. These form part of the underlying data used to produce the OEA. This report focusses on these indicators, which are typically released one to two months after the data are collected, and provides more up-to-date information on Ontario’s economic performance in the most recent quarter.[3]
The report contains the following sections:
- a summary of the OEA describing the province’s economic performance in the third quarter of 2025 (2025 Q3);
- a summary of the most recent monthly economic indicators for Ontario’s households and businesses in 2025 Q4; and
- an assessment of the FAO’s latest economic outlook based on recent economic trends.
For definitions of the various economic indicators covered in this report, as well as technical definitions of economic concepts, see the report’s Glossary. For information on the data used, see the report’s Methodology.
2025 Third Quarter Ontario Economic Accounts
The Ontario Economic Accounts (OEA) for the third quarter (July to September) of 2025 was released on January 12, 2026. The OEA provides a comprehensive assessment of Ontario’s recent economic performance.
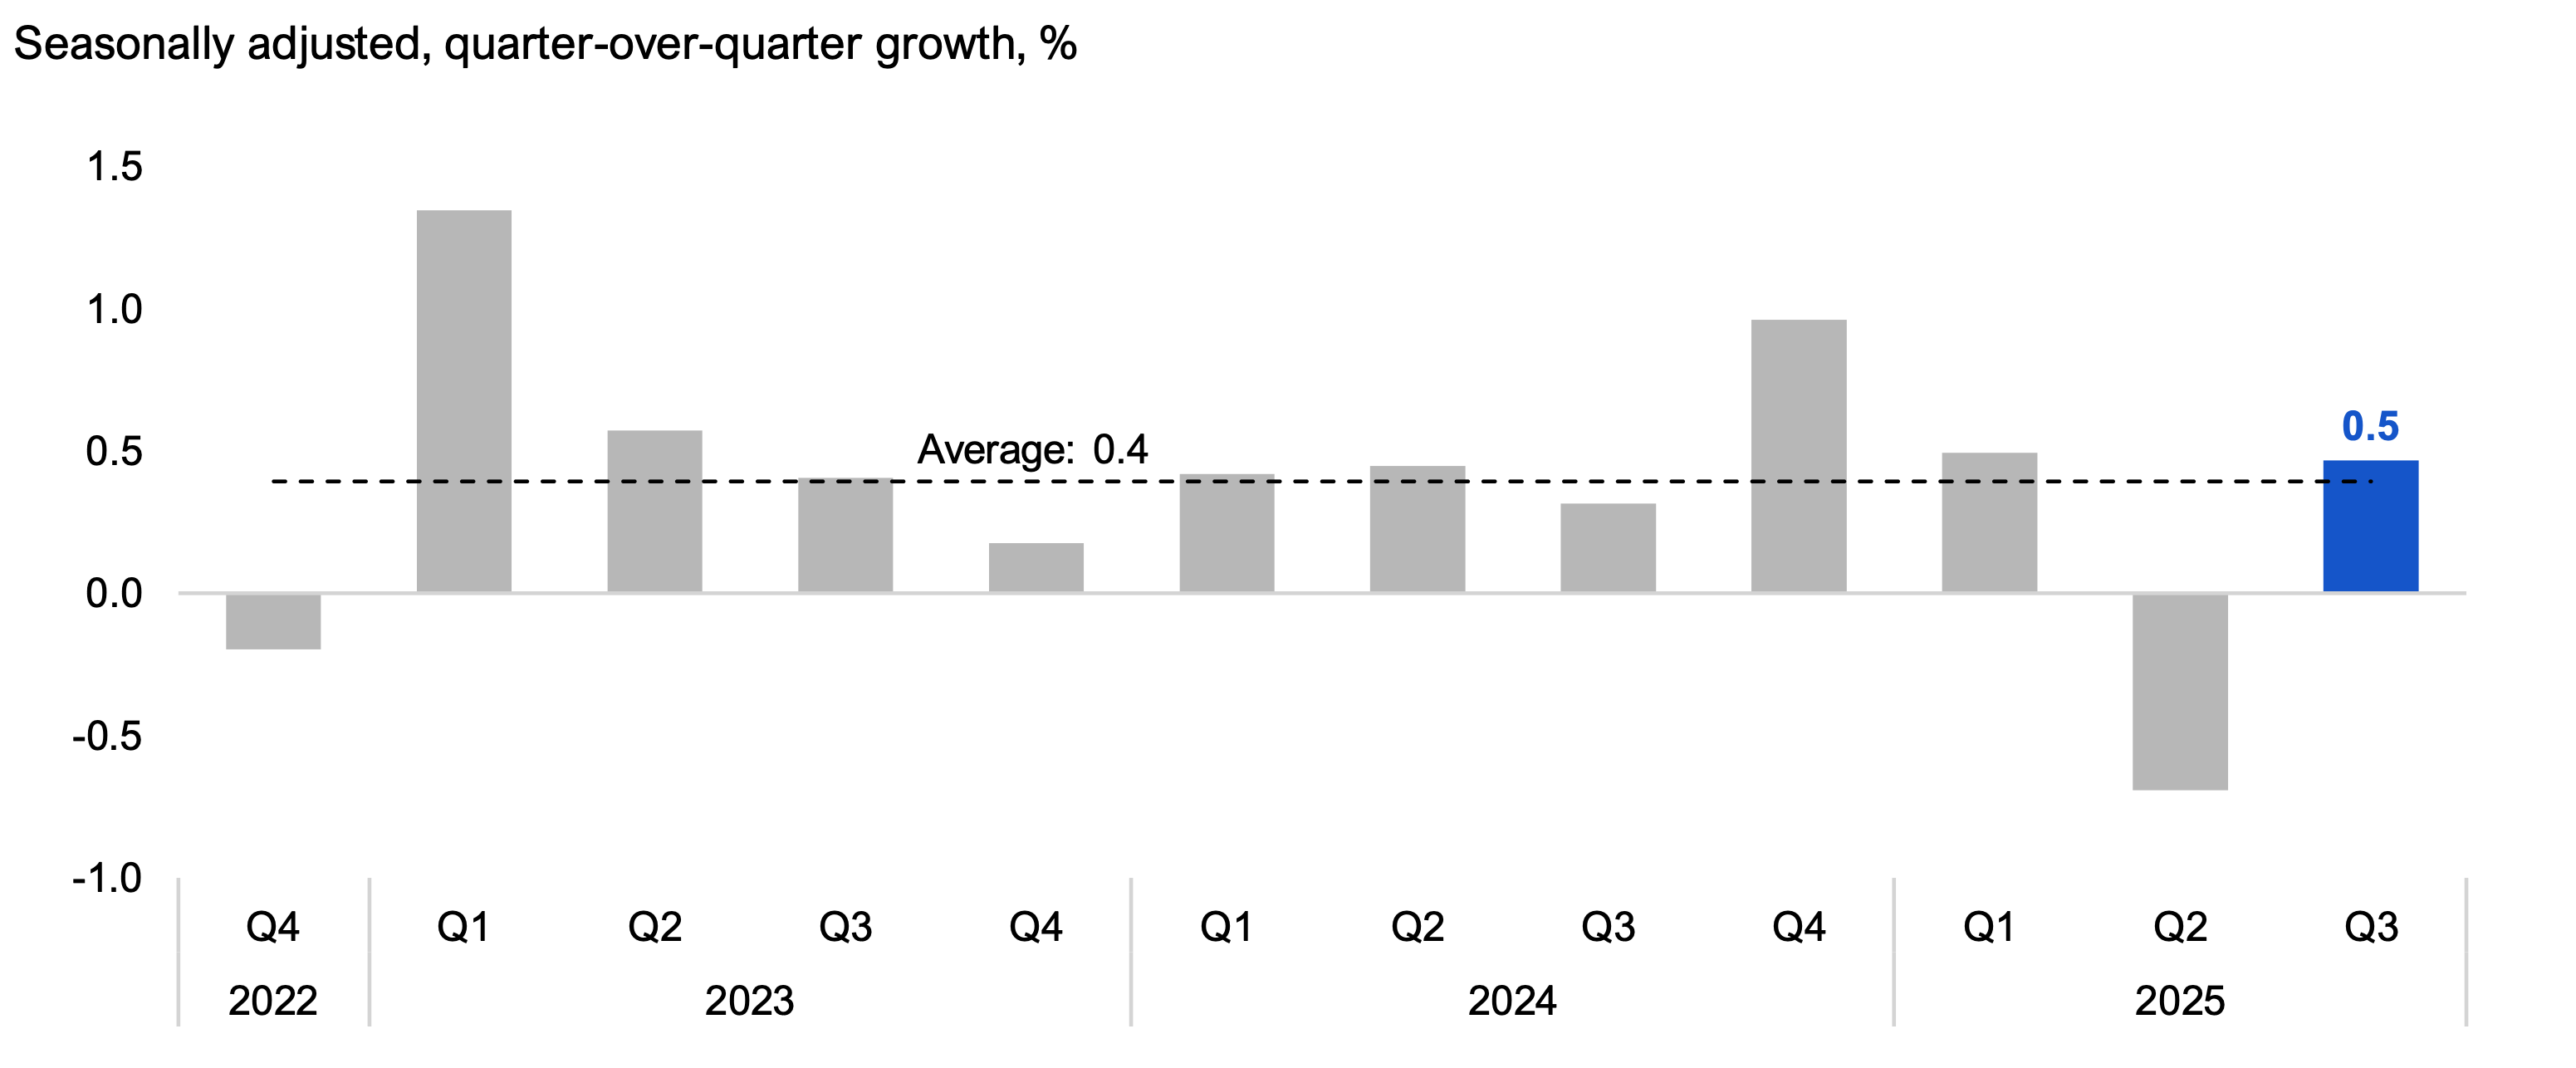
Real Gross Domestic Product (GDP), the broadest measure of economic activity, increased by 0.5% in 2025 Q3, rebounding after a 0.7% decline in the previous quarter when the imposition of US tariffs began to impact the Ontario economy. The rebound in overall economic activity largely resulted from an improvement in the province’s net trade,[4] while residential investment also increased as housing market activity grew.
Despite the increase in overall economic activity, household consumption declined by 0.1% in 2025 Q3, after a 0.7% gain in the previous quarter. Consumers continue to be concerned about the impact of US tariffs on the economy, the weak state of the job market, the high price of goods and services, and elevated housing costs.[5]
Business investment also weakened in the third quarter with a substantial decline in machinery and equipment investment (-4.4%), while non-residential investment remained essentially flat (0.1%) as businesses continue to scale back or hold off on new investments owing to weak demand and trade-related uncertainty.[6] A reduction in the pace of inventory building also slowed overall economic growth in 2025 Q3.
Figure 1 Real GDP increased by 0.5% in 2025 Q3
Source: Ontario Economic Accounts and FAO.
Accessible version
| Seasonally adjusted, quarter-over-quarter growth, % | Average | |
|---|---|---|
| 2022 Q4 | -0.2 | 0.4 |
| 2023 Q1 | 1.3 | 0.4 |
| 2023 Q2 | 0.6 | 0.4 |
| 2023 Q3 | 0.4 | 0.4 |
| 2023 Q4 | 0.2 | 0.4 |
| 2024 Q1 | 0.4 | 0.4 |
| 2024 Q2 | 0.4 | 0.4 |
| 2024 Q3 | 0.3 | 0.4 |
| 2024 Q4 | 1.0 | 0.4 |
| 2025 Q1 | 0.5 | 0.4 |
| 2025 Q2 | -0.7 | 0.4 |
| 2025 Q3 | 0.5 | 0.4 |
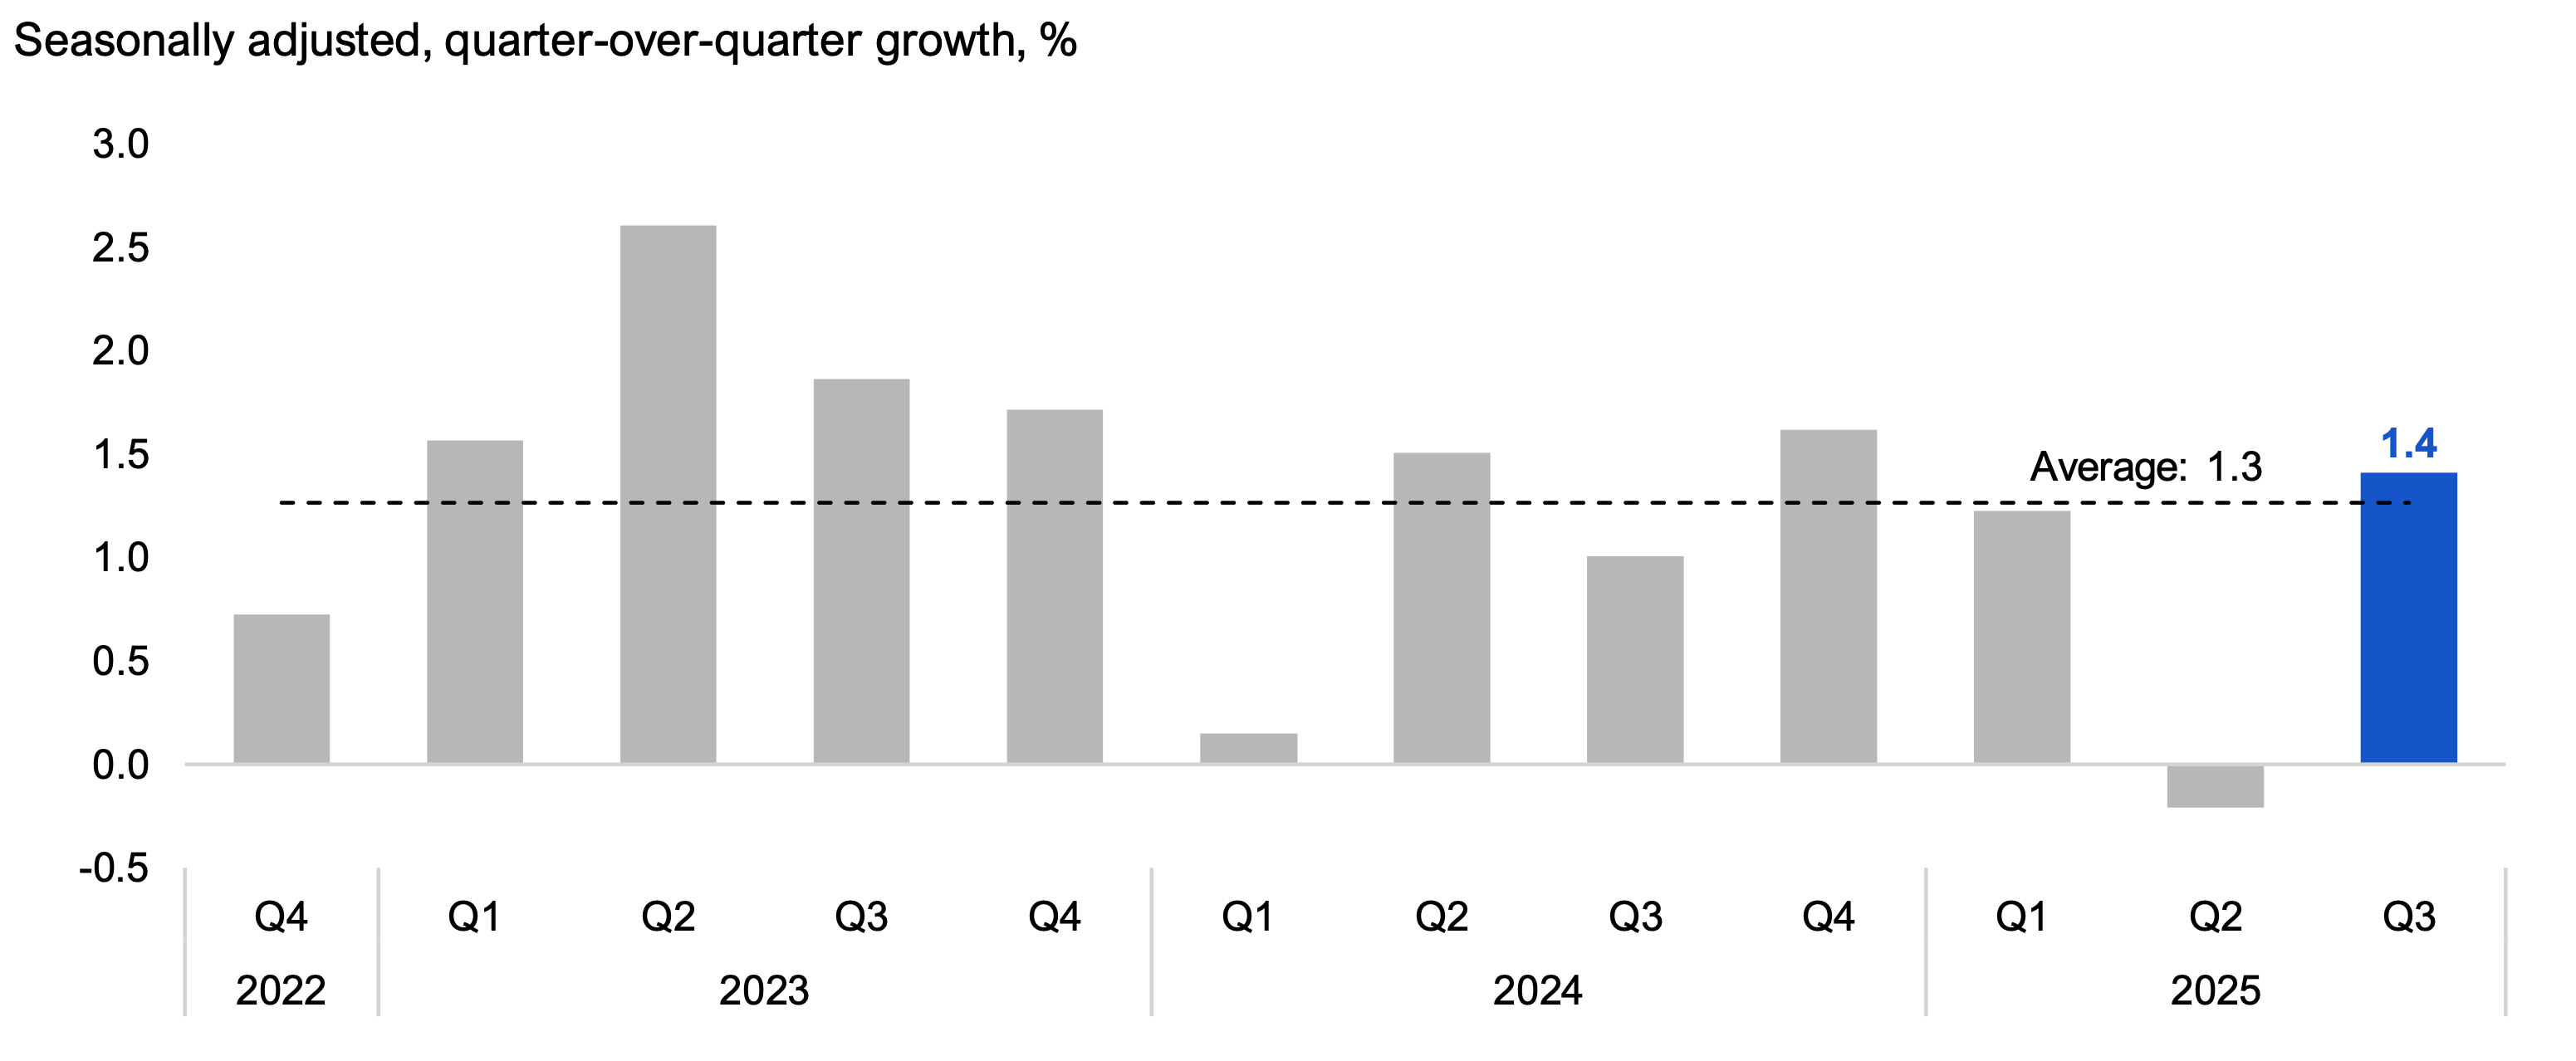
Nominal GDP, the broadest measure of the tax base and which includes inflation, increased by 1.4% in 2025 Q3, after declining 0.2% in the previous quarter, as US tariffs began to impact the Ontario economy. The growth in nominal GDP reflected gains in labour income (1.3%), corporate profits (4.0%) and unincorporated business income (2.5%).
Figure 2 Nominal GDP increased by 1.4% in 2025 Q3
Source: Ontario Economic Accounts and FAO.
Accessible version
| Seasonally adjusted, quarter-over-quarter growth, % | Average | |
|---|---|---|
| 2022 Q4 | 0.7 | 1.3 |
| 2023 Q1 | 1.6 | 1.3 |
| 2023 Q2 | 2.6 | 1.3 |
| 2023 Q3 | 1.9 | 1.3 |
| 2023 Q4 | 1.7 | 1.3 |
| 2024 Q1 | 0.2 | 1.3 |
| 2024 Q2 | 1.5 | 1.3 |
| 2024 Q3 | 1.0 | 1.3 |
| 2024 Q4 | 1.6 | 1.3 |
| 2025 Q1 | 1.2 | 1.3 |
| 2025 Q2 | -0.2 | 1.3 |
| 2025 Q3 | 1.4 | 1.3 |
For more detailed information on Ontario’s economic performance in 2025 Q3, see the Ontario Economic Accounts.
Ontario’s 2025 Fourth Quarter Economic Indicators
The latest economic indicators suggest Ontario’s economy was little changed in the fourth quarter of 2025, with gains in employment and net trade met with declines in retail sales, manufacturing sales, wholesale trade and the housing market.
Households
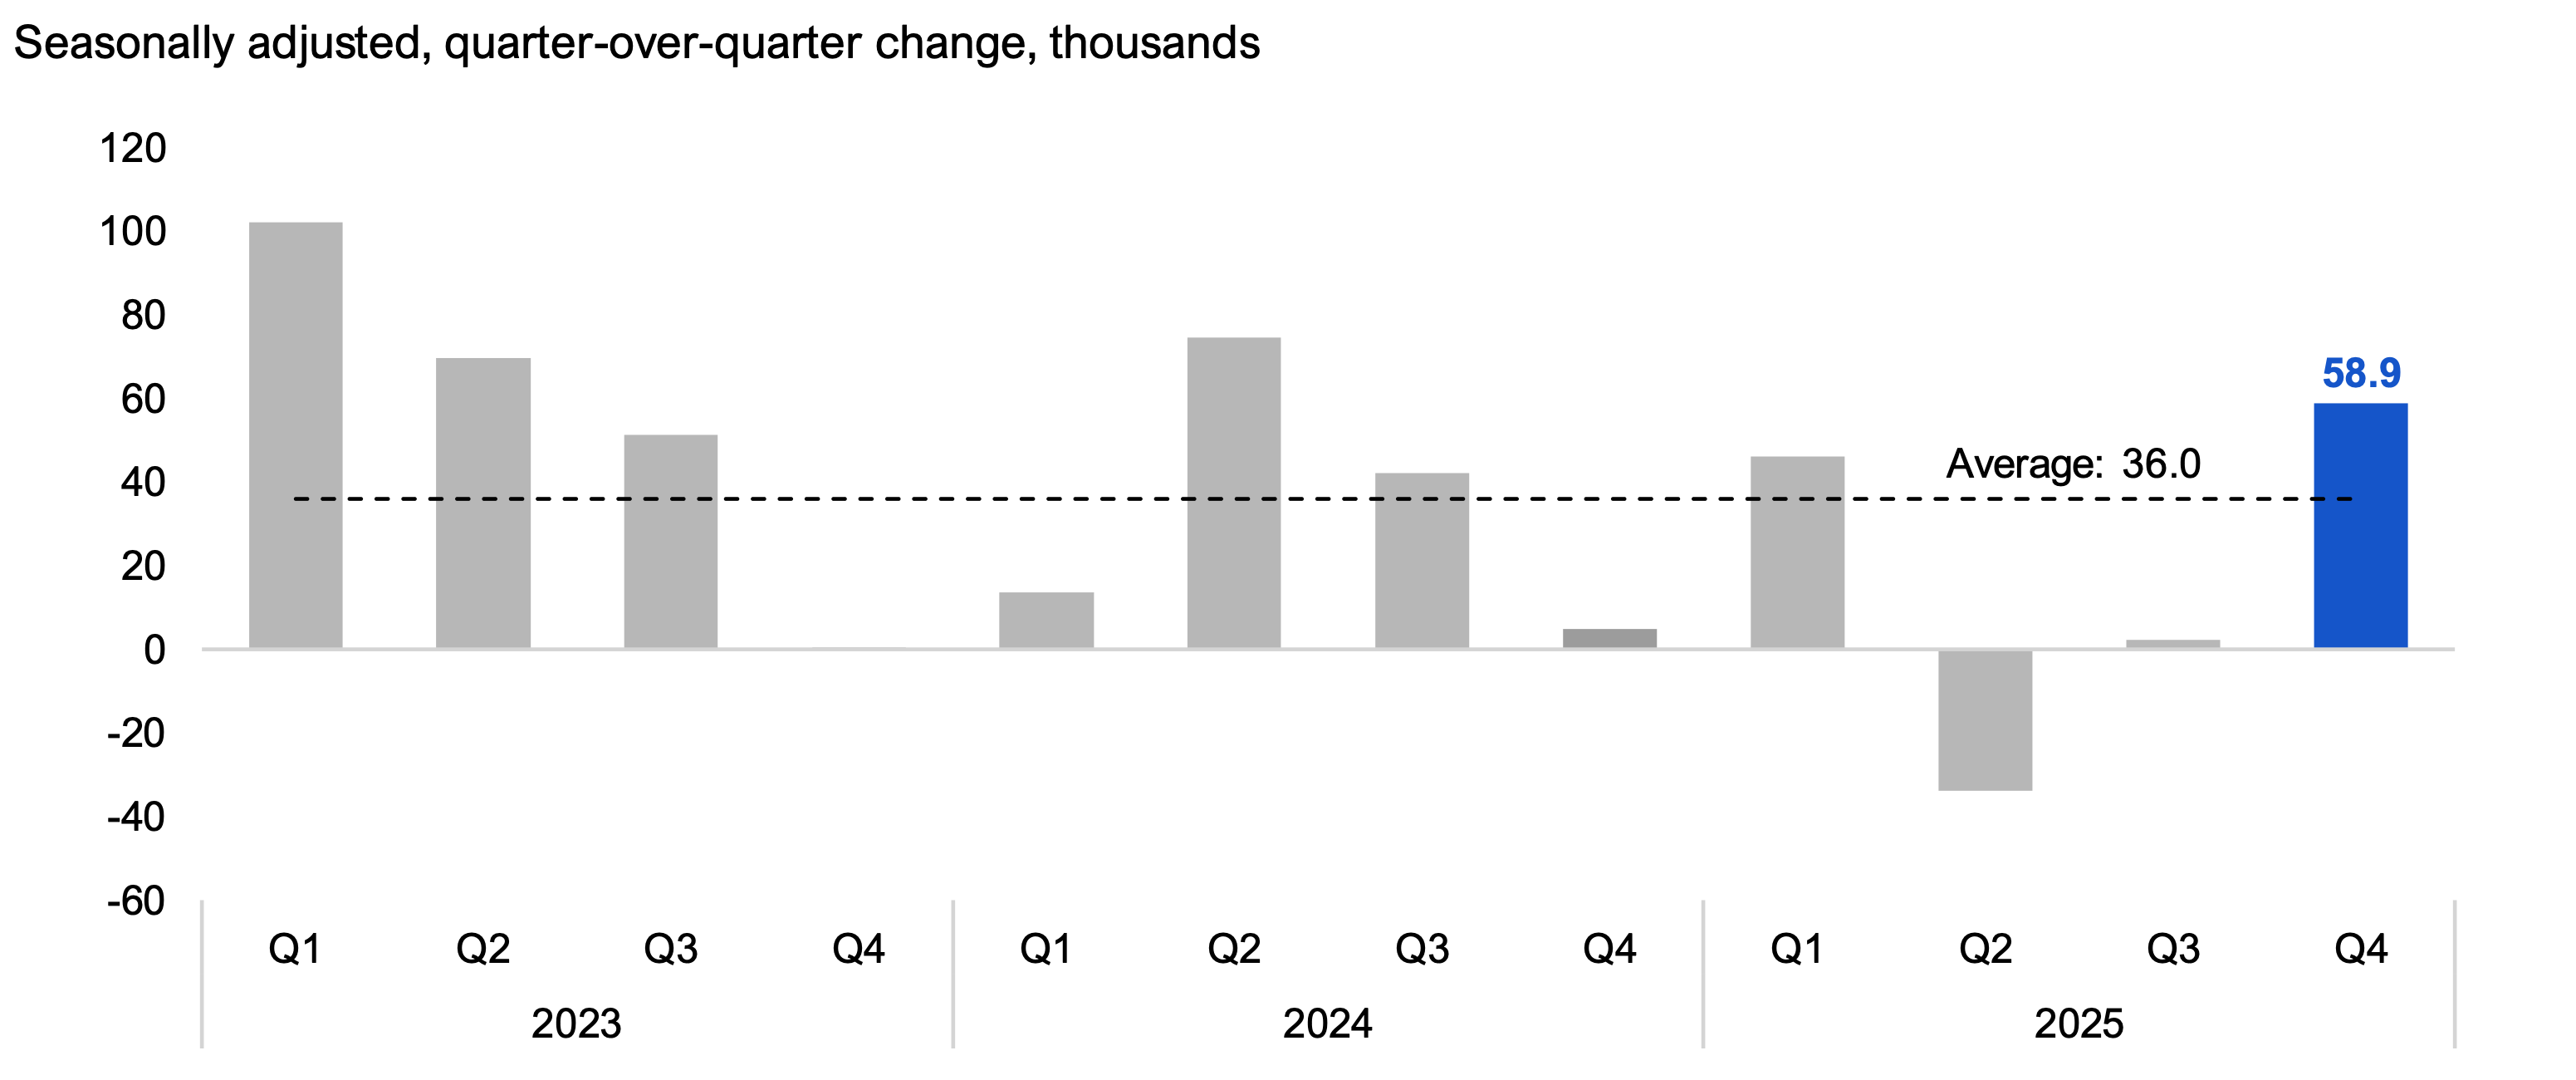
Employment in Ontario increased by a strong 58,900 (or 0.7%) in 2025 Q4, an improvement after weak job performance in the previous two quarters. In the fourth quarter, employment increased in both full-time (37,200) and part-time (21,700) positions. Job gains were concentrated in the private sector (80,900), with losses in both the public sector (-12,300) and in self-employment (-9,800).[7]
Figure 3 Employment increased by 58,900 jobs in 2025 Q4
Source: Statistics Canada Table 14-10-0287-01 and FAO.
Accessible version
| Seasonally adjusted, quarter-over-quarter change, thousands | Average | |
|---|---|---|
| 2023 Q1 | 102.1 | 36.0 |
| 2023 Q2 | 69.7 | 36.0 |
| 2023 Q3 | 51.3 | 36.0 |
| 2023 Q4 | 0.1 | 36.0 |
| 2024 Q1 | 13.5 | 36.0 |
| 2024 Q2 | 74.6 | 36.0 |
| 2024 Q3 | 42.2 | 36.0 |
| 2024 Q4 | 4.9 | 36.0 |
| 2025 Q1 | 46.1 | 36.0 |
| 2025 Q2 | -33.8 | 36.0 |
| 2025 Q3 | 2.3 | 36.0 |
| 2025 Q4 | 58.9 | 36.0 |
All major age groups saw job increases in 2025 Q4, with youth employment (aged 15 to 24) increasing 18,400 and core-age employment (aged 25 to 54) increasing 23,600. Employment of workers aged 55 and older rose 16,800.
Ontario saw job growth across most major industries in 2025 Q4, with the largest gains recorded in information and culture (27,300), transportation and warehousing (21,500), manufacturing (10,300), healthcare (7,000) and professional, scientific and technical services (6,100).[8] Industries with job losses included education (‑15,200), finance, insurance and real estate (-7,600), construction (-5,900) and wholesale and retail trade (‑2,600).
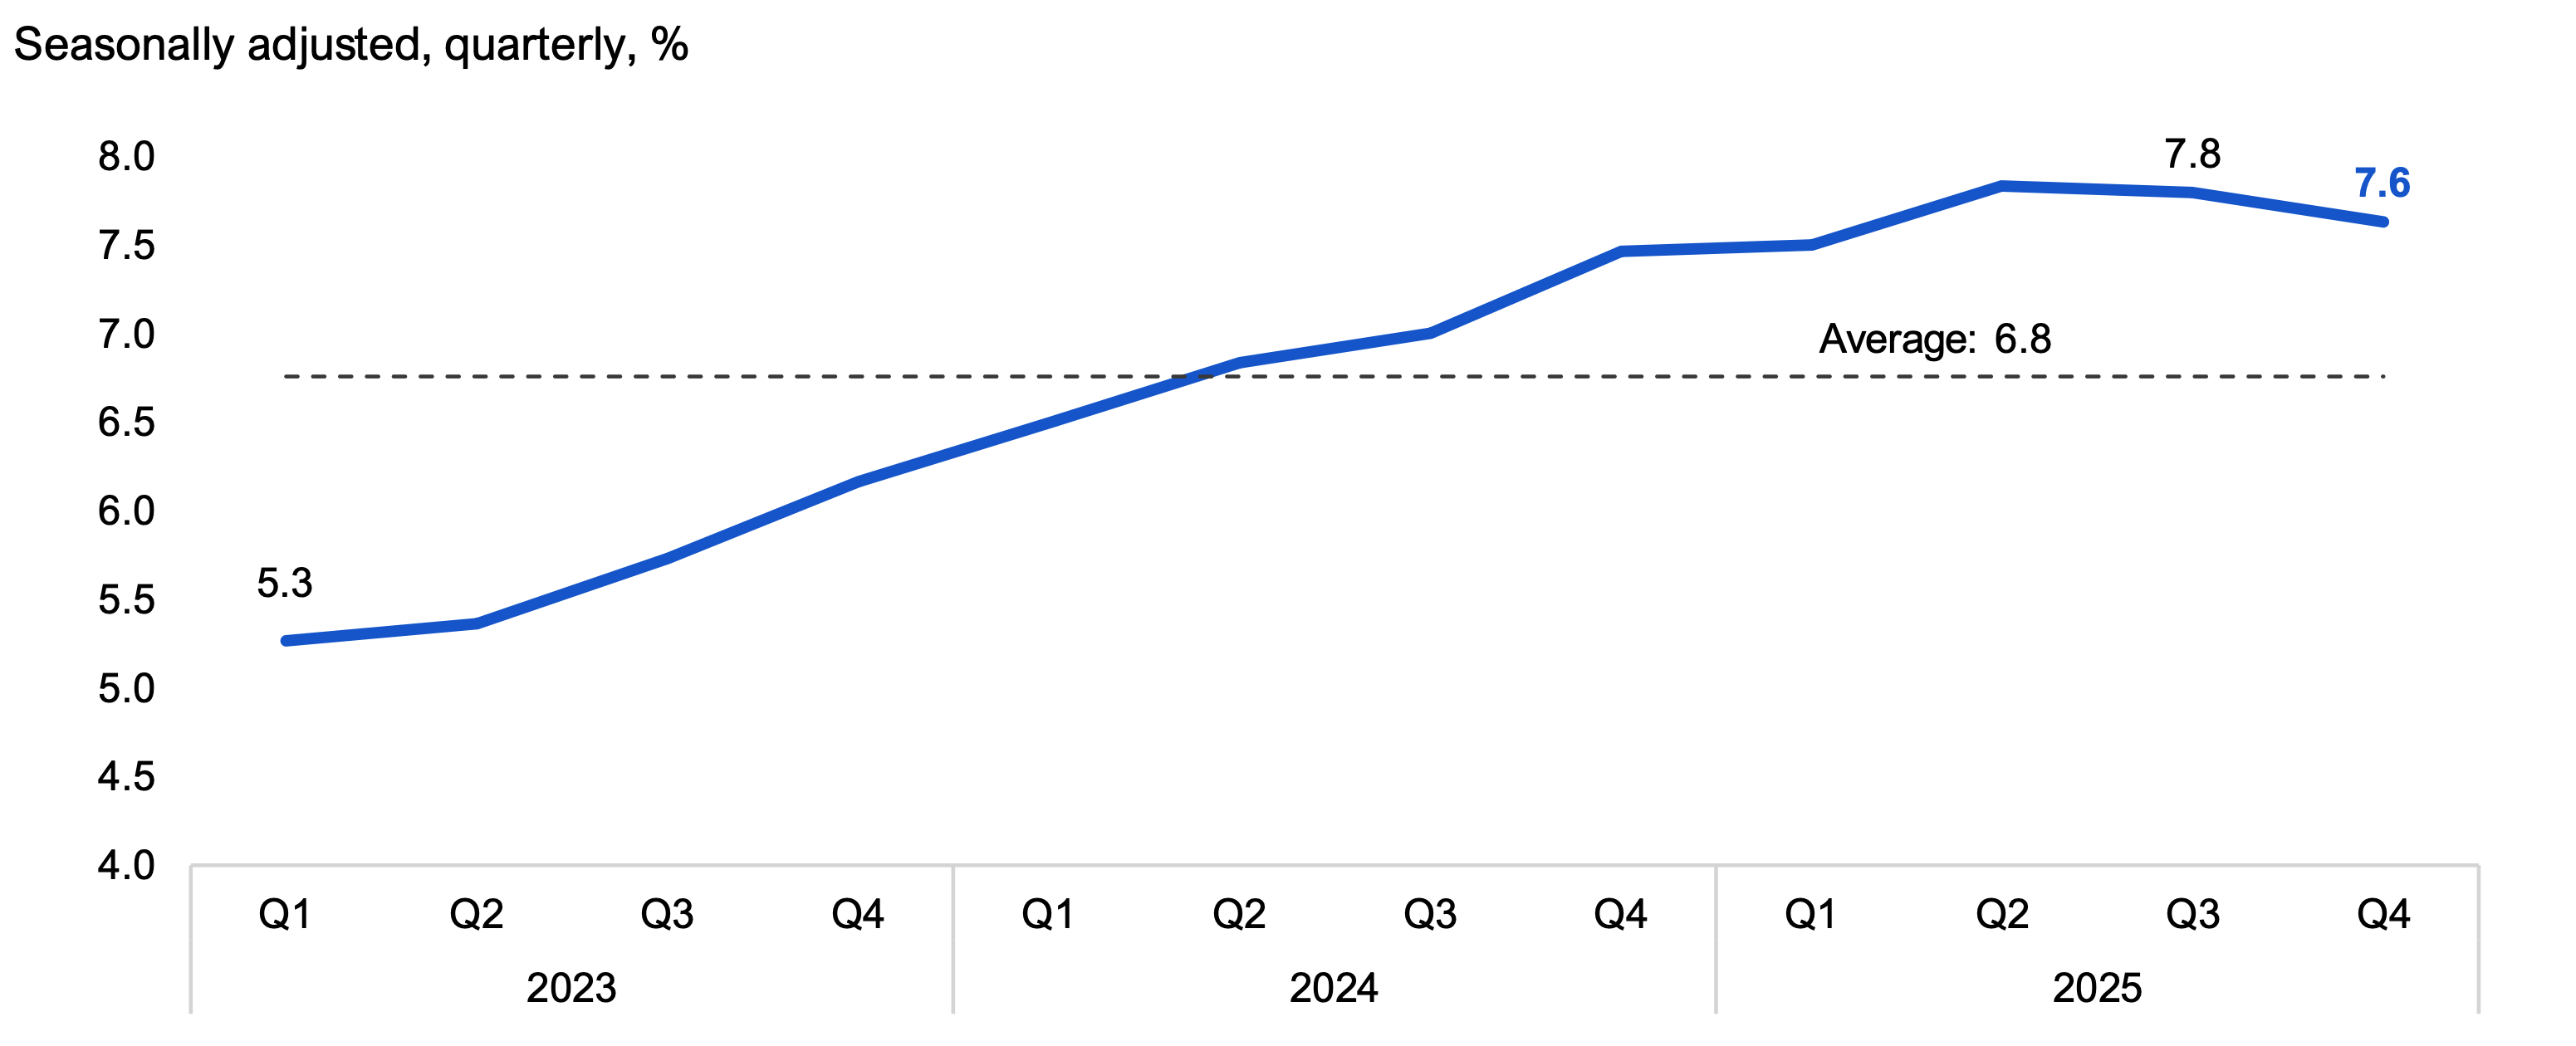
Ontario’s unemployment rate edged down 0.2 percentage points to 7.6% in 2025 Q4, the first quarterly drop in almost three years. The youth (aged 15 to 24) unemployment rate declined 1.0 percentage point in 2025 Q4 to 15.6%, while the unemployment rate was unchanged for both core-age (aged 25 to 54) workers (6.7%) and workers aged 55 year and over (5.3%).
Despite the decline in 2025 Q4, Ontario’s unemployment rate remains elevated, up 2.4 percentage points from the low of 5.3% recorded in 2023 Q1. As well, workers continue to have a difficult time finding employment as job vacancies have continued to trend lower. In 2025 Q4, long-term unemployment accounted for 27.8% of total unemployment, the second highest reading since 1996, excluding the pandemic.[9]
Figure 4 Unemployment rate declined to 7.6% in 2025 Q4
Source: Statistics Canada Table 14-10-0287-01 and FAO.
Accessible version
| Seasonally adjusted, quarterly, % | Average | |
|---|---|---|
| 2023 Q1 | 5.3 | 6.8 |
| 2023 Q2 | 5.4 | 6.8 |
| 2023 Q3 | 5.7 | 6.8 |
| 2023 Q4 | 6.2 | 6.8 |
| 2024 Q1 | 6.5 | 6.8 |
| 2024 Q2 | 6.8 | 6.8 |
| 2024 Q3 | 7.0 | 6.8 |
| 2024 Q4 | 7.5 | 6.8 |
| 2025 Q1 | 7.5 | 6.8 |
| 2025 Q2 | 7.8 | 6.8 |
| 2025 Q3 | 7.8 | 6.8 |
| 2025 Q4 | 7.6 | 6.8 |
Average hourly wages grew 2.8% in 2025 Q4 compared to 2024 Q4, reaching $38.49 an hour. The increase in average hourly wages in the fourth quarter marked the slowest pace of wage gains since mid-2021, reflecting a softening labour market. Hourly wage growth was broad-based across most major industries, with wages in services-producing industries rising 3.0% and goods-producing industries rising 1.9%. Industries with the fastest wage growth were business, building and other support services; wholesale and retail trade; and education services.
Figure 5 Average hourly wages grew 2.8% in 2025 Q4 compared to 2024 Q4
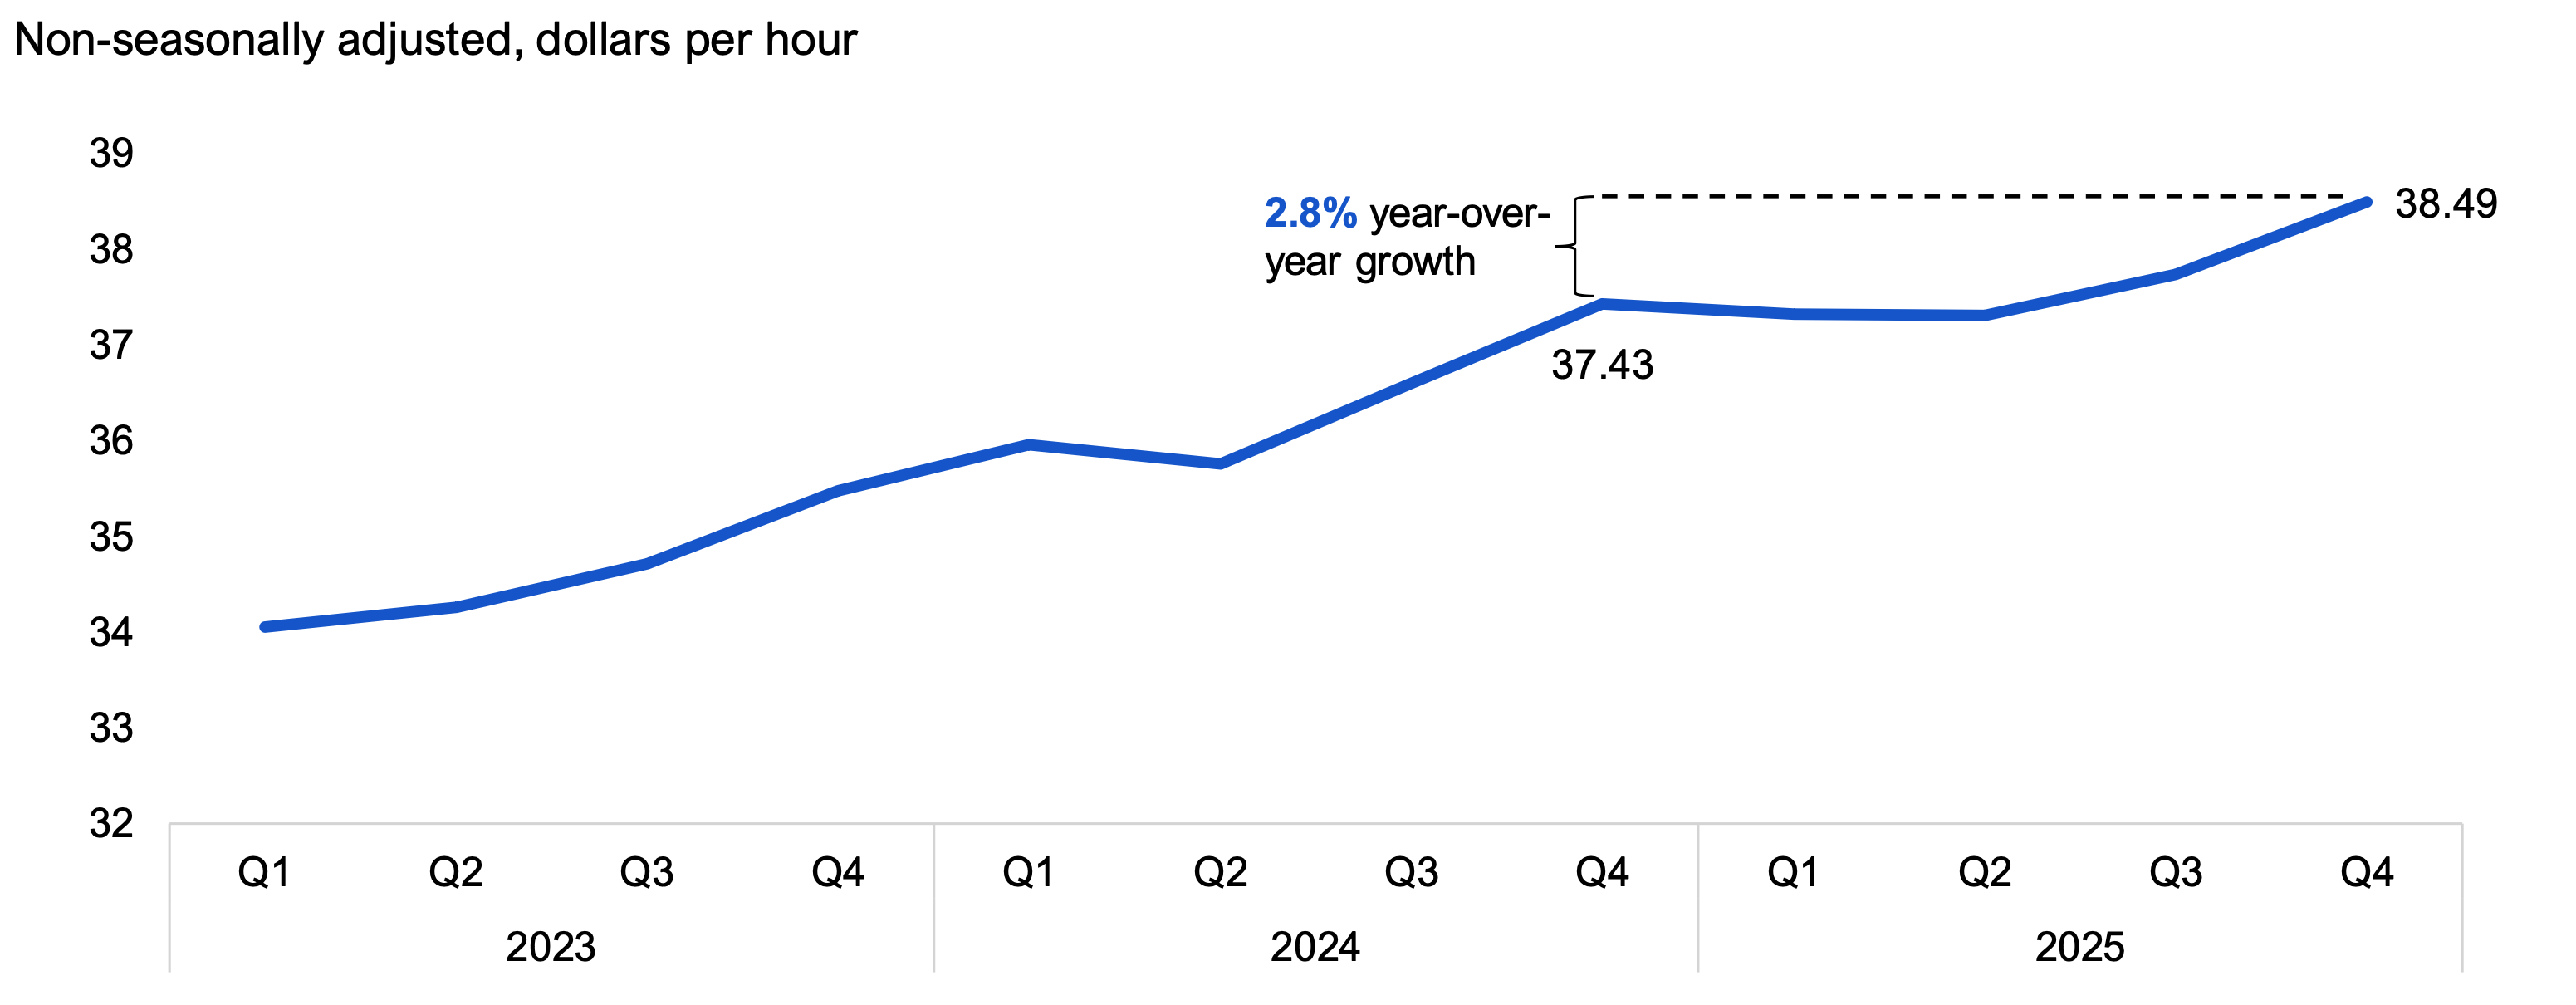
Source: Statistics Canada Table 14-10-0063-01 and FAO.
Accessible version
| Non-seasonally adjusted, dollars per hour | Growth | |
|---|---|---|
| 2023 Q1 | 34.05 | |
| 2023 Q2 | 34.26 | |
| 2023 Q3 | 34.72 | |
| 2023 Q4 | 35.48 | |
| 2024 Q1 | 35.96 | |
| 2024 Q2 | 35.76 | |
| 2024 Q3 | 36.60 | |
| 2024 Q4 | 37.43 | |
| 2025 Q1 | 37.32 | |
| 2025 Q2 | 37.31 | |
| 2025 Q3 | 37.73 | |
| 2025 Q4 | 38.49 | 2.8% year-over-year growth |
The Ontario Consumer Price Index (CPI) inflation rate[10] was 1.9% in 2025 Q4, slightly higher than the 1.8% rate recorded in 2025 Q3. Of the major CPI components, food (5.0%), household operating expenses (3.9%), health and personal care (2.2%) and alcohol and tobacco (2.1%) increased at rates faster than headline inflation in 2025 Q4. Shelter prices (1.0%) increased at a lower rate than headline inflation for the first time since 2022 Q2, when the Bank of Canada began to increase interest rates. Prices for energy were 9.2% lower than a year earlier, suppressing the overall inflation rate and reflecting in part the removal of the Canada consumer carbon tax. Excluding energy, the inflation rate was 2.7% in 2025 Q4, 0.7 percentage points above the all-items inflation rate of 1.9%.
Figure 6 CPI inflation rate was 1.9% in 2025 Q4
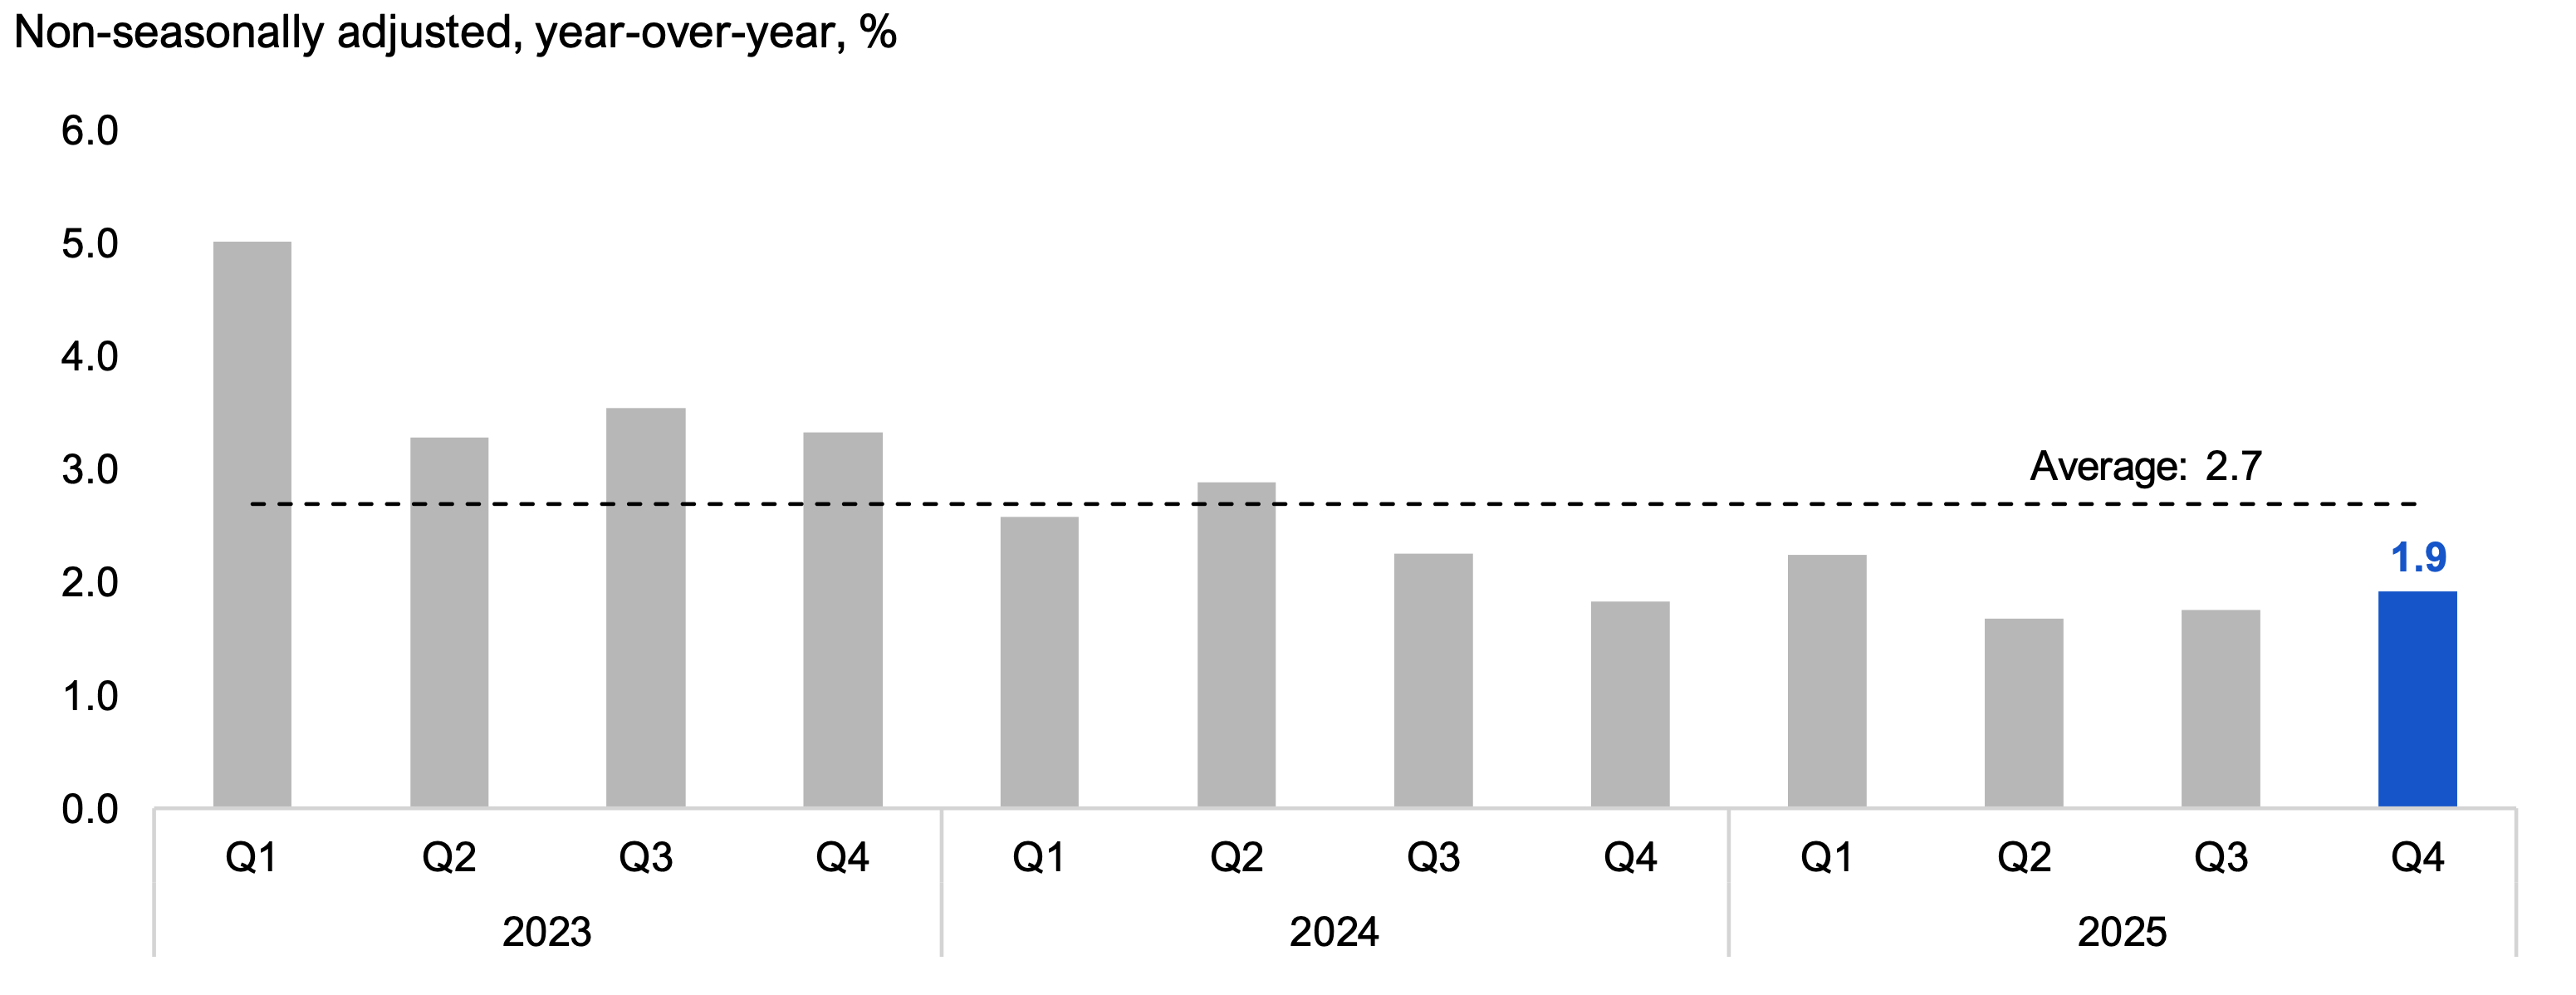
Source: Statistics Canada Table 18-10-0004-01 and FAO.
Accessible version
| Non-seasonally adjusted, year-over-year, % | Average | |
|---|---|---|
| 2023 Q1 | 5.0 | 2.7 |
| 2023 Q2 | 3.3 | 2.7 |
| 2023 Q3 | 3.5 | 2.7 |
| 2023 Q4 | 3.3 | 2.7 |
| 2024 Q1 | 2.6 | 2.7 |
| 2024 Q2 | 2.9 | 2.7 |
| 2024 Q3 | 2.3 | 2.7 |
| 2024 Q4 | 1.8 | 2.7 |
| 2025 Q1 | 2.2 | 2.7 |
| 2025 Q2 | 1.7 | 2.7 |
| 2025 Q3 | 1.8 | 2.7 |
| 2025 Q4 | 1.9 | 2.7 |
Retail sales decreased by 0.5% in 2025 Q4 in Ontario, marking a three-quarter period of prolonged weakness. The overall sales decline in Q4 resulted largely from a drop in motor vehicles and parts. Consumer spending continues to be negatively impacted by high prices, economic uncertainty and elevated housing costs.[11]
Figure 7 Retail sales decreased by 0.5% in 2025 Q4
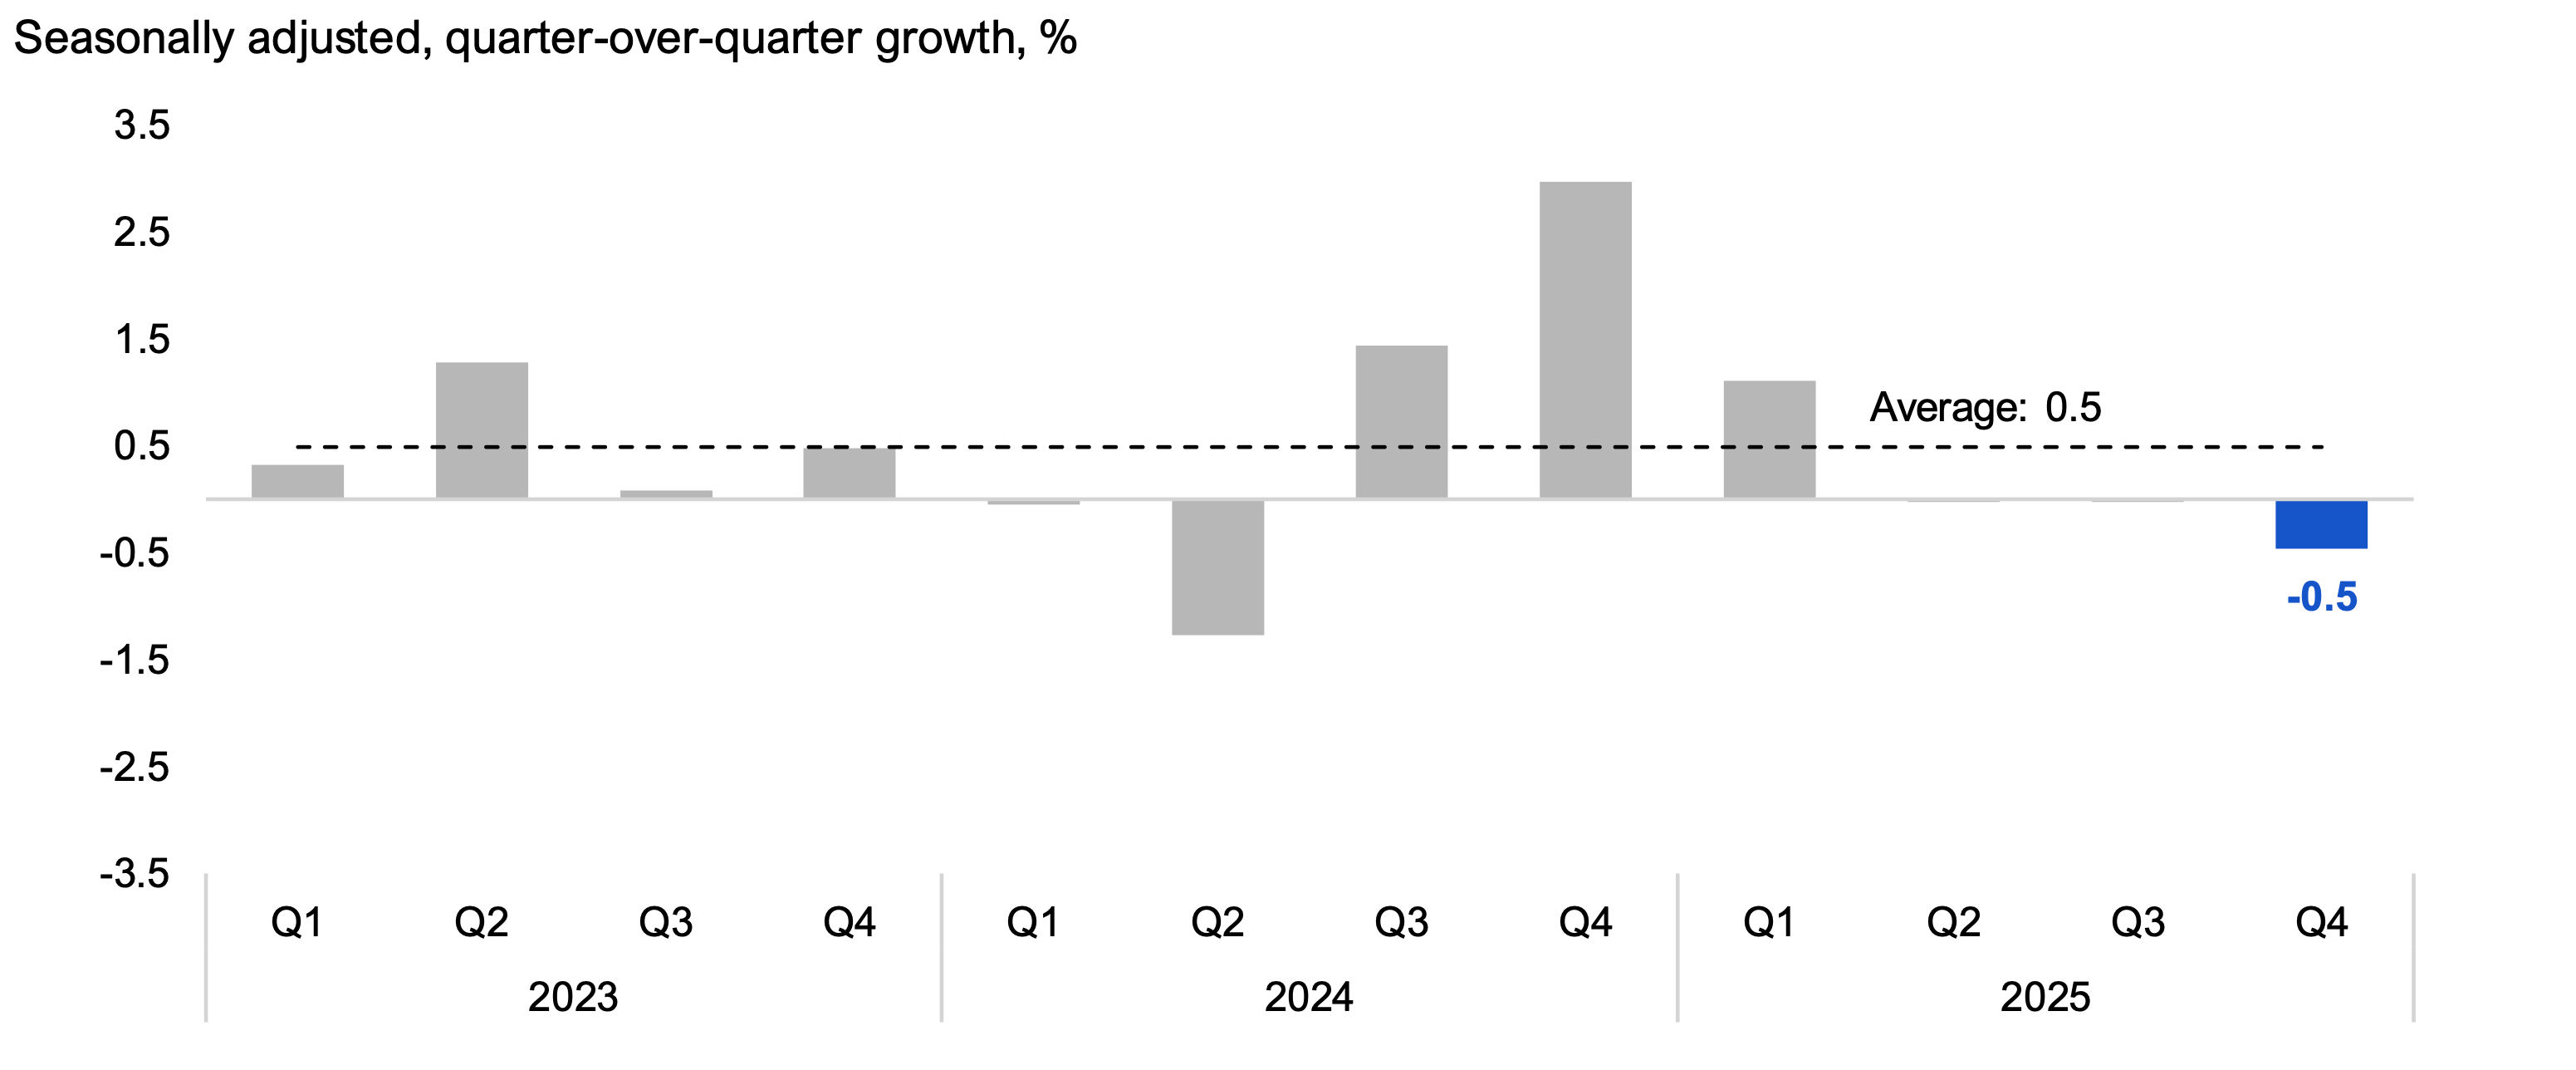
Source: Statistics Canada Table 20-10-0056-01 and FAO.
Accessible version
| Seasonally adjusted, quarter-over-quarter growth, % | Average | |
|---|---|---|
| 2023 Q1 | 0.3 | 0.5 |
| 2023 Q2 | 1.3 | 0.5 |
| 2023 Q3 | 0.1 | 0.5 |
| 2023 Q4 | 0.5 | 0.5 |
| 2024 Q1 | 0.0 | 0.5 |
| 2024 Q2 | -1.3 | 0.5 |
| 2024 Q3 | 1.4 | 0.5 |
| 2024 Q4 | 3.0 | 0.5 |
| 2025 Q1 | 1.1 | 0.5 |
| 2025 Q2 | 0.0 | 0.5 |
| 2025 Q3 | 0.0 | 0.5 |
| 2025 Q4 | -0.5 | 0.5 |
Ontario home resales in 2025 Q4 totalled 43,200 units, a decrease of 1.9%, following a gain of 14.3% in 2025 Q3. Despite the decline, home resale activity in the second half of 2025 picked up significantly from the first half of the year, reflecting the impact of lower mortgage rates and lower average prices compared to recent years.
Figure 8 Housing resales declined to 43,200 units in 2025 Q4
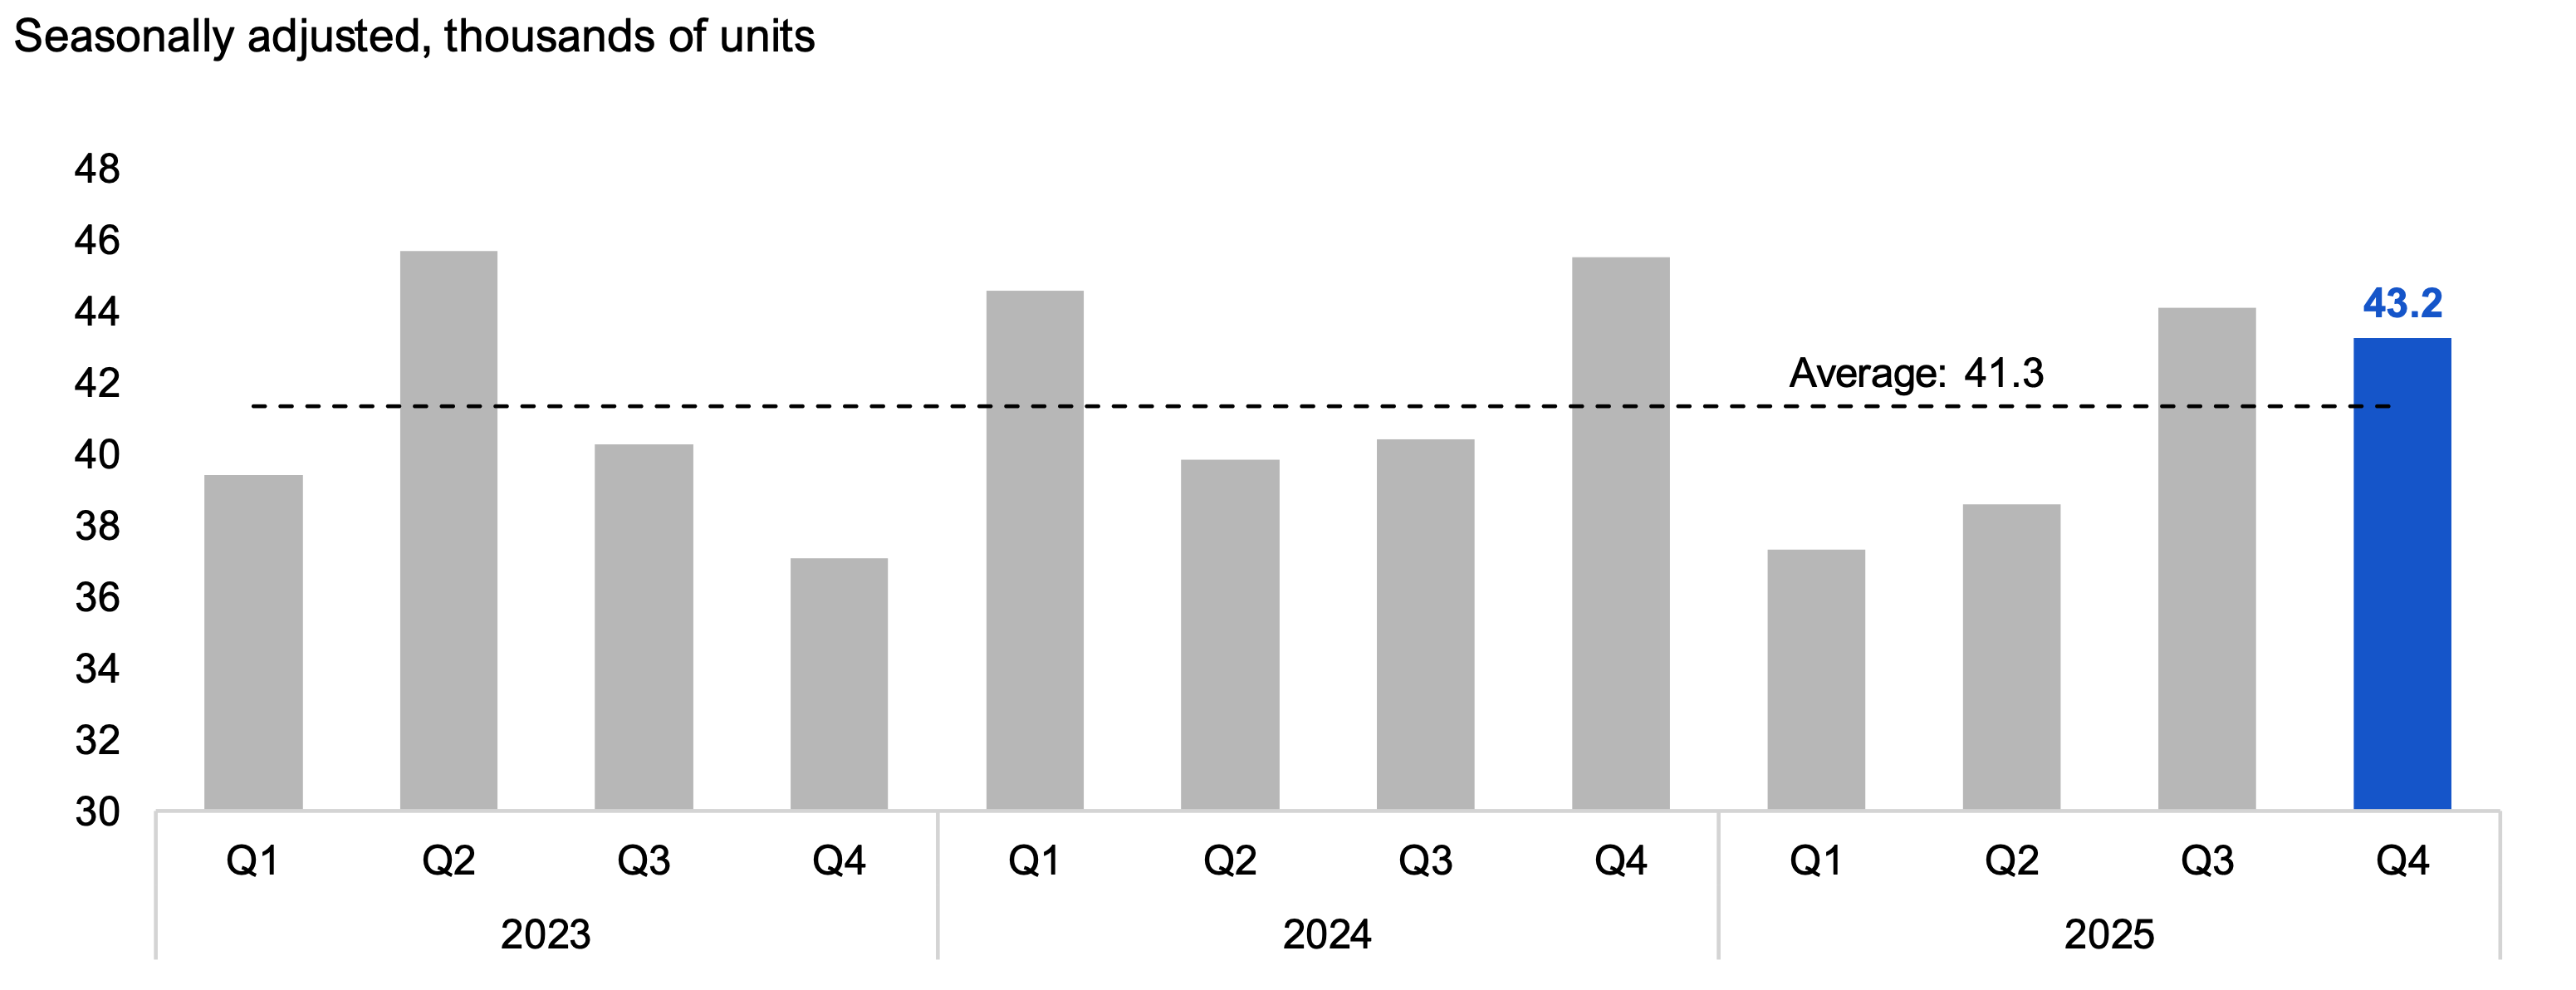
Source: Canadian Real Estate Association and FAO.
Accessible version
| Seasonally adjusted, thousands of units | Average | |
|---|---|---|
| 2023 Q1 | 39.4 | 41.3 |
| 2023 Q2 | 45.7 | 41.3 |
| 2023 Q3 | 40.3 | 41.3 |
| 2023 Q4 | 37.1 | 41.3 |
| 2024 Q1 | 44.6 | 41.3 |
| 2024 Q2 | 39.8 | 41.3 |
| 2024 Q3 | 40.4 | 41.3 |
| 2024 Q4 | 45.5 | 41.3 |
| 2025 Q1 | 37.3 | 41.3 |
| 2025 Q2 | 38.6 | 41.3 |
| 2025 Q3 | 44.1 | 41.3 |
| 2025 Q4 | 43.2 | 41.3 |
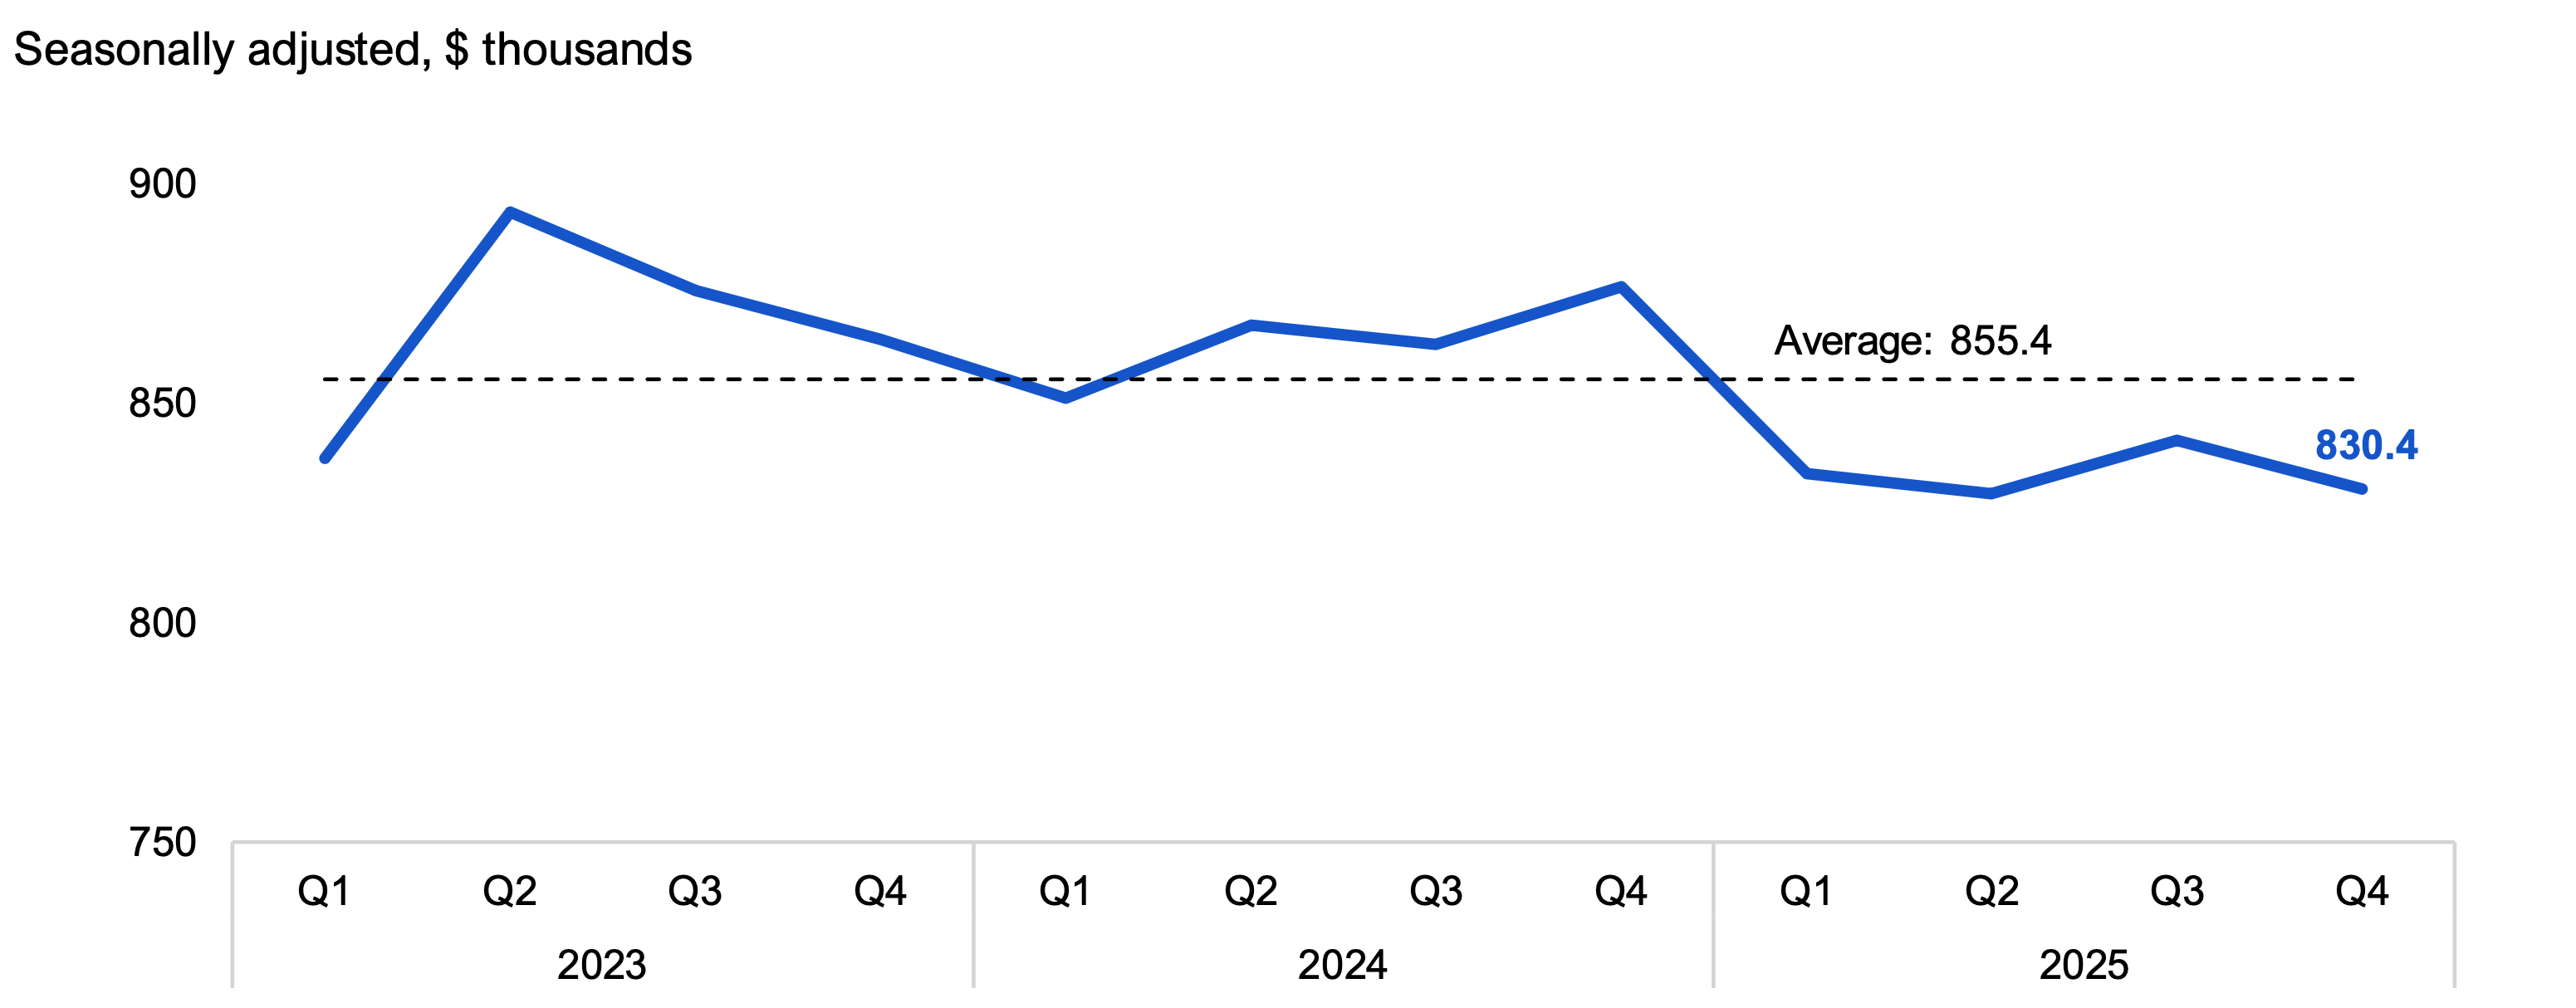
Home resale prices in Ontario averaged $830,400 in 2025 Q4, a 1.3% decline from the previous quarter. Although average home resale prices declined in 2025 Q4, little change occurred throughout the year. In 2025 Q4, the average resale home price was $201,400 (or ‑19.5%) below the peak reached in 2022 Q1 ($1,031,800).
Figure 9 Average home resale prices declined to $830,400 in 2025 Q4
Source: Canadian Real Estate Association and FAO.
Accessible version
| Seasonally adjusted, $ thousands | Average | |
|---|---|---|
| 2023 Q1 | 837.6 | 855.4 |
| 2023 Q2 | 893.5 | 855.4 |
| 2023 Q3 | 875.6 | 855.4 |
| 2023 Q4 | 864.6 | 855.4 |
| 2024 Q1 | 851.2 | 855.4 |
| 2024 Q2 | 867.7 | 855.4 |
| 2024 Q3 | 863.4 | 855.4 |
| 2024 Q4 | 876.4 | 855.4 |
| 2025 Q1 | 833.8 | 855.4 |
| 2025 Q2 | 829.4 | 855.4 |
| 2025 Q3 | 841.7 | 855.4 |
| 2025 Q4 | 830.4 | 855.4 |
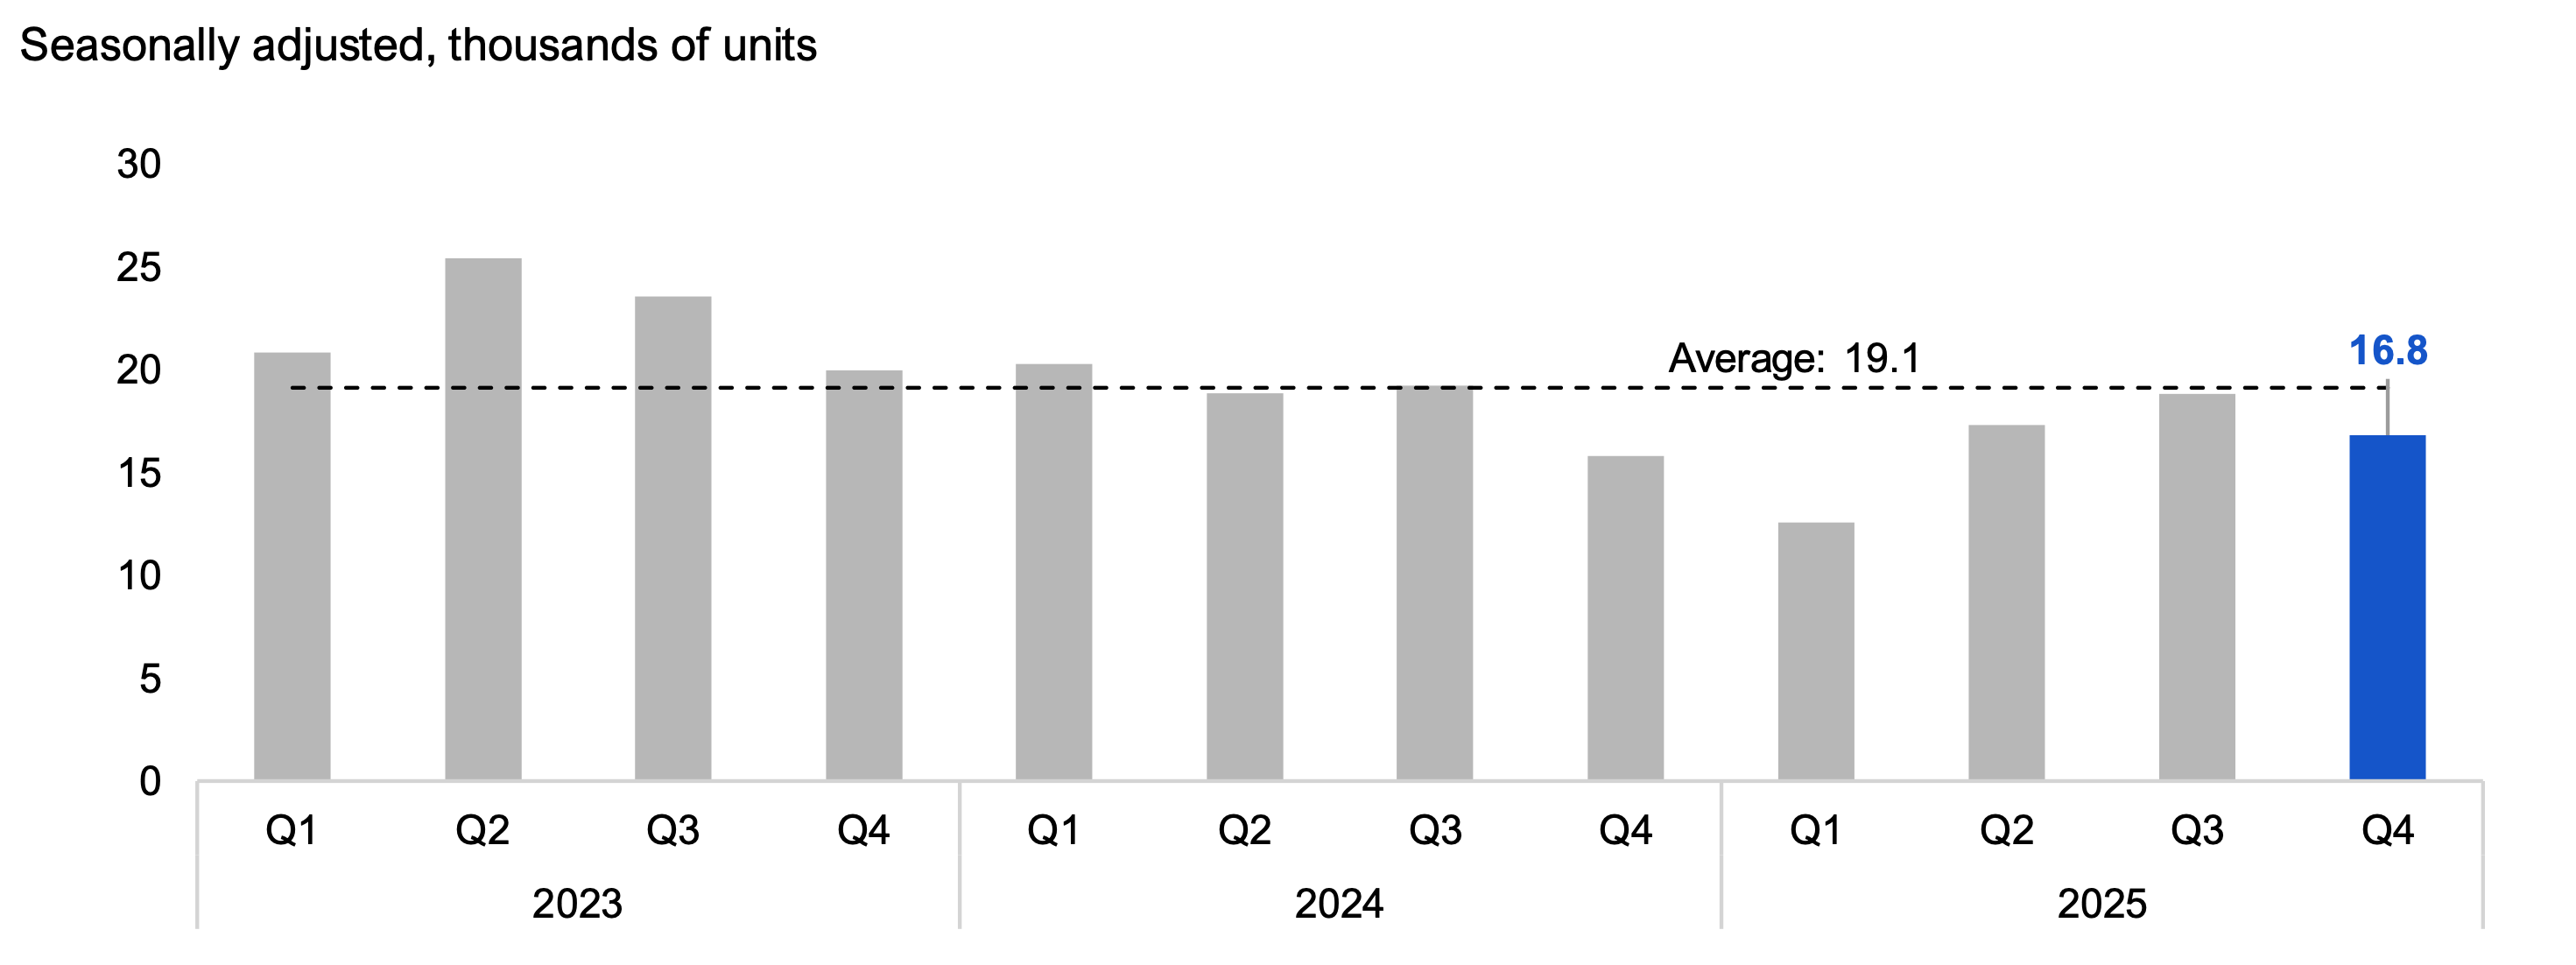
Housing starts[12] in 2025 Q4 totalled 16,800 units in Ontario, a decline of 10.7% from 2025 Q3, following two consecutive quarterly increases. In 2025 Q4, 82% of total housing starts were multiple unit dwellings, while 18% were single detached homes.[13] Housing starts in 2025 totalled 65,400, the lowest number of annual starts since 2014.
Figure 10 Housing starts fell to 16,800 units in 2025 Q4
Source: Statistics Canada Table 34-10-0141-01 and FAO.
Accessible version
| Seasonally adjusted, thousands of units | Average | |
|---|---|---|
| 2023 Q1 | 20.9 | 19.1 |
| 2023 Q2 | 25.4 | 19.1 |
| 2023 Q3 | 23.5 | 19.1 |
| 2023 Q4 | 20.0 | 19.1 |
| 2024 Q1 | 20.2 | 19.1 |
| 2024 Q2 | 18.9 | 19.1 |
| 2024 Q3 | 19.2 | 19.1 |
| 2024 Q4 | 15.8 | 19.1 |
| 2025 Q1 | 12.6 | 19.1 |
| 2025 Q2 | 17.3 | 19.1 |
| 2025 Q3 | 18.8 | 19.1 |
| 2025 Q4 | 16.8 | 19.1 |
Businesses
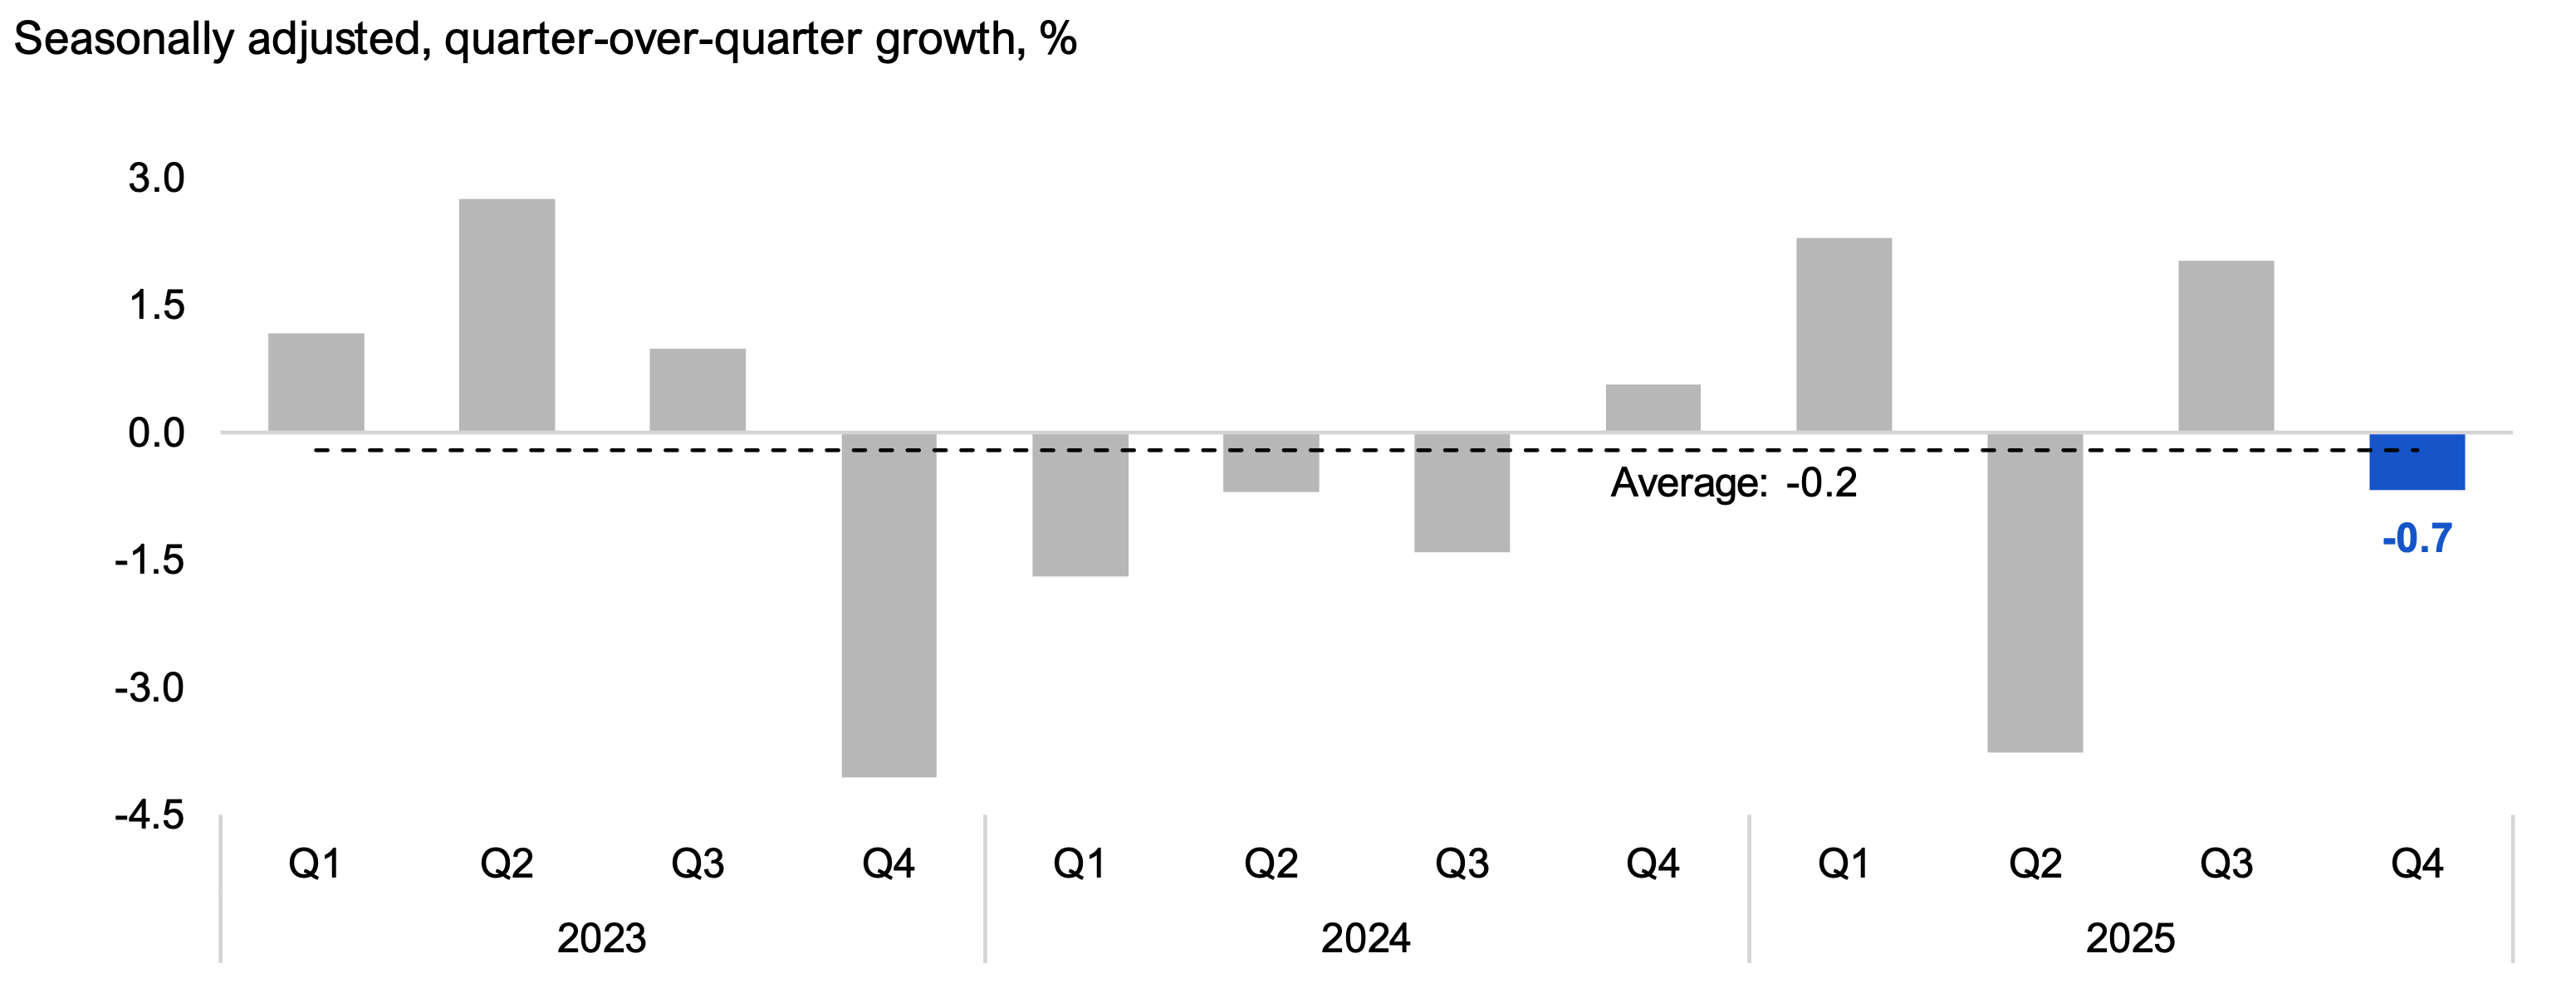
Manufacturing sales declined by 0.7% in 2025 Q4, following a 2.0% increase in 2025 Q3. The decline resulted primarily from lower sales of motor vehicles (-4.6%) and motor vehicle parts (-3.9%) whose output has been disrupted by semiconductor shortages.[14] Manufacturing sales have struggled over the last several years, declining in six of the past nine quarters, by a total of 7.4% since mid-2023, reflecting reduced activity in auto assembly for retooling and the impact of US tariffs.
Figure 11 Manufacturing sales declined by 0.7% in 2025 Q4
Source: Statistics Canada Table 16-10-0048-01 and FAO.
Accessible version
| Seasonally adjusted, quarter-over-quarter growth, % | Average | |
|---|---|---|
| 2023 Q1 | 1.2 | -0.2 |
| 2023 Q2 | 2.8 | -0.2 |
| 2023 Q3 | 1.0 | -0.2 |
| 2023 Q4 | -4.1 | -0.2 |
| 2024 Q1 | -1.7 | -0.2 |
| 2024 Q2 | -0.7 | -0.2 |
| 2024 Q3 | -1.4 | -0.2 |
| 2024 Q4 | 0.6 | -0.2 |
| 2025 Q1 | 2.3 | -0.2 |
| 2025 Q2 | -3.8 | -0.2 |
| 2025 Q3 | 2.0 | -0.2 |
| 2025 Q4 | -0.7 | -0.2 |
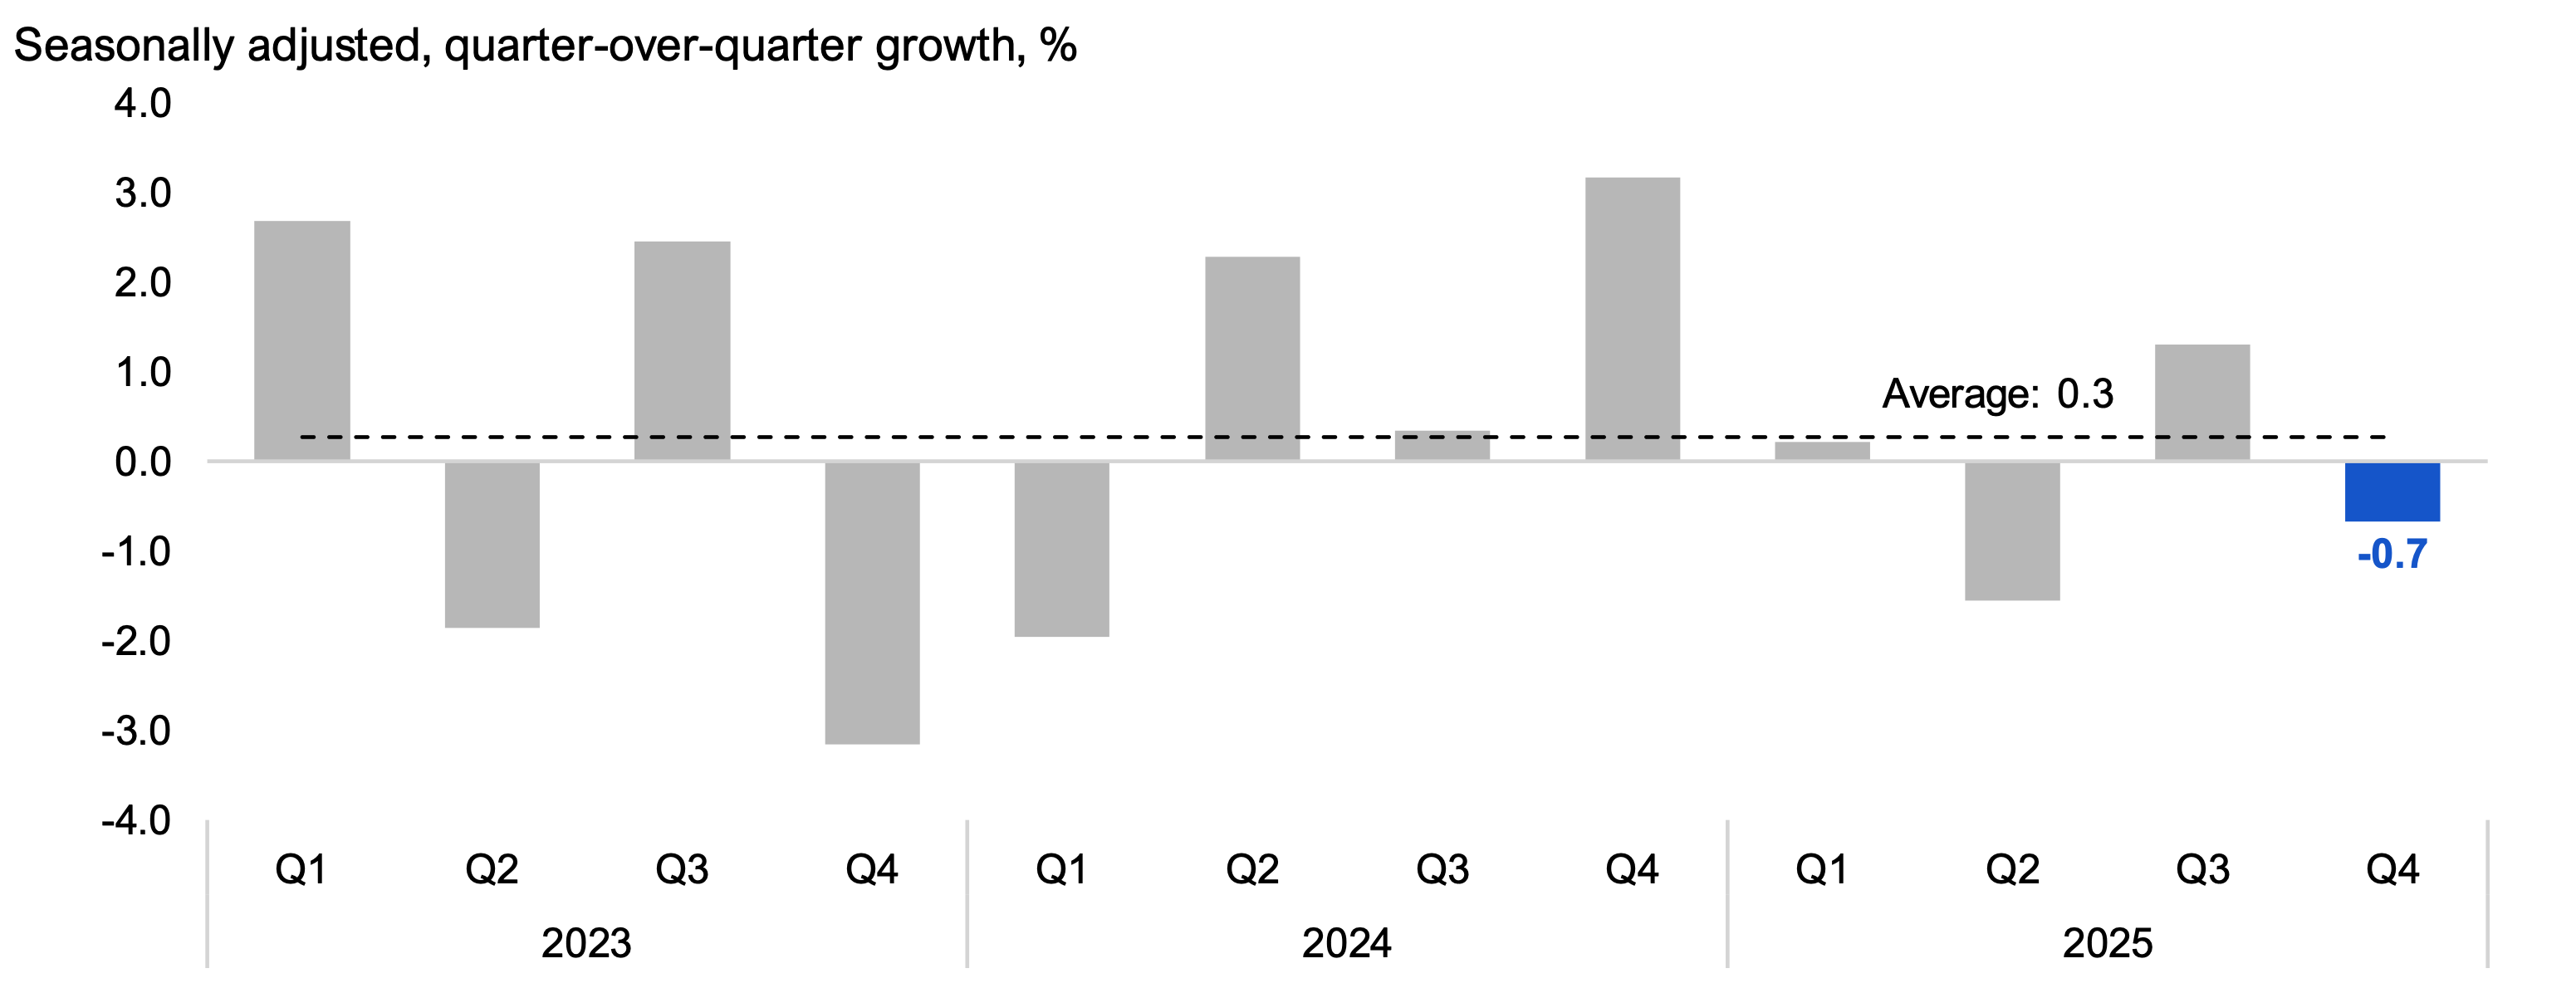
Wholesale trade, which measures sales of bulk items, declined by 0.7% in 2025 Q4, following a 1.3% increase in the previous quarter. The 2025 Q4 decline was largely the result of lower sales of motor vehicles and parts (-4.2%) and building materials (-5.5%).
Figure 12 Wholesale trade declined by 0.7% in 2025 Q4
Source: Statistics Canada Table 20-10-0074-01 and FAO.
Accessible version
| Seasonally adjusted, quarter-over-quarter growth, % | Average | |
|---|---|---|
| 2023 Q1 | 2.7 | 0.3 |
| 2023 Q2 | -1.9 | 0.3 |
| 2023 Q3 | 2.4 | 0.3 |
| 2023 Q4 | -3.2 | 0.3 |
| 2024 Q1 | -2.0 | 0.3 |
| 2024 Q2 | 2.3 | 0.3 |
| 2024 Q3 | 0.3 | 0.3 |
| 2024 Q4 | 3.2 | 0.3 |
| 2025 Q1 | 0.2 | 0.3 |
| 2025 Q2 | -1.6 | 0.3 |
| 2025 Q3 | 1.3 | 0.3 |
| 2025 Q4 | -0.7 | 0.3 |
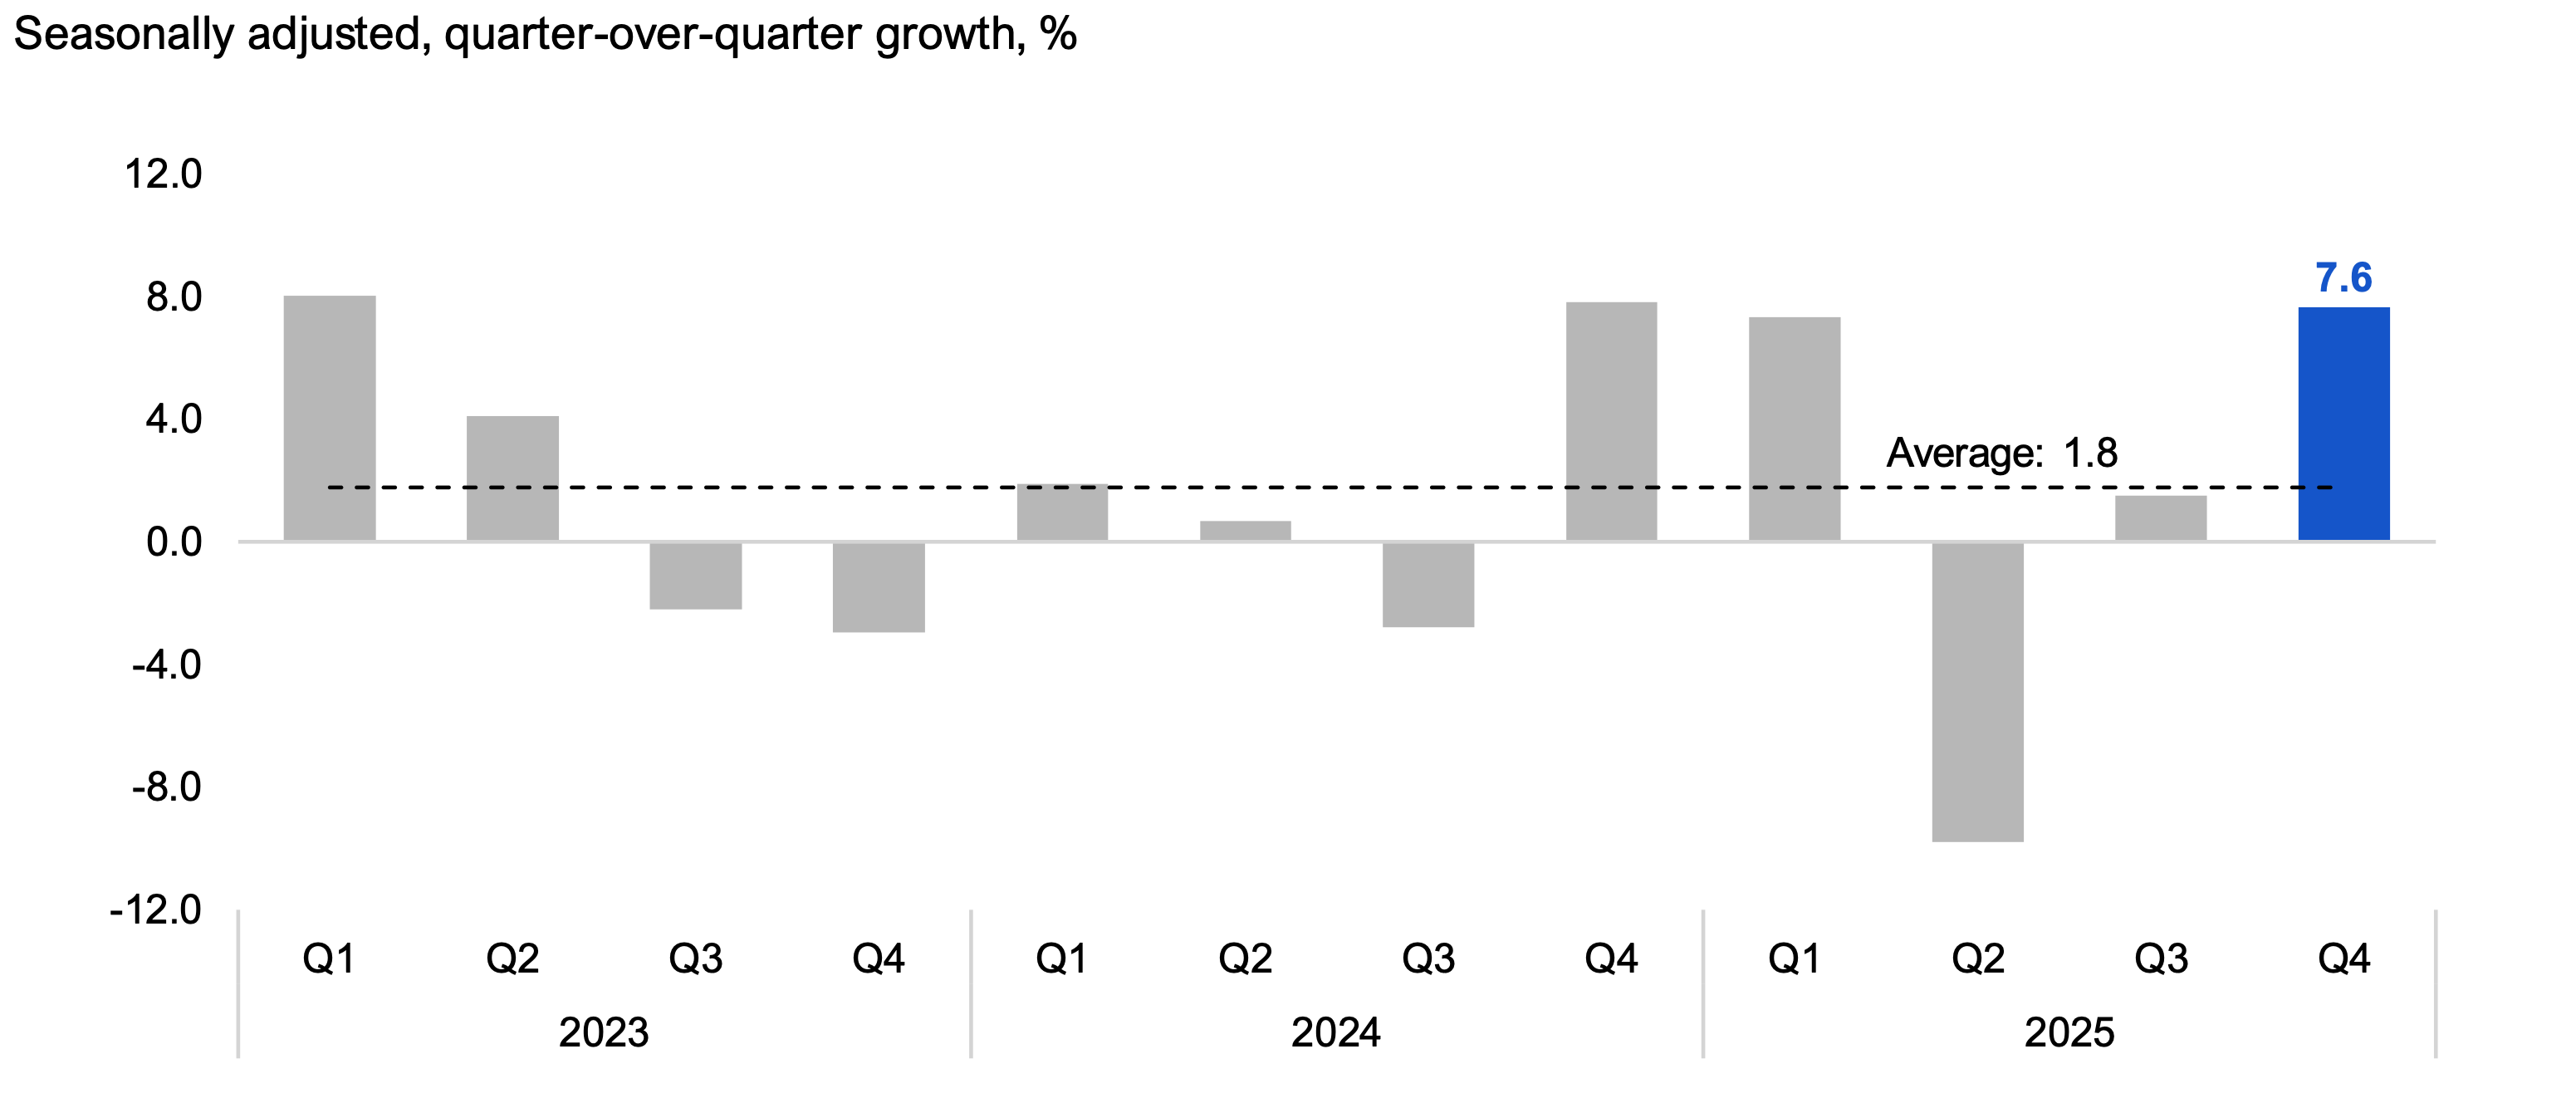
International merchandise exports, which account for all goods leaving the country through Ontario, increased by 7.6% in 2025 Q4, building on growth of 1.5% in the previous quarter. The sizeable increase in the fourth quarter was largely attributed to a rise in exports of metal and non-metallic mineral products, which was boosted by sharply higher gold prices.
Figure 13 International merchandise exports increased 7.6% in 2025 Q4
Source: Statistics Canada Table 12-10-0175-01, Table 12-10-0163-01 and FAO estimate.
Accessible version
| Seasonally adjusted, quarter-over-quarter growth, % | Average | |
|---|---|---|
| 2023 Q1 | 8.0 | 1.8 |
| 2023 Q2 | 4.1 | 1.8 |
| 2023 Q3 | -2.2 | 1.8 |
| 2023 Q4 | -2.9 | 1.8 |
| 2024 Q1 | 1.9 | 1.8 |
| 2024 Q2 | 0.7 | 1.8 |
| 2024 Q3 | -2.8 | 1.8 |
| 2024 Q4 | 7.8 | 1.8 |
| 2025 Q1 | 7.3 | 1.8 |
| 2025 Q2 | -9.8 | 1.8 |
| 2025 Q3 | 1.5 | 1.8 |
| 2025 Q4 | 7.6 | 1.8 |
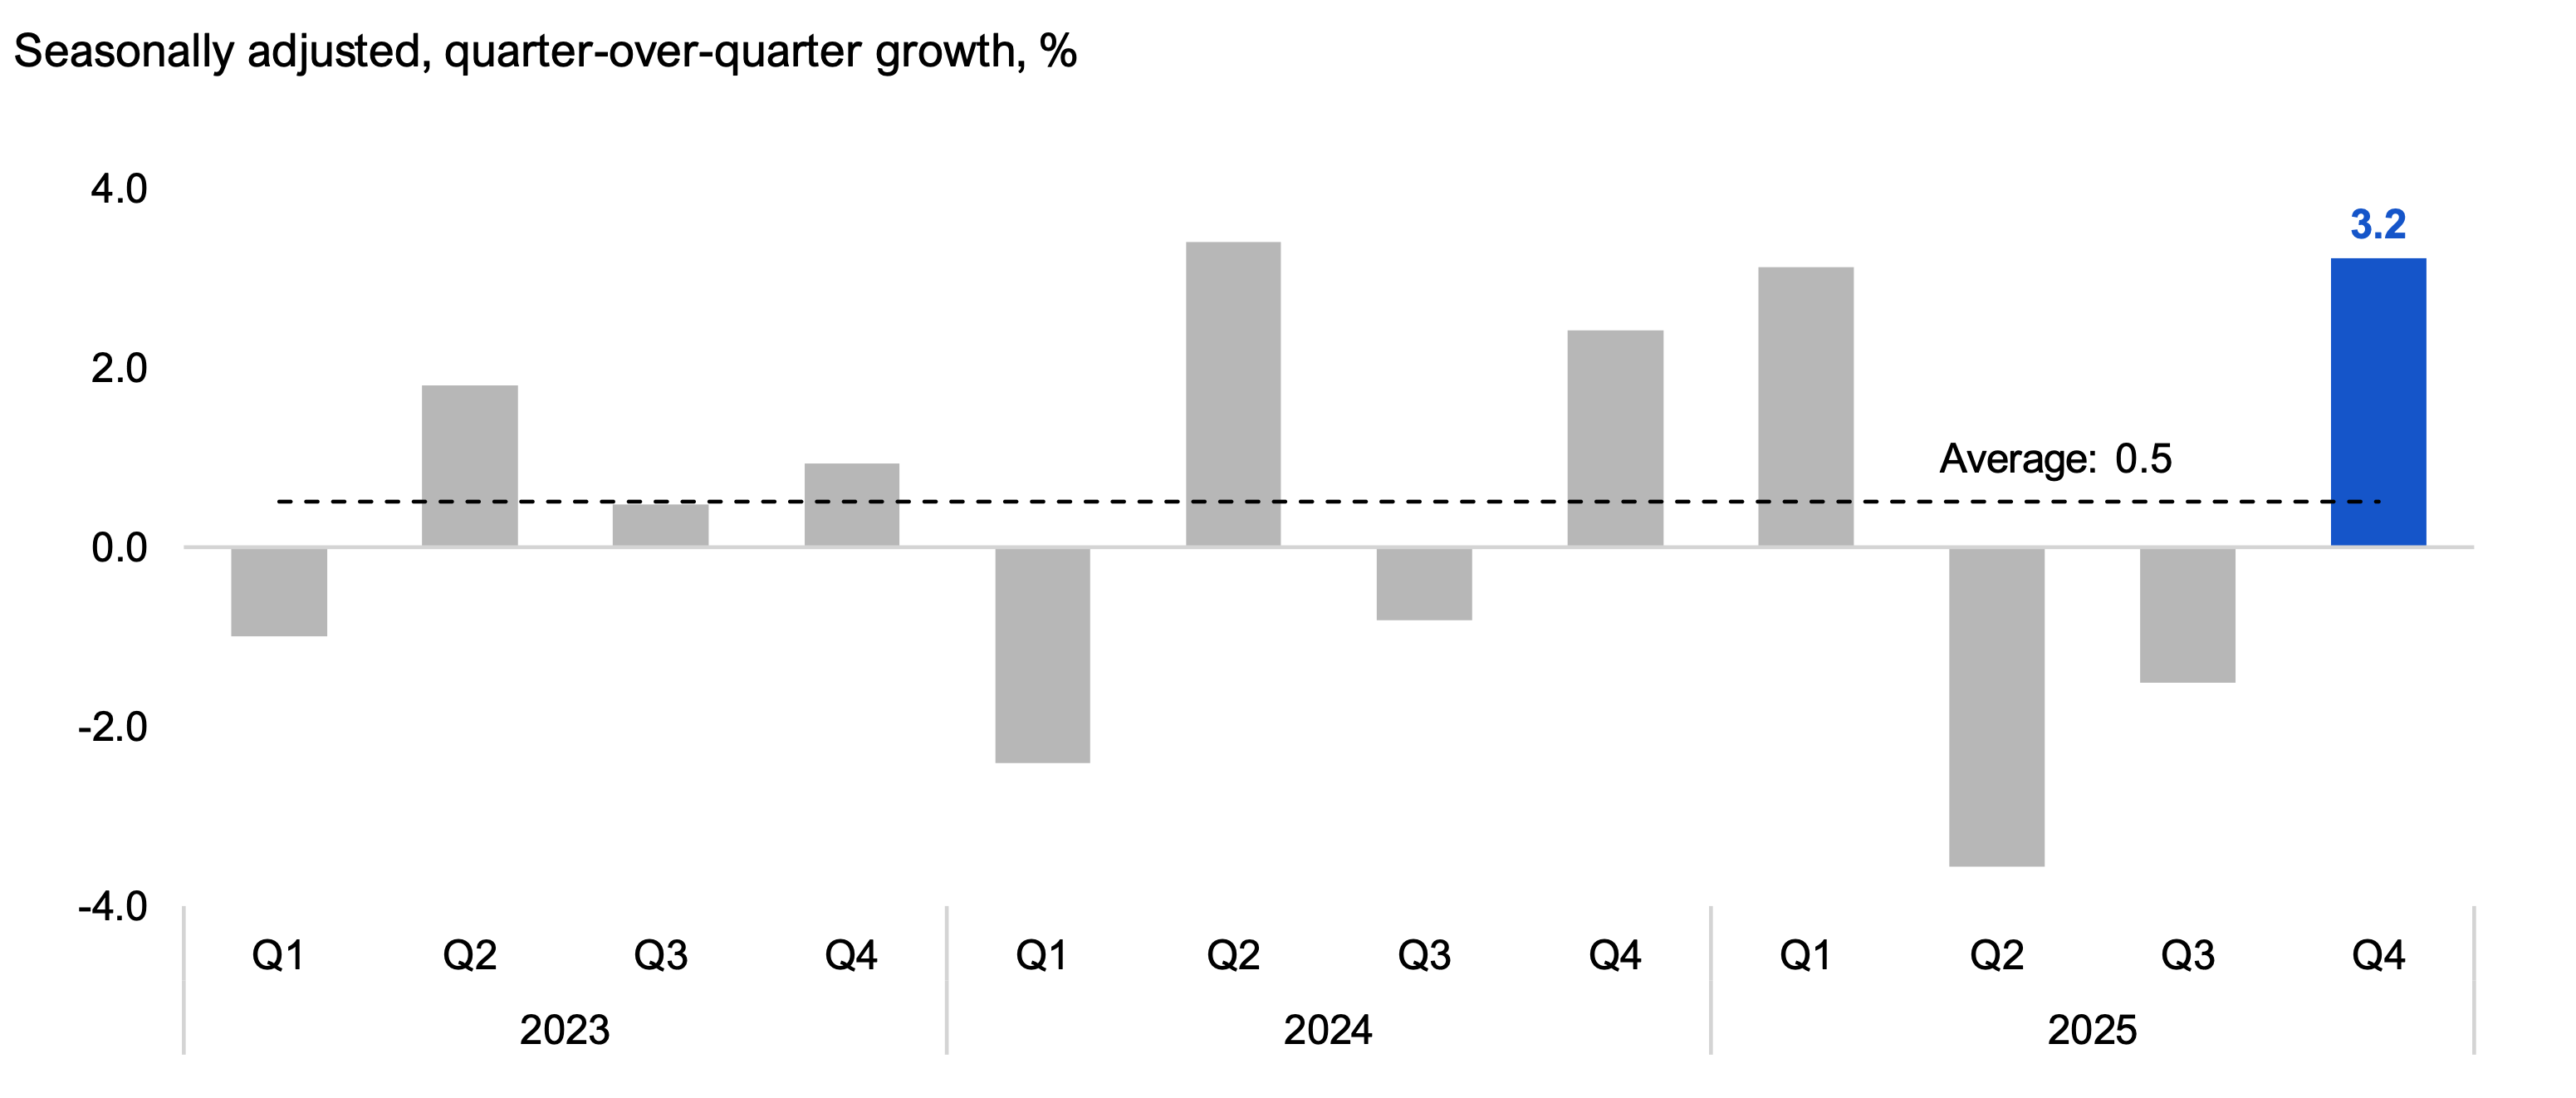
International merchandise imports, which measures international goods entering Ontario, increased by 3.2% in 2025 Q4 after two consecutive quarterly declines. The increase reflected higher imports of electronic and electrical equipment; metal ores and non-metallic minerals; and motor vehicles and parts.
Figure 14 International merchandise imports increased 3.2% in 2025 Q4
Source: Statistics Canada Table 12-10-0175-01, Table 12-10-0163-01 and FAO estimate.
Accessible version
| Seasonally adjusted, quarter-over-quarter growth, % | Average | |
|---|---|---|
| 2023 Q1 | -1.0 | 0.5 |
| 2023 Q2 | 1.8 | 0.5 |
| 2023 Q3 | 0.5 | 0.5 |
| 2023 Q4 | 0.9 | 0.5 |
| 2024 Q1 | -2.4 | 0.5 |
| 2024 Q2 | 3.4 | 0.5 |
| 2024 Q3 | -0.8 | 0.5 |
| 2024 Q4 | 2.4 | 0.5 |
| 2025 Q1 | 3.1 | 0.5 |
| 2025 Q2 | -3.6 | 0.5 |
| 2025 Q3 | -1.5 | 0.5 |
| 2025 Q4 | 3.2 | 0.5 |
US tariffs impacted Ontario’s trade patterns in 2025
Ontario’s international trade patterns shifted as US tariffs were imposed in 2025. Ontario’s goods exports to the US decreased by 4.0% in 2025, while goods exports to the rest of the world increased sharply by 17.0%.[15] The drop in exports to the US was concentrated in metal and mineral products; motor vehicles and parts; and chemical products. At the same time, Ontario’s higher exports to the rest of the world reflected gains in metal and mineral products; consumer goods; and industrial machinery. Similarly, Ontario’s goods imports from the US declined by 4.3% in 2025, while goods imports from the rest of the world rose by a strong 8.6%. The drop in Ontario’s imports from the US was led by declines in metal and mineral products; motor vehicles and parts; andindustrial machinery, while higher imports from the rest of the world were reflected in metal ores and minerals; consumer goods; and electronic equipment.
Figure 15 Ontario’s trade in goods with non-US countries increased significantly in 2025
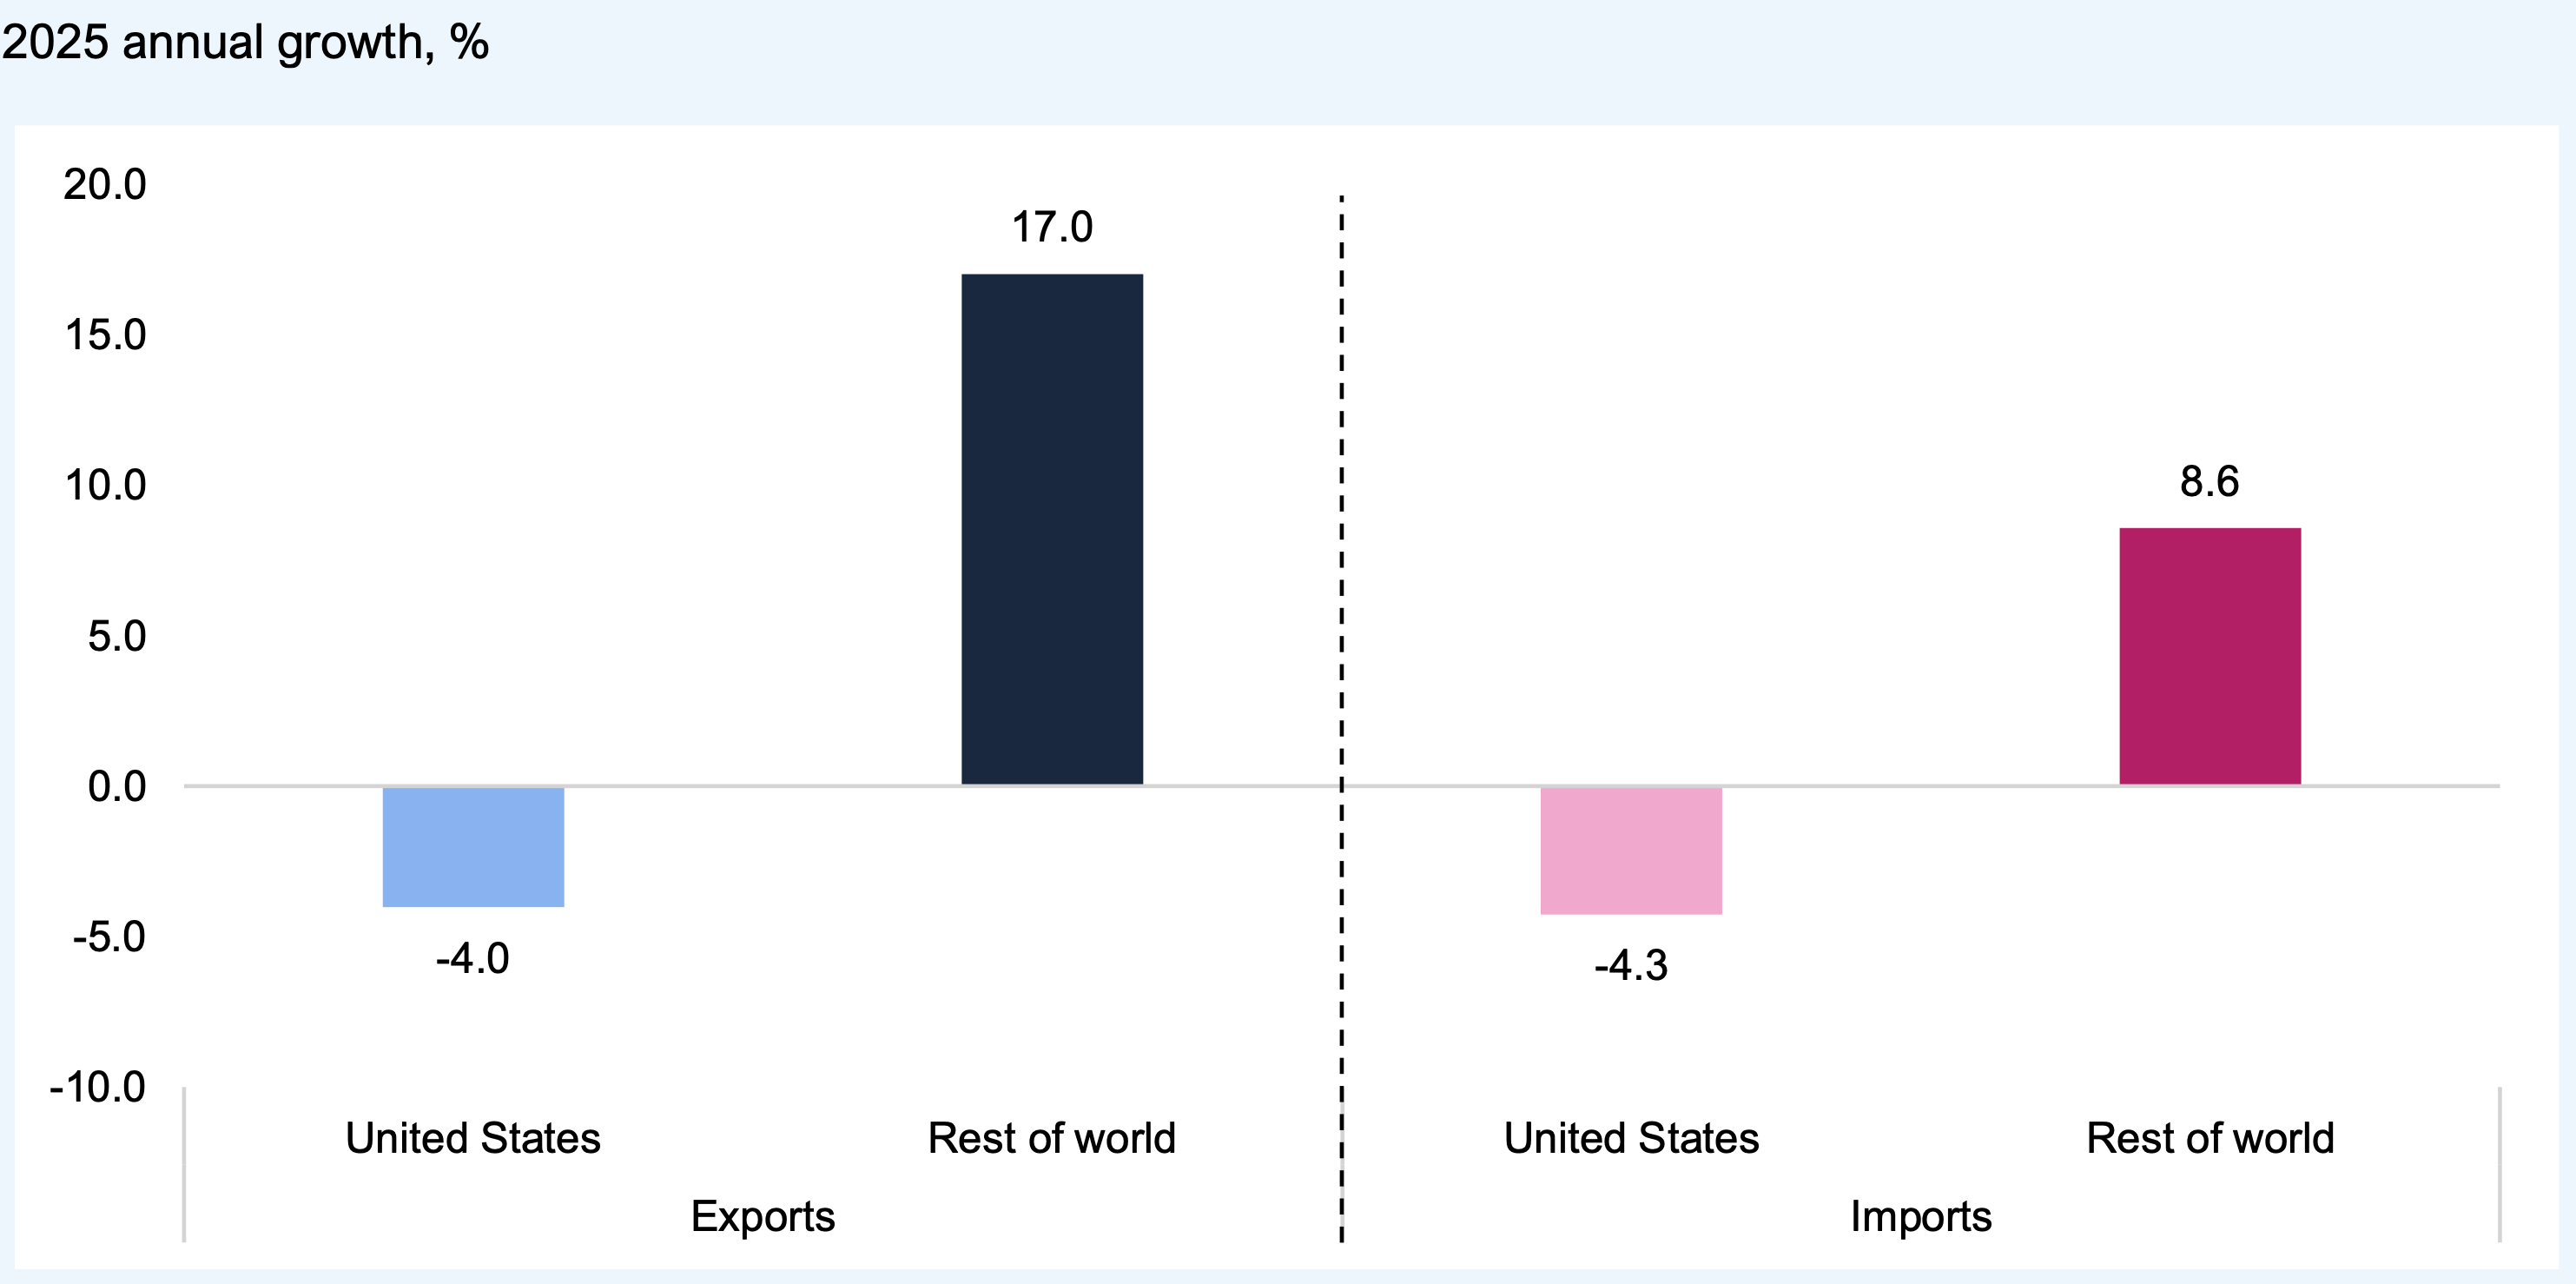
Note: Exports and imports figures in this textbox are estimated excluding gold.
Source: Statistics Canada Tables: 12-10-0175-01, 12-10-0163-01; Innovation, Science and Economic Development CanadaTrade Data Online; and FAO estimate.
Accessible version
| Exports | Imports | |||
|---|---|---|---|---|
| United States | Rest of world | United States | Rest of world | |
| 2025 annual growth, % | -4.0 | 17.0 | -4.3 | 8.6 |
Although trade patterns shifted in 2025, the US continues to be the main destination of Ontario’s international goods exports, with a share of 83.3% in 2025. Even with the sharp increase in goods exports to the rest of the world in 2025, their share of Ontario’s total international goods exports was 16.7% in 2025, slightly higher than the average of 15.6% since 2007. However, the strong growth in Ontario’s goods imports from the rest of the world pushed their share of the province’s total international goods imports to 50.4% in 2025, marking the highest share since record keeping began in 1997.
Figure 16 Share of Ontario’s trade in goods with the US and the rest of the world
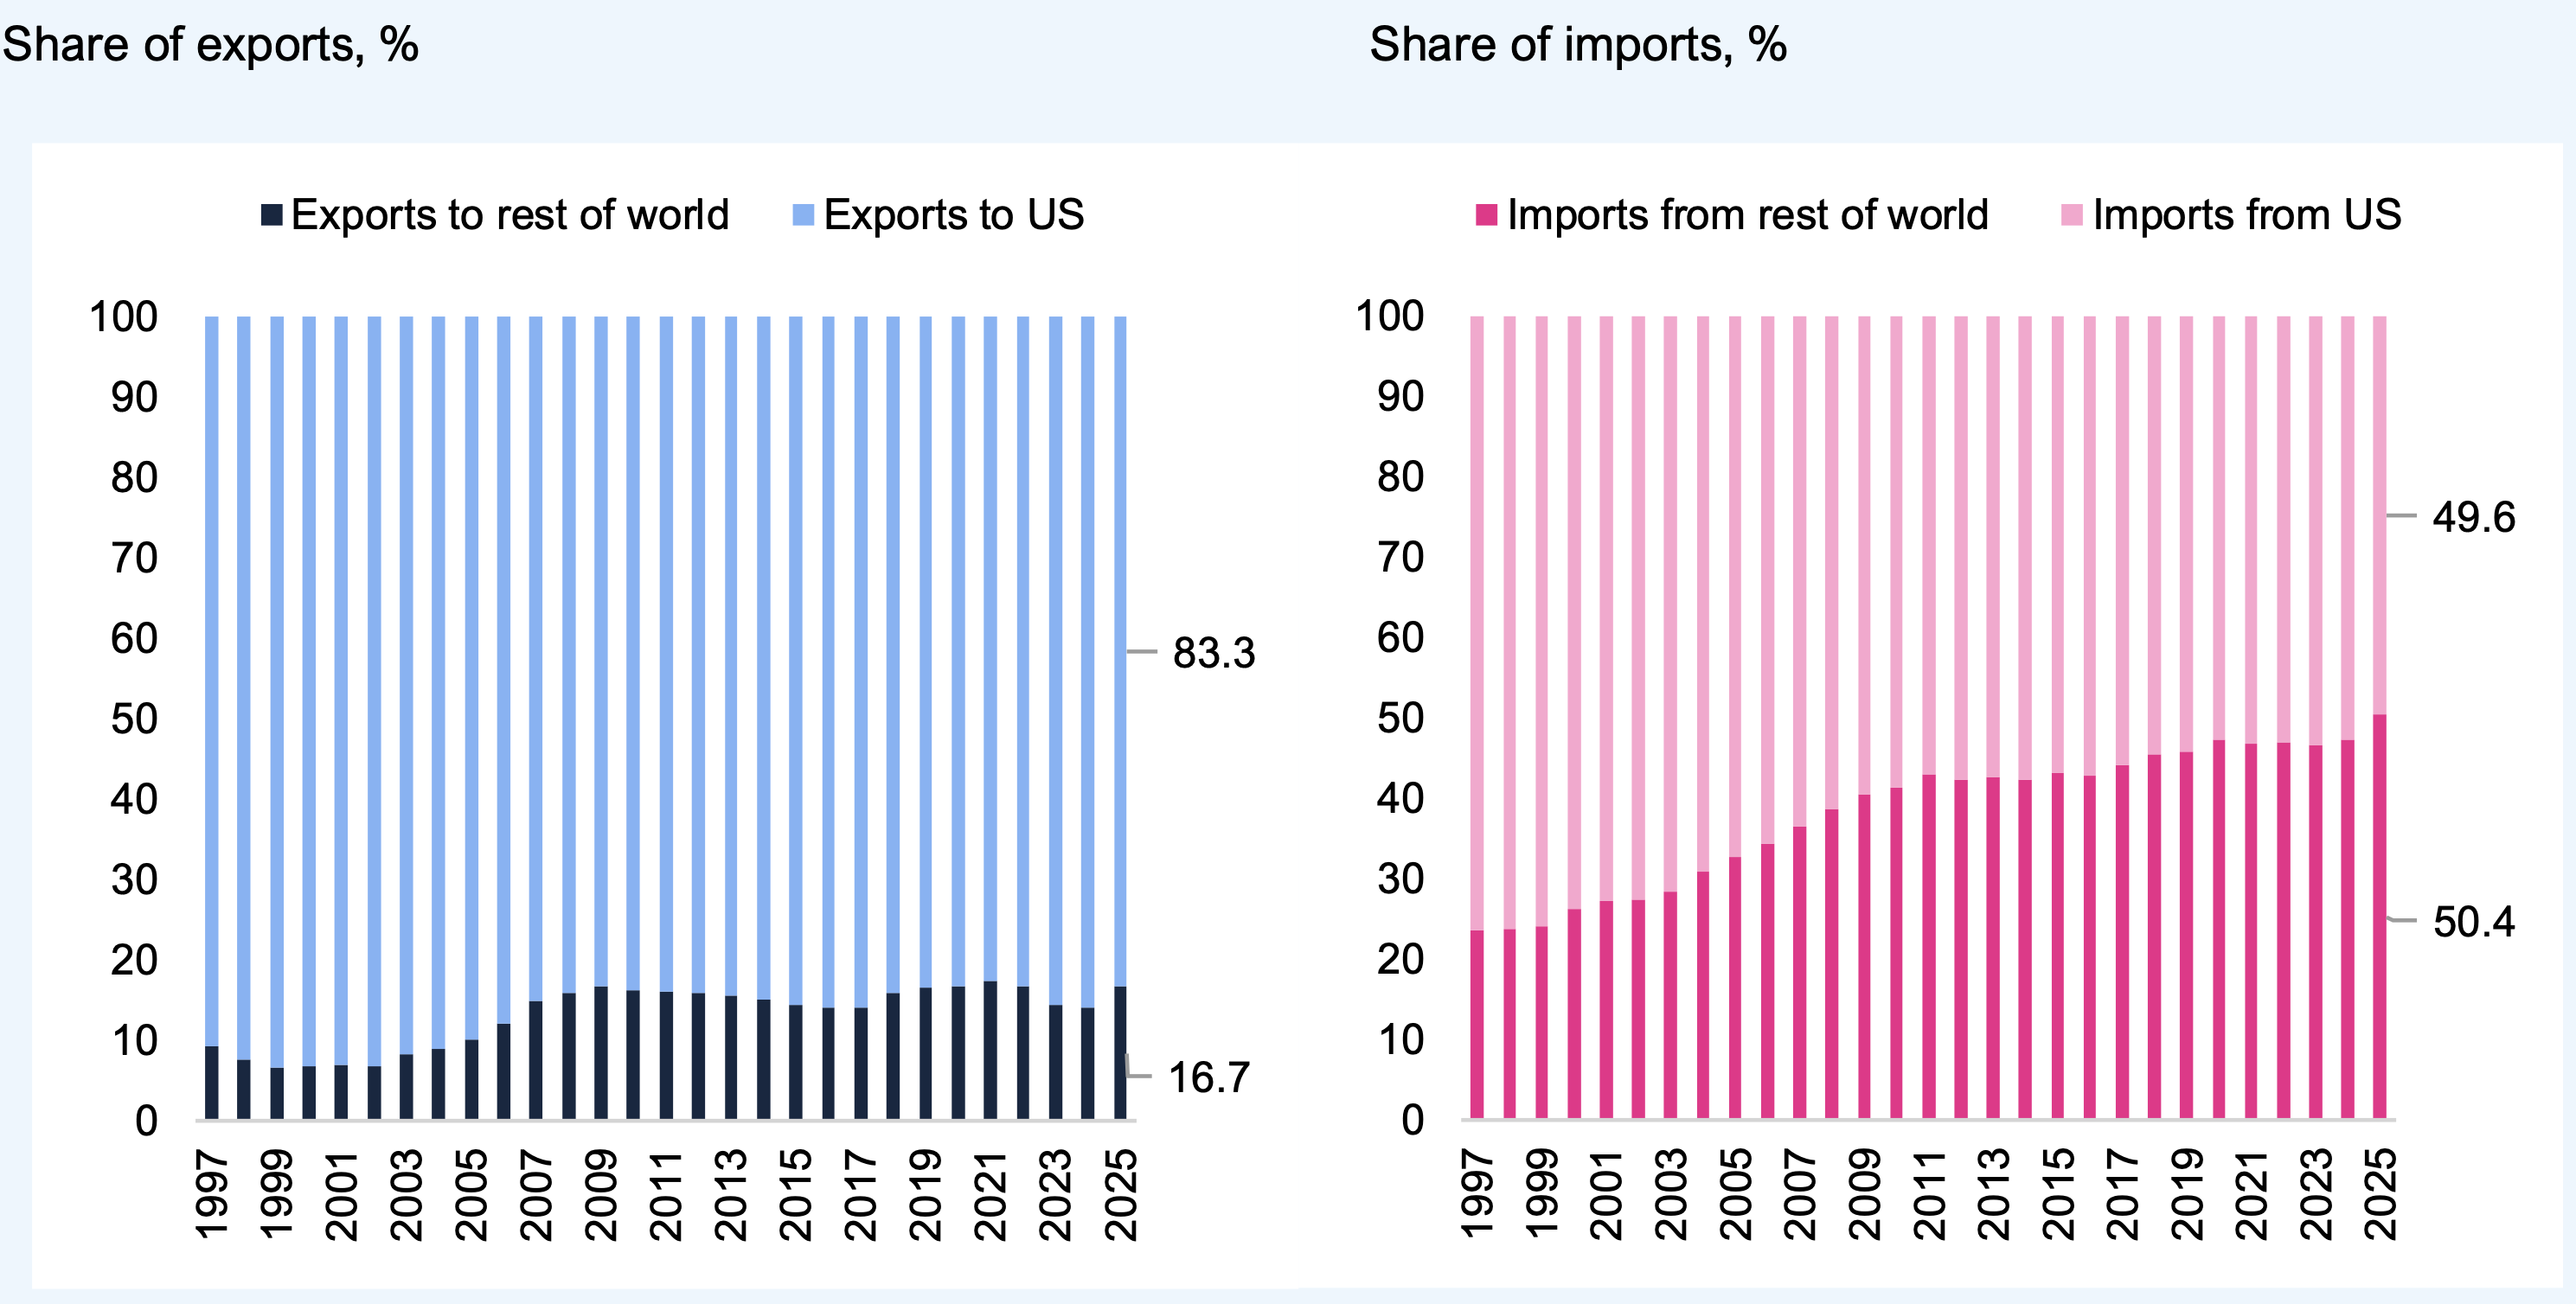
Note: Exports and imports figures in this textbox are estimated excluding gold.
Source: Statistics Canada Tables: 12-10-0175-01, 12-10-0163-01 and FAO.
Accessible version
| Share of exports, % | Exports to rest of world | Exports to US | Share of imports, % | Imports from US | Imports from rest of world |
|---|---|---|---|---|---|
| 1997 | 9.2 | 90.8 | 1997 | 76.4 | 23.6 |
| 1998 | 7.6 | 92.4 | 1998 | 76.2 | 23.8 |
| 1999 | 6.6 | 93.4 | 1999 | 76.0 | 24.0 |
| 2000 | 6.9 | 93.1 | 2000 | 73.8 | 26.2 |
| 2001 | 6.9 | 93.1 | 2001 | 72.8 | 27.2 |
| 2002 | 6.7 | 93.3 | 2002 | 72.6 | 27.4 |
| 2003 | 8.2 | 91.8 | 2003 | 71.5 | 28.5 |
| 2004 | 8.9 | 91.1 | 2004 | 69.1 | 30.9 |
| 2005 | 10.1 | 89.9 | 2005 | 67.3 | 32.7 |
| 2006 | 12.0 | 88.0 | 2006 | 65.7 | 34.3 |
| 2007 | 15.0 | 85.0 | 2007 | 63.5 | 36.5 |
| 2008 | 15.9 | 84.1 | 2008 | 61.2 | 38.8 |
| 2009 | 16.7 | 83.3 | 2009 | 59.5 | 40.5 |
| 2010 | 16.3 | 83.7 | 2010 | 58.6 | 41.4 |
| 2011 | 16.1 | 83.9 | 2011 | 56.9 | 43.1 |
| 2012 | 15.9 | 84.1 | 2012 | 57.6 | 42.4 |
| 2013 | 15.5 | 84.5 | 2013 | 57.4 | 42.6 |
| 2014 | 15.1 | 84.9 | 2014 | 57.7 | 42.3 |
| 2015 | 14.3 | 85.7 | 2015 | 56.9 | 43.1 |
| 2016 | 14.1 | 85.9 | 2016 | 57.2 | 42.8 |
| 2017 | 14.1 | 85.9 | 2017 | 55.8 | 44.2 |
| 2018 | 15.9 | 84.1 | 2018 | 54.5 | 45.5 |
| 2019 | 16.5 | 83.5 | 2019 | 54.2 | 45.8 |
| 2020 | 16.7 | 83.3 | 2020 | 52.7 | 47.3 |
| 2021 | 17.3 | 82.7 | 2021 | 53.1 | 46.9 |
| 2022 | 16.8 | 83.2 | 2022 | 53.0 | 47.0 |
| 2023 | 14.4 | 85.6 | 2023 | 53.3 | 46.7 |
| 2024 | 14.1 | 85.9 | 2024 | 52.7 | 47.3 |
| 2025 | 16.7 | 83.3 | 2025 | 49.6 | 50.4 |
Implications of Recent Economic Trends
After a 0.5% rise in real GDP in 2025 Q3, the latest economic indicators suggest Ontario’s economy was little changed in the fourth quarter of 2025.
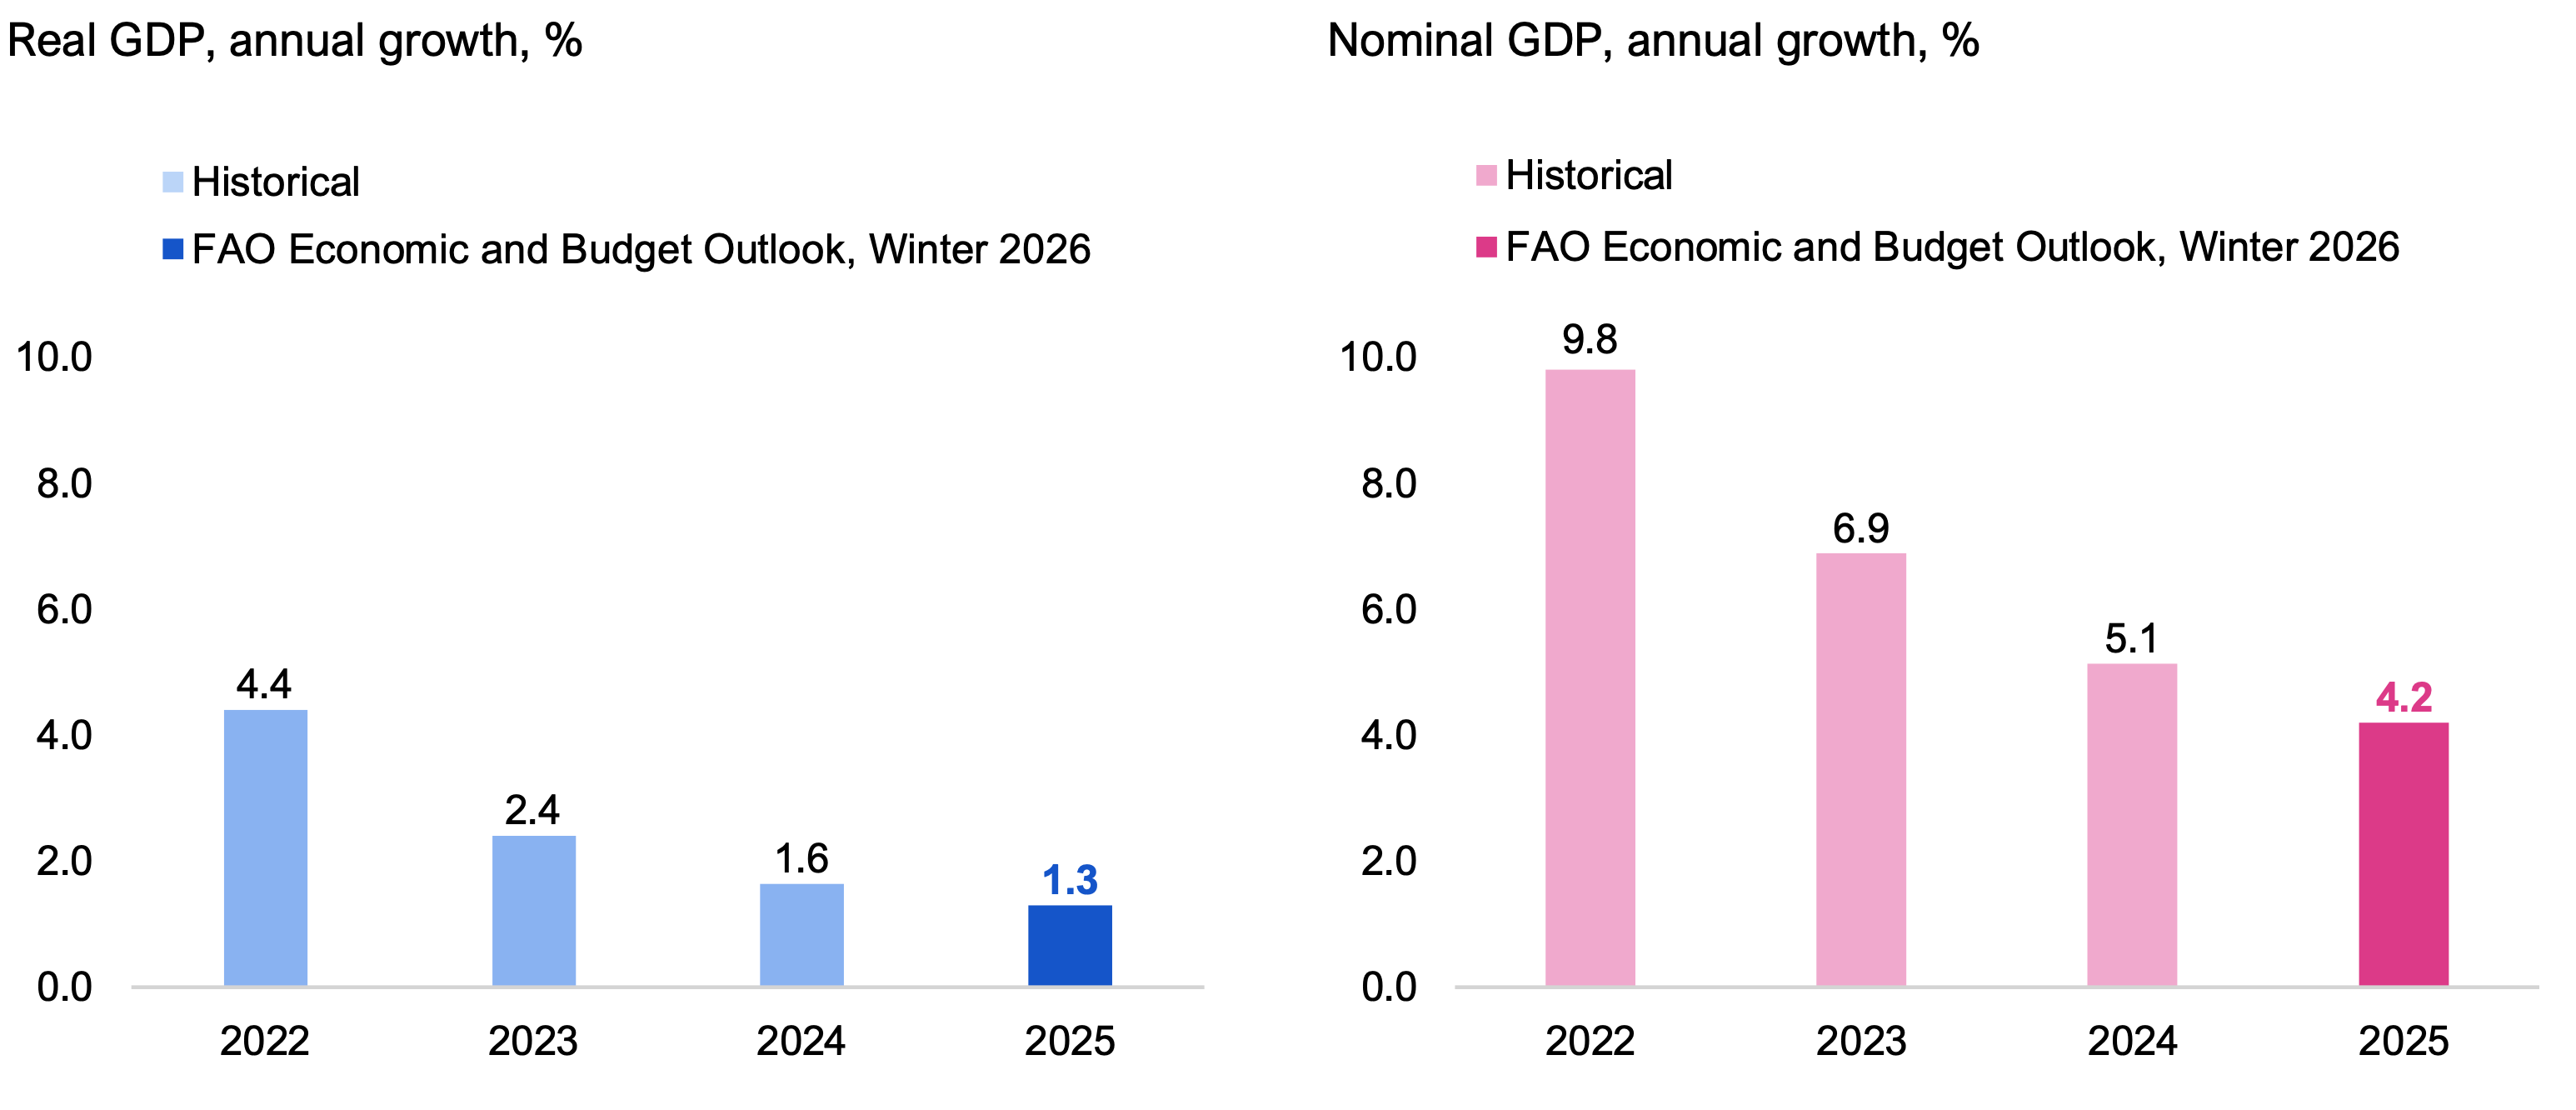
The FAO’s latest Economic and Budget Outlook[16] report projected that Ontario’s annual real GDP growth would slow from 1.6% in 2024 to 1.3% in 2025, while nominal GDP growth was expected to slow from 5.1% in 2024 to 4.2% in 2025. Economic activity in the fourth quarter of 2025 is largely consistent with the FAO’s projections. The FAO will continue to monitor Ontario’s economic performance and will update its forecast for economic growth in its next Economic and Budget Outlook report.
Figure 17 Recent economic trends are in line with the FAO’s latest economic growth projections
Source: Statistics Canada Table 36-10-0222-01 and FAO.
Accessible version
| Real GDP year-over-year growth, % | Historical | FAO Economic and Budget Outlook, Winter 2026 | Nominal GDP year-over-year growth, % | Historical | FAO Economic and Budget Outlook, Winter 2026 |
|---|---|---|---|---|---|
| 2022 | 4.4 | 2022 | 9.8 | ||
| 2023 | 2.4 | 2023 | 6.9 | ||
| 2024 | 1.6 | 2024 | 5.1 | ||
| 2025 | 1.3 | 2025 | 4.2 |
Glossary
Economic Indicators
- Gross Domestic Product (GDP)
- GDP is a broad indicator of economic activity that measures the value of goods and services produced by an economy. GDP is measured on both an expenditure and income basis.
- Employment and unemployment rate
- Employment from Statistics Canada’s Labour Force Survey estimates the number of individuals who did any work at a job or business (whether paid or unpaid) or those who had a job but were not at work due to factors unrelated to their job (e.g., their own illness or a labour dispute). The unemployment rate represents the number of people actively looking for work but not having a job as a proportion of the labour force. These two indicators are the most common measures of labour market performance.
- Average hourly wages
- Hourly wages are measured before taxes and other deductions, and include tips, commissions and bonuses for both hourly and salaried workers. This metric indicates wage inflation and labour market tightness.
- Retail sales
- Retail sales are the value of finished goods sold by retailers to the general public. This metric provides information on household spending by major commodity type.
- Housing resales
- Home resales data show the number of existing houses sold and is the most common measure of housing market activity.
- Housing prices
- The average price of existing houses sold. This metric is the most common measure of home prices that provides an indication of housing market strength.
- Housing starts
- Housing starts measures the number of housing units where construction has been started, including single and multiple unit dwellings. This metric provides a measure of change in the level of housing stock and can be compared to population growth to provide information on housing supply adequacy.
- Manufacturing sales
- The value of goods manufactured in Ontario that have been shipped to a customer.This metric is a measure of industrial production.
- Wholesale trade
- The value of merchandise sold in large quantities to retailers, businesses and institutional clients, such as governments. This metric provides insight into general business sector activity.
- International merchandise exports and imports
- The value of merchandise shipped out of the country from Ontario (exports) or into Ontario from outside the country (imports). International merchandise trade plays an important role in economic growth and provides information on the province’s competitiveness with other jurisdictions.
Technical Definitions
- Real dollars
- Values reflect prices after adjusting for inflation.
- Seasonally adjusted
- Data have been adjusted to reflect seasonal factors that may impact the data.
- Non-seasonally adjusted
- Data have not been adjusted to reflect seasonal factors.
- Year-over-year (Y/Y)
- Data from a particular time period are compared with data from the same time period a year ago. For example, Y/Y growth in 2023 Q4 would compare 2023 Q4 data with 2022 Q4 data. Using Y/Y data mostly removes the impact of seasonal factors.
- Quarter-over-quarter (Q/Q)
- Data compared from one quarter to the next. Q/Q growth in 2023 Q4 would compare 2023 Q4 data with 2023 Q3 data. Q/Q growth may suffer from seasonal factors unless data are seasonally adjusted.
Methodology
Data used in this report are primarily presented on a quarterly basis. For economic indicators that are adjusted for seasonality, growth is presented from one quarter to the next (Q/Q). For indicators that are not seasonally adjusted, growth is presented from the same quarter of the previous year (Y/Y) to avoid the impact of seasonal factors on economic trends. Indicators are presented in current dollars unless otherwise specified.
For some economic data, including retail sales, manufacturing sales and wholesale trade, the final month of the quarter may not yet be available at the time of the report’s publication. In these cases, Statistics Canada’s national preliminary estimate is used to estimate Ontario’s growth in that month.
Footnotes
[1] See the FAO’s Economic and Budget Outlook, Winter 2026.
[2] The Fiscal Sustainability, Transparency and Accountability Act, 2019 states that the quarterly Ontario Economic Accounts should be released within 45 days of Statistics Canada’s release of the National Income and Expenditure Accounts.
[3] Some of these data are regularly revised, and the growth rates presented in this report may differ from updated data published at a later date.
[4] Ontario’s real exports rose 0.2% in 2025 Q3 while real imports declined by 1.2%, resulting in an improvement in net trade. Excluding the impact of net trade (measured by final domestic demand in the Ontario Economic Accounts), Ontario’s economic growth slowed to 0.1% in 2025 Q3, the weakest quarterly pace since late 2023.
[5] See Bank of Canada’s Survey of Consumer Expectations—Third Quarter of 2025.
[6] See Bank of Canada’s Business Outlook Survey—Third Quarter of 2025.
[7] Source: Statistics Canada Table 14-10-0288-01 and FAO.
[8] Source: Statistics Canada Table 14-10-0355-01 and FAO.
[9] Long-term unemployment includes those unemployed who were looking for work or laid-off for 27 weeks or more. Statistics Canada Table 14-10-0342-01.
[10] Measured on a year-over-year basis.
[11] See Bank of Canada’s Canadian Survey of Consumer Expectations—Fourth Quarter of 2025.
[12] Canada Mortgage and Housing Corporation (CMHC) defines a housing unit as being a “structurally separate set of self-contained living premises [with] … a private entrance from outside the building or from a common hall, lobby or stairway inside the building. The entrance must be one that can be used without passing through another separate […] unit”. See CMHC’s Starts and Completions Survey and Market Absorption Survey Methodology.
[13] Source: Canada Mortgage and Housing Corporation, Seasonally-adjusted Starts (Canada and provinces).
[14] See Statistics Canada’s The Daily, Monthly Survey of Manufacturing, November 2025.
[15] Exports and imports have been adjusted to exclude gold. Rapidly rising gold prices through 2025 have sharply increased the value of gold exports and may not reflect underlying economic conditions, distorting Ontario’s trade performance. For more information, see Bank of Canada’s Monetary Policy Report – January 2026. If gold is included, exports to the US decreased 1.7%, exports to the rest of the world increased by 30.2%; imports from the US decreased 4.1%, and imports from the rest of the world increased 9.9%.
[16] See the FAO’s Economic and Budget Outlook, Winter 2026.