

Summary
- This report describes Ontario’s recent economic performance based on the latest economic indicators.
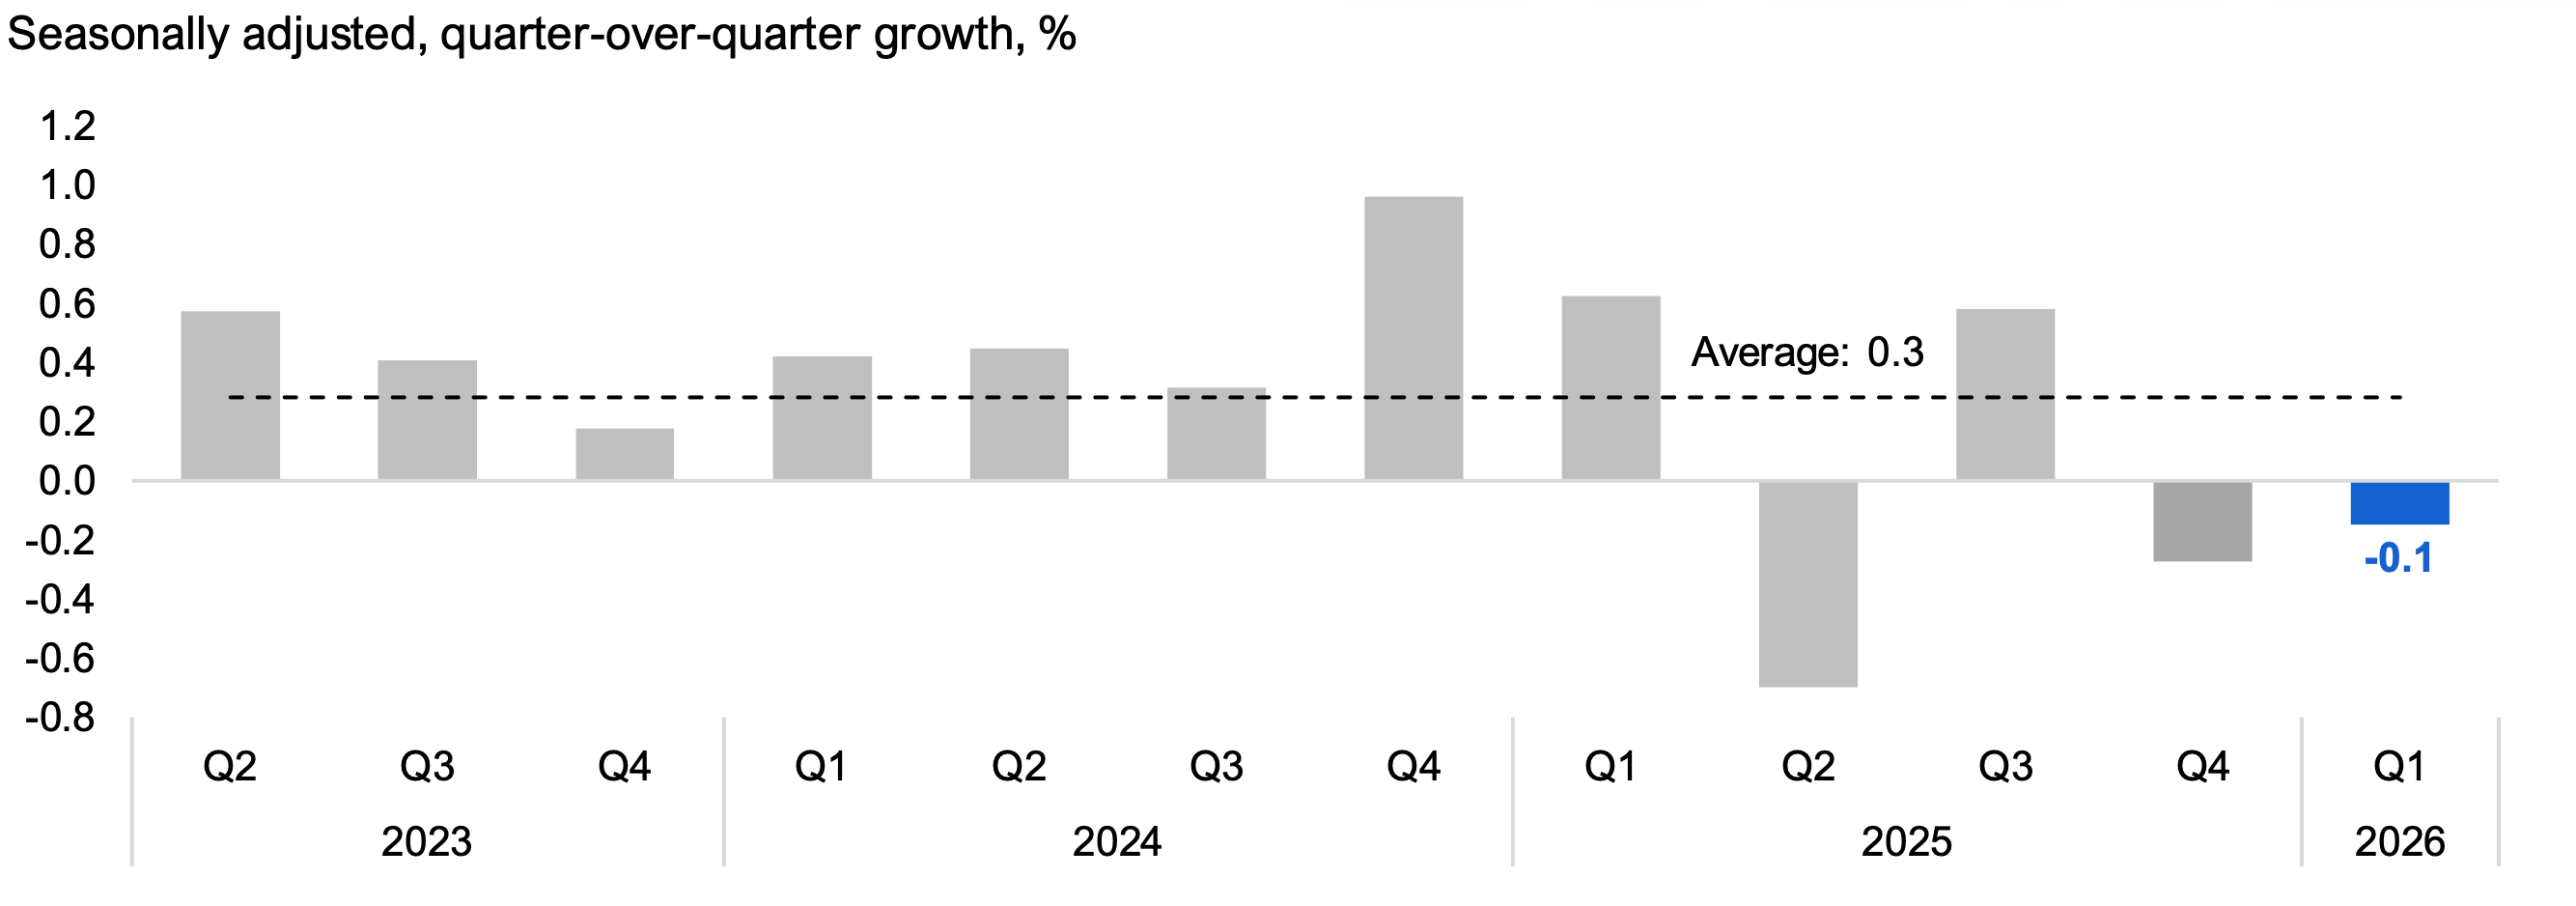
- In the first quarter of 2026, Ontario’s real Gross Domestic Product (GDP), the broadest measure of economic activity, decreased by 0.1% after a 0.3% decline in the previous quarter. This marks the first back-to-back decline in quarterly economic activity since the 2020 pandemic period and means that Ontario experienced a modest technical recession from 2025 Q4 to 2026 Q1.
- The latest economic indicators suggest Ontario’s economy advanced strongly in the second quarter of 2026, with notable gains in employment, retail sales, manufacturing sales, wholesale trade and the net trade of international goods.
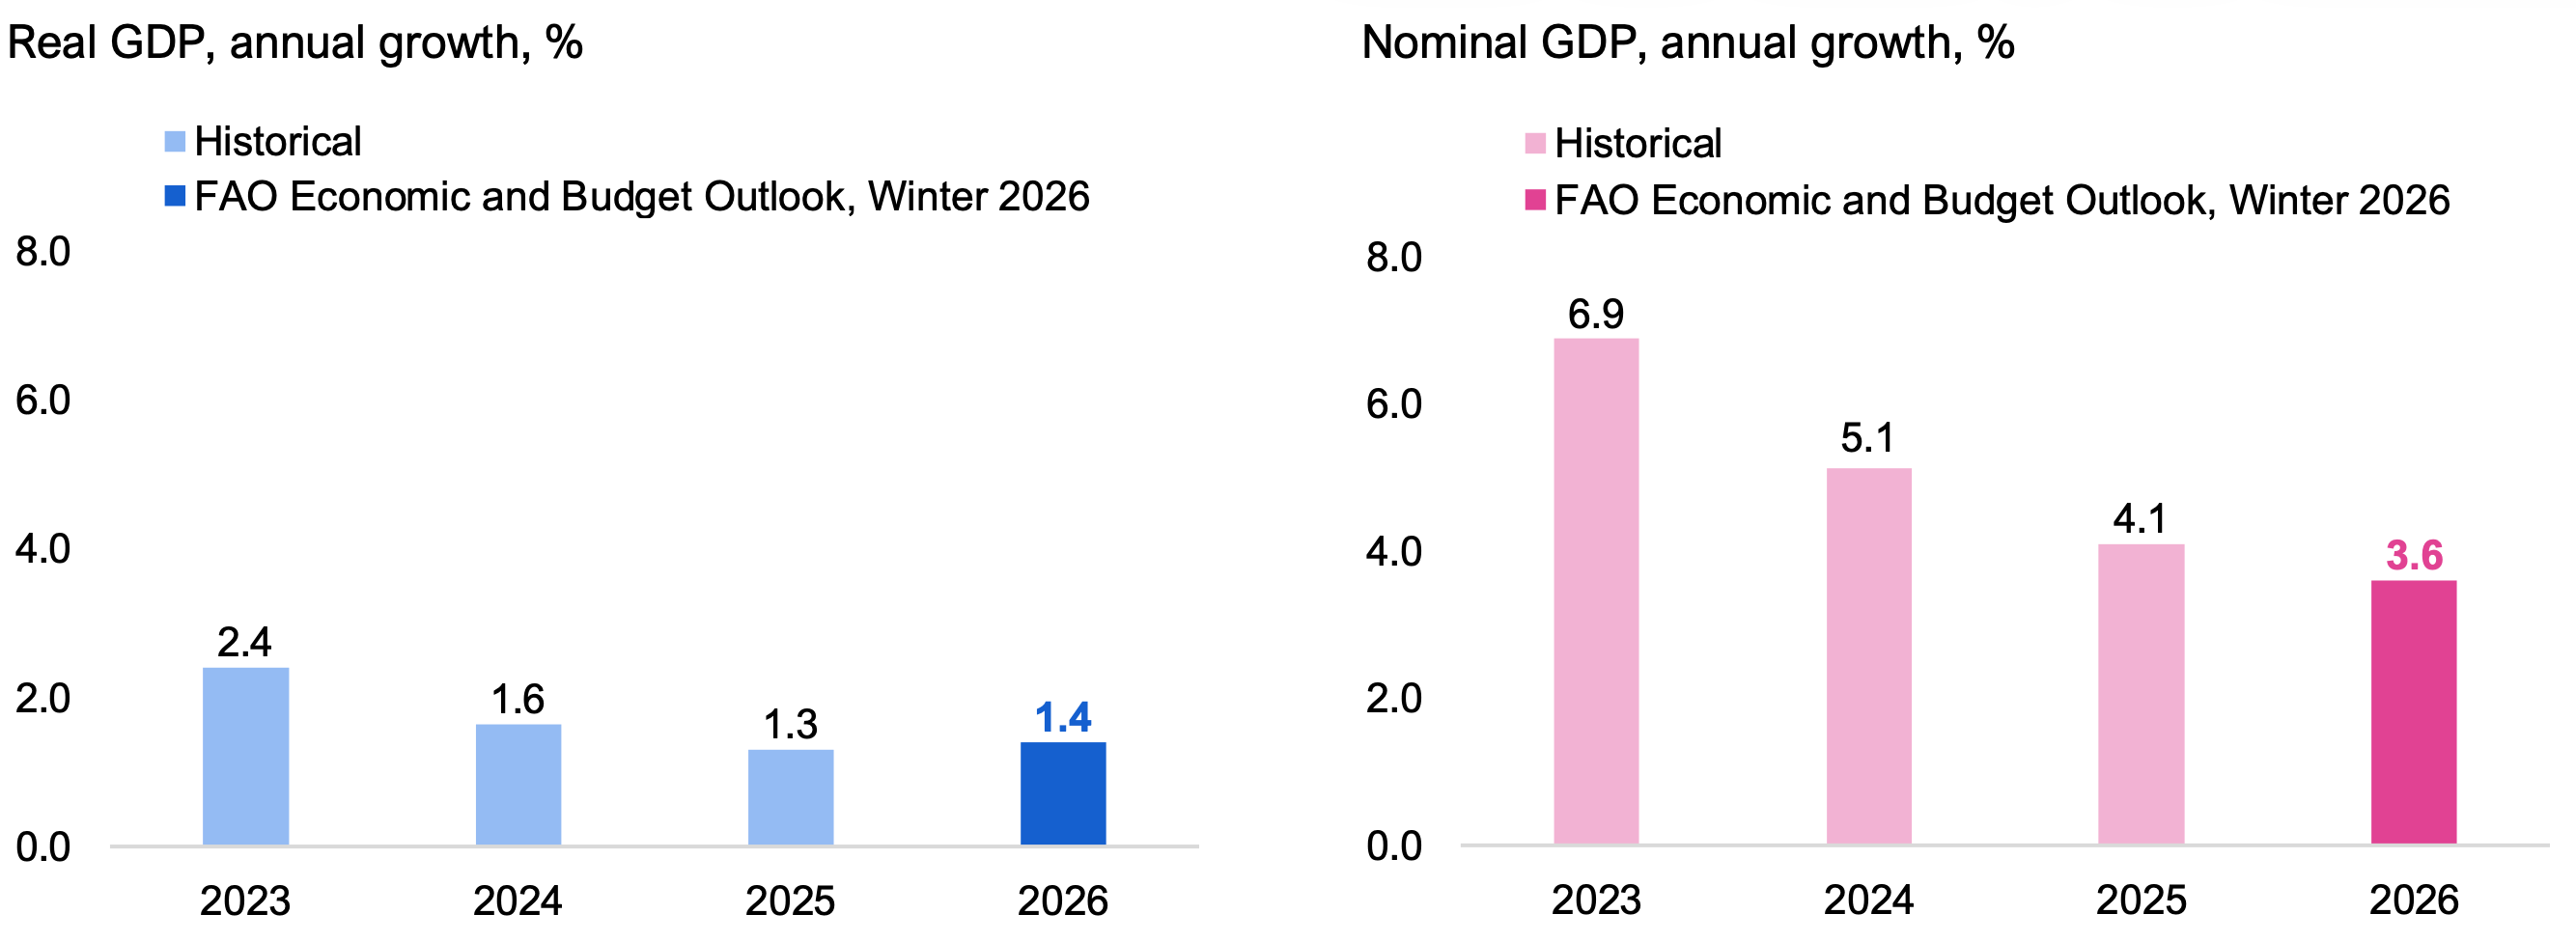
- The FAO’s latest Economic and Budget Outlook, released in February 2026, projected that Ontario’s annual real GDP would rise by 1.4% in 2026, while nominal GDP was expected to rise by 3.6%. Recent economic data and global events, including back-to-back quarterly declines in real GDP, a decline in Ontario’s population[1] and the dramatic increase in oil prices have put significant downside pressure on the FAO’s projection for 2026 economic growth.
Introduction and Background
The Ontario Economic Monitor presents an overview of the latest trends in the Ontario economy based on the most recent economic data as of August 14, 2026.
Each quarter, the Government of Ontario (the Province) releases the Ontario Economic Accounts (OEA), which provides data on GDP, a comprehensive measure of economic activity in Ontario. The OEA is produced by the Ontario Ministry of Finance and released approximately four months after the quarter closes.[2] The OEA is available on the Province’s Ontario Economic Accounts website.
In addition, Statistics Canada and other organizations produce many monthly economic indicators that provide insight into Ontario’s economy. These form part of the underlying data used to produce the OEA. This report focuses on these indicators, which are typically released one to two months after the data are collected, and provides more up-to-date information on Ontario’s economic performance in the most recent quarter.[3]
The report contains the following sections:
- a summary of the OEA describing Ontario’s economic performance in the first quarter of 2026 (2026 Q1);
- a summary of the most recent monthly economic indicators for Ontario’s households and businesses in 2026 Q2; and
- an assessment of the FAO’s latest economic outlook based on recent economic trends and geopolitical events.
For definitions of the economic indicators covered in this report, as well as technical definitions of economic concepts, see the report’s Glossary. For information on the data used, see the report’s Methodology.
2026 First Quarter Ontario Economic Accounts
The Ontario Economic Accounts (OEA) for the first quarter (January to March) of 2026 was released on July 10, 2026. The OEA provides a comprehensive assessment of Ontario’s recent economic performance.
Real Gross Domestic Product (GDP), the broadest measure of economic activity, decreased by 0.1% in 2026 Q1 after a 0.3% decline in the previous quarter. This marks the first back-to-back decline in quarterly economic activity since the 2020 pandemic period and means that Ontario experienced a modest technical recession from 2025 Q4 to 2026 Q1 (see textbox below). Several challenges have caused Ontario’s economy to struggle over the past year, including the impact of US tariffs, a declining population and elevated geopolitical uncertainty.
Figure 1 Real GDP decreased by 0.1% in 2026 Q1
Source: Ontario Economic Accounts and FAO.
Accessible version
| Seasonally adjusted, quarter-over-quarter growth, % | Average | |
|---|---|---|
| 2023 Q2 | 0.6 | 0.3 |
| 2023 Q3 | 0.4 | 0.3 |
| 2023 Q4 | 0.2 | 0.3 |
| 2024 Q1 | 0.4 | 0.3 |
| 2024 Q2 | 0.4 | 0.3 |
| 2024 Q3 | 0.3 | 0.3 |
| 2024 Q4 | 1.0 | 0.3 |
| 2025 Q1 | 0.6 | 0.3 |
| 2025 Q2 | -0.7 | 0.3 |
| 2025 Q3 | 0.6 | 0.3 |
| 2025 Q4 | -0.3 | 0.3 |
| 2026 Q1 | -0.1 | 0.3 |
Real GDP measures economic activity by adding up household consumption, business investment, government spending, net trade (exports less imports), and changes in inventories. The volume of spending in these categories excludes the effects of inflation, which helps identify underlying economic trends. The 0.1% decline in Ontario’s 2026 Q1 real GDP was due to offsetting changes in its main components:
- Household consumption grew modestly by 0.1%, driven mainly by growth in non-durable (0.8%) and services spending (0.4%).
- Business investment declined by 0.7%, mainly due to decreases in housing (-3.8%) and non-residential structures (-1.4%), partially offset by a 3.3% increase in machinery and equipment investment.
- Government spending by all levels (federal, provincial and municipal) declined by 0.5%, while capital expenditures by government declined by 2.5%.
- Total exports declined by 0.4%, with international exports falling by 0.8%, partially offset by a 0.4% increase in interprovincial exports.
- Total imports grew by 1.6%, with international imports increasing by 2.4%, partially offset by a 0.8% decline in interprovincial imports.
- Inventories increased by $3.8 billion, helping to partially offset the declines in the other categories of real GDP growth.
Ontario’s Economy Experienced a Technical Recession from 2025 Q4 to 2026 Q1
Periods of economic growth are eventually disrupted by recessions, when real GDP declines. Recessions can be measured by their length (the number of quarters during which real GDP declines) and depth (the total per cent decline in real GDP). Past recessions have occurred for different reasons and have had various depths and lengths.
Periods of declining real GDP that last for two consecutive quarters are commonly referred to as “technical recessions.” They are mainly caused by unique short-term factors. Examples include 2003, when an extensive electricity blackout and the SARS outbreak occurred, or the 2020 COVID-19 pandemic.
Economic downturns that last for three or more consecutive quarters can be referred to as “general recessions” and typically have more severe contractions in economic activity, with impacts across most sectors of the economy, alongside significant job losses. Examples include the recessions of the early 1980s, the early 1990s and the 2008-2009 financial crisis.
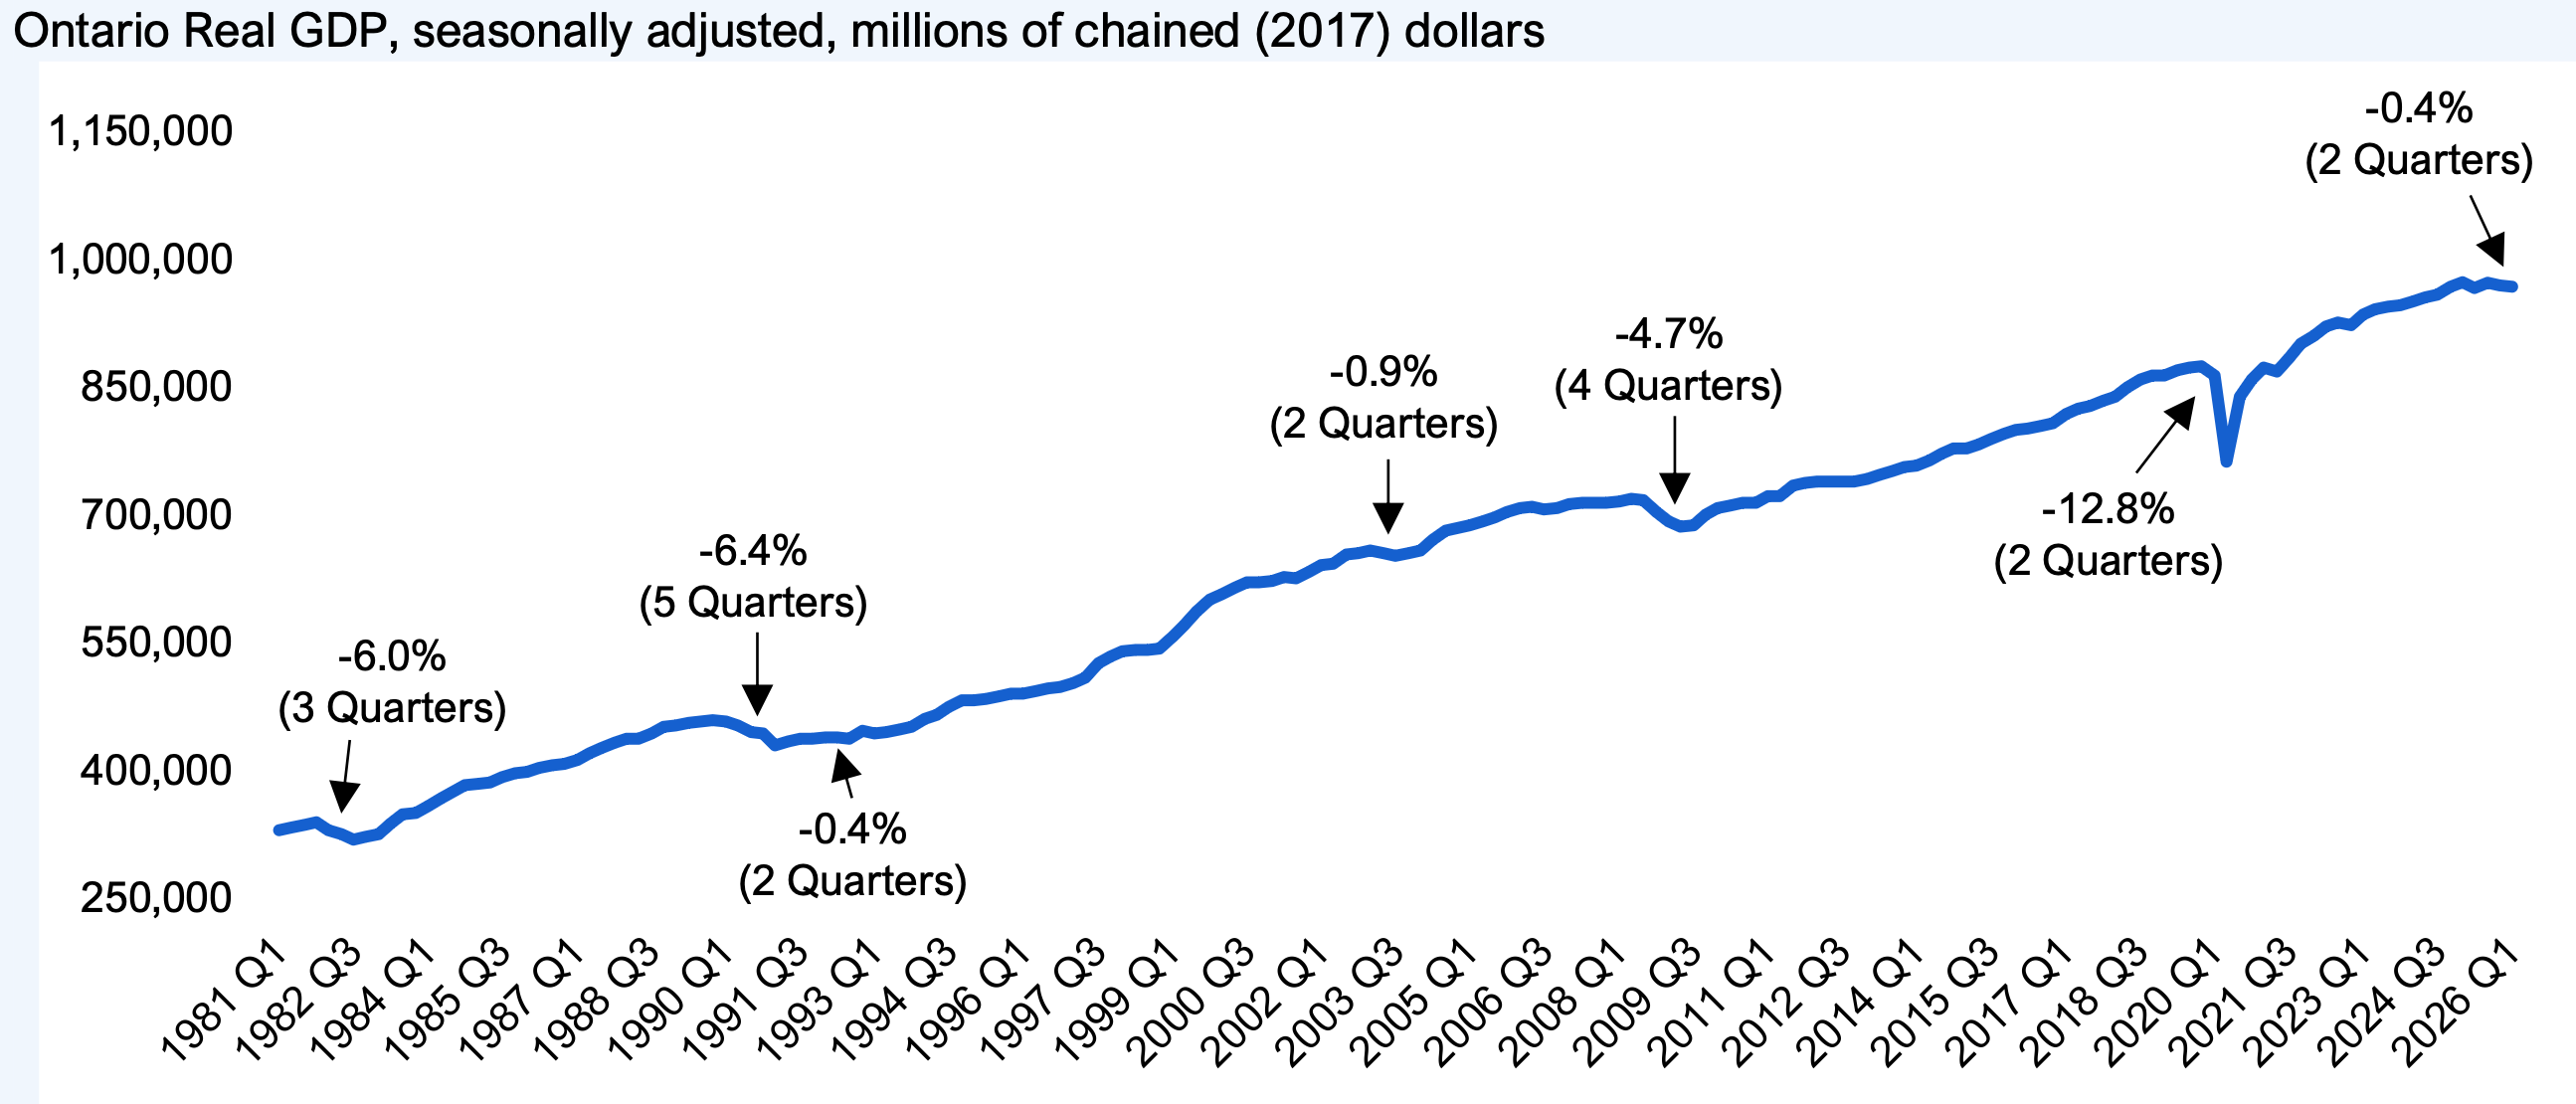
Ontario experienced a technical recession from 2025 Q4 to 2026 Q1 with real GDP declining by a total of 0.4%. This decline in economic activity reflected shifting factors rather than persistently broad negative trends over the whole period. For example, a large inventory drawdown was the main factor driving real GDP lower in 2025 Q4, while the decline in 2026 Q1 was largely due to lower net trade and government capital spending. Only residential and non-residential investment declined in both quarters.
To date, the current technical recession[4] (-0.4% total decline in real GDP) is similar to the 1992 technical recession (-0.4%), smaller than the 2003 technical recession (-0.9%), and much smaller than the general recessions in the early 1980s (-6.0%), early 1990s (‑6.4%) and the 2008-2009 financial crisis (-4.7%). The short but severe decline in economic activity during the COVID-19 pandemic shutdown (-12.8% over two quarters) was unique among all recessions.
Figure 2 Ontario has experienced seven recessions since 1981
Source: Ontario Economic Accounts and FAO.
Accessible version
| Ontario Real GDP, seasonally adjusted, millions of chained (2017) dollars | Recession periods, decline in real GDP | |
|---|---|---|
| 1981 Q1 | 329,265 | |
| 1981 Q2 | 332,830 | |
| 1981 Q3 | 335,333 | |
| 1981 Q4 | 338,117 | |
| 1982 Q1 | 329,620 | -6.0% |
| 1982 Q2 | 324,621 | |
| 1982 Q3 | 317,920 | |
| 1982 Q4 | 320,997 | |
| 1983 Q1 | 324,701 | |
| 1983 Q2 | 336,681 | |
| 1983 Q3 | 347,710 | |
| 1983 Q4 | 350,014 | |
| 1984 Q1 | 356,708 | |
| 1984 Q2 | 366,218 | |
| 1984 Q3 | 374,359 | |
| 1984 Q4 | 381,791 | |
| 1985 Q1 | 383,233 | |
| 1985 Q2 | 385,007 | |
| 1985 Q3 | 390,824 | |
| 1985 Q4 | 395,423 | |
| 1986 Q1 | 397,769 | |
| 1986 Q2 | 402,010 | |
| 1986 Q3 | 404,912 | |
| 1986 Q4 | 406,404 | |
| 1987 Q1 | 412,043 | |
| 1987 Q2 | 419,005 | |
| 1987 Q3 | 425,873 | |
| 1987 Q4 | 431,903 | |
| 1988 Q1 | 436,089 | |
| 1988 Q2 | 436,367 | |
| 1988 Q3 | 442,777 | |
| 1988 Q4 | 450,328 | |
| 1989 Q1 | 452,752 | |
| 1989 Q2 | 455,833 | |
| 1989 Q3 | 457,089 | |
| 1989 Q4 | 458,521 | |
| 1990 Q1 | 456,480 | -6.4% |
| 1990 Q2 | 452,305 | |
| 1990 Q3 | 444,532 | |
| 1990 Q4 | 442,134 | |
| 1991 Q1 | 428,956 | |
| 1991 Q2 | 432,688 | |
| 1991 Q3 | 436,708 | |
| 1991 Q4 | 436,943 | |
| 1992 Q1 | 438,205 | |
| 1992 Q2 | 437,497 | -0.4% |
| 1992 Q3 | 436,530 | |
| 1992 Q4 | 446,352 | |
| 1993 Q1 | 442,370 | |
| 1993 Q2 | 443,955 | |
| 1993 Q3 | 447,207 | |
| 1993 Q4 | 450,204 | |
| 1994 Q1 | 460,220 | |
| 1994 Q2 | 464,818 | |
| 1994 Q3 | 474,035 | |
| 1994 Q4 | 481,626 | |
| 1995 Q1 | 482,181 | |
| 1995 Q2 | 483,181 | |
| 1995 Q3 | 486,362 | |
| 1995 Q4 | 489,717 | |
| 1996 Q1 | 488,765 | |
| 1996 Q2 | 492,054 | |
| 1996 Q3 | 495,358 | |
| 1996 Q4 | 496,916 | |
| 1997 Q1 | 501,755 | |
| 1997 Q2 | 508,632 | |
| 1997 Q3 | 524,519 | |
| 1997 Q4 | 533,657 | |
| 1998 Q1 | 539,679 | |
| 1998 Q2 | 540,106 | |
| 1998 Q3 | 541,137 | |
| 1998 Q4 | 541,683 | |
| 1999 Q1 | 556,192 | |
| 1999 Q2 | 570,389 | |
| 1999 Q3 | 585,766 | |
| 1999 Q4 | 599,910 | |
| 2000 Q1 | 605,362 | |
| 2000 Q2 | 613,666 | |
| 2000 Q3 | 619,579 | |
| 2000 Q4 | 620,063 | |
| 2001 Q1 | 621,173 | |
| 2001 Q2 | 625,846 | |
| 2001 Q3 | 624,704 | |
| 2001 Q4 | 631,949 | |
| 2002 Q1 | 640,488 | |
| 2002 Q2 | 642,433 | |
| 2002 Q3 | 652,010 | |
| 2002 Q4 | 654,207 | |
| 2003 Q1 | 657,790 | |
| 2003 Q2 | 654,653 | -0.9% |
| 2003 Q3 | 651,622 | |
| 2003 Q4 | 653,747 | |
| 2004 Q1 | 657,763 | |
| 2004 Q2 | 670,025 | |
| 2004 Q3 | 680,312 | |
| 2004 Q4 | 683,209 | |
| 2005 Q1 | 686,697 | |
| 2005 Q2 | 692,033 | |
| 2005 Q3 | 697,022 | |
| 2005 Q4 | 702,034 | |
| 2006 Q1 | 707,874 | |
| 2006 Q2 | 708,372 | |
| 2006 Q3 | 705,815 | |
| 2006 Q4 | 707,807 | |
| 2007 Q1 | 711,471 | |
| 2007 Q2 | 713,437 | |
| 2007 Q3 | 713,676 | |
| 2007 Q4 | 713,434 | |
| 2008 Q1 | 715,086 | |
| 2008 Q2 | 718,428 | |
| 2008 Q3 | 716,040 | -4.7% |
| 2008 Q4 | 702,404 | |
| 2009 Q1 | 692,013 | |
| 2009 Q2 | 684,894 | |
| 2009 Q3 | 686,419 | |
| 2009 Q4 | 700,082 | |
| 2010 Q1 | 707,685 | |
| 2010 Q2 | 709,780 | |
| 2010 Q3 | 713,375 | |
| 2010 Q4 | 714,110 | |
| 2011 Q1 | 722,025 | |
| 2011 Q2 | 721,201 | |
| 2011 Q3 | 733,175 | |
| 2011 Q4 | 737,226 | |
| 2012 Q1 | 737,654 | |
| 2012 Q2 | 738,039 | |
| 2012 Q3 | 738,139 | |
| 2012 Q4 | 738,174 | |
| 2013 Q1 | 741,418 | |
| 2013 Q2 | 745,697 | |
| 2013 Q3 | 750,397 | |
| 2013 Q4 | 755,610 | |
| 2014 Q1 | 756,934 | |
| 2014 Q2 | 763,296 | |
| 2014 Q3 | 771,209 | |
| 2014 Q4 | 776,761 | |
| 2015 Q1 | 778,025 | |
| 2015 Q2 | 781,653 | |
| 2015 Q3 | 788,671 | |
| 2015 Q4 | 795,114 | |
| 2016 Q1 | 799,523 | |
| 2016 Q2 | 800,093 | |
| 2016 Q3 | 803,352 | |
| 2016 Q4 | 806,492 | |
| 2017 Q1 | 817,041 | |
| 2017 Q2 | 823,336 | |
| 2017 Q3 | 826,775 | |
| 2017 Q4 | 832,762 | |
| 2018 Q1 | 838,607 | |
| 2018 Q2 | 849,510 | |
| 2018 Q3 | 857,619 | |
| 2018 Q4 | 862,381 | |
| 2019 Q1 | 863,199 | |
| 2019 Q2 | 869,587 | |
| 2019 Q3 | 873,035 | |
| 2019 Q4 | 873,347 | |
| 2020 Q1 | 863,535 | |
| 2020 Q2 | 761,944 | |
| 2020 Q3 | 837,982 | |
| 2020 Q4 | 857,597 | |
| 2021 Q1 | 871,619 | |
| 2021 Q2 | 867,355 | |
| 2021 Q3 | 883,150 | |
| 2021 Q4 | 900,484 | |
| 2022 Q1 | 909,740 | -12.8% |
| 2022 Q2 | 920,651 | |
| 2022 Q3 | 924,611 | |
| 2022 Q4 | 922,797 | |
| 2023 Q1 | 935,213 | |
| 2023 Q2 | 940,556 | |
| 2023 Q3 | 944,384 | |
| 2023 Q4 | 946,035 | |
| 2024 Q1 | 950,009 | |
| 2024 Q2 | 954,256 | |
| 2024 Q3 | 957,262 | |
| 2024 Q4 | 966,458 | |
| 2025 Q1 | 972,495 | |
| 2025 Q2 | 965,705 | |
| 2025 Q3 | 971,314 | |
| 2025 Q4 | 968,660 | -0.4% |
| 2026 Q1 | 967,222 |
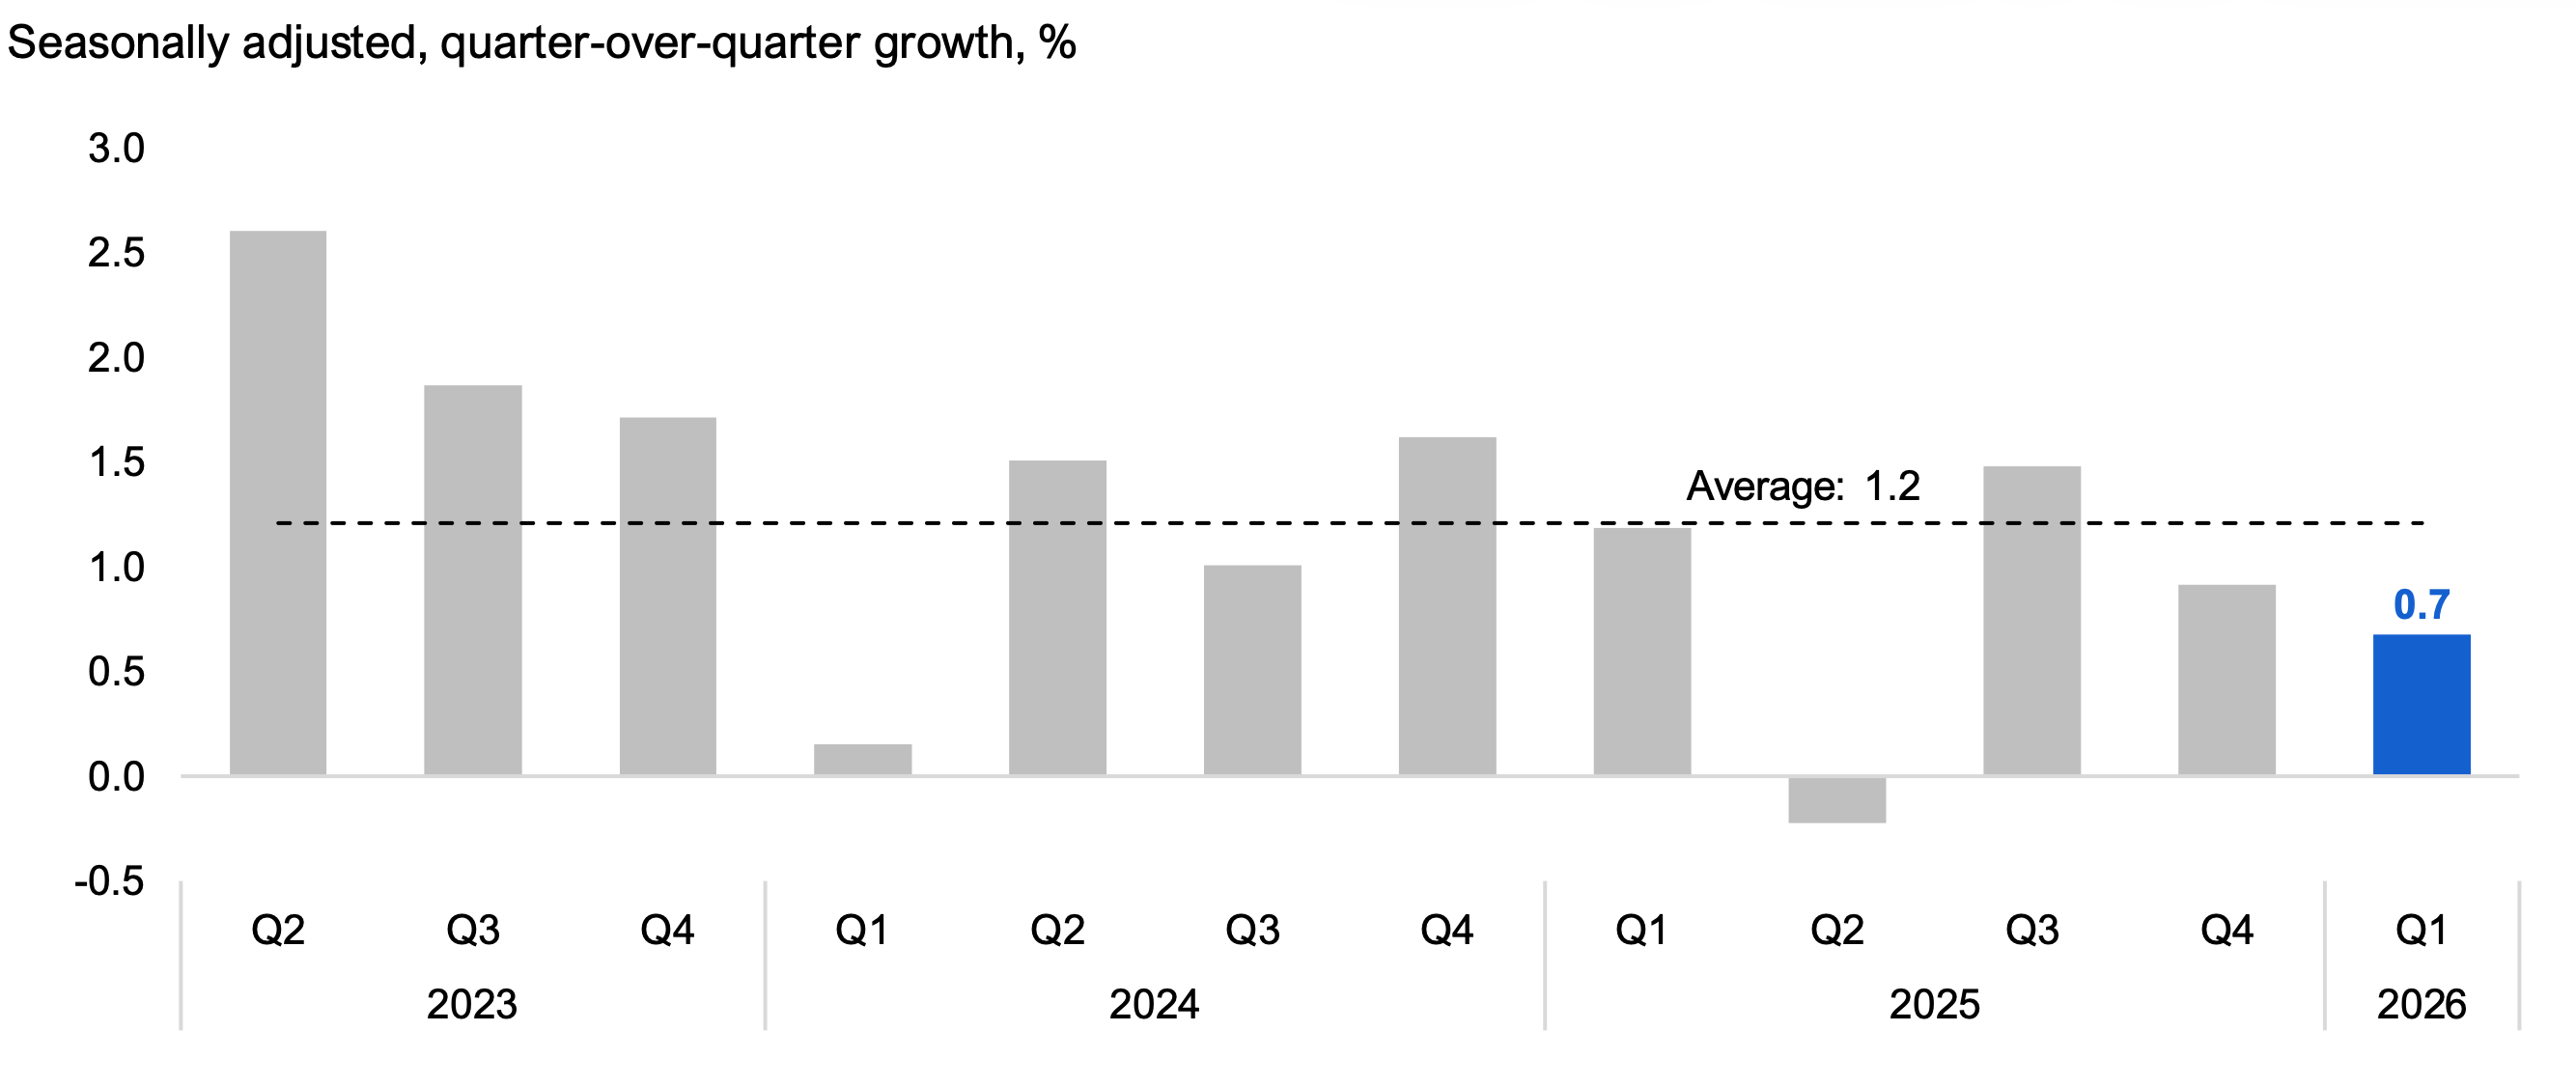
Nominal GDP, the broadest measure of the tax base and which includes inflation, increased by 0.7% in 2026 Q1, slowing from a gain of 0.9% in the previous quarter. Ontario’s nominal GDP growth has been slowing over the past 12 quarters, in part due to the Bank of Canada raising interest rates starting in 2022 and the introduction of US tariffs in 2025.
Figure 3 Nominal GDP increased by 0.7% in 2026 Q1
Source: Ontario Economic Accounts and FAO.
Accessible version
| Seasonally adjusted, quarter-over-quarter growth, % | Average | |
|---|---|---|
| 2023 Q2 | 2.6 | 1.2 |
| 2023 Q3 | 1.9 | 1.2 |
| 2023 Q4 | 1.7 | 1.2 |
| 2024 Q1 | 0.2 | 1.2 |
| 2024 Q2 | 1.5 | 1.2 |
| 2024 Q3 | 1.0 | 1.2 |
| 2024 Q4 | 1.6 | 1.2 |
| 2025 Q1 | 1.2 | 1.2 |
| 2025 Q2 | -0.2 | 1.2 |
| 2025 Q3 | 1.5 | 1.2 |
| 2025 Q4 | 0.9 | 1.2 |
| 2026 Q1 | 0.7 | 1.2 |
On an income basis,[5] nominal GDP is measured by adding up all the income earned in the economy, including labour income,[6] corporate profits,[7] net mixed income,[8] as well as other forms of income. In 2026 Q1:
- Labour income grew by 0.8% driven by ongoing hourly wage gains that were partially tempered by employment losses.
- Corporate profits grew by 0.9%, moderating from a 1.8% gain in the previous quarter.
- Net mixed income declined by 1.5%, following a 2.0% gain in 2025 Q4.
- All other forms of income grew by 1.0%.
For more detailed information on Ontario’s economic performance in 2026 Q1, see the Ontario Economic Accounts.
Ontario’s 2026 Second Quarter Economic Indicators
The latest economic indicators suggest Ontario’s economy advanced strongly in the second quarter of 2026, with notable gains in both household and business activity.
Households
Employment in Ontario increased by a significant 61,900 jobs (or 0.8%) in 2026 Q2, after a decrease of 52,900 jobs in the previous quarter. Job gains were the result of a 74,300 increase in full-time positions, which outweighed a loss of 12,400 part-time positions. Job gains were concentrated in the private sector (48,600) and self-employment (17,000), partially offset by a decline in the public sector (-3,600).[9]
Figure 4 Employment increased by 61,900 jobs in 2026 Q2
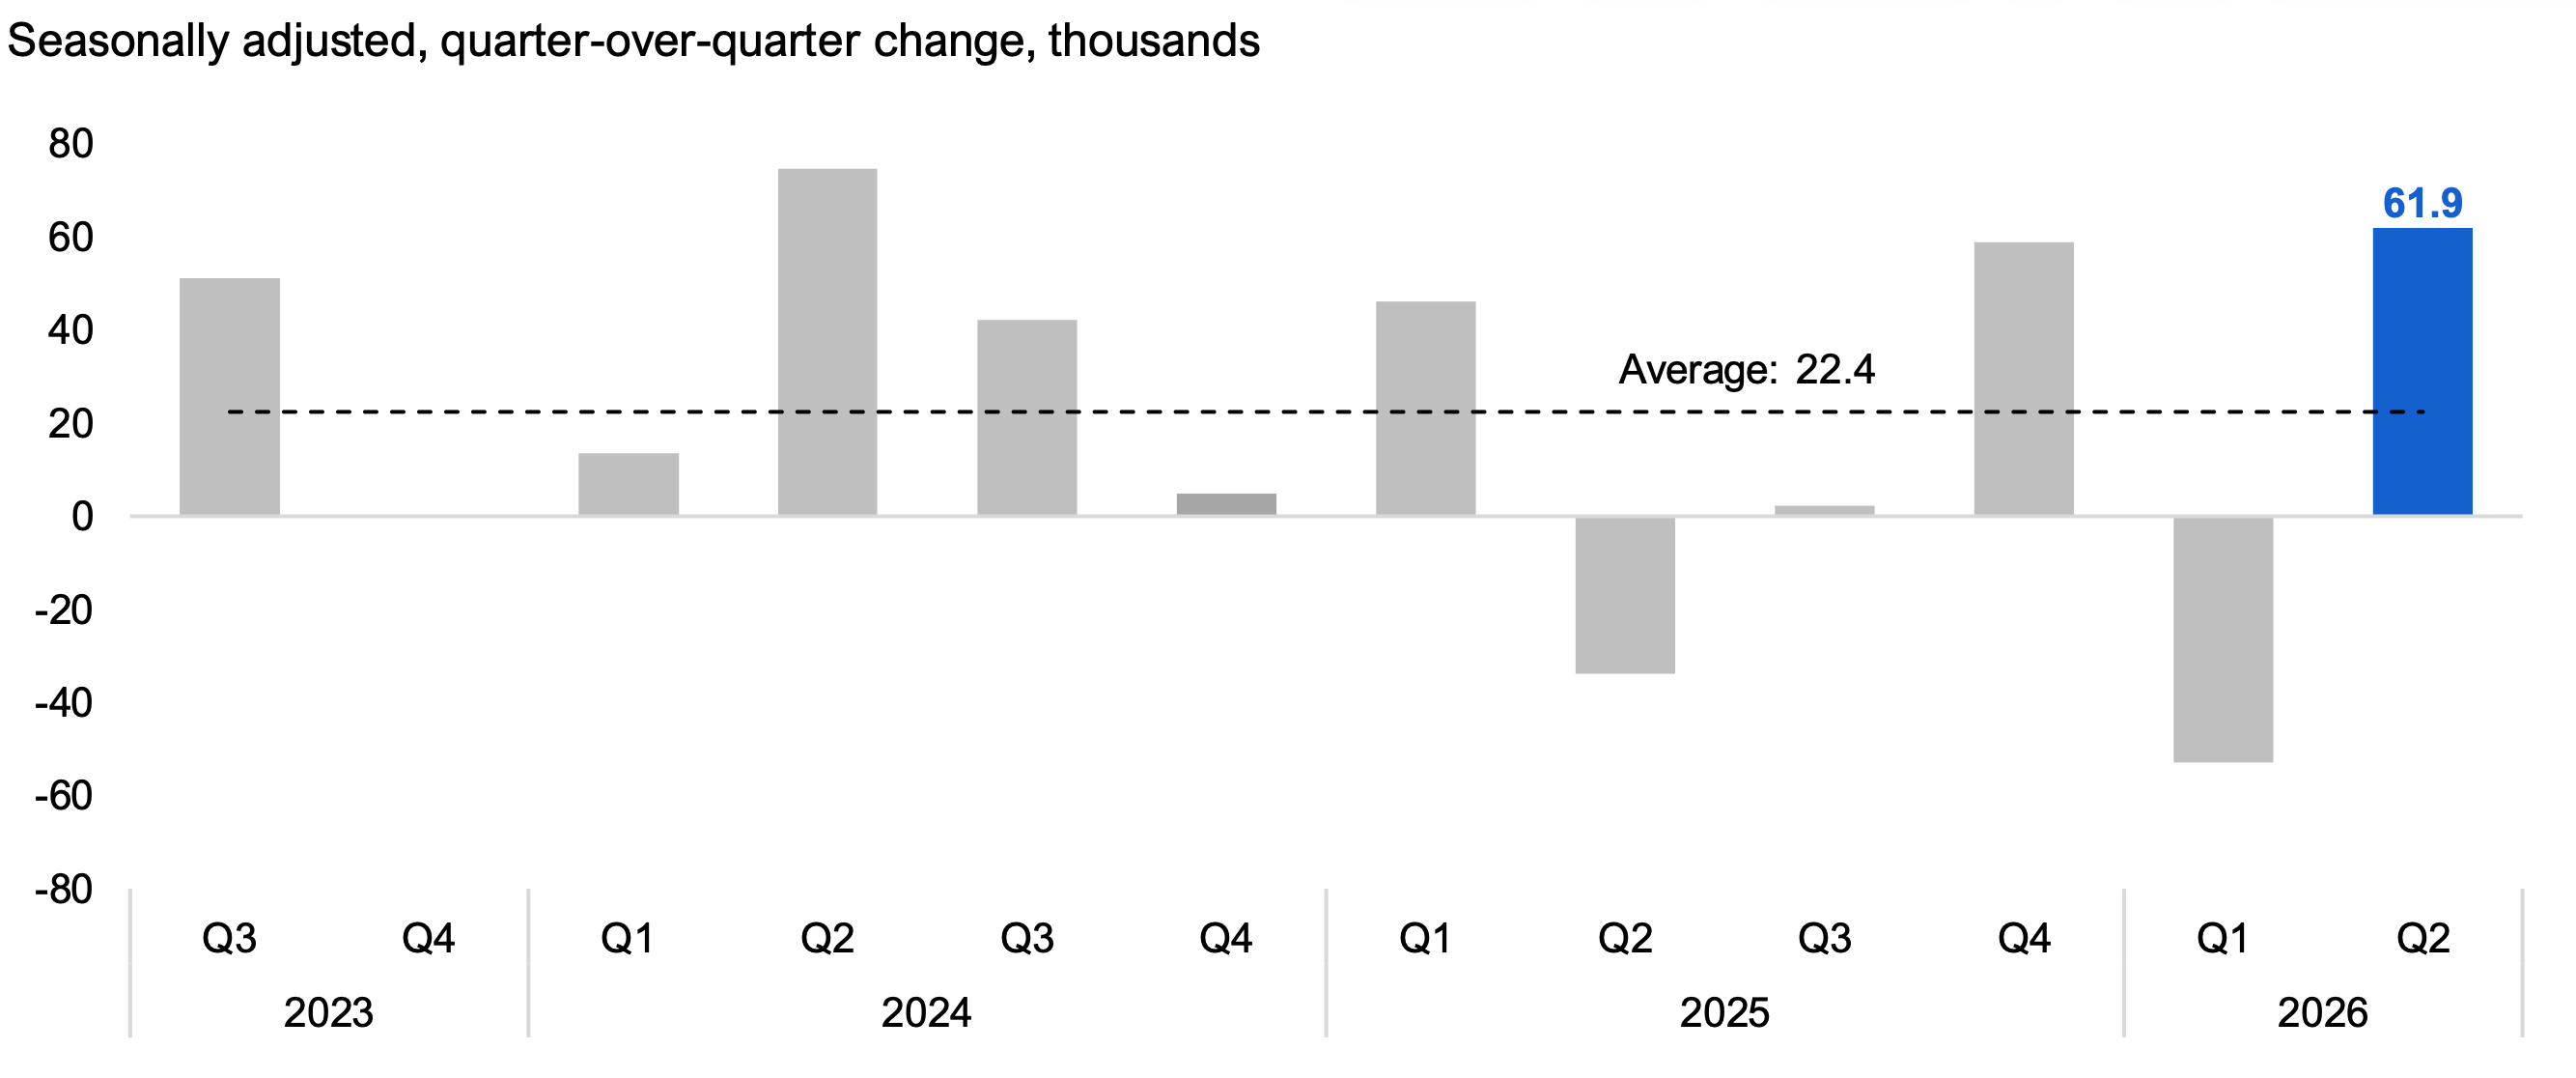
Source: Statistics Canada Table 14-10-0287-01 and FAO.
Accessible version
| Seasonally adjusted, quarter-over-quarter change, thousands | Average | |
|---|---|---|
| 2023 Q3 | 51.3 | 22.4 |
| 2023 Q4 | 0.1 | 22.4 |
| 2024 Q1 | 13.5 | 22.4 |
| 2024 Q2 | 74.6 | 22.4 |
| 2024 Q3 | 42.2 | 22.4 |
| 2024 Q4 | 4.9 | 22.4 |
| 2025 Q1 | 46.1 | 22.4 |
| 2025 Q2 | -33.8 | 22.4 |
| 2025 Q3 | 2.3 | 22.4 |
| 2025 Q4 | 58.9 | 22.4 |
| 2026 Q1 | -52.9 | 22.4 |
| 2026 Q2 | 61.9 | 22.4 |
By major age group, job gains in 2026 Q2 were concentrated in core-age workers (aged 25 to 54) with employment increasing by 63,300. Employment of youth (aged 15 to 24) increased modestly by 900 jobs but declined among older workers aged 55 and over (-2,300).
Ontario saw employment increases across several major industries in 2026 Q2, with the largest gains recorded in health care (25,600); finance, insurance, and real estate (15,400); manufacturing (14,100); professional, scientific and technical services (8,700); and business, building and other support services (6,600).[10] These gains were partially offset by losses in wholesale and retail trade (-14,500), construction (-4,100), and utilities (-2,700).
Ontario’s labour force increased by 35,600 (0.4%) in 2026 Q2. With job growth exceeding the number of people entering the labour force, Ontario’s unemployment rate declined by 0.3 percentage points from 7.5% in 2026 Q1 to 7.2% in 2026 Q2, the lowest rate in nearly two years. The unemployment rate declined for both core-age workers (from 6.6% to 6.1%) and youth (from 15.9% to 15.7%). In contrast, the unemployment rate of older workers increased by 0.1 percentage points to 4.8%.
Figure 5 Unemployment rate declined to 7.2% in 2026 Q2
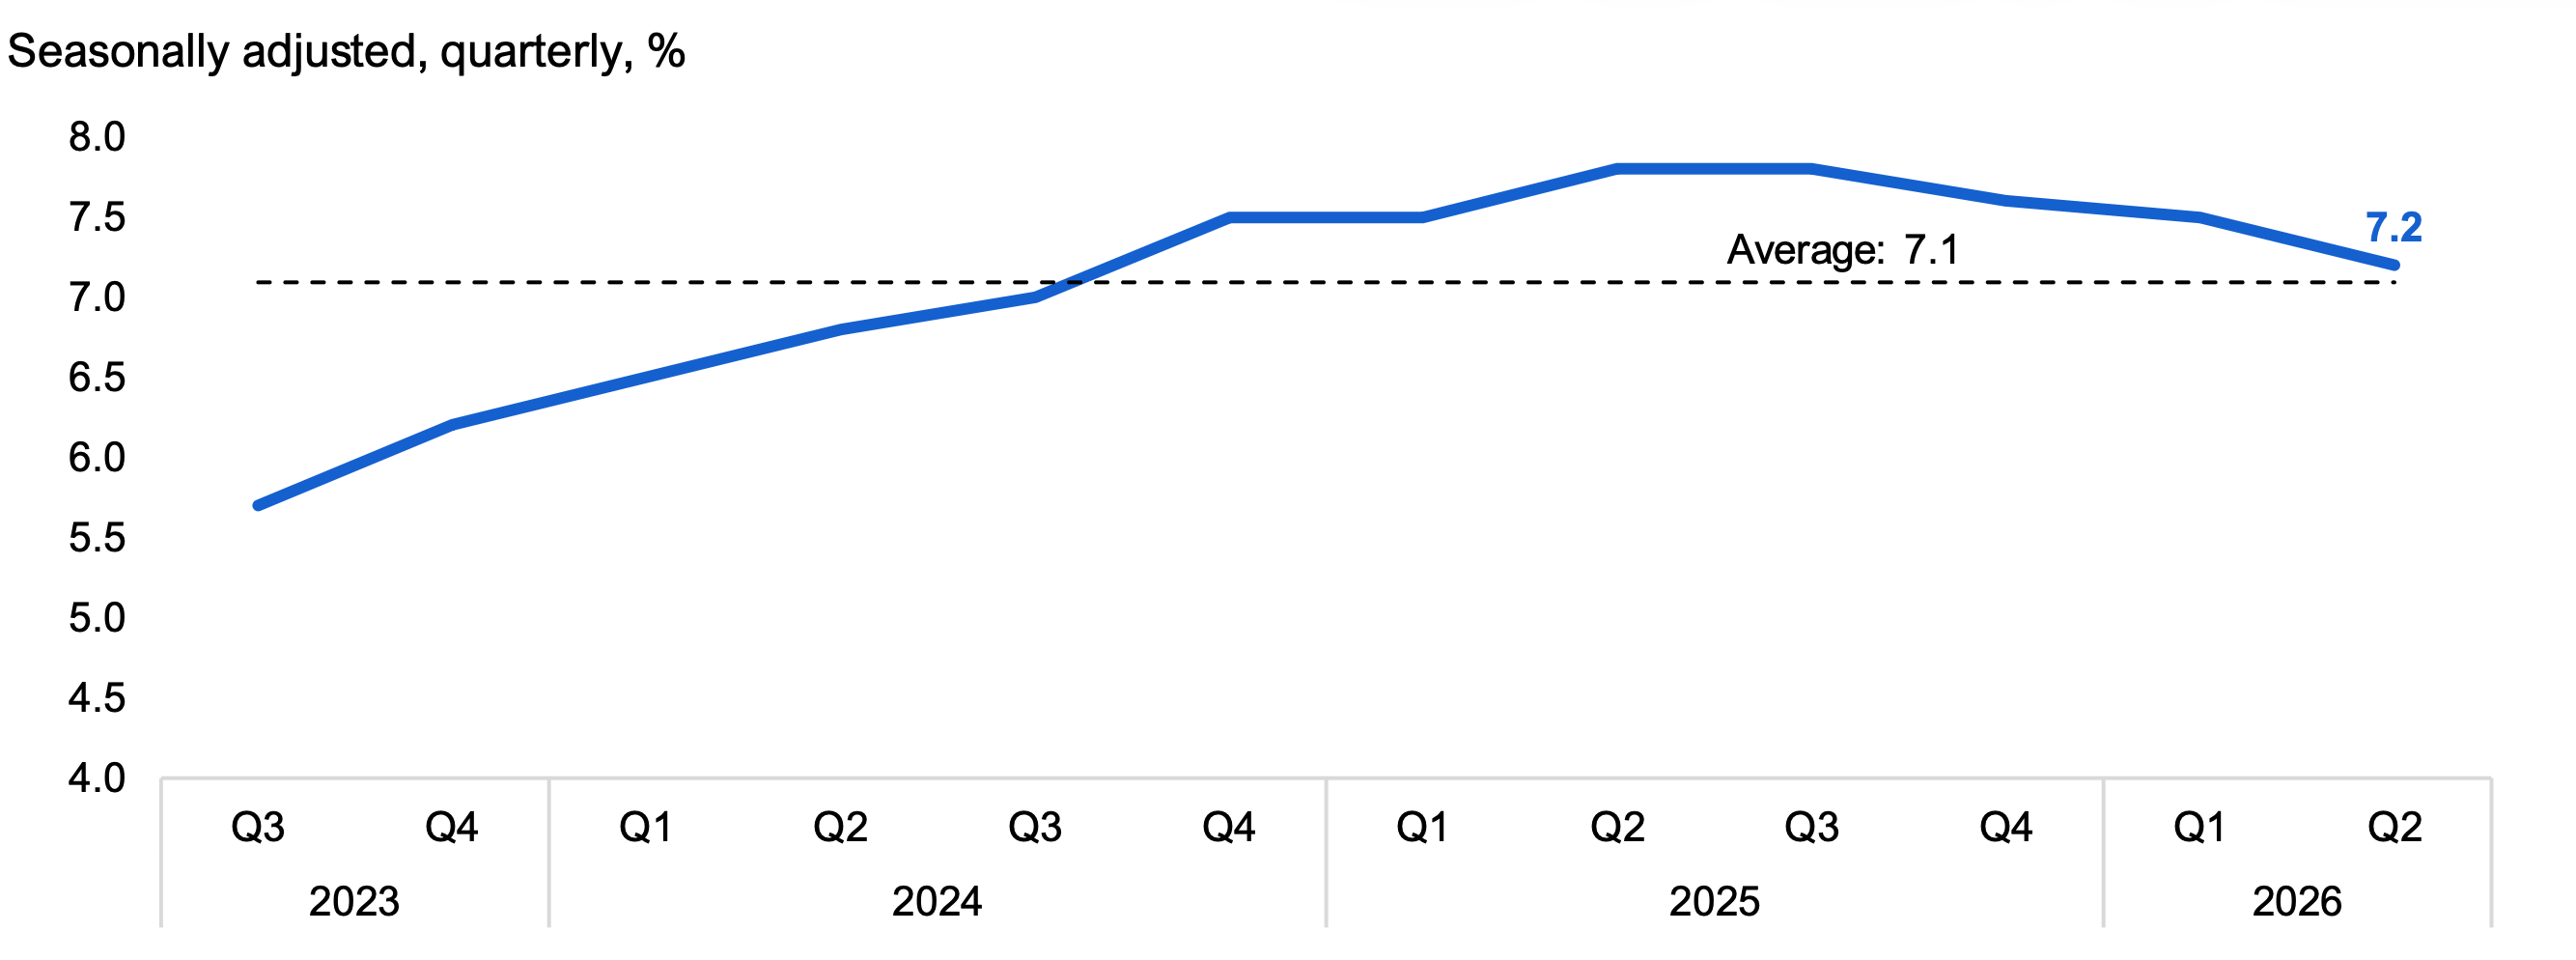
Source: Statistics Canada Table 14-10-0287-01 and FAO.
Accessible version
| Seasonally adjusted, quarterly, % | Average | |
|---|---|---|
| 2023 Q3 | 5.7 | 7.1 |
| 2023 Q4 | 6.2 | 7.1 |
| 2024 Q1 | 6.5 | 7.1 |
| 2024 Q2 | 6.8 | 7.1 |
| 2024 Q3 | 7.0 | 7.1 |
| 2024 Q4 | 7.5 | 7.1 |
| 2025 Q1 | 7.5 | 7.1 |
| 2025 Q2 | 7.8 | 7.1 |
| 2025 Q3 | 7.8 | 7.1 |
| 2025 Q4 | 7.6 | 7.1 |
| 2026 Q1 | 7.5 | 7.1 |
| 2026 Q2 | 7.2 | 7.1 |
Average hourly wages grew 3.2% in 2026 Q2 compared to 2025 Q2, reaching $38.49 an hour. Hourly wage growth was broad-based across most major industries, with wages in goods-producing industries rising 3.5% and services-producing industries increasing 3.1%. Industries with the fastest wage growth included finance, insurance and real estate; forestry, fishing, mining, quarrying, oil and gas; wholesale and retail trade; manufacturing; and accommodation and food services.
Figure 6 Average hourly wages grew 3.2% in 2026 Q2
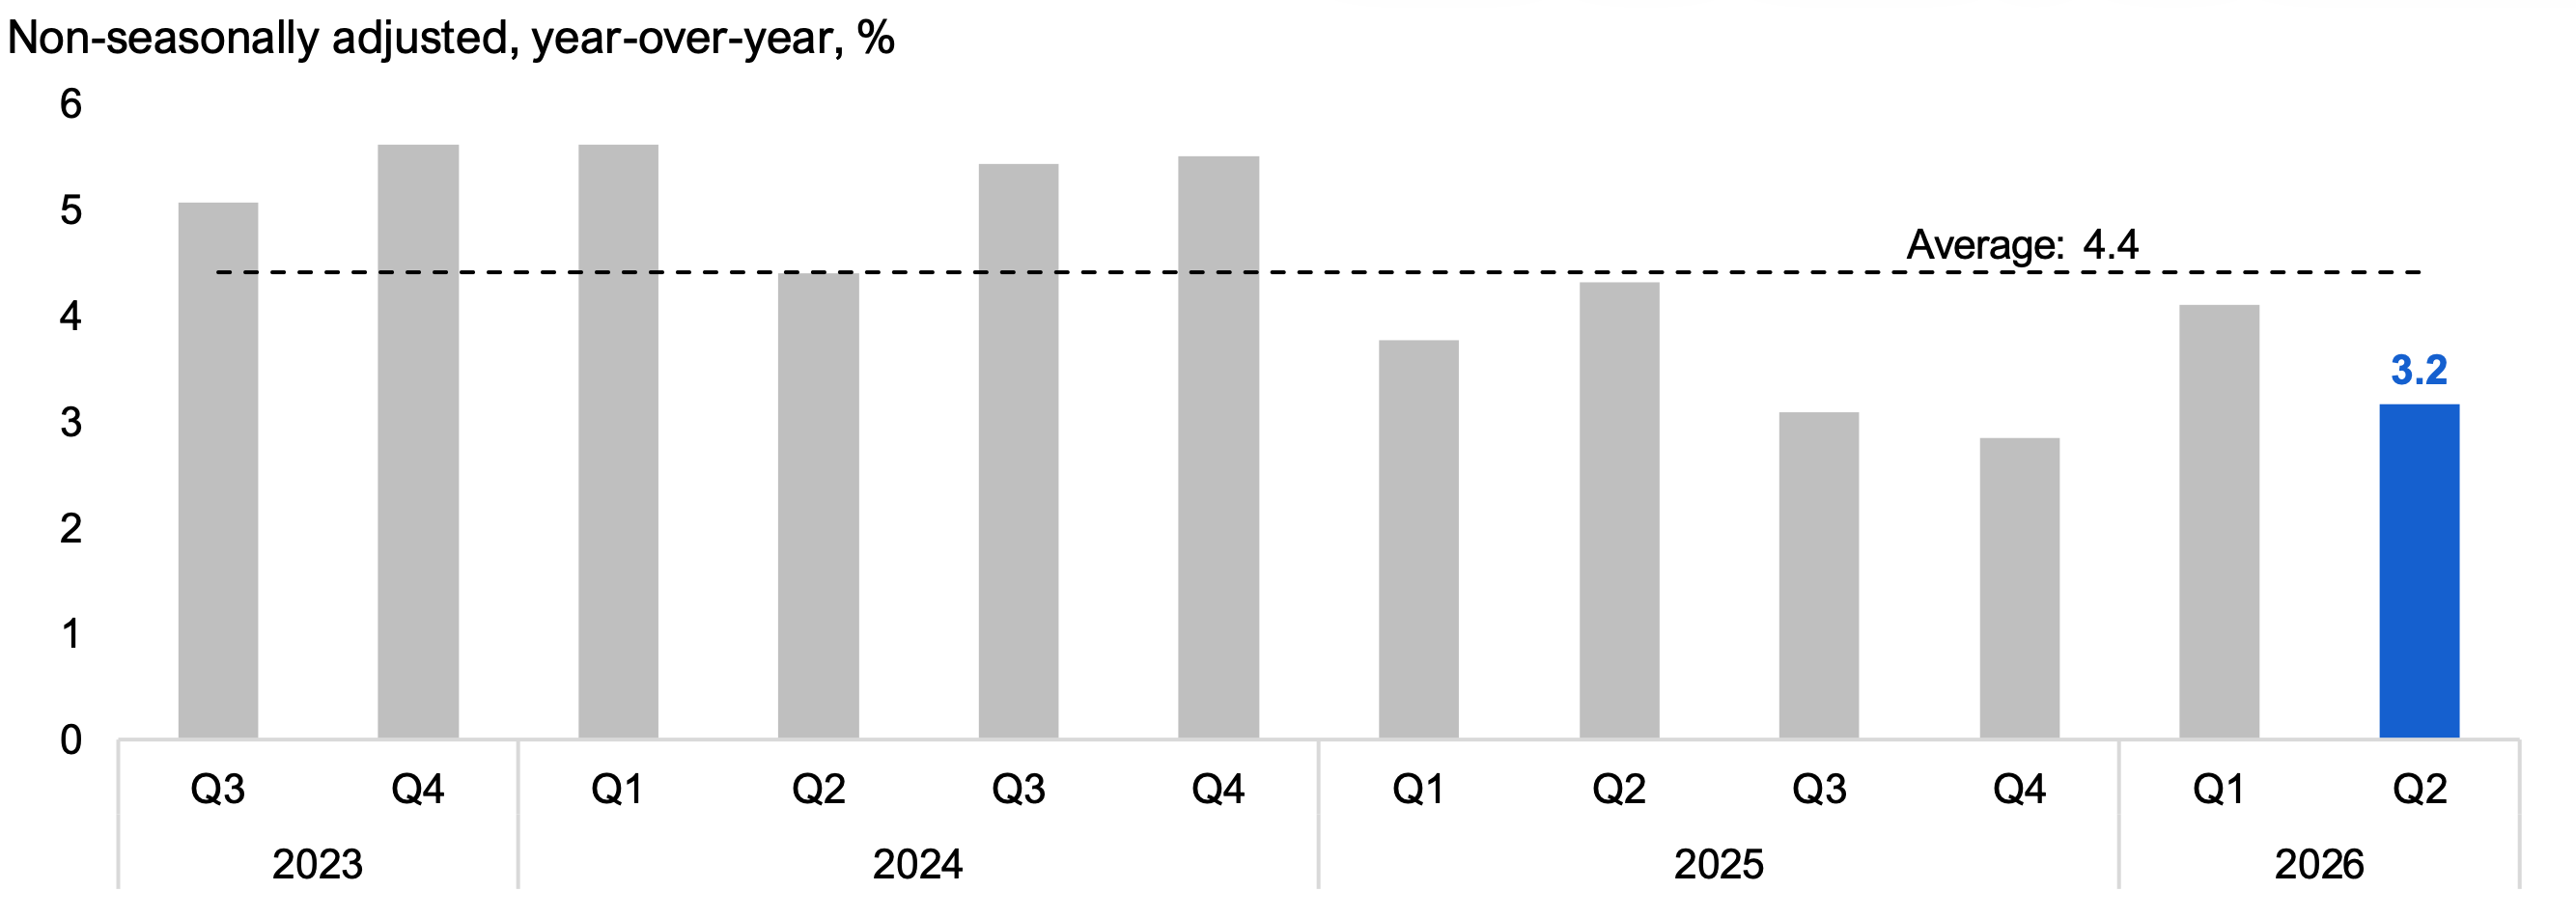
Source: Statistics Canada Table 14-10-0063-01 and FAO.
Accessible version
| Non-seasonally adjusted, year-over-year, % | Average | |
|---|---|---|
| 2023 Q3 | 5.1 | 4.4 |
| 2023 Q4 | 5.6 | 4.4 |
| 2024 Q1 | 5.6 | 4.4 |
| 2024 Q2 | 4.4 | 4.4 |
| 2024 Q3 | 5.4 | 4.4 |
| 2024 Q4 | 5.5 | 4.4 |
| 2025 Q1 | 3.8 | 4.4 |
| 2025 Q2 | 4.3 | 4.4 |
| 2025 Q3 | 3.1 | 4.4 |
| 2025 Q4 | 2.8 | 4.4 |
| 2026 Q1 | 4.1 | 4.4 |
| 2026 Q2 | 3.2 | 4.4 |
The Ontario Consumer Price Index (CPI) inflation rate[11] was 2.3% in 2026 Q2, higher than the 1.7% rate recorded in 2026 Q1. Of the major CPI components, energy was a significant contributor (20.6%) in 2026 Q2, led by a surge in gasoline prices (30.9%) reflecting the impact of the war in Iran. Excluding energy, Ontario’s inflation rate was 1.3% in 2026 Q2, one full percentage point below the all-items rate and the lowest rate in more than five years.
Other categories with inflation higher than the headline rate in 2026 Q2 were transportation (7.9%) and food (3.8%). In contrast, alcohol and tobacco (2.1%), recreation and reading (1.6%), clothing and footwear (1.3%), shelter (0.2%), and household operations (-0.7%) all grew slower than overall inflation. In the first half of 2026, shelter inflation has averaged 0.1%, the lowest level since late 2009 and early 2010, just after the global financial crisis.
Over the first half of 2026, Ontario’s CPI inflation rate has averaged 2.0%, the lowest rate among the provinces, reflecting in part Ontario’s relatively weaker economic growth.[12] If this trend persists for the year as a whole, it would mark the first time since 1991 that Ontario’s annual CPI inflation rate was the lowest among the provinces.
Figure 7 CPI inflation rate was 2.3% in 2026 Q2
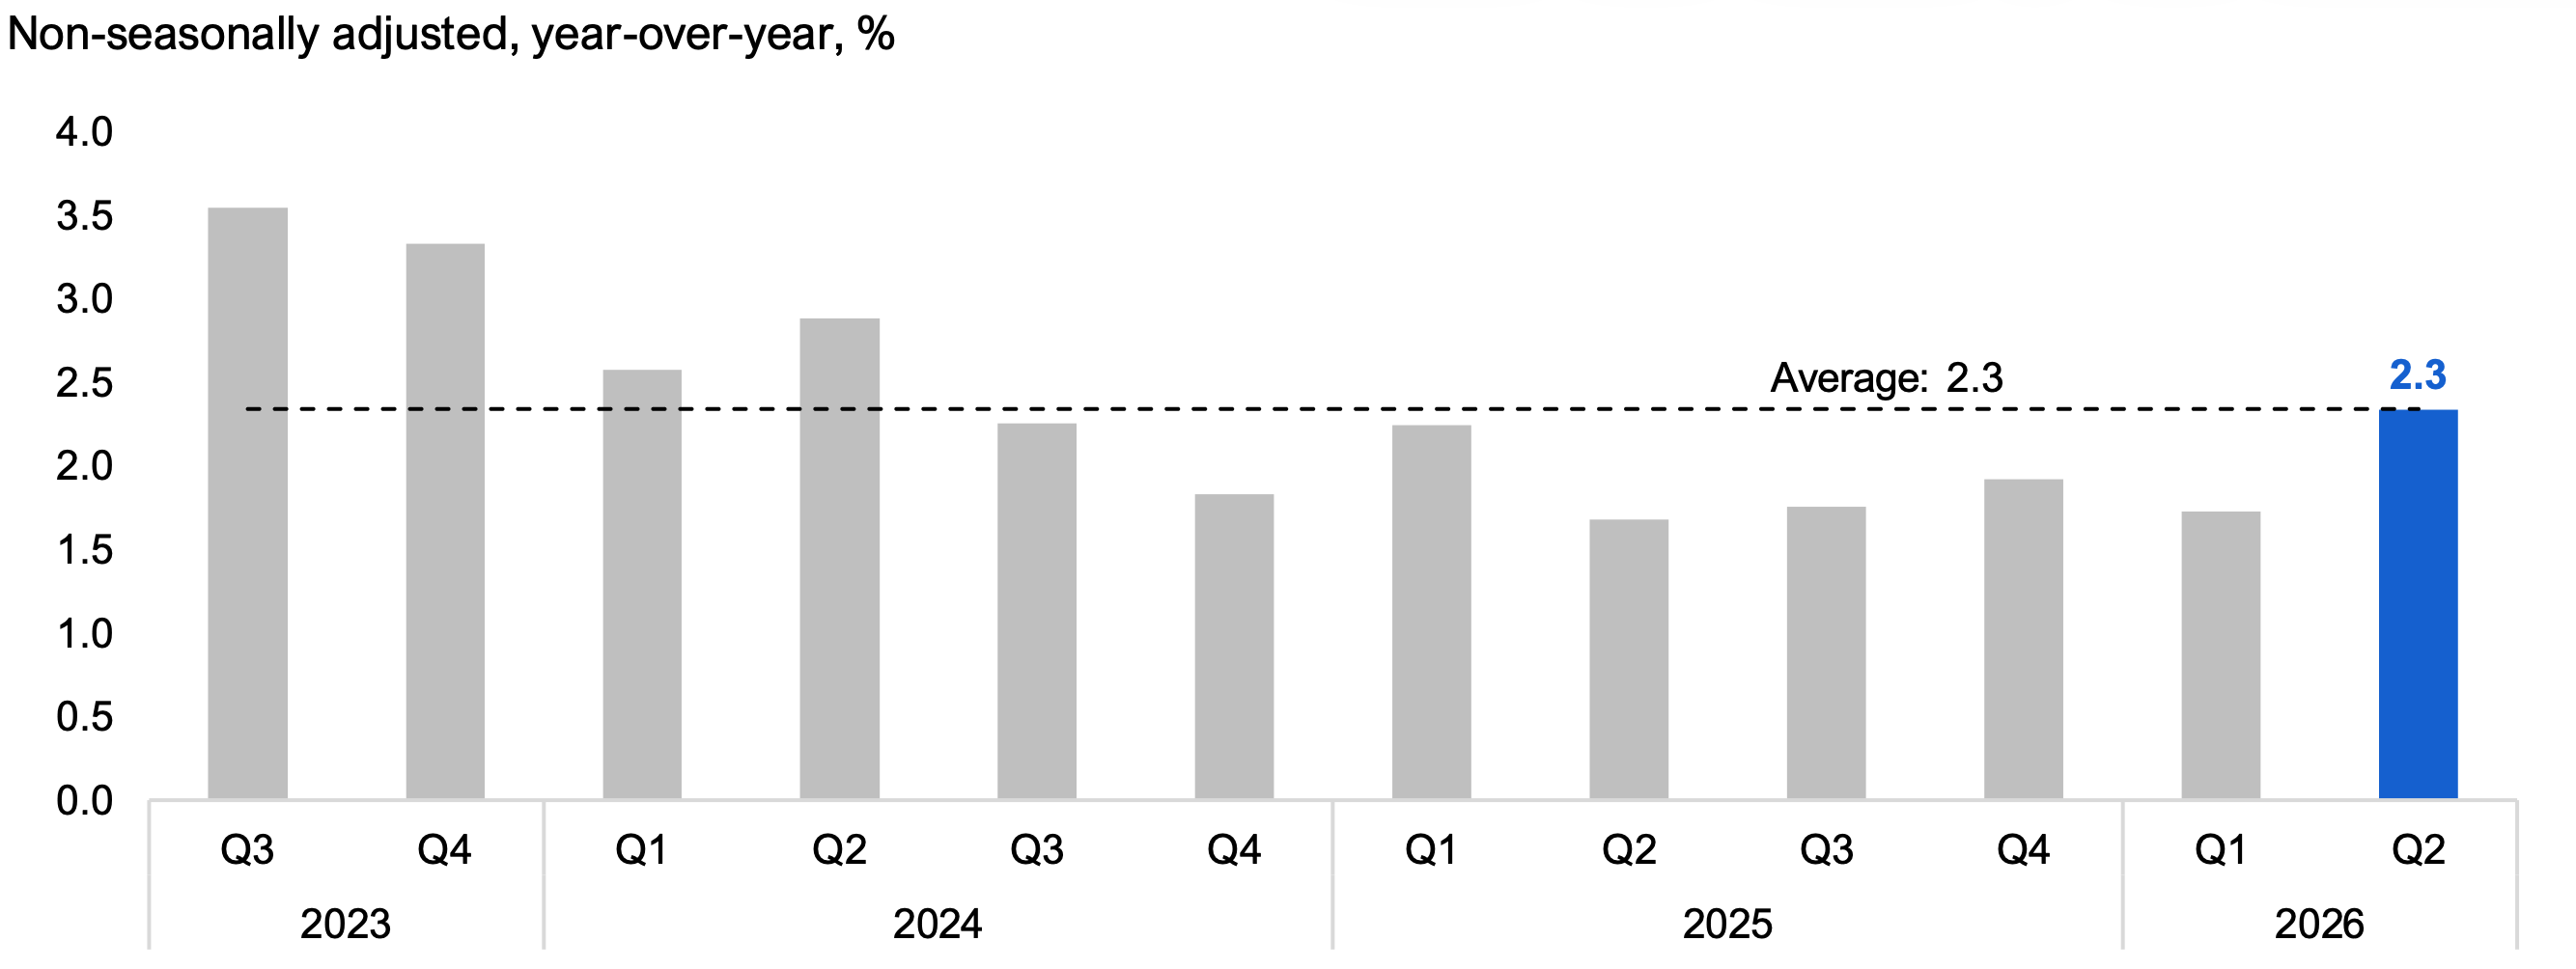
Source: Statistics Canada Table 18-10-0004-01 and FAO.
Accessible version
| Non-seasonally adjusted, year-over-year, % | Average | |
|---|---|---|
| 2023 Q3 | 3.5 | 2.3 |
| 2023 Q4 | 3.3 | 2.3 |
| 2024 Q1 | 2.6 | 2.3 |
| 2024 Q2 | 2.9 | 2.3 |
| 2024 Q3 | 2.3 | 2.3 |
| 2024 Q4 | 1.8 | 2.3 |
| 2025 Q1 | 2.2 | 2.3 |
| 2025 Q2 | 1.7 | 2.3 |
| 2025 Q3 | 1.8 | 2.3 |
| 2025 Q4 | 1.9 | 2.3 |
| 2026 Q1 | 1.7 | 2.3 |
| 2026 Q2 | 2.3 | 2.3 |
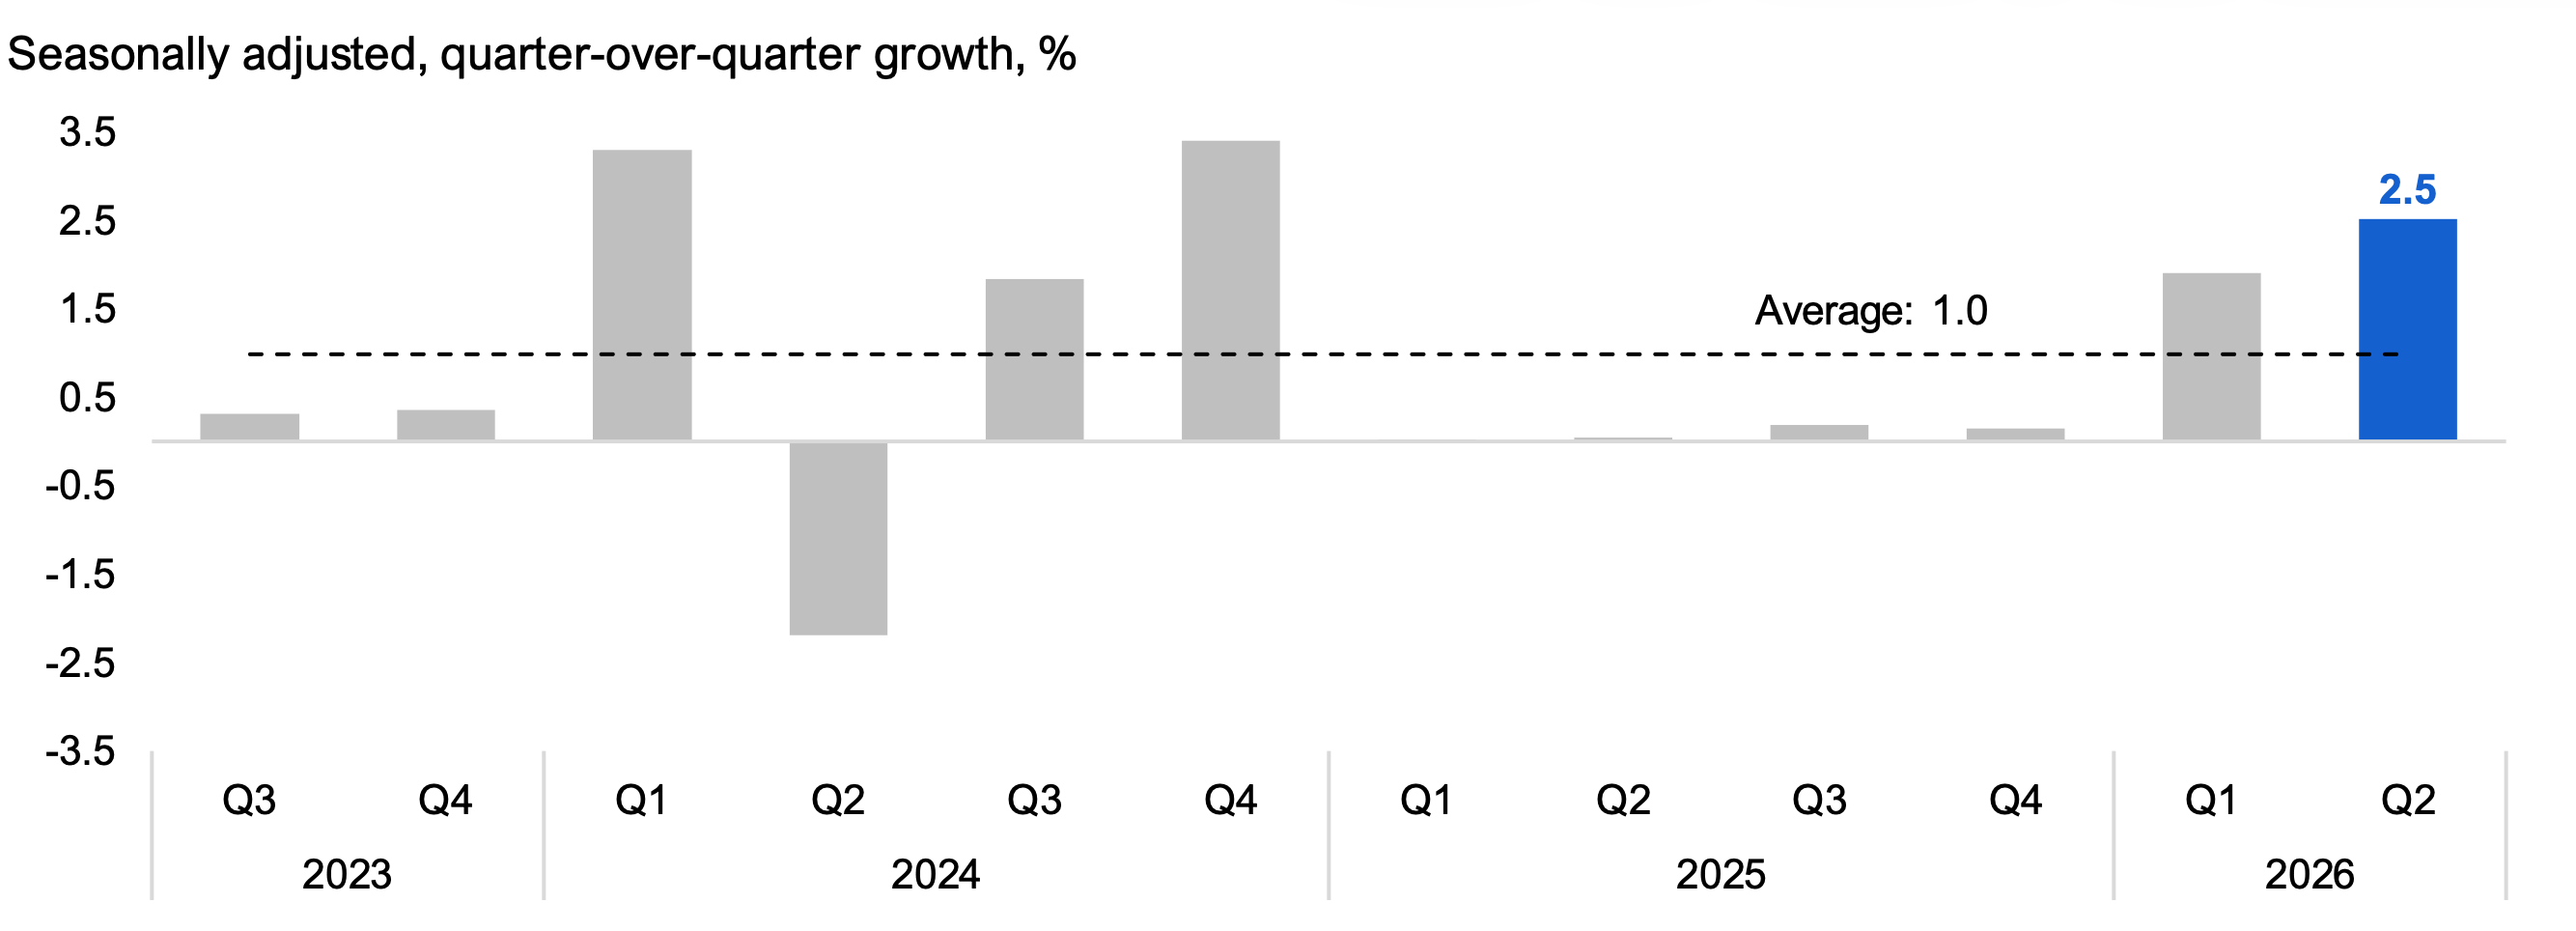
Retail sales[13] increased by 2.5% in 2026 Q2 in Ontario, the second quarterly increase after four quarters of prolonged weakness. Growth in retail sales in 2026 Q2 was driven by gasoline and fuel sales (mainly due to higher prices), motor vehicles and parts, and health and personal care, which more than offset declines in general merchandise, furniture and appliances, and food and beverage.
Figure 8 Retail sales increased by 2.5% in 2026 Q2
Source: Statistics Canada Table 20-10-0056-01 and FAO.
Accessible version
| Seasonally adjusted, quarter-over-quarter growth, % | Average | |
|---|---|---|
| 2023 Q3 | 0.3 | 1.0 |
| 2023 Q4 | 0.4 | 1.0 |
| 2024 Q1 | 3.3 | 1.0 |
| 2024 Q2 | -2.2 | 1.0 |
| 2024 Q3 | 1.8 | 1.0 |
| 2024 Q4 | 3.4 | 1.0 |
| 2025 Q1 | 0.0 | 1.0 |
| 2025 Q2 | 0.0 | 1.0 |
| 2025 Q3 | 0.2 | 1.0 |
| 2025 Q4 | 0.1 | 1.0 |
| 2026 Q1 | 1.9 | 1.0 |
| 2026 Q2 | 2.5 | 1.0 |
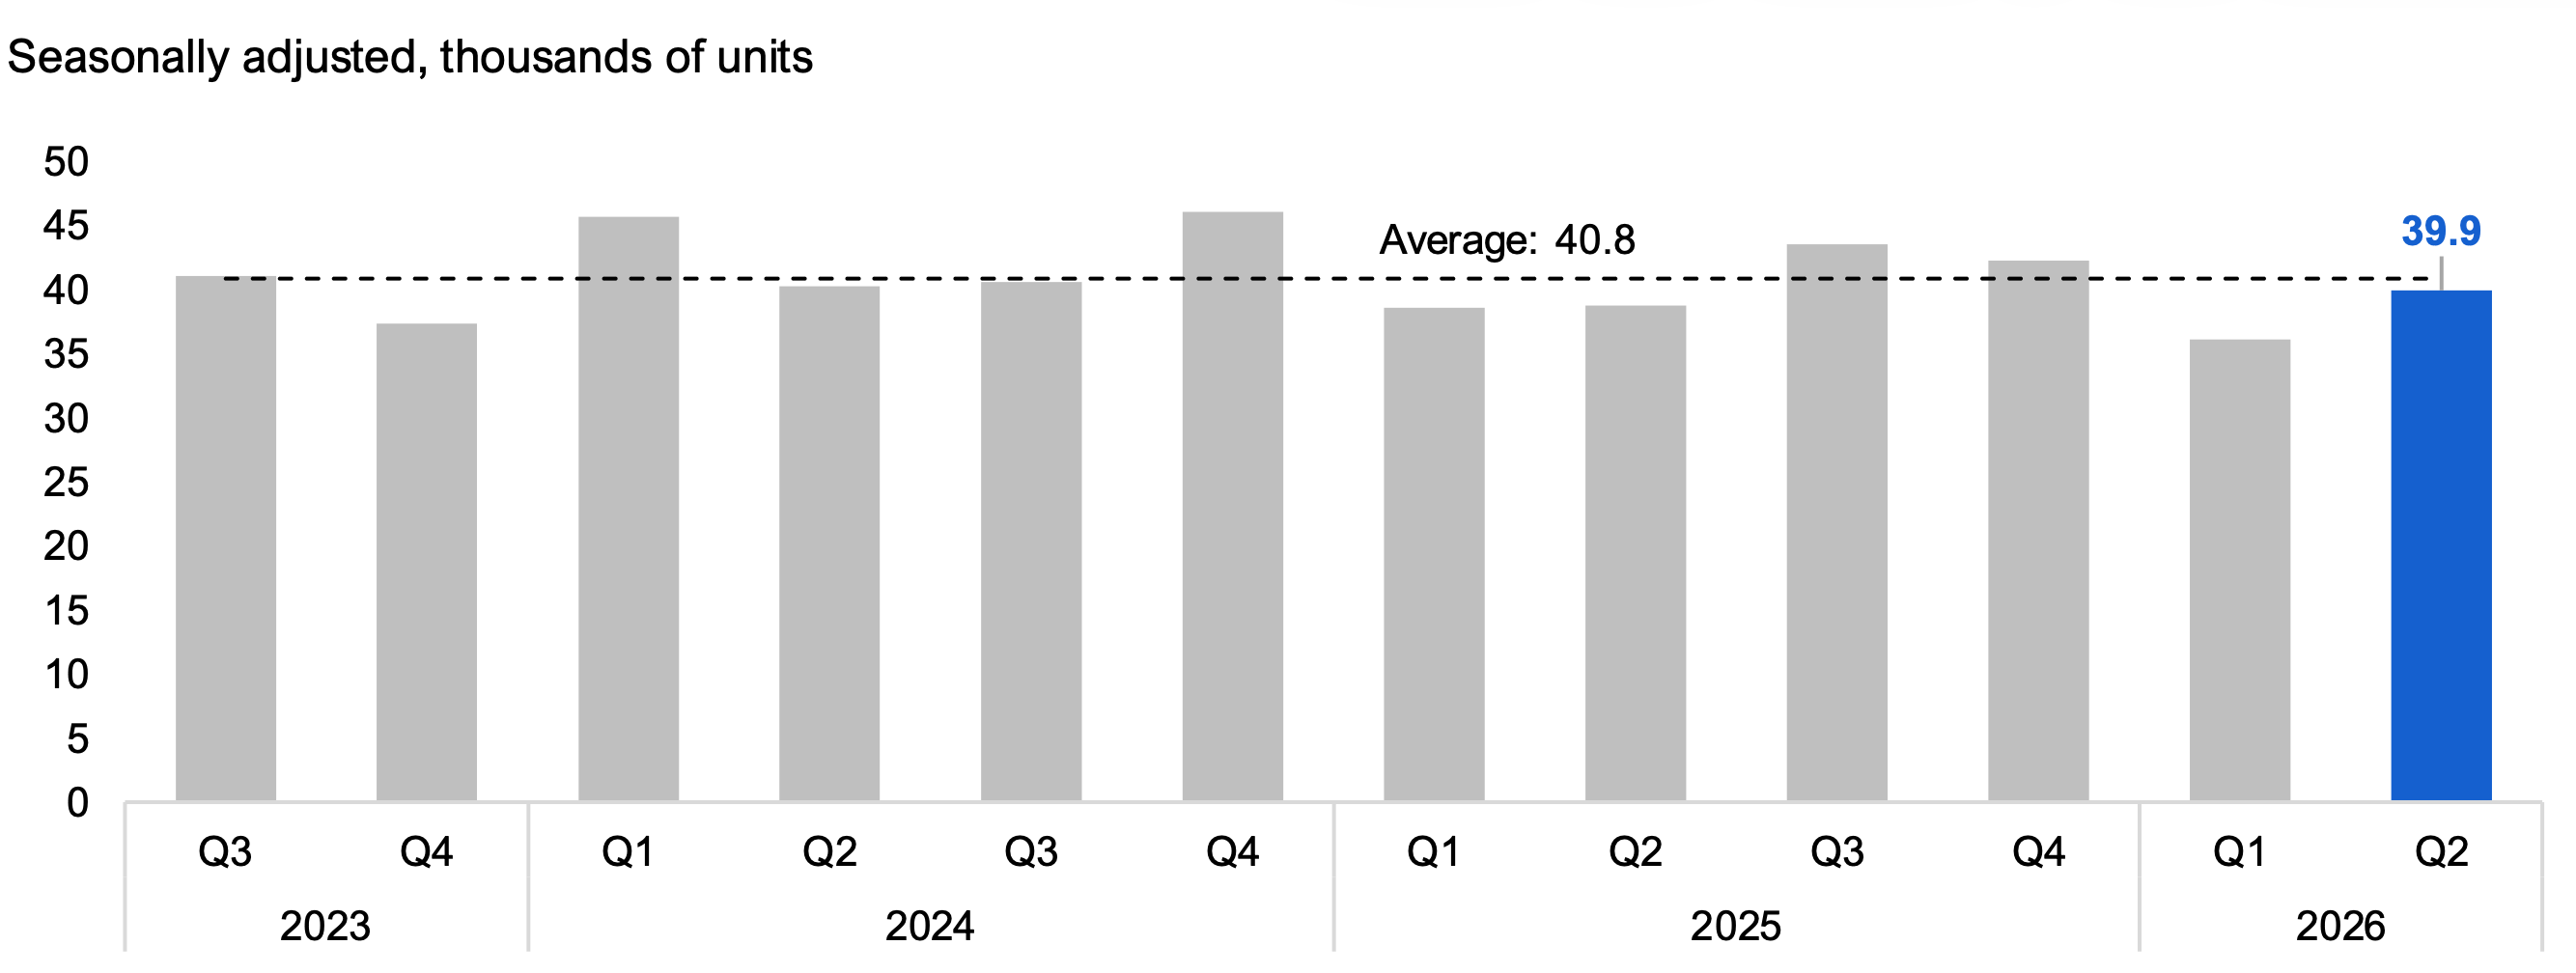
Ontario home resales in 2026 Q2 totalled 39,900 units, an increase of 10.6% from the previous quarter. This marked a rebound from 2026 Q1, when poor winter weather suppressed sales to its lowest level since early 2009, excluding the pandemic.
Figure 9 Housing resales increased to 39,900 units in 2026 Q2
Source: Canadian Real Estate Association and FAO.
Accessible version
| Seasonally adjusted, thousands of units | Average | |
|---|---|---|
| 2023 Q3 | 41.1 | 40.8 |
| 2023 Q4 | 37.3 | 40.8 |
| 2024 Q1 | 45.7 | 40.8 |
| 2024 Q2 | 40.3 | 40.8 |
| 2024 Q3 | 40.6 | 40.8 |
| 2024 Q4 | 46.0 | 40.8 |
| 2025 Q1 | 38.6 | 40.8 |
| 2025 Q2 | 38.7 | 40.8 |
| 2025 Q3 | 43.5 | 40.8 |
| 2025 Q4 | 42.2 | 40.8 |
| 2026 Q1 | 36.1 | 40.8 |
| 2026 Q2 | 39.9 | 40.8 |
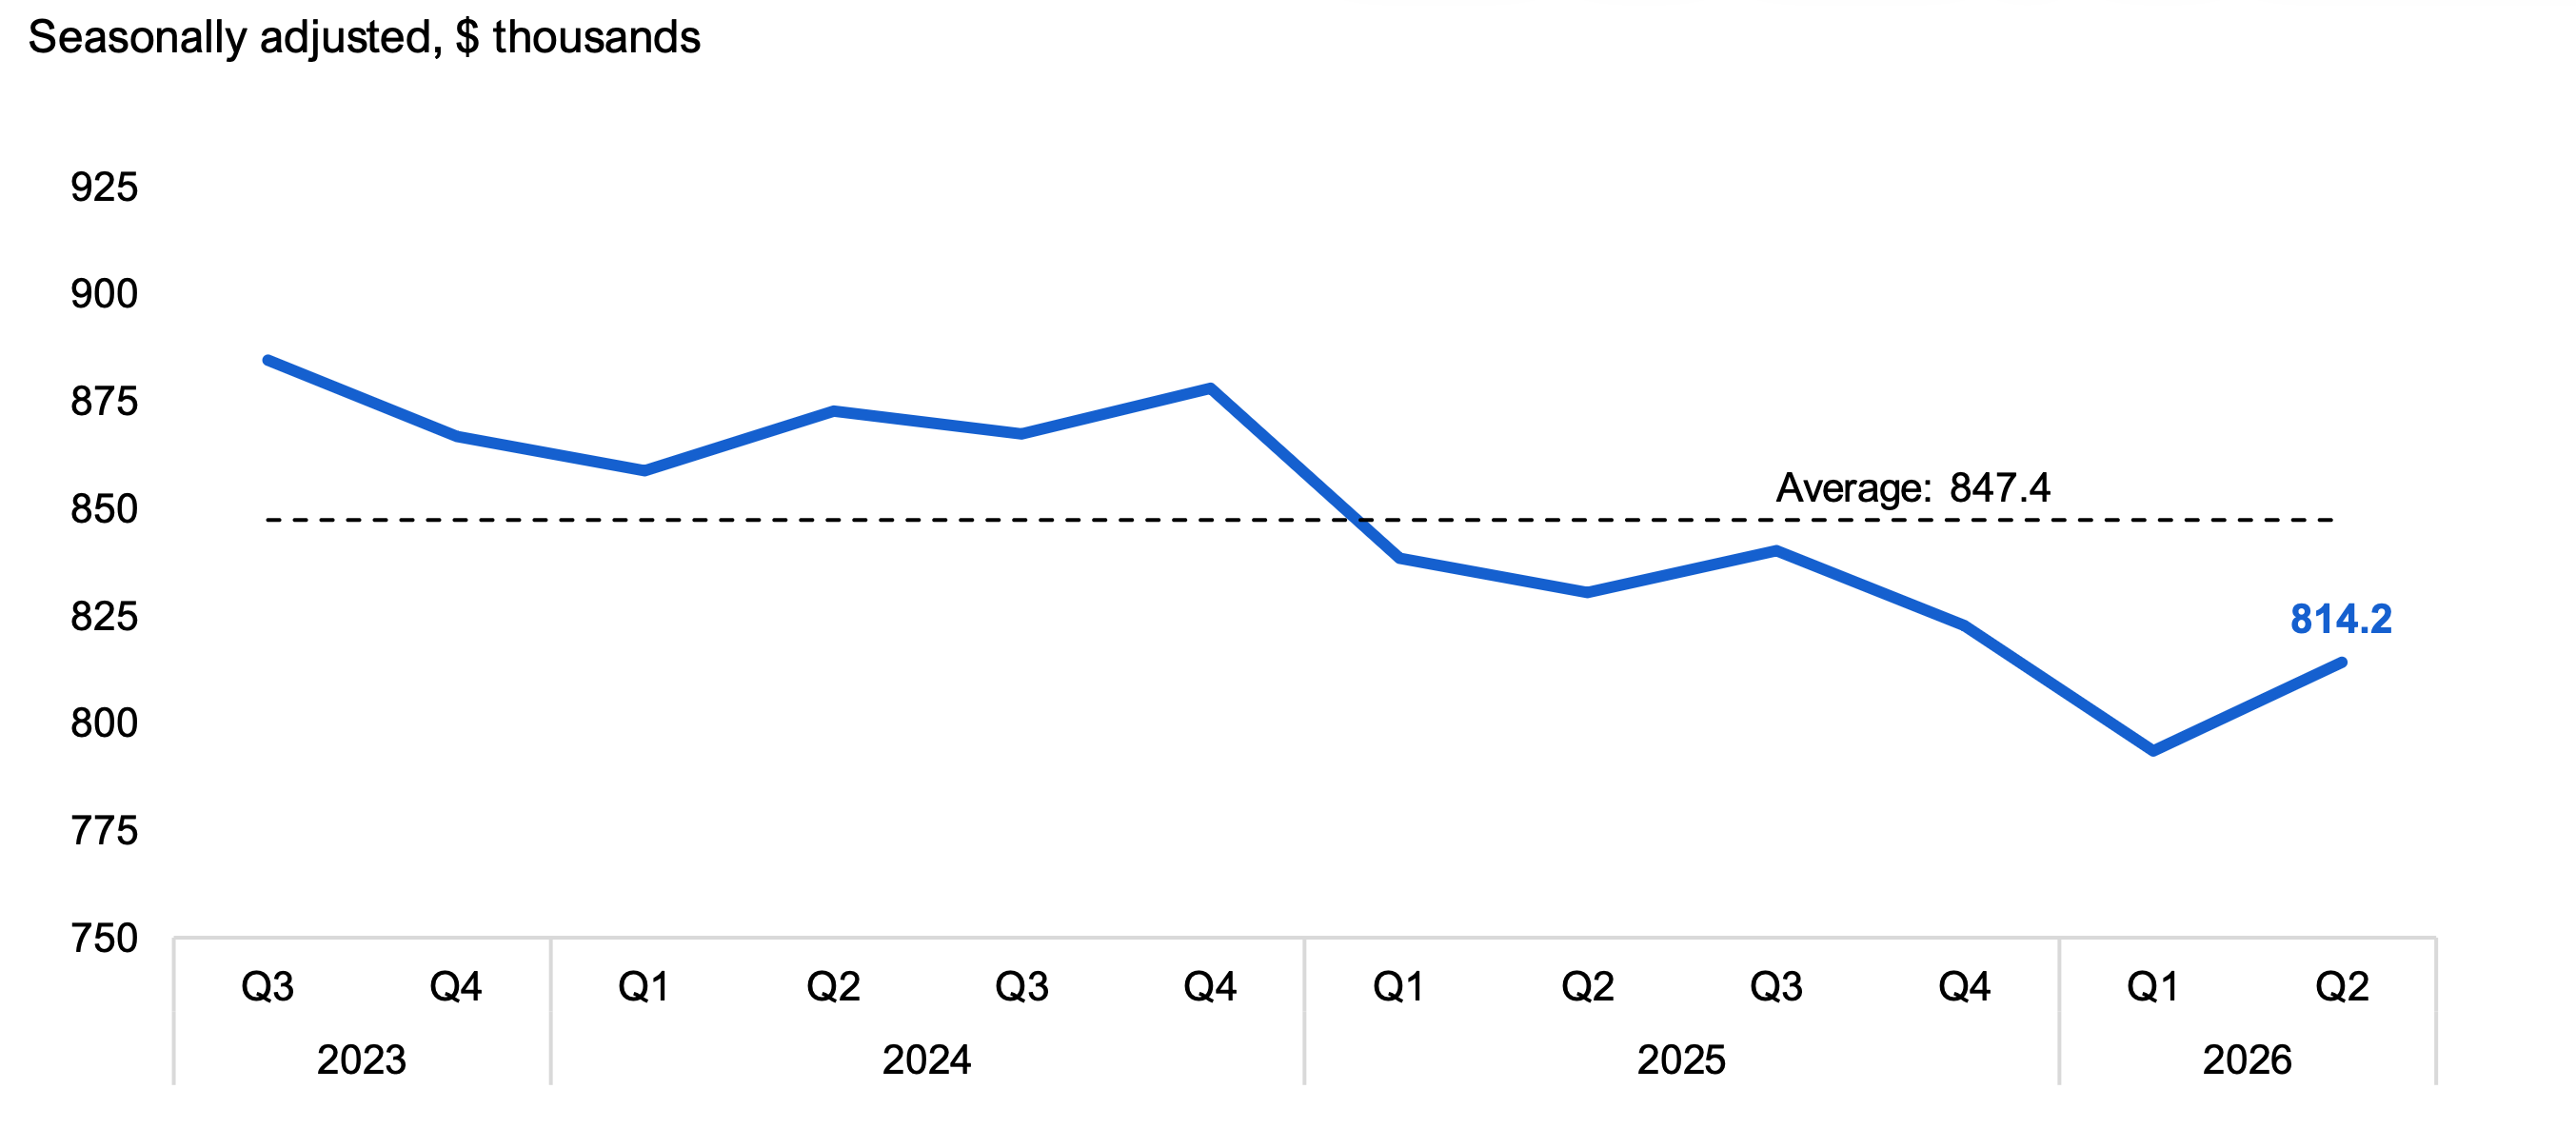
Home resale prices in Ontario averaged $814,200 in 2026 Q2, a 2.6% increase from the previous quarter. In 2026 Q2, the average resale home price was $224,700 (or ‑21.6%) below the peak reached in 2022 Q1 ($1,038,900), but $153,800 (or 23.3%) above the pre-pandemic average resale home price in 2020 Q1 ($660,400).
Figure 10 Average home resale prices increased to $814,200 in 2026 Q2
Source: Canadian Real Estate Association and FAO.
Accessible version
| Seasonally adjusted, $ thousands | Average | |
|---|---|---|
| 2023 Q3 | 884.6 | 847.4 |
| 2023 Q4 | 866.8 | 847.4 |
| 2024 Q1 | 858.7 | 847.4 |
| 2024 Q2 | 872.8 | 847.4 |
| 2024 Q3 | 867.5 | 847.4 |
| 2024 Q4 | 878.0 | 847.4 |
| 2025 Q1 | 838.5 | 847.4 |
| 2025 Q2 | 830.6 | 847.4 |
| 2025 Q3 | 840.2 | 847.4 |
| 2025 Q4 | 822.8 | 847.4 |
| 2026 Q1 | 793.5 | 847.4 |
| 2026 Q2 | 814.2 | 847.4 |
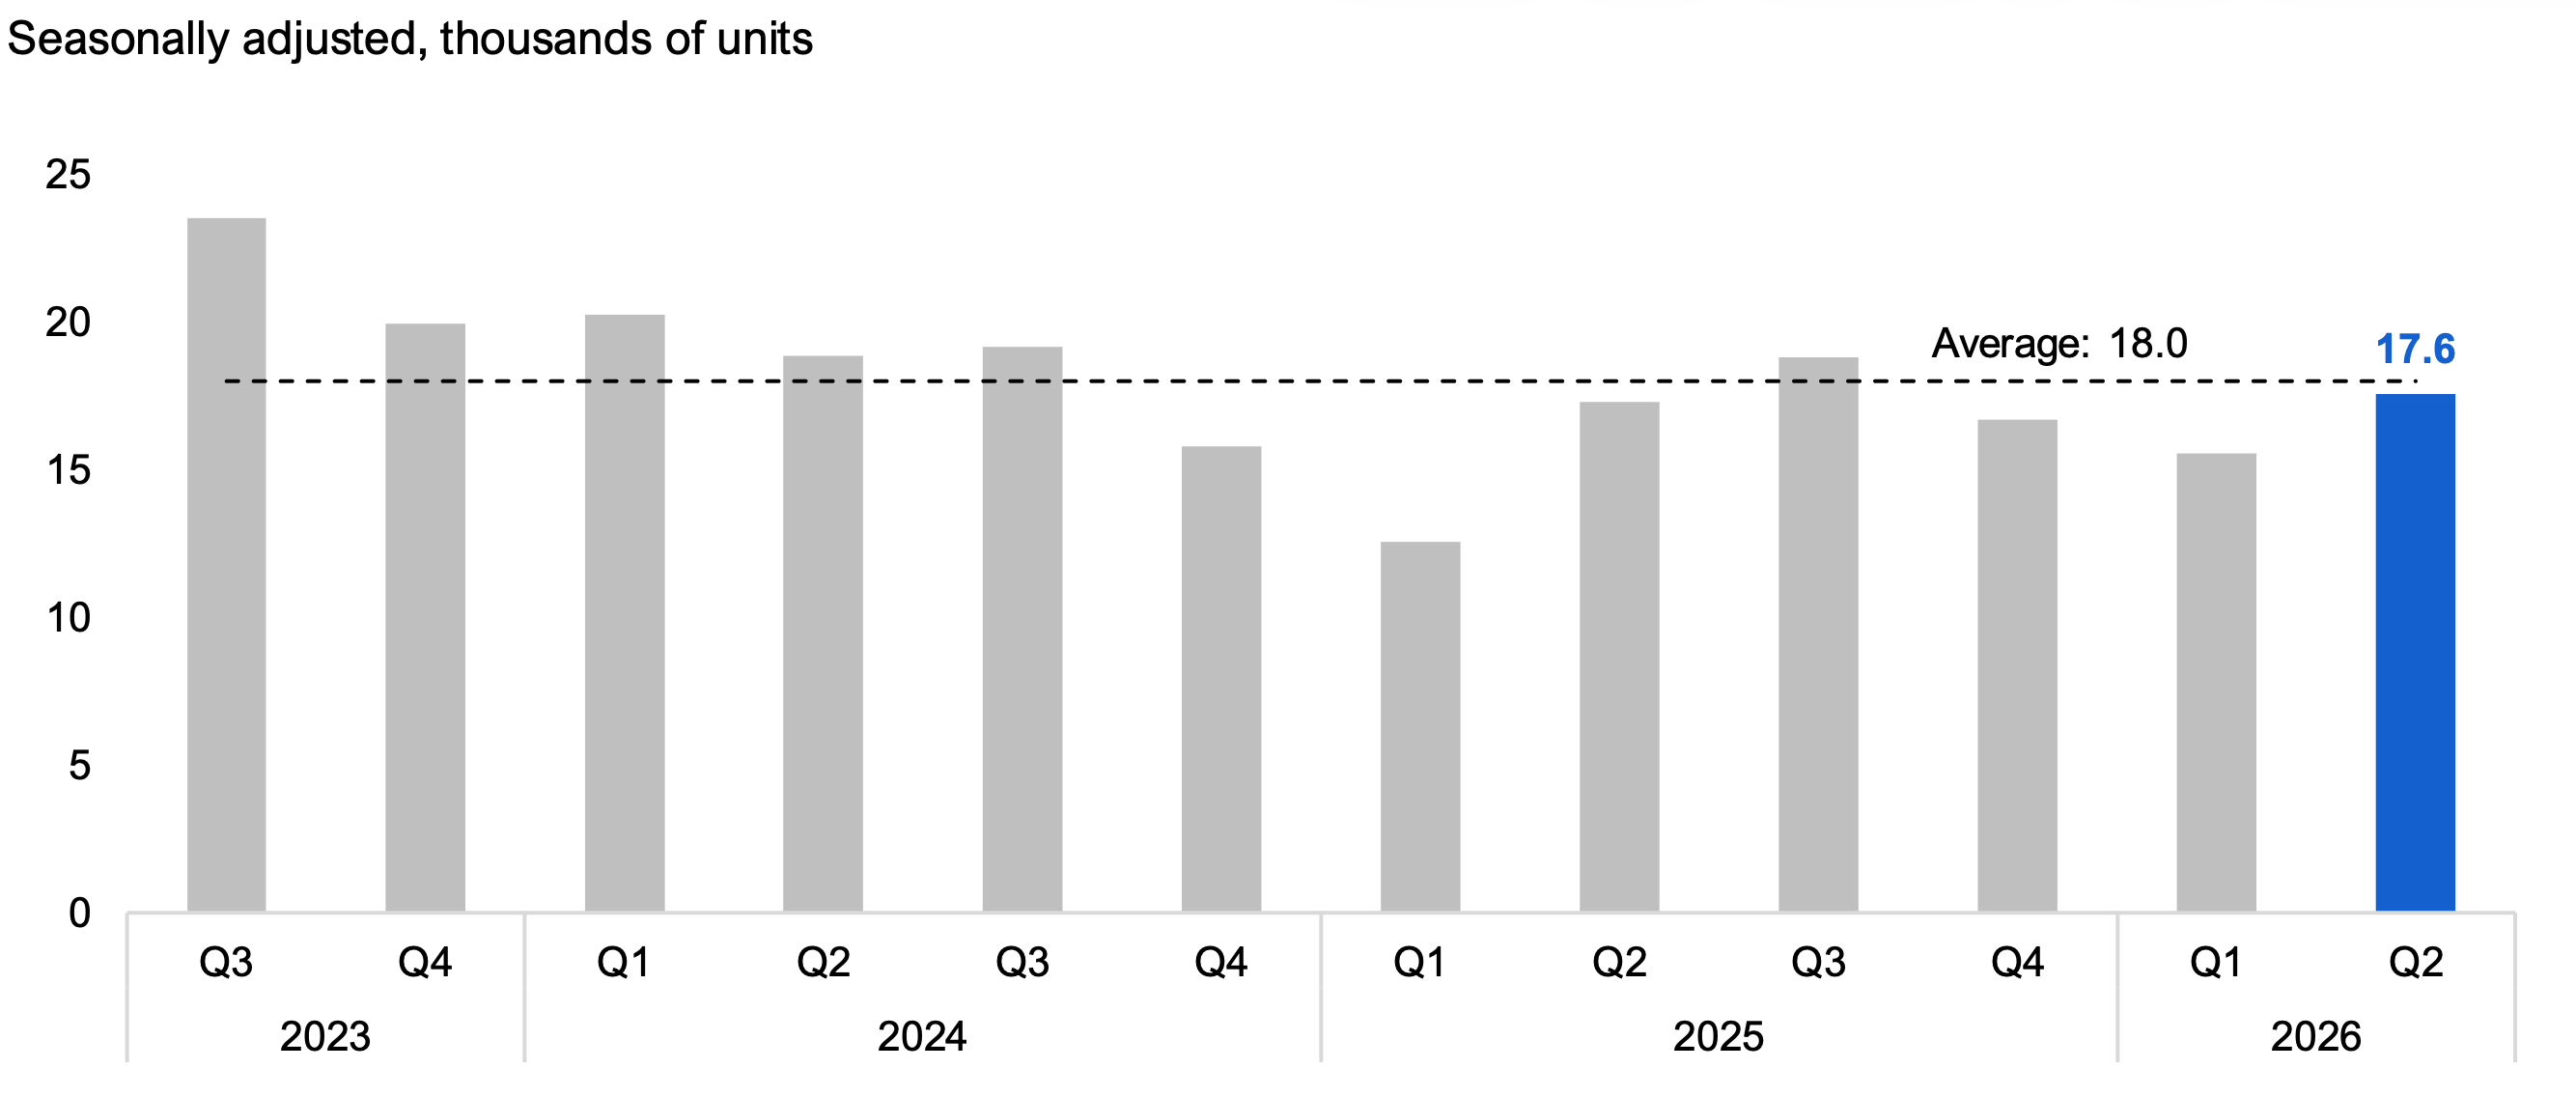
Housing starts[14] in 2026 Q2 totalled 17,600 units in Ontario, an increase of 12.9% from 2026 Q1. In 2026 Q2, 85% of total housing starts were multiple unit dwellings, while 15% were single detached homes.[15] Despite the increase in 2026 Q2, housing starts in Ontario have remained below their 12-quarter average in six of the past seven quarters.
Figure 11 Housing starts grew to 17,600 units in 2026 Q2
Source: Statistics Canada Table 34-10-0141-01 and FAO.
Accessible version
| Seasonally adjusted, thousands of units | Average | |
|---|---|---|
| 2023 Q3 | 23.5 | 18.0 |
| 2023 Q4 | 20.0 | 18.0 |
| 2024 Q1 | 20.2 | 18.0 |
| 2024 Q2 | 18.9 | 18.0 |
| 2024 Q3 | 19.2 | 18.0 |
| 2024 Q4 | 15.8 | 18.0 |
| 2025 Q1 | 12.6 | 18.0 |
| 2025 Q2 | 17.3 | 18.0 |
| 2025 Q3 | 18.8 | 18.0 |
| 2025 Q4 | 16.7 | 18.0 |
| 2026 Q1 | 15.6 | 18.0 |
| 2026 Q2 | 17.6 | 18.0 |
Businesses
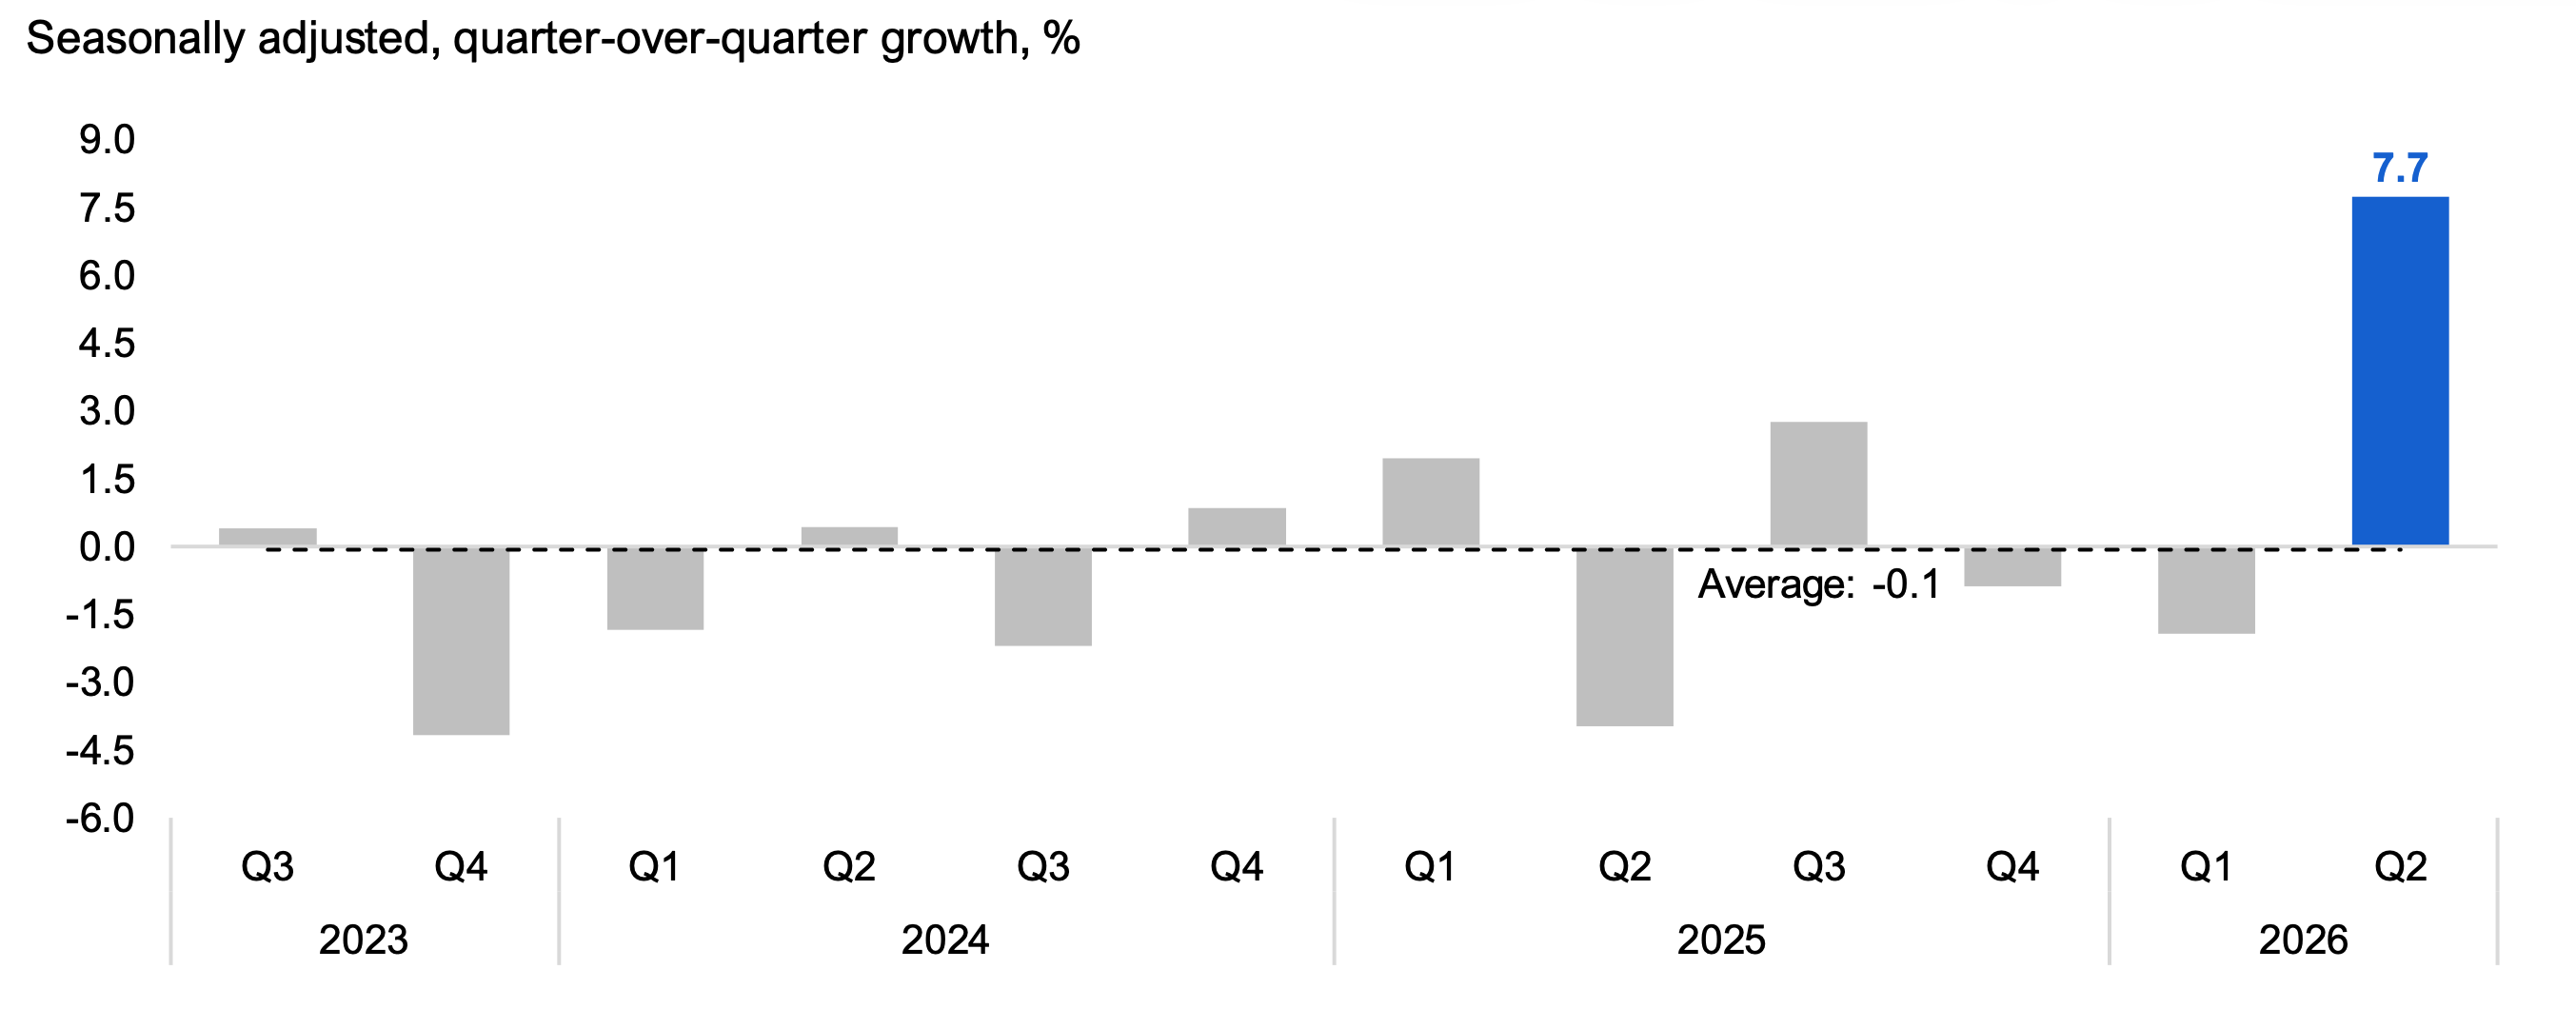
Manufacturing sales increased by a robust 7.7% in 2026 Q2, following a 1.9% decrease in 2026 Q1. The increase resulted primarily from higher sales of transportation equipment (18.4%), petroleum and coal products (20.2%), and machinery (12.2%). The rebound in sales in 2026 Q2 followed a prolonged period of weakness reflecting the impact of US tariffs as well as auto plant shutdowns for retooling.
Figure 12 Manufacturing sales increased by 7.7% in 2026 Q2
Source: Statistics Canada Table 16-10-0048-01 and FAO.
Accessible version
| Seasonally adjusted, quarter-over-quarter growth, % | Average | |
|---|---|---|
| 2023 Q3 | 0.4 | -0.1 |
| 2023 Q4 | -4.2 | -0.1 |
| 2024 Q1 | -1.8 | -0.1 |
| 2024 Q2 | 0.4 | -0.1 |
| 2024 Q3 | -2.2 | -0.1 |
| 2024 Q4 | 0.9 | -0.1 |
| 2025 Q1 | 2.0 | -0.1 |
| 2025 Q2 | -4.0 | -0.1 |
| 2025 Q3 | 2.8 | -0.1 |
| 2025 Q4 | -0.9 | -0.1 |
| 2026 Q1 | -1.9 | -0.1 |
| 2026 Q2 | 7.7 | -0.1 |
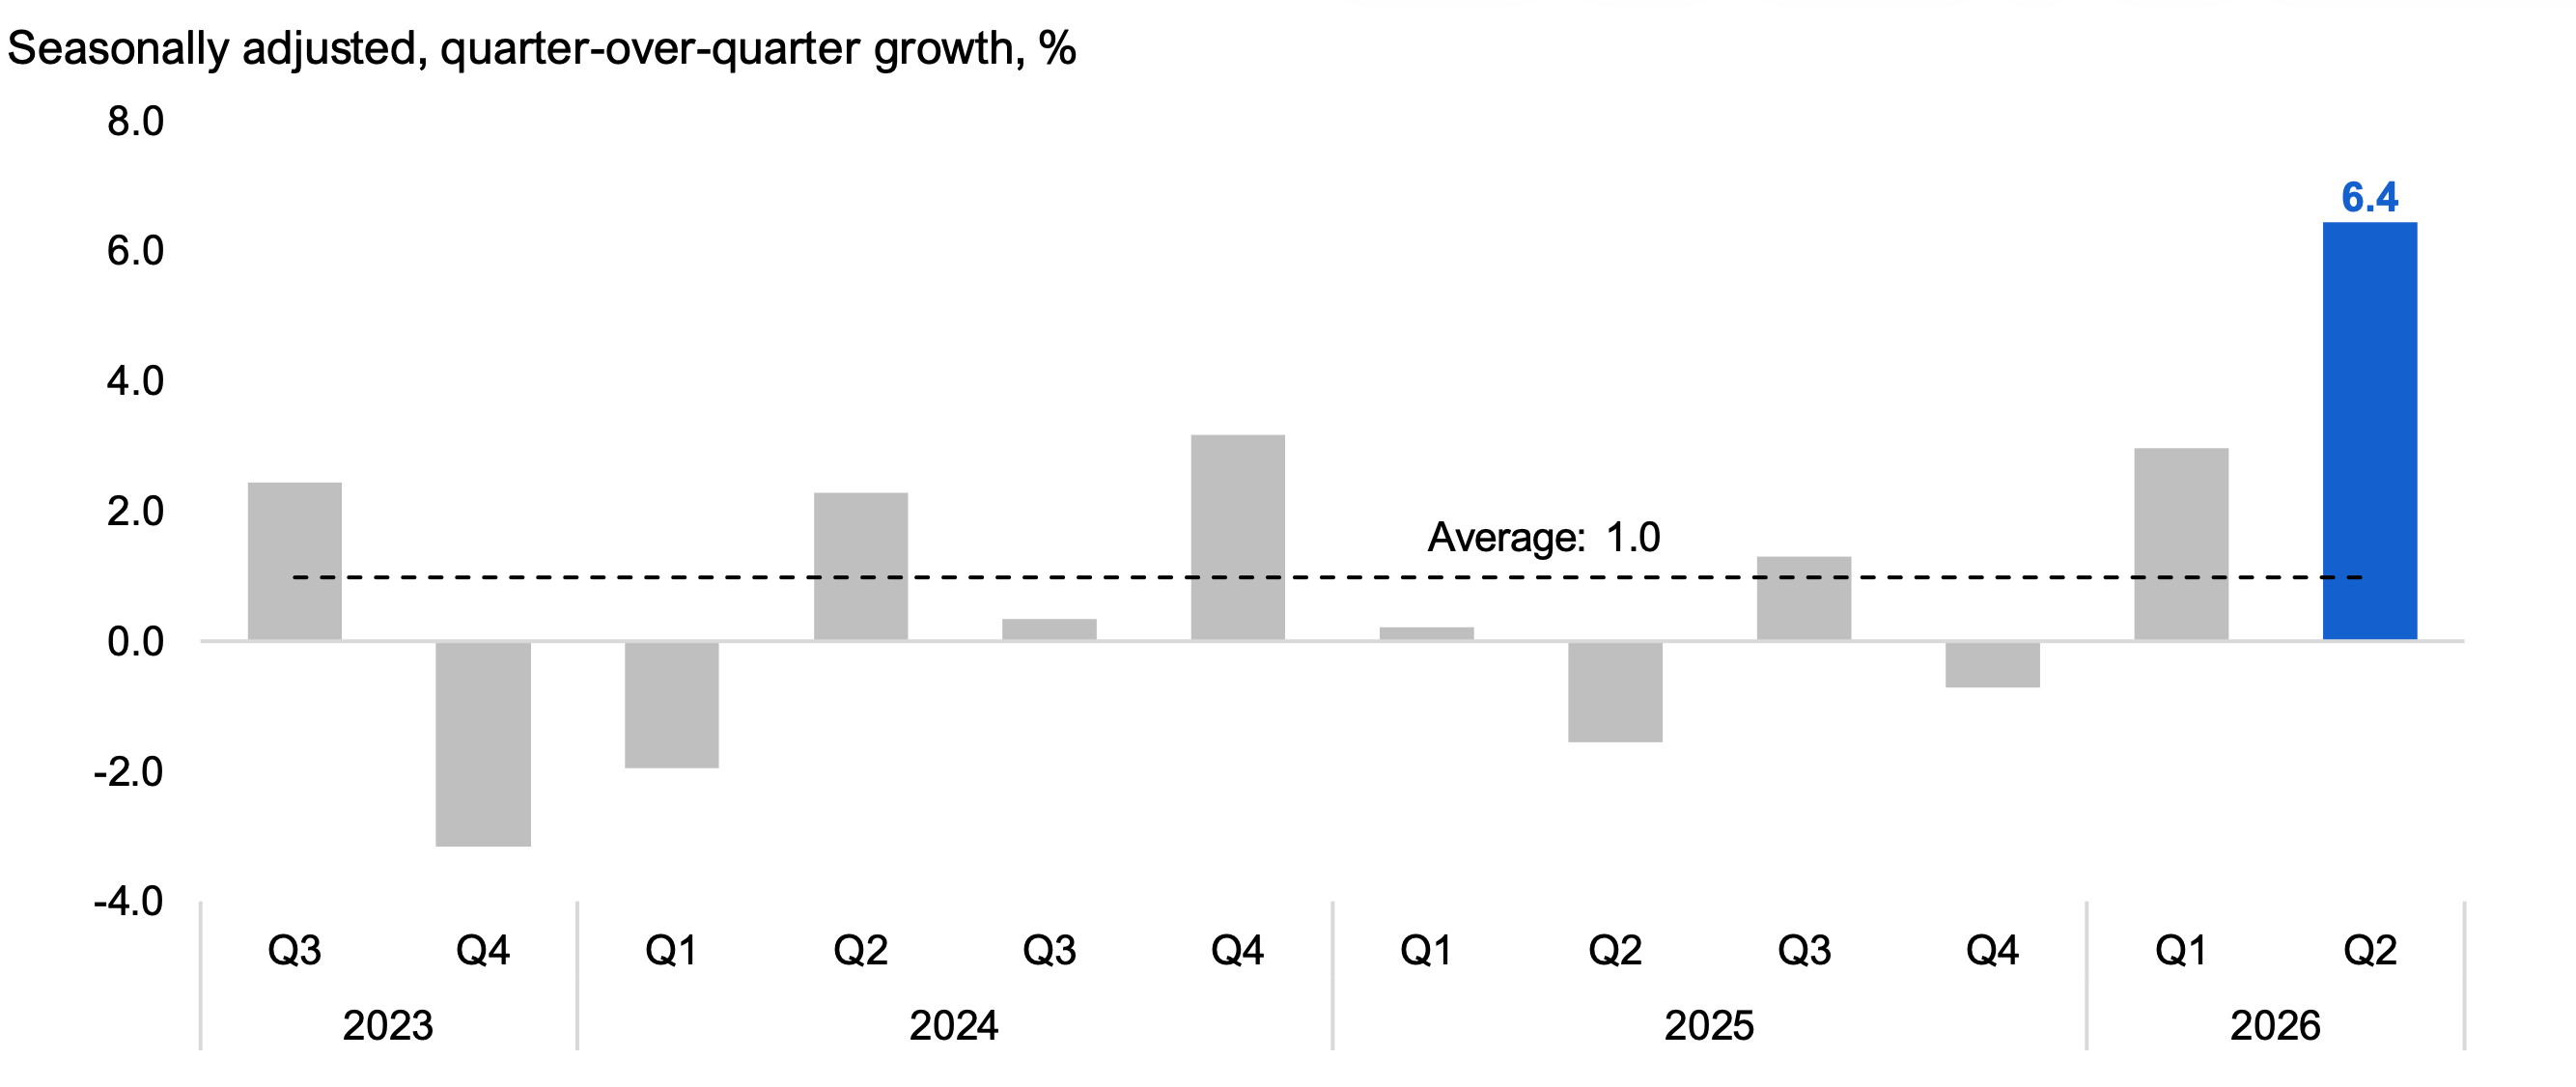
Wholesale trade, which measures sales of bulk items to retailers and businesses, increased by 6.4% in 2026 Q2, following a 3.0% increase in the previous quarter. The 2026 Q2 increase was largely the result of growth in petroleum and petroleum products (24.0%), building materials and supplies (13.6%), machinery and equipment (6.7%), and motor vehicles and parts (5.8%).
Figure 13 Wholesale trade increased by 6.4% in 2026 Q2
Source: Statistics Canada Table 20-10-0074-01 and FAO.
Accessible version
| Seasonally adjusted, quarter-over-quarter growth, % | Average | |
|---|---|---|
| 2023 Q3 | 2.4 | 1.0 |
| 2023 Q4 | -3.2 | 1.0 |
| 2024 Q1 | -2.0 | 1.0 |
| 2024 Q2 | 2.3 | 1.0 |
| 2024 Q3 | 0.3 | 1.0 |
| 2024 Q4 | 3.2 | 1.0 |
| 2025 Q1 | 0.2 | 1.0 |
| 2025 Q2 | -1.6 | 1.0 |
| 2025 Q3 | 1.3 | 1.0 |
| 2025 Q4 | -0.7 | 1.0 |
| 2026 Q1 | 3.0 | 1.0 |
| 2026 Q2 | 6.4 | 1.0 |
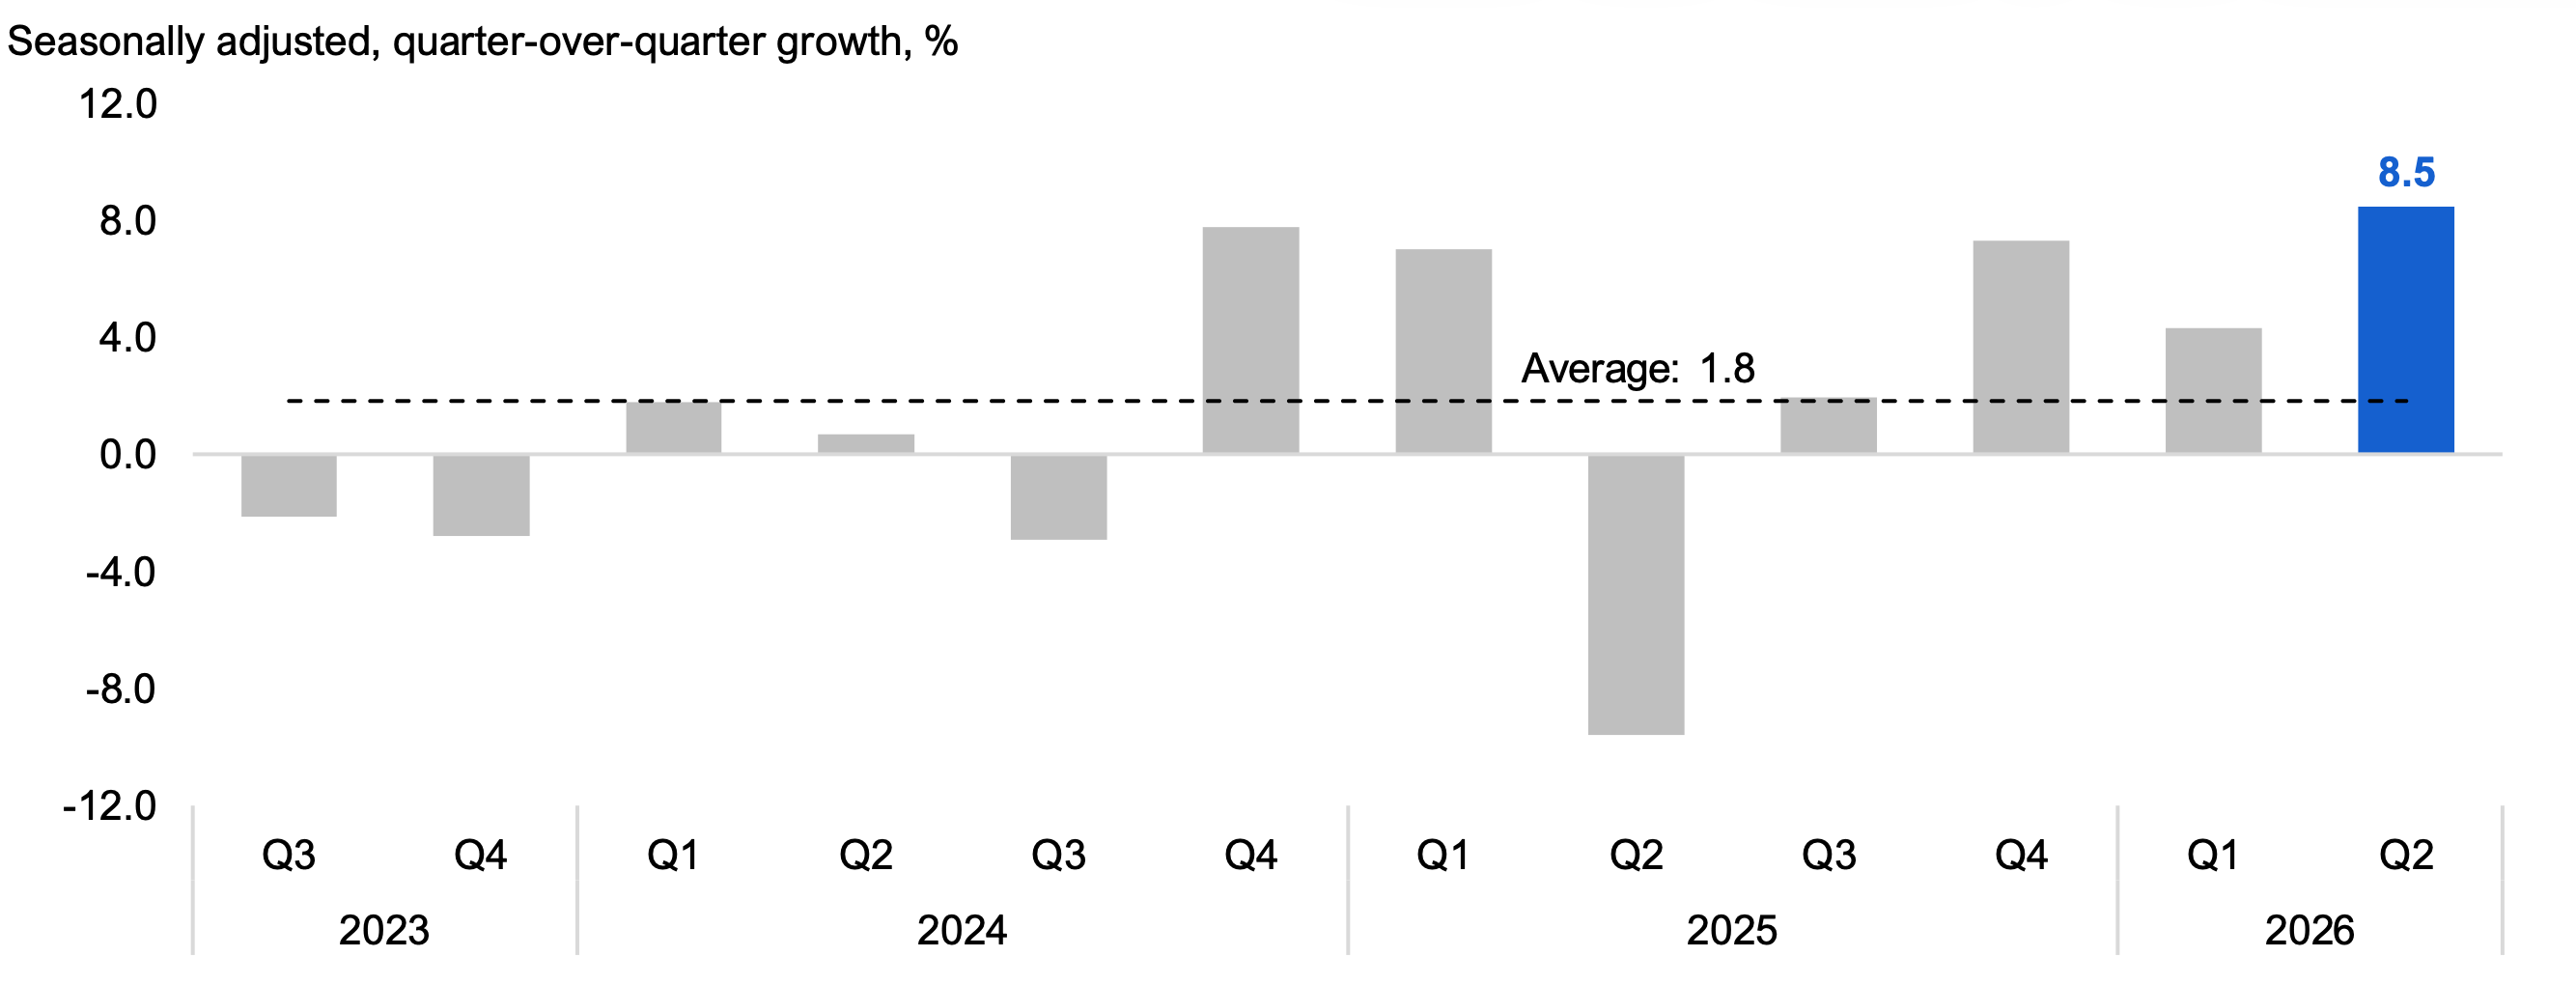
International merchandise exports, which accounts for all goods leaving the country through Ontario, increased by 8.5% in 2026 Q2, accelerating from growth of 4.3% in the previous quarter. The increase in the second quarter was largely attributed to a rise in exports of motor vehicles and parts, chemical, plastic and rubber products, consumer goods, and industrial machinery, partially offset by weakness in energy products and aircraft and other transportation equipment and parts.
Figure 14 International merchandise exports increased 8.5% in 2026 Q2
Source: Statistics Canada Table 12-10-0175-01, Table 12-10-0163-01 and FAO estimate.
Accessible version
| Seasonally adjusted, quarter-over-quarter growth, % | Average | |
|---|---|---|
| 2023 Q3 | -2.1 | 1.8 |
| 2023 Q4 | -2.8 | 1.8 |
| 2024 Q1 | 1.8 | 1.8 |
| 2024 Q2 | 0.7 | 1.8 |
| 2024 Q3 | -2.9 | 1.8 |
| 2024 Q4 | 7.8 | 1.8 |
| 2025 Q1 | 7.0 | 1.8 |
| 2025 Q2 | -9.6 | 1.8 |
| 2025 Q3 | 1.9 | 1.8 |
| 2025 Q4 | 7.3 | 1.8 |
| 2026 Q1 | 4.3 | 1.8 |
| 2026 Q2 | 8.5 | 1.8 |
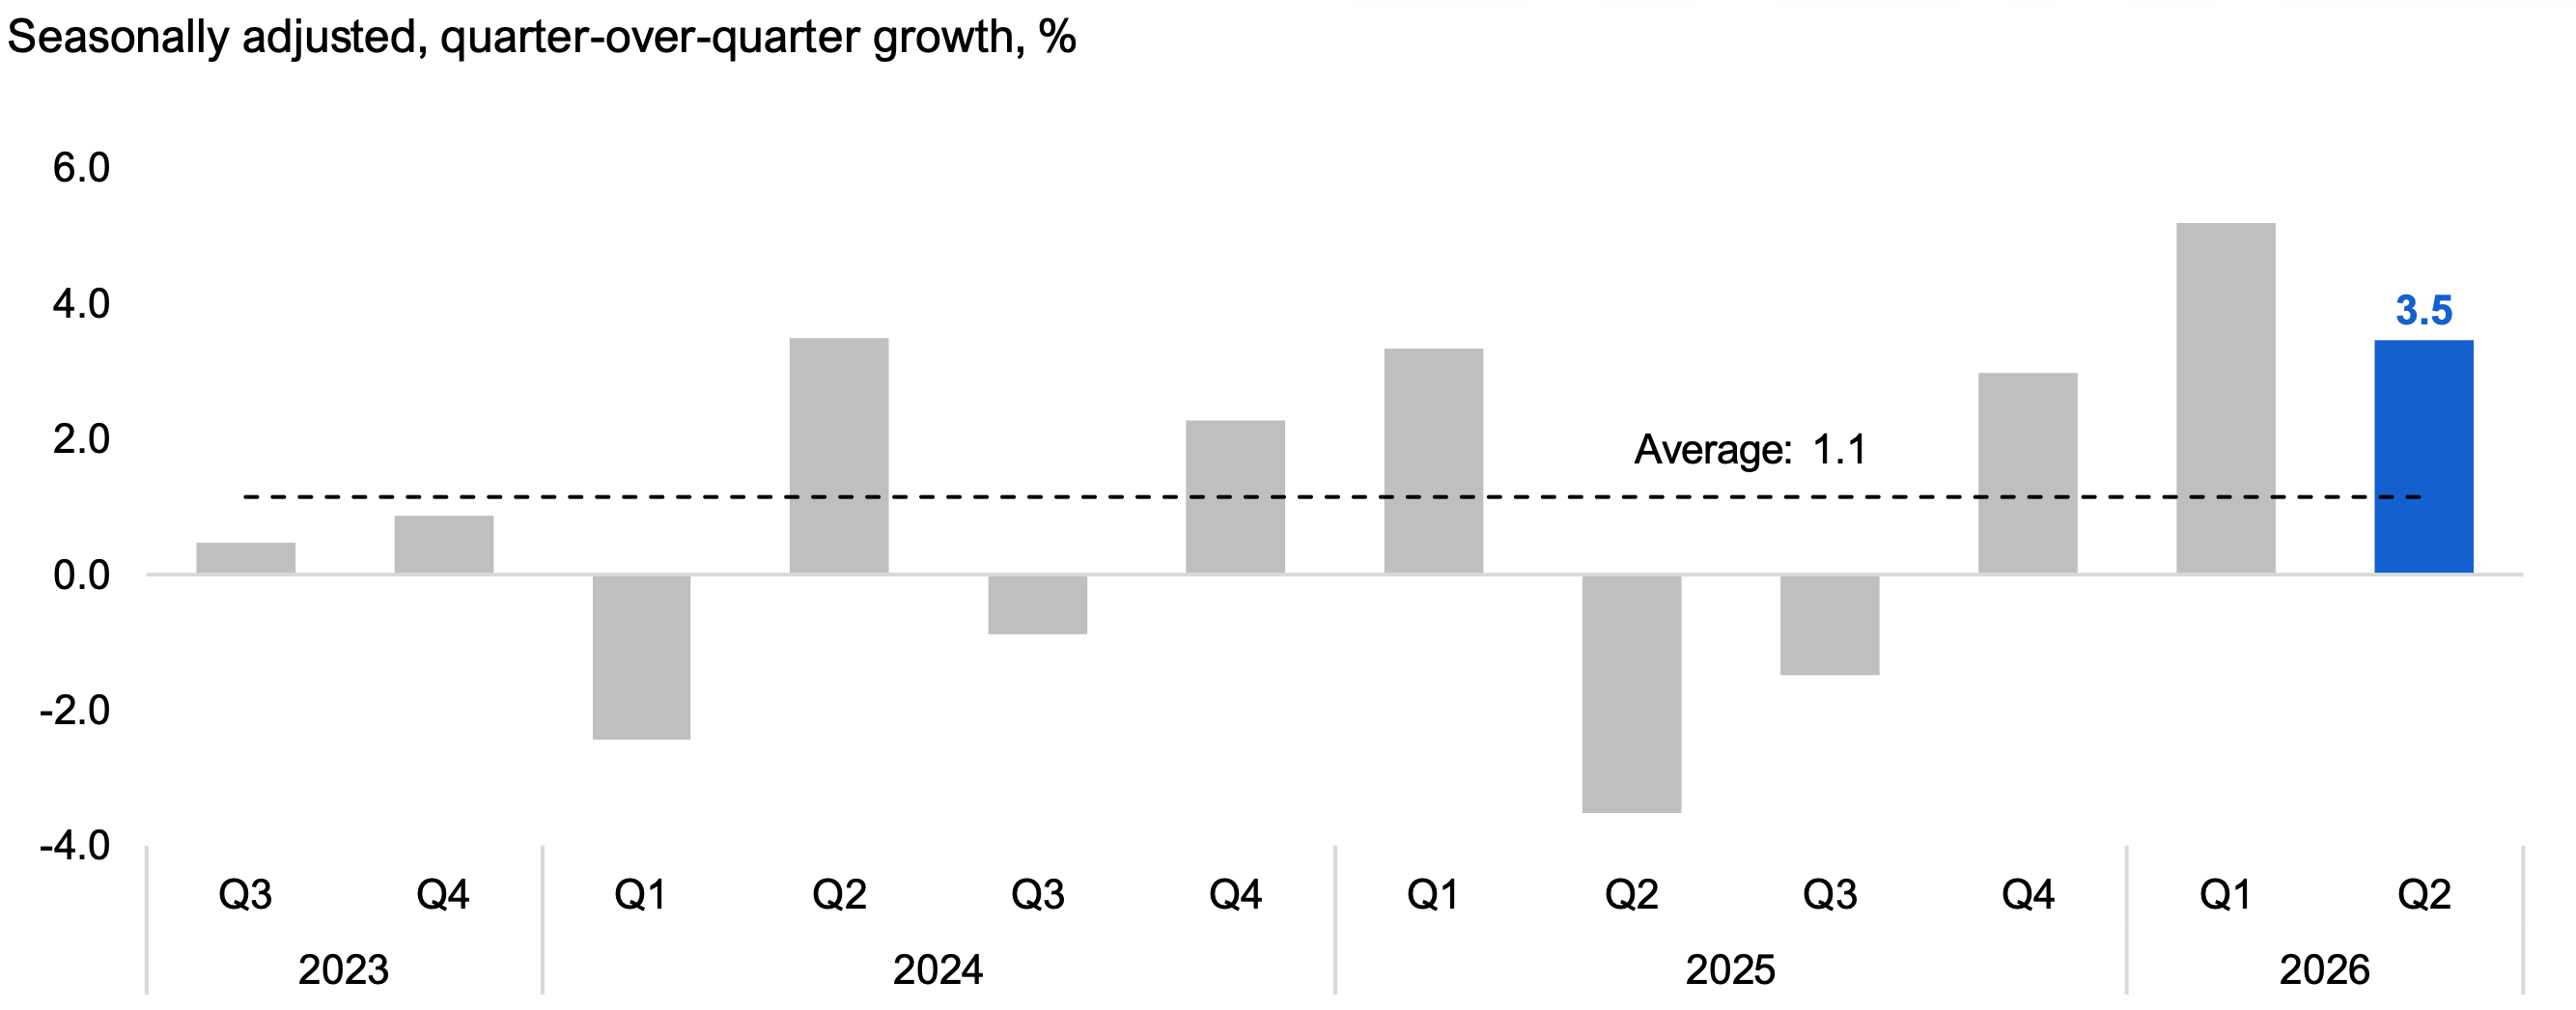
International merchandise imports, which measures international goods entering Ontario, increased by 3.5% in 2026 Q2, after a 5.2% increase the previous quarter. The increase largely reflected higher imports of electronic and electrical equipment and parts, motor vehicles and parts, chemical, plastic and rubber products, and industrial machinery, partially offset by weakness in metal and non-metallic mineral products, energy products, and metal ores and non-metallic minerals.
Figure 15 International merchandise imports increased 3.5% in 2026 Q2
Source: Statistics Canada Table 12-10-0175-01, Table 12-10-0163-01 and FAO estimate.
Accessible version
| Seasonally adjusted, quarter-over-quarter growth, % | Average | |
|---|---|---|
| 2023 Q3 | 0.5 | 1.1 |
| 2023 Q4 | 0.9 | 1.1 |
| 2024 Q1 | -2.4 | 1.1 |
| 2024 Q2 | 3.5 | 1.1 |
| 2024 Q3 | -0.9 | 1.1 |
| 2024 Q4 | 2.3 | 1.1 |
| 2025 Q1 | 3.3 | 1.1 |
| 2025 Q2 | -3.5 | 1.1 |
| 2025 Q3 | -1.5 | 1.1 |
| 2025 Q4 | 3.0 | 1.1 |
| 2026 Q1 | 5.2 | 1.1 |
| 2026 Q2 | 3.5 | 1.1 |
Implications of Recent Economic Trends
Looking ahead to the full year, the FAO’s latest Economic and Budget Outlook[16] (EBO), released in February 2026, projected that Ontario’s annual real GDP would rise by 1.4% in 2026, while nominal GDP was expected to rise by 3.6%.
Recent economic data and global events have put significant downside pressure on the FAO’s projection for 2026 real and nominal GDP growth.
- Ontario’s real GDP declined in the fourth quarter of 2025 and first quarter of 2026. Despite strong economic indicators in 2026 Q2, recent GDP growth has been much weaker than the FAO projected in the February 2026 EBO.
- Recent data indicate that Ontario’s population growth was weaker than anticipated, which could put downward pressure on economic growth. Compared to a year earlier, Ontario’s population has decreased in each of the last three quarters, marking Ontario’s first-ever population decrease based on records back to 1951.[17] The decline was caused by a significant outflow of non-permanent residents and fewer new permanent residents.
- The war in Iran has disrupted global supply chains and raised oil prices dramatically, which could slow household and business spending. The February 2026 EBO projected that the price of West Texas Intermediate crude oil would average $60 US per barrel in 2026, while oil prices have averaged $90 US per barrel since the start of the war. According to the 2025 Ontario Budget, a sustained increase of $10 US per barrel would lower Ontario real GDP growth in 2026 by 0.1 to 0.3 percentage points.[18]
The FAO will continue to monitor Ontario’s economic performance and will update its forecast for economic growth in its next Economic and Budget Outlook report.
Figure 16 Recent economic trends indicate downward revisions to the FAO’s 2026 economic growth projections
Source: Ontario Economic Accounts, Statistics Canada Table 36-10-0222-01 and Table 18-10-0004-01
Accessible version
| Real GDP annual growth, % | Historical | FAO Economic and Budget Outlook, Winter 2026 | Nominal GDP annual growth, % | Historical | FAO Economic and Budget Outlook, Winter 2026 | |
|---|---|---|---|---|---|---|
| 2023 | 2.4 | 2023 | 6.9 | |||
| 2024 | 1.6 | 2024 | 5.1 | |||
| 2025 | 1.3 | 2025 | 4.2 | |||
| 2026 | 1.4 | 2026 | 3.6 |
Glossary
Economic Indicators
- Gross Domestic Product (GDP)
- GDP is a broad indicator of economic activity that measures the value of goods and services produced by an economy. GDP is measured on an expenditure basis, an income basis, and an industry value-added basis.
- Employment and unemployment rate
- Employment from Statistics Canada’s Labour Force Survey estimates the number of individuals who did any work at a job or business (whether paid or unpaid) or those who had a job but were not at work due to factors unrelated to their job (e.g., their own illness or a labour dispute). The unemployment rate represents the number of people actively looking for work but not having a job as a share of the labour force. These two indicators are the most common measures of labour market performance.
- Average hourly wages
- Hourly wages are measured before taxes and other deductions, and include tips, commissions and bonuses for both hourly and salaried workers. This metric indicates wage gains and labour market tightness.
- Retail sales
- Retail sales are the value of finished goods sold by retailers to the general public. This metric provides information on household spending by major commodity type.
- Housing resales
- Home resales data show the number of existing houses sold and is the most common measure of housing market activity.
- Housing prices
- The average price of existing houses sold. This metric is the most common measure of home prices that provides an indication of housing market strength.
- Housing starts
- Housing starts measures the number of housing units where construction has been started, including single and multiple unit dwellings. This metric provides a measure of change in the level of housing stock and can be compared to population growth to provide information on housing supply adequacy.
- Manufacturing sales
- The value of goods manufactured in Ontario that have been shipped to a customer.This metric is a measure of industrial production.
- Wholesale trade
- The value of merchandise sold in large quantities to retailers, businesses and institutional clients, such as governments. This metric provides insight into general business sector activity.
- International merchandise exports and imports
- The value of merchandise shipped out of the country from Ontario (exports) or into Ontario from outside the country (imports). International merchandise trade plays an important role in economic growth and provides information on Ontario’s competitiveness with other jurisdictions.
Technical Definitions
- Real dollars
- Values reflect prices after adjusting for inflation.
- Seasonally adjusted
- Data have been adjusted to reflect seasonal factors that may impact the data.
- Non-seasonally adjusted
- Data have not been adjusted to reflect seasonal factors.
- Year-over-year (Y/Y)
- Data from a particular time period are compared with data from the same time period a year ago. For example, Y/Y growth in 2023 Q4 would compare 2023 Q4 data with 2022 Q4 data. Using Y/Y data mostly removes the impact of seasonal factors.
- Quarter-over-quarter (Q/Q)
- Data compared from one quarter to the next. Q/Q growth in 2023 Q4 would compare 2023 Q4 data with 2023 Q3 data. Q/Q growth may suffer from seasonal factors unless data are seasonally adjusted.
Methodology
Data used in this report are primarily presented on a quarterly basis. For economic indicators that are adjusted for seasonality, growth is presented from one quarter to the next (Q/Q). For indicators that are not seasonally adjusted, growth is presented from the same quarter of the previous year (Y/Y) to avoid the impact of seasonal factors on economic trends. Indicators are presented in current dollars unless otherwise specified.
For some economic data, including retail sales, manufacturing sales and wholesale trade, the final month of the quarter may not yet be available at the time of the report’s publication. In these cases, Statistics Canada’s national preliminary estimate is used to estimate Ontario’s growth in that month.
Footnotes
[1] Ontario’s population has decreased in each of the last three quarters, marking the first time Ontario’s population declined based on records back to 1951.
[2] The Fiscal Sustainability, Transparency and Accountability Act, 2019 states that the quarterly Ontario Economic Accounts should be released within 45 days of Statistics Canada’s release of the National Income and Expenditure Accounts.
[3] Some of these data are regularly revised, and the growth rates presented in this report may differ from updated data published in the future.
[4] Ontario’s quarterly real GDP is regularly revised, which could alter the current technical recession.
[5] Nominal GDP can also be measured on both an expenditure basis, and on an industry basis. See Appendix C: How GDP is measured in the Ontario Economic Accounts.
[6] This is called “compensation of employees” in the Ontario Economic Accounts and includes wages and salaries as well as supplementary labour income.
[7] This is called “net operating surplus of corporations” in the Ontario Economic Accounts.
[8] This includes farm income, unincorporated business income and rental income.
[9] Source: Statistics Canada Table 14-10-0288-01 and FAO.
[10] Source: Statistics Canada Table 14-10-0355-01 and FAO.
[11] Measured on a year-over-year basis.
[12] Over the 2024 to 2025 period, Ontario recorded the third slowest real GDP growth among the provinces.
[13] As June data were not available at the time of publication, Statistics Canada’s Canadian advance retail indicator was used to calculate the 2026 Q2 Ontario value. See Statistics Canada’s Retail trade, May 2026.
[14] Canada Mortgage and Housing Corporation (CMHC) defines a housing unit as being a “structurally separate set of self-contained living premises [with] … a private entrance from outside the building or from a common hall, lobby or stairway inside the building. The entrance must be one that can be used without passing through another separate […] unit”. See CMHC’s Starts and Completions Survey and Market Absorption Survey Methodology.
[15] Source: Canada Mortgage and Housing Corporation, Seasonally-adjusted Starts (Canada and provinces). According to the non-seasonally adjusted data in Statistics Canada Table 34-10-0135-01, the share of single detached housing starts has been declining since the 1990s, when it peaked at 68%, reflecting affordability challenges, changes in household preferences and planning efforts aimed at increasing density.
[16] See the FAO’s Economic and Budget Outlook, Winter 2026.
[17] In its June 2026 release, Statistics Canada noted the possibility of larger-than-usual revisions to non-permanent resident estimates in its next release in September 2026, which could lead to upward changes to total population estimates.
[18] 2025 Ontario Budget, Table 2.7. The 2026 Ontario Budget did not include estimates of the impact of changes in key external factors on Ontario’s economic growth.