

Key Points
- Ontario’s debt is rated by four major international credit rating agencies,[1] based on their assessment of the province’s economic and financial outlook and future risks.[2] These credit ratings represent the agencies’ opinions on the ability of Ontario to meet its debt-related financial obligations.
- Since the FAO’s last Update on Ontario’s Credit Rating, Moody’s downgraded its credit rating from AA to AA- and revised its outlook from negative to stable. Fitch maintained its AA- rating but also revised its outlook from negative to stable. The other two agencies did not change their rating or the outlook on their rating.
- On average, Ontario’s credit rating is now lower than the ratings for Quebec, Nova Scotia, Alberta, Saskatchewan and British Columbia, but still higher than Manitoba, New Brunswick, Prince Edward Island and Newfoundland and Labrador.
- While Ontario benefits from a strong, investment-grade credit rating,[3] the four agencies cite several concerns regarding Ontario’s credit outlook, including the Province’s elevated debt burden, the prolonged and on-going period of budget deficits, and an outlook for relatively moderate economic growth compounded by heightened risks.
Ontario’s Credit Rating Modestly Weaker
Based on a standardized scale[4], Ontario’s debt is currently rated AA- (4th highest rating) by three of the four credit rating agencies and A+ (5th highest) by S&P. In general, the agencies continue to rate Ontario as an ‘extremely strong’, investment-grade borrower. Since the FAO’s last Update on Ontario’s Credit Rating,[5] Moody’s lowered its Ontario rating by one notch, from AA to AA-, while also revising its outlook from negative to stable. Fitch maintained its AA- rating for Ontario but revised its outlook for the Province from negative to stable.
Over the past year, the yield on 10-year Ontario government bonds fell by 100 basis points to 2.1 per cent, in line with a similar decline in Government of Canada 10-year bond yields.[6] As a result, the spread between Ontario and Government of Canada 10-year bond yields has remained relatively stable, suggesting that the risk profile of Ontario debt relative to Canadian government debt has not shifted significantly.
The four agencies note that Ontario’s strong credit rating is supported by the Province’s large and diversified economy, a high degree of fiscal flexibility and an effective borrowing and debt management program. However, the agencies also identify several challenges for Ontario’s credit rating including an elevated debt burden, a prolonged and on-going period of budget deficits and an outlook for relatively moderate economic growth compounded by heightened risks.
Ontario’s 2019 Credit Ratings
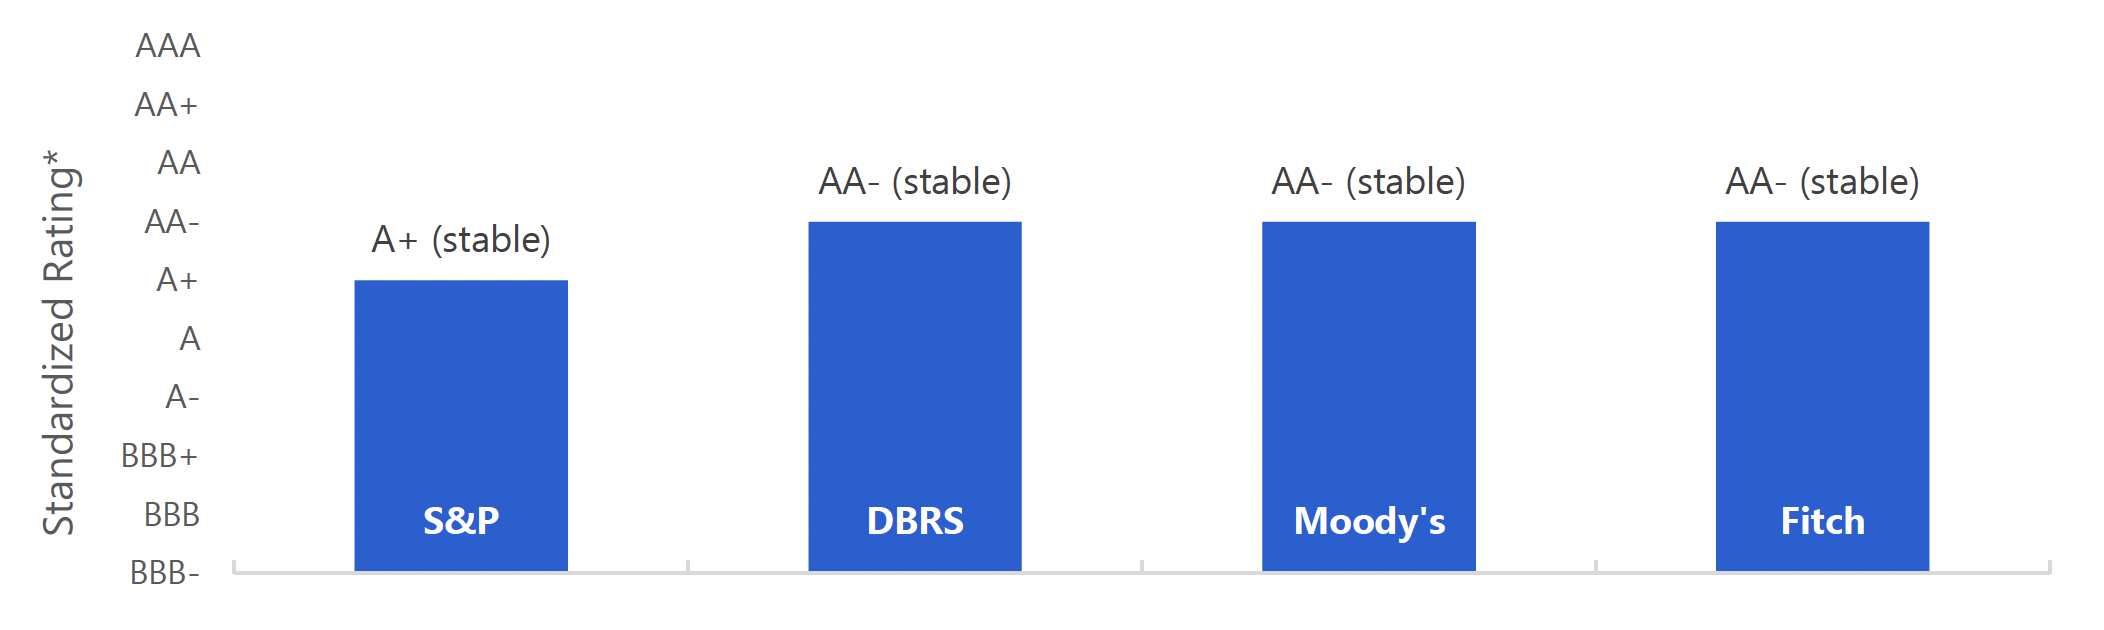
* Based on a standardized scale that includes 10 levels for investment-grade debt. See Appendix The Agencies’ Credit Rating Scales, where the FAO’s standardized rating scale is based on S&P’s and Fitch’s credit rating classifications.
Note: Outlooks are in parentheses. See Appendix Background on Credit Rating Agencies for discussion on outlooks.
Source: S&P, DBRS, Fitch, Moody’s and FAO.
Accessible version
This chart shows Ontario’s standardized credit rating for each credit rating agency. Ontario has an A+ rating with a stable outlook from S&P, an AA- rating with a stable outlook from DBRS, an AA- rating with a stable outlook from Moody’s and an AA- rating with a stable outlook from Fitch.
Elevated Debt Burden
With net debt at $338 billion in 2018-19, Ontario continues to be the most indebted Canadian province and the most indebted sub-sovereign borrower.[7]Consistent with the FAO’s fiscal projections[8], the agencies expect Ontario’s debt-to-revenue ratio (and other related measures of the Province’s debt burden) to peak in the next year before gradually declining over the extended outlook. However, Ontario’s net debt-to-GDP ratio will remain well above historical levels prior to the 2008-2009 recession due to the borrowing required to finance budget deficits until 2022-23.
Some of the agencies acknowledge that the current period of low interest rates has partially eased the pressure on the Province’s borrowing program and interest expense.[9] However, there is the risk that large borrowing requirements in the next few years combined with a steeper-than-expected increase in interest rates could accelerate the accumulation in debt and put downward pressure on the Province’s credit rating.
Prolonged Period of Deficits and the Challenge of Spending Restraint
Ontario has recorded on-going budget deficits each year since 2008-09, with continued projected deficits until 2022-23. The agencies noted that this prolonged period of deficit financing has made the path to a balanced budget more challenging by increasing the accumulated deficit and debt burden. The agencies view the lower capital spending plan[10] in the 2019 budget and a planned return to balance by 2023-24 as a positive direction for the province’s credit health. However, population growth, aging and previous fiscal constraint will make it challenging for the government to meet its current spending targets, particularly in the context of slower economic growth.
Weaker Economic Outlook and Heightened Risks
Ontario’s economic outlook has weakened over the past year, leading to lower expectations for revenue growth. The agencies stress that the province’s credit rating would face downward pressure if economic growth was weaker than expected.
Ontario faces heightened risks that could contribute to a potential economic downturn occurring in the near term.[11] The agencies point to structural barriers to Ontario’s revenue growth, including heavily indebted households and an uncertain trade and investment environment which could limit the government’s flexibility on tax policies. Since the government’s budget plan depends heavily on sustained economic growth and success in limiting spending, the agencies agree that an economic downturn or a significant departure from current spending plans could lead to a deterioration in Ontario’s credit health.
Ontario’s Rating Slips Behind Quebec and Nova Scotia
Ontario’s rating remains in the middle of the pack compared to other Canadian provinces, all of which have very strong, investment-grade credit ratings. However, over the past year, Ontario’s average rating has slipped below that of Quebec and Nova Scotia due to the downgrade of Ontario’s rating by Moody’s and an improvement in Nova Scotia’s rating.
Average Credit Rating by Province as of October 2019[12]
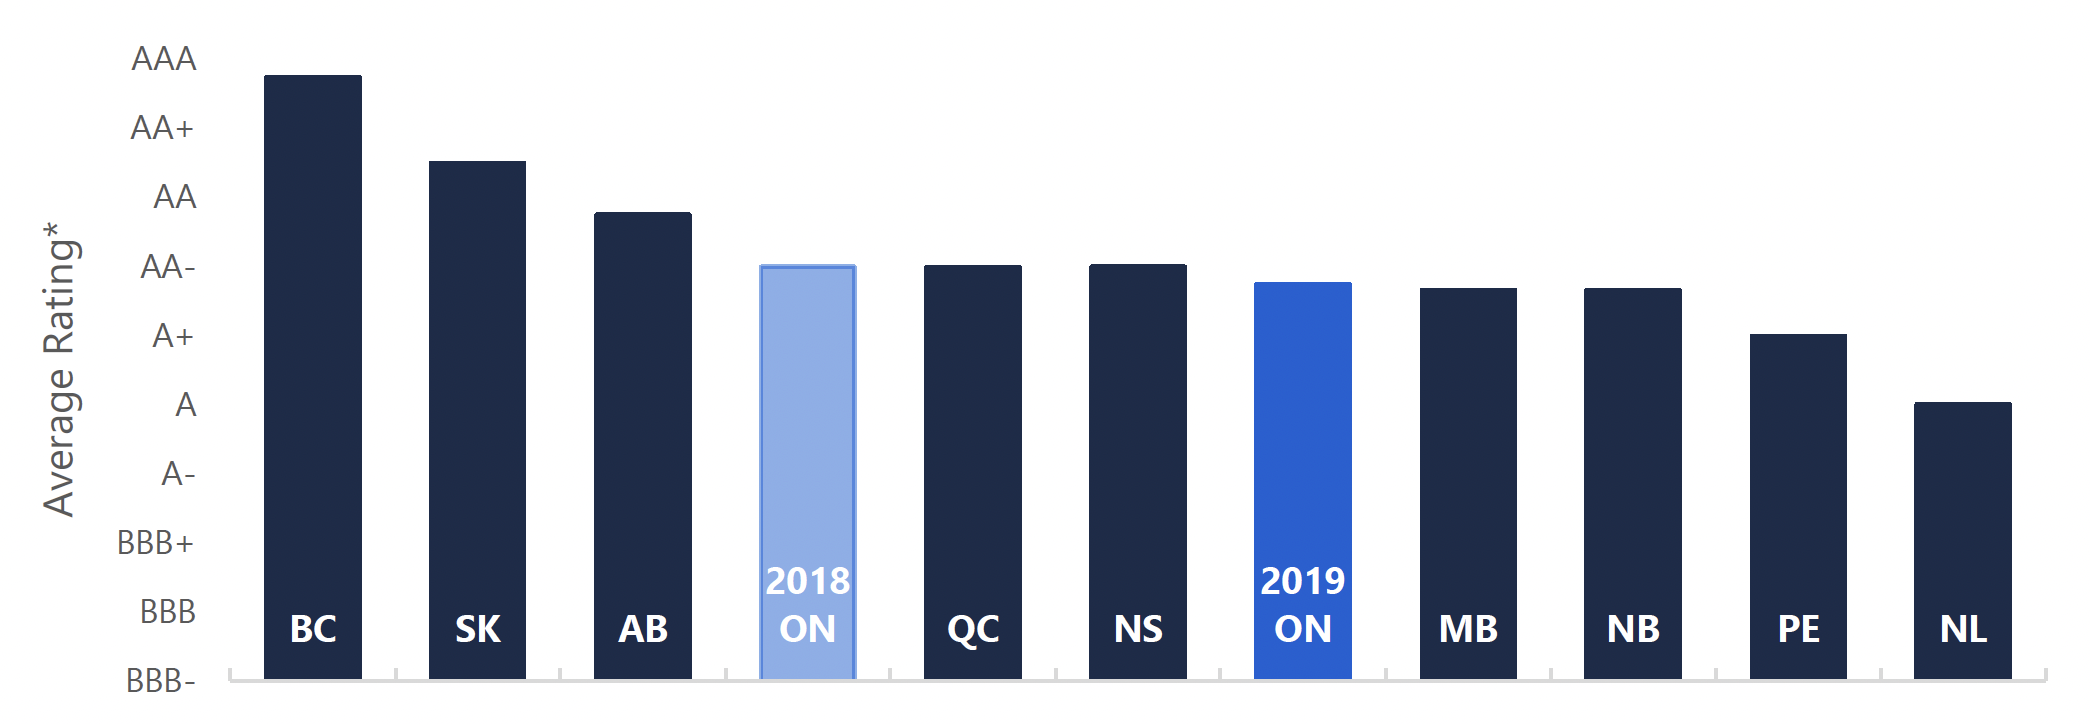
Source: S&P, DBRS, Fitch, Moody’s and FAO.
Accessible version
This chart shows the average credit rating by province. The chart shows British Columbia has the highest rating, followed by Saskatchewan then Alberta, Quebec and Nova Scotia. Ontario’s rating is behind Quebec and Nova Scotia, follow by Manitoba and New Brunswick. Prince Edward Island has the second lowest rating, followed by Newfoundland and Labrador, which has the lowest credit rating.
Appendix
Background on Credit Rating Agencies
Credit rating agencies are private, for-profit companies which assign a credit rating to the debt of governments or corporations. The credit rating is an assessment of the borrower’s credit risk and reflects the borrower’s ability to make interest payments as well as repay the original debt. A credit rating is a relative measure of the likelihood of default by a borrower, based on economic and financial forecasts and an assessment of future developments and risks. The factors that go into a government’s credit rating can be divided into five broad categories[13]:
- economic conditions;
- fiscal performance;
- financial and debt position;
- management quality and institutional strengths; and
- influence of intergovernmental relationships and fiscal arrangements.
Rating agencies also typically assign “outlooks” to credit ratings. The outlook of a credit rating indicates the likely direction of a borrower’s credit rating over the next two years. An outlook can either be stable, negative or positive. A stable outlook indicates that the borrower’s rating, all else equal, is unlikely to change in the short-term, while a negative or positive outlook indicates that the rating is likely to be lowered or raised over the same period. A change in a credit rating outlook does not necessarily indicate a change in the current credit rating.
Debt issuers (governments and corporations) are charged a fee by credit rating agencies to issue a credit rating, while investors (purchasers of debt) also pay a fee to access credit reports. The critical importance of an agency’s reputation ensures that credit rating agencies strive to provide an unbiased and accurate assessment of credit risk.
The main motivation for a debt issuer to acquire a credit rating is that the rating helps the issuer raise funds in capital markets. Receiving an investment-grade credit rating is valuable as it attracts and expands the number of investors willing to lend to the issuer in addition to substantially lowering the cost of borrowing.
| Province | S&P | DBRS | Moody’s | Fitch | Average Rating* (1 = highest rating) |
Last Update |
|---|---|---|---|---|---|---|
| British Columbia | AAA (stable) | AA high (stable) | Aaa (stable) | AAA (stable) | 1.25 | 10/10 |
| Alberta | A+ (stable) | AA (negative) | Aa1 (negative) | AA (stable) | 3.25 | 9/30 |
| Saskatchewan | AA (stable) | AA (stable) | Aaa (stable) | AA (stable) | 2.50 | 8/13 |
| Manitoba | A+ (positive) | A high (stable) | Aa2 (stable) | 4.33 | 10/4 | |
| Ontario | A+ (stable) | AA low (stable) | Aa3 (stable) | AA- (stable) | 4.25 | 10/15 |
| Quebec | AA- (stable) | A high (positive) | Aa2 (stable) | AA- (stable) | 4.00 | 6/21 |
| New Brunswick | A+ (stable) | A high (stable) | Aa2 (stable) | 4.33 | 9/30 | |
| Nova Scotia | AA- (stable) | A high (stable) | Aa2 (stable) | 4.00 | 9/23 | |
| Newfoundland & Labrador | A (stable) | A low (stable) | A1 (stable) | 6.00 | 10/3 | |
| Prince Edward Island | A (positive) | A (stable) | Aa2 (stable) | 5.00 | 10/10 |
| Rating Description | Credit Quality | S&P | DBRS | Moody’s | Fitch | |
|---|---|---|---|---|---|---|
| Long Term | Long Term | Long Term | Long Term | Ranking | ||
| Investment-grade | Extremely Strong | AAA | AAA | Aaa | AAA | 1 |
| AA+ | AA high | Aa1 | AA+ | 2 | ||
| AA | AA | Aa2 | AA | 3 | ||
| AA- | AA low | Aa3 | AA- | 4 | ||
| Very Strong | A+ | A high | A1 | A+ | 5 | |
| A | A | A2 | A | 6 | ||
| A- | A low | A3 | A- | 7 | ||
| Strong | BBB+ | BBB high | Baa1 | BBB+ | 8 | |
| BBB | BBB | Baa2 | BBB | 9 | ||
| BBB- | BBB low | Baa3 | BBB- | 10 | ||
| Non Investment-grade | Speculative | BB+ | BB high | Ba1 | BB+ | 11 |
| BB | BB | Ba2 | BB | 12 | ||
| BB- | BB low | Ba3 | BB- | 13 | ||
| B+ | B high | B1 | B+ | 14 | ||
| B | B | B2 | B | 15 | ||
| B- | B low | B3 | B- | 16 | ||
| CCC | CCC | Caa | CCC | 17 |
Footnotes
[1] The four credit rating agencies are Moody’s Investors Service (Moody’s), S&P Global Ratings (S&P), DBRS Limited (DBRS) and Fitch Ratings (Fitch). The agencies review the province’s credit rating annually and typically publish an update on their view of the Province’s finances and credit quality, based on the government’s latest financial reports or statements.
[2] See Appendix Background on Credit Rating Agencies for additional discussion on rating agencies.
[3] Technically, the agencies refer to Ontario’s debt as ‘extremely’ strong. See Appendix The Agencies’ Credit Rating Scales for credit quality of the ratings.
[4] See Appendix The Agencies’ Credit Rating Scales for the scale used by each agency. The FAO’s standardized rating scale is based on S&P’s and Fitch’s credit rating classifications.
[5] Update on Ontario’s Credit Rating, FAO, September 2018.
[6] In September 2018, the yields for Ontario government 10-year bonds and Government of Canada 10-year bonds were 3.1 per cent and 2.4 per cent respectively. As of September 2019, the yields were 2.1 per cent and 1.4 per cent respectively.
[7] Based on data from Moody’s which showed that Ontario had the largest amount of net debt among sub-national borrowers globally.
[8] 2019 Spring Economic and Budget Outlook, FAO, May 2019.
[9] Interest on debt as a share of revenue has remained relatively stable since 2009-10 despite a large increase in debt.
[10] Based on the government’s spending plan in the 2019 budget, total government spending is projected to grow by 1.3 per cent on average each year from 2018-19 to 2023-24, down from 4.5 per cent projected in the 2018 Ontario Budget.
[11] Assessing the Impact of an Economic Downturn on the Government’s Budget Plan, FAO, June 2019.
[12] The average rating is created by first translating each rating into a standardized rating and then converting all ratings to numerical values, 1 being the highest rating and 17 being the lowest rating (see Appendix The Agencies’ Credit Rating Scales for translation matrix, where the FAO’s standardized rating scale is based on S&P’s and Fitch’s credit rating classifications), after which, the average numerical ranking is converted to letter rating. For example, Ontario’s rankings are 5, 4, 4 and 4 from S&P, DBRS, Fitch and Moody’s, respectively, for an average of 4.25, which roughly translates into an AA- letter rating. Additionally, average ratings do not reflect outlooks, only credit ratings.
[13] Liu, L & Tan, K.S. (2009). Subnational Credit Rating: A Comparative Review. World Bank, Policy Research Working Paper; no. WPS 5013.